financial report - university of iowa · fall 2014 fall 2013 group total students 31,387 31,065...
TRANSCRIPT

FINANCIAL REPORTJ U L Y 1 , 2 0 1 2 T O J U N E 3 0 , 2 0 1 4
FINANCIAL REPORT J U L Y 1 , 2 0 1 3 T O
J U N E 3 0 , 2 0 1 4

BOARD OF REGENTS, STATE OF IOWA
Bruce L. Rastetter, Alden, President
Katie S. Mulholland, Marion, President Pro Tem
Nicole C. Carroll, Carroll
Milt J. Dakovich, Waterloo
Robert N. Downer, Iowa City
Ruth R. Harkin, Cumming
Larry E. McKibben, Marshalltown
Dr. Subhash C. Sahai, Webster City
Hannah M. Walsh, Iowa City
UNIVERSITY OFFICIALS
Sally Mason, President
P. Barry Butler, Executive Vice President and Provost
Douglas K. True, Senior Vice President and University Treasurer
Mark Braun, Chief of Staff and Vice President for External Relations
Joe Brennan, Vice President for Strategic Communication
Susan Buckley, Vice President for Human Resources
Carroll Reasoner, Vice President for Legal Affairs and General Counsel
Daniel Reed, Vice President for Research and Economic Development
Jean Robillard, Vice President for Medical Affairs
Thomas R. Rocklin, Vice President for Student Services
Terry L. Johnson, Associate Vice President and University Controller
Susan Klatt, Director of Financial Management/ Budget and University Secretary

1 Management’s Discussion and Analysis 1
2 Introduction and Highlights
4 Message from Senior Vice President and Treasurer, Douglas K. True
5 Independent Auditor’s Report
7 Management’s Discussion and Analysis
18 Statement of Net Position
20 Statement of Revenues, Expenses and Changes in Net Position
21 Statement of Cash Flows
23 The State University of Iowa Foundation and Affiliates Consolidated Statement of Financial Position
24 The State University of Iowa Foundation and Affiliates Consolidated Statement of Activities
25 Notes to Financial Statements
58 Segment Reporting
64 Required Supplementary Information
TABLE OF CONTENTS

2
FOR IOWA AND THE WORLDThe University of Iowa is a comprehensive research university with particular distinction in
the arts, humanities, and sciences; a world-class academic health center; and a wide array of
exceptional professional programs. While serving as the state’s most comprehensive institution
of higher learning, the University also enjoys a national and international reputation for
excellence, and competes at that level for the best faculty and the most talented graduate and
professional students.
UNIVERSITY OF IOWA MISSIONIn pursuing its missions of teaching, research, and service, the University seeks to advance
scholarly and creative endeavor through leading-edge research and artistic production; to use this
research and creativity to enhance undergraduate, graduate, and professional education, health
care, and other services provided to the people of Iowa, the nation, and the world; and to educate
students for success and personal fulfillment in a diverse world.
THE UNIVERSITY IN 2014University of Iowa achievements during fiscal year 2014 include:
• Enrolling the largest, most-diverse, and best-prepared first-year undergraduate class in
university history
• Opening the John and Mary PappaJohn Biomedical Discovery Building to house research
programs in diabetes, deafness, brain science, and cardiovascular disease
• Continuing progress on new arts facilities, a new residence hall, and other building
projects that promise to revitalize the physical campus
ENROLLMENTFall 2014 Fall 2013
Group
Total students 31,387 31,065
Undergraduates 22,354 21,974
Graduate and professional 9,033 9,091
Iowa residents 54.3% 54.5%
Total non-residents 45.7% 45.5%
International students 12.1% 12.1%
Minority enrollment 15.2% 13.6%
EMPLOYMENTFall 2014 Fall 2013
Group (by FTEs)
Total faculty and staff 22,748 22,365
Tenure-track faculty 1,598 1,613
Clinical-track faculty 610 584
Postdoctoral and other faculty 709 626
Professional and scientific staff 8,583 8,223
Merit staff 4,358 4,448
Residents 748 744
Graduate assistants 2,405 2,512
Temporary 3,737 3,615

3 Management’s Discussion and Analysis 3
EXTERNAL SUPPORT AND GIVINGThe University reported strong grants and contracts support during 2014:
• Fiscal year 2014 grants and contracts: $515.8 million
• Number of grants and contracts awarded: 2,187
The University and the UI Foundation marked significant progress toward goals for the For Iowa. Forever More. comprehensive fund-raising campaign:
• Campaign gifts raised by June 30, 2014: $1,286,838,656
• Percentage of $1.7 billion campaign goal: 76%
• Number of campaign donors: approximately 169,300
• Combined value of UI and UI Foundation endowments: $1.2 billion
RECENT RANKINGSSnapshot of the University’s standing in recent national surveys:
• U.S. News & World Report rank among U.S. public
universities: 27
• Number of graduate programs ranked among the top 25 of
their kind by U.S. News & World Report: 22
• U.S. News & World Report rank among best colleges for
military veterans: 6
• Kiplinger’s Personal Finance rank for resident tuition value: 56
• Kiplinger’s rank for non-resident tuition value: 86
• U.S. News & World Report rank among Iowa hospitals: 1
• Number of medical specialties on U.S. News & World Report
“Best Hospitals” list: 9
• Number of pediatric specialties ranked by U.S. News & World Report: 8
Ribbon cutting for the PBDB in October.
The PappaJohn Biomedical Discovery Building (PBDB), home to research programs on diabetes, deafness, brain science, and cardiovascular disease.
4 Management’s Discussion and Analysis4
I am pleased to present the University of Iowa’s audited Financial Report for fiscal year 2014, summarizing the financial position and results of operations of the University for the past two fiscal years. The University remains financially sound and stable with net position increasing by $289.1 million (8.8%) during fiscal year 2014. Continued strong credit ratings by Moody’s (Aa1) and Standard & Poor’s (AA) are important indicators of the institution’s financial health.
Quality and ease of access are critical for a successful public University. The University of Iowa is recognized as a “best buy” in several national college guides. Resident student undergraduate tuition and fees remain among the lowest in the University’s peer group, nearly $3,700 less than the Big Ten public institution average. The focus on value, student success, and academic excellence yielded the three largest enrollments in the history of the University over the past three academic years. This includes the University’s best-prepared, most diverse first-year undergraduate class in the fall of 2014. The University continues to attract a significant number of non-resident and international undergraduate students while vigorously recruiting all eligible Iowans. Indeed, the University of Iowa is going to extraordinary lengths to reach out and offer more academic opportunities to prospective Iowa students in a variety of settings – including those working or place-bound.
New undergraduates are eligible for the Summer Hawk Tuition Grant, which can offset tuition costs for up to 12 semester hours during one summer session at Iowa. The grant awards Iowa residents a scholarship to cover tuition charges for up to 12 credit hours of summer courses. Non-residents registered for more than 4 semester hours receive as a scholarship the difference between resident and nonresident tuition. Because of these strategies and other efficiency efforts, the University has dramatically improved its four year graduation rate.
The University has reached agreements with FEMA on most of the renovation or replacement of facilities devastated by the historic flood of 2008. Replacement facilities for Hancher Auditorium, the School of Music and the Studio Arts Building are proceeding rapidly with construction to be completed in 2016. Cumulatively, the University expects to invest at least $700 million toward the completion of flood recovery construction work. This along with the construction work at University of Iowa Hospitals & Clinics (UIHC) is generating an additional 11,300 construction jobs for the Iowa economy.
During this past year the UIHC was recognized as the U.S. News & World Report’s top hospital in the state of Iowa and in the top 3% of all U.S. hospitals. To enable UIHC to continue as one of the nation’s best hospitals, the Board of Regents authorized the new Children’s Hospital which is now in construction and is expected to open in 2016. Supporting this initiative to give Iowa the very best children’s medical services is UIHC’s strong financial performance reflected in its positive and consistent operating margin (4.6% in fiscal year 2014).
Expense management and efficiency have never been more important to maintain our quality and competitiveness. The University is focusing on energy management, faculty and staff fringe benefit costs, supply chain management, and organizational reassessments. Almost 100 LEAN events occur annually to guide systematic change and reinvestment. Consistently the University has benefitted from the general University and health care functions collectively achieving economies-of-scale and savings through integration of administrative functions. Building on this history of seeking productivity, the University of Iowa is an active participant in the Board of Regents TIER reviews pointed toward transformational change and improvement.
We hope you agree that there is much to be proud of at your University. The following financial information in the report of the Auditor of State and in the “Management Discussion and Analysis” section is a very good recap of the University’s performance over the last year.
Very truly yours,
Douglas K. TrueSenior Vice President and Treasurer
Message from Senior Vice President and Treasurer, Douglas K. TruePRESIDENT MASON AND MEMBERS OF THE BOARD OF REGENTS:
5
OFFICE OF AUDITOR OF STATESTATE OF IOWA
State Capitol Building Des Moines, Iowa 50319-0004
Telephone (515) 281-5834 Facsimile (515) 242-6134
Mary Mosiman, CPA
Auditor of State
Independent Auditor’s Report
To the Members of the Board of Regents, State of Iowa:
Report on the Financial Statements
We have audited the accompanying Statement of Net Position, and the related Statements of Revenues, Expenses and Changes in Net Position and Cash Flows, of the State University of Iowa, Iowa City, Iowa, (University of Iowa) and its aggregate discretely presented component units as of and for the years ended June 30, 2014 and 2013, and the related Notes to Financial Statements, which collectively comprise the University of Iowa’s basic financial statements listed in the table of contents.
Management’s Responsibility for the Financial Statements
Management is responsible for the preparation and fair presentation of these financial statements in accordance with U.S. generally accepted accounting principles. This includes the design, implementation and maintenance of internal control relevant to the preparation and fair presentation of financial statements that are free from material misstatement, whether due to fraud or error.
Auditor’s Responsibility
Our responsibility is to express opinions on these financial statements based on our audit. We did not audit the financial statements of the University of Iowa Research Foundation, the State University of Iowa Foundation and Affiliates and the University of Iowa Health System and Subsidiaries discussed in Note 1, which represent 100% of the assets, net position and revenues of the discretely presented component units. Those financial statements were audited by other auditors whose reports have been furnished to us, and our opinion, insofar as it relates to those financial statements, is based solely on the reports of the other auditors. We conducted our audit in accordance with U.S. generally accepted auditing standards and the standards applicable to financial audits contained in Government Auditing Standards, issued by the Comptroller General of the United States. Those standards require that we plan and perform the audit to obtain reasonable assurance about whether the financial statements are free from material misstatement. The financial statements of the discretely presented component units were not audited in accordance with Government Auditing Standards.
An audit involves performing procedures to obtain audit evidence about the amounts and disclosures in the financial statements. The procedures selected depend on the auditor’s judgment, including the assessment of the risks of material misstatement of the financial statements, whether due to fraud or error. In making those risk assessments, the auditor considers internal control relevant to the University of Iowa’s preparation and fair presentation of the financial statements in order to design audit procedures that are appropriate in the circumstances, but not for the purpose of expressing an opinion on the effectiveness of the University of Iowa’s internal control. Accordingly, we express no such opinion. An audit also includes evaluating the appropriateness of accounting policies used and the reasonableness of significant accounting estimates made by management, as well as evaluating the overall presentation of the financial statements.
We believe the audit evidence we have obtained is sufficient and appropriate to provide a basis for our audit opinion.

6
Opinion
In our opinion, based on our audit and the reports of the other auditors, the financial statements referred to above present fairly, in all material respects, the respective financial position of the University of Iowa and its aggregate discretely presented component units as of June 30, 2014 and 2013, and the respective changes in financial position and, where applicable, cash flows thereof for the years ended June 30, 2014 and 2013 in accordance with U.S. generally accepted accounting principles.
Emphasis of a Matter
As discussed in Note I, the financial statements of the University of Iowa are intended to present the financial position, and the changes in financial position and cash flows, of only that portion of the financial reporting entity of the State of Iowa that is attributable to the transactions of the University of Iowa. They do not purport to, and do not, present fairly the financial position of the State of Iowa as of June 30, 2014 and 2013 and the changes in its financial position and its cash flows for the years ended June 30, 2014 and 2013 in conformity with U.S. generally accepted accounting principles.
Other Matters
Required Supplementary Information
U.S. generally accepted accounting principles require Management’s Discussion and Analysis and the Schedule of Funding Progress for the Retiree Health Plan on pages 7 through 17 and 64 be presented to supplement the basic financial statements. Such information, although not a part of the basic financial statements, is required by the Governmental Accounting Standards Board which considers it to be an essential part of financial reporting for placing the basic financial statements in an appropriate operational, economic or historical context. We and the other auditors have applied certain limited procedures to the required supplementary information in accordance with U.S. generally accepted auditing standards, which consisted of inquiries of management about the methods of preparing the information and comparing the information for consistency with management’s responses to our inquiries, the financial statements and other knowledge we obtained during our audit of the financial statements. We do not express an opinion or provide any assurance on the information because the limited procedures do not provide us with sufficient evidence to express an opinion or provide any assurance.
The Introduction and Highlights Section and the Message from Senior Vice President and Treasurer, Douglas K. True, have not been subjected to the auditing procedures applied in the audit of the basic financial statements and, accordingly, we do not express an opinion or provide assurance on them.
Other Reporting Required by Government Auditing Standards
Our report on the University of Iowa’s internal control over financial reporting and other tests of its compliance with certain provisions of laws, regulations, contracts and grant agreements and other matters required by Government Auditing Standards will be issued under separate cover. The purpose of that report is to describe the scope of our testing of internal control over financial reporting and compliance and the results of that testing and not to provide an opinion on the internal control over financial reporting or on compliance. That report is an integral part of an audit performed in accordance with Government Auditing Standards and should be considered in assessing the results of our audits.
MARY MOSIMAN, CPA WARREN G. JENKINS, CPA Auditor of State Chief Deputy Auditor of State
December 10, 2014

7 Management’s Discussion and Analysis Management’s Discussion and Analysis 7
INTRODUCTIONThe following discussion and analysis of the University of Iowa’s financial statements presents an
overview of the University’s financial activities for the years ended June 30, 2014 and 2013. This
discussion has been prepared by management and should be read in conjunction with the financial
statements and related footnotes that follow.
FINANCIAL HIGHLIGHTSThe University’s financial position remained strong at June 30, 2014, with assets of $5,778 million
and liabilities of $2,207 million as compared to June 30, 2013 assets of $5,369 million and liabilities
of $2,088 million. Net position, the difference between total assets and deferred outflows, and total
liabilities and deferred inflows, increased by $289.1 million (8.8%) from June 30, 2013 to June 30,
2014. The increase from June 30, 2012 to June 30, 2013 was $187.8 million (6.1%).
The change in net position reports the financial results during the fiscal year by measuring the
relationship between revenues and expenses. It is important to note that public universities such as
the University of Iowa generally report an operating loss, as the financial reporting model classifies
state appropriations, investment income and gifts as nonoperating revenues. Operating revenues are
received for providing goods and services to the various students, customers and constituencies of
the University. Operating expenses are those expenses incurred to acquire or produce the goods and
services provided in return for the operating revenues and to carry out the mission of the University.
Nonoperating revenues are revenues received for which goods and services are not provided.
Implementation of GASB Statement No. 65 Items Previously Reported as Assets and Liabilities
required restatement of prior year prepaid expense and unrestricted net position to reduce each for
the balance of unamortized bond issuance costs. See Note 15 for additional information. The bar
graphs and tables of Statement of Net Position, Statement of Revenues, Expenses and Changes in
Net Position, and Statement of Cash Flows have been revised to reflect these adjustments.
Management’s Discussion and Analysis
Left: A new Art Building will replace original Art Building complex destroyed by the 2008 flood. Classes will be held here beginning fall 2016. Right: The 501-bed Mary Louise Petersen Residence Hall addresses a shortage of student living space on campus and is the first new residence hall built since 1968. It will house students beginning fall 2015.

8 Management’s Discussion and Analysis
The following charts compare Total Assets and Deferred Outflows, Total Liabilities and Deferred Inflows, and Total Net Position at June 30, 2014, 2013, and 2012 and the components of changes in Net Position at June 30, 2014, 2013 and 2012.
STATEMENT OF NET POSITION
STATEMENT OF REVENUES, EXPENSES AND CHANGES IN NET POSITION
0 500 1000 1500 2000 2500 3000 3500 4000 4500 5000 5500 6000
Total Net Position
Total Liabilities and Deferred In�ows
Total Assets and Deferred Out�ows
Millions
$5,781.2
$5,371.6
$4,841.0
$2.213.4
$2.092.9
$1.750.1
$3,567.8
$3.278.7
$3.090.9
2014
2013
2012
2014
2013
2012
0 500 1000 1500 2000 2500 3000
Increase in Net Position
Other Revenues & Extraordinary
Nonoperating Revenues, Net
Operating Expenses
Operating Revenues
Millions
$2,745.8
$2,597.9
$2,542.2
$2,519.4
$2,392.9
$2,375.0
$422.2
$339.4
$339.6
$93.3
$53.4
$47.9
$289.1
$187.8
$220.3
9 Management’s Discussion and Analysis Management’s Discussion and Analysis 9
USING THIS ANNUAL REPORTThe University’s annual report consists of three financial statements: the Statement of Net
Position, the Statement of Revenues, Expenses and Changes in Net Position, and the Statement
of Cash Flows. These statements provide information on the University as a whole and present a
long-term and short-term view of the University’s activities.
THE STATEMENT OF NET POSITION AND THE STATEMENT OF REVENUES, EXPENSES AND CHANGES IN NET POSITION The Statement of Net Position and the Statement of Revenues, Expenses and Changes in Net
Position present the financial position of the University at the end of the fiscal year and report
the University’s net position and changes in them during the current fiscal year, respectively.
Net position, the difference between total assets and deferred outflows, and total liabilities and
deferred inflows, is one indicator of the current financial condition of the University, while the
change in net position over time determines whether the financial health of the University is
improving. To assess the overall health of the University, non-financial factors are relevant as
well. Such factors include student enrollment, patient volumes, the University’s ability to attract
and retain qualified faculty and staff and the overall condition of the University’s buildings and
infrastructure.
These statements are reported under the accrual basis of accounting. Revenues are recognized
when earned and expenses are recognized when incurred, regardless of when cash is received or
paid.

10 Management’s Discussion and Analysis
The following table summarizes the University’s assets, deferred outflows, liabilities, deferred inflows, and net position for the years ended June 30, 2014, 2013 and 2012.
NET POSITION, END OF YEAR (in millions)
2014Restated
2013Restated
2012
Assets
Current assets $776.9 $737.4 $818.4
Capital assets, net 2,921.9 2,649.6 2,445.4
Other noncurrent assets 2,079.5 1,982.1 1,576.3
Total Assets 5,778.3 5,369.1 4,840.1
Deferred Outflows of Resources 2.9 2.5 0.9
Liabilities
Current liabilities 765.2 732.9 726.7
Noncurrent liabilities 1,441.5 1,354.9 1,020.9
Total Liabilities 2,206.7 2,087.8 1,747.6
Deferred Inflows of Resources 6.7 5.1 2.5
Net Position
Invested in capital assets, net of related debt 1,777.5 1,615.4 1,528.3
Restricted 438.8 412.2 341.5
Unrestricted 1,351.5 1,251.1 1,221.1
Total Net Position $3,567.8 $3,278.7 $3,090.9

11 Management’s Discussion and Analysis Management’s Discussion and Analysis 11
The following table summarizes the University’s revenues, expenses and changes in net position for the years ended June 30, 2014, 2013 and 2012.
REVENUES, EXPENSES AND CHANGES IN NET POSITION (in millions)
2014Restated
2013Restated
2012
Operating Revenues:
Tuition and fees, net of scholarship allowances $382.1 $374.8 $357.1
Grants and contracts 347.9 352.3 372.8
Patient services, net of allowances 1,462.0 1,356.5 1,319.6
Sales and services of educational departments 102.9 108.3 103.7
Auxiliary enterprises, net of scholarship allowances 179.6 175.3 175.3
Other operating revenue 44.9 25.7 46.5
Total Operating Revenues 2,519.4 2,392.9 2,375.0
Operating Expenses:
Instruction 349.8 336.0 336.6
Research 297.1 287.3 290.1
Academic support 167.4 163.1 137.9
Patient services 1,281.0 1,190.0 1,165.4
Depreciation and amortization 171.6 167.8 160.1
Auxiliary enterprises 166.7 157.5 165.1
Other operating expenses 312.2 296.2 287.0
Total Operating Expenses 2,745.8 2,597.9 2,542.2
Operating (Loss) (226.4) (205.0) (167.2)
Nonoperating Revenues (Expenses):
State appropriations 238.1 229.6 232.0
Grants and contracts 15.7 16.1 16.0
Investment income, net of investment expenses 131.8 61.2 56.7
Gifts 83.4 74.1 68.4
Interest expense (35.5) (36.2) (32.1)
Loss on disposal of capital assets (11.3) (5.4) (1.4)
Net Nonoperating Revenues (Expenses) 422.2 339.4 339.6
Income Before Other Revenues 195.8 134.4 172.4
Other Revenues:
Capital appropriations, State 21.4 19.9 10.5
Capital contributions and grants 8.4 9.2 20.2
FEMA reimbursement for capital costs, net of expenses 63.5 24.3 15.8
Other revenues - - 1.4
Net Other Revenues 93.3 53.4 47.9
Increase in Net Position 289.1 187.8 220.3
Net position, beginning of year 3,278.7 3,090.9 2,870.6
Net position, end of year $3,567.8 $3,278.7 $3,090.9

12 Management’s Discussion and Analysis
The Statement of Revenues, Expenses and Changes in Net position reflects a positive year
with an increase in net position for the fiscal year ended June 30, 2014 of $289.1 million (8.8%).
During the fiscal year ended June 30, 2014, the University increased operating revenues and
operating expenses by 5.3% and 5.8%, respectively. The net result from operating revenues and
expenses is an operating loss of 9.0% compared to 8.5% last year. However, after factoring in state
appropriations, investment income, gifts and other revenues, the University increased net position
by $289.1 million for the year ended June 30, 2014.
During the fiscal year ended June 30, 2014, net nonoperating revenues (expenses) increased by
24.4%.
OPERATING REVENUES For the fiscal years (FY) ended June 30, 2014, 2013 and 2012, operating revenues totaled $2,519
million, $2,393 million and $2,375 million, respectively. Operating revenues increased $126
million (5.3%) over FY 2013 revenues. The increase is primarily from patient services and other
operating revenue. The following is a graphic illustration of revenues by source which are used to
fund the University’s operating activities for the year ended June 30, 2014.
FY2014 OPERATING REVENUES $2,519.4 million
In the most recent National Science Foundation, Higher Education Research and Development
survey (2012), the University of Iowa ranked 48th among public and private universities
combined in terms of federally financed expenditures for research and development. Grants,
contracts and other sponsored agreements operating revenue exceeded $347 million in FY 2014,
$352 million in FY 2013 and $372 million in FY 2012.
Patient Services $1,462.0
58%
Sales and Services of Educational Departments $102.94%
Auxiliary Enterprises $179.67%
Other Operating Revenue $44.92%
Tuition and Fees $382.115%
Grants and Contracts $347.914%

13 Management’s Discussion and Analysis Management’s Discussion and Analysis 13
OPERATING EXPENSESFor the fiscal years ended June 30, 2014, 2013 and 2012, operating expenses totaled $2,746
million, $2,597 million and $2,542 million, respectively. Operating expenses increased
$149 million (5.7%) over FY 2013 expenses. The increase is primarily from patient services,
instruction and other operating expenses. The following is a graphic illustration of the
University’s operating expenses for the year ended June 30, 2014.
FY2014 OPERATING EXPENSES $2,745.8 million
Other operating expenses include Public Service (2014, $82 million; 2013, $80 million), Student
Services (2014, $32 million; 2013, $31 million), Institutional Support (2014, $64 million; 2013,
$79 million), Operation and Maintenance of Plant (2014, $79 million; 2013, $75 million),
Scholarships and Fellowships (2014, $31 million; 2013, $29 million), and Other (2014, $24
million; 2013, $3 million).
NONOPERATING REVENUES AND EXPENSESNonoperating revenues and expenses netted a positive $422.2 million for the fiscal year ended
June 30, 2014 and $339.4 million for the fiscal year ended June 30, 2013.
The following table summarizes the University’s nonoperating revenues and expenses for the years ended June 30, 2014, 2013 and 2012.
Patient Services $1,281.0
47%
Academic Support $167.4
6%Research $297.1
11%
Depreciation and Amortization $171.66%
Auxiliary Enterprises $166.76%
Other Operating Expenses $312.211%
Instruction $349.813%
NONOPERATING REVENUES (EXPENSES) (in millions)
2014Restated
2013Restated
2012
Nonoperating Revenues (Expenses)
State appropriations $238.1 $229.6 $232.0
Grants and contracts 15.7 16.1 16.0
Investment income, net of investment expenses 131.8 61.2 56.7
Gifts 83.4 74.1 68.4
Interest expense (35.5) (36.2) (32.1)
Loss on disposal of capital assets (11.3) (5.4) (1.4)
Net Nonoperating Revenues (Expenses) $422.2 $339.4 $339.6

14 Management’s Discussion and Analysis
State appropriations increased by $8.5 million (3.7%) in the fiscal year ended June 30, 2014.
Grants and contracts revenue decreased by $0.4 million (2.5%), investment income increased
by $70.6 million (115.4%) and gifts increased by $9.3 million (12.6%) in the fiscal year ended
June 30, 2014.
OTHER REVENUES AND EXPENSESNot included, by definition, as nonoperating revenues and expenses are state appropriations for
capital projects, contributions and grants for capital projects and reimbursement from FEMA
for capital costs, net of expenses. The other revenues and expenses increased from net revenue
of $51.0 million for the fiscal year ended June 30, 2013 to $93.3 million for the fiscal year ended
June 30, 2014, an increase of $42.3 million, or 82.9%. Capital appropriations, contributions,
and grants increased from $29.1 million for the fiscal year ended June 30, 2013 to $29.8 million
for the fiscal year ended June 30, 2014, an increase of $0.7 million, or 2.4%. For the fiscal years
ended June 30, 2014 and 2013, $63.5 million and $24.3 million, respectively, was recognized in
FEMA reimbursement for capital costs, net of expenses, an increase of $39.2 million, or 161.3%.
The net revenue is intended to fund flood-related expenses.
After insurance recoveries, FEMA has agreed to reimburse the University at 90% of actual cost
of approved project work orders. All FEMA related activity is reported in Other Revenues and
Expenses. In fiscal year 2014, the University received $74.8 million in FEMA reimbursements
towards flood-related costs expended ($63.5 million for capital costs and $11.3 million for
expenses).
STATEMENT OF CASH FLOWSThe Statement of Cash Flows provides information regarding the University’s cash receipts and
disbursements during the fiscal year. This provides an assessment of the University’s ability to
generate net cash flows and meet obligations as they come due. See Note 1 for a description of
reporting changes that have occurred with cash and cash equivalents.
The following table summarizes the University’s cash flow for the fiscal years ended June 30, 2014, 2013 and 2012.
The University’s overall liquidity decreased during the year, with a net decrease in cash and cash
equivalents of $6.0 million. The decrease is primarily due to the acquisition and construction of
capital assets.
CASH FLOWS FOR THE YEAR (in millions)
2014Restated
2013Restated
2012
Cash provided (used) by:
Operating activities ($51.4) $27.8 $26.4
Noncapital financing activities 338.0 335.8 356.6
Capital and related financing activities (298.4) (85.2) (277.7)
Investing activities 5.8 (290.0) (103.1)
Net change in cash and cash equivalents (6.0) (11.6) 2.2
Cash and cash equivalents, beginning of year 238.0 249.6 247.4
Cash and cash equivalents, end of year $232.0 $238.0 $249.6

15 Management’s Discussion and Analysis Management’s Discussion and Analysis 15
CAPITAL ASSETS AND DEBT ADMINISTRATION Capital AssetsThe following table summarizes the University’s capital assets, net of depreciation and amortization, as of June 30, 2014, 2013 and 2012.
The University of Iowa is currently in construction on numerous major, impactful projects
accounting for a campus construction workload of roughly $1.3 billion. A primary contributor
to the current construction workload continues to be related to recovery from the 2008 flood.
Construction is well underway on the three major flood replacement projects; Studio Art
Building, Voxman Music Building and Hancher Auditorium. Combined, these FEMA-supported
projects are budgeted at $404.9 million and all three are scheduled for completion in 2016.
There are a number of additional major flood repair, recovery and protection projects that are
also under construction. The Iowa Memorial Union ($27.3 million), the Theatre Building ($8.3
million), the Mayflower Residence Hall ($13.3 million) and the Iowa Advanced Technology
Laboratory ($18.3 million) are all scheduled to complete construction within the next year.
Construction work is coming to a close on the $133.7 million Pappajohn Biomedical Discovery
Building, and a follow-up project to fit out 35,000 gross square feet of research support space
underneath the adjacent site for $24.0 million will begin in the fall of 2014. Construction is well
underway for the new 500-bed Mary Louise Petersen residence hall on the west side of the Iowa
River. This 10-story $53.4 million facility, the first new residence hall on the UI campus since
1968, will be complete in the summer of 2015. The second phase of the UI Football Operations
project is scheduled to be complete in October, 2014. This project is budgeted at $36.6 million.
Interior renovations and modernization of the 1973-built College of Dentistry Building,
budgeted at $48.0 million, continue with completion scheduled for 2016. The first Design-Build/
Alternative Delivery project by a Regents institution was completed in September, 2014; the
delivery process for this $15.0 million indoor turf addition to the Hawkeye Campus Tennis
and Recreation Center has surpassed expectations and served as a model for future alternative
delivery efforts. The UIHC Children’s Hospital ($292 million) and the associated parking
structure ($77.0 mllion) are well into construction and are scheduled for completion in 2016.
CAPITAL ASSETS, NET OF DEPRECIATION AND AMORTIZATION (in millions)
2014 2013 2012
Nondepreciable/nonamortizable
Land $63.1 $63.1 $53.8
Construction in progress 585.3 386.9 256.3
Intangibles in development 15.6 6.4 5.1
Art & historical collections 25.0 33.7 33.3
Library materials 299.0 285.6 272.9
Depreciable/amortizable
Land improvements, net 5.6 6.8 5.8
Infrastructure, net 272.0 236.9 220.2
Buildings, net 1,395.4 1,374.0 1,339.3
Equipment, net 219.3 211.0 213.7
Intangibles, net 41.6 45.2 45.0
Total Capital Assets, Net $2,921.9 $2,649.6 $2,445.4

16 Management’s Discussion and Analysis16 Management’s Discussion and Analysis
Projects in design or study phases include a $96.3 million College of Pharmacy building, a $37.1
million addition to the College of Engineering Seamans Center and a $27.0 million building
for the Department of Psychology, within the College of Liberal Arts and Sciences. This project
will enable the modernization of the adjacent Seashore Hall complex, which was originally
constructed in 1899.
Additionally, the University has begun planning and programming for a new Museum of Art to
replace the flood damaged facility, which can no longer host the UI collection due to the inability
to insure the collection in the riverside facility. This project will be delivered as a private-public
partnership. While specific timing for these projects has yet to be determined, it is expected that
construction may begin in 2015 and 2016.
Additional information about the University’s capital assets is presented in Note 4 to the financial
statements.
DebtAs of June 30, 2014, the University had $1,330.5 million in outstanding bonds, notes and capital
leases, an increase of $89.0 million over the prior year. Debt principal payments of $61.1 million
and interest payments of $37.2 million were made during the fiscal year ended June 30, 2014.
The following table summarizes outstanding debt by type as of June 30, 2014, 2013 and 2012.
During the fiscal year ended June 30, 2014, $105.5 million of new revenue bonds were issued.
The revenue bond proceeds were $57.6 million for Academic Buildings, $27.9 million for
construction of a new residence hall and $20 million for construction of a new parking facility.
The University carries an Aa1 institutional bond rating from Moody’s and an AA rating from
Standard & Poor’s. UIHC carries a rating of AA2 and AA-. Additional information related to the
University’s long-term liabilities is presented in Note 5 to the financial statements.
BONDS, NOTES AND CAPITAL LEASES (in millions)
2014Restated
2013Restated
2012
Revenue bonds $1,257.7 $1,198.1 $957.3
Notes 52.4 22.1 16.8
Capital leases 20.4 21.3 -
Total Debt Outstanding $1,330.5 $1,241.5 $974.1

17 Management’s Discussion and Analysis Management’s Discussion and Analysis 17
ECONOMIC FACTORS THAT WILL AFFECT THE FUTURE The University of Iowa continues to have significant appeal to prospective students. This
is attributable, in great part, to the University’s high academic standards and its national
reputation as a best buy for prospective students. The University continues to draw a high
percentage of students from outside the state of Iowa, most notably from the state of Illinois. In
addition international non-resident undergraduate enrollment continues to increase and is at an
all-time high of 2,495 students. The University is pleased to report it has the most diversified
student body in its history. Total first year undergraduate enrollment for the 2013-2014 academic
term is 4,666, which is up 4.6% over the prior year. Total enrollment for fall 2014 is 31,387, the
second highest enrollment in the University’s history. It is forecasted that these trends will
continue with strong enrollment demand at the University of Iowa, despite overall neutral high
school graduation demographics within the state of Iowa.
The University continues to be one of the nation’s top research-intensive universities with grant
and contract research awards to the University exceeding $400 million per year for the past 6
years. The recent completion of new research labs, hiring of highly productive faculty within
focused clusters, and infrastructure improvements will enable the University’s researchers
to be more productive and better positioned to compete for external grants and contracts as
new sponsored research opportunities emerge. Particular emphasis is on developing stronger
partnerships with industry leading to improved marketability of intellectual capital generated by
UI faculty and staff. The University’s new Informatics Program and related facilities will add a
competitive edge to many research categories.
As economic conditions continue to improve in the United States and around the globe, the
University is experiencing benchmark or better returns in its operating, intermediate and long
term investment pools. The University is benefitting from these returns, but doing so with
attention to liquidity and risk. The Board of Regents investment advisor, Wilshire & Associates,
is a partner in this process to ensure prudently managed and well diversified investment
portfolios.
The University of Iowa Hospitals & Clinics continues to be recognized as one of the nation’s
best, and has achieved successful operating results for fiscal year 2014 with an operating margin
of 4.6%. According to US News & World Report, UIHC was ranked among the top 3% in the
U.S. in its annual “best hospitals” rankings. Seventeen programs were ranked in the top 50 in
the country. Of the seventeen, nine are in adult specialties and eight are in pediatric specialty
areas. The University of Iowa Health Care continues to report robust patient census data and
strong financial performance overall. Iowa’s future doctors are in a great learning environment
attributable to outstanding medical faculty and exposure to a high complexity case mix at
UIHC.
The state economy continues to report revenue growth over the prior year. The state increased
the University’s general education fund appropriation by $8.9 million or approximately 4.0%
for fiscal year 2015. These funds were invested toward increasing access and quality for Iowa
students within the University’s undergraduate, graduate and professional programs.

18 Statement of Net Position
ASSETS2014
Restated 2013
Current Assets:
Cash and cash equivalents $127,839 $152,807 Deposits with trustees 31 -Investments 220,007 176,914Accounts receivable, net 305,263 282,192Notes receivable, net 2,255 2,286Interest receivable 1,442 1,242Due from government agencies 77,097 70,830Inventories 28,898 28,643Prepaid expenses and other current assets 14,074 22,483
Total current assets 776,906 737,397
Noncurrent Assets:
Cash and cash equivalents 104,151 85,235Deposits with trustees 14,971 20,443Investments 1,866,178 1,788,936Notes receivable, net 24,647 23,866Investment in wholly owned subsidiary 69,580 63,688Capital assets, net 2,921,875 2,649,564
Total noncurrent assets 5,001,402 4,631,732
Total Assets 5,778,308 5,369,129
DEFERRED OUTFLOWS OF RESOURCES
Deferred Outflows 2,883 2,523
Total Assets and Deferred Outflows of Resources $5,781,191 $5,371,652
Statement of Net Position June 30, 2014 (in thousands)With comparative statement as of June 30, 2013

Statement of Net Position 19
Statement of Net Position, continued June 30, 2014 (in thousands)With comparative statement as of June 30, 2013
LIABILITIES2014
Restated 2013
Current Liabilities:
Accounts payable $106,882 $84,696 Salaries and wages payable 159,919 154,176Unpaid claims 26,597 25,690Unearned revenue 42,992 57,093Interest payable 17,092 15,808Long term debt 59,441 49,740Other long term liabilities 95,073 92,854Deposits held in custody for others 257,230 252,832
Total current liabilities 765,226 732,889
Noncurrent Liabilities:
Accounts payable 27,250 33,596 Long term debt 1,271,084 1,191,875Other long term liabilities 143,149 129,454
Total noncurrent liabilities 1,441,483 1,354,925
Total Liabilities 2,206,709 2,087,814
DEFERRED INFLOWS OF RESOURCES
Debt refunding gain 6,551 5,152Contract and grant deferred inflows 85 -
Total Deferred Inflows of Resources 6,636 5,152
NET POSITION
Invested in capital assets, net of related debt 1,777,534 1,615,412Restricted:
Nonexpendable 117,437 108,231Expendable 321,385 304,003
Unrestricted 1,351,490 1,251,040
Total Net Position 3,567,846 3,278,686
Total Liabilities, Deferred Inflows of Resources and Net Position $5,781,191 $5,371,652
The accompanying notes are an integral part of these financial statements.

20 Statement of Revenues, Expenses, and Changes in Net Position
Statement of Revenues, Expenses and Changes in Net Position For the year ended June 30, 2014 (in thousands) With comparative statement for the year ended June 30, 2013
Operating Revenues: 2014Restated
2013
Student tuition and fees, net of scholarship allowances of $95,162 and $91,907 for the years ended June 30, 2014 and 2013, respectively (pledged as payment on revenue bonds)
$382,136 $374,773
Federal grants and contracts 280,673 304,439State and other governmental grants and contracts 18,118 13,653Nongovernmental grants and contracts 49,126 34,210Patient services, net of write-offs, contractual adjustments and indigent
care of $2,424,586 and $2,280,759 for the years ended June 30, 2014 and 2013, respectively (pledged as payment on revenue bonds)
1,461,969 1,356,530
Sales and services of educational departments 102,949 108,291Interest on student loans 702 763Auxiliary enterprises, net of scholarship allowances of $8,626 and
$8,365 for the years ended June 30, 2014 and 2013, respectively (pledged as payment on revenue bonds)
179,465 175,299
Other operating revenue 44,208 24,895
Total Operating Revenues 2,519,346 2,392,853
Operating Expenses:
Instruction 349,814 335,972Research 297,059 287,370Public service 81,910 80,060Academic support 167,424 163,080Patient services 1,281,003 1,189,980Student services 32,024 31,131Institutional support 64,216 78,580Operation and maintenance of plant 78,999 74,863Scholarships and fellowships 30,833 28,726Depreciation and amortization 171,609 167,827Auxiliary enterprises 166,654 157,475Other operating expenses 24,256 2,829
Total Operating Expenses 2,745,801 2,597,893
Operating (Loss) (226,455) (205,040)
Nonoperating Revenues (Expenses):
State appropriations 238,097 229,634Federal grants and contracts 15,661 16,146Investment income, net of investment expenses of $1,465 and $1,059 for the years ended June 30, 2014 and 2013, respectively
131,766 61,192
Gifts 83,459 74,090Interest expense (35,457) (36,235)Loss on disposal of capital assets (11,285) (5,435)
Net Nonoperating Revenues (Expenses) 422,241 339,392
Income Before Other Revenues 195,786 134,352
Other Revenues (Expenses)
Capital appropriations, State 21,440 19,888Capital contributions and grants 8,428 9,164FEMA reimbursement for capital costs, net of expenses 63,506 24,344
Net Other Revenues (Expenses) 93,374 53,396
Increase in Net Position 289,160 187,748
Net Position
Net position, beginning of year 3,278,686 3,090,938
Net position, end of year $3,567,846 $3,278,686
The accompanying notes are an integral part of these financial statements.

Statement of Cash Flows 21
2014 Restated
2013
Cash Flows From Operating Activities
Tuition and fees $383,829 $371,771 Patient receipts 1,443,342 1,345,040Grants and contracts 331,593 370,212Payments for salaries and benefits (1,541,729) (1,492,044)Payments for goods and services (787,606) (714,302)Scholarships (30,833) (28,726)Loans issued to students (5,624) (5,346) Collections of loans from students 4,794 4,960Sales of educational activities 99,052 111,720Other receipts 45,089 45,263Auxiliary enterprise receipts 173,396 176,697Auxiliary enterprise payments (166,654) (157,475)
Net Cash Provided by Operating Activities (51,351) 27,770
Cash Flows From Noncapital Financing Activities
State appropriations 238,098 229,634Grants and contracts 15,661 16,146Proceeds from noncapital gifts 83,459 74,090Funds held for others receipts 230,549 284,863Funds held for others payments (229,809) (269,899)William D. Ford Direct Lending & Plus Loans receipts 164,160 202,126William D. Ford Direct Lending & Plus Loans made (162,050) (201,125)Other noncapital receipts (payments) (2,110) (14)
Net Cash Provided by Noncapital Financing Activities 337,958 335,821
Cash Flows From Capital and Related Financing Activities
Acquisition and construction of capital assets (453,903) (355,438)Interest paid on capital debt and leases (37,239) (34,751)Proceeds from sale of capital assets 1,320 563Capital appropriations 22,059 19,709Capital gifts and grants received 7,356 8,436 Deposits with trustee 5,441 (1,234)Principal paid on capital debt and leases (61,089) (45,123)Proceeds from capital debt and leases 158,045 296,328Defeased debt payments (54,930) (57,400)Other capital and related financing receipts 114,496 83,723
Net Cash (Used) by Capital and Related Financing Activities (298,444) (85,187)
Cash Flows From Investing Activities
Interest and dividends on investments 31,610 35,679Proceeds from sale and maturities of investments 1,158,442 1,017,184Purchase of investments (1,184,267) (1,342,826)
Net Cash (Used) by Investing Activities 5,785 (289,963)
Net Increase in Cash and Cash Equivalents (6,052) (11,559)
Cash and Cash Equivalents, beginning of year 238,042 249,601
Cash and Cash Equivalents, end of year $231,990 $238,042
Statement of Cash Flows For the Year ended June 30, 2014 (in thousands)With comparative statement for the year ended June 30, 2013

22 Statement of Cash Flows
2014Restated
2013
Reconciliation of Cash and Cash Equivalents to the Statement of Net Position:
Cash and cash equivalents in current assets $127,839 $152,807 Noncurrent cash and cash equivalents 104,151 85,235
Total Cash and Cash Equivalents $231,990 $238,042
Reconciliation of Operating (Loss) to Net Cash Provided by Operating Activities:
Operating (loss) ($226,455) ($205,040)Adjustments to reconcile operating (loss) to net cash provided by operating activities: Depreciation and amortization expense 171,609 167,827
Changes in operating assets and liabilities:Accounts receivable, net (19,677) (9,988)Interest receivable (447) 315Inventories (255) 1,658 Prepaid expenses and other current assets 8,407 (11,093)Due from government agencies, net of receivable from
State for capital appropriations (6,885) 30,459Notes receivable, net (750) (77)Accounts payable 14,663 26,423Salaries and wages payable 5,743 5,668Unpaid claims liability 908 2,574Other long term liabilities 270 580Unearned revenue (14,124) 5,447Other postemployment benefits other than pension liability 15,090 10,980Compensated absences 3,004 5,444Early retirement benefits (2,452) (3,407)
Net Cash Provided by Operating Activities ($51,351) $27,770
Significant Noncash Transactions:
Assets acquired under capital leases - $21,313 Assets acquired by gift $1,071 $727 Net unrealized gain on investment $80,016 $15,056
The accompanying notes are an integral part of these financial statements.
Statement of Cash Flows For the year ended June 30, 2014 (in thousands)With comparative statement for the year ended June 30, 2013

Consolidated Statement of Financial Position 23
ASSETS 2014 2013
Cash and cash equivalents $17,168 $14,355
Receivables:
Pledges, at net present value, less allowance for doubtful pledges 124,161 105,026 Other receivables and prepaids 356 434
124,517 105,460
Investments:
Carried at fair valueU.S. Government and governmental agency securities 5,018 5,177Corporation stocks, primarily common stocks 4,127 3,446Managed separate investment accounts, primarily equity securities 1,021,633 922,708Assets in living trusts, testamentary trusts and gift annuities 69,998 63,761Beneficial interest in perpetual trusts 13,139 11,916
1,113,915 1,007,008
Other:
Real estate 6,123 6,135Cash value of life insurance 5,762 5,433Other 936 936
12,821 12,504
Property leasehold interest and equipment, net 19,373 19,750
Total Assets $1,287,794 $1,159,077
LIABILITIES AND NET ASSETSLiabilities:
Accounts payable and accrued expenses $2,116 $1,646 Annuity and life income obligations 28,992 28,123 Capital lease obligation 3,760 4,430 Amounts held on behalf of others 99,516 89,034
134,384 123,233
Net Assets:
Unrestricted 29,376 23,120Temporarily restricted 562,831 486,934Permanently restricted 561,203 525,790
1,153,410 1,035,844
Total Liabilities and Net Assets $1,287,794 $1,159,077
The accompanying notes are an integral part of these financial statements.
Consolidated Statement of Financial Position June 30, 2014 (in thousands)With comparative statement as of June 30, 2013
THE STATE UNIVERSITY OF IOWA FOUNDATION AND AFFILIATES

24 Consolidated Statement of Actvities
UnrestrictedTemporarily
RestrictedPermanently
Restricted 2014 Total 2013 Total
Support and revenue:
Total contributions raised $1,769 $81,360 $32,265 $115,394 $95,266 Change in value of life income gifts - 3,940 3,320 7,260 6,534Less amounts raised on behalf of others - (5,365) (1,749) (7,114) (7,134)
Total contributions and change in value of life income gifts 1,769 79,935 33,836 115,540 94,666
Investment income:Interest and dividends 1,588 2,167 - 3,755 5,352Asset based management and service fees 11,905 (11,718) - 187 182Change in fair value of investments 4,972 105,697 - 110,669 82,085Less amounts attributed to others - (9,429) - (9,429) (7,553)
Total investment income 18,465 86,717 - 105,182 80,066
Other revenue:Other, primarily fundraising service revenue 9,865 2,951 - 12,816 13,040Less amounts attributed to others - (584) - (584) (562)
Total other revenue 9,865 2,367 - 12,232 12,478
Net assets released from restrictions and changes in donor restrictions 91,544 (93,122) 1,578 - -
Total support and revenue 121,643 75,897 35,414 232,954 187,210
Expenditures on behalf of The State University of Iowa and Affiliates:
Student financial aid 22,376 - - 22,376 16,161Faculty support 13,887 - - 13,887 12,337Research 19,133 - - 19,133 15,796Facilities and equipment 22,741 - - 22,741 22,104Program support 11,268 - - 11,268 16,916Fundraising 6,312 - - 6,312 6,079Management and service fees 2,473 - - 2,473 2,467
98,190 - - 98,190 91,860Less amounts incurred on behalf of others (6,646) - - (6,646) (6,672)
Total 91,544 - - 91,544 85,188
Expenses of The State University of Iowa Foundation and Affiliates:
Operating Expenses 23,844 - - 23,844 23,065
Total expenses 115,388 - - 115,388 108,253
Change in net assets 6,255 75,897 35,414 117,566 78,957
Net assets, beginning of year 23,120 486,934 525,790 1,035,844 956,887
Net assets, end of year $29,375 $562,831 $561,204 $1,153,410 $1,035,844
The accompanying notes are an integral part of these financial statements.
Consolidated Statement of Activites For the year ended June 30, 2014 (in thousands)With comparative statement for the year ended June 30, 2013
THE STATE UNIVERSITY OF IOWA FOUNDATION AND AFFILIATES

25 Notes to Financial Statements Notes to Financial Statements 25
Notes to Financial Statements
Note 1—Organization and Summary of Significant Accounting Policies
ORGANIZATIONThe State University of Iowa (University), located in Iowa City, Iowa, is a coeducational university
owned and operated by the State of Iowa (State) under the supervision of the Board of Regents,
State of Iowa (Board of Regents). The University was established by the First General Assembly
on February 25, 1847, and has been in continuous operation since classes began in 1855.
The University is classified as a state instrumentality under Internal Revenue Code Section 115
and its income is exempt from federal income taxes. Certain activities of the University may be
subject to taxation as unrelated business income under Internal Revenue Code Sections 511 to
514.
BASIS OF PRESENTATIONThe financial statements have been prepared in accordance with accounting principles generally
accepted in the United States of America, as prescribed by the Governmental Accounting
Standards Board (GASB). These statements present the University as a whole. These GASB
Statements establish standards for external financial reporting for public colleges and
universities and require that resources be classified for accounting and reporting purposes into
four net position categories:
• Net investment in capital assets—Capital assets, net of accumulated depreciation
and amortization and reduced by outstanding debt attributable to the acquisition,
construction, or improvement of those assets.
Left: Progress continues on the new 14-story University of Iowa Children’s Hospital, scheduled for completion in 2016. It takes construction crews three to four weeks to complete each floor. Right: Construction on the Voxman Music Building is under way on the corner of Burlington and Clinton streets. It will be occupied in fall 2016, replacing a facility destroyed by the 2008 flood.

26 Notes to Financial Statements
• Restricted, nonexpendable—Net position subject to externally imposed constraints
in which the donors or other outside sources have stipulated as a condition that the
principal is to be retained in perpetuity. Such assets include the University’s permanent
endowments.
• Restricted, expendable—Net position whose use by the University is subject to externally
imposed constraints that can be fulfilled by actions of the University pursuant to those
constraints or that expire by the passage of time.
• Unrestricted—Net position not subject to externally imposed constraints which may be
used by the governing board to meet current obligations for any purpose. Unrestricted
net position is derived from student tuition and fees, state appropriations, and sales and
services of auxiliary enterprises and are generally designated for academic, research and
capital programs or to meet contractual obligations of the University.
When an expense is incurred in which both unrestricted and restricted net position are available,
the University’s policy is to first apply the expense against the restricted, and then toward the
unrestricted net position.
FINANCIAL REPORTING ENTITYThe University’s financial statements include schools, colleges and departments, the University
of Iowa Hospitals & Clinics (UIHC), the Iowa Medical Mutual Insurance Company (IMMIC,
a captive insurance company) and certain affiliated operations determined to be a part of
the University’s financial reporting entity. The University has also considered all potential
component units for which it is financially accountable, and other organizations for which the
nature and significance of their relationship with the University are such that exclusion would
cause the University’s financial statements to be misleading or incomplete. GASB has set forth
criteria to be considered in determining financial accountability. The GASB classification of
these entities for the University’s financial reporting purposes does not affect their respective
legal or organizational relationships with the University. As required by United States generally
accepted accounting principles as prescribed by the GASB, these financial statements present
the University and its component units. These component units are included in the University’s
reporting entity because of the significance of their operational or financial relationships with
the University. These component units are separate legal entities from the University, but are so
intertwined with the University they are, in substance, the same as the University.
Blended Component UnitsThe Iowa Measurement Research Foundation, Miller Endowment, Incorporated and University
of Iowa Research Park Corporation are included in the reporting entity as blended component
units. These legally separate entities are included in the University’s financial reporting entity
because of the nature of their relationship to the University.
The Iowa Measurement Research Foundation (IMRF) was formed in 1970 under the provisions
of the Iowa Nonprofit Corporation Act. The primary purpose of the Foundation is to advance
and extend knowledge in the field of educational measurement by providing financial assistance
to The University of Iowa and its College of Education for promising research and educational
projects in furtherance of this purpose.

27 Notes to Financial Statements Notes to Financial Statements 27
Miller Endowment, Incorporated was established December 18, 1995 pursuant to the will
and codicil of F. Wendell Miller. The will and codicil appointed the presidents of Iowa State
University and the State University of Iowa as coexecutors of the Miller Estate and co-trustees of
the Miller Endowment Trust, a charitable trust, and further directed that the two universities be
equal beneficiaries of the income from said trust. The will and codicil also directed the
trustees to have the right and discretion to create a charitable corporation, to be “Miller
Endowment, Incorporated”, to own, administer and control the affairs and property of the trust.
This corporation has been organized under Chapter 504A of the Code of Iowa and Section
501(C)(3) of the Internal Revenue Code. During fiscal year 1998, the assets of the trust were
officially transferred to Miller Endowment, Incorporated. Since the net revenues and assets of
the corporation are solely for the equal benefit of the two universities, one half of the value of the
corporation’s transactions has been blended into the University’s operations.
The University of Iowa Research Park Corporation (Corporation) is a not-for-profit corporation
and a component unit of the University of Iowa (University). The Corporation leases from the
State of Iowa approximately 213 acres of land located in the University of Iowa Research Park.
The land subject to this lease is designated as the University of Iowa Research Park and is platted
as a subdivision of Coralville, Iowa. Under terms of its master lease with the State of Iowa, the
Corporation subleases parcels of the University of Iowa Research Park to businesses (or to private
developers working on behalf of businesses) wishing to locate close to the University and its
research assets.
The Corporation’s revenues derive primarily from the proceeds of its leases to tenant companies
or developers and from an annual special purpose appropriation from the State of Iowa.
Discretely Presented Component UnitsThe State University of Iowa Foundation and Affiliates (Foundation), the University of Iowa
Research Foundation, and the University of Iowa Health System and Subsidiaries are included in
the reporting entity as discretely presented component units. These legally separate entities are
included in the University’s financial reporting entity because of the nature of their relationship
to the University.
The State University of Iowa Foundation and Affiliates (Foundation) is a legally separate,
tax-exempt component unit of the University. The Foundation’s financial statements include
its affiliated organization, the University of Iowa Facilities Corporation, wholly controlled by
the Foundation. Additional information regarding the University of Iowa Facilities Corporation
is provided in the footnote Investments in Subsidiaries (Foundation). The Foundation acts
primarily as a fundraising organization to supplement the resources that are available to the
University in support of its programs. Although the University does not control the Foundation
or the timing or amount of receipts from the Foundation, the majority of resources, or income
thereon, the Foundation holds and invests are restricted to the activities of the University by the
donors. Because these restricted resources held by the Foundation can only be used by, or for the
benefit of, the University, the Foundation is considered a component unit of the University and is
discretely presented in the University’s financial statements.

28 Notes to Financial Statements
During the years ended June 30, 2014 and 2013, the Foundation distributed to the University
or expended on behalf of the University $91,544,000 and $85,188,000, respectively, for both
restricted and unrestricted purposes.
The Foundation is a nonprofit organization that reports under FASB standards, including
FASB Statement No. 117, Financial Statements for Not-for-Profit Organizations. As such,
certain revenue recognition criteria and presentation features are different from GASB
revenue recognition criteria and presentation features. No modifications have been made to
the Foundation’s financial information in the University’s financial reporting entity for these
differences.
The Foundation acts as an agent for other organizations benefiting the University. Since the
Foundation is not considered to be financially interrelated to these organizations, as defined
by SFAS No. 136, the total amount of funds held on behalf of these organizations has been
reflected as a liability in the Consolidated Statement of Financial Position (Amounts held on
behalf of others). The Foundation does not have variance power to redirect the assets held
for others and the funds are generally payable on demand. In the Statement of Activities, the
Foundation reports the gross amounts of support, revenue and expenses with the amount raised
and expended on behalf of these organizations shown as a reduction in the gross amounts of
support, revenue and expenses.
Assets held on behalf of these organizations include remainder interests in trusts, pledges and
investments, which are for the benefit of the University.
The following table identifies these legally separate, tax-exempt organizations (in thousands):
Although the University is the exclusive beneficiary of the Foundation, the Foundation is
independent of the University in all respects. The Foundation is not a subsidiary or affiliate
of the University and is not directly or indirectly controlled by the University. Moreover, the
assets of the Foundation are the exclusive property of the Foundation and do not belong to the
University. The University is not accountable for, and does not have ownership of, any of the
financial and capital resources of the Foundation. The University does not have the power or
authority to mortgage, pledge, or encumber the assets of the Foundation. The Board of Directors
of the Foundation are entitled to make all decisions regarding the business and affairs of the
Foundation, including, without limitation, distributions made to the University. Third parties
dealing with the University should not rely upon the financial statements of the Foundation for
any purpose without consideration of all of the foregoing conditions and limitations.
Amounts Held on
Behalf of Others
Iowa Law School Foundation $80,579
Iowa Scholarship Fund 10,384
University of Iowa Alumni Association 7,140
Student Publications Incorporated 1,413
Total $99,516
29 Notes to Financial Statements Notes to Financial Statements 29
Complete financial statements for the Foundation can be obtained from The University of Iowa
Foundation, One West Park Road, P.O. Box 4550, Iowa City, Iowa 52244-4550, Attn: Controller.
The University of Iowa Research Foundation (UIRF) – a 501(c)(3) corporation – commercializes
University of Iowa (University) developed technologies and inventions through licensing and
new venture formation, and manages the subsequent revenue stream. UIRF’s primary functions
are:
• Licensing: finding suitable partners for commercialization of University technologies and
inventions;
• New Ventures: identifying and helping develop new high growth University technology
spinout companies suitable for licensing UIRF technologies;
• Intellectual Property (IP) Management: protecting University inventions through patents
and copyrights, advising on IP terms for Clinical Trials and Sponsored Research, and
executing out-going material transfer agreements.
The University owns inventions made by faculty, staff, or students during the course of the
inventor’s employment by or association with the University, or if the invention was enabled
by significant use of the University resources. The University may take an ownership stake in
inventions stemming from privately sponsored research, and as a consequence of federal law,
the Bayh-Dole Act. All inventions arising from federal research support must be disclosed to the
University and must be reported to the associated funding agencies.
The UIRF was created in 1975 as a private, nonprofit, corporation tied to the University as the
designated manager for these inventions and selected University intellectual properties. The
intention of the UIRF is to effectively manage University intellectual property to successful
outcomes including: transferring University inventions to the marketplace for public benefit;
generating significant income; operating as a self-sustaining operation; and supporting the
research mission.
University of Iowa Health System (UIHS) was incorporated under the provisions of the Iowa
Nonprofit Corporation Act on December 2, 1994. UIHS was formed to support the clinical,
academic, and research programs of the University of Iowa College of Medicine (UICOM) and
the University of Iowa Hospitals and Clinics (UIHC).
UIHS does not have members with voting rights. Upon dissolution, any remaining assets will
be transferred to the University of Iowa, or its successor, if in existence. Otherwise the assets
may be transferred by the board of directors to various entities exclusively for public purposes in
accordance with the articles of incorporation for UIHS.
UIHS has a for-profit wholly owned subsidiary, University of Iowa Community Medical Services,
Inc. (UICMS), which was formed in 1995 and began operations in 1996. UICMS has a for-profit
wholly owned subsidiary, University of Iowa Community Homecare, Inc. (UICH), which was
also formed in 1995 and began operations in 1996.
UIHS has a wholly owned subsidiary, UI HealthWorks, L.L.C. (UIHW), which was formed and
began operations in 1998.

30 Notes to Financial Statements
BASIS OF ACCOUNTINGFor financial reporting purposes, the University is considered a special-purpose government
engaged only in Business Type Activity as defined in GASB Statement No. 35 Basic Financial
Statements-and Management’s Discussion and Analysis-for Public Colleges and Universities.
Accordingly, the financial statements of the University have been prepared using the economic
resources measurement focus and the accrual basis of accounting. As a result, revenues
are recognized when earned, expenses are recorded when an obligation is incurred and all
significant intra-agency transactions have been eliminated.
CASH AND CASH EQUIVALENTSFor purposes of the Statement of Net Position and Statement of Cash Flows, cash and cash
equivalents are reported in accordance with Board of Regents, State of Iowa policy Chapter
7.04, section H.2 (www.regents.iowa.gov/Policies/Chapter%207/chapter7.04.htm), as amended,
which states, in part: to appropriately reflect the Board’s overall investment strategy and as
outlined in the GASB Statement No. 9 Reporting Cash Flows of Proprietary and Nonexpendable
Trust Funds and Governmental Entities That Use Proprietary Fund Accounting, paragraph
11), that all funds held by external investment managers, as defined in section 7.04.C.4 of the
Board’s investment policy, shall be reported on the audited financial statements of the Regent
institutions as investments. Investments purchased by the institutions through Board authorized
brokerage firms that meet the definition of cash equivalents, investments with original purchase
dates to maturity of three months or less shall be reported on the audited financial statements of
the Regent institutions as cash equivalents.
INVESTMENTS (UNIVERSITY)Investments are reported at fair value in accordance with GASB Statement No. 31 Accounting
and Financial Reporting for Certain Investments and for External Investment Pools and GASB
Statement No. 34 Basic Financial Statements-and Management’s Discussion and Analysis-for
State and Local Governments. Changes in unrealized gain (loss) on the carrying value of the
investments are reported as a component of investment income in the Statement of Revenues,
Expenses and Changes in Net Position.
INVESTMENTS (FOUNDATION)In accordance with FASB 157, Fair Value Measurements, investments of the Foundation are
carried at fair value as determined by values provided by an external investment manager
and quoted market values. The carrying values of other investments and long-term liabilities
approximate fair values because these financial instruments bear interest at rates that
approximate current rates the Foundation could obtain on contracts or notes with similar
maturities and credit qualities.
PLEDGES RECEIVABLE (FOUNDATION)Pledges receivable are recorded at the net present value of estimated cash flows based on
appropriate rates commensurate with the risks involved, less an allowance for doubtful pledges.
Conditional promises to give are not included as support until the conditions are met. The
provision for losses on doubtful pledges is an adjustment to contributions at the time the pledge
is made equal to 2.5% of gross pledges. Pledges written off totaled $1,243,000 and $3,283,000 for
the years ended June 30, 2014 and 2013.

31 Notes to Financial Statements Notes to Financial Statements 31
INVENTORIESInventories, primarily expendable materials and supplies held for consumption, are valued using
the lower of cost or market, with cost determined on the first-in, first-out or weighted average
basis.
CAPITAL ASSETSCapital assets estimated to have a useful life greater than one year are stated at cost at the date of
acquisition or estimated fair market value at date of receipt in the case of gifts. The capitalization
thresholds for capital assets are as follows:
• Purchased equipment $5,000
• Leased capital equipment $50,000
• Intangible assets, non-UIHC $500,000
• Intangible assets, UIHC $5,000
• Art Assets $5,000 (effective beginning with FY 2014)
Library materials for the Main Library and Law Library are capitalized as a collection and
adjusted annually to account for additions, withdrawals, etc. Effective with fiscal year 2013,
adjustments to library collections excluded acquisitions of electronic subscriptions to which the
University does not have perpetual access. Routine repair and maintenance costs are expensed as
incurred. Interest costs are capitalized on University construction projects when the interest cost
during the construction period exceeds the interest earned on the investment of debt proceeds.
Depreciation and amortization of capital assets is calculated using the straight-line method over
the estimated useful lives (five to fifty years) of the respective assets.
WHOLLY OWNED SUBSIDIARY (UNIVERSITY)The University owns all of the outstanding stock of Musser-Davis Land Company (acquired
by gift) and reports such ownership as a wholly owned subsidiary. The Company’s operations
consist primarily of leasing mineral rights to others and planting seedlings to be harvested by
others. The Company’s fiscal year ends December 31 and its financial statements are presented
on a modified cash basis of accounting. As of December 31, 2013, assets (including investments
of $67,806,000) totaled $69,580,000, liabilities were $0 and net assets were $69,580,000. As of
December 31, 2012, assets (including investments of $61,915,000) totaled $63,688,000, liabilities
were $0 and net assets were $63,688,000.
INVESTMENTS IN SUBSIDIARIES (FOUNDATION)The University of Iowa Facilities Corporation (Corporation) is an affiliate of the Foundation
because the Foundation elects the Corporation’s Board of Directors. The Corporation is
organized to assist the Foundation in its programs which support the University. The
Corporation accomplishes this objective by acquiring and holding property for the benefit and
use of the University. The Corporation may incur debt obligations, either through the issuance
of bonds or incurring commercial mortgages, for the purchase of properties. Simultaneously,
the Corporation leases these buildings to the University. The lease agreements provide for the
University to service the debt and pay for expenses related to the facilities. The leases also provide
for the Corporation to convey title of the facilities to the University at the end of each lease term
when the debt agreements are fully amortized.

32 Notes to Financial Statements
Since the Corporation has not and will not have an economic interest in the outstanding bonds,
the asset and the related debt and revenue and expenses related to the asset are not recorded
on the financial statements of the Corporation. The asset and the related debt and revenue and
expenses related to the asset are recorded as a segment of the University and included within the
University’s financial statements.
The Corporation also acquires and holds real estate, which will ultimately be deeded to the
University after a period of time. These assets are recorded on the Corporation’s books.
The assets and net income (loss) of the subsidiaries described above are not material to the
financial statements and the Foundation uses the equity method of accounting for its investment
in these controlled corporations.
BOND ISSUANCE COSTS, DISCOUNTS, AND PREMIUMSBond issuance costs are expensed in the year the bonds are sold. Bond discounts and premiums
are deferred and amortized over the life of the bonds using the effective interest rate method.
UNEARNED REVENUEUnearned revenue includes advance tickets sales, student tuition related to next fiscal year and
amounts received from leases, grants and contracts that have not yet been earned.
COMPENSATED ABSENCES PAYABLEUniversity employees accumulate vacation and sick leave under the provisions of Chapters 70A
and 262 of the Code of Iowa. It is the policy of the State to liquidate these accrued benefits under
specific circumstances. The State pays for accrued vacation at 100% of the employee’s hourly
rate upon retirement, death, or termination and, with certain exceptions, for accrued sick leave
at 100% of the hourly rate to a maximum of $2,000 upon retirement. The liability for accrued
compensated absences as reported in the Statement of Net Position is based on the current rates
of pay.
LONG TERM DEBT AND OTHER LONG TERM LIABILITIESLong term debt includes principal amounts of revenue bonds payable, notes payable and
capital lease obligations with contractual maturities greater than one year. Long term debt also
includes unamortized discounts and premiums, resulting from bond issuances. Other long
term liabilities include estimated amounts for accrued early retirement benefits, accrued other
postemployment benefits, compensated absences payable, refundable allowances on student
loans and unearned revenue that will not be earned within the next fiscal year.
DEFERRED OUTFLOWS AND INFLOWS OF RESOURCESDeferred outflows include unamortized bond refunding losses. Deferred inflows include
unamortized bond refunding gains and qualifying receipts for sponsored programs. Bond
refunding losses and gains are the difference between the reacquisition price of the new debt
and the net carrying amount of the debt being refunded. The receipts for sponsored programs
represent resources received before time requirements are met, but after all other eligibility
requirements have been met.

33 Notes to Financial Statements Notes to Financial Statements 33
FRINGE BENEFITSThe University utilizes the fringe benefits pool method to account for fringe benefits. Under
the fringe benefits pool method, fringe benefits are expensed as a percentage of actual salary or
wage costs. The use of fringe benefits rates rather than actual fringe benefits costs is accepted
by the Federal Government and widely used by universities. Rates are reviewed annually prior
to the beginning of the fiscal year and adjusted to reflect differences between the rates charged
and actual benefits costs as well as future benefits projections. The Federal Government must
approve the annual rate study.
DEFINITION OF OPERATING ACTIVITIESOperating activities reported on the Statement of Revenues, Expenses and Changes in Net
Position are those that generally result from exchange transactions, such as payments received
for providing services and payments made for services or goods received. Nearly all of the
University’s expenses are from exchange transactions. Certain significant revenue streams relied
upon for operations are recorded as nonoperating revenues, as defined by GASB Statement No.
35, including state appropriations, gifts and investment income.
NON-VESTED EQUIPMENTCapital assets purchased with restricted contract and grant proceeds have been excluded from
the Statement of Net Position.
USE OF ESTIMATESThe preparation of financial statements in conformity with United States generally accepted
accounting principles requires management to make estimates and assumptions that affect
certain reported amounts and disclosures. Actual results could differ from those estimates.
RECLASSIFICATIONSCertain amounts presented for the prior year have been reclassified to be consistent with the
current years’ presentation. Not all investments that qualify are required to be treated as cash
equivalents. As permitted by GASB Statement No. 9 , certain amounts previously reported as
cash and cash equivalents in the prior year have been reclassified as investments to more closely
conform to the purpose of those investments. Note 1 to the financial statements for Cash and
Cash Equivalents describes the University’s policy for determining which short-term, highly
liquid investments are treated as cash equivalents.
Note 2—Cash, Cash Equivalents, Investments, And Deposits With Trustees
CASH AND CASH EQUIVALENTSA summary of the book and bank balances for cash and cash equivalents at June 30, 2014 and 2013 is as follows (in thousands):
2014 2013
Book Balance $231,990 $238,042
Bank Balance 245,911 257,464
Covered by FDIC insurance or State Sinking Fund 99,681 63,391
Invested in money market funds as cash equivalents 146,230 194,073

34 Notes to Financial Statements
The University’s balances for current cash and cash equivalents represent amounts that
are reasonably expected to be consumed within a year and are comprised of deposit and
disbursement bank accounts, the liquidity pool components of money market funds, demand
deposit accounts, savings accounts, and government securities for the debt service and
construction fund balances for bonded enterprises. As defined by Board of Regents, State of
Iowa policy Chapter 7.04 (http://www.regents.iowa.gov/Policies/Chapter%207/chapter7.04.htm)
the primary goal of the liquidity pool is to maintain the necessary liquidity to match expected
liabilities while seeking to preserve capital and obtain a reasonable return for a prudent level of
risk. The liquidity pool shall be managed to ensure funds are available to support operations for
the current budget year.
Cash and cash equivalents are used to fund obligations such as controlled disbursements for
accounts payable, salaries and wages payable, bond principal and interest payments, and federal
and state withholding taxes.
INVESTMENTSInvestments are made in accordance with Chapter 12B.10A, section 5d of the Code of Iowa, and
Board of Regents, State of Iowa policy. The University’s portfolios may be invested in obligations
of the U.S. government and its agencies, certificates of deposit, prime bankers’ acceptances,
commercial paper, repurchase agreements, investments authorized for the Iowa Public
Employees’ Retirement System in Section 97B.7A of the Code of Iowa, corporate debt, mortgage
pass through and asset backed securities, bank loans, an open-end management investment
company organized in trust form registered with the S.E.C. under the Investment Company
Act of 1940, the Common Fund for nonprofit organizations, commingled vehicles/mutual
funds/exchange traded funds, and common stocks. In order to achieve economies of scale, the
University of Northern Iowa’s endowments and a portion of its operating portfolio are pooled
with the University’s investments. The University’s endowment portfolio included $8,658,000
and $7,872,000 at June 30, 2014 and 2013, respectively, held for the University of Northern Iowa.
The University’s operating portfolio included $32,103,000 and $37,884,000 at June 30, 2014 and
2013, respectively, held for the University of Northern Iowa, as well as $6,309,000 invested in
the University’s intermediate term portfolio at June 30, 2014. The University of Northern Iowa
investments are recorded as Deposits Held in Custody for Others.
For donor restricted endowments, Chapter 540A of the Code of Iowa permits the University to
spend the net appreciation of realized and unrealized earnings as the University determines to
be prudent. The University’s spending policy adjusts dollar payouts by the trailing calendar year
Consumer Price Index (inflation rate). Total payout is banded at no less than 4% and no greater
than 6% of calendar year end market values.
Net appreciation of permanent endowment funds, which totaled $14,288,000 and $11,154,000
at June 30, 2014 and 2013, respectively, is available to meet spending rate distributions and is
recorded in restricted nonexpendable net position.

35 Notes to Financial Statements Notes to Financial Statements 35
The University’s investments are recorded at fair value. As of June 30, 2014, the University had the following investments and quality credit ratings (in thousands):
INTEREST RATE RISKInterest rate risk is the risk changes in interest rates will adversely affect the fair value of an
investment. This risk is measured using effective duration. At the time of purchase, the effective
maturity of direct investment purchases by the University in the operating portfolio cannot
exceed sixty-three months. There is no explicit limit on the average maturity of fixed income
securities in the endowment portfolios. Each fixed income portfolio is managed to an appropriate
benchmark.
CREDIT RISKCredit risk is the risk an issuer or other counterparty to an investment will not fulfill its
obligation to the University. The University manages exposure to credit risk by measuring
portfolios against benchmarks as established by the Board of Regents. As of June 30, 2014, the
University’s long term bond funds benchmark is AA (Barclays Capital Aggregate Bond Index).
CONCENTRATION OF CREDIT RISKConcentration of credit risk is the risk of loss attributed to the magnitude of investments in a
single issuer. Except for Treasury or Agency debentures, pass-throughs or REMICs, no more
than 5% of University investment portfolios are invested in securities of a single issuer. All direct
investment purchases by the University in the operating portfolio are U.S. Treasury and Agency
securities.
INVESTMENT TYPE
Effective Duration
(Years)AAA/
TSY/AGY AA A BBB BB B NA
Total Market
Value
Fixed Income
Corporate Notes and Bonds
1.74 $7,741 $1,061 $8,831 $6,433 - - - $24,066
U.S. Government Agencies
1.37 74,954 - - - - - 181 75,135
U.S. Treasury Obligations
1.97 81,539 - - - - - - 81,539
Mutual Funds 3.90 - 282,648 56,878 5,195 63,118 197,034 - 604,873
Total $164,234 $283,709 $65,709 $11,628 $63,118 $197,034 $181 785,613
Equity and Other
U.S. Equity Mutual Funds 246,998
Non-U.S. Equity Mutual Funds 203,633
Real Assets 250,056
Private Equity 19,356
Repurchase Agreement 115,503
Bank Investments 220,390
Money Market/Cash Equivalents 244,636
Total Investments $2,086,185
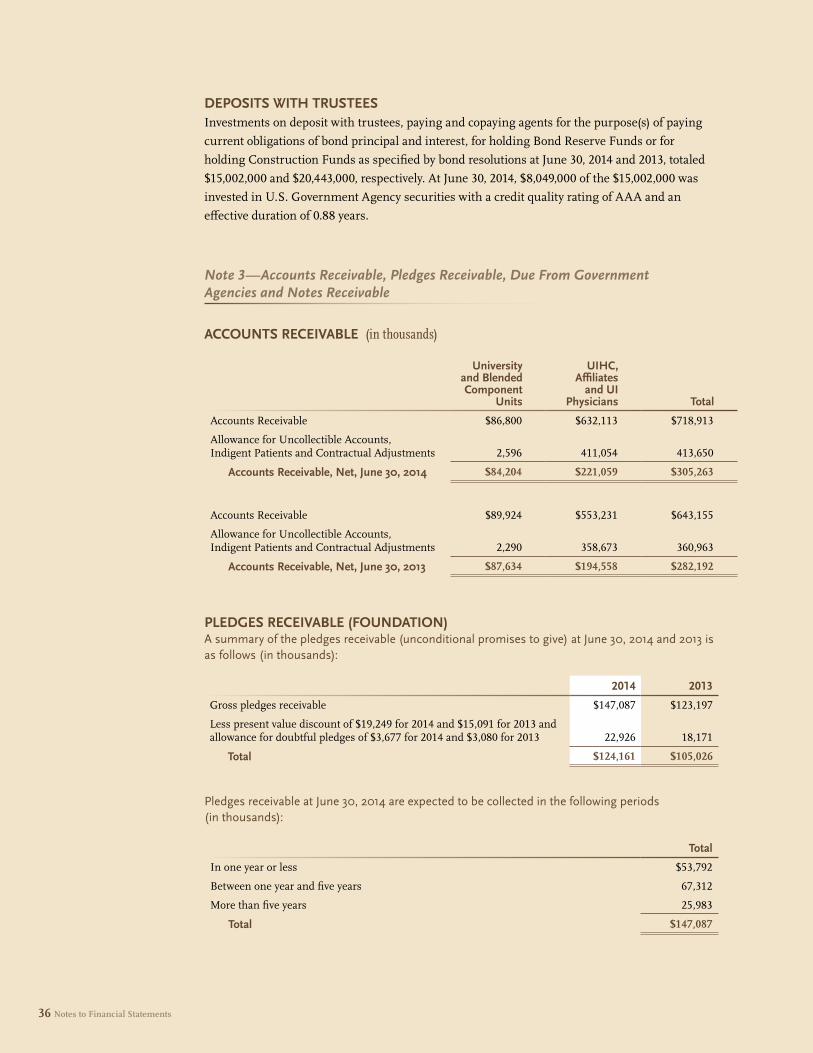
36 Notes to Financial Statements
DEPOSITS WITH TRUSTEESInvestments on deposit with trustees, paying and copaying agents for the purpose(s) of paying
current obligations of bond principal and interest, for holding Bond Reserve Funds or for
holding Construction Funds as specified by bond resolutions at June 30, 2014 and 2013, totaled
$15,002,000 and $20,443,000, respectively. At June 30, 2014, $8,049,000 of the $15,002,000 was
invested in U.S. Government Agency securities with a credit quality rating of AAA and an
effective duration of 0.88 years.
Note 3—Accounts Receivable, Pledges Receivable, Due From Government Agencies and Notes Receivable
ACCOUNTS RECEIVABLE (in thousands)
PLEDGES RECEIVABLE (FOUNDATION)A summary of the pledges receivable (unconditional promises to give) at June 30, 2014 and 2013 is as follows (in thousands):
Pledges receivable at June 30, 2014 are expected to be collected in the following periods (in thousands):
University and Blended Component
Units
UIHC, Affiliates
and UI Physicians Total
Accounts Receivable $86,800 $632,113 $718,913
Allowance for Uncollectible Accounts, Indigent Patients and Contractual Adjustments 2,596 411,054 413,650
Accounts Receivable, Net, June 30, 2014 $84,204 $221,059 $305,263
Accounts Receivable $89,924 $553,231 $643,155
Allowance for Uncollectible Accounts, Indigent Patients and Contractual Adjustments 2,290 358,673 360,963
Accounts Receivable, Net, June 30, 2013 $87,634 $194,558 $282,192
2014 2013
Gross pledges receivable $147,087 $123,197
Less present value discount of $19,249 for 2014 and $15,091 for 2013 and allowance for doubtful pledges of $3,677 for 2014 and $3,080 for 2013 22,926 18,171
Total $124,161 $105,026
Total
In one year or less $53,792
Between one year and five years 67,312
More than five years 25,983
Total $147,087
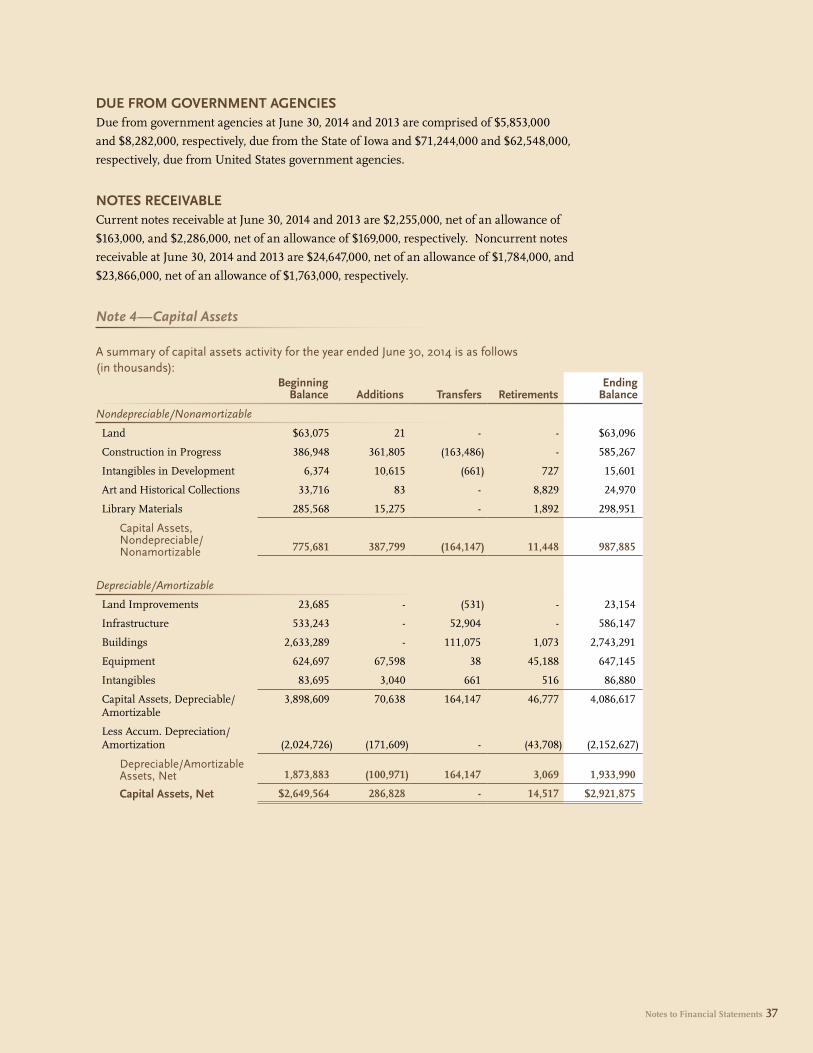
37 Notes to Financial Statements Notes to Financial Statements 37
DUE FROM GOVERNMENT AGENCIESDue from government agencies at June 30, 2014 and 2013 are comprised of $5,853,000
and $8,282,000, respectively, due from the State of Iowa and $71,244,000 and $62,548,000,
respectively, due from United States government agencies.
NOTES RECEIVABLECurrent notes receivable at June 30, 2014 and 2013 are $2,255,000, net of an allowance of
$163,000, and $2,286,000, net of an allowance of $169,000, respectively. Noncurrent notes
receivable at June 30, 2014 and 2013 are $24,647,000, net of an allowance of $1,784,000, and
$23,866,000, net of an allowance of $1,763,000, respectively.
Note 4—Capital Assets
A summary of capital assets activity for the year ended June 30, 2014 is as follows (in thousands):
Beginning Balance Additions Transfers Retirements
Ending Balance
Nondepreciable/Nonamortizable
Land $63,075 21 - - $63,096
Construction in Progress 386,948 361,805 (163,486) - 585,267
Intangibles in Development 6,374 10,615 (661) 727 15,601
Art and Historical Collections 33,716 83 - 8,829 24,970
Library Materials 285,568 15,275 - 1,892 298,951
Capital Assets, Nondepreciable/ Nonamortizable 775,681 387,799 (164,147) 11,448 987,885
Depreciable/Amortizable
Land Improvements 23,685 - (531) - 23,154
Infrastructure 533,243 - 52,904 - 586,147
Buildings 2,633,289 - 111,075 1,073 2,743,291
Equipment 624,697 67,598 38 45,188 647,145
Intangibles 83,695 3,040 661 516 86,880
Capital Assets, Depreciable/Amortizable
3,898,609 70,638 164,147 46,777 4,086,617
Less Accum. Depreciation/Amortization (2,024,726) (171,609) - (43,708) (2,152,627)
Depreciable/Amortizable Assets, Net 1,873,883 (100,971) 164,147 3,069 1,933,990
Capital Assets, Net $2,649,564 286,828 - 14,517 $2,921,875

38 Notes to Financial Statements
Note 5—Long-Term Liabilities
A summary of the changes in long-term liabilities for the year ended June 30, 2014 is as follows (in thousands):
Restated Beginning
Balance Additions ReductionsEnding
BalanceCurrent Portion
Long-term debt:
Bonds payable $1,198,144 162,511 102,912 1,257,743 $50,290
Notes payable 22,158 44,950 14,725 52,383 8,210
Capital lease payable 21,313 - 914 20,399 941
Total long-term debt 1,241,615 207,461 118,551 1,330,525 59,441
Other long term liabilities:
Early retirement benefits payable 4,519 - 2,452 2,067 1,990
Other postemployment benefits other than pensions 59,941 22,300 7,208 75,033 -
Compensated absences 133,747 93,411 90,407 136,751 93,083
Refundable allowances on student loans 22,710 137 126 22,721 -
Unearned revenue 1,391 259 - 1,650 -
Total other long term liabilities 222,308 116,107 100,193 238,222 95,073
Total long term liabilities $1,463,923 323,568 218,744 1,568,747 $154,514

39 Notes to Financial Statements Notes to Financial Statements 39
BONDS PAYABLEBonds have been sold to finance certain capital projects and are outstanding at June 30, 2014, as follows (in thousands):
Interest Rates
(Percent)
Fiscal Year Maturity
Date Range Amount
Bond Issues
Academic Buildings 2.00 - 5.00 2015-2037 $170,945
Add: Unamortized Premium 5,282
Athletic Facilities 2.50 - 5.30 2015-2037 141,400
Less: Unamortized Discount (32)
Add: Unamortized Premium 531
Center for University Advancement 4.25 - 4.75 2015-2020 4,430
Hospital 2.00 - 6.125 2015-2039 330,105
Add: Unamortized Premium 13,013
Iowa Memorial Union 2.00 - 5.00 2016-2026 6,420
Add: Unamortized Premium 865
Parking System 2.00 - 4.00 2015-2041 61,070
Add: Unamortized Premium 1,200
Recreational Facilities 3.00 - 4.875 2015-2035 70,625
Add: Unamortized Premium 158
Residence Services 0.30 - 4.00 2015-2035 91,490
Add: Unamortized Premium 3,220
Telecommunications 2.00 - 4.50 2015-2037 37,125
Less: Unamortized Discount (1)
Add: Unamortized Premium 184
University of Iowa Facility (UIFC) Corporation 2.00 - 5.00 2015-2038 159,385
Less: Unamortized Discount (22)
Add: Unamortized Premium 2,460
Utility System 2.00 - 5.00 2015-2038 154,540
Add: Unamortized Premium 3,350
Total $1,257,743

40 Notes to Financial Statements
As of June 30, 2014, unspent bond proceeds totaled $177,655,000. Unspent bond proceeds by
segment are: Academic Revenue Bonds $27,647,000; Hospital Revenue Bonds $115,486,000;
Parking Revenue Bonds $9,220,000; Residence Services Revenue Bonds $25,302,000.
The bonds will mature as follows (in thousands):
As provided in the various bond resolutions, the University has the right to redeem certain bonds
prior to the above maturity dates, under stated conditions.
Principal Interest Total
Year Ending June 30
2015 $50,290 46,215 $96,505
2016 52,810 44,538 97,348
2017 56,210 42,728 98,938
2018 58,940 40,770 99,710
2019 60,860 38,682 99,542
2020-2024 305,975 159,574 465,549
2025-2029 302,315 99,292 401,607
2030-2034 216,590 45,413 262,003
2035-2039 118,365 10,874 129,239
2040-2042 5,180 187 5,367
Less: Unamortized Discount (55) - (55)
Add: Unamortized Premium 30,263 - 30,263
Total $1,257,743 528,273 $1,786,016
Work on Hancher Auditorium, the UI’s largest flood replacement project, is about one-third complete and is scheduled to host its first performance in fall 2016.

41 Notes to Financial Statements Notes to Financial Statements 41
NOTES PAYABLEThe University has the following notes payable outstanding at June 30, 2014:
Interest RatesMaturity
Dates Amount
Purpose
Athletic Facility 2.48% 2015-2024 $27,609
Fleet Services 1 1.60% 2015-2018 1,173
Fleet Services 2 1.69% 2015-2019 2,026
Kinnick Scoreboard 2.41% 2015-2019 6,635
Oakdale Research Park 2.23% 2015-2016 4,946
Parking Access & Revenue 2.24% 2015-2019 4,500
Plaza Centre One 4.59% 2015-2016 339
University Athletic Club 5.05% 2015-2016 4,155
Wells Fargo Line of Credit 0.20-1.155% 2015 1,000
Total $52,383
Assets acquired under these notes had a net book value of $48,815,000 as of June 30, 2014.
As of June 30, 2014, unspent note proceeds totaled $11,750,000. Unspent note proceeds by
project are: Athletic Facility $7,264,000; Parking Access and Revenue System $4,486,000.
The notes will mature as follows (in thousands):Principal Interest Total
Year Ending June 30
2015 $8,210 1,305 $9,515
2016 14,378 936 15,314
2017 6,311 651 6,962
2018 6,138 506 6,644
2019 4,163 380 4,543
2020-2024 13,183 692 13,875
Total $52,383 4,470 $56,853

42 Notes to Financial Statements
CAPITAL LEASES PAYABLECapital leases outstanding at June 30, 2014, are as follows (in thousands):
The following is a schedule, by year, of future minimum payments required (in thousands):
Assets acquired under these capital leases had a net book value of $20,399,000 as of
June 30, 2014.
Note 6—Operating Leases
The University has leased various buildings to house several departments of the University.
These leases have been classified as operating leases. Accordingly, all rents are charged to
expense as incurred. These leases expire from fiscal year 2015 to fiscal year 2034, and require
various minimum annual rentals. Certain leases are renewable for additional periods. Some of
the leases require the payment of normal maintenance and insurance on the properties. In most
cases, management expects that the leases will be renewed or replaced by other leases.
Interest Rates Lease Period Amount
Purpose
Parking structure - Iowa River Landing 2.95%-5.00% 2015-2031 $20,399
Principal Interest Total
Year Ending June 30
2015 $941 602 $1,543
2016 969 574 1,543
2017 998 545 1,543
2018 1,027 516 1,543
2019 1,057 486 1,543
2020-2024 5,775 2,410 8,185
2025-2029 6,677 1,760 8,437
2030-2033 2,955 223 3,178
Total $20,399 7,116 $27,515

43 Notes to Financial Statements Notes to Financial Statements 43
The following is an annual schedule of future minimum rental payments required under operating leases which have initial or remaining non-cancellable lease terms in excess of one year as of June 30, 2014 (in thousands).
All leases contain non-appropriation clauses indicating that continuation of the lease is subject to
funding by the Iowa State Legislature.
Rental expense for the year ended June 30, 2014, for all operating leases, except those with terms
of a month or less that were not renewed, totaled $11,946,000.
Note 7—Retirement Programs
TEACHERS INSURANCE AND ANNUITY ASSOCIATIONThe University contributes to the Teachers Insurance and Annuity Association (TIAA)
retirement program, which is a defined contribution plan. TIAA administers the retirement plan
for the University. The defined contribution retirement plan provides individual annuities for
each plan participant. The Board of Regents establishes and amends the plan’s provisions and
contribution requirements. As required by the Board of Regents policy, all eligible University
employees must participate in a retirement plan from the date they are employed. Contributions
made by both employer and employee vest immediately. As specified by the contract with
TIAA, each employee through the fifth year of employment contributes 3 1/3% of the first
$4,800 of earnings and 5% on the balance of earnings. The University, through the fifth year
of employment, is required to contribute 6 2/3% of the first $4,800 of earnings and 10% on
earnings above the $4,800. Upon completion of five years of service, the participant contributes
5% and the University 10% on all earnings. During fiscal years 2014 and 2013, the University’s
required and actual contribution amounted to $104,065,000 and $101,144,000, respectively.
During fiscal years 2014 and 2013, the employees’ required and actual contribution amounted to
$52,030,000 and $50,572,000, respectively.
Amount
Year Ending June 30
2015 $10,713
2016 7,477
2017 4,359
2018 2,831
2019 2,304
2020-2024 7,107
2025-2029 1,498
2030-2034 73
Total $36,362

44 Notes to Financial Statements
IOWA PUBLIC EMPLOYEES RETIREMENT SYSTEMThe University contributes to the Iowa Public Employees Retirement System (IPERS), which is
a cost-sharing multiple-employer defined benefit pension plan administered by the State. IPERS
provides retirement and death benefits which are established by State statute to plan members
and beneficiaries. IPERS issues a publicly available financial report that includes financial
statements and required supplementary information. The report may be obtained by writing to
IPERS, PO Box 9117, Des Moines, IA 50306-9117.
Plan members are required to contribute 5.95%, 5.78% and 5.38% respectively, of their annual
covered salary and the University is required to contribute 8.93%, 8.67% and 8.07%, respectively,
of annual covered payroll for the years ended June 30, 2014, 2013 and 2012. Contribution
requirements are established by State statute. The required contribution paid by employees
for the years ended June 30, 2014, 2013 and 2012 were $3,812,000, $3,145,000 and $2,535,000,
respectively. The University’s required contributions to IPERS for the years ended June 30,
2014, 2013 and 2012 were $5,722,000, $4,718,000 and $3,802,000, respectively, equal to required
contributions for each year.
Note 8—Post-Employment Benefits
EARLY RETIREMENTThe early retirement programs were approved by the Board of Regents in April, 2009, and in
March, 2010. Those eligible for participation were faculty, professional-scientific employees,
institutional officials, staff of the Board Office and all merit system employees employed by
the Board of Regents who had attained the age of 57 by July 1, 2009 for the 2009 program
and age 55 at time of termination and at least 10 years of service for the 2010 program. The
employee’s department head and the appropriate administrative officers approved the employee’s
participation. The following benefits are applicable during participation in the Early Retirement
Program:
1. Health and Dental Insurance—The University will pay the full cost of the single employee
premium for health and dental insurance or its standard share of any coverage other
than single for a period of five years. This contribution shall be equal to the amount
contributed for an active employee in the same plan.
2. TIAA/CREF Contributions—During the first three years, the University will pay both
the employer and employee retirement contributions. During the next two years in the
program, the university will pay only the employer contribution.
The University has recognized an early retirement benefit liability of $2,067,000 as of June 30,
2014, calculated on merit, faculty and P & S employee personnel. The early retirement liability
for health and dental insurance has been rolled into GASB Statement No. 45, Accounting and
Financial Reporting by Employers for Postemployment Benefits Other Than Pensions (OPEB).
During fiscal year 2014, retirement expenditures for the four hundred twenty (420) participants
in the early retirement incentive program totaled $2,452,000.
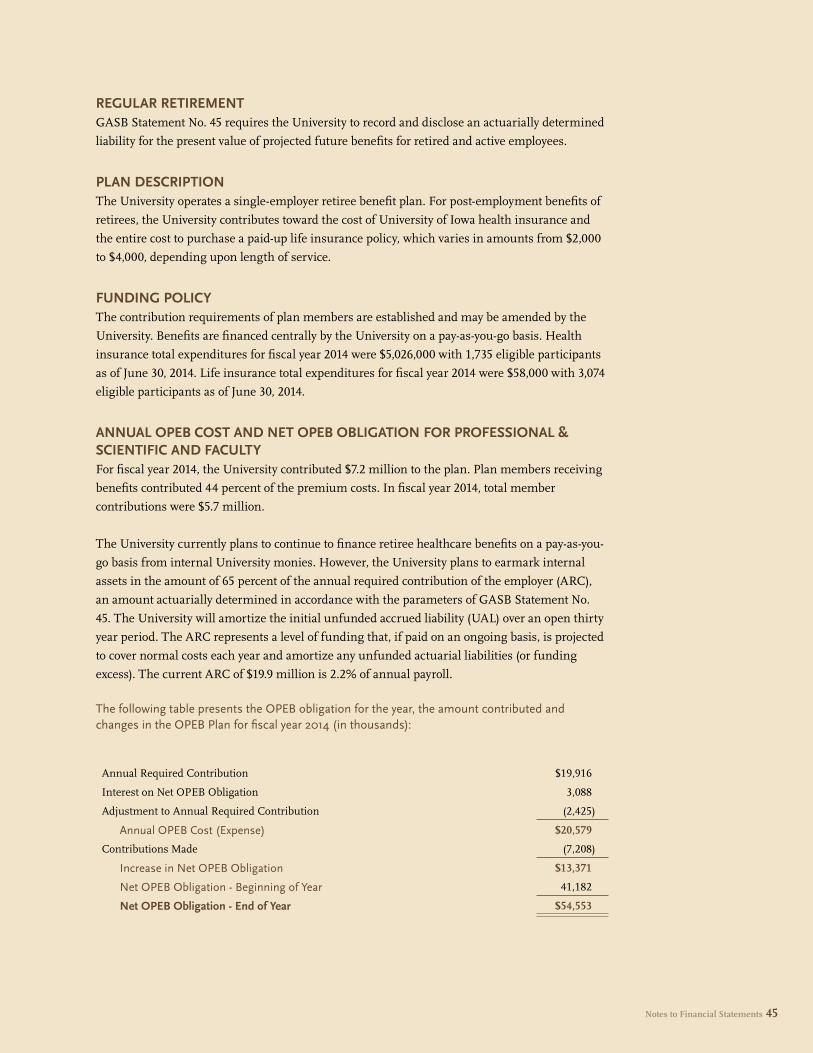
45 Notes to Financial Statements Notes to Financial Statements 45
REGULAR RETIREMENTGASB Statement No. 45 requires the University to record and disclose an actuarially determined
liability for the present value of projected future benefits for retired and active employees.
PLAN DESCRIPTIONThe University operates a single-employer retiree benefit plan. For post-employment benefits of
retirees, the University contributes toward the cost of University of Iowa health insurance and
the entire cost to purchase a paid-up life insurance policy, which varies in amounts from $2,000
to $4,000, depending upon length of service.
FUNDING POLICYThe contribution requirements of plan members are established and may be amended by the
University. Benefits are financed centrally by the University on a pay-as-you-go basis. Health
insurance total expenditures for fiscal year 2014 were $5,026,000 with 1,735 eligible participants
as of June 30, 2014. Life insurance total expenditures for fiscal year 2014 were $58,000 with 3,074
eligible participants as of June 30, 2014.
ANNUAL OPEB COST AND NET OPEB OBLIGATION FOR PROFESSIONAL & SCIENTIFIC AND FACULTYFor fiscal year 2014, the University contributed $7.2 million to the plan. Plan members receiving
benefits contributed 44 percent of the premium costs. In fiscal year 2014, total member
contributions were $5.7 million.
The University currently plans to continue to finance retiree healthcare benefits on a pay-as-you-
go basis from internal University monies. However, the University plans to earmark internal
assets in the amount of 65 percent of the annual required contribution of the employer (ARC),
an amount actuarially determined in accordance with the parameters of GASB Statement No.
45. The University will amortize the initial unfunded accrued liability (UAL) over an open thirty
year period. The ARC represents a level of funding that, if paid on an ongoing basis, is projected
to cover normal costs each year and amortize any unfunded actuarial liabilities (or funding
excess). The current ARC of $19.9 million is 2.2% of annual payroll.
The following table presents the OPEB obligation for the year, the amount contributed and changes in the OPEB Plan for fiscal year 2014 (in thousands):
Annual Required Contribution $19,916
Interest on Net OPEB Obligation 3,088
Adjustment to Annual Required Contribution (2,425)
Annual OPEB Cost (Expense) $20,579
Contributions Made (7,208)
Increase in Net OPEB Obligation $13,371
Net OPEB Obligation - Beginning of Year 41,182
Net OPEB Obligation - End of Year $54,553
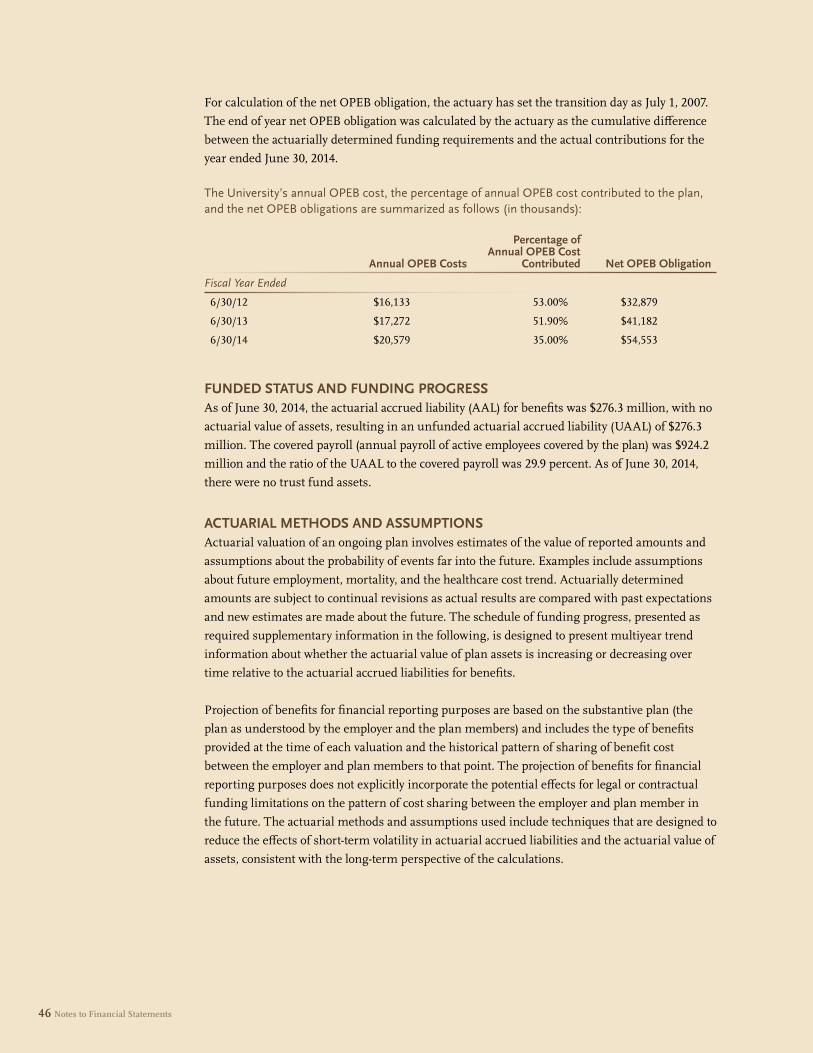
46 Notes to Financial Statements
For calculation of the net OPEB obligation, the actuary has set the transition day as July 1, 2007.
The end of year net OPEB obligation was calculated by the actuary as the cumulative difference
between the actuarially determined funding requirements and the actual contributions for the
year ended June 30, 2014.
The University’s annual OPEB cost, the percentage of annual OPEB cost contributed to the plan, and the net OPEB obligations are summarized as follows (in thousands):
FUNDED STATUS AND FUNDING PROGRESSAs of June 30, 2014, the actuarial accrued liability (AAL) for benefits was $276.3 million, with no
actuarial value of assets, resulting in an unfunded actuarial accrued liability (UAAL) of $276.3
million. The covered payroll (annual payroll of active employees covered by the plan) was $924.2
million and the ratio of the UAAL to the covered payroll was 29.9 percent. As of June 30, 2014,
there were no trust fund assets.
ACTUARIAL METHODS AND ASSUMPTIONSActuarial valuation of an ongoing plan involves estimates of the value of reported amounts and
assumptions about the probability of events far into the future. Examples include assumptions
about future employment, mortality, and the healthcare cost trend. Actuarially determined
amounts are subject to continual revisions as actual results are compared with past expectations
and new estimates are made about the future. The schedule of funding progress, presented as
required supplementary information in the following, is designed to present multiyear trend
information about whether the actuarial value of plan assets is increasing or decreasing over
time relative to the actuarial accrued liabilities for benefits.
Projection of benefits for financial reporting purposes are based on the substantive plan (the
plan as understood by the employer and the plan members) and includes the type of benefits
provided at the time of each valuation and the historical pattern of sharing of benefit cost
between the employer and plan members to that point. The projection of benefits for financial
reporting purposes does not explicitly incorporate the potential effects for legal or contractual
funding limitations on the pattern of cost sharing between the employer and plan member in
the future. The actuarial methods and assumptions used include techniques that are designed to
reduce the effects of short-term volatility in actuarial accrued liabilities and the actuarial value of
assets, consistent with the long-term perspective of the calculations.
Annual OPEB Costs
Percentage of Annual OPEB Cost
Contributed Net OPEB Obligation
Fiscal Year Ended
6/30/12 $16,133 53.00% $32,879
6/30/13 $17,272 51.90% $41,182
6/30/14 $20,579 35.00% $54,553

47 Notes to Financial Statements Notes to Financial Statements 47
In the June 30, 2014 actuarial valuation, the projected unit credit cost method was used. The
actuarial assumptions included a 5 percent discount rate based on the University’s funding
policy (earmarking the ARC internally) and the expected long-term returns on the University’s
internal capital. The projected annual healthcare trend rate is initially 8 percent for pre-65 costs
and 7 percent for post-65 costs, reduced in decrements to an ultimate rate of 5 percent after eight
years. The expected long-term payroll growth rate is assumed to be 3.5 percent per year. The
UAAL is being amortized as a level percent of pay on an open basis over thirty years.
TERMINATIONThe University continues faculty, P&S, and merit exempt terminated employees’ benefits for
health, dental, vision and hearing aid insurance under the Consolidated Omnibus Budget
Reconciliation Act of 1985, modified by the Tax Reform Act and the Budget Reconciliation Act of
1986.
Four hundred forty-nine (449) terminated employees continued their benefits by assuming total
financial responsibility. No University costs are associated with the premiums, but claims are the
responsibility of the University since the insurance plans are self-insured.
OTHER POSTEMPLOYMENT BENEFITSThe University’s merit employees are participants in the State of Iowa postretirement medical
plan (OPEB Plan). The State of Iowa recognized the implicit rate subsidy for the OPEB Plan as
required by GASB Statement No. 45. The annual valuation of liabilities under the OPEB Plan is
calculated using the entry age normal cost method. This method requires the calculation of an
unfunded actuarial liability, which is approximately $233.0 million for the State of Iowa at June
30, 2014. The University’s portion of the unfunded actuarial accrued liability is not separately
determinable.
Details of the OPEB Plan are provided on a state-wide basis and are available in the State of
Iowa’s Comprehensive Annual Financial Report for the year ended June 30, 2014. The report may
be obtained by writing to the Iowa Department of Administrative Services, Hoover State Office
Building, Des Moines, Iowa 50319.
The University recognized a net OPEB liability of $20.5 million for other postemployment
benefits, which represents the University’s portion of the State’s net OPEB liability. The
University’s portion of the net OPEB liability was calculated using the ratio of full time
equivalent University merit employees compared to all full time equivalent employees of the
State of Iowa.

48 Notes to Financial Statements
The University recognized a net OPEB liability of $54.5 million for its retiree benefit plan and a
liability of $20.5 million for its allocated portion of the State’s net OPEB liability, for a total net
OPEB liability of $75.0 million.
Note 9—Other Commitments and Risk Management
COMMITMENTSAt June 30, 2014 and 2013, the University had outstanding construction contract commitments of
$554,234,000 and $393,883,000, respectively.
RISK MANAGEMENTFollowing are risk financing and insurance related issues as defined by GASB Statement No. 10
Accounting and Financial Reporting for Risk Financing and Related Insurance Issues.
Property Loss—The University purchases catastrophic property insurance for academic/
general fund facilities with a single incident deductible of $5 million. The University may
seek reimbursement for property losses in excess of $5,000 from the State of Iowa pursuant
to Iowa Code Chapter 29C.20. Money from the state contingent fund may be requested for
repairing, rebuilding, or restoring state property injured, destroyed, or lost by fire, storm,
theft, or unavoidable causes. The University maintains conventional property insurance on
self-supporting, revenue-producing, and auxiliary facilities which are an integral part of the
operations of the University. Insured facilities include the Residence Halls, the Utility System,
Telecommunications, Iowa Memorial Union, Athletic Facilities, University of Iowa Hospitals &
Clinics, and other auxiliary operations. The University’s annual limit is $2 billion, the maximum
available on the November 1, 2013 renewal.
The properties of the Utility and Telecommunications Systems are appraised annually and specific coverage and valuation data are as follows:
Tort Liability—The University of Iowa is an agency of the State of Iowa and is covered by the
State’s self-insurance for tort liability. Tort claims against the State are handled as provided in the
Iowa Tort Claims Act (Iowa Code, Chapter 669) which also sets forth the procedures by which
tort claims may be brought. Claims under Chapter 669 may be filed against the State on account
of wrongful death, personal injury or property damage incurred by reason of the negligence of
Utility System specific coverage is as follows:
Utility System Operations Building & Contents $784,646,000
Power Plant Building & Contents $196,848,000
Telecommunications Facilities premium is based on the following values:
Building $31,148,000
Contents $9,650,000
Income $5,758,000

49 Notes to Financial Statements Notes to Financial Statements 49
the University or its employees while acting within the scope of employment.
By inter-agency agreement, tort liability claims under $5,000 may be administered by the
University subject to a maximum expenditure of $100,000 per year. All other tort claims may be
paid from the State’s general fund.
Motor Vehicle Liability—The University of Iowa and other Board of Regents’ institutions
are self-insured for automobile liability up to $250,000. Claims over $250,000 are paid by the
State of Iowa, as provided in Chapter 669 of the Code of Iowa. Coverage for physical damage
(comprehensive and collision) to University vehicles is included in the Board of Regents’ self-
insurance program. Each loss is subject to a $500 deductible.
Fidelity/Crime Coverage—The State maintains an employee fidelity bond where the first
$100,000 in losses is the responsibility of the University. Under the State coverage, losses in
excess of the $100,000 deductible are insured up to $2,000,000. The University maintains
separate fidelity and crime coverage, which extends to all employees, and includes coverage for
robbery and theft. The University’s bond provides an additional $8,000,000 in coverage over the
state bond.
Workers’ Compensation—The University participates in a State self-funded program. The
University pays a monthly premium for this coverage.
Unemployment Compensation—The University self-funds unemployment compensation claims
received from Iowa Workforce Development on a reimbursement basis.
College of Medicine Faculty Malpractice Claims—Based on actuarial analysis, the College of
Medicine has incurred a cumulative probable loss of $15,489,000 as of June 30, 2014. Starting
1/1/03, the University of Iowa Faculty Practice plan (the Plan) became University of Iowa
Physicians (UIP) and has self-funded its physician’s professional liabilities with a $5M per
occurrence, $9M aggregate limit of liability with the State of Iowa picking up loss amounts in
excess of $5M. Iowa Medical Mutual Insurance Company (IMMIC) was formed on 7/1/04 to
provide claims-made coverage with a retroactive date of 7/1/04 for the $2M excess of $3M per
occurrence layer that UIP retains. Claims reported after 7/1/04 with occurrence dates prior to
7/1/04 have a $5M per occurrence retention, while claims reported after 7/1/04 with occurrence
dates after 7/1/04 have a $3M per occurrence retention.
Employee Medical and Dental Claims—The University purchases life, health, dental and
disability insurance for eligible permanent employees. Based on actuarial analysis of employee
medical and dental claims, the University has incurred but not reported claims of $11,106,000 as
of June 30, 2014.
Reconciliation of Loss Contingencies (in thousands)—
FY 2014 FY 2013
Claims and contingent liabilities accrued at July 1 $25,690 $23,116
Claims incurred and contingent liabilities accrued for the current year 166,124 149,548
Payments on claims during the fiscal year (165,217) (146,974)
Claims and contingent liabilities at June 30 $26,597 $25,690

50 Notes to Financial Statements
Insurance Settlements—For those risks that the University has purchased commercial
insurance, only the property insurance has claims in excess of the commercial coverage due to
the 2008 flood. All other settled claims have not exceeded commercial coverage in the past three
years.
Pollution Remediation — In accordance with GASB Statement No. 49 Accounting & Financial
Reporting for Pollution Remediation Obligation, we have identified two potential pollution
remediation liability events. A description of the nature of the sites and allegations are described
below. The two matters were both brought pursuant to the Comprehensive Environmental
Response, Compensation, and Liability Act (CERCLA), commonly known as “Superfund”. The
potential associated liability is not reasonably estimable at this time.
1. The LWD Incinerator Site is a hazardous waste disposal site located in Kentucky. The
University received a demand letter regarding this site, alleging that the University of
Iowa, having contributed waste to the site, is a potentially responsible party. The demand
letter alleged that according to EPA’s database the University of Iowa contributed 151,606
pounds of materials to the LWD Incinerator Site over the years covering 1983, 1986 and
1987. University General Counsel responded by letter to the attorney who submitted the
demand letter, denying liability. A lawsuit was then filed in Federal District Court in
Kentucky against the University and other potentially responsible parties, based upon
the same claim involving the LWD Incinerator Site. The Attorney General’s Office filed
a motion to dismiss and included supporting brief in the case. The federal court did not
dismiss the lawsuit, and the Attorney General’s Office is planning to file a motion for
summary judgment in the case. Currently, the litigation is still pending in the District
Court of Kentucky.
2. The Marine Shale Processors site was a hazardous waste disposal site located in
Louisiana. The University received a demand letter in September of 2012 from a group
of potentially responsible parties (PRP) at the site alleging that the University of Iowa
is a PRP at the site and had shipped between 5 and 10 tons of materials to the Marine
Shale Processors site for disposal in 1991. University General Counsel responded by letter
denying the liability on the part of The University of Iowa. The University has not heard
anything further and is not aware of any claims filed.

51 Notes to Financial Statements Notes to Financial Statements 51
Note 10—Debt Defeasance
In September of 2013, the University issued $18,780,000 of Academic Building Revenue
Refunding Bonds, Series S.U.I. 2013, with an average interest rate of 4.67% and accrued interest
of $9,000 to advance refund $20,180,000 of outstanding Academic Building Revenue Bond, Series
S.U.I 2004 with interest ranging between 4.0 and 4.5%.
Net bond proceeds of $21,138,000 were placed in an irrevocable escrow account with the
University as trustee. The escrow account is sufficient to fully service all remaining principal
and interest due on the bonds. The Academic Building Revenue Bond, Series S.U.I 2004 will be
called on July 1, 2014.
The refunding permitted the University to realize an economic gain (difference between present
values of the old and new debt service payments) of $1,438,000; and reduced the aggregate debt
service payments by $1,628,000 over the next eleven years.
In May of 2014, the University issued $6,420,000 of Iowa Memorial Union Revenue Refunding
Bonds, Series S.U.I. 2014, with an average interest rate of 4.34% and accrued interest of $14,000
to advance refund $7,120,000 of outstanding Iowa Memorial Union Revenue Bonds, Series S.U.I
2005 with interest rates ranging between 3.75 and 4.30%.
Net bond proceeds of $7,275,000 were placed in an irrevocable escrow account with the University
as trustee. The escrow account is sufficient to fully service all remaining principal and interest
due on the bonds. The Iowa Memorial Union Revenue Bonds, Series S.U.I 2005 will be called on
July 1, 2015.
The refunding permitted the University to realize an economic gain (difference between present
values of the old and new debt service payments) of $550,000; and reduced the aggregate debt
service payments by $588,000 over the next eleven years.
In May of 2014, the University issued $17,905,000 of Utility System Revenue Refunding Bonds,
Series S.U.I. 2014, with an average interest rate of 2.33% and accrued interest of $23,000 to
advance refund $17,275,000 of outstanding Utility System Revenue Refunding Bonds, Series
S.U.I 2006 with interest rates ranging between 4.0 and 4.375%.
Net bond proceeds of $17,992,000 were placed in an irrevocable escrow account with the
University as trustee. The escrow account is sufficient to fully service all remaining principal
and interest due on the bonds. The Utility System Revenue Bonds, Series S.U.I 2006 will be
called on November 1, 2015.

52 Notes to Financial Statements
The refunding permitted the University to realize an economic gain (difference between present
values of the old and new debt service payments) of $1,205,000; and reduced the aggregate debt
service payments by $1,359,000 over the next twelve years.
In May of 2014, the University issued $7,970,000 of University of Iowa Facilities Corporation
(UIFC) Revenue Refunding Bonds, Series S.U.I. 2014 (Old Capitol Town Center), with an
average interest rate of 2.73% and accrued interest of $12,000 to advance refund $8,065,000 of
outstanding UIFC Revenue Refunding Bonds, Series S.U.I 2005 (Old Capitol Town Center) with
interest rates ranging between 4.0 and 4.25%.
Net bond proceeds of $8,193,000 were placed in an irrevocable escrow account with the
University as trustee. The escrow account is sufficient to fully service all remaining principal
and interest due on the bonds. The UIFC Revenue Bonds (Old Capitol Center), Series S.U.I 2005
will be called on June 1, 2015.
The refunding permitted the University to realize an economic gain (difference between present
values of the old and new debt service payments) of $552,000; and reduced the aggregate debt
service payments by $578,000 over the next eleven years.
The amount of defeased debt outstanding but removed from the Statement of Net Position at June 30, 2014, is as follows:
Amount(in thousands)
Bond Issues
Academic $20,180
Iowa Memorial Union 7,620
Utility 18,375
Old Capitol Town Center 8,065
Parking 12,595
Total $66,835
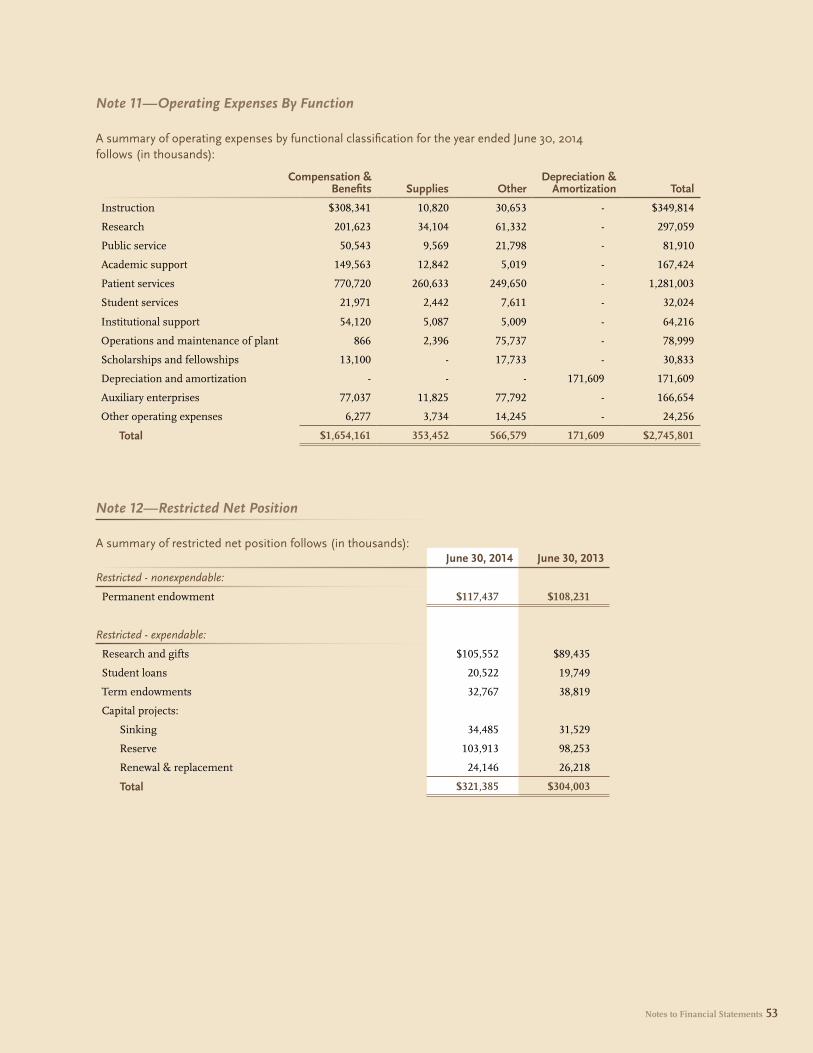
53 Notes to Financial Statements Notes to Financial Statements 53
Note 11—Operating Expenses By Function
A summary of operating expenses by functional classification for the year ended June 30, 2014 follows (in thousands):
Note 12—Restricted Net Position
A summary of restricted net position follows (in thousands):
Compensation & Benefits Supplies Other
Depreciation & Amortization Total
Instruction $308,341 10,820 30,653 - $349,814
Research 201,623 34,104 61,332 - 297,059
Public service 50,543 9,569 21,798 - 81,910
Academic support 149,563 12,842 5,019 - 167,424
Patient services 770,720 260,633 249,650 - 1,281,003
Student services 21,971 2,442 7,611 - 32,024
Institutional support 54,120 5,087 5,009 - 64,216
Operations and maintenance of plant 866 2,396 75,737 - 78,999
Scholarships and fellowships 13,100 - 17,733 - 30,833
Depreciation and amortization - - - 171,609 171,609
Auxiliary enterprises 77,037 11,825 77,792 - 166,654
Other operating expenses 6,277 3,734 14,245 - 24,256
Total $1,654,161 353,452 566,579 171,609 $2,745,801
June 30, 2014 June 30, 2013
Restricted - nonexpendable:
Permanent endowment $117,437 $108,231
Restricted - expendable:
Research and gifts $105,552 $89,435
Student loans 20,522 19,749
Term endowments 32,767 38,819
Capital projects:
Sinking 34,485 31,529
Reserve 103,913 98,253
Renewal & replacement 24,146 26,218
Total $321,385 $304,003
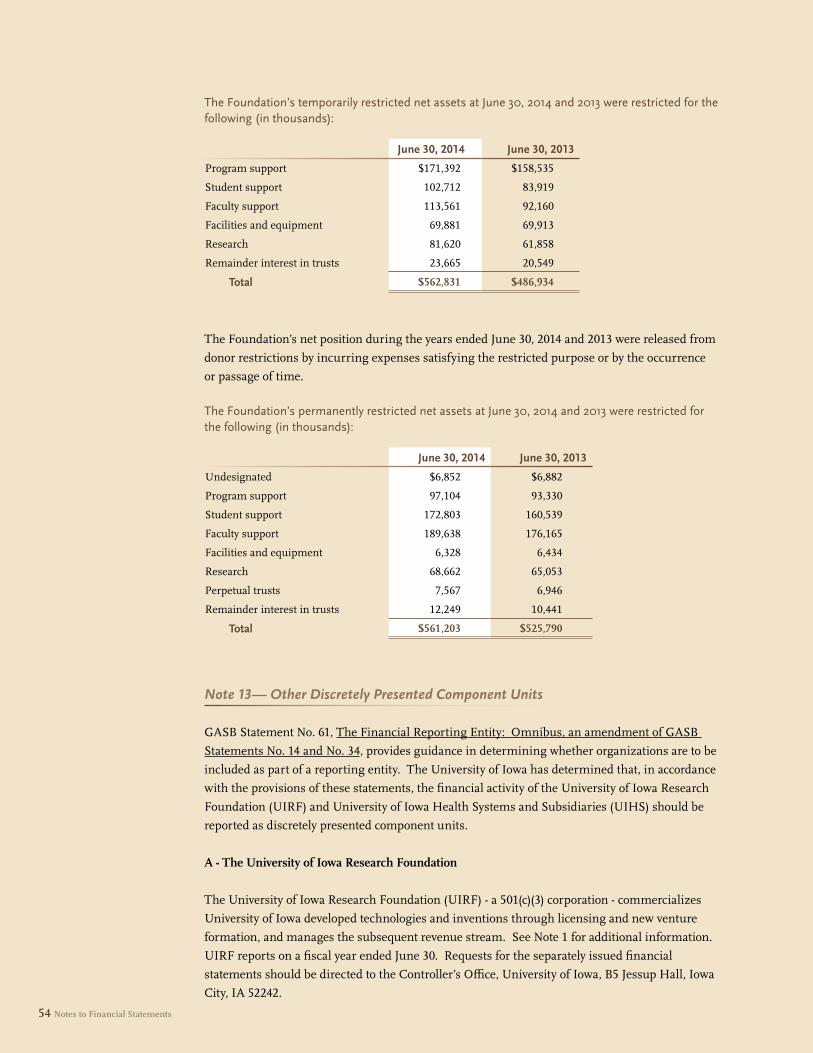
54 Notes to Financial Statements
The Foundation’s temporarily restricted net assets at June 30, 2014 and 2013 were restricted for the following (in thousands):
The Foundation’s net position during the years ended June 30, 2014 and 2013 were released from
donor restrictions by incurring expenses satisfying the restricted purpose or by the occurrence
or passage of time.
The Foundation’s permanently restricted net assets at June 30, 2014 and 2013 were restricted for the following (in thousands):
Note 13— Other Discretely Presented Component Units
GASB Statement No. 61, The Financial Reporting Entity: Omnibus, an amendment of GASB
Statements No. 14 and No. 34, provides guidance in determining whether organizations are to be
included as part of a reporting entity. The University of Iowa has determined that, in accordance
with the provisions of these statements, the financial activity of the University of Iowa Research
Foundation (UIRF) and University of Iowa Health Systems and Subsidiaries (UIHS) should be
reported as discretely presented component units.
A - The University of Iowa Research Foundation
The University of Iowa Research Foundation (UIRF) - a 501(c)(3) corporation - commercializes
University of Iowa developed technologies and inventions through licensing and new venture
formation, and manages the subsequent revenue stream. See Note 1 for additional information.
UIRF reports on a fiscal year ended June 30. Requests for the separately issued financial
statements should be directed to the Controller’s Office, University of Iowa, B5 Jessup Hall, Iowa
City, IA 52242.
June 30, 2014 June 30, 2013
Program support $171,392 $158,535
Student support 102,712 83,919
Faculty support 113,561 92,160
Facilities and equipment 69,881 69,913
Research 81,620 61,858
Remainder interest in trusts 23,665 20,549
Total $562,831 $486,934
June 30, 2014 June 30, 2013
Undesignated $6,852 $6,882
Program support 97,104 93,330
Student support 172,803 160,539
Faculty support 189,638 176,165
Facilities and equipment 6,328 6,434
Research 68,662 65,053
Perpetual trusts 7,567 6,946
Remainder interest in trusts 12,249 10,441
Total $561,203 $525,790

55 Notes to Financial Statements Notes to Financial Statements 55
Significant financial data for UIRF for the years ended June 30, 2014 and 2013 are presented below (in thousands):
CONDENSED STATEMENT OF NET ASSETS2014 2013
Assets
Cash, investments and other assets $22,650 $24,344
Capital assets, net 4 14
Total Assets 22,654 24,358
Liabilities
Accounts payable and other current liabilities 782 871
Long-term liabilities (current and noncurrent portions) 100 5
Total Liabilities 882 876
Net Assets
Net investment in capital assets 4 14
Unrestricted 21,768 23,468
Total Net Assets 21,772 23,482
Total Liabilities and Net Assets $22,654 $24,358
CONDENSED STATEMENT OF REVENUES, EXPENSES AND CHANGES IN NET ASSETS
2014 2013
Program Expenses
Intellectual properties expense $6,333 $5,565
Other 266 401
Total Program Expenses 6,599 5,966
Program Revenues
Intellectual properties income 3,503 2,522
Investment income 1,167 483
Payment from primary government 219 343
Total Program Revenues 4,889 3,348
Change in Net Assets (1,710) (2,618)
Net Assets, Beginning of Year 23,482 26,100
Net Assets, End of Year $21,772 $23,482
B - University of Iowa Health System and Subsidiaries
University of Iowa Health System and Subsidiaries (UIHS) was incorporated under the
provisions of the Iowa Nonprofit Corporations Act on December 2, 1994. UIHS was formed
to support the clinical, academic, and research programs of the University of Iowa College
of Medicine and the University of Iowa Hospitals and Clinics. See Note 1 for additional
information. UIHS reports on a fiscal year ended December 31. Requests for the separately
issued financial statements should be directed to the Controller’s Office, University of Iowa, B5
Jessup Hall, Iowa City, IA 52242.

56 Notes to Financial Statements
Significant financial data for UIHS for the years ended December 31, 2013 and 2012 are presented below (in thousands):
CONDENSED STATEMENT OF NET ASSETS2013 2012
Assets
Cash, investments and other assets $22,408 $23,352
Capital assets, net 220 274
Total Assets 22,628 23,626
Liabilities
Accounts payable and other current liabilities 1,547 1,244
Accounts held for other component units 5,155 5,364
Total Liabilities 6,702 6,608
Net Assets
Net investment in capital assets 220 274
Unrestricted 15,706 16,744
Total Net Assets 15,926 17,018
Total Liabilities and Net Assets $22,628 $23,626
CONDENSED STATEMENT OF OPERATIONS AND CHANGES IN NET ASSETS
2013 2012
Program Expenses
Patient Services $11,530 $11,247
Management services 12,001 10,492
Depreciation 152 177
Total Program Expenses 23,683 21,916
Program Revenues
Patient Services 7,816 7,385
Management services 13,107 11,860
Investment income 40 69
Other 1,628 2,555
Total Program Revenues 22,591 21,869
Change in Net Assets (1,092) (47)
Net Assets, Beginning of Year 17,018 17,065
Net Assets, End of Year $15,926 $17,018

57 Notes to Financial Statements Notes to Financial Statements 57
Note 14—Subsequent Events
In October 2014, the University received approval from the State Board of Regents to issue
Academic Building Revenue Bonds, Series S.U.I. 2014A in the amount of $24,560,000. The
proceeds of the bonds will be used to pay or reimburse a portion of the costs of building,
repairing, replacing, reconstructing and equipping flood damaged buildings and facilities on the
campus of the University damaged by the flood of 2008; fund a reserve fund; and pay the costs of
issuing the said Bonds. These bonds will bear interest at varying rates between 2.00% and 3.20%
and will mature in varying amounts from July 1, 2016 through July 1, 2035.
Note 15—Restatement
As a result of adopting GASB Statement No. 65 Items Previously Reported as Assets and
Liabilities, unamortized bond issuance costs which were previously reported as assets have been
expensed, as follows:
(in thousands)
Net position at June 30, 2012, as previously reported $3,100,158
Unamortized bond issuance costs expensed (9,220)
Net position at June 30, 2012, as restated $3,090,938
Note 16—Prospective Accounting Change
The Governmental Accounting Standards Board has issued Statement No. 68, Accounting
and Financial Reporting for Pensions–an Amendment of GASB No. 27. This statement will be
implemented for the fiscal year ending June 30, 2015. The revised requirements establish new
financial reporting requirements for state and local governments which provide their employees
with pension benefits, including additional note disclosures and required supplementary
information. In addition, the Statement of Net Position is expected to include a significant
liability for the government’s proportionate share of the employee pension plan.

58 Notes to Financial Statements
Note 17—Segment Information
A segment represents identifiable activities for which one or more revenue bonds or other
revenue-backed debt is outstanding. Investors in Academic Building Revenue Bonds rely on
pledged tuition and fees revenues generated by the University for repayment. Investors in bonds
of all other bond enterprises rely solely on the revenue generated by the individual activities for
repayment. The University’s segments are described as follows:
ACADEMIC BUILDING REVENUE BONDSThe Academic Building Revenue Bond Funds were created to defray the costs of constructing
and renovating academic buildings of the University.
ATHLETIC FACILITIES REVENUE BONDSThe Athletic Facilities Revenue Bond Funds were created to defray the costs of constructing
and equipping certain athletic and recreational buildings and facilities at the University. The
revenues pledged to these bonds are generated by student fees, tickets sold to athletic events and
concessions at athletic events.
CENTER FOR UNIVERSITY ADVANCEMENT REVENUE BONDSThe Center for University Advancement Revenue Bond Funds were created to defray the costs
of constructing, furnishing, and equipping a building to be used as the Center for University
Advancement at the University. The revenues pledged to these bonds are rental payments
received from the University of Iowa Foundation for the use of the building.
HOSPITAL REVENUE BONDSThe Hospital Revenue Bond Funds were created to defray the costs of various construction and
renovation projects at the University of Iowa Hospitals & Clinics. The revenues pledged to these
bonds consist of charges to patients for medical services.
IOWA MEMORIAL UNION (IMU) REVENUE BONDSThe Iowa Memorial Union (IMU) Revenue Bond Funds were created to defray the cost of
alterations and improvements to the IMU at the University. The revenues pledged to these bonds
are generated by fees paid by users of the IMU and from student fees.
PARKING SYSTEM REVENUE BONDSThe Parking System Revenue Bond Funds were created to defray additional costs of constructing,
improving, and equipping various parking facilities at the University. The revenues pledged to
these bonds are generated by fees paid by users of the parking facilities.
RECREATIONAL FACILITIES REVENUE BONDSThe Recreational Facilities Revenue Bonds were created to defray the costs of building,
furnishing, and equipping the Campus Recreation and Wellness Center and constructing
improvements to the University Field House at the University. The revenues pledged to these
bonds consist of student fees and charges.

59 Notes to Financial Statements Notes to Financial Statements 59
RESIDENCE SERVICES REVENUE BONDSThe Residence Services Revenue Bond Funds were created to defray additional costs of
constructing, improving and maintaining various residence halls and related facilities at the
University. The revenues pledged to these bonds are generated by fees paid by users of the
residence halls’ services.
TELECOMMUNICATIONS FACILITIES REVENUE BONDSThe Telecommunications Facilities Revenue Bond Funds were created to defray the costs of
constructing, equipping, furnishing, and improving the telecommunications facilities of the
University. The revenues pledged to these bonds come from charges assessed to the users of the
telecommunications facilities.
UNIVERSITY OF IOWA FACILITIES CORPORATION REVENUE BONDSThe University of Iowa Facilities Corporation Revenue Bond Funds were created to provide
financial assistance to the University of Iowa for the acquisition and construction of facilities
for the benefit of the University of Iowa. The bonds are payable solely from the lease payments
paid by the University of Iowa for the facilities. Upon repayment of the bonds, ownership of the
acquired facilities transfers to the University of Iowa.
UTILITY SYSTEM REVENUE BONDSThe Utility System Revenue Bond Funds were created to defray additional costs to construct,
equip and furnish the utility system of the University. The revenues pledged to these bonds come
from charges assessed to the users of the utility system.
FUND ACCOUNTINGIn order to ensure the observance of limitations and restrictions placed on the use of available
resources, the accounts are maintained in accordance with the principles of fund accounting.
Each fund provides a separate set of self-balancing accounts which comprises its assets,
liabilities, reserves, net position, revenues and expenses. Fund accounting is the procedure by
which resources for various purposes are classified, for accounting and reporting purposes, into
funds according to the activities or objectives specified. The University has set up accounts which
are consistent with the flow of funds per requirements of the bond covenants.
TRANSFERS IN (OUT)After meeting certain requirements specified in the bond agreements, the balance of net
receipts may be transferred to the University for its general operations. However, all such
monies that have been transferred shall be returned by the University, if necessary, to satisfy the
requirements of the bond indentures.

60 Notes to Financial Statements
Segment Reporting (in thousands)Academic
Building Revenue
Bonds
Athletic Facilities Revenue
Bonds
Center for University
Advancement Revenue
Bonds
Hospital Revenue
Bonds
IMU Revenue
Bonds
Parking System
Revenue Bonds
Recreational Facilities
Revenue Bonds
Residence Services Revenue
Bonds
Telecomm. Facilities Rev-
enue Bonds
UI Facility Corporation
Bonds
Utility System
Revenue Bonds
CONDENSED STATEMENT OF NET POSITIONAssets:
Current assets $17,125 $21,505 $773 $429,990 $3,063 $2,981 $5,776 $9,606 $4,754 $43 $12,782 Capital assets 492,094 127,807 6,633 699,136 34,945 93,480 94,704 129,667 32,946 208,909 265,860 Other noncurrent assets 40,453 11,568 938 721,399 642 24,231 9,609 53,848 12,586 14,971 16,841
Total assets 549,672 160,880 8,344 1,850,525 38,650 120,692 110,089 193,121 50,286 223,923 295,483
Deferred outflows of resources - - - 452 - - - 57 - 1,564 810
Liabilities:
Current liabilities 16,767 21,631 772 211,848 3,614 4,596 5,777 10,740 4,358 9,838 9,750 Noncurrent liabilities 170,482 137,114 3,760 413,588 7,284 60,850 67,858 90,081 34,838 152,458 150,815
Total liabilities 187,249 158,745 4,532 625,436 10,898 65,446 73,635 100,821 39,196 162,295 160,565
Deferred inflows of resources 1,400 - - 16 700 630 - 1,247 38 336 2,199
Net Position:
Invested in capital assets, net of related debt 341,651 (14,092) 2,202 457,748 26,960 39,800 23,920 59,067 -4,400 48,314 106,575 Restricted - expendable 19,372 16,343 1,610 7,571 633 4,080 10,884 26,993 5,873 14,542 15,980 Unrestricted - (116) - 760,206 -541 10,736 1,650 5,050 9,579 - 10,974
Total net position $361,023 $2,135 $3,812 $1,225,525 $27,052 $54,616 $36,454 $91,110 $11,052 $62,856 $133,529
CONDENSED STATEMENT OF REVENUES, EXPENSES AND CHANGES IN NET POSITION
Operating revenues $358,548 $33,906 - $1,189,532 $14,161 $18,531 $4,127 $67,855 $23,555 - $87,827 Depreciation expense (24,524) (6,849) (901) (73,639) -1,540 -2,577 -3,024 -6,184 -1,090 -5,105 -13,986Other operating expenses (1,370) (13,593) - (1,061,305) -17,230 -12,725 -6,822 -55,394 -17,260 -115 -57,563
Net operating income (loss) 332,654 13,464 (901) 54,588 -4,609 3,229 -5,719 6,277 5,205 -5,220 16,278
Nonoperating revenues (expenses) (4,270) (5,130) (194) 45,594 -72 -862 -4,103 -770 -1,576 -6,128 -4,587Transfers from/(to) University funds (331,730) (9,821) 852 (42,331) 4,448 -463 19,984 1,055 -2,073 31,542 -16,324
Change in net position (3,346) (1,487) (243) 57,851 -233 1,904 10,162 6,562 1,556 20,194 -4,633
Net position, beginning of year, as restated 364,369 3,622 4,055 1,167,674 27,285 52,712 26,292 84,548 9,496 42,662 138,162
Net position, end of year $361,023 $2,135 $3,812 $1,225,525 $27,052 $54,616 $36,454 $91,110 $11,052 $62,856 $133,529
CONDENSED STATEMENT OF CASH FLOWSNet cash provided (used) by operating activities $358,601 $19,275 - $150,002 -$3,070 $4,870 -$2,622 $11,031 $6,226 - $28,828
Net cash provided (used) by noncapital financing activities (329,394) (12,547) 852 (42,281) -689 -499 890 -152 -946 14,679 -14,976
Net cash provided (used) by capital and related financing activities 916 (9,759) (862) (155,461) 2,144 -1,321 1,709 -2,667 -4,489 -20,280 -24,113
Net cash provided (used) by investing activities (1,051) (3,115) 31 47,765 995 228 -2,617 -1,090 -677 -492 -4,456
Net increase (decrease) in cash 29,072 (6,146) 21 25 -620 3,278 -2,640 7,122 114 -6,093 -14,717
Cash and cash equivalents, beginning of year 12,560 27,705 797 2,129 692 9,470 11,775 46,464 11,824 6,124 29,795
Cash and cash equivalents, end of year $41,632 $21,559 $818 $2,154 $72 $12,748 $9,135 $53,586 $11,938 $31 $15,078

61 Notes to Financial Statements Notes to Financial Statements 61
Academic Building
Revenue Bonds
Athletic Facilities Rev-
enue Bonds
Center for Uni-versity Advance-
ment Revenue Bonds
Hospital Revenue
Bonds
IMU Revenue
Bonds
Parking System
Revenue Bonds
Recreational Facilities Revenue
Bonds
Residence Services Revenue
Bonds
Telecomm. Facilities Revenue
Bonds
UI Facilities Corporation
Revenue Bonds
Utility System
Revenue Bonds
CONDENSED STATEMENT OF NET POSITIONAssets:
Current assets $17,125 $21,505 $773 $429,990 $3,063 $2,981 $5,776 $9,606 $4,754 $43 $12,782 Capital assets 492,094 127,807 6,633 699,136 34,945 93,480 94,704 129,667 32,946 208,909 266,225 Other noncurrent assets 40,453 11,568 938 721,399 642 24,231 9,609 53,848 12,586 14,971 16,841
Total assets 549,672 160,880 8,344 1,850,525 38,650 120,692 110,089 193,121 50,286 223,923 295,848
Total deferred outflows - - - 452 - - - 57 - 1,564 810
Liabilities:
Current liabilities 16,767 21,631 772 211,848 3,614 4,596 5,777 10,740 4,358 9,838 9,749 Noncurrent liabilities 170,482 137,114 3,760 413,588 7,284 60,850 67,858 90,081 34,838 152,458 150,815
Total liabilities 187,249 158,745 4,532 625,436 10,898 65,446 73,635 100,821 39,196 162,295 160,564
Total deferred inflows 1,400 - - 16 700 630 - 1,247 38 336 2,200
Net Position:
Invested in capital assets, net of related debt 341,651 -14,092 2,202 457,748 26,960 39,800 23,920 59,067 (4,400) 48,314 106,940 Restricted - expendable 19,372 16,343 1,610 7,571 633 4,080 10,884 26,993 5,873 14,542 15,980 Unrestricted - -116 - 760,206 (541) 10,736 1,650 5,050 9,579 - 10,974
Total net position $361,023 $2,135 $3,812 $1,225,525 $27,052 $54,616 $36,454 $91,110 $11,052 $62,856 $133,894
CONDENSED STATEMENT OF REVENUES, EXPENSES AND CHANGES IN NET POSITION
Operating revenues $348,015 $33,906 - $1,189,532 $14,161 $18,531 $4,127 $67,855 $23,555 - $87,827 Depreciation expense -24,524 -6,849 -901 -73,639 (1,540) (2,577) (3,024) (6,184) (1,090) (5,105) (13,986)Other operating expenses -1,370 -13,593 - -1,061,305 (17,230) (12,725) (6,822) (55,394) (17,260) (115) (57,563)
Net operating income (loss) 322,121 13,464 -901 54,588 (4,609) 3,229 (5,719) 6,277 5,205 (5,220) 16,278
Nonoperating revenues (expenses) -5,157 -6,984 -194 45,594 (72) (85) (2,996) 148 (1,246) (6,128) (3,318)Transfers from/(to) University funds -321,197 -9,821 852 -42,331 4,448 (463) 19,984 1,055 (1,675) 31,542 (15,959)
Change in net position -4,233 -3,341 -243 57,851 (233) 2,681 11,269 7,480 2,284 20,194 (2,999)
Net position, beginning of year 365,256 5,476 4,055 1,167,674 27,285 51,935 25,185 83,630 8,768 42,662 136,893
Net position, end of year $361,023 $2,135 $3,812 $1,225,525 $27,052 $54,616 $36,454 $91,110 $11,052 $62,856 $133,894
CONDENSED STATEMENT OF CASH FLOWSNet cash provided (used) by operating activities $348,068 $19,275 - $150,002 ($3,070) $4,870 ($2,622) $11,031 $6,226 - $28,828
Net cash provided (used) by noncapital financing activities -318,861 -12,547 852 -42,281 (689) (499) 890 (152) (946) 14,679 (14,976)
Net cash provided (used) by capital and related financing activities 916 -9,759 -862 -155,461 2,144 (1,321) 1,709 (2,667) (4,489) (20,280) (24,113)
Net cash provided (used) by investing activities -1,051 -3,115 31 47,765 995 228 (2,617) (1,090) (677) (492) (4,456)
Net increase (decrease) in cash 29,072 -6,146 21 25 (620) 3,278 (2,640) 7,122 114 (6,093) (14,717)
Cash and cash equivalents, beginning of year 12,560 27,705 797 2,129 692 9,470 11,775 46,464 11,824 6,124 29,795
Cash and cash equivalents, end of year $41,632 $21,559 $818 $2,154 $72 $12,748 $9,135 $53,586 $11,938 $31 $15,078

62 Notes to Financial Statements
Academic Building Revenue
Bonds
Athletic Facilities Revenue
Bonds
Center for University
Advancement Revenue
Bonds
Hospital Revenue
Bonds
IMU Revenue
Bonds
Parking Sys-tem Revenue
Bonds
Recreational Facilities Rev-
enue Bonds
Residence Services Rev-
enue Bonds
Telecomm. Facilities Rev-
enue Bonds UI Facility Cor-
poration Bonds
Utility System
Revenue Bonds
DEBT SERVICE COVERAGEDebt service coverage % - Required N/A 125% 100% 130% 120% 120% 125% 135% 110% N/A 120%
Debt service coverage % - Actual N/A 204% 100% 651% 191% 244% 132% 240% 165% N/A 184%
PORTION OF REVENUE PLEDGEDAnnual debt service (principal & interest) $11,008 $10,716 $874 $19,702 $812 $3,018 $6,048 $7,000 $3,848 $14,956 $17,438
Net pledged revenue 348,095 21,852 874 128,228 1,553 7,369 7,965 16,776 6,355 N/A 32,007
Annual debt service/Net operating revenues (%) 3% 49% 100% 15% 52% 41% 76% 42% 61% N/A 54%
REVENUE BONDS PAYABLEA summary of revenue bonds payable activity, by segment, for the year ended June 30, 2014, is as follows:
Beginning Balance, as restated $122,259 $146,113 $5,075 $349,982 $8,100 $43,030 $73,546 $70,352 $40,266 $171,029 $168,393
Additions 80,596 - - - 7,285 20,001 - 28,238 - 8,255 18,137
Reductions 26,628 4,214 645 6,864 8,100 761 2,763 3,879 2,958 17,461 28,640
Ending Balance $176,227 $141,899 $4,430 $343,118 $7,285 $62,270 $70,783 $94,711 $37,308 $161,823 $157,890
DEBT SERVICE REQUIREMENTSA summary of revenue bond debt service for payment of principal and interest is shown below. As of June 30, 2014, the amount shown for debt service payments due on July 1 were on hand.
Semi-annual maturity Jan & Jul 1st Jan & Jul 1st Jan & Jul 1st Mar & Sep 1st Jan & Jul 1st Jan & Jul 1st Jan & Jul 1st Jan & Jul 1st Jan & Jul 1st Dec & Jun 1st May & Nov 1st
Due on demand $25 - - - - - - - - - -
2015 12,457 10,625 859 24,674 158 3,089 5,995 7,346 3,811 14,855 12,611
2016 12,006 10,596 850 24,533 698 3,420 4,856 8,519 3,113 14,731 14,026
2017 12,865 10,618 853 24,442 733 4,612 4,979 8,484 2,395 14,727 14,230
2018 13,916 10,673 834 24,305 739 4,511 5,116 8,327 2,391 14,725 14,174
2019 13,845 10,697 838 24,252 737 4,514 5,098 8,289 2,380 14,765 14,127
2020-2024 68,712 54,616 844 120,128 3,689 19,529 27,179 35,485 11,976 58,112 65,278
2025-2029 59,175 55,498 - 114,772 1,482 15,484 26,020 20,653 12,149 48,370 48,004
2030-2034 39,283 37,550 - 76,228 - 13,195 24,795 19,047 11,500 23,493 16,912
2035-2039 10,263 7,239 - 65,882 - 13,321 4,941 1,882 4,932 11,892 8,887
2040-2042 - - - - - 5,367 - - - - -
Unamortized Discount and Premium 5,282 499 13,012 865 1,200 158 3,221 183 2,438 3,350
Total $247,829 $208,611 $5,078 $512,228 $9,101 $88,242 $109,137 $121,253 $54,830 $218,108 $211,599
COMMITMENTSAs of June 30, 2014, the University has entered into contract commitments for construction projects as follows:
Contract Commitments $158,567 $356 - $186,725 $13,340 $11,205 $4,921 $28,019 $364 $7,263 $5,057

63 Notes to Financial Statements Notes to Financial Statements 63
Academic Building Rev-
enue Bonds
Athletic Facilities Rev-
enue Bonds
Center for Uni-versity Advance-
ment Revenue Bonds
Hospital Rev-enue Bonds
IMU Revenue
Bonds
Parking System
Revenue Bonds
Recreational Facilities Revenue
Bonds
Residence Services Revenue
Bonds
Telecomm. Facilities Revenue
Bonds
UI Facilities Corporation
Revenue Bonds
Utility System
Revenue Bonds
DEBT SERVICE COVERAGEDebt service coverage % - Required N/A 125% 100% 130% 120% 120% 125% 135% 110% N/A 120%
Debt service coverage % - Actual N/A 204% 100% 651% 191% 244% 132% 240% 165% N/A 184%
PORTION OF REVENUE PLEDGEDAnnual debt service (principal & interest) $11,008 $10,716 $874 $19,702 $812 $3,018 $6,048 $7,000 $3,848 $14,956 $17,438
Net pledged revenue 348,095 21,852 874 128,228 1,553 7,369 7,965 16,776 6,355 N/A 32,007
Annual debt service/Net operating revenues (%) 3% 49% 100% 15% 52% 41% 76% 42% 61% N/A 54%
REVENUE BONDS PAYABLEA summary of revenue bonds payable activity, by segment, for the year ended June 30, 2014
Beginning Balance $122,259 $146,113 $5,075 $349,981 $8,100 $43,030 $73,546 $70,351 $40,266 $171,029 $168,393
Additions 80,596 - - - 7,285 20,001 - 28,238 - 8,255 18,136
Deductions 26,628 4,214 645 6,864 8,100 761 2,763 3,879 2,958 17,461 28,649
Ending Balance $176,227 $141,899 $4,430 $343,117 $7,285 $62,270 $70,783 $94,710 $37,308 $161,823 $157,890
DEBT SERVICE REQUIREMENTSA summary of revenue bond debt service for payment of principal and interest is shown below. As of June 30, 2014, the amount shown for debt service payments due on July 1 were on hand.
Semi-annual maturity Jan & Jul 1st Jan & Jul 1st Jan & Jul 1st Mar & Sep 1st Jan & Jul 1st Jan & Jul 1st Jan & Jul 1st Jan & Jul 1st Jan & Jul 1st Dec & Jun 1st May & Nov 1st
Due on demand $25 - - - - - - - - - -
2014 12,457 10,625 859 24,674 158 3,089 5,995 7,346 3,811 14,855 12,611
2015 12,006 10,596 850 24,533 698 3,420 4,856 8,519 3,113 14,731 14,026
2016 12,865 10,618 853 24,442 733 4,612 4,979 8,484 2,395 14,727 14,230
2017 13,916 10,673 834 24,305 739 4,511 5,116 8,327 2,391 14,725 14,173
2018 13,845 10,697 838 24,252 737 4,514 5,098 8,289 2,380 14,765 14,127
2019-2023 68,712 54,616 844 120,128 3,689 19,529 27,179 35,485 11,976 58,112 65,279
2024-2028 59,175 55,498 - 114,772 1,482 15,484 26,020 20,653 12,149 48,370 48,004
2029-2033 39,283 37,550 - 76,228 - 13,195 24,795 19,047 11,500 23,493 16,912
2034-2038 10,263 7,239 - 65,882 - 13,321 4,941 1,882 4,932 11,892 8,887
2039-2041 - - - - - 5,367 - - - - -
Unamortized Discount, Premium, 5,282 499 13,012 865 1,200 158 3,221 183 2,438 3,350
Total Principal and Interest $247,829 $208,611 $5,078 $512,228 $9,101 $88,242 $109,137 $121,253 $54,830 $218,108 $211,599
COMMITMENTSAs of June 30, 2014, the University has entered into contract commitments for construction projects as follows:
Contract Commitments $158,567 $356 - $186,725 $13,340 $11,205 $4,921 $28,019 $364 $7,263 $5,057

64 Notes to Financial Statements
The following schedule represents the University’s actuarially determined funding progress using the projected unit credit actuarial cost method. See Note 8 in the accompanying Notes to the Financial Statements for the plan description, funding policy, annual OPEB cost, Net OPEB Obligation, and funded status and funding progress.
SCHEDULE OF FUNDING PROGRESS BY VALUATION DATE (in thousands)
As a result of a change in the discount rate from 7.5% to 5.0%, the Actuarial Accrued Liability
increased from the prior year. All other assumptions used in the calculation remained the same.
Actuarial Value of
Assets
Actuarial Accrued Liability
(AAL)
Unfunded Actuarial Accrued Liability (UAAL)
Funded Ratio
Annual Covered
Payroll
UAAL as a percentage of Covered
Payroll
Fiscal Year Ended
Valuation Date
6/30/12 7/1/11 - $151,820 $151,820 0.00% $836,794 18.10%
6/30/13 7/1/12 - $169,800 $169,800 0.00% $906,000 18.70%
6/30/14 7/1/13 - $276,300 $276,300 0.00% $924,200 29.90%
Required Supplementary Information June 30, 2014

65 Notes to Financial Statements
OFFICE OF THE CONTROLLER ACCOUNTING & FINANCIAL REPORTING
Terry L. Johnson Associate Vice President and University Controller
Selina J. Martin Associate Controller
Steve Romont Director, Accounting & Financial Reporting
Yan Huang Assistant Director, Accounting & Financial Reporting
Design and Photography by University Communication and MarketingPrinted by UI Printing Services
r Printed on recycled paper
This financial report is designed to provide users with a general overview of the University of Iowa’s finances and to demonstrate the University’s accountability for the funds received. Questions regarding this report, or requests for additional financial information, should be directed to the Controller’s Office, University of Iowa, B5 Jessup Hall, Iowa City, IA 52242 or phone 319-335-0062. An electronic version can be found at afr.fo.uiowa.edu/annual-reports.
The University of Iowa prohibits discrimination in employment and in its educational programs and activities on the basis of race, national origin, color, creed, religion, sex, age, disability, veteran status, sexual orientation, gender identity, or associational preference. The University also affirms its commitment to providing equal opportunities and equal access to University facilities. For additional information on nondiscrimination policies, contact the Coordinator of Title IX, Section 504, and the ADA in the Office of Equal Opportunity & Diversity, 319/335-0705 (voice) or 319/335-0697 (text). The University of Iowa, 202 Jessup Hall, Iowa City, Iowa 52242-1316. W13762-1/15
