financial report (u.s. version) year ended 30 june 2017 · the commonwealth bank of australia...
TRANSCRIPT

Financial Report (U.S. Version) Year ended 30 June 2017

Other information
1
2
5
30
148
Contents Introduction
Our board
Directors’ report
Financial report

Introduction
The Commonwealth Bank of Australia Financial Report
(US Version) - Year Ended 30 June 2017, which contains
the Financial Statements for the year ended 30 June 2015,
2016 and 2017 and as of 30 June 2016 and 2017 (the
“2017 Financial Report”) should be read in conjunction with:
The Commonwealth Bank of Australia Financial
Report (US version) – Year Ended 30 June 2016,
which contains the Financial Statements for the years
ended 30 June 2014, 2015 and 2016 and as at
30 June 2015 and 2016 (the “2016 Financial Report”);
and
The Commonwealth Bank of Australia Basel III Pillar 3
Capital Adequacy and Risk Disclosures as at
30 June 2017, in each case, as found on the
US Investor Website located at:
www.commbank.com.au/usinvestors (the “US Investor
Website”).
1

Our board
Catherine has been a Director since March 2016 and was appointed Chairman on 1 January 2017. Catherine is Chairman of the Nominations Committee, a member of the Risk Committee, the Audit Committee and the Remuneration Committee. She is a former Chairman of Telstra and of the CSIRO, and was Managing Director and Chief Executive Officer of Cochlear Limited. She has served on the Boards of Macquarie Group Limited, Goodman Fielder Limited and Rural Press Limited and has contributed to the work of the Innovation and Productivity Council for the New South Wales Government. She is a former President of the Business Council of Australia. In 2008, Catherine was awarded Officer of the Order of Australia.
Other Directorships and Interests: WorleyParsons Ltd, The George Institute for Global Health, Saluda Medical Pty Ltd, University of Technology Sydney (Chancellor) and Australian Museum Trust (President).
Qualifications: BA (Accounting) (Hons), FCA, FTSE, FAICD, FAA.
Ian has been a Director since December 2011 and was appointed Managing Director and Chief Executive Officer on 1 December 2011. He joined the Bank in May 2007 as Group Head of Strategy, responsible for corporate strategy development, mergers and acquisitions and major cross business strategic initiatives. In January 2009 he was appointed as Group Executive, Business and Private Banking. Prior to joining the Bank, Ian was a partner of McKinsey’s New York, Sydney and Auckland offices. He became a global partner in 2003, and from 2005 until his departure in 2007 was head of McKinsey’s New Zealand office. Prior to joining McKinsey, Ian was a lawyer specialising in mergers and acquisitions.
Other Directorships and Interests: Sydney Theatre Company Ltd (Chairman), Business Council of Australia, The Financial Markets Foundation for Children and Institute of International Finance.
Qualifications: BA LLB (Hons) (Auck), LLM (Cantab), LLM (NYU).
Shirish has been a Director since June 2014. He is Chairman of the Risk Committee and a member of the Audit Committee. Shirish has more than 32 years’ experience with Citi having held various senior roles, including Co-Chairman of Citi Asia Pacific Banking, Chief Executive Officer of Citi Asia Pacific, Chief Executive Officer of Central & Eastern Europe, Middle East & Africa and Country Manager and Deputy President of Citi Handlowy, where he is now Vice Chairman of the Supervisory Board. Shirish is a former Director of Crompton Greaves Ltd.
Other Directorships and Interests: IHH Healthcare Bhd (including two of its subsidiaries), AIG Asia Pacific Pte Ltd, Clifford Capital Pte Ltd, Pierfront Capital Mezzanine Fund Pte Ltd (Chairman) and Supervisory Board of Citi Handlowy (Vice Chairman).
Qualifications: CA, BCom (Calc), MBA (LondBus).
Sir David has been a Director since September 2014. He is Chairman of the Remuneration Committee and a member of the Risk Committee. Sir David is Chairman of Gatwick Airport Ltd, which operates Gatwick Airport in the UK and Chairman of High Speed Two (HS2) Ltd, the company responsible for developing and promoting the UK’s new high speed rail network. Sir David is a senior advisor to Global Infrastructure Partners in the US and to Lone Star Funds. Previously he was Chief Executive Officer of Network Rail Infrastructure Ltd, Chief Executive Officer of the Olympic Delivery Authority for the London 2012 Olympic Games, Chief Executive Officer of English Partnerships and Managing Director and Chief Executive Officer of Lend Lease.
Other Directorships and Interests: Gatwick Airport Ltd (Chairman) and High Speed Two (HS2) Ltd (Chairman).
Qualifications: BE (Civil) (USyd), Diploma (Securities Institute of Australia).
Launa has been a Director since March 2011. She is a member of the Audit Committee and the Remuneration Committee. She was Managing Director and Chief Executive Officer of Billabong International Limited from May 2012 until August 2013. Prior to this, she was Managing Director of Target Australia Pty Limited and Managing Director of Officeworks Ltd. She has significant international and Australian experience in retailing, wholesale, property and logistics, as well as extensive marketing experience in traditional, digital and social media channels. Launa is a former Director of Bellamy’s Australia Ltd.
Other Directorships and Interests: Super Retail Group Ltd, Precinct Properties New Zealand Ltd, Melbourne Fashion Festival Ltd and The Alannah and Madeline Foundation Ltd.
Qualifications: MCom (UNISA), BCom (Hons) (UNISA), BCom (Economics and Accounting) (UNISA), MAICD.
Ian Narev Managing Director and Chief Executive Officer
Mr Narev is a resident of New South Wales. Age 50.
Shirish Apte Non-Executive Director
Mr Apte is a resident of Singapore. Age 64.
Sir David HigginsNon-Executive Director
Sir David is a resident of London, United Kingdom. Age 62.
Launa InmanNon-Executive Director
Ms Inman is a resident of Victoria. Age 60.
Catherine Livingstone AOChairman
Ms Livingstone is a resident of New South Wales. Age 61.
2

Co
mm
on
we
alth B
an
k of A
ustra
liaA
nn
ual R
epo
rt 2017F
inan
cial rep
ort
6
Perfo
rman
ce o
verview
2
Co
rpo
rate resp
on
sibility
3
Co
rpo
rate g
overn
ance
4
Directo
rs’ rep
ort
5
Oth
er in
form
ation
7
Ou
r b
usin
ess
1
Brian has been a Director since September 2010. He is Chairman of the Audit Committee, a member of the Risk Committee and the Nominations Committee. He retired as a partner of Ernst & Young on 30 June 2010. Until that time he was the Chairman of both the Ernst & Young Global Advisory Council and the Oceania Area Advisory Council. He was one of the firm’s most experienced audit partners with over 30 years’ experience in serving as audit signing partner on major Australian public companies including those in the financial services, property, insurance and media sectors.
Other Directorships and Interests: Brambles Limited, Cantarella Bros Pty Ltd, University of New South Wales (Council Member) and Centennial Park and Moore Park Trust (Trustee).
Qualifications: FCA.
Andrew has been a Director since July 2008. He is a member of the Risk Committee and the Remuneration Committee. Andrew has over 40 years’ financial services experience. He was Managing Director and Chief Executive Officer of AMP Limited from October 2002 until December 2007. Andrew’s previous roles at AMP included Managing Director, AMP Financial Services and Managing Director and Chief Investment Officer, AMP Asset Management. Previously, he was the Group Chief Economist, Chief Manager, Retail Banking and Managing Director, ANZ Funds Management at ANZ Banking Group. Andrew commenced his career at the Reserve Bank of Australia where his roles included Senior Economist and Deputy Head of Research.
Other Directorships and Interests: ASIC External Advisory Panel (Member) and CEDA Board of Governors (Member).
Qualifications: BEc (Hons) (Monash).
Mary has been a Director since June 2016. She is a member of the Remuneration Committee and the Nominations Committee. Mary is a pre-eminent intellectual property lawyer with over 30 years’ experience. She is a Partner and the Vice Chairman of Ashurst, having been the Chairman of Ashurst Australia for eight years prior to the firm’s full merger with Ashurst LLP in 2013. Mary spent a number of years in the UK with boutique firm, Bristows, and as resident partner of Ashurst Australia. She has undertaken intellectual property work for Australian and multinational corporations in a range of technology areas and has extensive international, legal and governance experience.
Other Directorships and Interests: Ashurst (Vice Chairman), Trans-Tasman IP Attorneys Board (Chairman), The Macfarlane Burnet Institute for Medical Research and Public Health Ltd, Chief Executive Women (Member), Melbourne University Law School Foundation (Member) and Victorian Legal Admissions Board (Member).
Qualifications: BA LLB (Hons) (Melb), GAICD.
Wendy has been a Director since March 2015. She is a member of the Remuneration Committee. Wendy was Senior Managing Director, Technology – Asia Pacific for Accenture Limited from 2012 until June 2014. Her career at Accenture spanned some 32 years in which she held various senior positions, including Global Managing Director, Technology Quality & Risk Management, Global Managing Director, Outsourcing Quality & Risk Management and Director of Operations, Asia Pacific. She also served on Accenture’s Global Leadership Council from 2008 until her retirement.
Other Directorships and Interests: Fitted For Work Ltd, University of Melbourne (Council Member) and Chief Executive Women (Member), serving on the Scholarships and Marketing & Communications Committees.
Qualifications: BAppSc (Information Technology), GAICD.
Harrison has been a Director since February 2007. He is a member of the Risk Committee, the Audit Committee and the Nominations Committee. He was Chairman of NBN Co Limited from March 2010 until March 2013. Previously he was a Director and Member of the Financial Stability Committee of the Bank of England, Chairman of Morgan Stanley Australia and Vice Chairman of Morgan Stanley Asia. Harrison also spent two years in Beijing as Chief Executive Officer of China International Capital Corporation and from 1991 until 1994, he was a senior officer of the Federal Deposit Insurance Corporation in Washington.
Other Directorships and Interests: The Conversation Media Group Ltd (Chairman).
Qualifications: A.B. (Cum Laude) (Harvard), LLD (Honoris Causa) (Monash).
Brian LongNon-Executive Director
Mr Long is a resident of New South Wales. Age 71.
Andrew MohlNon-Executive Director
Mr Mohl is a resident of New South Wales. Age 61.
Mary PadburyNon-Executive Director
Ms Padbury is a resident of Victoria. Age 58.
Wendy StopsNon-Executive Director
Ms Stops is a resident of Victoria. Age 56.
Harrison YoungNon-Executive Director
Mr Young is a resident of Victoria. Age 72.
3

This page has been intentionally left blank
4

Ou
r b
usin
essP
erform
ance
overview
C
orp
orate
respo
nsib
ility C
orp
orate
go
vernan
ceD
irectors’
repo
rtO
ther
info
rmatio
nC
om
mo
nw
ea
lth Ba
nk o
f Au
stralia
An
nu
al Rep
ort 2017
Fin
ancial
repo
rt
6
2
1
3
4
5
7
Directors’ report5
Directors’ reportThe Directors of the Commonwealth Bank of Australia submit their report, together with the financial report of the Commonwealth Bank of Australia (the Bank) and of the Group, being the Bank and its controlled entities, for the year ended 30 June 2017.Principal ActivitiesWe are one of Australia’s leading providers of integrated financial services, including retail, business and institutional banking, funds management, superannuation, life insurance, general insurance, broking services and finance company activities.Our operations are conducted primarily in Australia, New Zealand and the Asia Pacific region. In addition, we also operate in a number of other countries including the United Kingdom, the United States, China, Japan, Singapore, Hong Kong, Indonesia and South Africa.There have been no significant changes in the nature of the principal activities during the financial year.Consolidated ProfitOur net profit after income tax and non-controlling interests for the year ended 30 June 2017 was $9,928 million (2016: $9,223 million).Our vision is to excel at securing and enhancing the financial wellbeing of people, businesses and communities. The long-term strategies that the Group has pursued to achieve this vision have continued to deliver high levels of customer satisfaction across all businesses and another solid financial result.Operating income growth was solid, relative to the prior year. Excluding a $397 million gain on sale of the Group’s remaining investment in Visa Inc., underlying operating income increased due to solid growth in banking income. Operating expenses increased, including a $393 million one-off expense for acceleration of amortisation on certain software assets. Underlying expenses increased due to higher staff and technology costs, and increased investment spend partly offset by the incremental benefit generated from productivity initiatives.Loan impairment expense decreased primarily due to lower provisioning levels in Institutional Banking and Markets and Business and Private Banking, partly offset by an increase in Bankwest. Provisioning levels remain prudent and there has been no change to the economic overlay.DividendsThe Directors have determined a fully franked (at 30%) final dividend of 230 cents per share amounting to $3,979 million. The dividend will be payable on 29 September 2017 to shareholders on the register at 5pm AEST on 17 August 2017.Dividends paid in the year ended 30 June 2017 were as follows:• In respect of the year to 30 June 2016, a fully franked final
dividend of 222 cents per share amounting to $3,808 millionwas paid on 29 September 2016. The payment compriseddirect cash disbursements of $3,222 million with $586 millionbeing reinvested by participants through the DividendReinvestment Plan (DRP); and
• In respect of the year to 30 June 2017, a fully franked interimdividend of 199 cents per share amounting to $3,429 millionwas paid on 4 April 2017. The payment comprised directcash disbursements of $2,871 million with $558 million beingreinvested by participants through the DRP.
Review of OperationsAn analysis of operations for the financial year is set out in the Performance Overview sections.Changes in State of AffairsWe continue to make progress against each of the key strategic priorities in pursuit of our vision to secure and enhance the financial wellbeing of people, businesses and communities. There have been no significant changes in the state of affairs during the financial year.Events Subsequent to Balance Sheet DateWe expect the DRP for the final dividend for the year ended 30 June 2017 will be satisfied by the issue of shares of approximately $1.4 billion. AUSTRAC Civil ProceedingsOn 3 August 2017, Australian Transaction Reports and Analysis Centre (AUSTRAC) commenced civil penalty proceedings against CBA. CBA takes the allegations made by AUSTRAC very seriously and will file a defence in relation to this matter, which will take significant time to prepare. The actual outcome in this matter will be determined by a Court in accordance with established legal principles. The AUSTRAC statement of claims relates to alleged past and ongoing contraventions of four provisions of the Anti-Money Laundering and Counter-Terrorism Financing Act 2006 (Cth). To the extent that contraventions may be established, a Court will ordinarily
take into account a range of factors in setting penalties. One factor is the extent to which any contraventions arise from a single course of conduct. For example, AUSTRAC alleges that approximately 53,000 threshold transaction reports were lodged late. Late lodgement carries a penalty of up to $18 million. However, these alleged contraventions could be considered to arise from a single course of conduct to the extent that they emanated from the same systems error. Ultimately, a Court will seek to ensure that, overall, any civil penalties are just and appropriate and do not exceed what is proper having regard to the totality of established contraventions. Under the Act, the only mechanism available to AUSTRAC to secure a pecuniary penalty from CBA is by taking court action. What we can say about these proceedings is limited until they have run their course. CBA is reviewing the allegations in the 580 page statement of claim and at this time it is not possible to reliably estimate the possible financial effect on the Group. It is not appropriate to disclose any detailed information about the subject matter of the claims as court proceedings are on foot and such information would be highly likely to be prejudicial to our position. Aussie Home Loan Acquisition On 4 August 2017, John Symond exercised his put option, which will require the Group to acquire a 20% interest in AHL. The purchase price for the remaining 20% interest will be determined in accordance with the terms agreed in 2012. The purchase consideration will be paid in the issue of CBA shares. The Group will consolidate AHL from completion of the acquisition which is currently expected to be in late August 2017. Strategic Corporate ActionsWe are committed to securing and enhancing the financial wellbeing of people, businesses and communities, and the provision of insurance products to our customers remains core to that vision. CommInsure and Sovereign are strong businesses with scale, expertise, competitive products and access to attractive distribution channels. We are in discussions with third parties in relation to their potential interest in our life insurance businesses in Australia and New Zealand. The outcome of those discussions is uncertain. While the discussions may lead to the divestment of those businesses, we will also consider a full range of alternatives, including retaining the businesses, reinsurance arrangements or other strategic options.The Directors are not aware of any other matter or circumstance that has occurred since the end of the financial year that has significantly affected or may significantly affect the operations of the Group, the results of those operations or the state of affairs of the Group in subsequent financial years. Environmental ReportingWe are subject to the Federal Government’s National Greenhouse and Energy Reporting (NGER) scheme. The scheme makes it mandatory for controlling corporations to report annually on greenhouse gas emissions, energy production and energy consumption, if they exceed certain threshold levels. The Group has a long history in voluntary environmental reporting, including Corporate Responsibility Reporting and CDP (formerly the Carbon Disclosure Project). As a result, the Group is well placed to meet the NGER requirements.We are not subject to any other significant environmental reporting regulation under any law of the Commonwealth or of a State or Territory. The Environment Policy is updated to ensure risks are managed appropriately. Directors The names of the Directors holding office at any time during or since the end of the financial year are:
• Catherine Livingstone AO (appointed Chairman 1 January 2017)• Ian Narev• Shirish Apte• Sir David Higgins• Launa Inman• Brian Long• Andrew Mohl• Mary Padbury• Wendy Stops• Harrison Young• Sir John Anderson KBE (retired 9 November 2016)• David Turner (retired 31 December 2016)
Details of current Directors, their experience, qualifications, and any special responsibilities, including Committee memberships are set out on pages 2 and 3.
6
Ou
r b
usin
essP
erform
ance
overview
C
orp
orate
respo
nsib
ility C
orp
orate
go
vernan
ceD
irectors’
repo
rtO
ther
info
rmatio
nC
om
mo
nw
ea
lth Ba
nk o
f Au
stralia
An
nu
al Rep
ort 2017
Fin
ancial
repo
rt
6
2
1
3
4
5
7
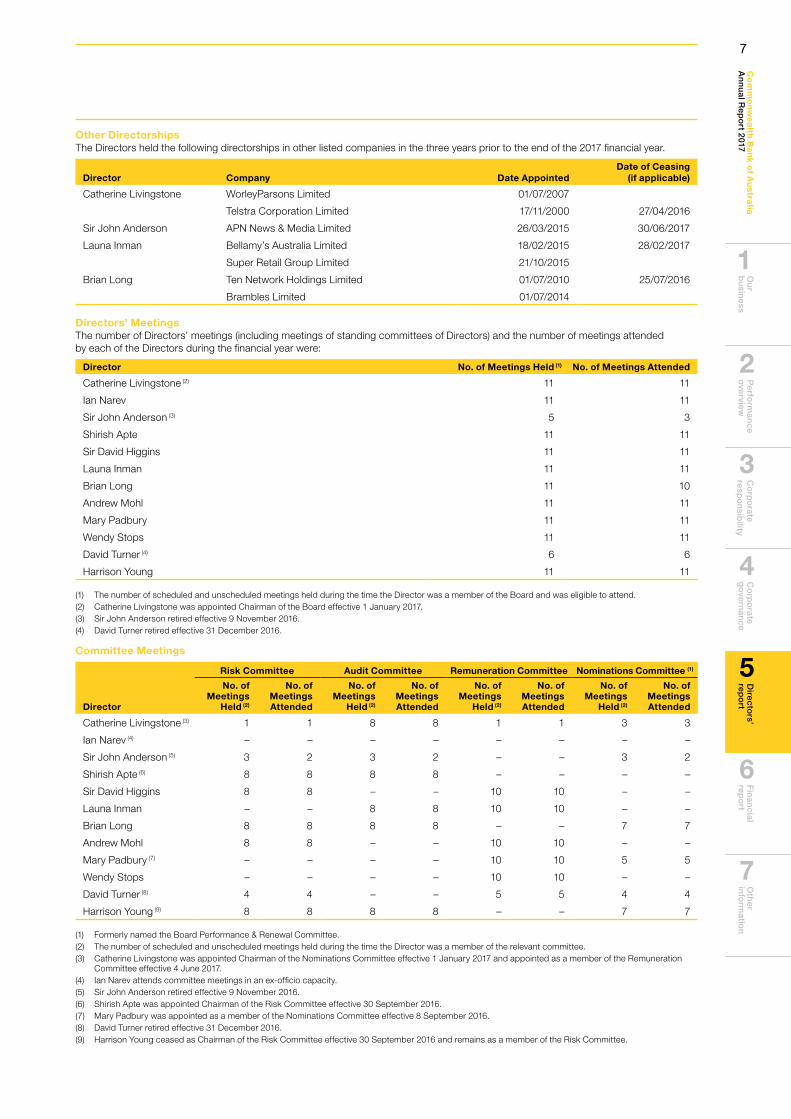
Other DirectorshipsThe Directors held the following directorships in other listed companies in the three years prior to the end of the 2017 financial year.
Director Company Date AppointedDate of Ceasing
(if applicable)
Catherine Livingstone WorleyParsons Limited 01/07/2007
Telstra Corporation Limited 17/11/2000 27/04/2016
Sir John Anderson APN News & Media Limited 26/03/2015 30/06/2017
Launa Inman Bellamy’s Australia Limited 18/02/2015 28/02/2017
Super Retail Group Limited 21/10/2015
Brian Long Ten Network Holdings Limited 01/07/2010 25/07/2016
Brambles Limited 01/07/2014
Directors’ MeetingsThe number of Directors’ meetings (including meetings of standing committees of Directors) and the number of meetings attended by each of the Directors during the financial year were:
Director No. of Meetings Held (1) No. of Meetings Attended
Catherine Livingstone (2) 11 11
Ian Narev 11 11
Sir John Anderson (3) 5 3
Shirish Apte 11 11
Sir David Higgins 11 11
Launa Inman 11 11
Brian Long 11 10
Andrew Mohl 11 11
Mary Padbury 11 11
Wendy Stops 11 11
David Turner (4) 6 6
Harrison Young 11 11
(1) The number of scheduled and unscheduled meetings held during the time the Director was a member of the Board and was eligible to attend.(2) Catherine Livingstone was appointed Chairman of the Board effective 1 January 2017.(3) Sir John Anderson retired effective 9 November 2016.(4) David Turner retired effective 31 December 2016.
Committee Meetings
Risk Committee Audit Committee Remuneration Committee Nominations Committee (1)
Director
No. of Meetings
Held (2)
No. of Meetings Attended
No. of Meetings
Held (2)
No. of Meetings Attended
No. of Meetings
Held (2)
No. of Meetings Attended
No. of Meetings
Held (2)
No. of Meetings Attended
Catherine Livingstone (3) 1 1 8 8 1 1 3 3
Ian Narev (4) – – – – – – – –
Sir John Anderson (5) 3 2 3 2 – – 3 2
Shirish Apte (6) 8 8 8 8 – – – –
Sir David Higgins 8 8 – – 10 10 – –
Launa Inman – – 8 8 10 10 – –
Brian Long 8 8 8 8 – – 7 7
Andrew Mohl 8 8 – – 10 10 – –
Mary Padbury (7) – – – – 10 10 5 5
Wendy Stops – – – – 10 10 – –
David Turner (8) 4 4 – – 5 5 4 4
Harrison Young (9) 8 8 8 8 – – 7 7
(1) Formerly named the Board Performance & Renewal Committee.(2) The number of scheduled and unscheduled meetings held during the time the Director was a member of the relevant committee.(3) Catherine Livingstone was appointed Chairman of the Nominations Committee effective 1 January 2017 and appointed as a member of the Remuneration
Committee effective 4 June 2017.(4) Ian Narev attends committee meetings in an ex-officio capacity. (5) Sir John Anderson retired effective 9 November 2016.(6) Shirish Apte was appointed Chairman of the Risk Committee effective 30 September 2016.(7) Mary Padbury was appointed as a member of the Nominations Committee effective 8 September 2016.(8) David Turner retired effective 31 December 2016.(9) Harrison Young ceased as Chairman of the Risk Committee effective 30 September 2016 and remains as a member of the Risk Committee.
7
Directors’ report continued
Directors’ Shareholdings and OptionsParticulars of shares held by Directors and the Chief Executive Officer in the Bank or in a related body corporate are set out in the Remuneration Report that forms part of this report.
No options have been granted to the Directors or Chief Executive Officer during the period.
Options and Share Rights OutstandingAs at the date of this report there are no employee options and 3,300,826 share rights outstanding in relation to Bank ordinary shares.
Directors’ Interests in ContractsA number of Directors have given written notices, stating that they hold office in specified companies and accordingly are to be regarded as having an interest in any contract or proposed contract that may be made between the Bank and any of those companies.
Directors’ and Officers’ IndemnityThe Directors, as named on page 6 of this report, and the Company Secretaries of the Bank, referred to below, are indemnified under the Constitution of Commonwealth Bank of Australia (the Constitution), as are all senior managers of the Bank.
The indemnity extends to such other officers, employees, former officers or former employees of the Bank, or of its related bodies corporate, as the Directors in each case determine (each, including the Directors and Company Secretaries, defined as an ‘Officer’ for the purposes of this section).
The Officers are indemnified on a full indemnity basis and to the full extent permitted by law against all losses, liabilities, costs, charges and expenses incurred by the Officer as an Officer of the Bank or of a related body corporate.
Deeds of Indemnity have been executed by the Bank, consistent with the Constitution, in favour of each Director of the Bank which includes indemnification in substantially the same terms to that provided in the Constitution.
An Indemnity Deed Poll has been executed by the Bank, consistent with the Constitution which also includes indemnification in substantially the same terms to that provided in the Constitution, in favour of each:
• company secretary and senior manager of the Bank;
• director, secretary or senior manager of a related bodycorporate of the Bank;
• person who, at the prior formal request of the Bank or a relatedbody corporate, acts as director, secretary or senior managerof a body corporate which is not a related body corporate ofthe Bank (in which case the indemnity operates only in excessof protection provided by that body corporate); and
• person who, at the request of a related body corporate of theBank, acts as a member of the compliance committee of aregistered scheme for which the related body corporate ofthe Bank is the responsible entity.
In the case of a partly-owned subsidiary of the Bank, where a director, company secretary or senior manager of that entity is a nominee of an entity which is not a related body corporate of the Bank, the Indemnity Deed Poll will not apply to that person unless the Bank’s CEO has certified that the indemnity will apply to that person.
Directors’ and Officers’ InsuranceThe Bank has, during the financial year, paid an insurance premium in respect of an insurance policy for the benefit of the Bank and those named and referred to above including the directors, company secretaries, officers and certain employees of the Bank and related bodies corporate as defined in the insurance policy. The insurance is appropriate pursuant to section 199B of the Corporations Act 2001. In accordance with commercial practice, the insurance policy prohibits disclosure of the terms of the policy, including the nature of the liability insured against and the amount of the premium.
Proceedings on behalf of the BankNo application has been made under section 237 of the Corporations Act 2001 in respect of the Bank, and there are no proceedings that a person has brought or intervened in on behalf of the Bank under that section.
Rounding and Presentation of Amounts Unless otherwise indicated, the Bank has rounded off amounts in this Directors’ Report and the accompanying financial statements to the nearest million dollars in accordance with ASIC Corporations Instrument 2016/191.
The financial information included in this Annual Report has been prepared and presented in accordance with Australian Accounting Standards, unless otherwise indicated. This ensures compliance with International Financial Reporting Standards.
The Group manages its business performance using a “cash basis” profit measure. The key items that are excluded from statutory profit for this purpose are non-recurring or not considered representative of the Group’s ongoing financial performance. Profit on an “underlying basis” is used primarily in the Wealth Management businesses. It provides a profit measure that excludes both the volatility of equity markets on shareholder funds and the mark to market revaluations on the Guaranteed Annuity portfolio for a measure of core operating performance.
Company SecretariesDetails of the Bank’s Company Secretaries, including their experience and qualifications, are set out below.
Taryn Morton was appointed Group Company Secretary of the Bank in October 2015. She has over 18 years of combined corporate governance, company secretarial and legal experience. Prior to the Bank, she was with Insurance Australia Group and before that held the role of Company Secretary of Qantas Airways, where she was also a director of Qantas subsidiaries. Her earlier governance roles were at Babcock & Brown, Ten Network Holdings and Ashurst. She holds Bachelor degrees in Arts and Law and is a Fellow of the Governance Institute of Australia.
Clare McManus was appointed a Company Secretary of the Bank in February 2017. She was previously the Deputy Company Secretary and Corporate Counsel at WorleyParsons and prior to that an Associate Director of Macquarie Group and a Senior Associate at Minter Ellison. She holds a Bachelor of Laws (Hons), Bachelor of Commerce, Diploma of Modern Languages (Mandarin) and Graduate Diploma in Applied Corporate Governance.
Carla Collingwood was a Company Secretary of the Bank from July 2005 until January 2017. From 1994 until 2005, she was a solicitor with the Bank’s Legal Services, before being appointed to the position of General Manager, Secretariat. She holds a Bachelor of Laws degree (Hons) and a Graduate Diploma in Applied Corporate Governance from the Governance Institute of Australia. She is a Graduate of the Australian Institute of Company Directors.
8
Ou
r b
usin
essP
erform
ance
overview
C
orp
orate
respo
nsib
ility C
orp
orate
go
vernan
ceD
irectors’
repo
rtO
ther
info
rmatio
nC
om
mo
nw
ea
lth Ba
nk o
f Au
stralia
An
nu
al Rep
ort 2017
Fin
ancial
repo
rt
6
2
1
3
4
5
7
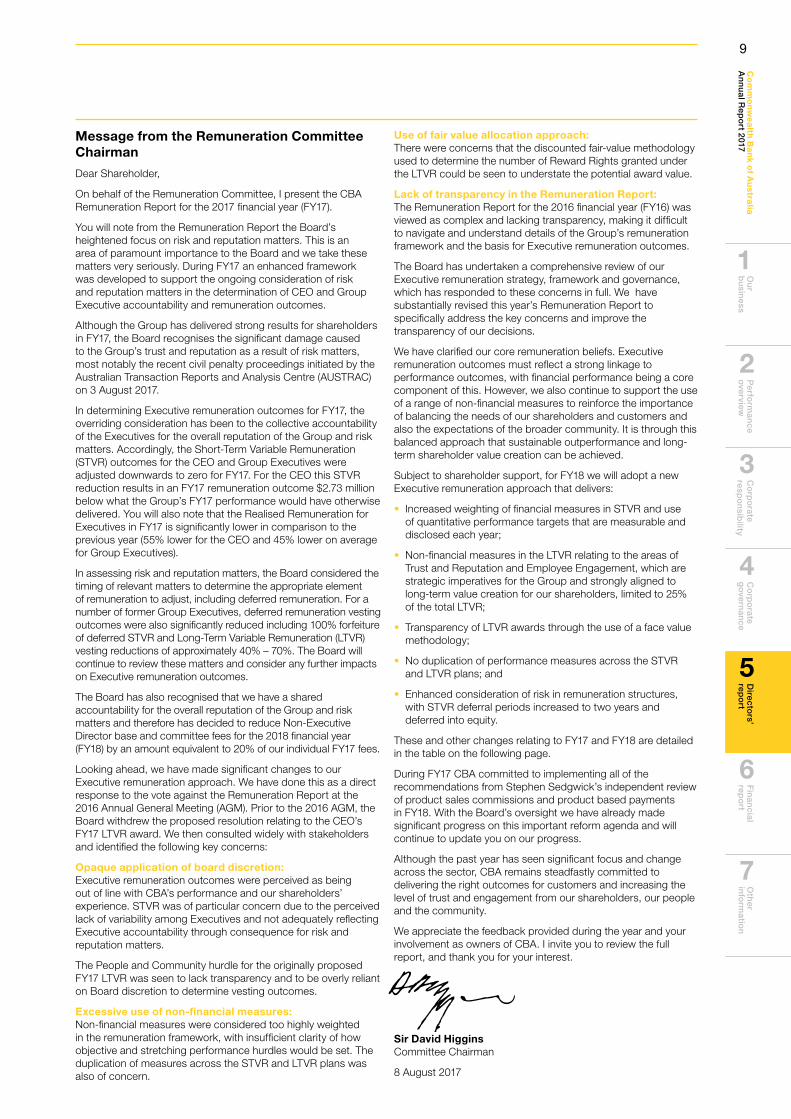
Message from the Remuneration Committee Chairman
Dear Shareholder,
On behalf of the Remuneration Committee, I present the CBA Remuneration Report for the 2017 financial year (FY17).
You will note from the Remuneration Report the Board’s heightened focus on risk and reputation matters. This is an area of paramount importance to the Board and we take these matters very seriously. During FY17 an enhanced framework was developed to support the ongoing consideration of risk and reputation matters in the determination of CEO and Group Executive accountability and remuneration outcomes.
Although the Group has delivered strong results for shareholders in FY17, the Board recognises the significant damage caused to the Group’s trust and reputation as a result of risk matters, most notably the recent civil penalty proceedings initiated by the Australian Transaction Reports and Analysis Centre (AUSTRAC) on 3 August 2017.
In determining Executive remuneration outcomes for FY17, the overriding consideration has been to the collective accountability of the Executives for the overall reputation of the Group and risk matters. Accordingly, the Short-Term Variable Remuneration (STVR) outcomes for the CEO and Group Executives were adjusted downwards to zero for FY17. For the CEO this STVR reduction results in an FY17 remuneration outcome $2.73 million below what the Group’s FY17 performance would have otherwise delivered. You will also note that the Realised Remuneration for Executives in FY17 is significantly lower in comparison to the previous year (55% lower for the CEO and 45% lower on average for Group Executives).
In assessing risk and reputation matters, the Board considered the timing of relevant matters to determine the appropriate element of remuneration to adjust, including deferred remuneration. For a number of former Group Executives, deferred remuneration vesting outcomes were also significantly reduced including 100% forfeiture of deferred STVR and Long-Term Variable Remuneration (LTVR) vesting reductions of approximately 40% – 70%. The Board will continue to review these matters and consider any further impacts on Executive remuneration outcomes.
The Board has also recognised that we have a shared accountability for the overall reputation of the Group and risk matters and therefore has decided to reduce Non-Executive Director base and committee fees for the 2018 financial year (FY18) by an amount equivalent to 20% of our individual FY17 fees.
Looking ahead, we have made significant changes to our Executive remuneration approach. We have done this as a direct response to the vote against the Remuneration Report at the 2016 Annual General Meeting (AGM). Prior to the 2016 AGM, the Board withdrew the proposed resolution relating to the CEO’s FY17 LTVR award. We then consulted widely with stakeholders and identified the following key concerns:
Opaque application of board discretion:Executive remuneration outcomes were perceived as being out of line with CBA’s performance and our shareholders’ experience. STVR was of particular concern due to the perceived lack of variability among Executives and not adequately reflecting Executive accountability through consequence for risk and reputation matters.
The People and Community hurdle for the originally proposed FY17 LTVR was seen to lack transparency and to be overly reliant on Board discretion to determine vesting outcomes.
Excessive use of non-financial measures:Non-financial measures were considered too highly weighted in the remuneration framework, with insufficient clarity of how objective and stretching performance hurdles would be set. The duplication of measures across the STVR and LTVR plans was also of concern.
Use of fair value allocation approach:There were concerns that the discounted fair-value methodology used to determine the number of Reward Rights granted under the LTVR could be seen to understate the potential award value.
Lack of transparency in the Remuneration Report:The Remuneration Report for the 2016 financial year (FY16) was viewed as complex and lacking transparency, making it difficult to navigate and understand details of the Group’s remuneration framework and the basis for Executive remuneration outcomes.
The Board has undertaken a comprehensive review of our Executive remuneration strategy, framework and governance, which has responded to these concerns in full. We have substantially revised this year’s Remuneration Report to specifically address the key concerns and improve the transparency of our decisions.
We have clarified our core remuneration beliefs. Executive remuneration outcomes must reflect a strong linkage to performance outcomes, with financial performance being a core component of this. However, we also continue to support the use of a range of non-financial measures to reinforce the importance of balancing the needs of our shareholders and customers and also the expectations of the broader community. It is through this balanced approach that sustainable outperformance and long- term shareholder value creation can be achieved.
Subject to shareholder support, for FY18 we will adopt a new Executive remuneration approach that delivers:
• Increased weighting of financial measures in STVR and useof quantitative performance targets that are measurable anddisclosed each year;
• Non-financial measures in the LTVR relating to the areas ofTrust and Reputation and Employee Engagement, which arestrategic imperatives for the Group and strongly aligned tolong-term value creation for our shareholders, limited to 25%of the total LTVR;
• Transparency of LTVR awards through the use of a face valuemethodology;
• No duplication of performance measures across the STVRand LTVR plans; and
• Enhanced consideration of risk in remuneration structures,with STVR deferral periods increased to two years anddeferred into equity.
These and other changes relating to FY17 and FY18 are detailed in the table on the following page.
During FY17 CBA committed to implementing all of the recommendations from Stephen Sedgwick’s independent review of product sales commissions and product based payments in FY18. With the Board’s oversight we have already made significant progress on this important reform agenda and will continue to update you on our progress.
Although the past year has seen significant focus and change across the sector, CBA remains steadfastly committed to delivering the right outcomes for customers and increasing the level of trust and engagement from our shareholders, our people and the community.
We appreciate the feedback provided during the year and your involvement as owners of CBA. I invite you to review the full report, and thank you for your interest.
Sir David Higgins Committee Chairman
8 August 2017
9
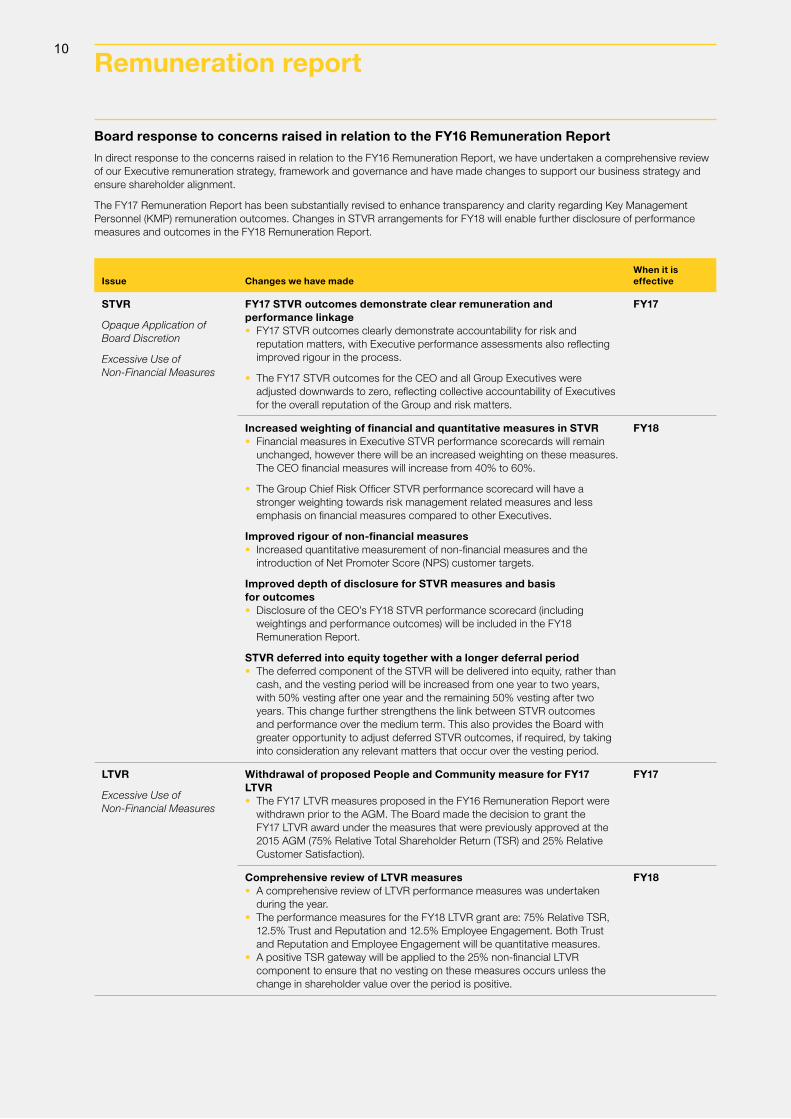
Board response to concerns raised in relation to the FY16 Remuneration Report
In direct response to the concerns raised in relation to the FY16 Remuneration Report, we have undertaken a comprehensive review of our Executive remuneration strategy, framework and governance and have made changes to support our business strategy and ensure shareholder alignment.
The FY17 Remuneration Report has been substantially revised to enhance transparency and clarity regarding Key Management Personnel (KMP) remuneration outcomes. Changes in STVR arrangements for FY18 will enable further disclosure of performance measures and outcomes in the FY18 Remuneration Report.
Issue Changes we have madeWhen it is effective
STVR
Opaque Application of Board Discretion
Excessive Use of Non-Financial Measures
FY17 STVR outcomes demonstrate clear remuneration and performance linkage• FY17 STVR outcomes clearly demonstrate accountability for risk and
reputation matters, with Executive performance assessments also reflectingimproved rigour in the process.
• The FY17 STVR outcomes for the CEO and all Group Executives wereadjusted downwards to zero, reflecting collective accountability of Executivesfor the overall reputation of the Group and risk matters.
FY17
Increased weighting of financial and quantitative measures in STVR• Financial measures in Executive STVR performance scorecards will remain
unchanged, however there will be an increased weighting on these measures.The CEO financial measures will increase from 40% to 60%.
• The Group Chief Risk Officer STVR performance scorecard will have astronger weighting towards risk management related measures and lessemphasis on financial measures compared to other Executives.
Improved rigour of non-financial measures• Increased quantitative measurement of non-financial measures and the
introduction of Net Promoter Score (NPS) customer targets.
Improved depth of disclosure for STVR measures and basis for outcomes• Disclosure of the CEO’s FY18 STVR performance scorecard (including
weightings and performance outcomes) will be included in the FY18Remuneration Report.
STVR deferred into equity together with a longer deferral period• The deferred component of the STVR will be delivered into equity, rather than
cash, and the vesting period will be increased from one year to two years,with 50% vesting after one year and the remaining 50% vesting after twoyears. This change further strengthens the link between STVR outcomesand performance over the medium term. This also provides the Board withgreater opportunity to adjust deferred STVR outcomes, if required, by takinginto consideration any relevant matters that occur over the vesting period.
FY18
LTVR
Excessive Use of Non-Financial Measures
Withdrawal of proposed People and Community measure for FY17 LTVR• The FY17 LTVR measures proposed in the FY16 Remuneration Report were
withdrawn prior to the AGM. The Board made the decision to grant theFY17 LTVR award under the measures that were previously approved at the2015 AGM (75% Relative Total Shareholder Return (TSR) and 25% RelativeCustomer Satisfaction).
FY17
Comprehensive review of LTVR measures• A comprehensive review of LTVR performance measures was undertaken
during the year.• The performance measures for the FY18 LTVR grant are: 75% Relative TSR,
12.5% Trust and Reputation and 12.5% Employee Engagement. Both Trustand Reputation and Employee Engagement will be quantitative measures.
• A positive TSR gateway will be applied to the 25% non-financial LTVRcomponent to ensure that no vesting on these measures occurs unless thechange in shareholder value over the period is positive.
FY18
Remuneration report10

Ou
r b
usin
essP
erform
ance
overview
C
orp
orate
respo
nsib
ility C
orp
orate
go
vernan
ceD
irectors’
repo
rtO
ther
info
rmatio
nC
om
mo
nw
ea
lth Ba
nk o
f Au
stralia
An
nu
al Rep
ort 2017
Fin
ancial
repo
rt
6
2
1
3
4
5
7
Issue Changes we have madeWhen it is effective
LTVR
Use of Fair Value Allocation Approach
Change from fair value to face value allocation methodology for LTVR• Face value rather than fair value will be used to determine the number of
Reward Rights granted under the FY18 LTVR. Details of the FY18 LTVR willbe disclosed in the 2017 Notice of Meeting and FY18 Remuneration Report.
• The maximum face value of FY18 LTVR awards is set at 180% of FixedRemuneration (FR) with no dividend equivalent payment. The overallmaximum value has decreased as previously the total face value of LTVRawards was approximately 200% of FR, inclusive of dividend equivalentpayments (three-year average).
• A face value approach provides greater simplicity and transparency forshareholders.
FY18
STVR and LTVR
Excessive Use of Non-Financial Measures
No duplication of performance measures between STVR and LTVR• The customer measure will no longer be duplicated in the STVR and LTVR
plans.
• Customer measures will only be included in the STVR with Customer NPSbeing adopted.
FY18
Remuneration Governance
Opaque Application of Board Discretion
Enhanced risk and remuneration governance• The Board has reviewed and strengthened its remuneration governance
procedures, including developing an enhanced framework for theconsideration of risk and reputational matters in the determination ofExecutive variable remuneration outcomes.
• The framework will provide the Board with increased transparency, rigour andconsistency when applying its discretion in assessing Executive outcomes.
FY17
This Remuneration Report details the performance and remuneration frameworks and outcomes for CBA and its KMP for FY17.
The report has been prepared and audited against the disclosure requirements of the Corporations Act 2001 (Cth) (‘Corporations Act’).
Contents
1. FY17 KMP 66
2. FY17 Summary 67
3. Executive Remuneration Framework 69
4. Linking Remuneration to Performance 71
5. Remuneration Governance 73
6. Executive Remuneration in Detail 73
7. Non-Executive Director Arrangements 78
8. Loans and Other Transactions 80
9. Key Terms 81
11
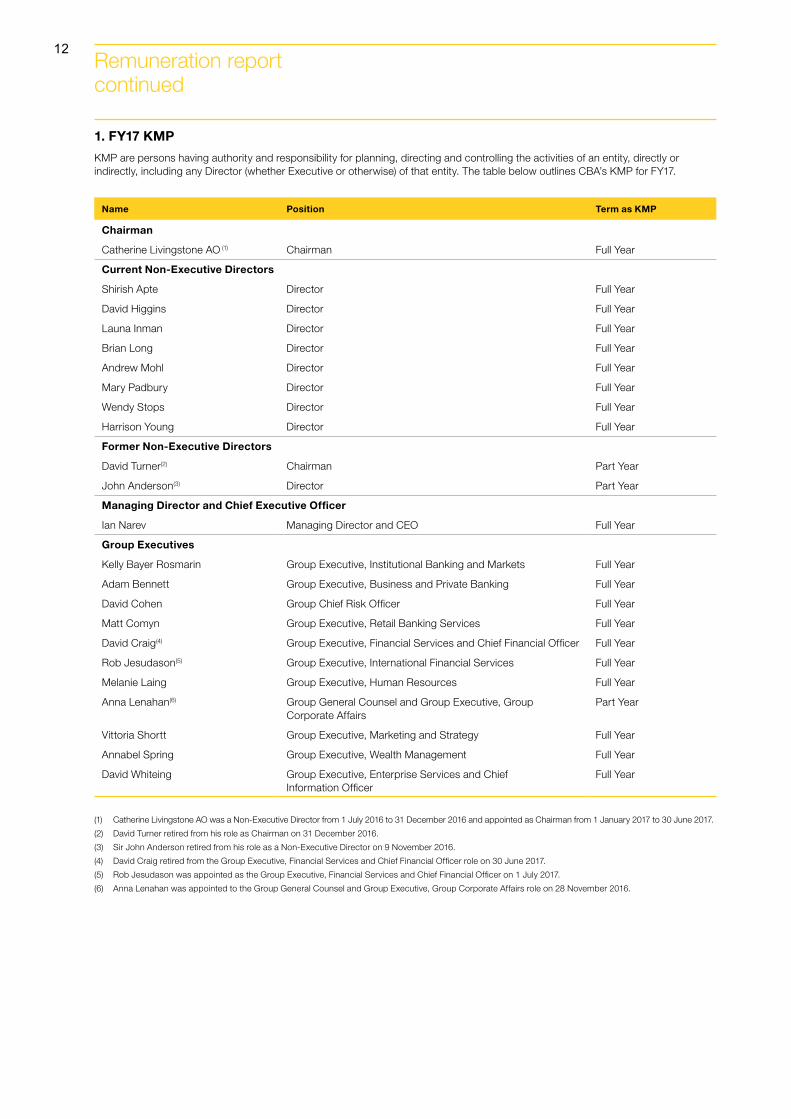
1. FY17 KMP
KMP are persons having authority and responsibility for planning, directing and controlling the activities of an entity, directly or indirectly, including any Director (whether Executive or otherwise) of that entity. The table below outlines CBA’s KMP for FY17.
Name Position Term as KMP
Chairman
Catherine Livingstone AO (1) Chairman Full Year
Current Non-Executive Directors
Shirish Apte Director Full Year
David Higgins Director Full Year
Launa Inman Director Full Year
Brian Long Director Full Year
Andrew Mohl Director Full Year
Mary Padbury Director Full Year
Wendy Stops Director Full Year
Harrison Young Director Full Year
Former Non-Executive Directors
David Turner(2) Chairman Part Year
John Anderson(3) Director Part Year
Managing Director and Chief Executive Officer
Ian Narev Managing Director and CEO Full Year
Group Executives
Kelly Bayer Rosmarin Group Executive, Institutional Banking and Markets Full Year
Adam Bennett Group Executive, Business and Private Banking Full Year
David Cohen Group Chief Risk Officer Full Year
Matt Comyn Group Executive, Retail Banking Services Full Year
David Craig(4) Group Executive, Financial Services and Chief Financial Officer Full Year
Rob Jesudason(5) Group Executive, International Financial Services Full Year
Melanie Laing Group Executive, Human Resources Full Year
Anna Lenahan(6) Group General Counsel and Group Executive, Group Corporate Affairs
Part Year
Vittoria Shortt Group Executive, Marketing and Strategy Full Year
Annabel Spring Group Executive, Wealth Management Full Year
David Whiteing Group Executive, Enterprise Services and Chief Information Officer
Full Year
(1) Catherine Livingstone AO was a Non-Executive Director from 1 July 2016 to 31 December 2016 and appointed as Chairman from 1 January 2017 to 30 June 2017.
(2) David Turner retired from his role as Chairman on 31 December 2016.
(3) Sir John Anderson retired from his role as a Non-Executive Director on 9 November 2016.
(4) David Craig retired from the Group Executive, Financial Services and Chief Financial Officer role on 30 June 2017.
(5) Rob Jesudason was appointed as the Group Executive, Financial Services and Chief Financial Officer on 1 July 2017.
(6) Anna Lenahan was appointed to the Group General Counsel and Group Executive, Group Corporate Affairs role on 28 November 2016.
Remuneration report continued
12
Ou
r b
usin
essP
erform
ance
overview
C
orp
orate
respo
nsib
ility C
orp
orate
go
vernan
ceD
irectors’
repo
rtO
ther
info
rmatio
nC
om
mo
nw
ea
lth Ba
nk o
f Au
stralia
An
nu
al Rep
ort 2017
Fin
ancial
repo
rt
6
2
1
3
4
5
7
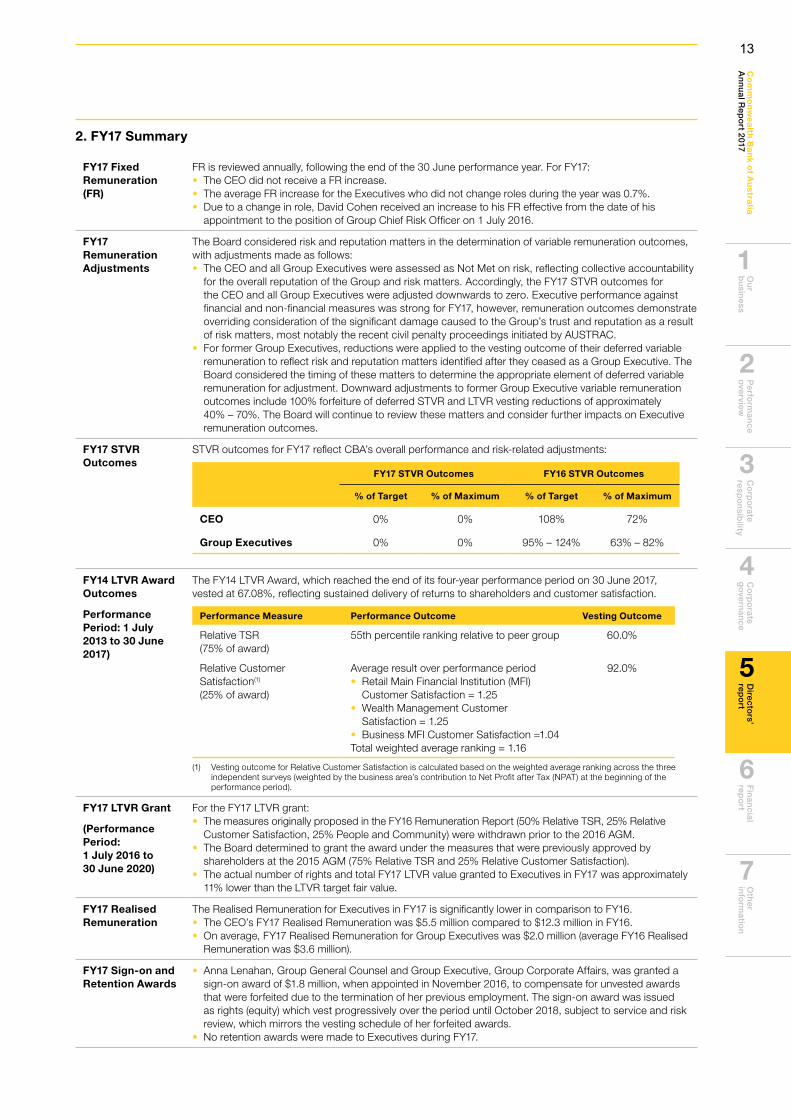
2. FY17 Summary
FY17 Fixed Remuneration (FR)
FR is reviewed annually, following the end of the 30 June performance year. For FY17:• The CEO did not receive a FR increase.• The average FR increase for the Executives who did not change roles during the year was 0.7%.• Due to a change in role, David Cohen received an increase to his FR effective from the date of his
appointment to the position of Group Chief Risk Officer on 1 July 2016.
FY17 Remuneration Adjustments
The Board considered risk and reputation matters in the determination of variable remuneration outcomes, with adjustments made as follows:• The CEO and all Group Executives were assessed as Not Met on risk, reflecting collective accountability
for the overall reputation of the Group and risk matters. Accordingly, the FY17 STVR outcomes forthe CEO and all Group Executives were adjusted downwards to zero. Executive performance againstfinancial and non-financial measures was strong for FY17, however, remuneration outcomes demonstrateoverriding consideration of the significant damage caused to the Group’s trust and reputation as a resultof risk matters, most notably the recent civil penalty proceedings initiated by AUSTRAC.
• For former Group Executives, reductions were applied to the vesting outcome of their deferred variableremuneration to reflect risk and reputation matters identified after they ceased as a Group Executive. TheBoard considered the timing of these matters to determine the appropriate element of deferred variableremuneration for adjustment. Downward adjustments to former Group Executive variable remunerationoutcomes include 100% forfeiture of deferred STVR and LTVR vesting reductions of approximately40% – 70%. The Board will continue to review these matters and consider further impacts on Executiveremuneration outcomes.
FY17 STVR Outcomes
STVR outcomes for FY17 reflect CBA’s overall performance and risk-related adjustments:
FY17 STVR Outcomes FY16 STVR Outcomes
% of Target % of Maximum % of Target % of Maximum
CEO 0% 0% 108% 72%
Group Executives 0% 0% 95% – 124% 63% – 82%
FY14 LTVR Award Outcomes
Performance Period: 1 July 2013 to 30 June 2017)
The FY14 LTVR Award, which reached the end of its four-year performance period on 30 June 2017, vested at 67.08%, reflecting sustained delivery of returns to shareholders and customer satisfaction.
Performance Measure Performance Outcome Vesting Outcome
Relative TSR (75% of award)
55th percentile ranking relative to peer group 60.0%
Relative Customer Satisfaction(1) (25% of award)
Average result over performance period• Retail Main Financial Institution (MFI)
Customer Satisfaction = 1.25• Wealth Management Customer
Satisfaction = 1.25• Business MFI Customer Satisfaction =1.04Total weighted average ranking = 1.16
92.0%
(1) Vesting outcome for Relative Customer Satisfaction is calculated based on the weighted average ranking across the three independent surveys (weighted by the business area’s contribution to Net Profit after Tax (NPAT) at the beginning of the performance period).
FY17 LTVR Grant
(Performance Period: 1 July 2016 to 30 June 2020)
For the FY17 LTVR grant:• The measures originally proposed in the FY16 Remuneration Report (50% Relative TSR, 25% Relative
Customer Satisfaction, 25% People and Community) were withdrawn prior to the 2016 AGM.• The Board determined to grant the award under the measures that were previously approved by
shareholders at the 2015 AGM (75% Relative TSR and 25% Relative Customer Satisfaction).• The actual number of rights and total FY17 LTVR value granted to Executives in FY17 was approximately
11% lower than the LTVR target fair value.
FY17 Realised Remuneration
The Realised Remuneration for Executives in FY17 is significantly lower in comparison to FY16.• The CEO’s FY17 Realised Remuneration was $5.5 million compared to $12.3 million in FY16.• On average, FY17 Realised Remuneration for Group Executives was $2.0 million (average FY16 Realised
Remuneration was $3.6 million).
FY17 Sign-on and Retention Awards
• Anna Lenahan, Group General Counsel and Group Executive, Group Corporate Affairs, was granted asign-on award of $1.8 million, when appointed in November 2016, to compensate for unvested awardsthat were forfeited due to the termination of her previous employment. The sign-on award was issuedas rights (equity) which vest progressively over the period until October 2018, subject to service and riskreview, which mirrors the vesting schedule of her forfeited awards.
• No retention awards were made to Executives during FY17.
13
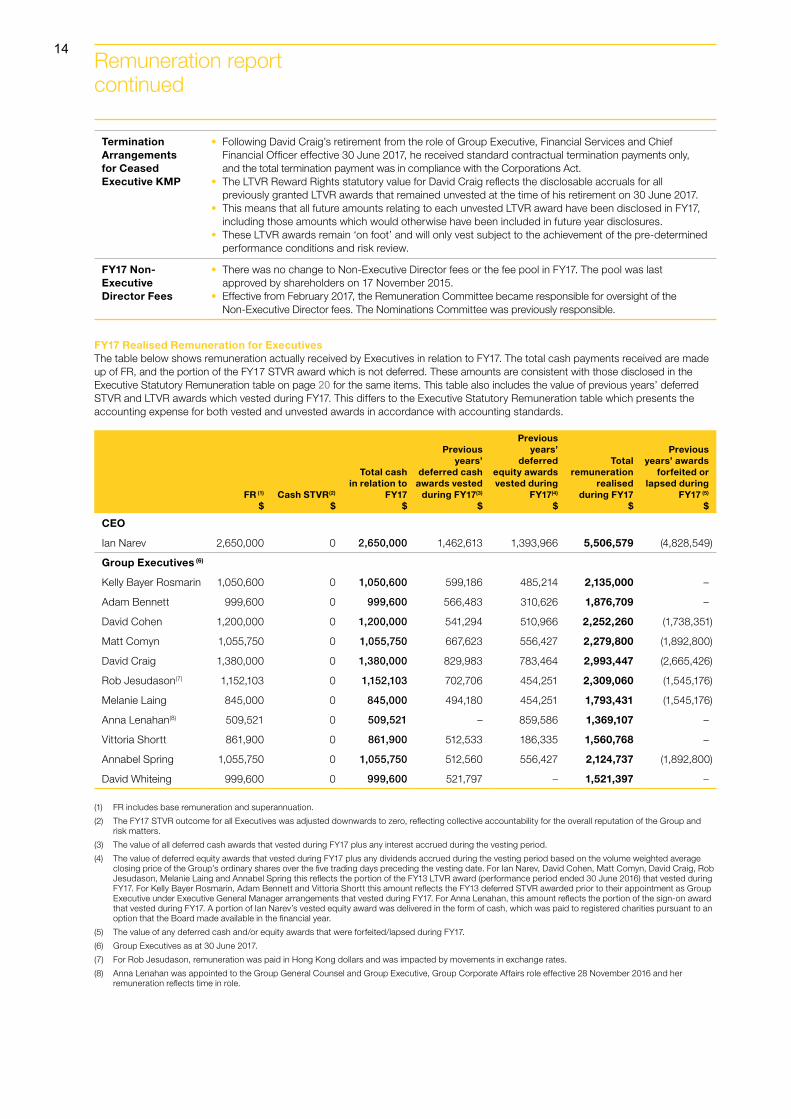
Termination Arrangements for Ceased Executive KMP
• Following David Craig’s retirement from the role of Group Executive, Financial Services and ChiefFinancial Officer effective 30 June 2017, he received standard contractual termination payments only,and the total termination payment was in compliance with the Corporations Act.
• The LTVR Reward Rights statutory value for David Craig reflects the disclosable accruals for allpreviously granted LTVR awards that remained unvested at the time of his retirement on 30 June 2017.
• This means that all future amounts relating to each unvested LTVR award have been disclosed in FY17,including those amounts which would otherwise have been included in future year disclosures.
• These LTVR awards remain ‘on foot’ and will only vest subject to the achievement of the pre-determinedperformance conditions and risk review.
FY17 Non-Executive Director Fees
• There was no change to Non-Executive Director fees or the fee pool in FY17. The pool was lastapproved by shareholders on 17 November 2015.
• Effective from February 2017, the Remuneration Committee became responsible for oversight of theNon-Executive Director fees. The Nominations Committee was previously responsible.
FY17 Realised Remuneration for ExecutivesThe table below shows remuneration actually received by Executives in relation to FY17. The total cash payments received are made up of FR, and the portion of the FY17 STVR award which is not deferred. These amounts are consistent with those disclosed in the Executive Statutory Remuneration table on page 20 for the same items. This table also includes the value of previous years’ deferred STVR and LTVR awards which vested during FY17. This differs to the Executive Statutory Remuneration table which presents the accounting expense for both vested and unvested awards in accordance with accounting standards.
FR (1) $
Cash STVR(2) $
Total cash in relation to
FY17 $
Previous years’
deferred cash awards vested
during FY17(3) $
Previous years’
deferred equity awards vested during
FY17(4) $
Total remuneration
realised during FY17
$
Previous years’ awards
forfeited or lapsed during
FY17 (5) $
CEO
Ian Narev 2,650,000 0 2,650,000 1,462,613 1,393,966 5,506,579 (4,828,549)
Group Executives (6)
Kelly Bayer Rosmarin 1,050,600 0 1,050,600 599,186 485,214 2,135,000 –
Adam Bennett 999,600 0 999,600 566,483 310,626 1,876,709 –
David Cohen 1,200,000 0 1,200,000 541,294 510,966 2,252,260 (1,738,351)
Matt Comyn 1,055,750 0 1,055,750 667,623 556,427 2,279,800 (1,892,800)
David Craig 1,380,000 0 1,380,000 829,983 783,464 2,993,447 (2,665,426)
Rob Jesudason(7) 1,152,103 0 1,152,103 702,706 454,251 2,309,060 (1,545,176)
Melanie Laing 845,000 0 845,000 494,180 454,251 1,793,431 (1,545,176)
Anna Lenahan(8) 509,521 0 509,521 – 859,586 1,369,107 –
Vittoria Shortt 861,900 0 861,900 512,533 186,335 1,560,768 –
Annabel Spring 1,055,750 0 1,055,750 512,560 556,427 2,124,737 (1,892,800)
David Whiteing 999,600 0 999,600 521,797 – 1,521,397 –
(1) FR includes base remuneration and superannuation.
(2) The FY17 STVR outcome for all Executives was adjusted downwards to zero, reflecting collective accountability for the overall reputation of the Group and risk matters.
(3) The value of all deferred cash awards that vested during FY17 plus any interest accrued during the vesting period.
(4) The value of deferred equity awards that vested during FY17 plus any dividends accrued during the vesting period based on the volume weighted average closing price of the Group’s ordinary shares over the five trading days preceding the vesting date. For Ian Narev, David Cohen, Matt Comyn, David Craig, Rob Jesudason, Melanie Laing and Annabel Spring this reflects the portion of the FY13 LTVR award (performance period ended 30 June 2016) that vested during FY17. For Kelly Bayer Rosmarin, Adam Bennett and Vittoria Shortt this amount reflects the FY13 deferred STVR awarded prior to their appointment as Group Executive under Executive General Manager arrangements that vested during FY17. For Anna Lenahan, this amount reflects the portion of the sign-on award that vested during FY17. A portion of Ian Narev’s vested equity award was delivered in the form of cash, which was paid to registered charities pursuant to an option that the Board made available in the financial year.
(5) The value of any deferred cash and/or equity awards that were forfeited/lapsed during FY17.
(6) Group Executives as at 30 June 2017.
(7) For Rob Jesudason, remuneration was paid in Hong Kong dollars and was impacted by movements in exchange rates.
(8) Anna Lenahan was appointed to the Group General Counsel and Group Executive, Group Corporate Affairs role effective 28 November 2016 and her remuneration reflects time in role.
Remuneration report continued
14
Ou
r b
usin
essP
erform
ance
overview
C
orp
orate
respo
nsib
ility C
orp
orate
go
vernan
ceD
irectors’
repo
rtO
ther
info
rmatio
nC
om
mo
nw
ea
lth Ba
nk o
f Au
stralia
An
nu
al Rep
ort 2017
Fin
ancial
repo
rt
6
2
1
3
4
5
7
3. Executive Remuneration Framework
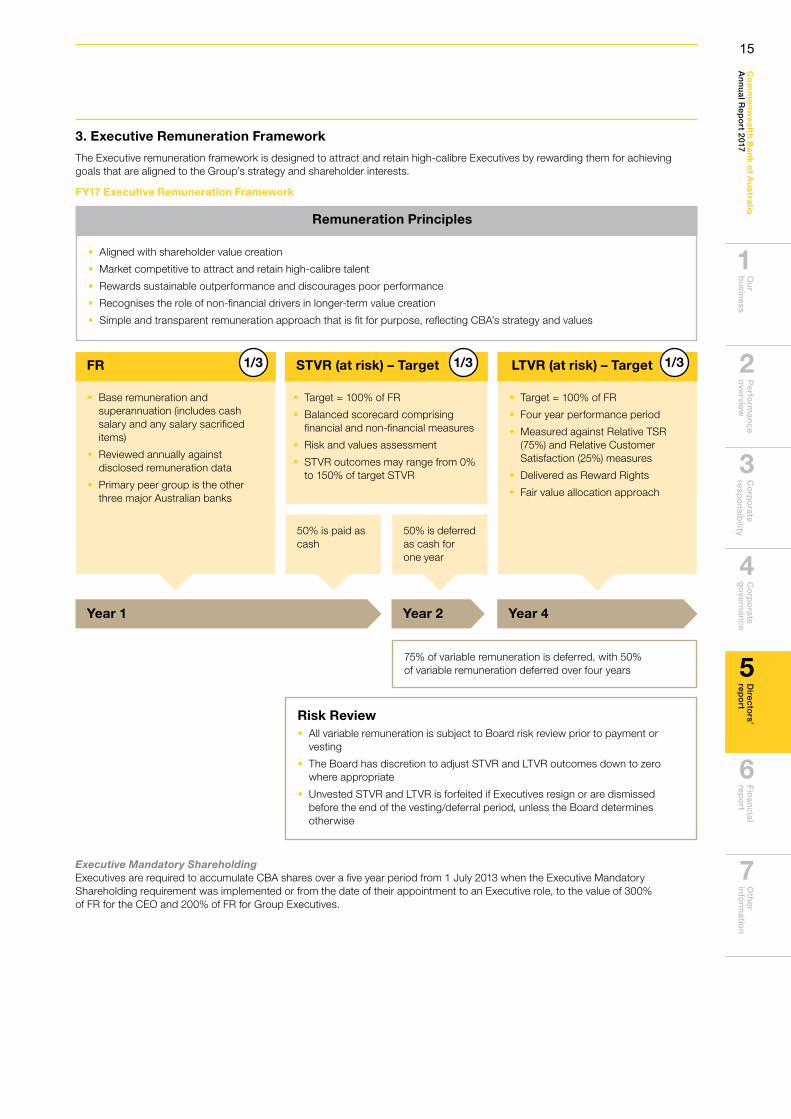
The Executive remuneration framework is designed to attract and retain high-calibre Executives by rewarding them for achieving goals that are aligned to the Group’s strategy and shareholder interests.
FY17 Executive Remuneration Framework
Executive Mandatory ShareholdingExecutives are required to accumulate CBA shares over a five year period from 1 July 2013 when the Executive Mandatory Shareholding requirement was implemented or from the date of their appointment to an Executive role, to the value of 300% of FR for the CEO and 200% of FR for Group Executives.
• Base remuneration andsuperannuation (includes cashsalary and any salary sacrificeditems)
• Reviewed annually againstdisclosed remuneration data
• Primary peer group is the otherthree major Australian banks
• Target = 100% of FR
• Four year performance period
• Measured against Relative TSR(75%) and Relative CustomerSatisfaction (25%) measures
• Delivered as Reward Rights
• Fair value allocation approach
• Target = 100% of FR
• Balanced scorecard comprisingfinancial and non-financial measures
• Risk and values assessment
• STVR outcomes may range from 0%to 150% of target STVR
• Aligned with shareholder value creation
• Market competitive to attract and retain high-calibre talent
• Rewards sustainable outperformance and discourages poor performance
• Recognises the role of non-financial drivers in longer-term value creation
• Simple and transparent remuneration approach that is fit for purpose, reflecting CBA’s strategy and values
50% is paid as cash
50% is deferred as cash for one year
75% of variable remuneration is deferred, with 50% of variable remuneration deferred over four years
Risk Review• All variable remuneration is subject to Board risk review prior to payment or
vesting
• The Board has discretion to adjust STVR and LTVR outcomes down to zerowhere appropriate
• Unvested STVR and LTVR is forfeited if Executives resign or are dismissedbefore the end of the vesting/deferral period, unless the Board determinesotherwise
STVR (at risk) – Target LTVR (at risk) – TargetFR
Year 1 Year 2 Year 4
Remuneration Principles
15
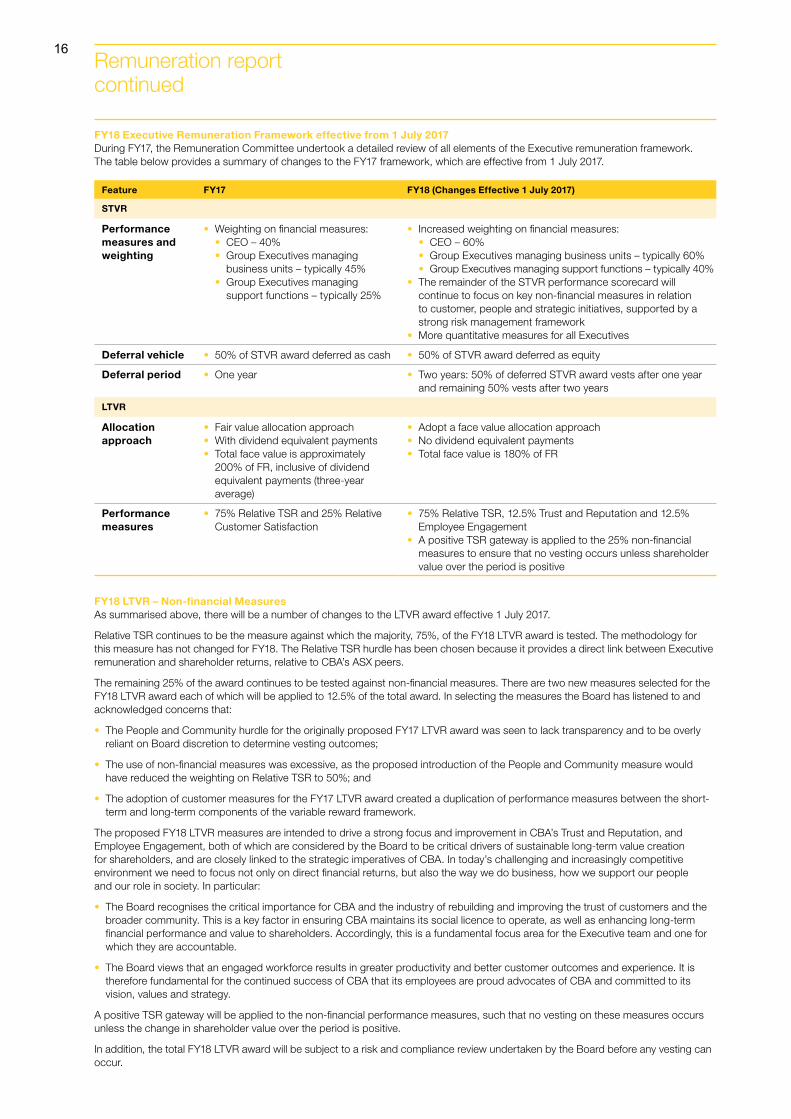
FY18 Executive Remuneration Framework effective from 1 July 2017During FY17, the Remuneration Committee undertook a detailed review of all elements of the Executive remuneration framework. The table below provides a summary of changes to the FY17 framework, which are effective from 1 July 2017.
Feature FY17 FY18 (Changes Effective 1 July 2017)
STVR
Performance measures and weighting
• Weighting on financial measures:• CEO – 40%• Group Executives managing
business units – typically 45%• Group Executives managing
support functions – typically 25%
• Increased weighting on financial measures:• CEO – 60%• Group Executives managing business units – typically 60%• Group Executives managing support functions – typically 40%
• The remainder of the STVR performance scorecard willcontinue to focus on key non-financial measures in relationto customer, people and strategic initiatives, supported by astrong risk management framework
• More quantitative measures for all Executives
Deferral vehicle • 50% of STVR award deferred as cash • 50% of STVR award deferred as equity
Deferral period • One year • Two years: 50% of deferred STVR award vests after one yearand remaining 50% vests after two years
LTVR
Allocation approach
• Fair value allocation approach• With dividend equivalent payments• Total face value is approximately
200% of FR, inclusive of dividendequivalent payments (three-yearaverage)
• Adopt a face value allocation approach• No dividend equivalent payments• Total face value is 180% of FR
Performance measures
• 75% Relative TSR and 25% RelativeCustomer Satisfaction
• 75% Relative TSR, 12.5% Trust and Reputation and 12.5%Employee Engagement
• A positive TSR gateway is applied to the 25% non-financialmeasures to ensure that no vesting occurs unless shareholdervalue over the period is positive
FY18 LTVR – Non-financial MeasuresAs summarised above, there will be a number of changes to the LTVR award effective 1 July 2017.
Relative TSR continues to be the measure against which the majority, 75%, of the FY18 LTVR award is tested. The methodology for this measure has not changed for FY18. The Relative TSR hurdle has been chosen because it provides a direct link between Executive remuneration and shareholder returns, relative to CBA’s ASX peers.
The remaining 25% of the award continues to be tested against non-financial measures. There are two new measures selected for the FY18 LTVR award each of which will be applied to 12.5% of the total award. In selecting the measures the Board has listened to and acknowledged concerns that:
• The People and Community hurdle for the originally proposed FY17 LTVR award was seen to lack transparency and to be overlyreliant on Board discretion to determine vesting outcomes;
• The use of non-financial measures was excessive, as the proposed introduction of the People and Community measure wouldhave reduced the weighting on Relative TSR to 50%; and
• The adoption of customer measures for the FY17 LTVR award created a duplication of performance measures between the short-term and long-term components of the variable reward framework.
The proposed FY18 LTVR measures are intended to drive a strong focus and improvement in CBA’s Trust and Reputation, and Employee Engagement, both of which are considered by the Board to be critical drivers of sustainable long-term value creation for shareholders, and are closely linked to the strategic imperatives of CBA. In today’s challenging and increasingly competitive environment we need to focus not only on direct financial returns, but also the way we do business, how we support our people and our role in society. In particular:
• The Board recognises the critical importance for CBA and the industry of rebuilding and improving the trust of customers and thebroader community. This is a key factor in ensuring CBA maintains its social licence to operate, as well as enhancing long-termfinancial performance and value to shareholders. Accordingly, this is a fundamental focus area for the Executive team and one forwhich they are accountable.
• The Board views that an engaged workforce results in greater productivity and better customer outcomes and experience. It istherefore fundamental for the continued success of CBA that its employees are proud advocates of CBA and committed to itsvision, values and strategy.
A positive TSR gateway will be applied to the non-financial performance measures, such that no vesting on these measures occurs unless the change in shareholder value over the period is positive.
In addition, the total FY18 LTVR award will be subject to a risk and compliance review undertaken by the Board before any vesting can occur.
Remuneration report continued
16

Ou
r b
usin
essP
erform
ance
overview
C
orp
orate
respo
nsib
ility C
orp
orate
go
vernan
ceD
irectors’
repo
rtO
ther
info
rmatio
nC
om
mo
nw
ea
lth Ba
nk o
f Au
stralia
An
nu
al Rep
ort 2017
Fin
ancial
repo
rt
6
2
1
3
4
5
7
4. Linking Remuneration to Performance
Variable remuneration is directly linked to both short-term and long-term performance goals.
Financial PerformanceThe below table illustrates CBA’s financial performance over the past five financial years (including FY17) and the link to Executive remuneration.
Financial Performance Measure Link to Executive Remuneration FY17 FY16 FY15 FY14 FY13
Group Cash NPAT ($M) (1) STVR scorecard measure 9,881 9,445 9,127 8,680 7,760
Group PACC ($M) (2) STVR scorecard measure 6,525 6,187 n/a n/a n/a
Share Price as at 30 June ($) LTVR Relative TSR measure 82.81 74.37 85.13 80.88 69.18
Dividends per Share ($) LTVR Relative TSR measure 4.29 4.20 4.20 4.01 3.64
TSR (four-year period) as at 30 June (%) LTVR Relative TSR measure 50.75 74.74 110.43 109.89 122.57
(1) Comparative information has been restated to reflect the change in accounting policy detailed in Note 1 to the Financial Statements. (2) Due to methodology changes comparatives for Group Profit after Capital Charge (PACC) have only been provided for FY16.
FY17 STVR Performance OutcomesOverall Group performance, together with an assessment of individual Executive performance through a balanced scorecard approach, determines the individual STVR outcomes of Executives. All Executives scorecards contain the same performance categories, with financial and non-financial measures aligned with business unit specific targets where appropriate. Weighting of financial and non-financial measures varies by role.
• The CEO had a 40% weighting on financial measures.
• Group Executives managing business units typically had a 45% weighting on financial measures.
• Group Executives managing support functions typically had a 25% weighting on financial measures.
Risk is an important factor in accounting for short-term performance. The Group uses PACC, a risk-adjusted measure, as a key measure of financial performance. PACC takes into account the profit achieved, and also reflects the risk to capital that was taken to achieve it. Moreover, in managing risk, Executives are required to comply with the Group and relevant Business Unit Risk Appetite Statements and provide exemplary leadership of a strong risk culture.
The following table provides the Board’s assessment of the CEO’s performance for FY17.
FY17 CEO Outcome
Performance Category Measures % of STVR Target % of STVR Maximum
Sound Risk ManagementGate opener/STVR adjustment
Exemplary leadership of risk culture The CEO was assessed as Not Met on risk reflecting consideration
of risk and reputation matters.
Shareholder (40%)
• Group Cash NPAT• Group Underlying PACC• Productivity
132% 88%
Customer (15%)
• Roy Morgan (6 month rolling average,four major banks)
• DBM Institutional: in the +$300mcategory or +$500m category
• DBM (whole of market)
100% 67%
Strategy (15%)
• Strategy development and execution 100% 67%
People and Community (30%)
• Reputation• Culture• Engagement• Safety
67% 44%
Overall STVR Outcome 103% 69%
Risk-Adjusted STVR Outcome 0% 0%
17
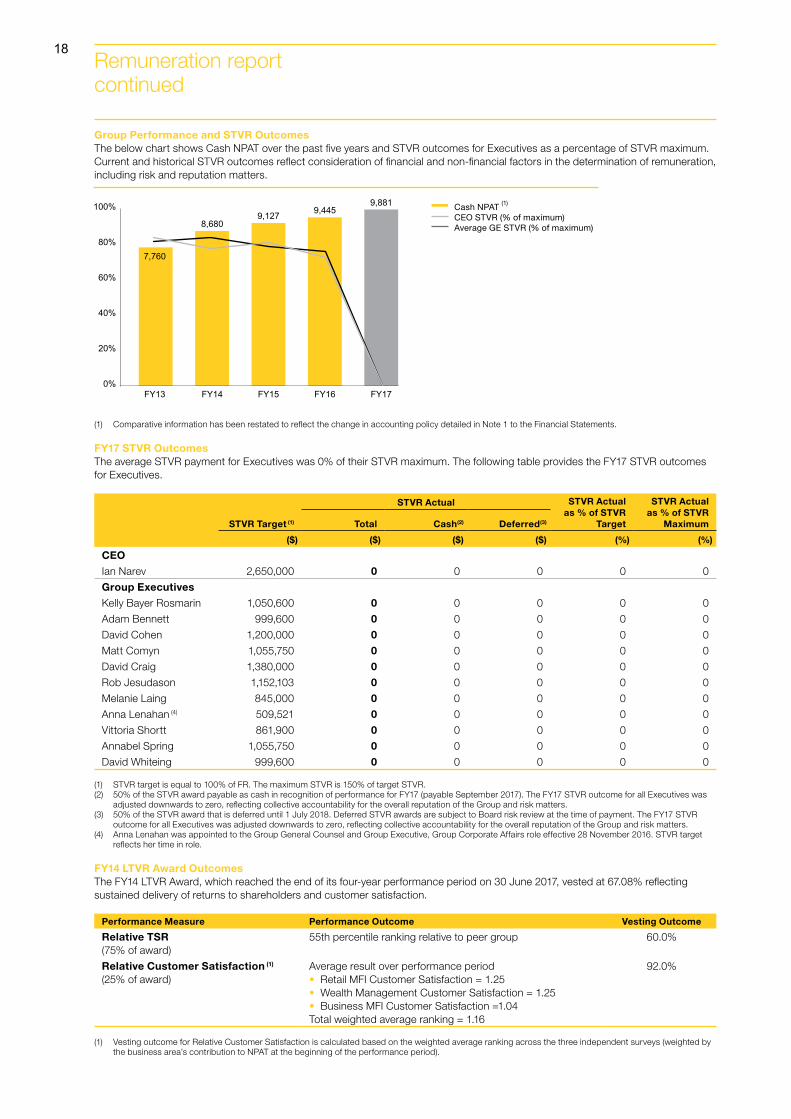
Group Performance and STVR OutcomesThe below chart shows Cash NPAT over the past five years and STVR outcomes for Executives as a percentage of STVR maximum. Current and historical STVR outcomes reflect consideration of financial and non-financial factors in the determination of remuneration, including risk and reputation matters.
(1) Comparative information has been restated to reflect the change in accounting policy detailed in Note 1 to the Financial Statements.
FY17 STVR OutcomesThe average STVR payment for Executives was 0% of their STVR maximum. The following table provides the FY17 STVR outcomes for Executives.
STVR Actual STVR Actual as % of STVR
Target
STVR Actual as % of STVR
MaximumSTVR Target (1) Total Cash(2) Deferred(3)
($) ($) ($) ($) (%) (%)
CEO
Ian Narev 2,650,000 0 0 0 0 0
Group Executives
Kelly Bayer Rosmarin 1,050,600 0 0 0 0 0
Adam Bennett 999,600 0 0 0 0 0
David Cohen 1,200,000 0 0 0 0 0
Matt Comyn 1,055,750 0 0 0 0 0
David Craig 1,380,000 0 0 0 0 0
Rob Jesudason 1,152,103 0 0 0 0 0
Melanie Laing 845,000 0 0 0 0 0
Anna Lenahan (4) 509,521 0 0 0 0 0
Vittoria Shortt 861,900 0 0 0 0 0
Annabel Spring 1,055,750 0 0 0 0 0
David Whiteing 999,600 0 0 0 0 0
(1) STVR target is equal to 100% of FR. The maximum STVR is 150% of target STVR. (2) 50% of the STVR award payable as cash in recognition of performance for FY17 (payable September 2017). The FY17 STVR outcome for all Executives was
adjusted downwards to zero, reflecting collective accountability for the overall reputation of the Group and risk matters.(3) 50% of the STVR award that is deferred until 1 July 2018. Deferred STVR awards are subject to Board risk review at the time of payment. The FY17 STVR
outcome for all Executives was adjusted downwards to zero, reflecting collective accountability for the overall reputation of the Group and risk matters.(4) Anna Lenahan was appointed to the Group General Counsel and Group Executive, Group Corporate Affairs role effective 28 November 2016. STVR target
reflects her time in role.
FY14 LTVR Award OutcomesThe FY14 LTVR Award, which reached the end of its four-year performance period on 30 June 2017, vested at 67.08% reflecting sustained delivery of returns to shareholders and customer satisfaction.
Performance Measure Performance Outcome Vesting Outcome
Relative TSR (75% of award)
55th percentile ranking relative to peer group 60.0%
Relative Customer Satisfaction (1)
(25% of award)Average result over performance period• Retail MFI Customer Satisfaction = 1.25• Wealth Management Customer Satisfaction = 1.25• Business MFI Customer Satisfaction =1.04Total weighted average ranking = 1.16
92.0%
(1) Vesting outcome for Relative Customer Satisfaction is calculated based on the weighted average ranking across the three independent surveys (weighted by the business area’s contribution to NPAT at the beginning of the performance period).
FY13 FY14 FY15 FY16 FY17
7,760
8,6809,127 9,445
9,881
0%
20%
40%
60%
80%
100% Cash NPAT (1)
CEO STVR (% of maximum)Average GE STVR (% of maximum)
Remuneration report continued
18

Ou
r b
usin
essP
erform
ance
overview
C
orp
orate
respo
nsib
ility C
orp
orate
go
vernan
ceD
irectors’
repo
rtO
ther
info
rmatio
nC
om
mo
nw
ea
lth Ba
nk o
f Au
stralia
An
nu
al Rep
ort 2017
Fin
ancial
repo
rt
6
2
1
3
4
5
7
5. Remuneration Governance
Remuneration CommitteeThe Remuneration Committee is the main governing body for remuneration across the Group. The Remuneration Committee develops the remuneration philosophy, framework and policies for Board approval.
The Remuneration Committee has a robust framework for the systematic review of risk and compliance issues impacting remuneration and works closely with the Board’s Risk Committee and management’s Risk and Remuneration Review Committee (RRRC) to consider risk and reputational matters in the determination of variable remuneration outcomes.
The following diagram illustrates the Group’s remuneration governance framework.
Remuneration Committee Focus Areas for FY17During FY17, the Remuneration Committee continued to focus on embedding a remuneration framework that is appropriate for the Group’s different businesses with transparency in design, strong governance and risk oversight. This year the Remuneration Committee’s key areas of focus were:
• Comprehensive review of the Executive remuneration strategy and framework following the significant vote against theFY16 Remuneration Report at the 2016 AGM;
• A review of Executive remuneration governance with a particular focus on risk. An enhanced framework has been developed forthe consideration of risk and reputational matters in the determination of variable remuneration outcomes;
• Ongoing review and monitoring of variable remuneration practices, with a particular focus on the Group’s retail customer facingroles, in line with the Group’s commitment to adopt in full, in FY18, the recommendations from Stephen Sedgwick’s independentreview of product sales commissions and product based payments;
• The annual review of the Group Remuneration Policy (GRP) ensuring that the GRP remains fit for purpose and continues toeffectively deliver on intent;
• Ongoing monitoring of regulatory and legislative changes, both locally and offshore, ensuring that the Group’s policies andpractices remain compliant with all regulatory requirements;
• The retirement of David Craig from the Group Executive, Financial Services and Chief Financial Officer role, effective 30 June 2017;
• The appointment of Rob Jesudason to the role of Group Executive, Financial Services and Chief Financial Officer, effective 1 July2017; and
• The appointment of Coenraad Jonker to the role of Group Executive, International Financial Services, effective 1 July 2017.
6. Executive Remuneration in Detail
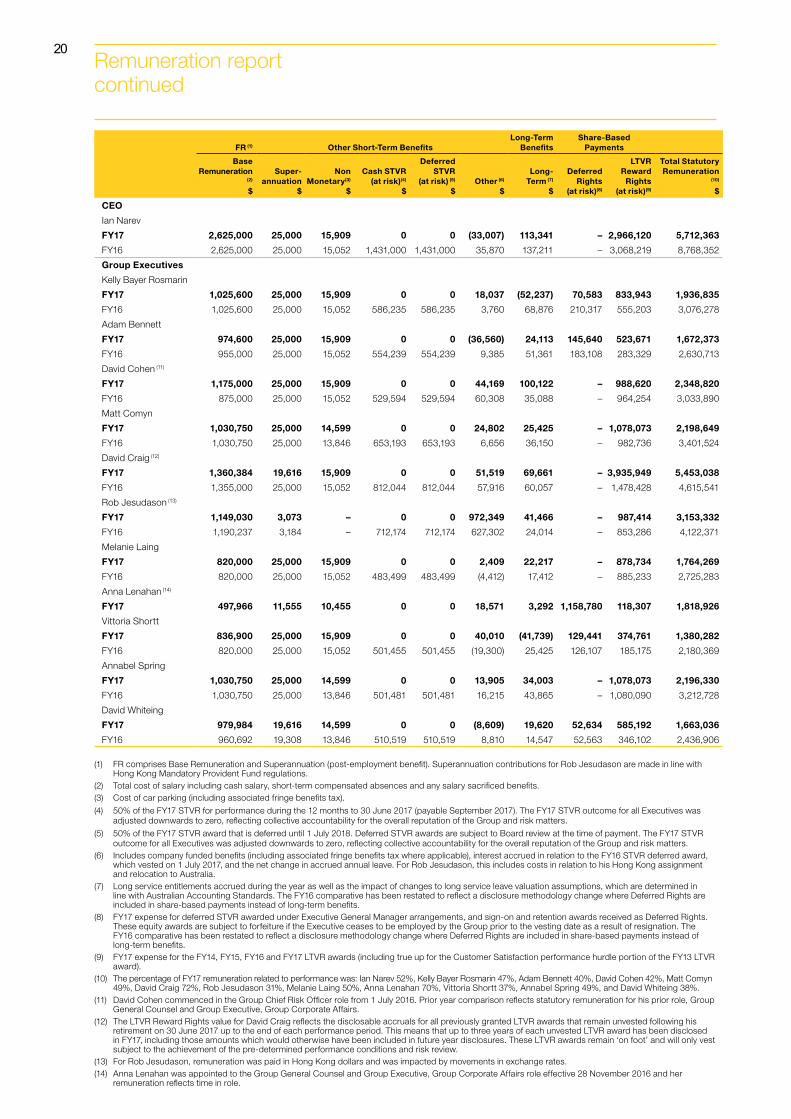
Executive Statutory RemunerationThe following statutory tables detail the statutory accounting expense of all remuneration related items for the Executives. This includes remuneration costs in relation to both FY16 and FY17. The tables are different to the Realised Remuneration table on page 14, which shows the remuneration realised in FY17 rather than the accrual amounts on the statutory accounting basis, as outlined in these statutory tables. The tables have been developed and audited against the relevant Australian Accounting Standards. Refer to the footnotes below each table for more detail on each remuneration component.
CBA Board
Risk Committee
Assists the Board in the governance of the Group’s risks.
Advises the Remuneration Committee of material risk issues which may impact remuneration outcomes.
RRRC
Management committee that advises the Group Chief Risk Officer on material risk issues which may impact remuneration outcomes.
Remuneration Committee Independent remuneration consultant (EY)
EY provides information to assist the Committee in making remuneration decisions. EY did not make any remuneration recommendations in FY17.
Members
David Higgins (Chairman)Launa InmanCatherine Livingstone AO
Andrew MohlMary PadburyWendy Stops
Roles and responsibilities
The responsibilities of the Remuneration Committee are outlined in its Charter and reviewed periodically: www.commbank.com.au/corporategovernance
19
FR (1) Other Short-Term BenefitsLong-Term
BenefitsShare-Based
Payments
Base Remuneration
(2)
$
Super-annuation
$
Non Monetary(3)
$
Cash STVR (at risk)(4)
$
Deferred STVR
(at risk) (5) $
Other (6) $
Long-Term (7)
$
Deferred Rights
(at risk)(8)
LTVR Reward
Rights (at risk)(9)
Total Statutory Remuneration
(10)
$
CEO
Ian Narev
FY17 2,625,000 25,000 15,909 0 0 (33,007) 113,341 – 2,966,120 5,712,363
FY16 2,625,000 25,000 15,052 1,431,000 1,431,000 35,870 137,211 – 3,068,219 8,768,352
Group Executives
Kelly Bayer Rosmarin
FY17 1,025,600 25,000 15,909 0 0 18,037 (52,237) 70,583 833,943 1,936,835
FY16 1,025,600 25,000 15,052 586,235 586,235 3,760 68,876 210,317 555,203 3,076,278
Adam Bennett
FY17 974,600 25,000 15,909 0 0 (36,560) 24,113 145,640 523,671 1,672,373
FY16 955,000 25,000 15,052 554,239 554,239 9,385 51,361 183,108 283,329 2,630,713
David Cohen (11)
FY17 1,175,000 25,000 15,909 0 0 44,169 100,122 – 988,620 2,348,820
FY16 875,000 25,000 15,052 529,594 529,594 60,308 35,088 – 964,254 3,033,890
Matt Comyn
FY17 1,030,750 25,000 14,599 0 0 24,802 25,425 – 1,078,073 2,198,649
FY16 1,030,750 25,000 13,846 653,193 653,193 6,656 36,150 – 982,736 3,401,524
David Craig (12)
FY17 1,360,384 19,616 15,909 0 0 51,519 69,661 – 3,935,949 5,453,038
FY16 1,355,000 25,000 15,052 812,044 812,044 57,916 60,057 – 1,478,428 4,615,541
Rob Jesudason (13)
FY17 1,149,030 3,073 – 0 0 972,349 41,466 – 987,414 3,153,332
FY16 1,190,237 3,184 – 712,174 712,174 627,302 24,014 – 853,286 4,122,371
Melanie Laing
FY17 820,000 25,000 15,909 0 0 2,409 22,217 – 878,734 1,764,269
FY16 820,000 25,000 15,052 483,499 483,499 (4,412) 17,412 – 885,233 2,725,283
Anna Lenahan (14)
FY17 497,966 11,555 10,455 0 0 18,571 3,292 1,158,780 118,307 1,818,926
Vittoria Shortt
FY17 836,900 25,000 15,909 0 0 40,010 (41,739) 129,441 374,761 1,380,282
FY16 820,000 25,000 15,052 501,455 501,455 (19,300) 25,425 126,107 185,175 2,180,369
Annabel Spring
FY17 1,030,750 25,000 14,599 0 0 13,905 34,003 – 1,078,073 2,196,330
FY16 1,030,750 25,000 13,846 501,481 501,481 16,215 43,865 – 1,080,090 3,212,728
David Whiteing
FY17 979,984 19,616 14,599 0 0 (8,609) 19,620 52,634 585,192 1,663,036
FY16 960,692 19,308 13,846 510,519 510,519 8,810 14,547 52,563 346,102 2,436,906
(1) FR comprises Base Remuneration and Superannuation (post-employment benefit). Superannuation contributions for Rob Jesudason are made in line withHong Kong Mandatory Provident Fund regulations.
(2) Total cost of salary including cash salary, short-term compensated absences and any salary sacrificed benefits. (3) Cost of car parking (including associated fringe benefits tax).
(4) 50% of the FY17 STVR for performance during the 12 months to 30 June 2017 (payable September 2017). The FY17 STVR outcome for all Executives was adjusted downwards to zero, reflecting collective accountability for the overall reputation of the Group and risk matters.
(5) 50% of the FY17 STVR award that is deferred until 1 July 2018. Deferred STVR awards are subject to Board review at the time of payment. The FY17 STVR outcome for all Executives was adjusted downwards to zero, reflecting collective accountability for the overall reputation of the Group and risk matters.
(6) Includes company funded benefits (including associated fringe benefits tax where applicable), interest accrued in relation to the FY16 STVR deferred award, which vested on 1 July 2017, and the net change in accrued annual leave. For Rob Jesudason, this includes costs in relation to his Hong Kong assignment and relocation to Australia.
(7) Long service entitlements accrued during the year as well as the impact of changes to long service leave valuation assumptions, which are determined in line with Australian Accounting Standards. The FY16 comparative has been restated to reflect a disclosure methodology change where Deferred Rights are included in share-based payments instead of long-term benefits.
(8) FY17 expense for deferred STVR awarded under Executive General Manager arrangements, and sign-on and retention awards received as Deferred Rights. These equity awards are subject to forfeiture if the Executive ceases to be employed by the Group prior to the vesting date as a result of resignation. The FY16 comparative has been restated to reflect a disclosure methodology change where Deferred Rights are included in share-based payments instead of long-term benefits.
(9) FY17 expense for the FY14, FY15, FY16 and FY17 LTVR awards (including true up for the Customer Satisfaction performance hurdle portion of the FY13 LTVR award).
(10) The percentage of FY17 remuneration related to performance was: Ian Narev 52%, Kelly Bayer Rosmarin 47%, Adam Bennett 40%, David Cohen 42%, Matt Comyn49%, David Craig 72%, Rob Jesudason 31%, Melanie Laing 50%, Anna Lenahan 70%, Vittoria Shortt 37%, Annabel Spring 49%, and David Whiteing 38%.
(11) David Cohen commenced in the Group Chief Risk Officer role from 1 July 2016. Prior year comparison reflects statutory remuneration for his prior role, Group General Counsel and Group Executive, Group Corporate Affairs.
(12) The LTVR Reward Rights value for David Craig reflects the disclosable accruals for all previously granted LTVR awards that remain unvested following his retirement on 30 June 2017 up to the end of each performance period. This means that up to three years of each unvested LTVR award has been disclosed in FY17, including those amounts which would otherwise have been included in future year disclosures. These LTVR awards remain ‘on foot’ and will only vest subject to the achievement of the pre-determined performance conditions and risk review.
(13) For Rob Jesudason, remuneration was paid in Hong Kong dollars and was impacted by movements in exchange rates.(14) Anna Lenahan was appointed to the Group General Counsel and Group Executive, Group Corporate Affairs role effective 28 November 2016 and her
remuneration reflects time in role.
Remuneration report continued
20
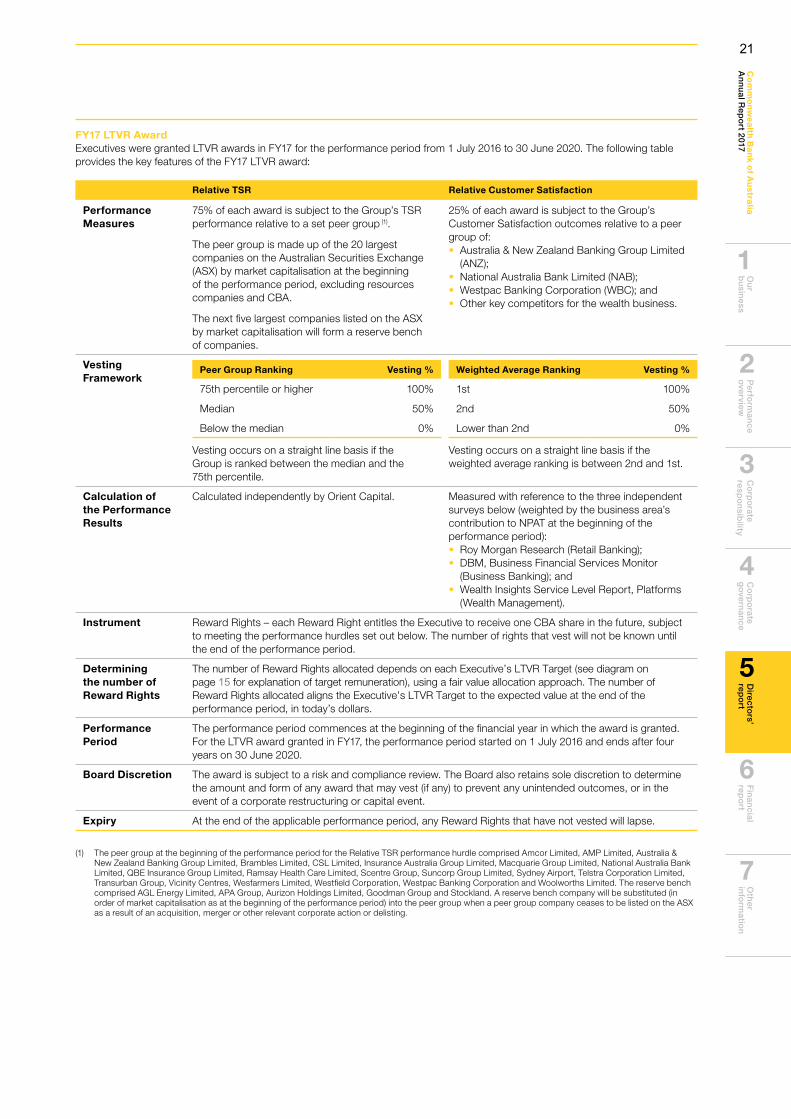
Ou
r b
usin
essP
erform
ance
overview
C
orp
orate
respo
nsib
ility C
orp
orate
go
vernan
ceD
irectors’
repo
rtO
ther
info
rmatio
nC
om
mo
nw
ea
lth Ba
nk o
f Au
stralia
An
nu
al Rep
ort 2017
Fin
ancial
repo
rt
6
2
1
3
4
5
7
FY17 LTVR Award Executives were granted LTVR awards in FY17 for the performance period from 1 July 2016 to 30 June 2020. The following table provides the key features of the FY17 LTVR award:
Relative TSR Relative Customer Satisfaction
Performance Measures
75% of each award is subject to the Group’s TSR performance relative to a set peer group (1).
The peer group is made up of the 20 largest companies on the Australian Securities Exchange (ASX) by market capitalisation at the beginning of the performance period, excluding resources companies and CBA.
The next five largest companies listed on the ASX by market capitalisation will form a reserve bench of companies.
25% of each award is subject to the Group’s Customer Satisfaction outcomes relative to a peer group of:• Australia & New Zealand Banking Group Limited
(ANZ);• National Australia Bank Limited (NAB);• Westpac Banking Corporation (WBC); and• Other key competitors for the wealth business.
Vesting Framework
Peer Group Ranking Vesting %
75th percentile or higher 100%
Median 50%
Below the median 0%
Vesting occurs on a straight line basis if the Group is ranked between the median and the 75th percentile.
Weighted Average Ranking Vesting %
1st 100%
2nd 50%
Lower than 2nd 0%
Vesting occurs on a straight line basis if the weighted average ranking is between 2nd and 1st.
Calculation of the Performance Results
Calculated independently by Orient Capital. Measured with reference to the three independent surveys below (weighted by the business area’s contribution to NPAT at the beginning of the performance period):• Roy Morgan Research (Retail Banking);• DBM, Business Financial Services Monitor
(Business Banking); and• Wealth Insights Service Level Report, Platforms
(Wealth Management).
Instrument Reward Rights – each Reward Right entitles the Executive to receive one CBA share in the future, subject to meeting the performance hurdles set out below. The number of rights that vest will not be known until the end of the performance period.
Determining the number of Reward Rights
The number of Reward Rights allocated depends on each Executive’s LTVR Target (see diagram on page 15 for explanation of target remuneration), using a fair value allocation approach. The number of Reward Rights allocated aligns the Executive’s LTVR Target to the expected value at the end of the performance period, in today’s dollars.
Performance Period
The performance period commences at the beginning of the financial year in which the award is granted. For the LTVR award granted in FY17, the performance period started on 1 July 2016 and ends after four years on 30 June 2020.
Board Discretion The award is subject to a risk and compliance review. The Board also retains sole discretion to determine the amount and form of any award that may vest (if any) to prevent any unintended outcomes, or in the event of a corporate restructuring or capital event.
Expiry At the end of the applicable performance period, any Reward Rights that have not vested will lapse.
(1) The peer group at the beginning of the performance period for the Relative TSR performance hurdle comprised Amcor Limited, AMP Limited, Australia & New Zealand Banking Group Limited, Brambles Limited, CSL Limited, Insurance Australia Group Limited, Macquarie Group Limited, National Australia Bank Limited, QBE Insurance Group Limited, Ramsay Health Care Limited, Scentre Group, Suncorp Group Limited, Sydney Airport, Telstra Corporation Limited, Transurban Group, Vicinity Centres, Wesfarmers Limited, Westfield Corporation, Westpac Banking Corporation and Woolworths Limited. The reserve bench comprised AGL Energy Limited, APA Group, Aurizon Holdings Limited, Goodman Group and Stockland. A reserve bench company will be substituted (in order of market capitalisation as at the beginning of the performance period) into the peer group when a peer group company ceases to be listed on the ASX as a result of an acquisition, merger or other relevant corporate action or delisting.
21
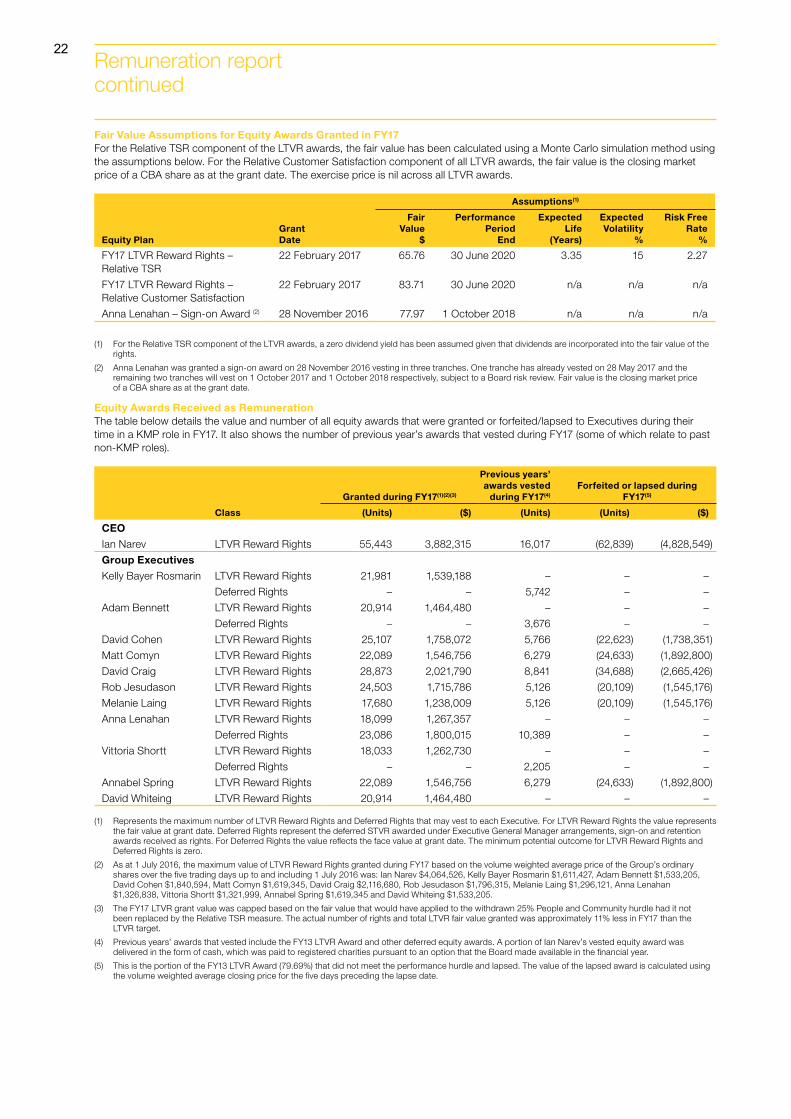
Fair Value Assumptions for Equity Awards Granted in FY17For the Relative TSR component of the LTVR awards, the fair value has been calculated using a Monte Carlo simulation method using the assumptions below. For the Relative Customer Satisfaction component of all LTVR awards, the fair value is the closing market price of a CBA share as at the grant date. The exercise price is nil across all LTVR awards.
Assumptions(1)
Equity PlanGrant Date
Fair Value
$
Performance Period
End
Expected Life
(Years)
Expected Volatility
%
Risk Free Rate
%
FY17 LTVR Reward Rights – Relative TSR
22 February 2017 65.76 30 June 2020 3.35 15 2.27
FY17 LTVR Reward Rights – Relative Customer Satisfaction
22 February 2017 83.71 30 June 2020 n/a n/a n/a
Anna Lenahan – Sign-on Award (2) 28 November 2016 77.97 1 October 2018 n/a n/a n/a
(1) For the Relative TSR component of the LTVR awards, a zero dividend yield has been assumed given that dividends are incorporated into the fair value of the rights.
(2) Anna Lenahan was granted a sign-on award on 28 November 2016 vesting in three tranches. One tranche has already vested on 28 May 2017 and the remaining two tranches will vest on 1 October 2017 and 1 October 2018 respectively, subject to a Board risk review. Fair value is the closing market price of a CBA share as at the grant date.
Equity Awards Received as RemunerationThe table below details the value and number of all equity awards that were granted or forfeited/lapsed to Executives during their time in a KMP role in FY17. It also shows the number of previous year’s awards that vested during FY17 (some of which relate to past non-KMP roles).
Granted during FY17(1)(2)(3)
Previous years’ awards vested
during FY17(4)
Forfeited or lapsed during FY17(5)
Class (Units) ($) (Units) (Units) ($)
CEO
Ian Narev LTVR Reward Rights 55,443 3,882,315 16,017 (62,839) (4,828,549)
Group Executives
Kelly Bayer Rosmarin LTVR Reward Rights 21,981 1,539,188 – – –
Deferred Rights – – 5,742 – –
Adam Bennett LTVR Reward Rights 20,914 1,464,480 – – –
Deferred Rights – – 3,676 – –
David Cohen LTVR Reward Rights 25,107 1,758,072 5,766 (22,623) (1,738,351)
Matt Comyn LTVR Reward Rights 22,089 1,546,756 6,279 (24,633) (1,892,800)
David Craig LTVR Reward Rights 28,873 2,021,790 8,841 (34,688) (2,665,426)
Rob Jesudason LTVR Reward Rights 24,503 1,715,786 5,126 (20,109) (1,545,176)
Melanie Laing LTVR Reward Rights 17,680 1,238,009 5,126 (20,109) (1,545,176)
Anna Lenahan LTVR Reward Rights 18,099 1,267,357 – – –
Deferred Rights 23,086 1,800,015 10,389 – –
Vittoria Shortt LTVR Reward Rights 18,033 1,262,730 – – –
Deferred Rights – – 2,205 – –
Annabel Spring LTVR Reward Rights 22,089 1,546,756 6,279 (24,633) (1,892,800)
David Whiteing LTVR Reward Rights 20,914 1,464,480 – – –
(1) Represents the maximum number of LTVR Reward Rights and Deferred Rights that may vest to each Executive. For LTVR Reward Rights the value represents the fair value at grant date. Deferred Rights represent the deferred STVR awarded under Executive General Manager arrangements, sign-on and retention awards received as rights. For Deferred Rights the value reflects the face value at grant date. The minimum potential outcome for LTVR Reward Rights and Deferred Rights is zero.
(2) As at 1 July 2016, the maximum value of LTVR Reward Rights granted during FY17 based on the volume weighted average price of the Group’s ordinary shares over the five trading days up to and including 1 July 2016 was: Ian Narev $4,064,526, Kelly Bayer Rosmarin $1,611,427, Adam Bennett $1,533,205, David Cohen $1,840,594, Matt Comyn $1,619,345, David Craig $2,116,680, Rob Jesudason $1,796,315, Melanie Laing $1,296,121, Anna Lenahan $1,326,838, Vittoria Shortt $1,321,999, Annabel Spring $1,619,345 and David Whiteing $1,533,205.
(3) The FY17 LTVR grant value was capped based on the fair value that would have applied to the withdrawn 25% People and Community hurdle had it not been replaced by the Relative TSR measure. The actual number of rights and total LTVR fair value granted was approximately 11% less in FY17 than the LTVR target.
(4) Previous years’ awards that vested include the FY13 LTVR Award and other deferred equity awards. A portion of Ian Narev’s vested equity award was delivered in the form of cash, which was paid to registered charities pursuant to an option that the Board made available in the financial year.
(5) This is the portion of the FY13 LTVR Award (79.69%) that did not meet the performance hurdle and lapsed. The value of the lapsed award is calculated using the volume weighted average closing price for the five days preceding the lapse date.
Remuneration report continued
22
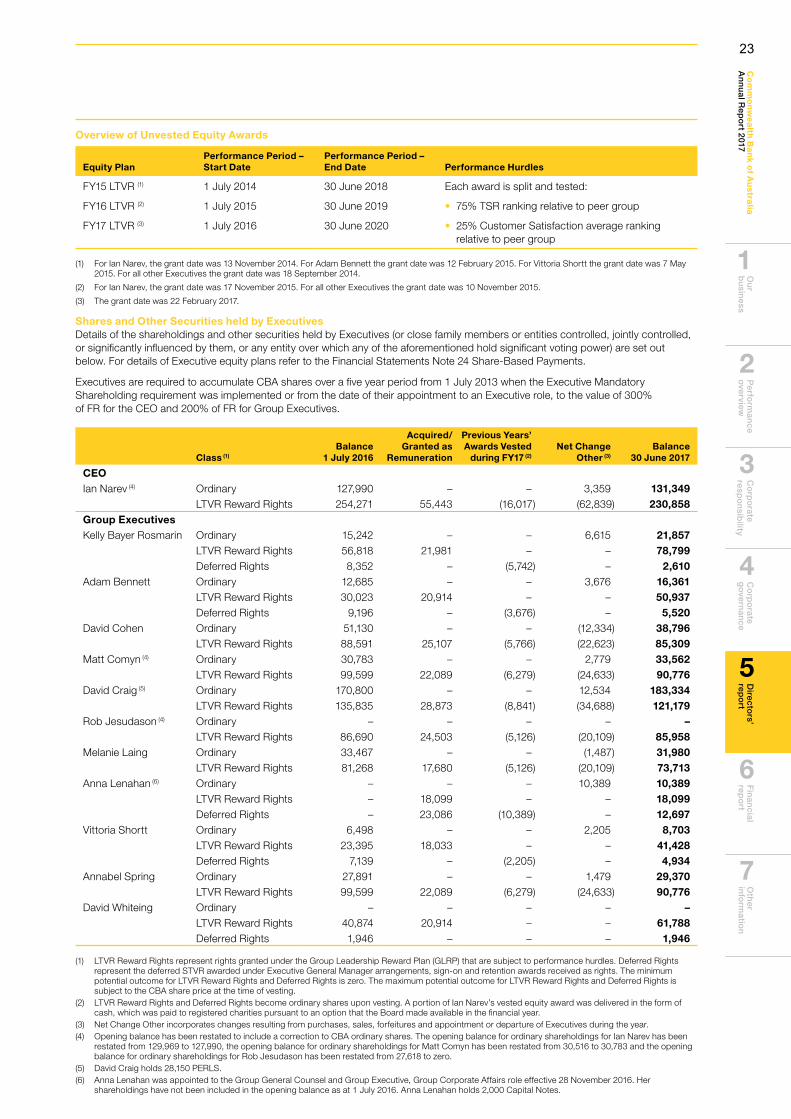
Ou
r b
usin
essP
erform
ance
overview
C
orp
orate
respo
nsib
ility C
orp
orate
go
vernan
ceD
irectors’
repo
rtO
ther
info
rmatio
nC
om
mo
nw
ea
lth Ba
nk o
f Au
stralia
An
nu
al Rep
ort 2017
Fin
ancial
repo
rt
6
2
1
3
4
5
7
Overview of Unvested Equity Awards
Equity Plan Performance Period – Start Date
Performance Period – End Date Performance Hurdles
FY15 LTVR (1) 1 July 2014 30 June 2018 Each award is split and tested:
FY16 LTVR (2) 1 July 2015 30 June 2019 • 75% TSR ranking relative to peer group
FY17 LTVR (3) 1 July 2016 30 June 2020 • 25% Customer Satisfaction average rankingrelative to peer group
(1) For Ian Narev, the grant date was 13 November 2014. For Adam Bennett the grant date was 12 February 2015. For Vittoria Shortt the grant date was 7 May 2015. For all other Executives the grant date was 18 September 2014.
(2) For Ian Narev, the grant date was 17 November 2015. For all other Executives the grant date was 10 November 2015.
(3) The grant date was 22 February 2017.
Shares and Other Securities held by ExecutivesDetails of the shareholdings and other securities held by Executives (or close family members or entities controlled, jointly controlled, or significantly influenced by them, or any entity over which any of the aforementioned hold significant voting power) are set out below. For details of Executive equity plans refer to the Financial Statements Note 24 Share-Based Payments.
Executives are required to accumulate CBA shares over a five year period from 1 July 2013 when the Executive Mandatory Shareholding requirement was implemented or from the date of their appointment to an Executive role, to the value of 300% of FR for the CEO and 200% of FR for Group Executives.
Class (1)
Balance 1 July 2016
Acquired/Granted as
Remuneration
Previous Years’ Awards Vested
during FY17 (2)
Net Change Other (3)
Balance 30 June 2017
CEOIan Narev (4) Ordinary 127,990 – – 3,359 131,349
LTVR Reward Rights 254,271 55,443 (16,017) (62,839) 230,858 Group ExecutivesKelly Bayer Rosmarin Ordinary 15,242 – – 6,615 21,857
LTVR Reward Rights 56,818 21,981 – – 78,799 Deferred Rights 8,352 – (5,742) – 2,610
Adam Bennett Ordinary 12,685 – – 3,676 16,361LTVR Reward Rights 30,023 20,914 – – 50,937Deferred Rights 9,196 – (3,676) – 5,520
David Cohen Ordinary 51,130 – – (12,334) 38,796LTVR Reward Rights 88,591 25,107 (5,766) (22,623) 85,309
Matt Comyn (4) Ordinary 30,783 – – 2,779 33,562LTVR Reward Rights 99,599 22,089 (6,279) (24,633) 90,776
David Craig (5) Ordinary 170,800 – – 12,534 183,334LTVR Reward Rights 135,835 28,873 (8,841) (34,688) 121,179
Rob Jesudason (4) Ordinary – – – – –LTVR Reward Rights 86,690 24,503 (5,126) (20,109) 85,958
Melanie Laing Ordinary 33,467 – – (1,487) 31,980 LTVR Reward Rights 81,268 17,680 (5,126) (20,109) 73,713
Anna Lenahan (6) Ordinary – – – 10,389 10,389 LTVR Reward Rights – 18,099 – – 18,099 Deferred Rights – 23,086 (10,389) – 12,697
Vittoria Shortt Ordinary 6,498 – – 2,205 8,703LTVR Reward Rights 23,395 18,033 – – 41,428Deferred Rights 7,139 – (2,205) – 4,934
Annabel Spring Ordinary 27,891 – – 1,479 29,370LTVR Reward Rights 99,599 22,089 (6,279) (24,633) 90,776
David Whiteing Ordinary – – – – –LTVR Reward Rights 40,874 20,914 – – 61,788 Deferred Rights 1,946 – – – 1,946
(1) LTVR Reward Rights represent rights granted under the Group Leadership Reward Plan (GLRP) that are subject to performance hurdles. Deferred Rights represent the deferred STVR awarded under Executive General Manager arrangements, sign-on and retention awards received as rights. The minimum potential outcome for LTVR Reward Rights and Deferred Rights is zero. The maximum potential outcome for LTVR Reward Rights and Deferred Rights is subject to the CBA share price at the time of vesting.
(2) LTVR Reward Rights and Deferred Rights become ordinary shares upon vesting. A portion of Ian Narev’s vested equity award was delivered in the form of cash, which was paid to registered charities pursuant to an option that the Board made available in the financial year.
(3) Net Change Other incorporates changes resulting from purchases, sales, forfeitures and appointment or departure of Executives during the year.(4) Opening balance has been restated to include a correction to CBA ordinary shares. The opening balance for ordinary shareholdings for Ian Narev has been
restated from 129,969 to 127,990, the opening balance for ordinary shareholdings for Matt Comyn has been restated from 30,516 to 30,783 and the opening balance for ordinary shareholdings for Rob Jesudason has been restated from 27,618 to zero.
(5) David Craig holds 28,150 PERLS. (6) Anna Lenahan was appointed to the Group General Counsel and Group Executive, Group Corporate Affairs role effective 28 November 2016. Her
shareholdings have not been included in the opening balance as at 1 July 2016. Anna Lenahan holds 2,000 Capital Notes.
23
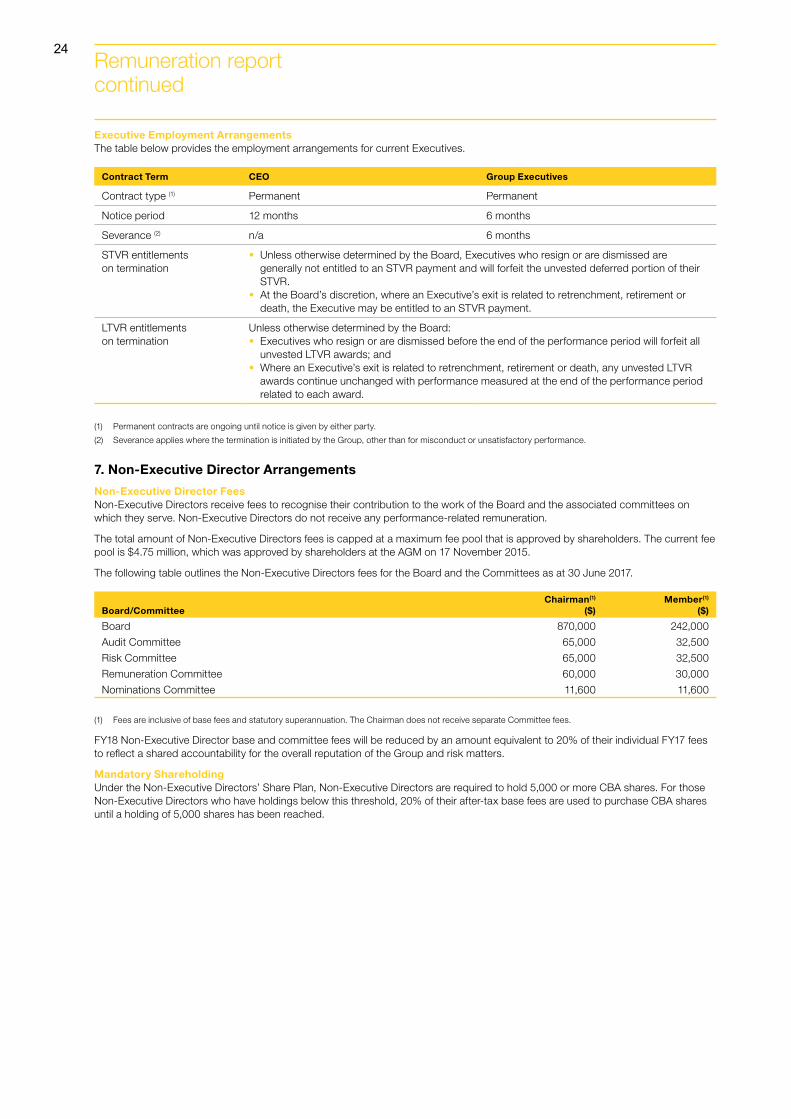
Executive Employment Arrangements The table below provides the employment arrangements for current Executives.
Contract Term CEO Group Executives
Contract type (1) Permanent Permanent
Notice period 12 months 6 months
Severance (2) n/a 6 months
STVR entitlements on termination
• Unless otherwise determined by the Board, Executives who resign or are dismissed aregenerally not entitled to an STVR payment and will forfeit the unvested deferred portion of theirSTVR.
• At the Board’s discretion, where an Executive’s exit is related to retrenchment, retirement ordeath, the Executive may be entitled to an STVR payment.
LTVR entitlements on termination
Unless otherwise determined by the Board:• Executives who resign or are dismissed before the end of the performance period will forfeit all
unvested LTVR awards; and• Where an Executive’s exit is related to retrenchment, retirement or death, any unvested LTVR
awards continue unchanged with performance measured at the end of the performance periodrelated to each award.
(1) Permanent contracts are ongoing until notice is given by either party.
(2) Severance applies where the termination is initiated by the Group, other than for misconduct or unsatisfactory performance.
7. Non-Executive Director Arrangements
Non-Executive Director FeesNon-Executive Directors receive fees to recognise their contribution to the work of the Board and the associated committees on which they serve. Non-Executive Directors do not receive any performance-related remuneration.
The total amount of Non-Executive Directors fees is capped at a maximum fee pool that is approved by shareholders. The current fee pool is $4.75 million, which was approved by shareholders at the AGM on 17 November 2015.
The following table outlines the Non-Executive Directors fees for the Board and the Committees as at 30 June 2017.
Board/CommitteeChairman(1)
($)Member(1)
($)
Board 870,000 242,000
Audit Committee 65,000 32,500
Risk Committee 65,000 32,500
Remuneration Committee 60,000 30,000
Nominations Committee 11,600 11,600
(1) Fees are inclusive of base fees and statutory superannuation. The Chairman does not receive separate Committee fees.
FY18 Non-Executive Director base and committee fees will be reduced by an amount equivalent to 20% of their individual FY17 fees to reflect a shared accountability for the overall reputation of the Group and risk matters.
Mandatory ShareholdingUnder the Non-Executive Directors’ Share Plan, Non-Executive Directors are required to hold 5,000 or more CBA shares. For those Non-Executive Directors who have holdings below this threshold, 20% of their after-tax base fees are used to purchase CBA shares until a holding of 5,000 shares has been reached.
Remuneration report continued
24
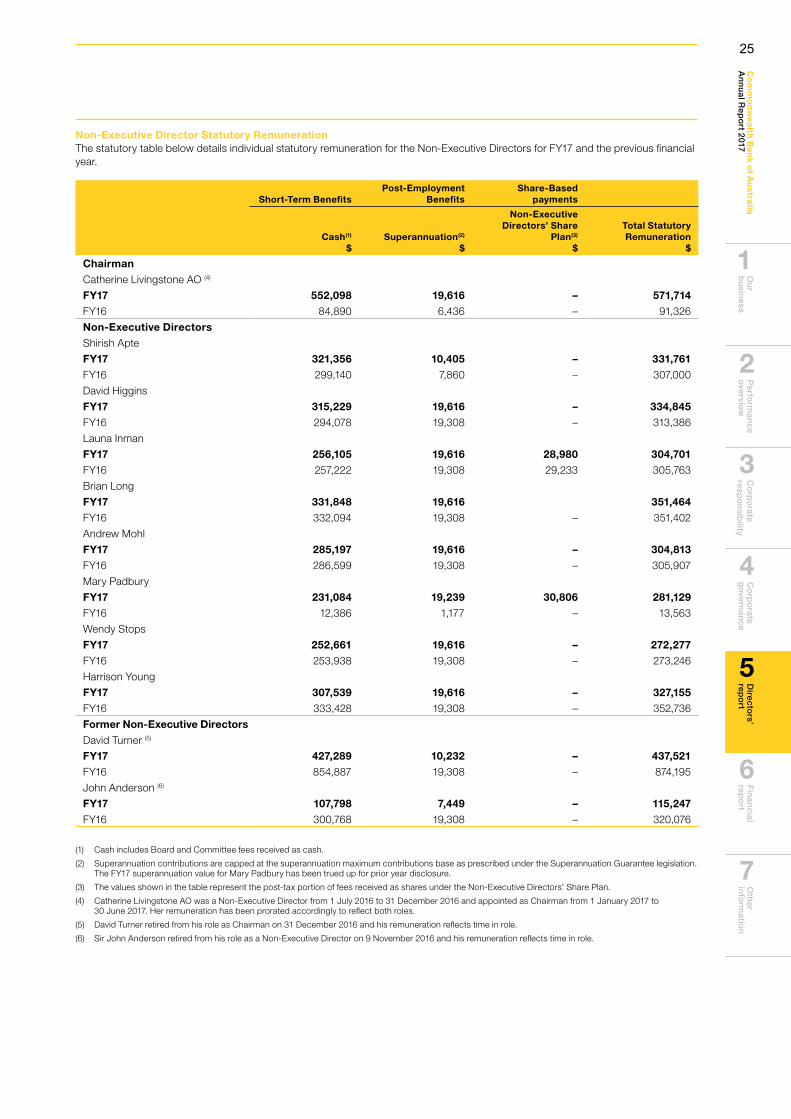
Ou
r b
usin
essP
erform
ance
overview
C
orp
orate
respo
nsib
ility C
orp
orate
go
vernan
ceD
irectors’
repo
rtO
ther
info
rmatio
nC
om
mo
nw
ea
lth Ba
nk o
f Au
stralia
An
nu
al Rep
ort 2017
Fin
ancial
repo
rt
6
2
1
3
4
5
7
Non-Executive Director Statutory RemunerationThe statutory table below details individual statutory remuneration for the Non-Executive Directors for FY17 and the previous financial year.
Short-Term BenefitsPost-Employment
BenefitsShare-Based
payments
Cash(1) $
Superannuation(2) $
Non-Executive Directors’ Share
Plan(3) $
Total Statutory Remuneration
$
Chairman
Catherine Livingstone AO (4)
FY17 552,098 19,616 – 571,714
FY16 84,890 6,436 – 91,326
Non-Executive Directors
Shirish Apte
FY17 321,356 10,405 – 331,761
FY16 299,140 7,860 – 307,000
David Higgins
FY17 315,229 19,616 – 334,845
FY16 294,078 19,308 – 313,386
Launa Inman
FY17 256,105 19,616 28,980 304,701
FY16 257,222 19,308 29,233 305,763
Brian Long
FY17 331,848 19,616 351,464
FY16 332,094 19,308 – 351,402
Andrew Mohl
FY17 285,197 19,616 – 304,813
FY16 286,599 19,308 – 305,907
Mary Padbury
FY17 231,084 19,239 30,806 281,129
FY16 12,386 1,177 – 13,563
Wendy Stops
FY17 252,661 19,616 – 272,277
FY16 253,938 19,308 – 273,246
Harrison Young
FY17 307,539 19,616 – 327,155
FY16 333,428 19,308 – 352,736
Former Non-Executive Directors
David Turner (5)
FY17 427,289 10,232 – 437,521
FY16 854,887 19,308 – 874,195
John Anderson (6)
FY17 107,798 7,449 – 115,247
FY16 300,768 19,308 – 320,076
(1) Cash includes Board and Committee fees received as cash.
(2) Superannuation contributions are capped at the superannuation maximum contributions base as prescribed under the Superannuation Guarantee legislation.The FY17 superannuation value for Mary Padbury has been trued up for prior year disclosure.
(3) The values shown in the table represent the post-tax portion of fees received as shares under the Non-Executive Directors’ Share Plan.
(4) Catherine Livingstone AO was a Non-Executive Director from 1 July 2016 to 31 December 2016 and appointed as Chairman from 1 January 2017 to 30 June 2017. Her remuneration has been prorated accordingly to reflect both roles.
(5) David Turner retired from his role as Chairman on 31 December 2016 and his remuneration reflects time in role.
(6) Sir John Anderson retired from his role as a Non-Executive Director on 9 November 2016 and his remuneration reflects time in role.
25

Shares and Other Securities held by Non-Executive DirectorsAll shares were acquired by Non-Executive Directors on normal terms and conditions or through the Non-Executive Directors’ Share Plan. Other securities acquired by Non-Executive Directors were on normal terms and conditions.
ClassBalance
1 July 2016 Acquired(1)
Net Change Other(2)
Balance 30 June 2017
Chairman
Catherine Livingstone AO (3) Ordinary 5,204 133 – 5,337
Non-Executive Directors
Shirish Apte Ordinary 7,500 – – 7,500
David Higgins (3) Ordinary 10,878 – – 10,878
PERLS (6) – 3,094 (474) 2,620
Launa Inman Ordinary 4,221 432 – 4,653
Brian Long Ordinary 14,654 143 – 14,797
PERLS (6) 6,850 – – 6,850
Andrew Mohl Ordinary 82,234 – – 82,234
Mary Padbury Ordinary – 294 – 294
PERLS (6) 1,600 – – 1,600
Wendy Stops Ordinary 15,218 782 – 16,000
Harrison Young Ordinary 30,000 – – 30,000
Former Non-Executive Directors
David Turner (4) Ordinary 12,268 – – n/a
PERLS (6) 1,380 – (380) n/a
John Anderson (5) Ordinary 18,978 – – n/a
(1) Incorporates shares and other securities acquired during the year. Non-Executive Directors who hold fewer than 5,000 Commonwealth Bank shares are required to receive 20% of their total after-tax base fees as CBA shares. These shares are subject to a 10-year trading restriction (the shares will be released earlier if the Non-Executive Director leaves the Board). In FY17, under the Non-Executive Directors’ Share Plan, Launa Inman received 307 shares and Mary Padbury received 257 shares. Mary Padbury also voluntarily salary sacrificed a portion of her fees to purchase 37 shares during FY17.
(2) Net Change Other incorporates changes resulting from sales of securities.
(3) Opening balance has been restated to include a correction to CBA ordinary shares. The opening balance for ordinary shareholdings for Catherine Livingstone has been restated from 5,146 to 5,204 and the opening balance for ordinary shareholdings for David Higgins has been restated from 10,346 to 10,878.
(4) David Turner retired from the Group on 31 December 2016 and his shareholdings are not included in the balance as at 30 June 2017.
(5) Sir John Anderson retired from the Group on 9 November 2016 and his shareholdings are not included in the balance as at 30 June 2017.
(6) Includes cumulative holdings of all PERLS securities issued by the Group.
8. Loans and Other Transactions
Loans to KMPAll loans to KMP (including close family members or entities controlled, jointly controlled, or significantly influenced by them, or any entity over which any of those family members or entities held significant voting power) have been made in the ordinary course of business on normal commercial terms and conditions no more favourable than those given to other employees and customers, including the term of the loan, security required and the interest rate (which may be fixed or variable). There has been no write down of loans during the period.
Total Loans to KMP
FY17 ($)
Opening Balance (1) 11,330,450
Closing Balance (2) 12,145,179
Interest Charged 406,211
(1) The opening balance has been restated from $11,354,745.
(2) The aggregate loan amount at the end of the reporting period includes loans issued to 16 KMP.
Remuneration report continued
26
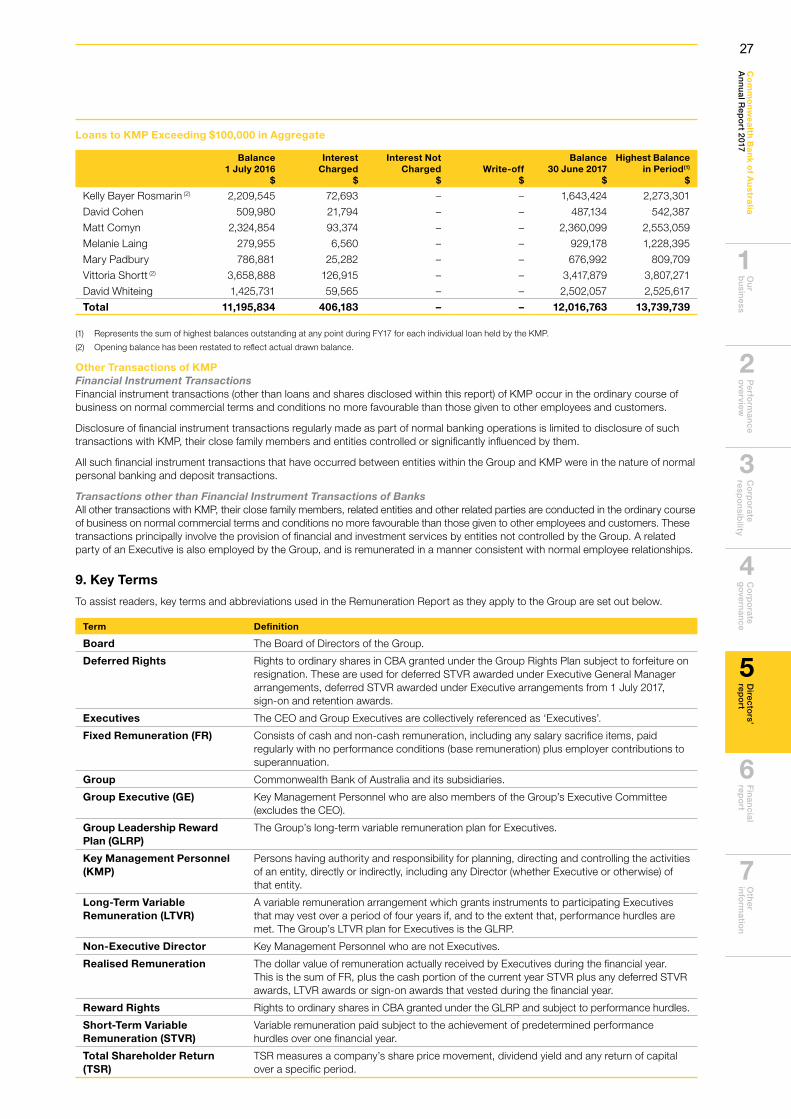
Ou
r b
usin
essP
erform
ance
overview
C
orp
orate
respo
nsib
ility C
orp
orate
go
vernan
ceD
irectors’
repo
rtO
ther
info
rmatio
nC
om
mo
nw
ea
lth Ba
nk o
f Au
stralia
An
nu
al Rep
ort 2017
Fin
ancial
repo
rt
6
2
1
3
4
5
7
Loans to KMP Exceeding $100,000 in Aggregate
Balance 1 July 2016
$
Interest Charged
$
Interest Not Charged
$Write-off
$
Balance 30 June 2017
$
Highest Balance in Period(1)
$
Kelly Bayer Rosmarin (2) 2,209,545 72,693 – – 1,643,424 2,273,301
David Cohen 509,980 21,794 – – 487,134 542,387
Matt Comyn 2,324,854 93,374 – – 2,360,099 2,553,059
Melanie Laing 279,955 6,560 – – 929,178 1,228,395
Mary Padbury 786,881 25,282 – – 676,992 809,709
Vittoria Shortt (2) 3,658,888 126,915 – – 3,417,879 3,807,271
David Whiteing 1,425,731 59,565 – – 2,502,057 2,525,617
Total 11,195,834 406,183 – – 12,016,763 13,739,739
(1) Represents the sum of highest balances outstanding at any point during FY17 for each individual loan held by the KMP.
(2) Opening balance has been restated to reflect actual drawn balance.
Other Transactions of KMPFinancial Instrument TransactionsFinancial instrument transactions (other than loans and shares disclosed within this report) of KMP occur in the ordinary course of business on normal commercial terms and conditions no more favourable than those given to other employees and customers.
Disclosure of financial instrument transactions regularly made as part of normal banking operations is limited to disclosure of such transactions with KMP, their close family members and entities controlled or significantly influenced by them.
All such financial instrument transactions that have occurred between entities within the Group and KMP were in the nature of normal personal banking and deposit transactions.
Transactions other than Financial Instrument Transactions of BanksAll other transactions with KMP, their close family members, related entities and other related parties are conducted in the ordinary course of business on normal commercial terms and conditions no more favourable than those given to other employees and customers. These transactions principally involve the provision of financial and investment services by entities not controlled by the Group. A related party of an Executive is also employed by the Group, and is remunerated in a manner consistent with normal employee relationships.
9. Key Terms
To assist readers, key terms and abbreviations used in the Remuneration Report as they apply to the Group are set out below.
Term Definition
Board The Board of Directors of the Group.
Deferred Rights Rights to ordinary shares in CBA granted under the Group Rights Plan subject to forfeiture on resignation. These are used for deferred STVR awarded under Executive General Manager arrangements, deferred STVR awarded under Executive arrangements from 1 July 2017, sign-on and retention awards.
Executives The CEO and Group Executives are collectively referenced as ‘Executives’.
Fixed Remuneration (FR) Consists of cash and non-cash remuneration, including any salary sacrifice items, paid regularly with no performance conditions (base remuneration) plus employer contributions to superannuation.
Group Commonwealth Bank of Australia and its subsidiaries.
Group Executive (GE) Key Management Personnel who are also members of the Group’s Executive Committee (excludes the CEO).
Group Leadership Reward Plan (GLRP)
The Group’s long-term variable remuneration plan for Executives.
Key Management Personnel (KMP)
Persons having authority and responsibility for planning, directing and controlling the activities of an entity, directly or indirectly, including any Director (whether Executive or otherwise) of that entity.
Long-Term Variable Remuneration (LTVR)
A variable remuneration arrangement which grants instruments to participating Executives that may vest over a period of four years if, and to the extent that, performance hurdles are met. The Group’s LTVR plan for Executives is the GLRP.
Non-Executive Director Key Management Personnel who are not Executives.
Realised Remuneration The dollar value of remuneration actually received by Executives during the financial year. This is the sum of FR, plus the cash portion of the current year STVR plus any deferred STVR awards, LTVR awards or sign-on awards that vested during the financial year.
Reward Rights Rights to ordinary shares in CBA granted under the GLRP and subject to performance hurdles.
Short-Term Variable Remuneration (STVR)
Variable remuneration paid subject to the achievement of predetermined performance hurdles over one financial year.
Total Shareholder Return (TSR)
TSR measures a company’s share price movement, dividend yield and any return of capital over a specific period.
27
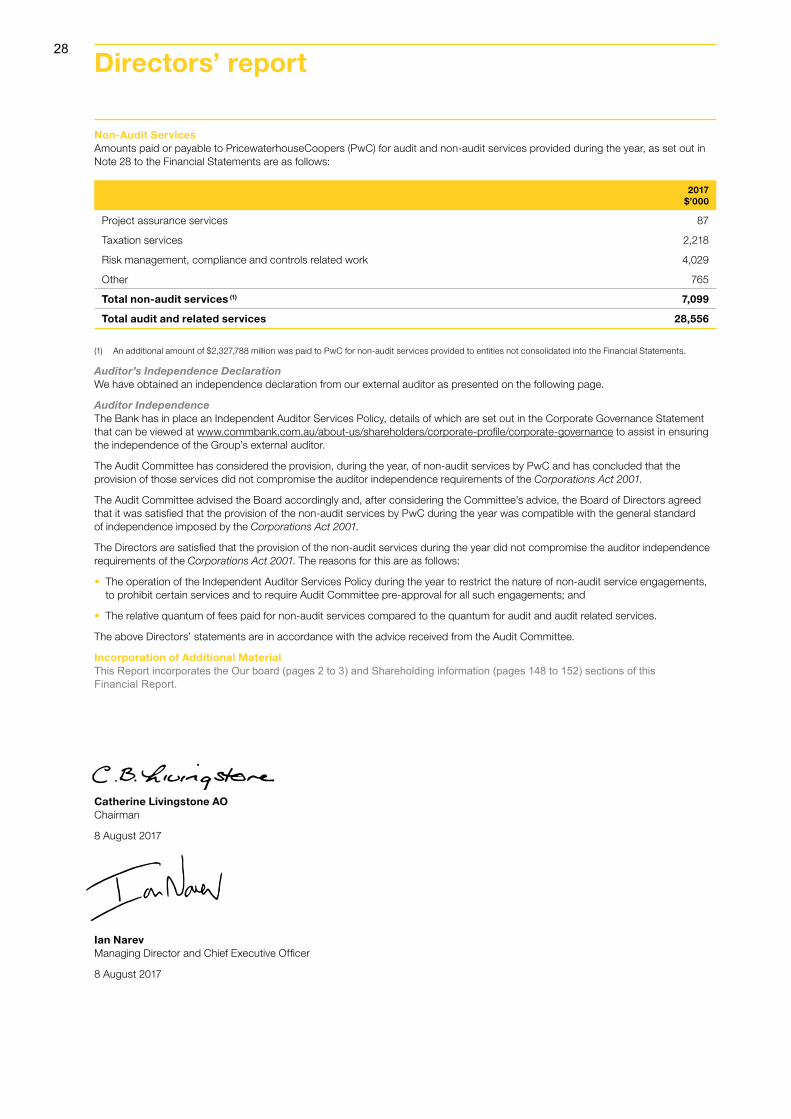
Non-Audit ServicesAmounts paid or payable to PricewaterhouseCoopers (PwC) for audit and non-audit services provided during the year, as set out in Note 28 to the Financial Statements are as follows:
2017 $’000
Project assurance services 87
Taxation services 2,218
Risk management, compliance and controls related work 4,029
Other 765
Total non-audit services (1) 7,099
Total audit and related services 28,556
(1) An additional amount of $2,327,788 million was paid to PwC for non-audit services provided to entities not consolidated into the Financial Statements.
Auditor’s Independence DeclarationWe have obtained an independence declaration from our external auditor as presented on the following page.
Auditor IndependenceThe Bank has in place an Independent Auditor Services Policy, details of which are set out in the Corporate Governance Statement that can be viewed at www.commbank.com.au/about-us/shareholders/corporate-profile/corporate-governance to assist in ensuring the independence of the Group’s external auditor.
The Audit Committee has considered the provision, during the year, of non-audit services by PwC and has concluded that the provision of those services did not compromise the auditor independence requirements of the Corporations Act 2001.
The Audit Committee advised the Board accordingly and, after considering the Committee’s advice, the Board of Directors agreed that it was satisfied that the provision of the non-audit services by PwC during the year was compatible with the general standard of independence imposed by the Corporations Act 2001.
The Directors are satisfied that the provision of the non-audit services during the year did not compromise the auditor independence requirements of the Corporations Act 2001. The reasons for this are as follows:
• The operation of the Independent Auditor Services Policy during the year to restrict the nature of non-audit service engagements,to prohibit certain services and to require Audit Committee pre-approval for all such engagements; and
• The relative quantum of fees paid for non-audit services compared to the quantum for audit and audit related services.
The above Directors’ statements are in accordance with the advice received from the Audit Committee.
Incorporation of Additional MaterialThis Report incorporates the Our board (pages 2 to 3) and Shareholding information (pages 148 to 152) sections of this Financial Report.
Catherine Livingstone AO Chairman
8 August 2017
Ian Narev Managing Director and Chief Executive Officer
8 August 2017
Directors’ report28
Ou
r b
usin
essP
erform
ance
overview
C
orp
orate
respo
nsib
ility C
orp
orate
go
vernan
ceD
irectors’
repo
rtO
ther
info
rmatio
nC
om
mo
nw
ea
lth Ba
nk o
f Au
stralia
An
nu
al Rep
ort 2017
Fin
ancial
repo
rt
6
2
1
3
4
5
7
As lead auditor for the audit of Commonwealth Bank of Australia for the year ended 30 June 2017, I declare that to the best of my knowledge and belief, there have been:
(a) no contraventions of the auditor independence requirements of the Corporations Act 2001 in relation to the audit; and
(b) no contraventions of any applicable code of professional conduct in relation to the audit.
This declaration is in respect of Commonwealth Bank of Australia and the entities it controlled during the period.
Marcus Laithwaite Partner PricewaterhouseCoopers
Auditor’s independence declaration
Sydney 8 August 2017
29

Financial report8294
Ou
r b
usin
essP
erform
ance
overview
C
orp
orate
respo
nsib
ility C
orp
orate
go
vernan
ceD
irectors’
repo
rtO
ther
info
rmatio
nC
om
mo
nw
ea
lth Ba
nk o
f Au
stralia
An
nu
al Rep
ort 2017
Fin
ancial
repo
rt
6
2
1
3
4
5
7
Financial statements 85
Income Statements 86
Statements of Comprehensive Income 87
Balance Sheets 88
Statements of Changes in Equity 89
Statements of Cash Flows 91
Note 1 Accounting Policies 93
Note 2 Profit 104
Note 3 Average Balances and Related Interest 106
Note 4 Income Tax 109
Note 5 Dividends 112
Note 6 Earnings Per Share 113
Note 7 Cash and Liquid Assets 113
Note 8 Receivables Due from Other Financial Institutions 113
Note 9 Assets at Fair Value through Income Statement 114
Note 10 Derivative Financial Instruments 114
Note 11 Available-for-Sale Investments 118
Note 12 Loans, Bills Discounted and Other Receivables 119
Note 13 Provisions for Impairment 122
Note 14 Property, Plant and Equipment 124
Note 15 Intangible Assets 126
Note 16 Other Assets 128
Note 17 Deposits and Other Public Borrowings 128
Note 18 Liabilities at Fair Value through Income Statement 129
Note 19 Other Provisions 129
Note 20 Debt Issues 131
Note 21 Bills Payable and Other Liabilities 132
Note 22 Loan Capital 133
Note 23 Shareholders’ Equity 134
Note 24 Share-Based Payments 137
Note 25 Capital Adequacy 139
Note 26 Financial Reporting by Segments 140
Note 27 Life Insurance 143
Note 28 Remuneration of Auditors 145
Note 29 Lease Commitments 145
Note 30 Contingent Liabilities, Contingent Assets and Commitments 146
Note 31 Risk Management 148
Note 32 Credit Risk 152
Note 33 Market Risk 166
Note 34 Liquidity and Funding Risk 168
Note 35 Retirement Benefit Obligations 171
Note 36 Investments in Subsidiaries and Other Entities 174
Note 37 Key Management Personnel 179
Note 38 Related Party Disclosures 180
Note 39 Notes to the Statements of Cash Flows 181
Note 40 Disclosures about Fair Values 182
Note 41 Securitisation, Covered Bonds and Transferred Assets 188
Note 42 Collateral Arrangements 189
Note 43 Offsetting Financial Assets and Financial Liabilities 190
Note 44 Subsequent Events 192
31
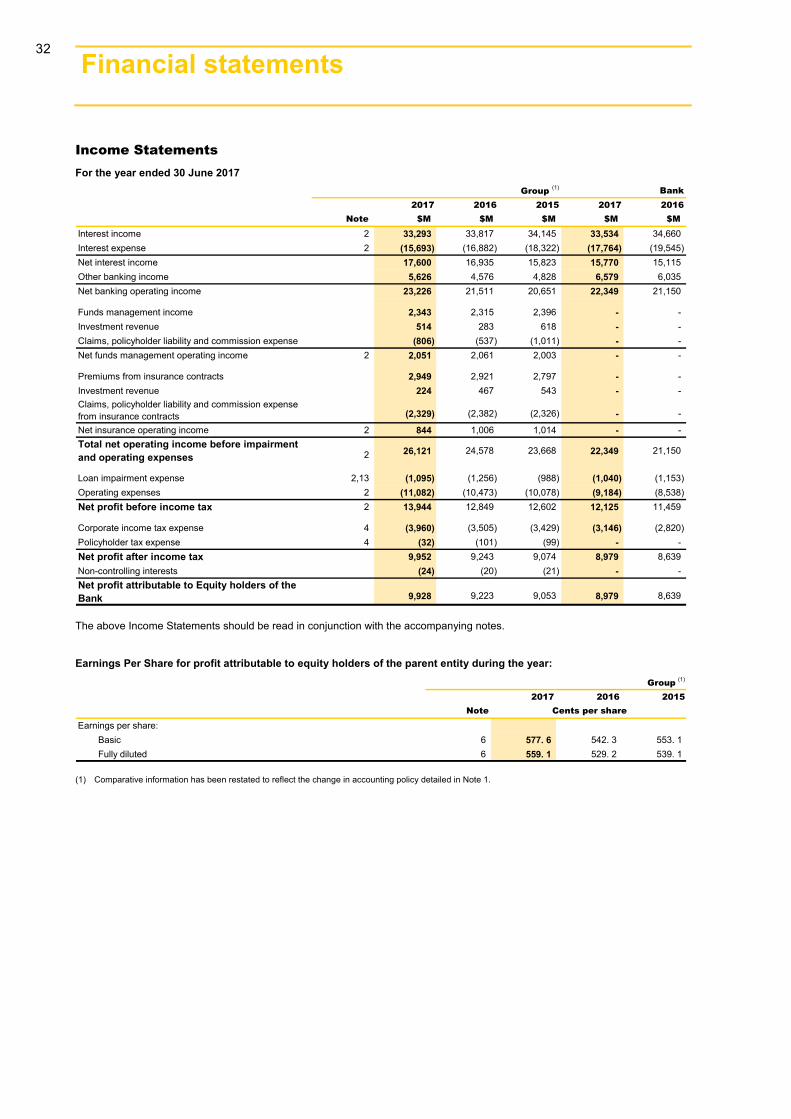
Financial statements 86
Income Statements For the year ended 30 June 2017
Group (1) Bank2017 2016 2015 2017 2016
Note $M $M $M $M $M
Interest income 2 33,293 33,817 34,145 33,534 34,660Interest expense 2 (15,693) (16,882) (18,322) (17,764) (19,545)Net interest income 17,600 16,935 15,823 15,770 15,115Other banking income 5,626 4,576 4,828 6,579 6,035Net banking operating income 23,226 21,511 20,651 22,349 21,150
Funds management income 2,343 2,315 2,396 - -Investment revenue 514 283 618 - -Claims, policyholder liability and commission expense (806) (537) (1,011) - -Net funds management operating income 2 2,051 2,061 2,003 - -
Premiums from insurance contracts 2,949 2,921 2,797 - -Investment revenue 224 467 543 - -Claims, policyholder liability and commission expense from insurance contracts (2,329) (2,382) (2,326) - -
Net insurance operating income 2 844 1,006 1,014 - -Total net operating income before impairment and operating expenses 2 26,121 24,578 23,668 22,349 21,150
Loan impairment expense 2,13 (1,095) (1,256) (988) (1,040) (1,153)Operating expenses 2 (11,082) (10,473) (10,078) (9,184) (8,538)Net profit before income tax 2 13,944 12,849 12,602 12,125 11,459
Corporate income tax expense 4 (3,960) (3,505) (3,429) (3,146) (2,820)Policyholder tax expense 4 (32) (101) (99) - -Net profit after income tax 9,952 9,243 9,074 8,979 8,639Non-controlling interests (24) (20) (21) - -Net profit attributable to Equity holders of the Bank 9,928 9,223 9,053 8,979 8,639
The above Income Statements should be read in conjunction with the accompanying notes.
Earnings Per Share for profit attributable to equity holders of the parent entity during the year: Group (1)
2017 2016 2015Note
Earnings per share: Basic 6 577. 6 542. 3 553. 1
Fully diluted 6 559. 1 529. 2 539. 1
Cents per share
(1) Comparative information has been restated to reflect the change in accounting policy detailed in Note 1.
32
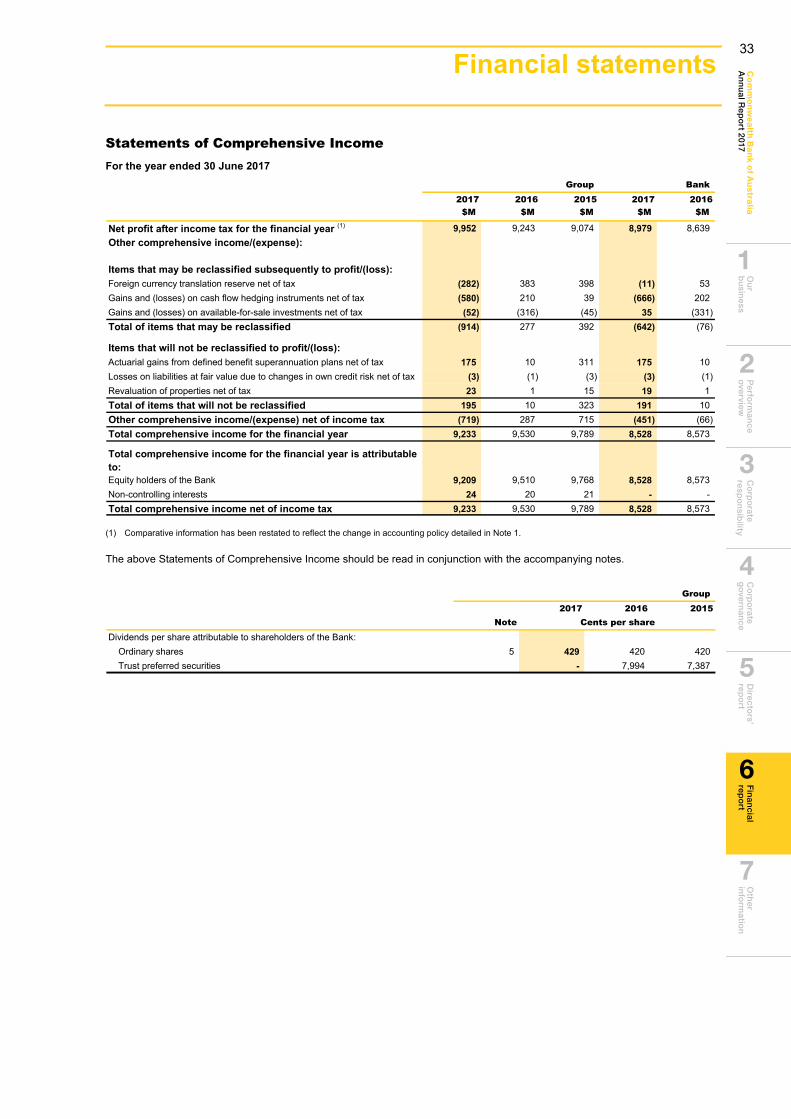
Ou
r b
usin
essP
erform
ance
overview
C
orp
orate
respo
nsib
ility C
orp
orate
go
vernan
ceD
irectors’
repo
rtO
ther
info
rmatio
nC
om
mo
nw
ea
lth Ba
nk o
f Au
stralia
An
nu
al Rep
ort 2017
Fin
ancial
repo
rt
6
2
1
3
4
5
7
Financial statements 87
Statements of Comprehensive Income For the year ended 30 June 2017
Group Bank2017 2016 2015 2017 2016$M $M $M $M $M
Net profit after income tax for the financial year (1) 9,952 9,243 9,074 8,979 8,639Other comprehensive income/(expense):
Items that may be reclassified subsequently to profit/(loss):Foreign currency translation reserve net of tax (282) 383 398 (11) 53Gains and (losses) on cash flow hedging instruments net of tax (580) 210 39 (666) 202Gains and (losses) on available-for-sale investments net of tax (52) (316) (45) 35 (331)Total of items that may be reclassified (914) 277 392 (642) (76)
Items that will not be reclassified to profit/(loss):Actuarial gains from defined benefit superannuation plans net of tax 175 10 311 175 10Losses on liabilities at fair value due to changes in own credit risk net of tax (3) (1) (3) (3) (1)Revaluation of properties net of tax 23 1 15 19 1Total of items that will not be reclassified 195 10 323 191 10Other comprehensive income/(expense) net of income tax (719) 287 715 (451) (66)Total comprehensive income for the financial year 9,233 9,530 9,789 8,528 8,573
Total comprehensive income for the financial year is attributable to:Equity holders of the Bank 9,209 9,510 9,768 8,528 8,573Non-controlling interests 24 20 21 - -Total comprehensive income net of income tax 9,233 9,530 9,789 8,528 8,573
(1) Comparative information has been restated to reflect the change in accounting policy detailed in Note 1.
The above Statements of Comprehensive Income should be read in conjunction with the accompanying notes.
Group 2017 2016 2015
Note
Dividends per share attributable to shareholders of the Bank:Ordinary shares 5 429 420 420Trust preferred securities - 7,994 7,387
Cents per share
33
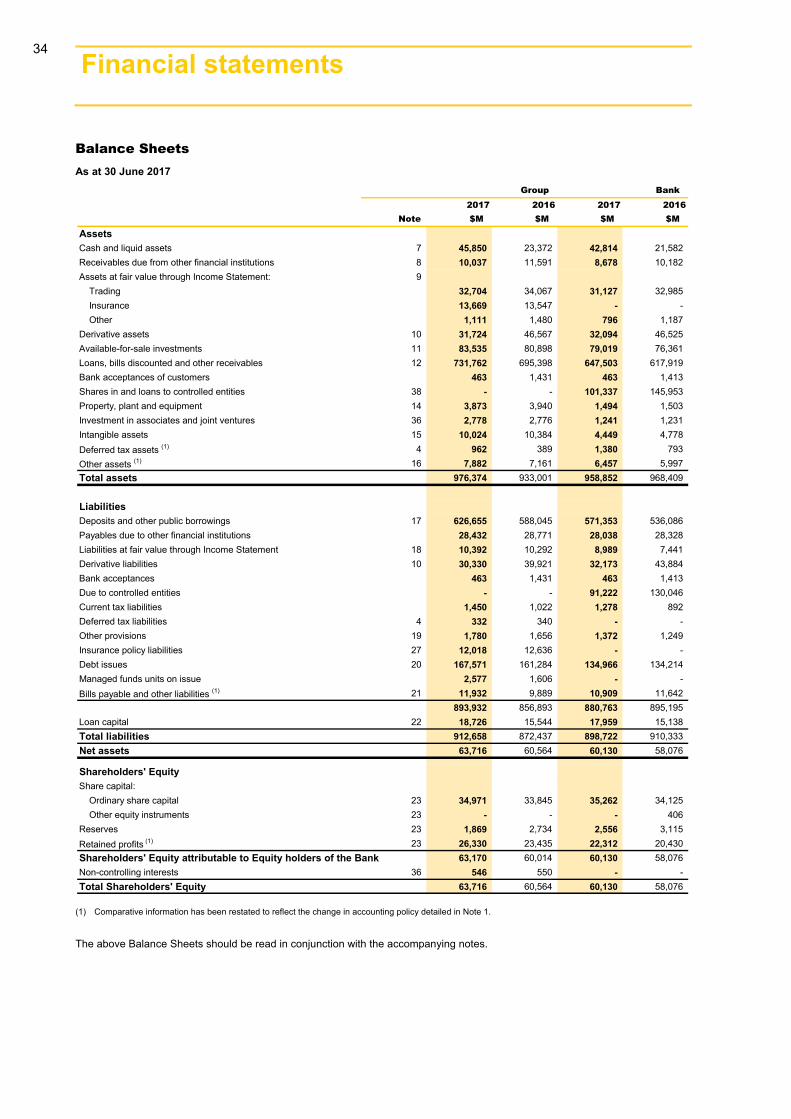
Financial statements 88
Balance Sheets As at 30 June 2017
Group Bank2017 2016 2017 2016
Note $M $M $M $M
AssetsCash and liquid assets 7 45,850 23,372 42,814 21,582Receivables due from other financial institutions 8 10,037 11,591 8,678 10,182Assets at fair value through Income Statement: 9
Trading 32,704 34,067 31,127 32,985Insurance 13,669 13,547 - -Other 1,111 1,480 796 1,187
Derivative assets 10 31,724 46,567 32,094 46,525Available-for-sale investments 11 83,535 80,898 79,019 76,361Loans, bills discounted and other receivables 12 731,762 695,398 647,503 617,919Bank acceptances of customers 463 1,431 463 1,413Shares in and loans to controlled entities 38 - - 101,337 145,953Property, plant and equipment 14 3,873 3,940 1,494 1,503Investment in associates and joint ventures 36 2,778 2,776 1,241 1,231Intangible assets 15 10,024 10,384 4,449 4,778Deferred tax assets (1) 4 962 389 1,380 793Other assets (1) 16 7,882 7,161 6,457 5,997Total assets 976,374 933,001 958,852 968,409
LiabilitiesDeposits and other public borrowings 17 626,655 588,045 571,353 536,086Payables due to other financial institutions 28,432 28,771 28,038 28,328Liabilities at fair value through Income Statement 18 10,392 10,292 8,989 7,441Derivative liabilities 10 30,330 39,921 32,173 43,884Bank acceptances 463 1,431 463 1,413Due to controlled entities - - 91,222 130,046Current tax liabilities 1,450 1,022 1,278 892Deferred tax liabilities 4 332 340 - -Other provisions 19 1,780 1,656 1,372 1,249Insurance policy liabilities 27 12,018 12,636 - -Debt issues 20 167,571 161,284 134,966 134,214Managed funds units on issue 2,577 1,606 - -Bills payable and other liabilities (1) 21 11,932 9,889 10,909 11,642
893,932 856,893 880,763 895,195Loan capital 22 18,726 15,544 17,959 15,138Total liabilities 912,658 872,437 898,722 910,333Net assets 63,716 60,564 60,130 58,076
Shareholders' EquityShare capital:
Ordinary share capital 23 34,971 33,845 35,262 34,125Other equity instruments 23 - - - 406
Reserves 23 1,869 2,734 2,556 3,115Retained profits (1) 23 26,330 23,435 22,312 20,430Shareholders' Equity attributable to Equity holders of the Bank 63,170 60,014 60,130 58,076Non-controlling interests 36 546 550 - -Total Shareholders' Equity 63,716 60,564 60,130 58,076
(1) Comparative information has been restated to reflect the change in accounting policy detailed in Note 1.
The above Balance Sheets should be read in conjunction with the accompanying notes.
34
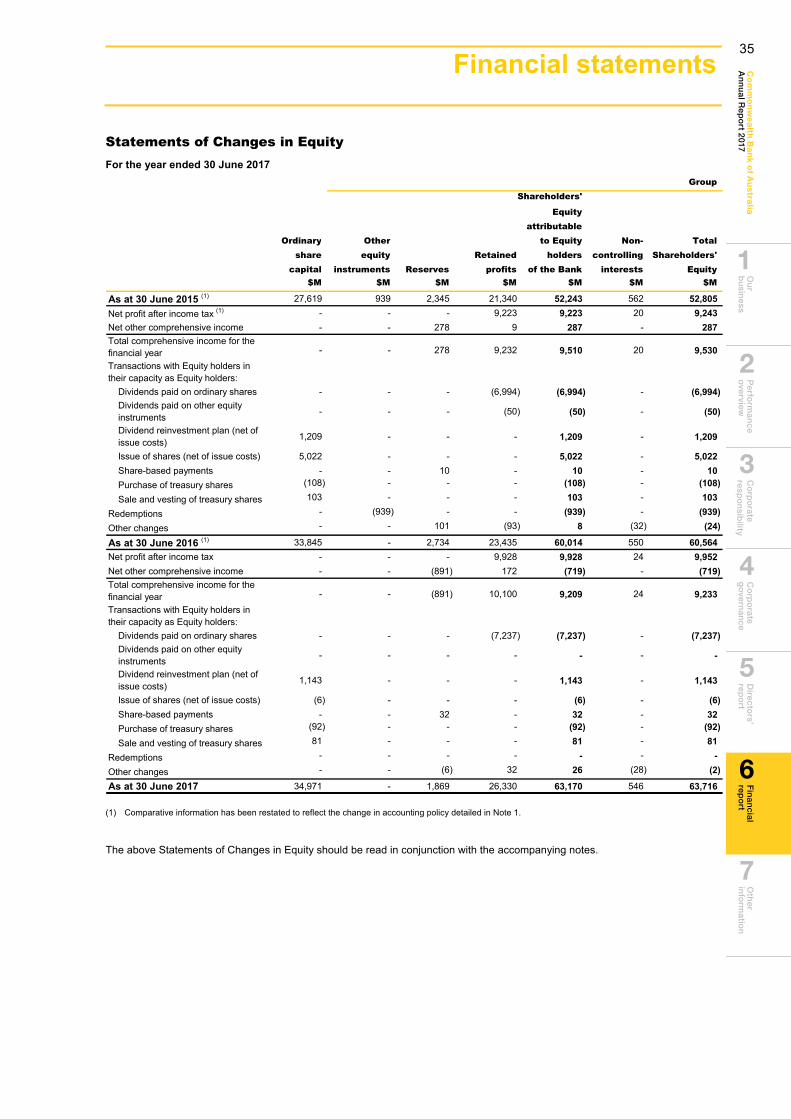
Ou
r b
usin
essP
erform
ance
overview
C
orp
orate
respo
nsib
ility C
orp
orate
go
vernan
ceD
irectors’
repo
rtO
ther
info
rmatio
nC
om
mo
nw
ea
lth Ba
nk o
f Au
stralia
An
nu
al Rep
ort 2017
Fin
ancial
repo
rt
6
2
1
3
4
5
7
Financial statements 89
Statements of Changes in Equity For the year ended 30 June 2017
GroupShareholders'
Equityattributable
Ordinary Other to Equity Non- Total share equity Retained holders controlling Shareholders'
capital instruments Reserves profits of the Bank interests Equity$M $M $M $M $M $M $M
As at 30 June 2015 (1) 27,619 939 2,345 21,340 52,243 562 52,805Net profit after income tax (1) - - - 9,223 9,223 20 9,243Net other comprehensive income - - 278 9 287 - 287Total comprehensive income for the financial year - - 278 9,232 9,510 20 9,530Transactions with Equity holders in their capacity as Equity holders:
Dividends paid on ordinary shares - - - (6,994) (6,994) - (6,994)Dividends paid on other equity instruments - - - (50) (50) - (50)
Dividend reinvestment plan (net of issue costs) 1,209 - - - 1,209 - 1,209
Issue of shares (net of issue costs) 5,022 - - - 5,022 - 5,022Share-based payments - - 10 - 10 - 10Purchase of treasury shares (108) - - - (108) - (108)Sale and vesting of treasury shares 103 - - - 103 - 103
Redemptions - (939) - - (939) - (939)Other changes - - 101 (93) 8 (32) (24)
As at 30 June 2016 (1) 33,845 - 2,734 23,435 60,014 550 60,564Net profit after income tax - - - 9,928 9,928 24 9,952Net other comprehensive income - - (891) 172 (719) - (719)Total comprehensive income for the financial year - - (891) 10,100 9,209 24 9,233Transactions with Equity holders in their capacity as Equity holders:
Dividends paid on ordinary shares - - - (7,237) (7,237) - (7,237)Dividends paid on other equity instruments - - - - - - -
Dividend reinvestment plan (net of issue costs) 1,143 - - - 1,143 - 1,143
Issue of shares (net of issue costs) (6) - - - (6) - (6)Share-based payments - - 32 - 32 - 32Purchase of treasury shares (92) - - - (92) - (92)Sale and vesting of treasury shares 81 - - - 81 - 81
Redemptions - - - - - - -Other changes - - (6) 32 26 (28) (2)As at 30 June 2017 34,971 - 1,869 26,330 63,170 546 63,716
(1) Comparative information has been restated to reflect the change in accounting policy detailed in Note 1.
The above Statements of Changes in Equity should be read in conjunction with the accompanying notes.
35

Financial statements 90
Statements of Changes in Equity (continued) For the year ended 30 June 2017
BankShareholders'
Equityattributable
Ordinary Other to Equity share equity Retained holders
capital instruments Reserves profits of the Bank$M $M $M $M $M
As at 30 June 2015 27,894 1,895 3,195 18,763 51,747Net profit after income tax - - - 8,639 8,639Net other comprehensive income - - (75) 9 (66)Total comprehensive income for the financial year - - (75) 8,648 8,573Transactions with Equity holders in their capacity as Equity holders:
Dividends paid on ordinary shares - - - (6,994) (6,994)Dividend reinvestment plan (net of issue costs) 1,209 - - - 1,209Issue of shares (net of issue costs) 5,022 - - - 5,022Share-based payments - - 10 - 10
Redemptions - (1,489) - - (1,489)
Other changes - - (15) 13 (2)
As at 30 June 2016 34,125 406 3,115 20,430 58,076Net profit after income tax - - - 8,979 8,979Net other comprehensive income - - (623) 172 (451)Total comprehensive income for the financial year - - (623) 9,151 8,528Transactions with Equity holders in their capacity as Equity holders:
Dividends paid on ordinary shares - - - (7,237) (7,237)Dividend reinvestment plan (net of issue costs) 1,143 - - - 1,143Issue of shares (net of issue costs) (6) - - - (6)Share-based payments - - 32 - 32
Redemptions - (406) - - (406)
Other changes - - 32 (32) -
As at 30 June 2017 35,262 - 2,556 22,312 60,130
The above Statements of Changes in Equity should be read in conjunction with the accompanying notes.
36
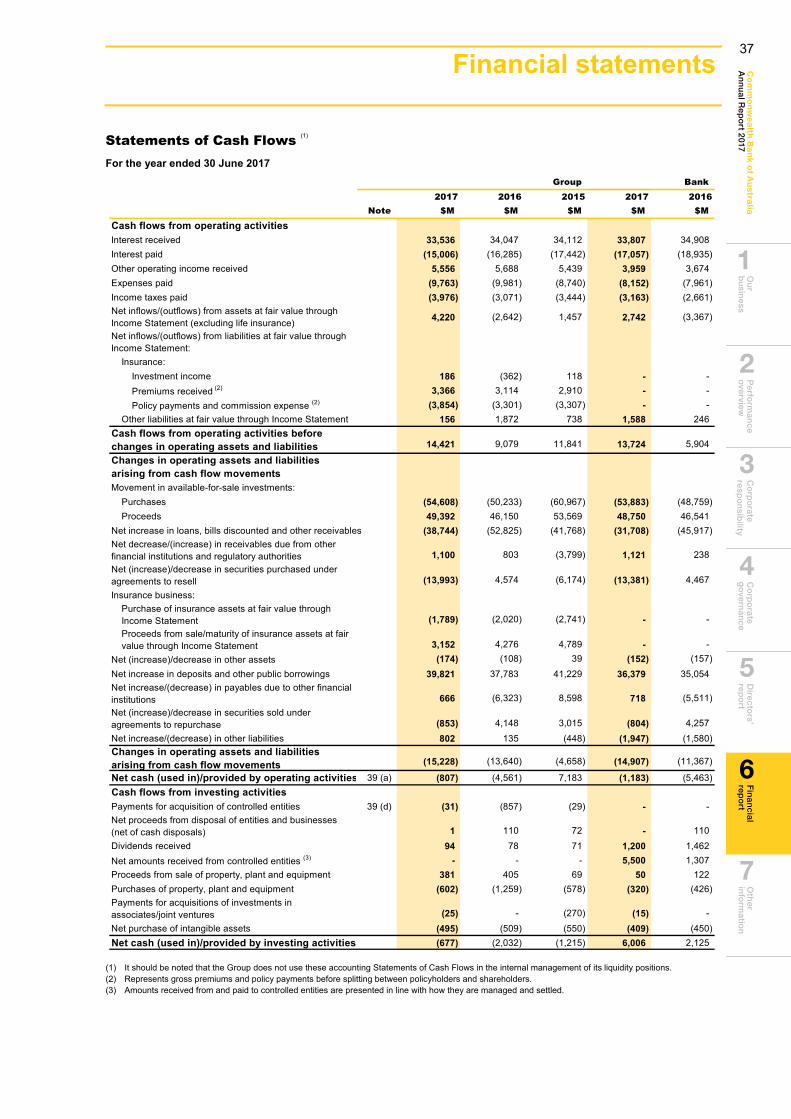
Ou
r b
usin
essP
erform
ance
overview
C
orp
orate
respo
nsib
ility C
orp
orate
go
vernan
ceD
irectors’
repo
rtO
ther
info
rmatio
nC
om
mo
nw
ea
lth Ba
nk o
f Au
stralia
An
nu
al Rep
ort 2017
Fin
ancial
repo
rt
6
2
1
3
4
5
7
Financial statements 91
Statements of Cash Flows (1) For the year ended 30 June 2017
Group Bank2017 2016 2015 2017 2016
Note $M $M $M $M $M
Cash flows from operating activitiesInterest received 33,536 34,047 34,112 33,807 34,908Interest paid (15,006) (16,285) (17,442) (17,057) (18,935)Other operating income received 5,556 5,688 5,439 3,959 3,674Expenses paid (9,763) (9,981) (8,740) (8,152) (7,961)Income taxes paid (3,976) (3,071) (3,444) (3,163) (2,661)Net inflows/(outflows) from assets at fair value through Income Statement (excluding life insurance) 4,220 (2,642) 1,457 2,742 (3,367)
Net inflows/(outflows) from liabilities at fair value through Income Statement:
Insurance:Investment income 186 (362) 118 - -Premiums received (2) 3,366 3,114 2,910 - -Policy payments and commission expense (2) (3,854) (3,301) (3,307) - -
Other liabilities at fair value through Income Statement 156 1,872 738 1,588 246Cash flows from operating activities before changes in operating assets and liabilities 14,421 9,079 11,841 13,724 5,904
Changes in operating assets and liabilities arising from cash flow movementsMovement in available-for-sale investments:
Purchases (54,608) (50,233) (60,967) (53,883) (48,759)Proceeds 49,392 46,150 53,569 48,750 46,541
Net increase in loans, bills discounted and other receivables (38,744) (52,825) (41,768) (31,708) (45,917)Net decrease/(increase) in receivables due from other financial institutions and regulatory authorities 1,100 803 (3,799) 1,121 238Net (increase)/decrease in securities purchased under agreements to resell (13,993) 4,574 (6,174) (13,381) 4,467Insurance business:
Purchase of insurance assets at fair value through Income Statement (1,789) (2,020) (2,741) - -Proceeds from sale/maturity of insurance assets at fair value through Income Statement 3,152 4,276 4,789 - -
Net (increase)/decrease in other assets (174) (108) 39 (152) (157)Net increase in deposits and other public borrowings 39,821 37,783 41,229 36,379 35,054Net increase/(decrease) in payables due to other financial institutions 666 (6,323) 8,598 718 (5,511)Net (increase)/decrease in securities sold underagreements to repurchase (853) 4,148 3,015 (804) 4,257Net increase/(decrease) in other liabilities 802 135 (448) (1,947) (1,580)Changes in operating assets and liabilities arising from cash flow movements (15,228) (13,640) (4,658) (14,907) (11,367)
Net cash (used in)/provided by operating activities 39 (a) (807) (4,561) 7,183 (1,183) (5,463)Cash flows from investing activitiesPayments for acquisition of controlled entities 39 (d) (31) (857) (29) - -Net proceeds from disposal of entities and businesses (net of cash disposals) 1 110 72 - 110Dividends received 94 78 71 1,200 1,462Net amounts received from controlled entities (3) - - - 5,500 1,307Proceeds from sale of property, plant and equipment 381 405 69 50 122Purchases of property, plant and equipment (602) (1,259) (578) (320) (426)Payments for acquisitions of investments in associates/joint ventures (25) - (270) (15) -Net purchase of intangible assets (495) (509) (550) (409) (450)Net cash (used in)/provided by investing activities (677) (2,032) (1,215) 6,006 2,125
(1) It should be noted that the Group does not use these accounting Statements of Cash Flows in the internal management of its liquidity positions.(2) Represents gross premiums and policy payments before splitting between policyholders and shareholders. (3) Amounts received from and paid to controlled entities are presented in line with how they are managed and settled.
37

Financial statements 92
Statements of Cash Flows (1) (continued) For the year ended 30 June 2017
Group Bank2017 2016 2015 2017 2016
Note $M $M $M $M $M
Cash flows from financing activitiesDividends paid (excluding Dividend Reinvestment Plan) (6,084) (5,827) (6,200) (6,084) (5,777)Redemption of other equity instruments (net of costs) - (939) - (406) (1,483)Proceeds from issuance of debt securities 94,560 98,958 68,655 77,938 88,920Redemption of issued debt securities (81,758) (97,740) (73,377) (71,345) (90,149)Purchase of treasury shares (92) (108) (790) - -Sale of treasury shares 34 50 744 - -Issue of loan capital 3,757 3,949 6,184 3,379 3,943Redemption of loan capital - (1,678) (2,971) 3 (2,645)Proceeds from issuance of shares (net of issue costs) (6) 5,022 - (6) 5,022Other 61 (67) (120) 30 179Net cash provided by/(used in) financing activities 10,472 1,620 (7,875) 3,509 (1,990)Net increase/(decrease) in cash and cash equivalents 8,988 (4,973) (1,907) 8,332 (5,328)Effect of foreign exchange rates on cash and cash equivalents (318) 150 2,049 (292) 72Cash and cash equivalents at beginning of year 14,447 19,270 19,128 12,909 18,165Cash and cash equivalents at end of year 39 (b) 23,117 14,447 19,270 20,949 12,909
(1) It should be noted that the Group does not use these accounting Statements of Cash Flows in the internal management of its liquidity positions.
The above Statements of Cash Flows should be read in conjunction with the accompanying notes.
38
Ou
r b
usin
essP
erform
ance
overview
C
orp
orate
respo
nsib
ility C
orp
orate
go
vernan
ceD
irectors’
repo
rtO
ther
info
rmatio
nC
om
mo
nw
ea
lth Ba
nk o
f Au
stralia
An
nu
al Rep
ort 2017
Fin
ancial
repo
rt
6
2
1
3
4
5
7
Financial statements 93
Note 1 Accounting Policies The Financial Statements of the Commonwealth Bank of Australia (the Bank) and the Bank and its subsidiaries (the Group) for the year ended 30 June 2017, were approved and authorised for issue by the Board of Directors on 8 August 2017. The Directors have the power to amend and reissue the Financial Statements. The Bank is a for-profit entity incorporated and domiciled in Australia. It is a company limited by shares that are publicly traded on the Australian Securities Exchange. The registered office is Ground Floor, Tower 1, 201 Sussex Street, Sydney, NSW 2000, Australia. The principal accounting policies adopted in the preparation of this financial report are set out below. These policies have been consistently applied to all the periods presented, unless otherwise stated. The financial report is presented in Australian dollars. The assets and liabilities are presented in order of liquidity on the Balance Sheet.
Basis of Preparation
(a) Basis of AccountingThis General Purpose Financial Report has been prepared in accordance with Australian Accounting Standards (the standards), Australian Interpretations, and the Corporations Act 2001. The Financial Statements comply with International Financial Reporting Standards (IFRS) and Interpretations as issued by the International Accounting Standards Board (IASB) and IFRS Interpretations Committee (IFRIC) respectively.
(b) Historical Cost ConventionThis financial report has been prepared under the historical cost convention, except for certain assets and liabilities (including derivative instruments) measured at fair value.
(c) Rounding of AmountsThe amounts in this financial report have been rounded in accordance with ASIC Corporations Instrument 2016/191 to the nearest million dollars, unless otherwise indicated.
(d) Segment ReportingOperating segments are reported based on the Group’s organisational and management structures. Senior management review the Group’s internal reporting based around these segments, in order to assess performance and allocate resources. All transactions between segments are conducted on an arm’s length basis, with inter-segment revenue and costs being eliminated in “Other”.
(e) Changes in Accounting PoliciesThe accounting policies adopted are consistent with those of the previous financial year other than the changes outlined below.
Comparatives
Where necessary, comparative information has been restated to conform to changes in presentation in the current year. All comparative changes made have been footnoted throughout the Financial Statements. Other than changes to the presentation of segment information, as disclosed in Note 26, the restatements are not considered to have a material impact on the Financial Statements.
During the year, the Group changed its accounting policy in relation to the recognition of Global Asset Management long-term incentives provided to certain employees in Wealth Management. The new accounting policy expenses the long-term incentives when granted rather than over the vesting period per the previous accounting policy. The new policy more closely aligns the accounting with the economic substance of the arrangements. The change has been applied retrospectively and results in a reduction in net profit after tax of $4 million (30 June 2015: $10 million), a reduction of $192 million in retained earnings (30 June 2015: $188 million), a decrease of $77 million in total assets (30 June 2015: $43 million increase) and an increase in total liabilities of $115 million (30 June 2015: $231 million).
(f) Principles of Consolidation
Subsidiaries
The consolidated financial report comprises the financial report of the Bank and its subsidiaries. Subsidiaries are entities (including structured entities) over which the Bank has control. The Bank controls another entity when it has: power over the relevant activities of the entity, for
example through voting or other rights; exposure to, or rights to, variable returns from the Bank’s
involvement with the entity; and the ability to use its power over the entity to affect the
Bank’s returns from the entity.Transactions between subsidiaries in the Group are eliminated. Non-controlling interests in the results and equity of subsidiaries are shown separately in the consolidated Income Statement, Statement of Comprehensive Income, Statement of Changes in Equity, and Balance Sheet. Subsidiaries are consolidated from the date on which control is transferred to the Group and de-consolidated when control ceases. Subsidiaries are accounted for at cost less accumulated impairments at the Bank level.
Business Combinations
Business combinations are accounted for using the acquisition method. Cost is measured as the aggregate of the fair values of assets given, equity instruments issued, or liabilities incurred or assumed at the date of exchange. Identifiable assets acquired and liabilities and contingent liabilities assumed in a business combination are measured at fair value on the acquisition date. Goodwill is recorded as the excess of the total consideration transferred, the carrying amount of any non-controlling interest in the acquiree and the acquisition date fair value of any previous equity interest in the acquiree over the net identifiable assets acquired. If there is a deficit instead, this discount on acquisition is recognised directly in the consolidated Income Statement, but only after a reassessment of the identification and measurement of the net assets acquired.
Investment in Associates and Joint Ventures
Associates and joint ventures are entities over which the Group has significant influence or joint control, but not control. In the consolidated financial report, they are equity accounted. They are initially recorded at cost and adjusted for
39
Notes to the financial statements 94
Note 1 Accounting Policies (continued) the Group’s share of the associates’ and joint ventures’ post-acquisition profits or losses and other comprehensive income (OCI), less any dividends received. At the Bank level, they are accounted for at cost less accumulated impairments. The Group assesses, at each Balance Sheet date, whether there is any objective evidence of impairment. The main indicators of impairment are as for equity securities classified as available-for-sale (Note 1(t)). If there is an indication that an investment may be impaired, then the entire carrying amount of the investment in associate or joint venture is tested for impairment by comparing the recoverable amount (higher of value in use and fair value less disposal costs) with its carrying amount. Impairment losses recognised in the Income Statement are subsequently reversed through the Income Statement if there has been a change in the estimates used to determine recoverable amount since the impairment loss was recognised.
(g) Foreign Currency Translation
Functional and Presentation Currency
The consolidated are presented in Australian dollars, which is the Bank’s functional and presentation currency. The functional currency of the Group’s foreign operations (including subsidiaries, branches, associates, and joint ventures) will vary based on the currency of the main economy to which it is exposed.
Foreign Currency Transactions
Foreign currency transactions are translated into the functional currency, using the exchange rates prevailing at the date of each transaction. Monetary assets and liabilities resulting from foreign currency transactions are subsequently translated at the spot rate at reporting date. Exchange differences arising upon settling or translating monetary items at different rates to those at which they were initially recognised or previously reported, are recognised in the Income Statement.
Foreign Operations
Where the Group’s foreign operations do not have an Australian dollar functional currency: assets and liabilities are translated at the prevailing
exchange rate at Balance Sheet date; revenue and expenses are translated at the average
exchange rate for the period (or the prevailing rate at thetransaction date where the average is not a reasonableapproximation); and
all resulting exchange differences are recognised in theforeign currency translation reserve.
When a foreign operation is disposed of, exchange differences are recognised in the Income Statement as part of the gain or loss on disposal. No Group entities have a functional currency of a hyperinflationary economy.
(h) OffsettingIncome and expenses are only offset in the Income Statement if permitted under the relevant accounting standard. Examples of offsetting include gains and losses from foreign exchange exposures and trading operations.
Financial assets and liabilities are offset and the net amount is presented in the Balance Sheet if, and only if, there is a currently enforceable legal right to offset the recognised amounts, and there is an intention to settle on a net basis, or to realise the asset and settle the liability simultaneously.
(i) Fair Value MeasurementFair value is the amount that would be received to sell anasset or paid to transfer a liability in an orderly transactionbetween market participants at the measurement date.Financial assets and liabilities at fair value through IncomeStatement, available-for-sale investments and all derivativeinstruments are initially recognised and subsequentlymeasured at fair value.The fair value for financial instruments traded in active markets at the reporting date is based on their quoted market price or dealer price quotations, without any deduction for transaction costs. Assets and long positions are measured at a quoted bid price; liabilities and short positions are measured at a quoted asking price. Where the Group has positions with offsetting market risks, mid-market prices are used to measure the offsetting risk positions and a quoted bid or asking price adjustment is applied only to the net open position as appropriate. Non-market quoted financial instruments are mostly valued using valuation techniques based on observable inputs, except for a limited number of instances where observable market data is unavailable. In this instance, the financial instrument is initially recognised at the transaction price, which is generally the best indicator of fair value. This may differ from the value obtained from the valuation model. The timing of the recognition in the Income Statement of this initial difference in fair value depends on the individual facts and circumstances of each transaction, but is never later than when the market data becomes observable. The difference may be either amortised over the life of the transaction, recognised when the inputs become observable or on derecognition of the instrument, as appropriate.
Income Statement
(j) Interest IncomeInterest income is brought to account using the effective interest method. The effective interest method calculates the amortised cost of a financial instrument and allocates the interest income or interest expense over the relevant period. The effective interest rate is the rate that discounts estimated future cash payments or receipts through the expected life of the financial instrument or, when appropriate, a shorter period, to the net carrying amount of the financial asset or liability. Fees and transaction costs associated with loans are capitalised and included in the effective interest rate and recognised in the Income Statement, over the expected life of the instrument. Interest income on finance leases is brought to account progressively over the life of the lease, consistent with the outstanding investment and unearned income balance.
(k) Fee and Commission IncomeFees and commissions that relate to the execution of a significant act (for example, advisory or arrangement services, placement fees and underwriting fees) are recognised when the significant act has been completed.
40
Ou
r b
usin
essP
erform
ance
overview
C
orp
orate
respo
nsib
ility C
orp
orate
go
vernan
ceD
irectors’
repo
rtO
ther
info
rmatio
nC
om
mo
nw
ea
lth Ba
nk o
f Au
stralia
An
nu
al Rep
ort 2017
Fin
ancial
repo
rt
6
2
1
3
4
5
7
Notes to the financial statements 95
Note 1 Accounting Policies (continued) Fees charged for providing ongoing services (for example, managing and administering existing facilities and funds) are recognised as income over the service period. Fees and commissions, which include commitment fees to originate a loan that is unlikely to be drawn down, are recognised as fee income as the facility is provided.
(l) Other IncomeTrading income represents both realised and unrealised gains and losses from changes in the fair value of trading assets, liabilities and derivatives. Translation differences on non-monetary items, such as derivatives measured at fair value through the Income Statement, are reported as part of the fair value gain or loss on these items. Translation differences on non-monetary items measured at fair value through equity, such as equities classified as available-for-sale financial assets, are recognised in equity through OCI. Insurance income recognition is outlined in Note 1 (dd).
(m) Interest ExpenseInterest expense on financial liabilities measured at amortised cost is recognised in the Income Statement using the effective interest method. Interest expense includes issue costs that are initially recognised as part of the carrying value of the liability and amortised over the expected life using the effective interest method. These include fees and commissions payable to advisers and other expenses such as external legal costs, provided these are incremental costs that are directly related to the issue of a financial liability. It also includes payments made under a liquidity facility arrangement with the Reserve Bank of Australia and other financing charges.
(n) Operating ExpensesOperating expenses are recognised as the relevant service is rendered or once a liability is incurred. Staff expenses are recognised over the period the employee renders the service to receive the benefit. Staff expenses include share based payments which may be cash or equity settled. The fair value of equity settled remuneration is calculated at grant date and amortised to the Income Statement over the vesting period, with a corresponding increase in the employee compensation reserve. Market vesting conditions, such as share price performance conditions, are taken into account when estimating the fair value. Non–market vesting conditions, such as service conditions, are taken into account by adjusting the number of the equity instruments included in the measurement of the expense. Cash settled share-based remuneration is recognised as a liability and remeasured to fair value until settled, with changes in the fair value recognised as an expense.
Occupancy and equipment expenses include the depreciation and lease rentals that are outlined in Note 1(w) and Note 1(u) respectively.IT expenses are recognised as incurred unless they qualify for capitalisation as an asset due to the related service generating probable future economic benefits. If capitalised the asset is subsequently amortised per Note 1(x).
Taxation
(o) Income Tax ExpenseIncome tax is recognised in the Income Statement, except to the extent that it relates to items recognised directly in OCI, in which case it is recognised in the Statement of Comprehensive Income. Income tax on the profit or loss for the period comprises current and deferred tax.
(p) Current TaxCurrent tax is the expected tax payable on the taxable income for the year, using tax rates enacted at the Balance Sheet date, and any adjustment to tax payable in respect of previous years.
(q) Deferred TaxDeferred tax is calculated using the Balance Sheet method where temporary differences between the carrying amounts of assets and liabilities for financial reporting purposes and their tax base are recognised. The amount of deferred tax provided is based on the expected manner of realisation or settlement of the carrying amount of assets and liabilities (i.e. through use or through sale), using tax rates which are expected to apply when the deferred tax asset is realised or the deferred tax liability is settled. A deferred tax asset is only recognised to the extent that it is probable that future taxable profits will be available for it to be used against. Deferred tax assets and liabilities are offset where they relate to income tax levied by the same taxation authority on either the same taxable entity or different taxable entities within the same taxable group.
(r) The Tax Consolidated GroupTax consolidation legislation allows Australian resident entities to elect to consolidate and be treated as a single entity for Australian tax purposes. The Bank, as the head of the tax consolidated group, and its wholly-owned Australian subsidiaries, elected to be taxed as a single entity under this regime with effect from 1 July 2002. The members of the tax consolidated group have entered into tax funding and tax sharing agreements, which set out the funding obligations of members of the tax consolidated group in respect of tax amounts. Any current tax liabilities/assets and deferred tax assets arising from unused tax losses from subsidiaries are recognised in conjunction with any tax funding arrangement amounts by the Bank legal entity (as the head of the tax consolidated group). The measurement and disclosure of deferred tax assets and liabilities have been performed in accordance with the principles in AASB 112 ‘Income Taxes’, and on a modified standalone basis under UIG 1052 ‘Tax Consolidation Accounting’.
(s) Cash and Liquid AssetsCash and liquid assets include cash at branches, cash at banks, nostro balances, money at short call with an original maturity of three months or less and securities held under reverse repurchase agreements. They are measured at face value, or the gross value of the outstanding balance. Interest is recognised in the Income Statement using the effective interest method.
41

Notes to the financial statements 96
Note 1 Accounting Policies (continued) For the purposes of the Statements of Cash Flows, cash and cash equivalents include cash and money at short call.
(t) Financial AssetsThe Group classifies its financial assets in the following categories: financial assets at fair value through the Income
Statement; derivative assets; loans and receivables; and available-for-sale investments.The classification of financial instruments at initial recognition depends on their purpose, characteristics and management’s intention when acquiring them. Financial instruments, except for loans and receivables, are initially recognised by the Group on the trade date, i.e. the date that the Group becomes a party to the contractual provisions of the instruments. This applies to trades transacted in a regular way, i.e. purchases or sales of financial assets that require delivery of assets within the time frame generally established by regulation or convention in the market place. Loans and receivables are recognised on settlement date, when funding is advanced to the borrowers. Financial assets are initially recognised at their fair value plus directly attributable transaction costs, except in the case of financial assets recorded at fair value through Income Statement. Directly attributable transaction costs on these assets are expensed on subsequent fair value measurement. The Group has not classified any of its financial assets as held to maturity investments.
Financial Assets at Fair Value through the Income Statement
Assets classified at fair value through the Income Statement are further classified into three sub-categories: trading, insurance and other. Trading assets are those acquired or incurred principally for the purpose of selling or repurchasing in the near term, or if they are a part of a portfolio of identified financial instruments that are managed together and for which there is evidence of a recent actual pattern of short-term profit-taking. Discounted bills that the Group intends to sell into the market immediately or in the near term also meet the definition of assets held for trading. Due to their nature, such assets are included in loans, bills discounted and other receivables in the Balance Sheet, while being measured at fair value. Insurance assets are investments that back life insurance contracts and life investment contracts. Refer to Note 1 (ff). Other investments include financial assets, which the Group has designated at fair value through Income Statement at inception to: eliminate an accounting mismatch; reflect they are managed on a fair value basis; or where the asset is a contract which contains an embedded derivative. Subsequent to initial recognition, financial assets are measured at fair value with changes in fair value recognised in other operating income. Dividends earned are recorded in other operating income. Interest earned is recorded within net interest income using the effective interest method.
Derivative Financial Instruments
Derivative financial instruments are contracts whose value is derived from one or more underlying price, index or other variable. They include forward rate agreements, futures, options and interest rate, currency, equity and credit swaps. Derivatives are entered into for trading or hedging purposes. Subsequent to initial recognition, gains or losses on derivatives are recognised in the Income Statement, unless they are entered into for hedging purposes and designated into a cash flow hedge. The Group uses derivatives to manage exposures to interest rate, foreign currency, commodity and credit risks, including exposures arising from forecast transactions. Where derivatives are held for risk management purposes and when transactions meet the required criteria, the Group applies one of three hedge accounting models; fair value hedge accounting, cash flow hedge accounting, or hedging of a net investment in a foreign operation as appropriate to the risks being hedged.
(i) Fair Value HedgesChanges in fair value of derivatives that qualify and are designated as fair value hedges are recorded in the Income Statement, together with changes in the fair value of the hedged asset or liability that are attributable to the hedged risk. The changes in the fair value of the hedged asset or liability shall be adjusted against their carrying value. If the hedge relationship no longer meets the criteria for hedge accounting, it is discontinued. For fair value hedges of interest rate risk, the fair value adjustment to the hedged item is amortised to the Income Statement over the period to maturity of the previously designated hedge relationship using the effective interest method. If the hedged item is sold or repaid, the unamortised fair value adjustment is recognised immediately in the Income Statement.
(ii) Cash Flow HedgesChanges in fair value associated with the effective portion of a derivative designated as a cash flow hedge are recognised through OCI in the Cash Flow Hedge Reserve within equity. Ineffective portions are recognised immediately in the Income Statement. Amounts deferred in equity are transferred to the Income Statement in the period in which the hedged forecast transaction takes place. When a hedging instrument expires or is sold, terminated or exercised, or when the hedge no longer meets the criteria for hedge accounting, any cumulative gain or loss existing in equity at that time remains in equity and is reclassified to profit or loss in the period in which the hedged item affects profit or loss. When a forecast transaction is no longer expected to occur, the cumulative gain or loss that was reported in equity is recycled immediately to the Income Statement. (iii) Net Investment HedgesGains and losses on derivative contracts relating to the effective portion of the net investment hedge are recognised in the foreign currency translation reserve in equity. Ineffective portions are recognised immediately in the Income Statement. Gains and losses accumulated in equity are
42
Ou
r b
usin
essP
erform
ance
overview
C
orp
orate
respo
nsib
ility C
orp
orate
go
vernan
ceD
irectors’
repo
rtO
ther
info
rmatio
nC
om
mo
nw
ea
lth Ba
nk o
f Au
stralia
An
nu
al Rep
ort 2017
Fin
ancial
repo
rt
6
2
1
3
4
5
7
Notes to the financial statements 97
Note 1 Accounting Policies (continued) included in the Income Statement when the foreign subsidiary or branch is disposed of.
(iv) Embedded DerivativesIn certain instances, a derivative may be embedded within a host contract. It is accounted for separately as a stand-alone derivative at fair value, where: the host contract is not carried at fair value through the
Income Statement; and the economic characteristics and risks of the embedded
derivative are not closely related to the host contract.Available-for-Sale Investments Available-for-sale (AFS) investments are non-derivative financial assets that are not classified at fair value through the Income Statement or as loans and receivables. They primarily include public debt securities held as part of the Group’s liquidity holdings. Subsequent to initial recognition, AFS investments are measured at fair value with unrealised gains and losses arising from changes in fair value recognised in the AFS investment reserve within equity, net of applicable income taxes until such investments are sold, collected, otherwise disposed of, or become impaired. Interest, premiums and dividends are recognised in the Income Statement when earned. Foreign exchange gains and losses on AFS equity instruments are recognised directly in equity. The Group assesses at each Balance Sheet date, whether there is any objective evidence of impairment as a result of one or more events which have an impact on the estimated future cash flows of the AFS investments that can be reliably estimated. For equity securities classified as an AFS investment, the main indicators of impairment are significant changes in the market, economic or legal environment and a significant or prolonged decline in fair value below cost. If any such evidence exists for AFS investments, cumulative losses are removed from equity and recognised in the Income Statement. If, in a subsequent period, the fair value of an AFS debt security increases and the increase can be linked objectively to an event occurring after the impairment event, the impairment is reversed through the Income Statement. Impairment losses on AFS equity securities are not reversed. Upon disposal, the accumulated change in fair value within the AFS investments reserve is transferred to the Income Statement and reported within other operating income. Loans, Bills Discounted and Other Receivables Loans, bills discounted and other receivables are non-derivative financial assets, with fixed and determinable payments that are not quoted in an active market. Loans, bills discounted and other receivables include overdrafts, home loans, credit card and other personal lending, term loans, bill financing, redeemable preference shares, securities, finance leases, and receivables due from other financial institutions (including loans, deposits with regulatory authorities and settlement account balances due from other banks). Subsequent to initial recognition, loans and receivables are measured at amortised cost using the effective interest method and are presented net of provisions for impairment. Discounted bills included in this category due to their nature meet the definition of trading asset. They are
measured at fair value through Income Statement in line with the accounting policy for assets held for trading. The Group assesses at each Balance Sheet date whether there is any objective evidence of impairment. If there is objective evidence that an impairment loss on loans and other receivables has been incurred, the amount of the loss is measured as the difference between the asset's carrying amount and the present value of the estimated future cash flows (excluding future credit losses that have not been incurred), discounted at the financial asset's original effective interest rate. Short-term balances are not discounted. Loans and other receivables are presented net of provisions for loan impairment. The Group has individually and collectively assessed provisions. Individually assessed provisions are made against financial assets that are individually significant, or which have been individually assessed as impaired. Individual provisions for impairment are recognised to reduce the carrying amount of non-performing facilities to the present value of their expected future cash flows. Individually significant provisions are calculated based on discounted cash flows. The unwinding of the discount, from initial recognition of impairment through to recovery of the written down amount, is recognised as interest income. In subsequent periods, interest in arrears/due on non-performing facilities is recognised in the Income Statement using the original effective interest rate. All loans and other receivables that do not have an individually assessed provision are assessed collectively for impairment. Collective provisions are maintained to reduce the carrying amount of portfolios of similar loans and advances to the present value of their expected future cash flows at the Balance Sheet date. The expected future cash flows for portfolios of assets with similar credit risk characteristics are estimated on the basis of historical loss experience. Loss experience is adjusted on the basis of current observable data to reflect the effects of current conditions that did not affect the period on which the loss experience is based and to remove the effects of conditions in the period that do not currently exist. Increases or decreases in the provision amount are recognised in the Income Statement.
Derecognition of Financial Assets and Financial Liabilities
The Group derecognises financial assets when the rights to receive cash flows from the asset have expired or when the Group transfers its rights to receive cash flows from the asset together with substantially all the risks and rewards of the asset. The Group enters into certain transactions where it transfers financial assets recognised on its Balance Sheet but retains either all or a majority of the risks and rewards of the transferred financial assets If all or substantially all risks and rewards are retained, the transferred financial assets are not derecognised from the Balance Sheet. Transactions where transfers of financial assets result in the Group retaining all or substantially all risks and rewards include reverse repurchase transactions and some of the Group’s securitisation and covered bonds programs.
43
Notes to the financial statements 98
Note 1 Accounting Policies (continued) A financial liability is derecognised when the obligation under the liability is discharged, cancelled or expires. Where an existing financial liability is replaced by another from the same lender on substantially different terms, or the terms of an existing liability are substantially modified, such an exchange or modification is treated as a derecognition of the original liability and the recognition of a new liability. The difference in the respective carrying amounts is recognised in the Income Statement.
Repurchase and Reverse Repurchase Agreements
Securities sold under repurchase agreements are retained in the Financial Statements where substantially all the risks and rewards of ownership remain with the Group. A counterparty liability is recognised within deposits and public borrowings. The difference between the sale price and the repurchase price is accrued over the life of the repurchase agreement and charged to interest expense in the Income Statement. Securities purchased under agreements to resell, where the Group does not acquire the risks and rewards of ownership, are recorded as receivables in cash and liquid assets. The security is not included in the Balance Sheet as the Group is not exposed to substantially all its risks and rewards. Interest income is accrued on the underlying receivable amount.
Provision for Off Balance Sheet Items
Guarantees and other contingent liabilities are accounted for as off Balance Sheet items. Provisioning for these exposures is calculated under AASB 137 ‘Provisions, Contingent Liabilities and Contingent Assets’. Loan assets under committed lending facilities are not recognised until the facilities are drawn upon. The Group has determined that it is appropriate to establish provisions in relation to such facilities where a customer has been downgraded. These provisions are disclosed as other liabilities in the Balance Sheet.
(u) Lease ReceivablesLeases are classified as either finance or operating leases. Under a finance lease, substantially all the risks and rewards incidental to legal ownership are transferred to the lessee. Under an operating lease, these risks remain with the lessor. As a lessor, the assets the Group has leased out under finance leases are recognised as lease receivables on the Balance Sheet at an amount equal to the net investment in the lease. Finance lease income reflects a constant periodic return on this net investment and is recognised within interest income in the Income Statement. The assets the Group has leased out under operating leases continue to be recognised on the Balance Sheet as property, plant and equipment and are depreciated accordingly. Operating lease revenue is recognised in the Income Statement on a straight line basis over the lease term. As a lessee, rental expense is recognised on a straight line basis over the lease term.
(v) Shares in and Loans to Controlled EntitiesInvestments in controlled entities are initially recorded at cost and subsequently held at the lower of cost and recoverable amount. Loans to controlled entities are subsequently recorded at amortised cost less impairment.
(w) Property, Plant and EquipmentThe Group measures its property assets (land and buildings) at fair value, based on annual independent market valuations. Revaluation adjustments are reflected in the asset revaluation reserve, except to the extent they reverse a revaluation decrease of the same asset previously recognised in the Income Statement. Upon disposal, realised amounts in the asset revaluation reserve are transferred to retained profits. Other property, plant and equipment assets are stated at cost, including direct and incremental acquisition costs less accumulated depreciation and impairment if required. Subsequent costs are capitalised where it enhances the asset. Depreciation is calculated using the straight line method over the asset’s estimated useful economic life. The useful lives of major depreciable asset categories are as follows:
Land Indefinite (not depreciated)
Buildings Up to 30 years
Equipment 3 – 8 years
Leasehold improvements Lesser of unexpired lease term or lives as above
Assets under lease Aircraft Rail ShipsOther property, plant and equipment Infrastructure assets
25 years 35 – 40 years 25 – 40 years
50 – 100 years
The Group assesses at each Balance Sheet date useful lives and residual values and whether there is any objective evidence of impairment. If an asset’s carrying value is greater than its recoverable amount, the carrying amount is written down immediately to its recoverable amount.
(x) Intangible AssetsIntangible assets are identifiable non-monetary assets without physical substance. They are recognised only if it is probable the asset will generate future benefits for the Group. Those assets with an indefinite useful life are tested for impairment annually. All intangible assets must be tested for impairment when there is an indication that its carrying amount may be greater than its recoverable amount.
Goodwill
Goodwill arising from business combinations is included in intangible assets on the Balance Sheet and has an indefinite useful life. Goodwill is tested for impairment annually through allocation to a group of Cash Generating Units (CGUs). The CGUs’ recoverable amount is then compared to its carrying amount and an impairment is recognised for any excess carrying value. The CGUs and how their recoverable amount is calculated are listed in Note 15.
44
Ou
r b
usin
essP
erform
ance
overview
C
orp
orate
respo
nsib
ility C
orp
orate
go
vernan
ceD
irectors’
repo
rtO
ther
info
rmatio
nC
om
mo
nw
ea
lth Ba
nk o
f Au
stralia
An
nu
al Rep
ort 2017
Fin
ancial
repo
rt
6
2
1
3
4
5
7
Notes to the financial statements 99
Note 1 Accounting Policies (continued) Computer Software Costs
Certain internal and external costs directly incurred in acquiring and developing software, net of specific project related grants, are capitalised and amortised over the estimated useful life. The majority of software projects are amortised over two to five years. The Core Banking Modernisation software project is amortised over ten years. Software maintenance is expensed as incurred.
Core Deposits
Core deposits were initially recognised at fair value following the acquisition of Bankwest and represent the value of the deposit base acquired. Core deposits are amortised over their estimated useful life of seven years. The core deposits were fully amortised in the year ended 30 June 2016.
Brand Names
Brand names are initially recognised at fair value when acquired in a business combination. Brand names are amortised over their useful life, which is considered to be similar to the period of the brand name’s existence at the time of purchase. Where the brand name is assessed to have an indefinite useful life, it is carried at cost less accumulated impairment. An indefinite useful life is considered appropriate when there is no foreseeable limit to the period over which the brand name is expected to generate cash flows.
Other Intangibles
Other intangibles predominantly comprise customer lists. Customer relationships acquired as part of a business combination are initially measured at fair value. They are subsequently measured at cost less accumulated amortisation and any impairment losses. Amortisation is calculated based on the timing of projected cash flows of the relationships over their estimated useful lives.
Liabilities
(y) Financial LiabilitiesThe Group classifies its financial liabilities in the following categories: liabilities at fair value through Income Statement; liabilities at amortised cost; and derivative liabilities (refer to Note 1(t)).Financial liabilities are initially recognised at their fair value less directly attributable transaction costs, except in the case of financial liabilities recorded at fair value through Income Statement. Directly attributable transaction costs on these liabilities are expensed on subsequent fair value measurement.
Liabilities at Fair Value through Income Statement
The Group designates certain liabilities at fair value through Income Statement on origination where those liabilities are managed on a fair value basis, where the liabilities eliminate an accounting mismatch, or where they contain embedded derivatives. Subsequent to initial recognition, these liabilities are measured at fair value. Changes in fair value relating to the Group’s own credit risk are recognised in other comprehensive income, with the remaining fair value movement recognised in other operating income. Interest incurred is recorded within net interest income using the effective interest method.
Liabilities at Amortised Cost
(i) Deposits From CustomersDeposits from customers include certificates of deposit, term deposits, savings deposits, other demand deposits and debentures. Subsequent to initial recognition, they are measured at amortised cost. Interest and yield related fees are recognised on an effective interest basis.
(ii) Payables Due to Other Financial InstitutionsPayables due to other financial institutions include deposits, vostro balances and settlement account balances due to other banks. Subsequent to initial recognition, they are measured at amortised cost. Interest and yield related fees are recognised using the effective interest method.
(iii) Debt IssuesDebt issues are short and long-term debt issues of the Group, including commercial paper, notes, term loans and medium term notes. Commercial paper, floating, fixed and structured debt issues are recorded at amortised cost using the effective interest method. Premiums, discounts and associated issue expenses are recognised in the Income Statement using the effective interest method from the date of issue, to ensure that securities attain their redemption values by maturity date. Interest is recognised in the Income Statement using the effective interest method. Any profits or losses arising from redemption prior to maturity are taken to the Income Statement in the period in which they are realised. The Group hedges interest rate and foreign currency risk on certain debt issues. When fair value hedge accounting is applied to fixed rate debt issues, the carrying values are adjusted for changes in fair value related to the hedged risks, rather than carried at amortised cost. (iv) Loan CapitalLoan capital is debt issued by the Group with terms and conditions that qualify for inclusion as capital, under APRA Prudential Standards. It is initially recorded at fair value, plus directly attributable transaction costs and thereafter at amortised cost using the effective interest method.
(v) Bank Acceptances of Customers - LiabilityThese are bills of exchange initially accepted and discounted by the Group and subsequently sold into the market. They are recognised at amortised cost. The market exposure is recognised as a liability. An asset of equal value is recognised to reflect the offsetting claim against the drawer of the bill.
Bank acceptances generate interest and fee income that is recognised in the Income Statement when earned.
(vi) Financial Guarantees and Credit CommitmentsIn the ordinary course of business, the Group gives financial guarantees consisting of letters of credit, guarantees and acceptances. Financial guarantees are recognised within other liabilities initially at fair value, being the premium received. Subsequent to initial recognition, the Group’s liability under each guarantee is measured at the higher of the amount initially recognised less cumulative amortisation recognised in the Income Statement, and the best estimate of expenditure required to settle any financial obligation arising
45
Notes to the financial statements 100
Note 1 Accounting Policies (continued) as a result of the guarantee. Any increase in the liability relating to financial guarantees is recorded in the Income Statement. The premium received is recognised in the Income Statement in other operating income on a straight line basis over the life of the guarantee. Loan commitments are defined amounts (unutilised credit lines or undrawn portions of credit lines) against which clients can borrow money under defined terms and conditions. Loan commitments that are cancellable by the Group are not recognised on the Balance Sheet. Upon a loan drawdown by the counterparty, the amount of the loan is accounted for in accordance with accounting policies for loans and receivables. Irrevocable loan commitments are not recorded in the Balance Sheet, but a provision is recognised if it is probable that a loss has been incurred and a reliable estimate of the amount can be made.
(z) Employee Benefits
Annual Leave
The provision for annual leave represents the current outstanding liability to employees for annual leave entitlements at Balance Sheet date.
Long Service Leave
The provision for long service leave is discounted to present value and is set based on actuarial assumptions. The assumptions and provision balance are subject to periodic review.
Other Employee Benefits
Other employee entitlements comprises liabilities to a registered health fund for subsidies with respect to retired and current employees, and employee incentives under employee share plans and bonus schemes.
Defined Benefit Superannuation Plans
The Group currently sponsors two defined benefit superannuation plans for its employees. The net defined benefit liability or asset recognised in the Balance Sheet is the present value of the defined benefit obligation as at the Balance Sheet date less the fair value of plan assets. The defined benefit obligation is calculated by independent fund actuaries. In each reporting period, the movement in the net defined benefit liability or asset is recognised as follows: The net movement relating to the current period service
cost, net interest cost (income), past service and othercosts (such as the effects of any curtailments andsettlements) is recognised as an employee expense inthe Income Statement;
Remeasurements relating to actuarial gains and lossesand the difference between interest income and thereturn on plan assets are recognised directly in retainedprofits through OCI;
Contributions made by the Group are recognised directlyagainst the net defined benefit liability or asset; and
Net interest cost (income) is determined by multiplyingthe rate of high quality corporate bonds by the netdefined benefit obligation (asset) at the beginning of thereporting period and adjusted for changes in the netdefined benefit liability (asset) due to contributions andbenefit payments.
Defined Contribution Superannuation Plans
The Group sponsors a number of defined contribution superannuation plans. The Group recognises contributions due in respect of the accounting period in the Income Statement. Any contributions unpaid at the Balance Sheet date are included as a liability.
(aa) Provisions Provisions are recognised when a probable obligation has arisen as a result of a past event that can be reliably measured. Note 19 Other Provisions contains a description of provisions held.
Equity
(bb) Shareholders’ Equity Ordinary shares are recognised at the amount paid up per ordinary share, net of directly attributable issue costs. Where the Bank or other members of the Group purchase shares in the Bank, the consideration paid is deducted from total Shareholders’ Equity and the shares are treated as treasury shares until they are subsequently sold, reissued or cancelled. Where such shares are sold or reissued, any consideration received is included in Shareholders’ Equity.
(cc) Reserves
General Reserve
The general reserve is derived from revenue profits and is available for dividend payments except for undistributable profits in respect of the Group’s life insurance businesses.
Capital Reserve
The capital reserve held by the Bank relates to historic internal Group restructuring performed at fair value. The capital reserve is eliminated on consolidation.
Asset Revaluation Reserve
The asset revaluation reserve is used to record revaluation adjustments on the Group’s property assets. Where an asset is sold or disposed of, any balance in the reserve in relation to the asset is transferred directly to retained profits.
Foreign Currency Translation Reserve
Exchange differences arising on translation of the Group’s foreign operations are accumulated in the foreign currency translation reserve. The cumulative amount is reclassified to profit or loss when the foreign investment is disposed of or wound up.
Cash Flow Hedge Reserve
The cash flow hedge reserve is used to record fair value gains or losses associated with the effective portion of designated cash flow hedging instruments. Amounts are reclassified to profit or loss when the hedged transaction impacts profit or loss.
Employee Compensation Reserve
The employee compensation reserve is used to recognise the fair value of shares and other equity instruments issued to employees under the employee share plans and bonus schemes.
46
Ou
r b
usin
essP
erform
ance
overview
C
orp
orate
respo
nsib
ility C
orp
orate
go
vernan
ceD
irectors’
repo
rtO
ther
info
rmatio
nC
om
mo
nw
ea
lth Ba
nk o
f Au
stralia
An
nu
al Rep
ort 2017
Fin
ancial
repo
rt
6
2
1
3
4
5
7
Notes to the financial statements 101
Note 1 Accounting Policies (continued) Available-for-Sale Investment Reserve
The available-for-sale investment reserve includes changes in the fair value of available-for-sale financial assets. These changes are transferred to profit or loss when the asset is derecognised or impaired.
Life and General Insurance Business
The Group’s consolidated Financial Statements include the assets, liabilities, income and expenses of the life and general insurance businesses conducted by various subsidiaries of the Bank. Insurance contracts involve the acceptance of significant insurance risk from another party (the policyholder) by agreeing to compensate the policyholder if a specified uncertain future event adversely affects the policyholder. The insured benefit is either not linked or only partly linked to the market value of the investments held, and the financial risks are substantially borne by the insurer. General insurance contracts are insurance contracts that are not life insurance contracts. Life investment contracts involve the origination of one or more financial instruments and may involve the provision of management services. Life investment contracts do not meet the definition of insurance contracts as they do not involve an acceptance of significant insurance risk by the Group’s life insurers. The financial risks are substantially borne by the policyholder. Shareholders can only receive a distribution when the capital adequacy requirements of the Life Insurance Act 1995 (Life Act) are met.
(dd) RevenueLife insurance premiums received for providing services and bearing risks are recognised as revenue. Premiums with a regular due date are recognised as revenue on a due and receivable basis. Premiums with no due date are recognised on a cash received basis. Life investment premiums comprise a management fee, which is recognised as revenue over the service period, and a deposit portion that increases investment contract liabilities. Premiums with no due date are recognised on a cash received basis. General insurance premium comprises amounts charged to policyholders, including fire service levies, but excludes taxes collected on behalf of third parties. The earned portion of premiums received and receivable is recognised as revenue. Premium revenue is earned from the date of attachment of risk and over the term of the policies written, based on actuarial assessment of the likely pattern in which risk will emerge. The portion not yet earned based on the pattern assessment is recognised as unearned premium liability. Returns on all investments controlled by life and general insurance businesses are recognised as revenue.
(ee) Expenses Life and general insurance contract claims are recognised as an expense when a liability has been established. Acquisition costs (which include commission costs) are the costs associated with obtaining and recording insurance contracts. Acquisition costs are deferred when they relate to the acquisition of new business. These costs are amortised on the same basis as the earning pattern of the premium, over the life of the contract. The amount deferred is limited to
the extent that they are deemed recoverable from the expected future profits.
(ff) Investment Assets Assets backing insurance liabilities are carried at fair value through Income Statement. Investments held in the life insurance funds are subject to the restrictions imposed under the Life Act.
(gg) Policy Liabilities Life insurance contract liabilities are measured at the net present value of future receipts from and payments to policyholders using a risk free discount rate (or expected fund earning rate where benefits are contractually linked to the asset performance), and are calculated in accordance with the principles of Margin on Services profit reporting as set out in Prudential Standard LPS 340 ‘Valuation of Policy Liabilities’ issued by APRA. Life investment contract liabilities are measured at fair value. The balance is no less than the contract surrender value. General insurance policy liabilities comprise two components: unearned premium liability and outstanding claims liability. The unearned premium liability is subject to a liability adequacy test. Any deficiency will be recognised as an expense in the Income Statement by first writing down any related deferred acquisition costs, with any excess being recorded on the Balance Sheet as an unexpired risk liability. The provision for outstanding claims is measured as the central estimate of the present value of expected future claims payments plus a risk margin. The expected future payments include those in relation to claims reported but not yet paid; claims incurred but not reported; claims incurred but not enough reported; and estimated claims handling costs.
Other
(hh) Managed Funds Units on Issue When a controlled unit trust is consolidated, any amounts due to external unit-holders remain as managed funds units on issue liabilities in the Group’s consolidated Balance Sheet. In the Income Statement, the net profit or loss of the controlled entities relating to external unit-holders is excluded from the Group’s net profit or loss.
(ii) Asset SecuritisationThe Group packages and sells asset backed securities to investors through an asset securitisation program.
The Group is entitled to any residual income of the program after all payments due to investors and costs of the program have been met. The Group also directs any decisions over relevant activities of the program and therefore controls the entities through which asset securitisation is conducted and so it consolidates these entities.
Liabilities associated with asset securitisation entities and related issue costs are accounted for on an amortised cost basis using the effective interest method. Interest rate swaps and liquidity facilities are provided at arm’s length to the program by the Group in accordance with APRA Prudential Guidelines. Derivatives return the risks and rewards of ownership of the securitised assets to the Group, resulting in their continued
47
Notes to the financial statements 102
Note 1 Accounting Policies (continued) recognition by the Group. An imputed borrowing is recognised by the Bank inclusive of the derivative and any related fees.
(jj) Fiduciary Activities Certain controlled entities within the Group act as Responsible Entity, Trustee and/or Manager for a number of wholesale, superannuation and investment funds, trusts and approved deposit funds. The assets and liabilities of these trusts and funds are not included in the consolidated Financial Statements as the Group does not have direct or indirect control of the trusts and funds. Commissions and fees earned in respect of the activities are included in the Income Statement of the Group.
Critical Judgements and Estimates
The application of the Group’s accounting policies requires the use of judgement, estimates and assumptions. The estimates and associated assumptions are based on historical experience and other factors that are considered to be relevant, and are reviewed on an ongoing basis. Actual results may differ from these estimates, which could impact the Group’s net assets and profit.
(kk) Provisions for Impairment of Financial Assets Provisions for impairment of financial assets are raised where there is objective evidence of impairment (where the Group does not expect to receive all of the cashflows contractually due) at an amount adequate to cover assessed credit related losses. Financial assets are either individually or collectively assessed. Credit losses arise primarily from loans, but also from other credit instruments such as bank acceptances, contingent liabilities, guarantees and other financial instruments.
Individually Assessed Provisions
Individually assessed provisions are made against financial assets that are individually significant, or which have been individually assessed as impaired. The provisions are established based primarily on estimates of the realisable (fair) value of collateral taken and are measured as the difference between a financial asset’s carrying amount and the present value of the expected future cash flows (excluding future credit losses that have not been incurred), discounted at the financial asset’s original effective interest rate. Short-term balances are not discounted.
Collective Provisions
Loans and receivables that do not have an individually assessed provision are assessed collectively for impairment. The collective provision is maintained to reduce the carrying amount of portfolios of similar loans and receivables to their estimated recoverable amounts at the Balance Sheet date. The evaluation process is subject to a series of estimates and judgements. In the risk rated segment, the risk rating system, including the frequency of default and loss given default rates, loss history, and the size, structure and diversity of individual borrowers are considered. Current developments in portfolios (industry, geographic and term) are reviewed. In the statistically managed (retail) segment, the history of defaults and losses, and the size, structure and diversity of portfolios are considered. Management also considers overall indicators of portfolio performance, quality and economic conditions.
Changes in these estimates could have a direct impact on the level of provision determined.
(ll) Provisions (Other than Loan Impairment)Provisions are held in respect of a range of future obligations as outlined in Note 19. Some of the provisions involve significant judgement about the likely outcome of various events and estimated future cash flows. The measurement of these obligations involves the exercise of management judgements about the ultimate outcomes of the transactions. Payments which are expected to be incurred later than one year are discounted at a rate which reflects both current interest rates and the risks specific to that provision.
(mm) Life Insurance Policyholder LiabilitiesThe determination of life insurance policyholder liabilities involves the following key actuarial assumptions: Business assumptions including amount, timing and
duration of claims/policy payments, policy lapse ratesand acquisition and maintenance expense levels;
Long-term economic assumptions for discount, interest,inflation and market earnings rates; and
Determining whether the projection or accumulationmethod is appropriate. The selection of the method isgenerally governed by the product type.
The determination of assumptions relies on making judgements on variances from long-term assumptions. Where experience differs from long-term assumptions: Recent results may be a statistical aberration; or There may be a commencement of a new paradigm
requiring a change in long-term assumptions.The Group’s actuaries arrive at conclusions regarding the statistical analysis using their experience and judgement. Further detail on the financial position on performance of the Group’s Life Insurance operations is set out in Note 27.
(nn) Consolidation of Structured Entities The Group exercises judgement at inception and periodically thereafter, to assess whether that structured entity should be consolidated based on the Bank’s power over the relevant activities of the entity and the significance of its exposure to variable returns of the structured entity. Such assessments are predominantly required for the Group’s securitisation program, structured transactions and involvement with investment funds.
(oo) Financial Instruments at Fair Value A significant portion of financial instruments are carried at fair value on the Balance Sheet.
The best evidence of fair value is quoted prices in an active market. If the market for a financial instrument is not active, the Group establishes fair value by using a valuation technique. The objective of using a valuation technique is to establish what the transaction price would have been on the measurement date in an arm’s length exchange motivated by normal business considerations.
48
Ou
r b
usin
essP
erform
ance
overview
C
orp
orate
respo
nsib
ility C
orp
orate
go
vernan
ceD
irectors’
repo
rtO
ther
info
rmatio
nC
om
mo
nw
ea
lth Ba
nk o
f Au
stralia
An
nu
al Rep
ort 2017
Fin
ancial
repo
rt
6
2
1
3
4
5
7
Notes to the financial statements 103
Note 1 Accounting Policies (continued) Valuation techniques include using recent arm’s length market transactions between knowledgeable willing parties (if available), reference to the current fair value of substantially similar instruments’ discounted cash flow analysis and option pricing models. If there is a valuation technique commonly used by market participants to price the instrument and that technique has been demonstrated to provide reliable estimates of prices obtained in actual market transactions, the Group uses that technique. The chosen valuation technique makes maximum use of market inputs and relies as little as possible on entity specific inputs. It incorporates all factors that the Group believes market participants would consider in setting a price and is consistent with accepted economic methodologies for pricing financial instruments. Data inputs that the Group relies upon when valuing financial instruments relate to counterparty credit risk, volatility, correlation and extrapolation. Periodically, the Group calibrates its valuation techniques and tests them for validity using prices from any observable current market transactions in the same instrument (i.e. without modification or repackaging) and any other available observable market data. Note 40 includes details of non-observable inputs used to fair value financial instruments.
(pp) Goodwill Goodwill is allocated to CGUs whose recoverable amount is calculated for the purpose of impairment testing. The recoverable amount calculation relies primarily on publicly available earnings multiples. Note 15 includes the details of the inputs used in recoverable amount calculations.
(qq) Taxation Provisions for taxation require significant judgement with respect to outcomes that are uncertain. For such uncertainties, the Group has estimated its tax provisions based on its expected outcomes.
(rr) Superannuation Obligations The Group’s defined benefit plans are described in Note 35. Actuarial valuations of the plan’s obligations and fair value of the plan’s assets are performed semi-annually. The actuarial valuation of plan obligations is dependent upon a series of assumptions, including price inflation, discount rates, salary growth, mortality, morbidity and investment returns assumptions. Different assumptions could significantly alter the difference between plan assets and obligations, and the superannuation cost charged. Future Accounting Developments AASB 9 ‘Financial Instruments’ introduces an ‘expected credit loss’ model, revised classification and measurement requirements and modified hedge accounting rules. AASB 9 is not mandatorily effective until 1 July 2018 and the Group does not intend to early adopt the standard.
Impairment
AASB 9 expected credit loss model replaces the existing incurred loss model requirement to recognise impairment when there is objective evidence of default. It requires entities to recognise expected credit losses based on unbiased forward looking information. The key changes under AASB 9 are as follows: AASB 9 requires more timely recognition of expected credit losses using a three stage approach. For financial assets
where there has been no significant increase in credit risk since origination, a provision equivalent to 12 months expected credit losses is recognised. For financial assets where there has been a significant increase in credit risk or where the asset is credit impaired, a provision equivalent to full lifetime expected loss is required. Expected credit losses are probability weighted amounts determined by evaluating a range of possible outcomes and taking into account the time value of money, past events, current conditions and forecasts of future economic conditions.
Classification and measurement
AASB 9 replaces the classification and measurement requirements in AASB 139 with the approach that classifies financial assets based on a business model for managing financial assets and whether the contractual cash flows represent solely payments of principal and interest. Financial assets can be classified as financial assets at amortised cost, financial assets at fair value through profit or loss or financial assets at fair value through OCI. Non-traded equity instruments can be measured at fair value through OCI.
Hedging
AASB 9 will change hedge accounting by introducing more principal based approach to hedge effectiveness testing and by increasing eligibility of both hedge instruments and hedged items. Adoption of the new hedge accounting model is optional and current hedge accounting under AASB 139 can continue to apply until the IASB completes its accounting for dynamic risk management project. The Group will apply the new hedge accounting requirements from 1 July 2018. A Group-wide program has been in progress to implement AASB 9 requirements. It is not practical to disclose a financial impact until the implementation program is further advanced and reliable estimates of the impact are available. AASB 15 ‘Revenue from Contracts with Customers’ introduces a single model for the recognition of revenue based on when control of goods and services transfers to a customer. It does not apply to financial instruments. AASB 15 is not mandatory until 1 July 2018 for the Group. AASB 16 ‘Leases’ amends the accounting for leases. Lessees will be required to bring all leases on Balance Sheet as the distinction between operating and finance leases has been eliminated. Lessor accounting remains largely unchanged. AASB 16 is not mandatory until 1 July 2019 for the Group. AASB 17 ‘Insurance Contracts’ introduces three new measurement approaches for accounting for insurance contracts. These include the Building Block Approach for long term contracts; the Premium Allocation Approach for short term contracts and a Variable Fee Approach for direct participating contracts. In addition, the level of contract aggregration is likely to be lower than under current practices. AASB 17 is not mandatory until 1 July 2021 for the Group. The potential financial impacts of the above to the Group have not yet been determined. The Group does not intend to early adopt these standards. Other amendments to existing standards that are not yet effective are not expected to result in significant changes to the Group’s accounting policies.
49
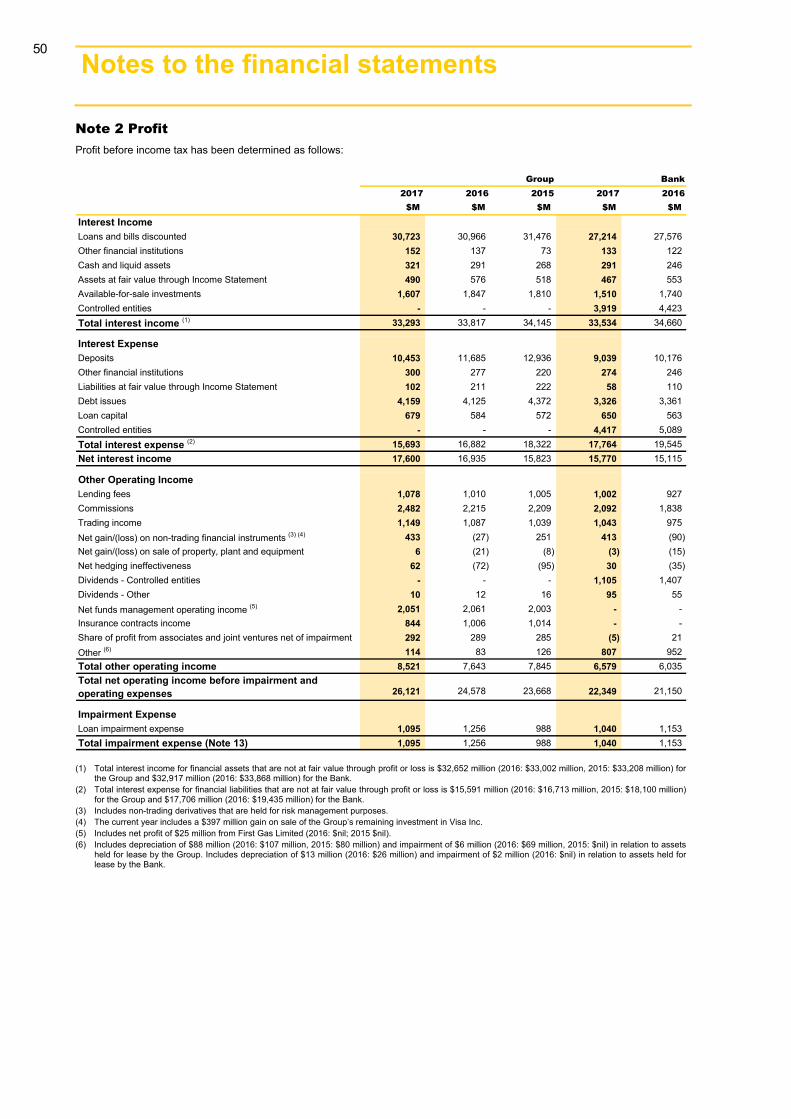
Notes to the financial statements 104
Note 2 Profit Profit before income tax has been determined as follows:
Group Bank2017 2016 2015 2017 2016
$M $M $M $M $M
Interest IncomeLoans and bills discounted 30,723 30,966 31,476 27,214 27,576Other financial institutions 152 137 73 133 122Cash and liquid assets 321 291 268 291 246Assets at fair value through Income Statement 490 576 518 467 553Available-for-sale investments 1,607 1,847 1,810 1,510 1,740Controlled entities - - - 3,919 4,423Total interest income (1) 33,293 33,817 34,145 33,534 34,660
Interest ExpenseDeposits 10,453 11,685 12,936 9,039 10,176Other financial institutions 300 277 220 274 246Liabilities at fair value through Income Statement 102 211 222 58 110Debt issues 4,159 4,125 4,372 3,326 3,361Loan capital 679 584 572 650 563Controlled entities - - - 4,417 5,089Total interest expense (2) 15,693 16,882 18,322 17,764 19,545Net interest income 17,600 16,935 15,823 15,770 15,115
Other Operating IncomeLending fees 1,078 1,010 1,005 1,002 927Commissions 2,482 2,215 2,209 2,092 1,838Trading income 1,149 1,087 1,039 1,043 975Net gain/(loss) on non-trading financial instruments (3) (4) 433 (27) 251 413 (90)Net gain/(loss) on sale of property, plant and equipment 6 (21) (8) (3) (15)Net hedging ineffectiveness 62 (72) (95) 30 (35)Dividends - Controlled entities - - - 1,105 1,407Dividends - Other 10 12 16 95 55Net funds management operating income (5) 2,051 2,061 2,003 - -Insurance contracts income 844 1,006 1,014 - -Share of profit from associates and joint ventures net of impairment 292 289 285 (5) 21Other (6) 114 83 126 807 952Total other operating income 8,521 7,643 7,845 6,579 6,035Total net operating income before impairment and operating expenses 26,121 24,578 23,668 22,349 21,150
Impairment ExpenseLoan impairment expense 1,095 1,256 988 1,040 1,153Total impairment expense (Note 13) 1,095 1,256 988 1,040 1,153
(1) Total interest income for financial assets that are not at fair value through profit or loss is $32,652 million (2016: $33,002 million, 2015: $33,208 million) forthe Group and $32,917 million (2016: $33,868 million) for the Bank.
(2) Total interest expense for financial liabilities that are not at fair value through profit or loss is $15,591 million (2016: $16,713 million, 2015: $18,100 million)for the Group and $17,706 million (2016: $19,435 million) for the Bank.
(3) Includes non-trading derivatives that are held for risk management purposes.(4) The current year includes a $397 million gain on sale of the Group’s remaining investment in Visa Inc. (5) Includes net profit of $25 million from First Gas Limited (2016: $nil; 2015 $nil).(6) Includes depreciation of $88 million (2016: $107 million, 2015: $80 million) and impairment of $6 million (2016: $69 million, 2015: $nil) in relation to assets
held for lease by the Group. Includes depreciation of $13 million (2016: $26 million) and impairment of $2 million (2016: $nil) in relation to assets held for lease by the Bank.
50

Ou
r b
usin
essP
erform
ance
overview
C
orp
orate
respo
nsib
ility C
orp
orate
go
vernan
ceD
irectors’
repo
rtO
ther
info
rmatio
nC
om
mo
nw
ea
lth Ba
nk o
f Au
stralia
An
nu
al Rep
ort 2017
Fin
ancial
repo
rt
6
2
1
3
4
5
7
Notes to the financial statements 105
Note 2 Profit (continued)
Group Bank2017 2016 2015 2017 2016
$M $M $M $M $M
Staff ExpensesSalaries and related on-costs (1) 5,652 5,657 5,331 4,112 4,128Share-based compensation 122 102 96 118 99Superannuation 494 410 399 388 316Total staff expenses 6,268 6,169 5,826 4,618 4,543
Occupancy and Equipment ExpensesOperating lease rentals 661 650 620 572 564Depreciation of property, plant and equipment 288 266 253 237 221Other occupancy expenses 190 218 213 155 171Total occupancy and equipment expenses 1,139 1,134 1,086 964 956
Information Technology ServicesApplication maintenance and development 512 511 430 455 450Data processing 210 197 183 209 197Desktop 188 143 110 173 132Communications 193 203 190 173 180Amortisation of software assets (2) 779 379 308 724 333Software write-offs 6 1 11 6 -IT equipment depreciation 53 51 60 51 47Total information technology services 1,941 1,485 1,292 1,791 1,339
Other ExpensesPostage and stationery 187 192 195 168 171Transaction processing and market data 186 179 153 130 129Fees and commissions:
Professional fees 404 247 390 367 209Other 76 93 97 346 353
Advertising, marketing and loyalty 437 491 522 380 392Amortisation of intangible assets (excluding software and merger related amortisation) 11 14 16 - -
Non-lending losses 125 103 118 115 74Other 304 327 308 301 333Total other expenses 1,730 1,646 1,799 1,807 1,661Total expenses 11,078 10,434 10,003 9,180 8,499
Investment and RestructuringMerger related amortisation (3) 4 39 75 4 39Total investment and restructuring 4 39 75 4 39
Total operating expenses 11,082 10,473 10,078 9,184 8,538
Profit before income tax 13,944 12,849 12,602 12,125 11,459
Net hedging ineffectiveness comprises:Gain/(loss) on fair value hedges:
Hedging instruments 841 (709) (568) 1,862 (1,409)Hedged items (799) 642 493 (1,829) 1,369
Cash flow and net investment hedge ineffectiveness 20 (5) (20) (3) 5Net hedging ineffectiveness 62 (72) (95) 30 (35)
(1) Comparative information has been restated to reflect the change in accounting policy detailed in Note 1. (2) The current year includes a $393 million one-off expense for acceleration of amortisation on certain software assets. (3) Merger related amortisation relates to Bankwest core deposits and customer lists.
51
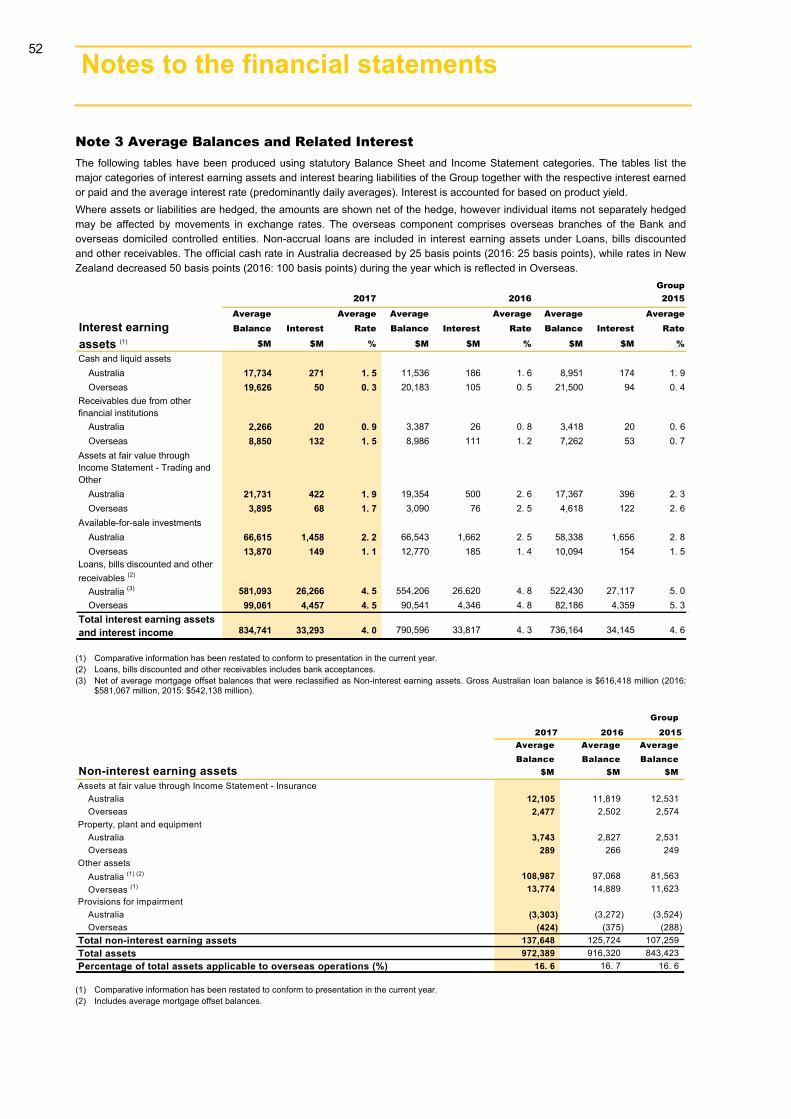
Notes to the financial statements 106
Note 3 Average Balances and Related Interest The following tables have been produced using statutory Balance Sheet and Income Statement categories. The tables list the major categories of interest earning assets and interest bearing liabilities of the Group together with the respective interest earned or paid and the average interest rate (predominantly daily averages). Interest is accounted for based on product yield. Where assets or liabilities are hedged, the amounts are shown net of the hedge, however individual items not separately hedged may be affected by movements in exchange rates. The overseas component comprises overseas branches of the Bank and overseas domiciled controlled entities. Non-accrual loans are included in interest earning assets under Loans, bills discounted and other receivables. The official cash rate in Australia decreased by 25 basis points (2016: 25 basis points), while rates in New Zealand decreased 50 basis points (2016: 100 basis points) during the year which is reflected in Overseas.
Group2017 2016 2015
Average Average Average Average Average AverageInterest earning Balance Interest Rate Balance Interest Rate Balance Interest Rate
assets (1) $M $M % $M $M % $M $M %
Cash and liquid assetsAustralia 17,734 271 1. 5 11,536 186 1. 6 8,951 174 1. 9Overseas 19,626 50 0. 3 20,183 105 0. 5 21,500 94 0. 4
Receivables due from other financial institutions
Australia 2,266 20 0. 9 3,387 26 0. 8 3,418 20 0. 6Overseas 8,850 132 1. 5 8,986 111 1. 2 7,262 53 0. 7
Assets at fair value through Income Statement - Trading and Other
Australia 21,731 422 1. 9 19,354 500 2. 6 17,367 396 2. 3Overseas 3,895 68 1. 7 3,090 76 2. 5 4,618 122 2. 6
Available-for-sale investmentsAustralia 66,615 1,458 2. 2 66,543 1,662 2. 5 58,338 1,656 2. 8Overseas 13,870 149 1. 1 12,770 185 1. 4 10,094 154 1. 5
Loans, bills discounted and other receivables (2)
Australia (3) 581,093 26,266 4. 5 554,206 26,620 4. 8 522,430 27,117 5. 0Overseas 99,061 4,457 4. 5 90,541 4,346 4. 8 82,186 4,359 5. 3
Total interest earning assets and interest income 834,741 33,293 4. 0 790,596 33,817 4. 3 736,164 34,145 4. 6
(1) Comparative information has been restated to conform to presentation in the current year.(2) Loans, bills discounted and other receivables includes bank acceptances.(3) Net of average mortgage offset balances that were reclassified as Non-interest earning assets. Gross Australian loan balance is $616,418 million (2016:
$581,067 million, 2015: $542,138 million).
Group
2017 2016 2015Average Average AverageBalance Balance Balance
Non-interest earning assets $M $M $MAssets at fair value through Income Statement - Insurance
Australia 12,105 11,819 12,531Overseas 2,477 2,502 2,574
Property, plant and equipmentAustralia 3,743 2,827 2,531Overseas 289 266 249
Other assetsAustralia (1) (2) 108,987 97,068 81,563Overseas (1) 13,774 14,889 11,623
Provisions for impairmentAustralia (3,303) (3,272) (3,524)Overseas (424) (375) (288)
Total non-interest earning assets 137,648 125,724 107,259Total assets 972,389 916,320 843,423Percentage of total assets applicable to overseas operations (%) 16. 6 16. 7 16. 6
(1) Comparative information has been restated to conform to presentation in the current year.(2) Includes average mortgage offset balances.
52
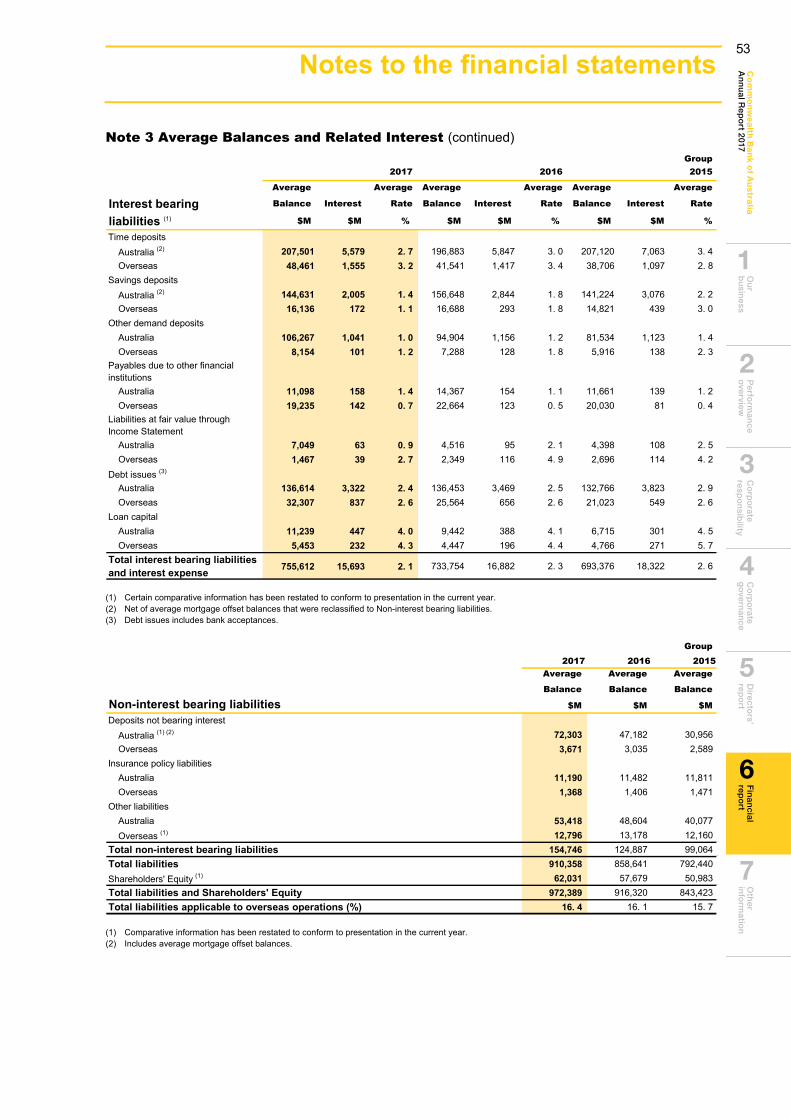
Ou
r b
usin
essP
erform
ance
overview
C
orp
orate
respo
nsib
ility C
orp
orate
go
vernan
ceD
irectors’
repo
rtO
ther
info
rmatio
nC
om
mo
nw
ea
lth Ba
nk o
f Au
stralia
An
nu
al Rep
ort 2017
Fin
ancial
repo
rt
6
2
1
3
4
5
7
Notes to the financial statements 107
Note 3 Average Balances and Related Interest (continued) Group
2017 2016 2015
Average Average Average Average Average Average
Interest bearing Balance Interest Rate Balance Interest Rate Balance Interest Rate
liabilities (1) $M $M % $M $M % $M $M %
Time depositsAustralia (2) 207,501 5,579 2. 7 196,883 5,847 3. 0 207,120 7,063 3. 4Overseas 48,461 1,555 3. 2 41,541 1,417 3. 4 38,706 1,097 2. 8
Savings depositsAustralia (2) 144,631 2,005 1. 4 156,648 2,844 1. 8 141,224 3,076 2. 2Overseas 16,136 172 1. 1 16,688 293 1. 8 14,821 439 3. 0
Other demand depositsAustralia 106,267 1,041 1. 0 94,904 1,156 1. 2 81,534 1,123 1. 4Overseas 8,154 101 1. 2 7,288 128 1. 8 5,916 138 2. 3
Payables due to other financialinstitutions
Australia 11,098 158 1. 4 14,367 154 1. 1 11,661 139 1. 2Overseas 19,235 142 0. 7 22,664 123 0. 5 20,030 81 0. 4
Liabilities at fair value throughIncome Statement
Australia 7,049 63 0. 9 4,516 95 2. 1 4,398 108 2. 5Overseas 1,467 39 2. 7 2,349 116 4. 9 2,696 114 4. 2
Debt issues (3)
Australia 136,614 3,322 2. 4 136,453 3,469 2. 5 132,766 3,823 2. 9Overseas 32,307 837 2. 6 25,564 656 2. 6 21,023 549 2. 6
Loan capitalAustralia 11,239 447 4. 0 9,442 388 4. 1 6,715 301 4. 5Overseas 5,453 232 4. 3 4,447 196 4. 4 4,766 271 5. 7
Total interest bearing liabilities and interest expense 755,612 15,693 2. 1 733,754 16,882 2. 3 693,376 18,322 2. 6
(1) Certain comparative information has been restated to conform to presentation in the current year.(2) Net of average mortgage offset balances that were reclassified to Non-interest bearing liabilities. (3) Debt issues includes bank acceptances.
Group2017 2016 2015
Average Average Average
Balance Balance Balance
Non-interest bearing liabilities $M $M $M
Deposits not bearing interestAustralia (1) (2) 72,303 47,182 30,956Overseas 3,671 3,035 2,589
Insurance policy liabilitiesAustralia 11,190 11,482 11,811Overseas 1,368 1,406 1,471
Other liabilities Australia 53,418 48,604 40,077Overseas (1) 12,796 13,178 12,160
Total non-interest bearing liabilities 154,746 124,887 99,064Total liabilities 910,358 858,641 792,440Shareholders' Equity (1) 62,031 57,679 50,983Total liabilities and Shareholders' Equity 972,389 916,320 843,423Total liabilities applicable to overseas operations (%) 16. 4 16. 1 15. 7
(1) Comparative information has been restated to conform to presentation in the current year.(2) Includes average mortgage offset balances.
53
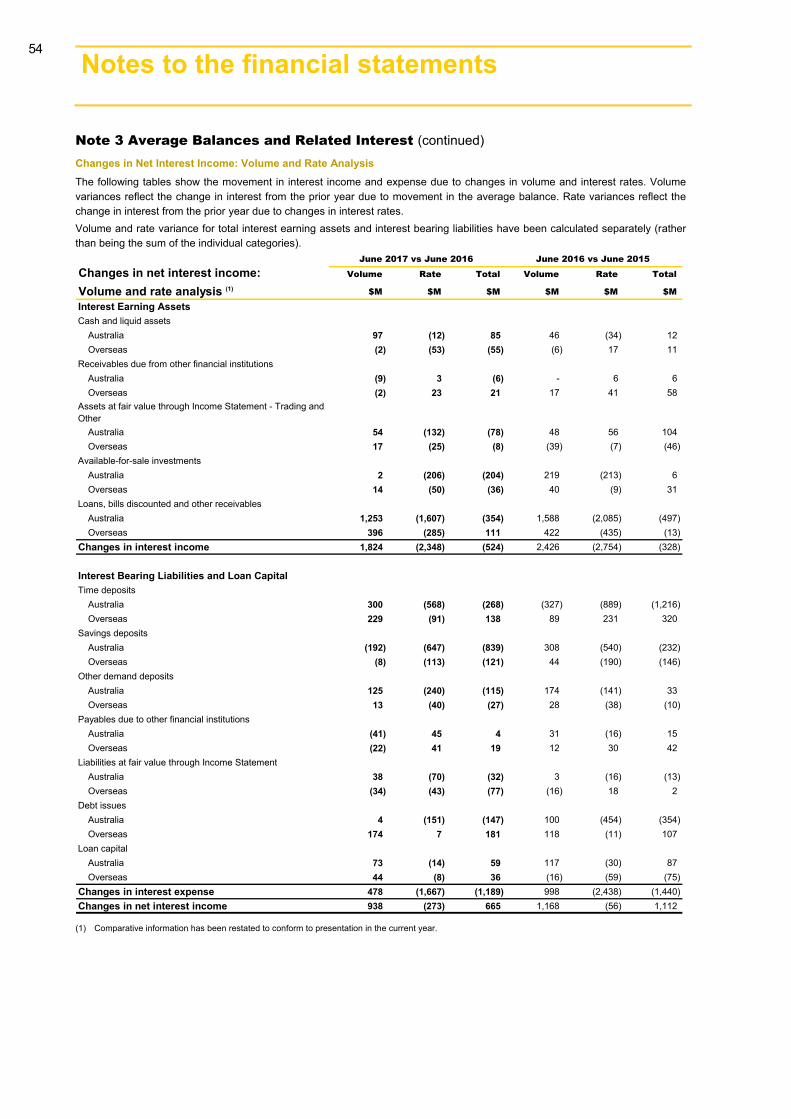
Notes to the financial statements 108
Note 3 Average Balances and Related Interest (continued) Changes in Net Interest Income: Volume and Rate Analysis The following tables show the movement in interest income and expense due to changes in volume and interest rates. Volume variances reflect the change in interest from the prior year due to movement in the average balance. Rate variances reflect the change in interest from the prior year due to changes in interest rates. Volume and rate variance for total interest earning assets and interest bearing liabilities have been calculated separately (rather than being the sum of the individual categories).
Changes in net interest income: Volume Rate Total Volume Rate Total
Volume and rate analysis (1) $M $M $M $M $M $M
Interest Earning AssetsCash and liquid assets
Australia 97 (12) 85 46 (34) 12Overseas (2) (53) (55) (6) 17 11
Receivables due from other financial institutionsAustralia (9) 3 (6) - 6 6Overseas (2) 23 21 17 41 58
Assets at fair value through Income Statement - Trading and Other
Australia 54 (132) (78) 48 56 104Overseas 17 (25) (8) (39) (7) (46)
Available-for-sale investmentsAustralia 2 (206) (204) 219 (213) 6Overseas 14 (50) (36) 40 (9) 31
Loans, bills discounted and other receivablesAustralia 1,253 (1,607) (354) 1,588 (2,085) (497)Overseas 396 (285) 111 422 (435) (13)
Changes in interest income 1,824 (2,348) (524) 2,426 (2,754) (328)
Interest Bearing Liabilities and Loan CapitalTime deposits
Australia 300 (568) (268) (327) (889) (1,216)Overseas 229 (91) 138 89 231 320
Savings depositsAustralia (192) (647) (839) 308 (540) (232)Overseas (8) (113) (121) 44 (190) (146)
Other demand depositsAustralia 125 (240) (115) 174 (141) 33Overseas 13 (40) (27) 28 (38) (10)
Payables due to other financial institutionsAustralia (41) 45 4 31 (16) 15Overseas (22) 41 19 12 30 42
Liabilities at fair value through Income StatementAustralia 38 (70) (32) 3 (16) (13)Overseas (34) (43) (77) (16) 18 2
Debt issuesAustralia 4 (151) (147) 100 (454) (354)Overseas 174 7 181 118 (11) 107
Loan capitalAustralia 73 (14) 59 117 (30) 87Overseas 44 (8) 36 (16) (59) (75)
Changes in interest expense 478 (1,667) (1,189) 998 (2,438) (1,440)Changes in net interest income 938 (273) 665 1,168 (56) 1,112
June 2017 vs June 2016 June 2016 vs June 2015
(1) Comparative information has been restated to conform to presentation in the current year.
54
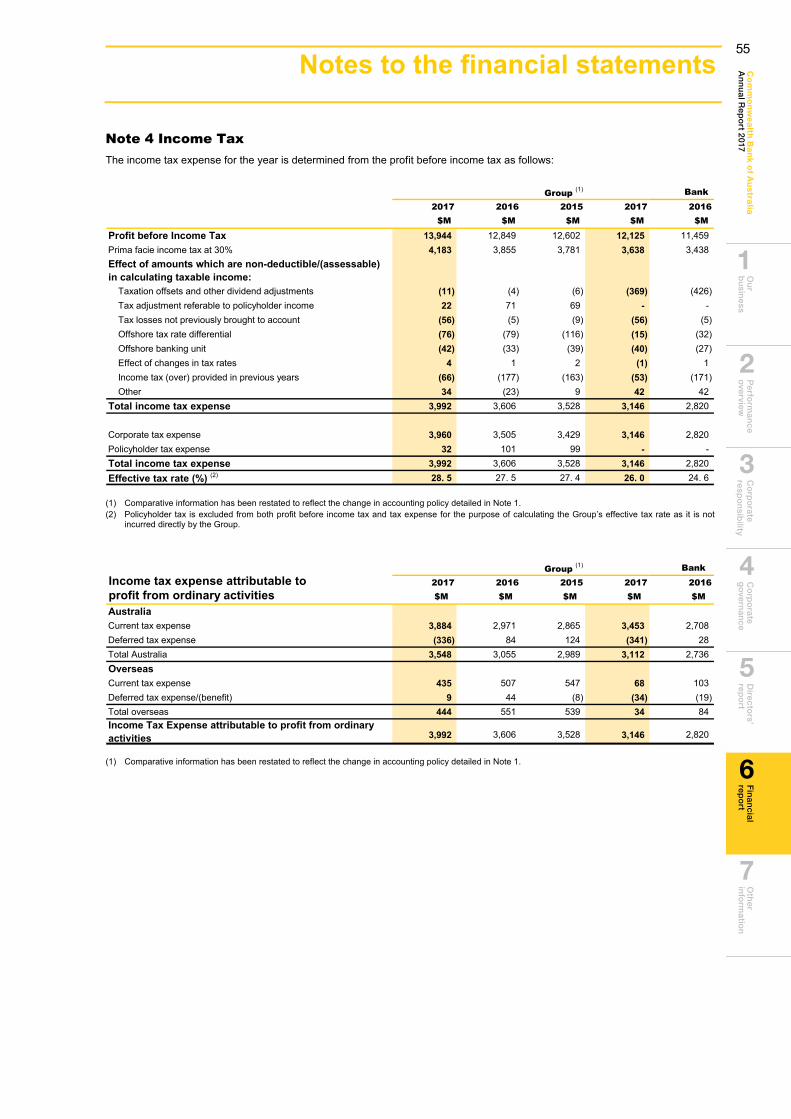
Ou
r b
usin
essP
erform
ance
overview
C
orp
orate
respo
nsib
ility C
orp
orate
go
vernan
ceD
irectors’
repo
rtO
ther
info
rmatio
nC
om
mo
nw
ea
lth Ba
nk o
f Au
stralia
An
nu
al Rep
ort 2017
Fin
ancial
repo
rt
6
2
1
3
4
5
7
Notes to the financial statements 109
Note 4 Income Tax The income tax expense for the year is determined from the profit before income tax as follows:
Group (1) Bank2017 2016 2015 2017 2016
$M $M $M $M $M
Profit before Income Tax 13,944 12,849 12,602 12,125 11,459Prima facie income tax at 30% 4,183 3,855 3,781 3,638 3,438Effect of amounts which are non-deductible/(assessable) in calculating taxable income:
Taxation offsets and other dividend adjustments (11) (4) (6) (369) (426)Tax adjustment referable to policyholder income 22 71 69 - -Tax losses not previously brought to account (56) (5) (9) (56) (5)Offshore tax rate differential (76) (79) (116) (15) (32)Offshore banking unit (42) (33) (39) (40) (27)Effect of changes in tax rates 4 1 2 (1) 1Income tax (over) provided in previous years (66) (177) (163) (53) (171)Other 34 (23) 9 42 42
Total income tax expense 3,992 3,606 3,528 3,146 2,820
Corporate tax expense 3,960 3,505 3,429 3,146 2,820Policyholder tax expense 32 101 99 - -Total income tax expense 3,992 3,606 3,528 3,146 2,820Effective tax rate (%) (2) 28. 5 27. 5 27. 4 26. 0 24. 6
(1) Comparative information has been restated to reflect the change in accounting policy detailed in Note 1.(2) Policyholder tax is excluded from both profit before income tax and tax expense for the purpose of calculating the Group’s effective tax rate as it is not
incurred directly by the Group.
Group (1) Bank Income tax expense attributable to 2017 2016 2015 2017 2016profit from ordinary activities $M $M $M $M $M
AustraliaCurrent tax expense 3,884 2,971 2,865 3,453 2,708Deferred tax expense (336) 84 124 (341) 28Total Australia 3,548 3,055 2,989 3,112 2,736OverseasCurrent tax expense 435 507 547 68 103Deferred tax expense/(benefit) 9 44 (8) (34) (19)Total overseas 444 551 539 34 84Income Tax Expense attributable to profit from ordinary activities 3,992 3,606 3,528 3,146 2,820
(1) Comparative information has been restated to reflect the change in accounting policy detailed in Note 1.
55
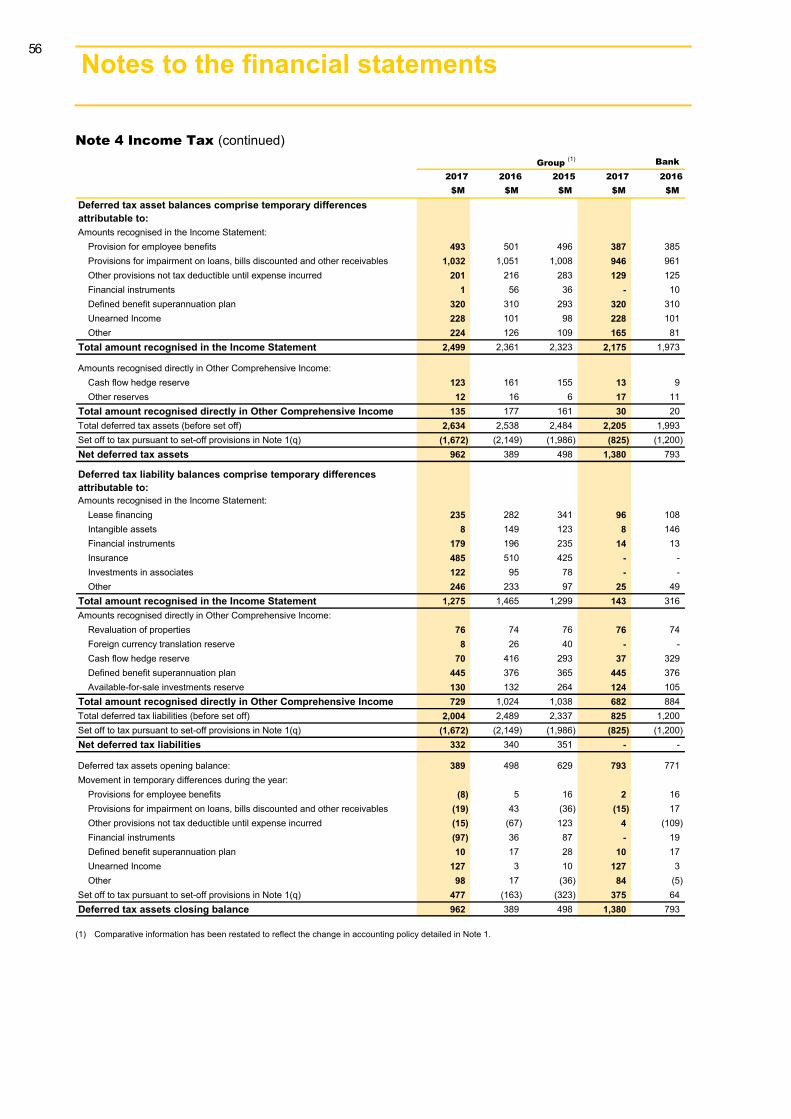
Notes to the financial statements 110
Note 4 Income Tax (continued) Group (1) Bank
2017 2016 2015 2017 2016$M $M $M $M $M
Deferred tax asset balances comprise temporary differences attributable to:Amounts recognised in the Income Statement:
Provision for employee benefits 493 501 496 387 385Provisions for impairment on loans, bills discounted and other receivables 1,032 1,051 1,008 946 961Other provisions not tax deductible until expense incurred 201 216 283 129 125Financial instruments 1 56 36 - 10Defined benefit superannuation plan 320 310 293 320 310Unearned Income 228 101 98 228 101Other 224 126 109 165 81
Total amount recognised in the Income Statement 2,499 2,361 2,323 2,175 1,973
Amounts recognised directly in Other Comprehensive Income:Cash flow hedge reserve 123 161 155 13 9Other reserves 12 16 6 17 11
Total amount recognised directly in Other Comprehensive Income 135 177 161 30 20Total deferred tax assets (before set off) 2,634 2,538 2,484 2,205 1,993Set off to tax pursuant to set-off provisions in Note 1(q) (1,672) (2,149) (1,986) (825) (1,200)Net deferred tax assets 962 389 498 1,380 793
Deferred tax liability balances comprise temporary differences attributable to:Amounts recognised in the Income Statement:
Lease financing 235 282 341 96 108Intangible assets 8 149 123 8 146Financial instruments 179 196 235 14 13Insurance 485 510 425 - -Investments in associates 122 95 78 - -Other 246 233 97 25 49
Total amount recognised in the Income Statement 1,275 1,465 1,299 143 316Amounts recognised directly in Other Comprehensive Income:
Revaluation of properties 76 74 76 76 74Foreign currency translation reserve 8 26 40 - -Cash flow hedge reserve 70 416 293 37 329Defined benefit superannuation plan 445 376 365 445 376Available-for-sale investments reserve 130 132 264 124 105
Total amount recognised directly in Other Comprehensive Income 729 1,024 1,038 682 884Total deferred tax liabilities (before set off) 2,004 2,489 2,337 825 1,200Set off to tax pursuant to set-off provisions in Note 1(q) (1,672) (2,149) (1,986) (825) (1,200)Net deferred tax liabilities 332 340 351 - -
Deferred tax assets opening balance: 389 498 629 793 771Movement in temporary differences during the year:
Provisions for employee benefits (8) 5 16 2 16Provisions for impairment on loans, bills discounted and other receivables (19) 43 (36) (15) 17Other provisions not tax deductible until expense incurred (15) (67) 123 4 (109)Financial instruments (97) 36 87 - 19Defined benefit superannuation plan 10 17 28 10 17Unearned Income 127 3 10 127 3Other 98 17 (36) 84 (5)
Set off to tax pursuant to set-off provisions in Note 1(q) 477 (163) (323) 375 64Deferred tax assets closing balance 962 389 498 1,380 793
(1) Comparative information has been restated to reflect the change in accounting policy detailed in Note 1.
56
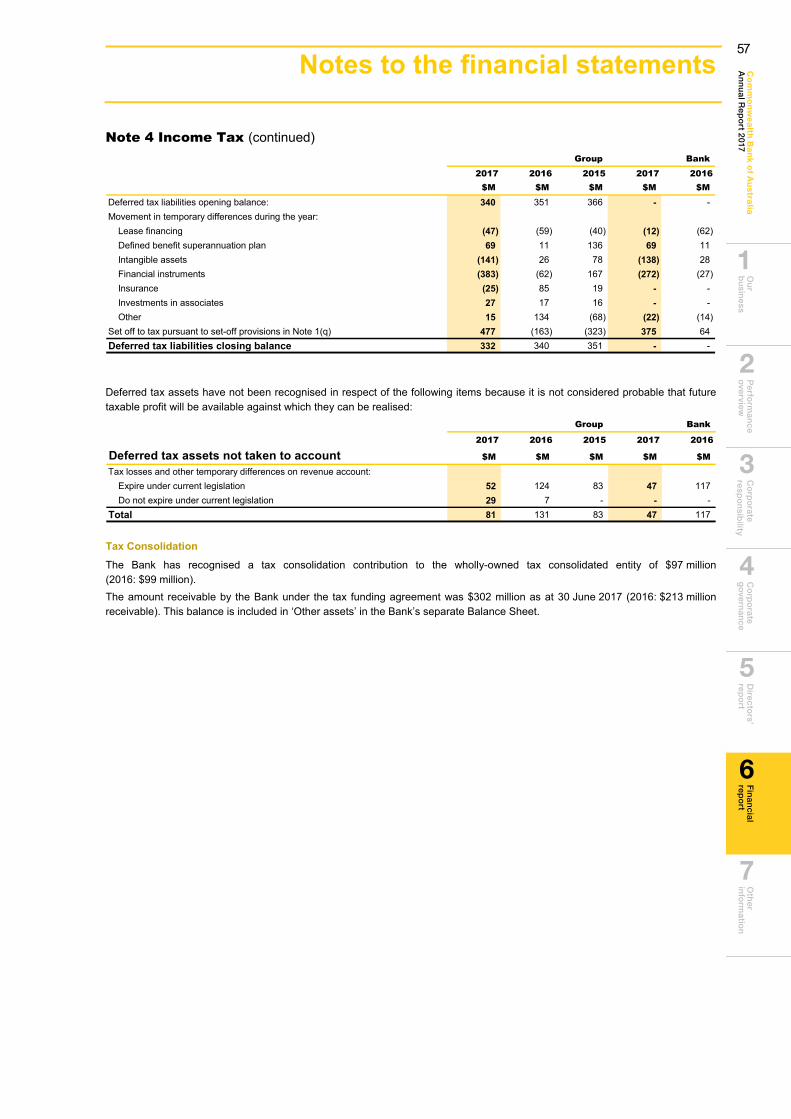
Ou
r b
usin
essP
erform
ance
overview
C
orp
orate
respo
nsib
ility C
orp
orate
go
vernan
ceD
irectors’
repo
rtO
ther
info
rmatio
nC
om
mo
nw
ea
lth Ba
nk o
f Au
stralia
An
nu
al Rep
ort 2017
Fin
ancial
repo
rt
6
2
1
3
4
5
7
Notes to the financial statements 111
Note 4 Income Tax (continued) Group Bank
2017 2016 2015 2017 2016$M $M $M $M $M
Deferred tax liabilities opening balance: 340 351 366 - -Movement in temporary differences during the year:
Lease financing (47) (59) (40) (12) (62)Defined benefit superannuation plan 69 11 136 69 11Intangible assets (141) 26 78 (138) 28Financial instruments (383) (62) 167 (272) (27)Insurance (25) 85 19 - -Investments in associates 27 17 16 - -Other 15 134 (68) (22) (14)
Set off to tax pursuant to set-off provisions in Note 1(q) 477 (163) (323) 375 64Deferred tax liabilities closing balance 332 340 351 - -
Deferred tax assets have not been recognised in respect of the following items because it is not considered probable that future taxable profit will be available against which they can be realised:
Group Bank
2017 2016 2015 2017 2016
Deferred tax assets not taken to account $M $M $M $M $M
Tax losses and other temporary differences on revenue account:Expire under current legislation 52 124 83 47 117Do not expire under current legislation 29 7 - - -
Total 81 131 83 47 117
Tax Consolidation The Bank has recognised a tax consolidation contribution to the wholly-owned tax consolidated entity of $97 million (2016: $99 million). The amount receivable by the Bank under the tax funding agreement was $302 million as at 30 June 2017 (2016: $213 million receivable). This balance is included in ‘Other assets’ in the Bank’s separate Balance Sheet.
57
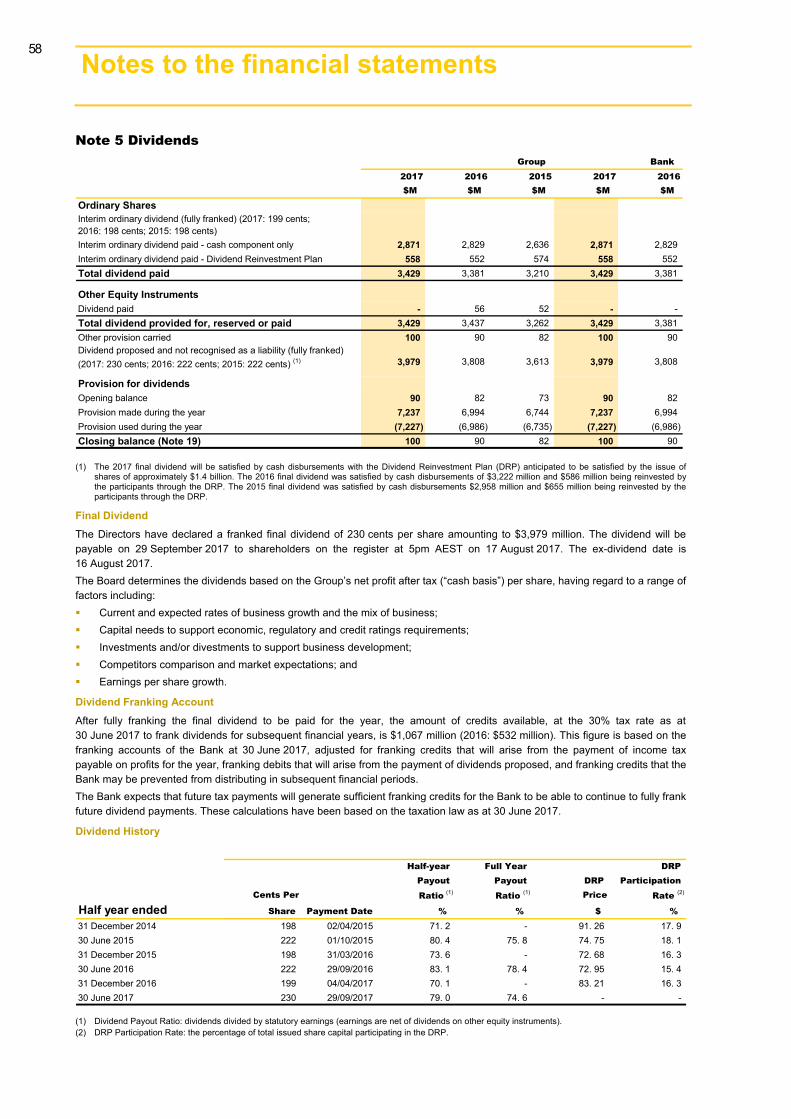
Notes to the financial statements 112
Note 5 Dividends Group Bank
2017 2016 2015 2017 2016$M $M $M $M $M
Ordinary SharesInterim ordinary dividend (fully franked) (2017: 199 cents; 2016: 198 cents; 2015: 198 cents)Interim ordinary dividend paid - cash component only 2,871 2,829 2,636 2,871 2,829Interim ordinary dividend paid - Dividend Reinvestment Plan 558 552 574 558 552Total dividend paid 3,429 3,381 3,210 3,429 3,381
Other Equity InstrumentsDividend paid - 56 52 - -Total dividend provided for, reserved or paid 3,429 3,437 3,262 3,429 3,381Other provision carried 100 90 82 100 90Dividend proposed and not recognised as a liability (fully franked) (2017: 230 cents; 2016: 222 cents; 2015: 222 cents) (1) 3,979 3,808 3,613 3,979 3,808
Provision for dividendsOpening balance 90 82 73 90 82Provision made during the year 7,237 6,994 6,744 7,237 6,994Provision used during the year (7,227) (6,986) (6,735) (7,227) (6,986)Closing balance (Note 19) 100 90 82 100 90
(1) The 2017 final dividend will be satisfied by cash disbursements with the Dividend Reinvestment Plan (DRP) anticipated to be satisfied by the issue of shares of approximately $1.4 billion. The 2016 final dividend was satisfied by cash disbursements of $3,222 million and $586 million being reinvested by the participants through the DRP. The 2015 final dividend was satisfied by cash disbursements $2,958 million and $655 million being reinvested by the participants through the DRP.
Final Dividend The Directors have declared a franked final dividend of 230 cents per share amounting to $3,979 million. The dividend will be payable on 29 September 2017 to shareholders on the register at 5pm AEST on 17 August 2017. The ex-dividend date is 16 August 2017. The Board determines the dividends based on the Group’s net profit after tax (“cash basis”) per share, having regard to a range of factors including: Current and expected rates of business growth and the mix of business; Capital needs to support economic, regulatory and credit ratings requirements; Investments and/or divestments to support business development; Competitors comparison and market expectations; and Earnings per share growth.
Dividend Franking Account After fully franking the final dividend to be paid for the year, the amount of credits available, at the 30% tax rate as at 30 June 2017 to frank dividends for subsequent financial years, is $1,067 million (2016: $532 million). This figure is based on the franking accounts of the Bank at 30 June 2017, adjusted for franking credits that will arise from the payment of income tax payable on profits for the year, franking debits that will arise from the payment of dividends proposed, and franking credits that the Bank may be prevented from distributing in subsequent financial periods. The Bank expects that future tax payments will generate sufficient franking credits for the Bank to be able to continue to fully frank future dividend payments. These calculations have been based on the taxation law as at 30 June 2017.
Dividend History
Half-year Full Year DRPPayout Payout DRP Participation
Cents Per Ratio (1) Ratio (1) Price Rate (2)
Half year ended Share Payment Date % % $ %
31 December 2014 198 02/04/2015 71. 2 - 91. 26 17. 930 June 2015 222 01/10/2015 80. 4 75. 8 74. 75 18. 131 December 2015 198 31/03/2016 73. 6 - 72. 68 16. 330 June 2016 222 29/09/2016 83. 1 78. 4 72. 95 15. 431 December 2016 199 04/04/2017 70. 1 - 83. 21 16. 330 June 2017 230 29/09/2017 79. 0 74. 6 - -
(1) Dividend Payout Ratio: dividends divided by statutory earnings (earnings are net of dividends on other equity instruments). (2) DRP Participation Rate: the percentage of total issued share capital participating in the DRP.
58
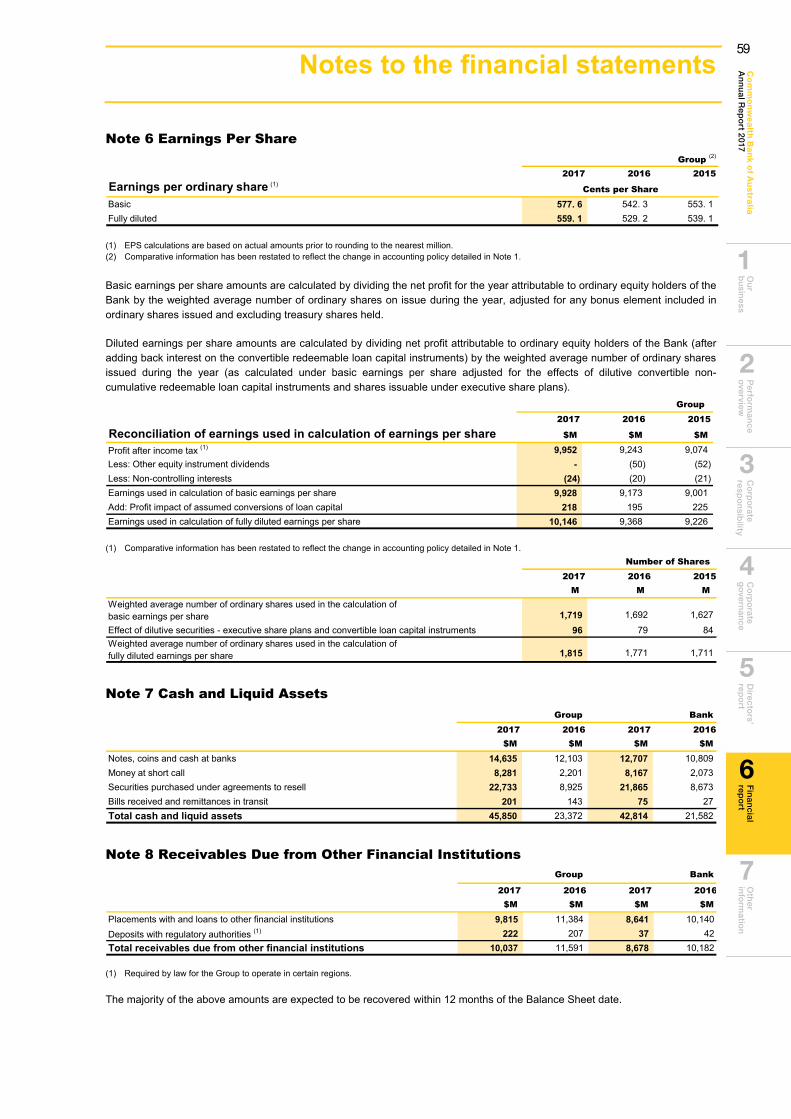
Ou
r b
usin
essP
erform
ance
overview
C
orp
orate
respo
nsib
ility C
orp
orate
go
vernan
ceD
irectors’
repo
rtO
ther
info
rmatio
nC
om
mo
nw
ea
lth Ba
nk o
f Au
stralia
An
nu
al Rep
ort 2017
Fin
ancial
repo
rt
6
2
1
3
4
5
7
Notes to the financial statements 113
Note 6 Earnings Per Share Group (2)
2017 2016 2015Earnings per ordinary share (1)
Cents per Share
Basic 577. 6 542. 3 553. 1Fully diluted 559. 1 529. 2 539. 1
(1) EPS calculations are based on actual amounts prior to rounding to the nearest million.(2) Comparative information has been restated to reflect the change in accounting policy detailed in Note 1.
Basic earnings per share amounts are calculated by dividing the net profit for the year attributable to ordinary equity holders of the Bank by the weighted average number of ordinary shares on issue during the year, adjusted for any bonus element included in ordinary shares issued and excluding treasury shares held.
Diluted earnings per share amounts are calculated by dividing net profit attributable to ordinary equity holders of the Bank (after adding back interest on the convertible redeemable loan capital instruments) by the weighted average number of ordinary shares issued during the year (as calculated under basic earnings per share adjusted for the effects of dilutive convertible non-cumulative redeemable loan capital instruments and shares issuable under executive share plans).
Group 2017 2016 2015
Reconciliation of earnings used in calculation of earnings per share $M $M $M
Profit after income tax (1) 9,952 9,243 9,074Less: Other equity instrument dividends - (50) (52)Less: Non-controlling interests (24) (20) (21)Earnings used in calculation of basic earnings per share 9,928 9,173 9,001Add: Profit impact of assumed conversions of loan capital 218 195 225Earnings used in calculation of fully diluted earnings per share 10,146 9,368 9,226
(1) Comparative information has been restated to reflect the change in accounting policy detailed in Note 1. Number of Shares
2017 2016 2015M M M
Weighted average number of ordinary shares used in the calculation of basic earnings per share 1,719 1,692 1,627Effect of dilutive securities - executive share plans and convertible loan capital instruments 96 79 84Weighted average number of ordinary shares used in the calculation of fully diluted earnings per share 1,815 1,771 1,711
Note 7 Cash and Liquid Assets Group Bank
2017 2016 2017 2016$M $M $M $M
Notes, coins and cash at banks 14,635 12,103 12,707 10,809Money at short call 8,281 2,201 8,167 2,073Securities purchased under agreements to resell 22,733 8,925 21,865 8,673Bills received and remittances in transit 201 143 75 27Total cash and liquid assets 45,850 23,372 42,814 21,582
Note 8 Receivables Due from Other Financial Institutions Group Bank
2017 2016 2017 2016$M $M $M $M
Placements with and loans to other financial institutions 9,815 11,384 8,641 10,140Deposits with regulatory authorities (1) 222 207 37 42Total receivables due from other financial institutions 10,037 11,591 8,678 10,182
(1) Required by law for the Group to operate in certain regions.
The majority of the above amounts are expected to be recovered within 12 months of the Balance Sheet date.
59
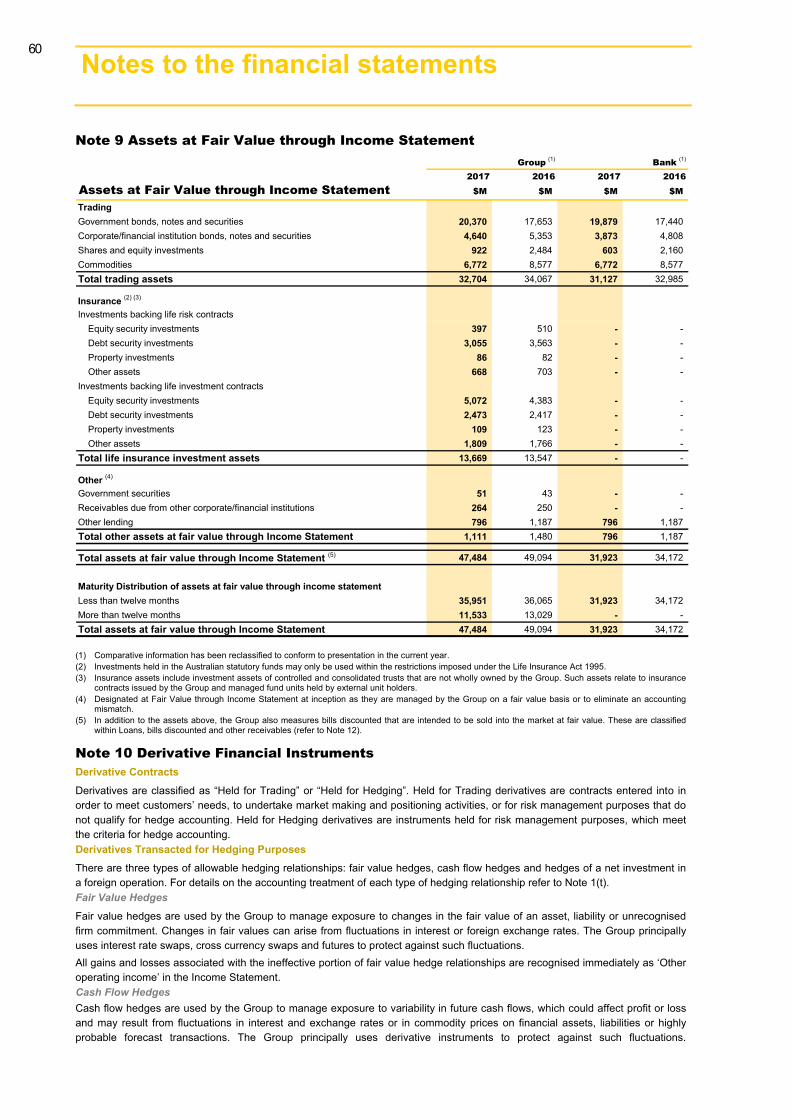
Notes to the financial statements 114
Note 9 Assets at Fair Value through Income Statement Group (1) Bank (1)
2017 2016 2017 2016Assets at Fair Value through Income Statement $M $M $M $M
TradingGovernment bonds, notes and securities 20,370 17,653 19,879 17,440Corporate/financial institution bonds, notes and securities 4,640 5,353 3,873 4,808Shares and equity investments 922 2,484 603 2,160Commodities 6,772 8,577 6,772 8,577Total trading assets 32,704 34,067 31,127 32,985
Insurance (2) (3)
Investments backing life risk contractsEquity security investments 397 510 - -Debt security investments 3,055 3,563 - -Property investments 86 82 - -Other assets 668 703 - -
Investments backing life investment contractsEquity security investments 5,072 4,383 - -Debt security investments 2,473 2,417 - -Property investments 109 123 - -Other assets 1,809 1,766 - -
Total life insurance investment assets 13,669 13,547 - -
Other (4)
Government securities 51 43 - -Receivables due from other corporate/financial institutions 264 250 - -Other lending 796 1,187 796 1,187Total other assets at fair value through Income Statement 1,111 1,480 796 1,187
Total assets at fair value through Income Statement (5) 47,484 49,094 31,923 34,172
Maturity Distribution of assets at fair value through income statementLess than twelve months 35,951 36,065 31,923 34,172More than twelve months 11,533 13,029 - -Total assets at fair value through Income Statement 47,484 49,094 31,923 34,172
(1) Comparative information has been reclassified to conform to presentation in the current year. (2) Investments held in the Australian statutory funds may only be used within the restrictions imposed under the Life Insurance Act 1995. (3) Insurance assets include investment assets of controlled and consolidated trusts that are not wholly owned by the Group. Such assets relate to insurance
contracts issued by the Group and managed fund units held by external unit holders.(4) Designated at Fair Value through Income Statement at inception as they are managed by the Group on a fair value basis or to eliminate an accounting
mismatch. (5) In addition to the assets above, the Group also measures bills discounted that are intended to be sold into the market at fair value. These are classified
within Loans, bills discounted and other receivables (refer to Note 12).
Note 10 Derivative Financial Instruments Derivative Contracts Derivatives are classified as “Held for Trading” or “Held for Hedging”. Held for Trading derivatives are contracts entered into in order to meet customers’ needs, to undertake market making and positioning activities, or for risk management purposes that do not qualify for hedge accounting. Held for Hedging derivatives are instruments held for risk management purposes, which meet the criteria for hedge accounting. Derivatives Transacted for Hedging Purposes There are three types of allowable hedging relationships: fair value hedges, cash flow hedges and hedges of a net investment in a foreign operation. For details on the accounting treatment of each type of hedging relationship refer to Note 1(t). Fair Value Hedges
Fair value hedges are used by the Group to manage exposure to changes in the fair value of an asset, liability or unrecognised firm commitment. Changes in fair values can arise from fluctuations in interest or foreign exchange rates. The Group principally uses interest rate swaps, cross currency swaps and futures to protect against such fluctuations. All gains and losses associated with the ineffective portion of fair value hedge relationships are recognised immediately as ‘Other operating income’ in the Income Statement. Cash Flow Hedges Cash flow hedges are used by the Group to manage exposure to variability in future cash flows, which could affect profit or loss and may result from fluctuations in interest and exchange rates or in commodity prices on financial assets, liabilities or highly probable forecast transactions. The Group principally uses derivative instruments to protect against such fluctuations.
60
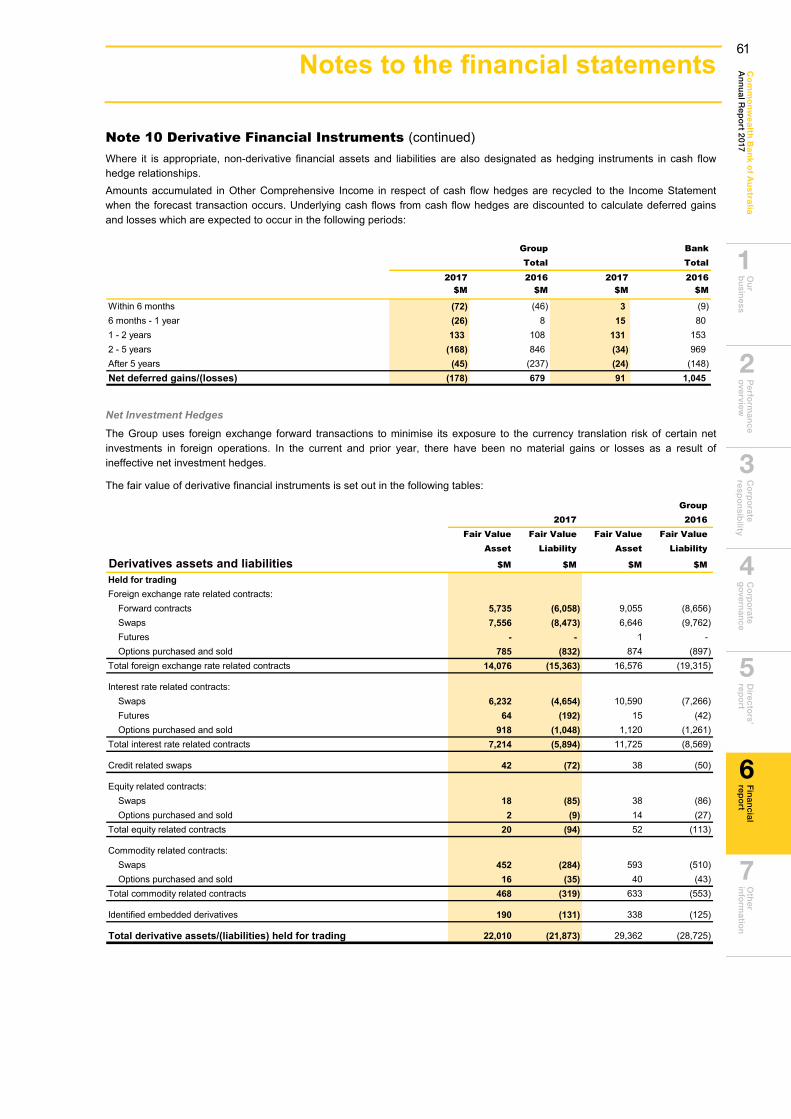
Ou
r b
usin
essP
erform
ance
overview
C
orp
orate
respo
nsib
ility C
orp
orate
go
vernan
ceD
irectors’
repo
rtO
ther
info
rmatio
nC
om
mo
nw
ea
lth Ba
nk o
f Au
stralia
An
nu
al Rep
ort 2017
Fin
ancial
repo
rt
6
2
1
3
4
5
7
Notes to the financial statements 115
Note 10 Derivative Financial Instruments (continued) Where it is appropriate, non-derivative financial assets and liabilities are also designated as hedging instruments in cash flow hedge relationships. Amounts accumulated in Other Comprehensive Income in respect of cash flow hedges are recycled to the Income Statement when the forecast transaction occurs. Underlying cash flows from cash flow hedges are discounted to calculate deferred gains and losses which are expected to occur in the following periods:
Group BankTotal Total
2017 2016 2017 2016$M $M $M $M
Within 6 months (72) (46) 3 (9)6 months - 1 year (26) 8 15 801 - 2 years 133 108 131 1532 - 5 years (168) 846 (34) 969After 5 years (45) (237) (24) (148)Net deferred gains/(losses) (178) 679 91 1,045
Net Investment Hedges
The Group uses foreign exchange forward transactions to minimise its exposure to the currency translation risk of certain net investments in foreign operations. In the current and prior year, there have been no material gains or losses as a result of ineffective net investment hedges.
The fair value of derivative financial instruments is set out in the following tables:
Group2017 2016
Fair Value Fair Value Fair Value Fair ValueAsset Liability Asset Liability
Derivatives assets and liabilities $M $M $M $M
Held for tradingForeign exchange rate related contracts:
Forward contracts 5,735 (6,058) 9,055 (8,656)Swaps 7,556 (8,473) 6,646 (9,762)Futures - - 1 -Options purchased and sold 785 (832) 874 (897)
Total foreign exchange rate related contracts 14,076 (15,363) 16,576 (19,315)
Interest rate related contracts:Swaps 6,232 (4,654) 10,590 (7,266)Futures 64 (192) 15 (42)Options purchased and sold 918 (1,048) 1,120 (1,261)
Total interest rate related contracts 7,214 (5,894) 11,725 (8,569)
Credit related swaps 42 (72) 38 (50)
Equity related contracts:Swaps 18 (85) 38 (86)Options purchased and sold 2 (9) 14 (27)
Total equity related contracts 20 (94) 52 (113)
Commodity related contracts:Swaps 452 (284) 593 (510)Options purchased and sold 16 (35) 40 (43)
Total commodity related contracts 468 (319) 633 (553)
Identified embedded derivatives 190 (131) 338 (125)
Total derivative assets/(liabilities) held for trading 22,010 (21,873) 29,362 (28,725)
61
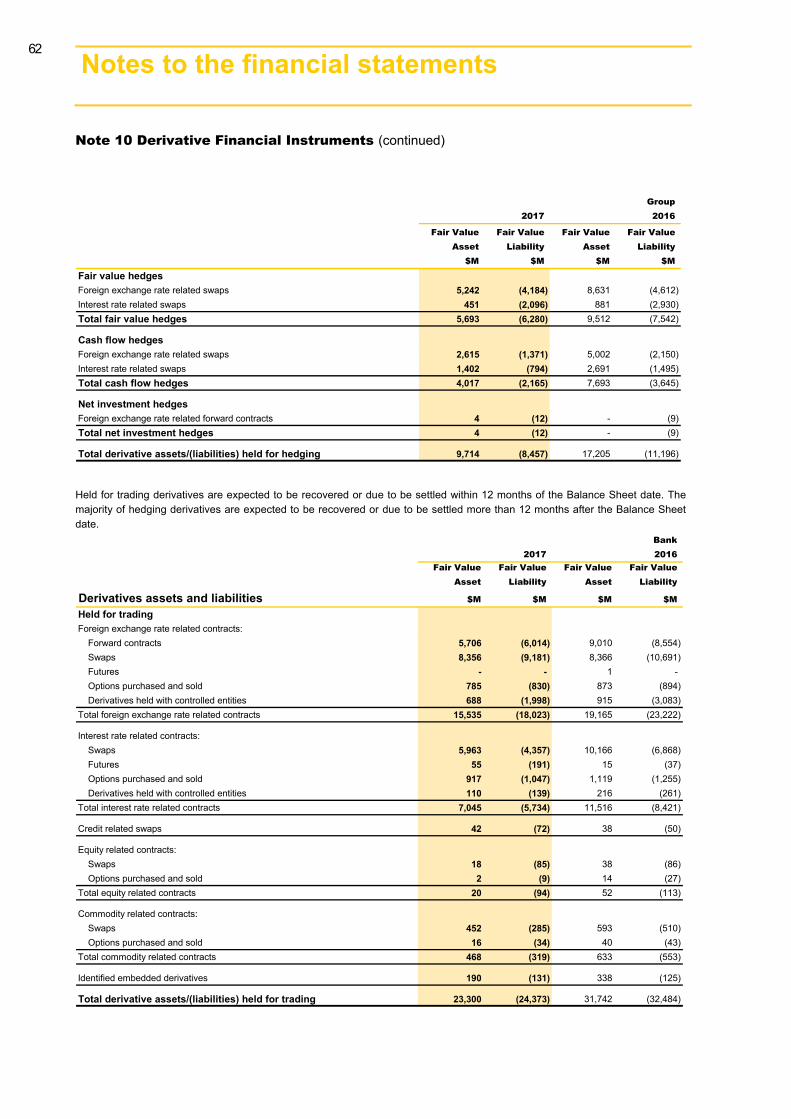
Notes to the financial statements 116
Note 10 Derivative Financial Instruments (continued)
Group2017 2016
Fair Value Fair Value Fair Value Fair ValueAsset Liability Asset Liability
$M $M $M $M
Fair value hedgesForeign exchange rate related swaps 5,242 (4,184) 8,631 (4,612)Interest rate related swaps 451 (2,096) 881 (2,930)Total fair value hedges 5,693 (6,280) 9,512 (7,542)
Cash flow hedgesForeign exchange rate related swaps 2,615 (1,371) 5,002 (2,150)Interest rate related swaps 1,402 (794) 2,691 (1,495)Total cash flow hedges 4,017 (2,165) 7,693 (3,645)
Net investment hedgesForeign exchange rate related forward contracts 4 (12) - (9)Total net investment hedges 4 (12) - (9)
Total derivative assets/(liabilities) held for hedging 9,714 (8,457) 17,205 (11,196)
Held for trading derivatives are expected to be recovered or due to be settled within 12 months of the Balance Sheet date. The majority of hedging derivatives are expected to be recovered or due to be settled more than 12 months after the Balance Sheet date.
Bank2017 2016
Fair Value Fair Value Fair Value Fair ValueAsset Liability Asset Liability
Derivatives assets and liabilities $M $M $M $M
Held for tradingForeign exchange rate related contracts:
Forward contracts 5,706 (6,014) 9,010 (8,554)Swaps 8,356 (9,181) 8,366 (10,691)Futures - - 1 -Options purchased and sold 785 (830) 873 (894)Derivatives held with controlled entities 688 (1,998) 915 (3,083)
Total foreign exchange rate related contracts 15,535 (18,023) 19,165 (23,222)
Interest rate related contracts:Swaps 5,963 (4,357) 10,166 (6,868)Futures 55 (191) 15 (37)Options purchased and sold 917 (1,047) 1,119 (1,255)Derivatives held with controlled entities 110 (139) 216 (261)
Total interest rate related contracts 7,045 (5,734) 11,516 (8,421)
Credit related swaps 42 (72) 38 (50)
Equity related contracts:Swaps 18 (85) 38 (86)Options purchased and sold 2 (9) 14 (27)
Total equity related contracts 20 (94) 52 (113)
Commodity related contracts:Swaps 452 (285) 593 (510)Options purchased and sold 16 (34) 40 (43)
Total commodity related contracts 468 (319) 633 (553)
Identified embedded derivatives 190 (131) 338 (125)
Total derivative assets/(liabilities) held for trading 23,300 (24,373) 31,742 (32,484)
62
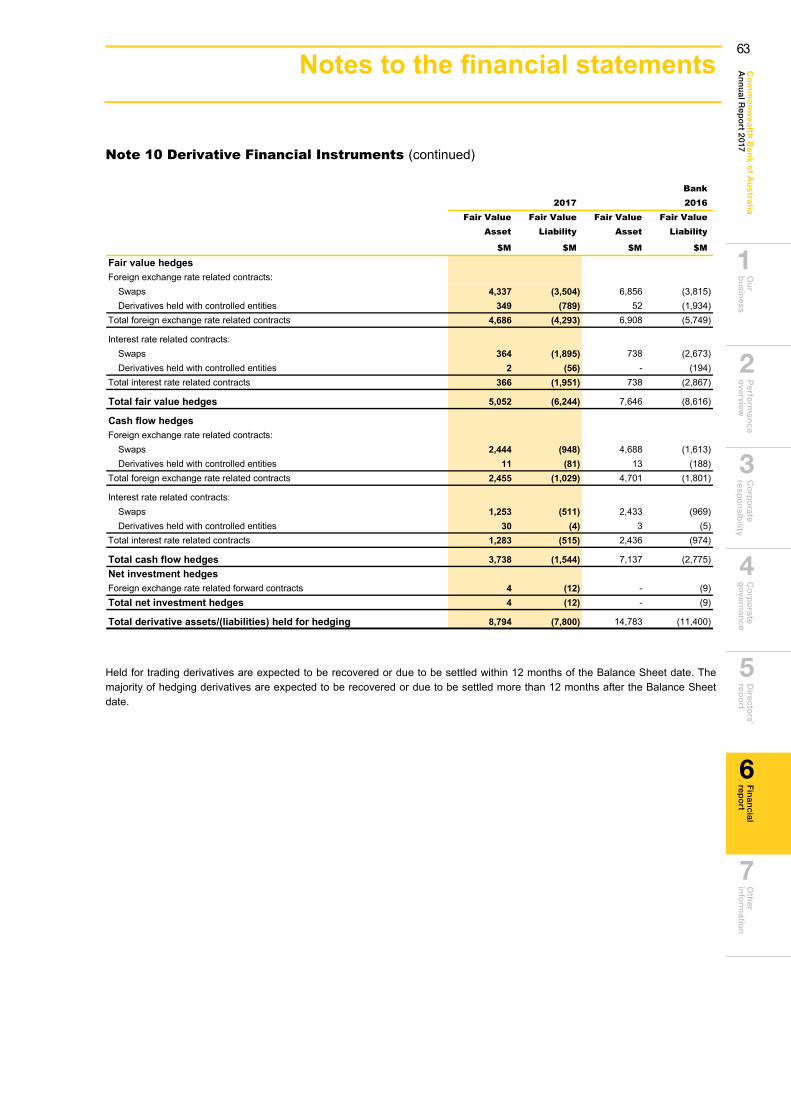
Ou
r b
usin
essP
erform
ance
overview
C
orp
orate
respo
nsib
ility C
orp
orate
go
vernan
ceD
irectors’
repo
rtO
ther
info
rmatio
nC
om
mo
nw
ea
lth Ba
nk o
f Au
stralia
An
nu
al Rep
ort 2017
Fin
ancial
repo
rt
6
2
1
3
4
5
7
Notes to the financial statements 117
Note 10 Derivative Financial Instruments (continued)
Bank2017 2016
Fair Value Fair Value Fair Value Fair ValueAsset Liability Asset Liability
$M $M $M $M
Fair value hedgesForeign exchange rate related contracts:
Swaps 4,337 (3,504) 6,856 (3,815)Derivatives held with controlled entities 349 (789) 52 (1,934)
Total foreign exchange rate related contracts 4,686 (4,293) 6,908 (5,749)
Interest rate related contracts:Swaps 364 (1,895) 738 (2,673)Derivatives held with controlled entities 2 (56) - (194)
Total interest rate related contracts 366 (1,951) 738 (2,867)
Total fair value hedges 5,052 (6,244) 7,646 (8,616)
Cash flow hedgesForeign exchange rate related contracts:
Swaps 2,444 (948) 4,688 (1,613)Derivatives held with controlled entities 11 (81) 13 (188)
Total foreign exchange rate related contracts 2,455 (1,029) 4,701 (1,801)
Interest rate related contracts:Swaps 1,253 (511) 2,433 (969)Derivatives held with controlled entities 30 (4) 3 (5)
Total interest rate related contracts 1,283 (515) 2,436 (974)
Total cash flow hedges 3,738 (1,544) 7,137 (2,775)Net investment hedgesForeign exchange rate related forward contracts 4 (12) - (9)Total net investment hedges 4 (12) - (9)
Total derivative assets/(liabilities) held for hedging 8,794 (7,800) 14,783 (11,400)
Held for trading derivatives are expected to be recovered or due to be settled within 12 months of the Balance Sheet date. The majority of hedging derivatives are expected to be recovered or due to be settled more than 12 months after the Balance Sheet date.
63
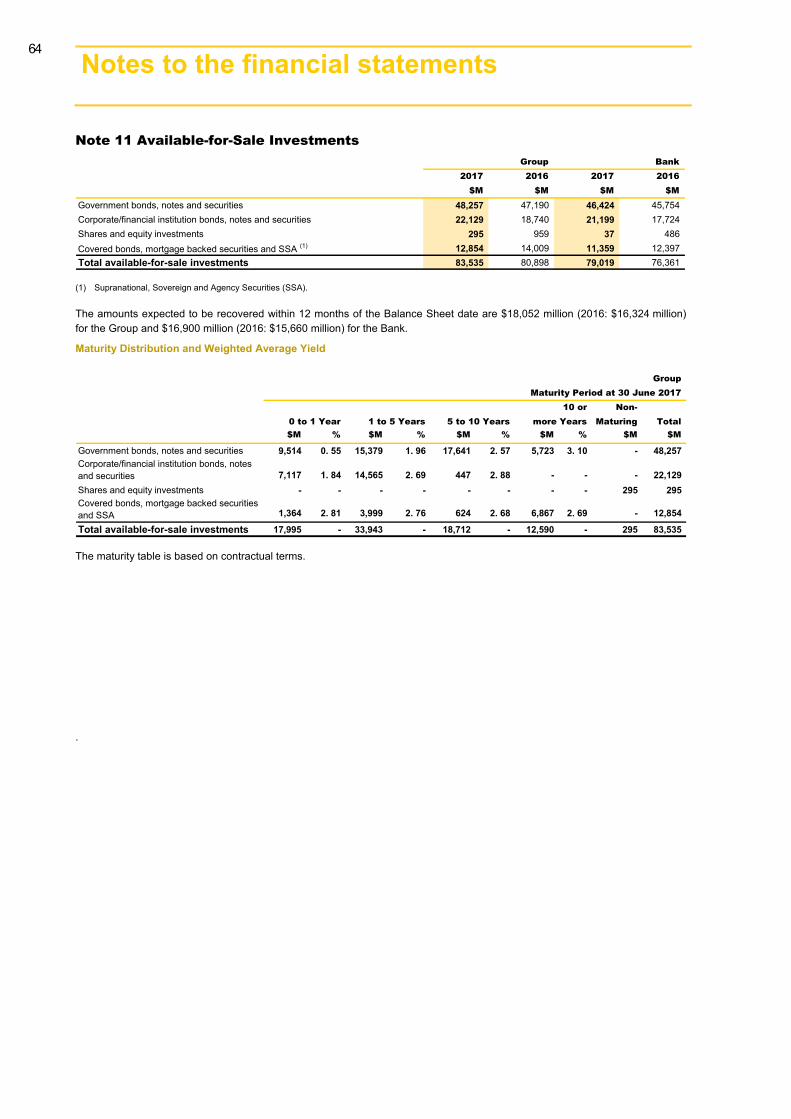
Notes to the financial statements 118
Note 11 Available-for-Sale Investments Group Bank
2017 2016 2017 2016$M $M $M $M
Government bonds, notes and securities 48,257 47,190 46,424 45,754Corporate/financial institution bonds, notes and securities 22,129 18,740 21,199 17,724Shares and equity investments 295 959 37 486Covered bonds, mortgage backed securities and SSA (1) 12,854 14,009 11,359 12,397Total available-for-sale investments 83,535 80,898 79,019 76,361
(1) Supranational, Sovereign and Agency Securities (SSA).
The amounts expected to be recovered within 12 months of the Balance Sheet date are $18,052 million (2016: $16,324 million) for the Group and $16,900 million (2016: $15,660 million) for the Bank.
Maturity Distribution and Weighted Average Yield
GroupMaturity Period at 30 June 2017
10 or Non-0 to 1 Year 1 to 5 Years 5 to 10 Years more Years Maturing Total$M % $M % $M % $M % $M $M
Government bonds, notes and securities 9,514 0. 55 15,379 1. 96 17,641 2. 57 5,723 3. 10 - 48,257
7,117 1. 84 14,565 2. 69 447 2. 88 - - - 22,129Shares and equity investments - - - - - - - - 295 295
1,364 2. 81 3,999 2. 76 624 2. 68 6,867 2. 69 - 12,854
Total available-for-sale investments 17,995 - 33,943 - 18,712 - 12,590 - 295 83,535
Covered bonds, mortgage backed securities and SSA
Corporate/financial institution bonds, notes and securities
The maturity table is based on contractual terms.
.
64
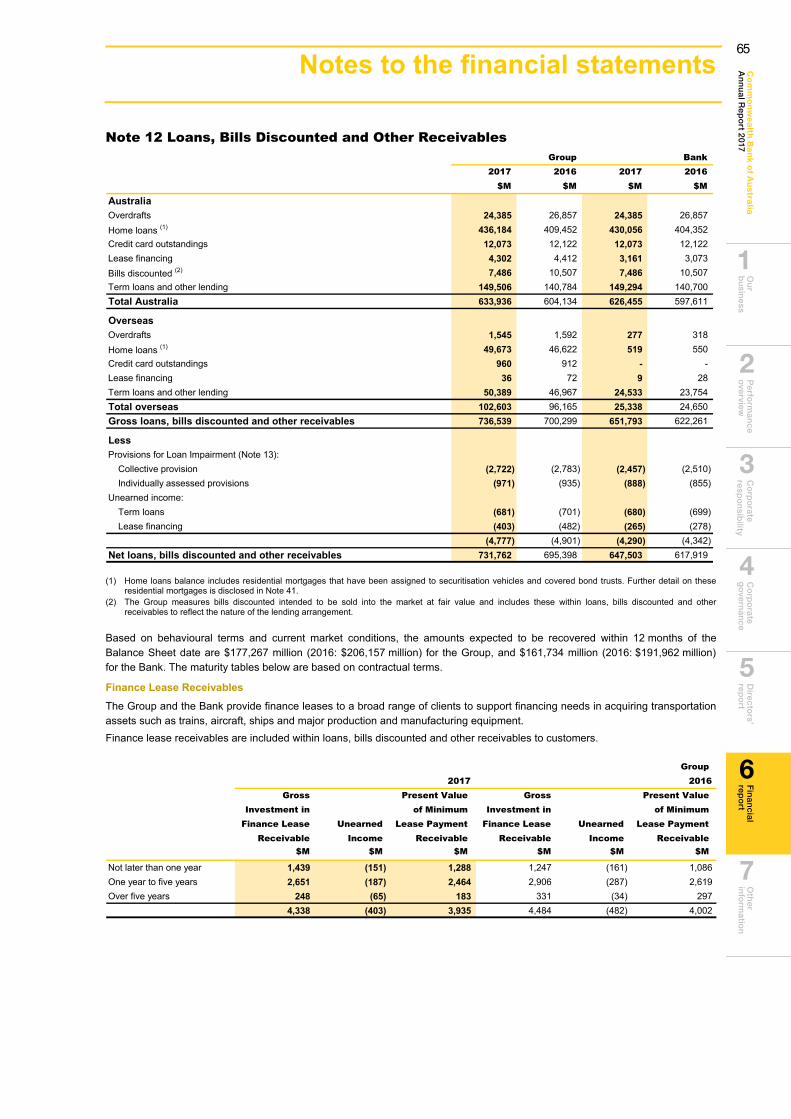
Ou
r b
usin
essP
erform
ance
overview
C
orp
orate
respo
nsib
ility C
orp
orate
go
vernan
ceD
irectors’
repo
rtO
ther
info
rmatio
nC
om
mo
nw
ea
lth Ba
nk o
f Au
stralia
An
nu
al Rep
ort 2017
Fin
ancial
repo
rt
6
2
1
3
4
5
7
Notes to the financial statements 119
Note 12 Loans, Bills Discounted and Other Receivables Group Bank
2017 2016 2017 2016$M $M $M $M
AustraliaOverdrafts 24,385 26,857 24,385 26,857Home loans (1) 436,184 409,452 430,056 404,352Credit card outstandings 12,073 12,122 12,073 12,122Lease financing 4,302 4,412 3,161 3,073Bills discounted (2) 7,486 10,507 7,486 10,507Term loans and other lending 149,506 140,784 149,294 140,700Total Australia 633,936 604,134 626,455 597,611
OverseasOverdrafts 1,545 1,592 277 318Home loans (1) 49,673 46,622 519 550Credit card outstandings 960 912 - -Lease financing 36 72 9 28Term loans and other lending 50,389 46,967 24,533 23,754Total overseas 102,603 96,165 25,338 24,650Gross loans, bills discounted and other receivables 736,539 700,299 651,793 622,261
LessProvisions for Loan Impairment (Note 13):
Collective provision (2,722) (2,783) (2,457) (2,510)Individually assessed provisions (971) (935) (888) (855)
Unearned income:Term loans (681) (701) (680) (699)Lease financing (403) (482) (265) (278)
(4,777) (4,901) (4,290) (4,342)Net loans, bills discounted and other receivables 731,762 695,398 647,503 617,919
(1) Home loans balance includes residential mortgages that have been assigned to securitisation vehicles and covered bond trusts. Further detail on theseresidential mortgages is disclosed in Note 41.
(2) The Group measures bills discounted intended to be sold into the market at fair value and includes these within loans, bills discounted and otherreceivables to reflect the nature of the lending arrangement.
Based on behavioural terms and current market conditions, the amounts expected to be recovered within 12 months of the Balance Sheet date are $177,267 million (2016: $206,157 million) for the Group, and $161,734 million (2016: $191,962 million) for the Bank. The maturity tables below are based on contractual terms.
Finance Lease Receivables The Group and the Bank provide finance leases to a broad range of clients to support financing needs in acquiring transportation assets such as trains, aircraft, ships and major production and manufacturing equipment. Finance lease receivables are included within loans, bills discounted and other receivables to customers.
Group 2017 2016
Gross Present Value Gross Present Value Investment in of Minimum Investment in of Minimum
Finance Lease Unearned Lease Payment Finance Lease Unearned Lease Payment Receivable Income Receivable Receivable Income Receivable
$M $M $M $M $M $M
Not later than one year 1,439 (151) 1,288 1,247 (161) 1,086One year to five years 2,651 (187) 2,464 2,906 (287) 2,619Over five years 248 (65) 183 331 (34) 297
4,338 (403) 3,935 4,484 (482) 4,002
65
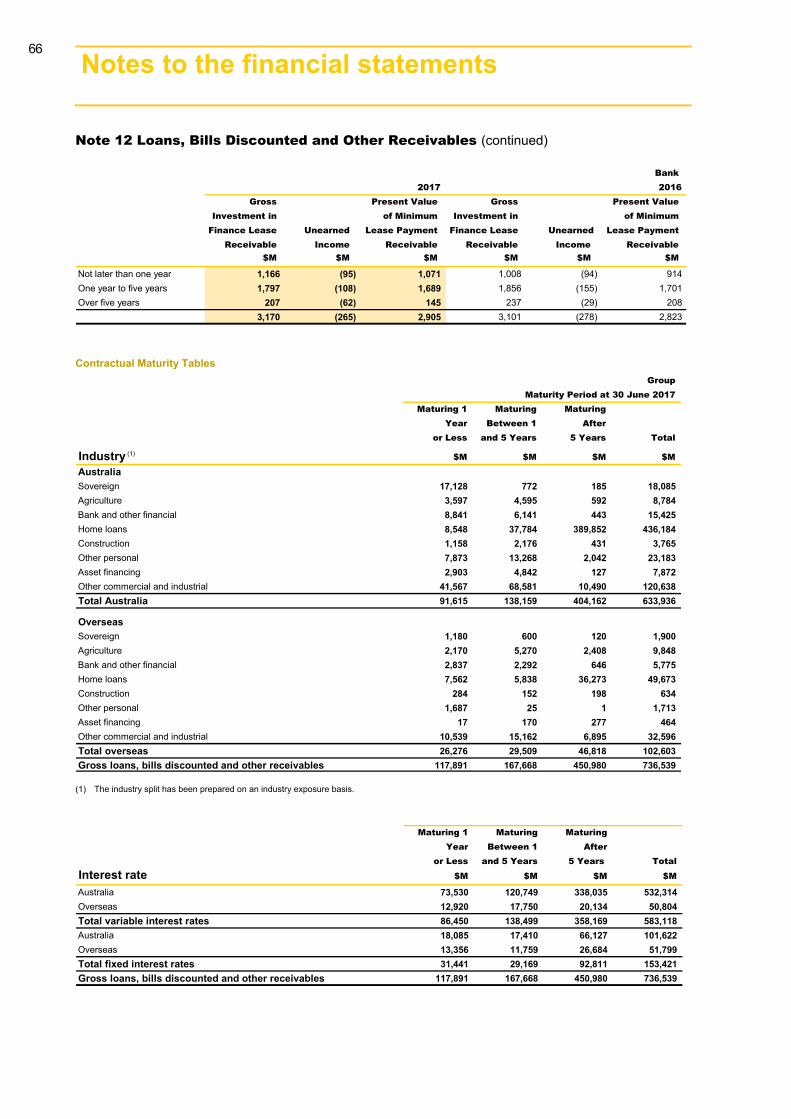
Notes to the financial statements 120
Note 12 Loans, Bills Discounted and Other Receivables (continued)
Bank 2017 2016
Gross Present Value Gross Present Value Investment in of Minimum Investment in of Minimum Finance Lease Unearned Lease Payment Finance Lease Unearned Lease Payment
Receivable Income Receivable Receivable Income Receivable$M $M $M $M $M $M
Not later than one year 1,166 (95) 1,071 1,008 (94) 914One year to five years 1,797 (108) 1,689 1,856 (155) 1,701Over five years 207 (62) 145 237 (29) 208
3,170 (265) 2,905 3,101 (278) 2,823
Contractual Maturity Tables Group
Maturity Period at 30 June 2017Maturing 1 Maturing Maturing
Year Between 1 Afteror Less and 5 Years 5 Years Total
Industry (1) $M $M $M $M
AustraliaSovereign 17,128 772 185 18,085Agriculture 3,597 4,595 592 8,784Bank and other financial 8,841 6,141 443 15,425Home loans 8,548 37,784 389,852 436,184Construction 1,158 2,176 431 3,765Other personal 7,873 13,268 2,042 23,183Asset financing 2,903 4,842 127 7,872Other commercial and industrial 41,567 68,581 10,490 120,638Total Australia 91,615 138,159 404,162 633,936
OverseasSovereign 1,180 600 120 1,900Agriculture 2,170 5,270 2,408 9,848Bank and other financial 2,837 2,292 646 5,775Home loans 7,562 5,838 36,273 49,673Construction 284 152 198 634Other personal 1,687 25 1 1,713Asset financing 17 170 277 464Other commercial and industrial 10,539 15,162 6,895 32,596Total overseas 26,276 29,509 46,818 102,603Gross loans, bills discounted and other receivables 117,891 167,668 450,980 736,539
(1) The industry split has been prepared on an industry exposure basis.
Maturing 1 Maturing MaturingYear Between 1 After
or Less and 5 Years 5 Years TotalInterest rate $M $M $M $M
Australia 73,530 120,749 338,035 532,314Overseas 12,920 17,750 20,134 50,804Total variable interest rates 86,450 138,499 358,169 583,118Australia 18,085 17,410 66,127 101,622Overseas 13,356 11,759 26,684 51,799Total fixed interest rates 31,441 29,169 92,811 153,421Gross loans, bills discounted and other receivables 117,891 167,668 450,980 736,539
66
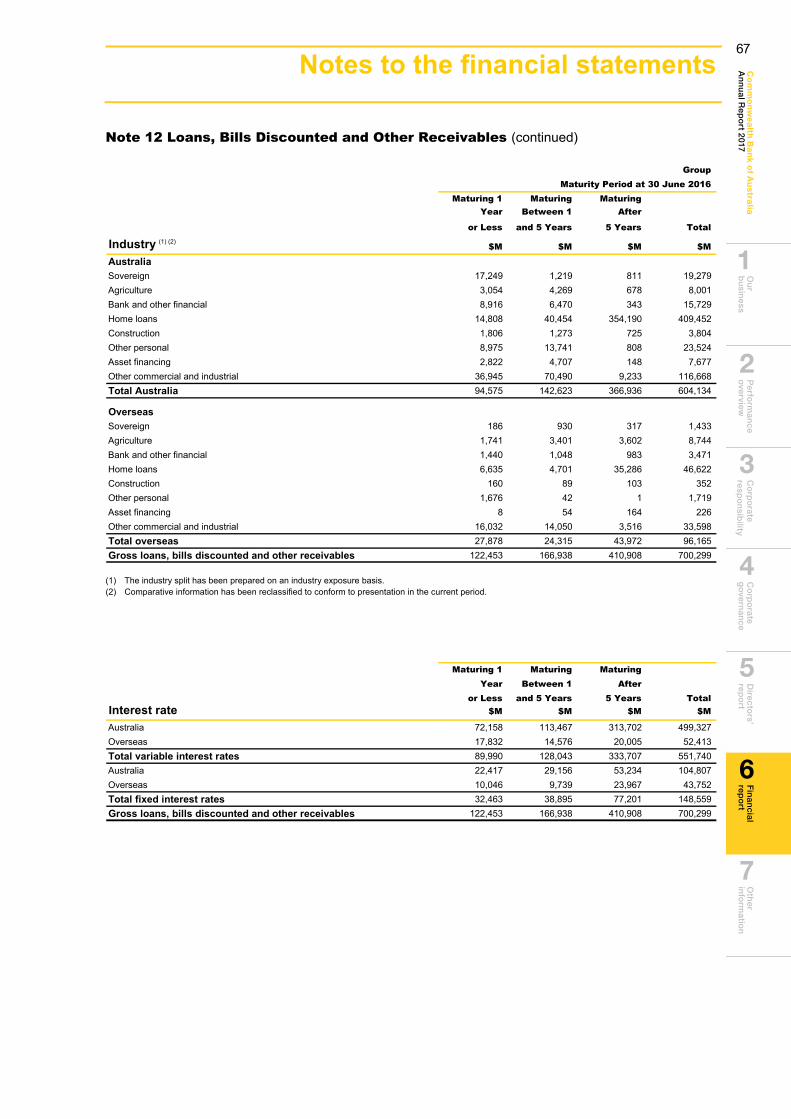
Ou
r b
usin
essP
erform
ance
overview
C
orp
orate
respo
nsib
ility C
orp
orate
go
vernan
ceD
irectors’
repo
rtO
ther
info
rmatio
nC
om
mo
nw
ea
lth Ba
nk o
f Au
stralia
An
nu
al Rep
ort 2017
Fin
ancial
repo
rt
6
2
1
3
4
5
7
Notes to the financial statements 121
Note 12 Loans, Bills Discounted and Other Receivables (continued)
GroupMaturity Period at 30 June 2016
Maturing 1 Maturing MaturingYear Between 1 After
or Less and 5 Years 5 Years Total
Industry (1) (2) $M $M $M $M
AustraliaSovereign 17,249 1,219 811 19,279Agriculture 3,054 4,269 678 8,001Bank and other financial 8,916 6,470 343 15,729Home loans 14,808 40,454 354,190 409,452Construction 1,806 1,273 725 3,804Other personal 8,975 13,741 808 23,524Asset financing 2,822 4,707 148 7,677Other commercial and industrial 36,945 70,490 9,233 116,668Total Australia 94,575 142,623 366,936 604,134
OverseasSovereign 186 930 317 1,433Agriculture 1,741 3,401 3,602 8,744Bank and other financial 1,440 1,048 983 3,471Home loans 6,635 4,701 35,286 46,622Construction 160 89 103 352Other personal 1,676 42 1 1,719Asset financing 8 54 164 226Other commercial and industrial 16,032 14,050 3,516 33,598Total overseas 27,878 24,315 43,972 96,165Gross loans, bills discounted and other receivables 122,453 166,938 410,908 700,299
(1) The industry split has been prepared on an industry exposure basis.(2) Comparative information has been reclassified to conform to presentation in the current period.
Maturing 1 Maturing MaturingYear Between 1 After
or Less and 5 Years 5 Years TotalInterest rate $M $M $M $M
Australia 72,158 113,467 313,702 499,327Overseas 17,832 14,576 20,005 52,413Total variable interest rates 89,990 128,043 333,707 551,740Australia 22,417 29,156 53,234 104,807Overseas 10,046 9,739 23,967 43,752Total fixed interest rates 32,463 38,895 77,201 148,559Gross loans, bills discounted and other receivables 122,453 166,938 410,908 700,299
67
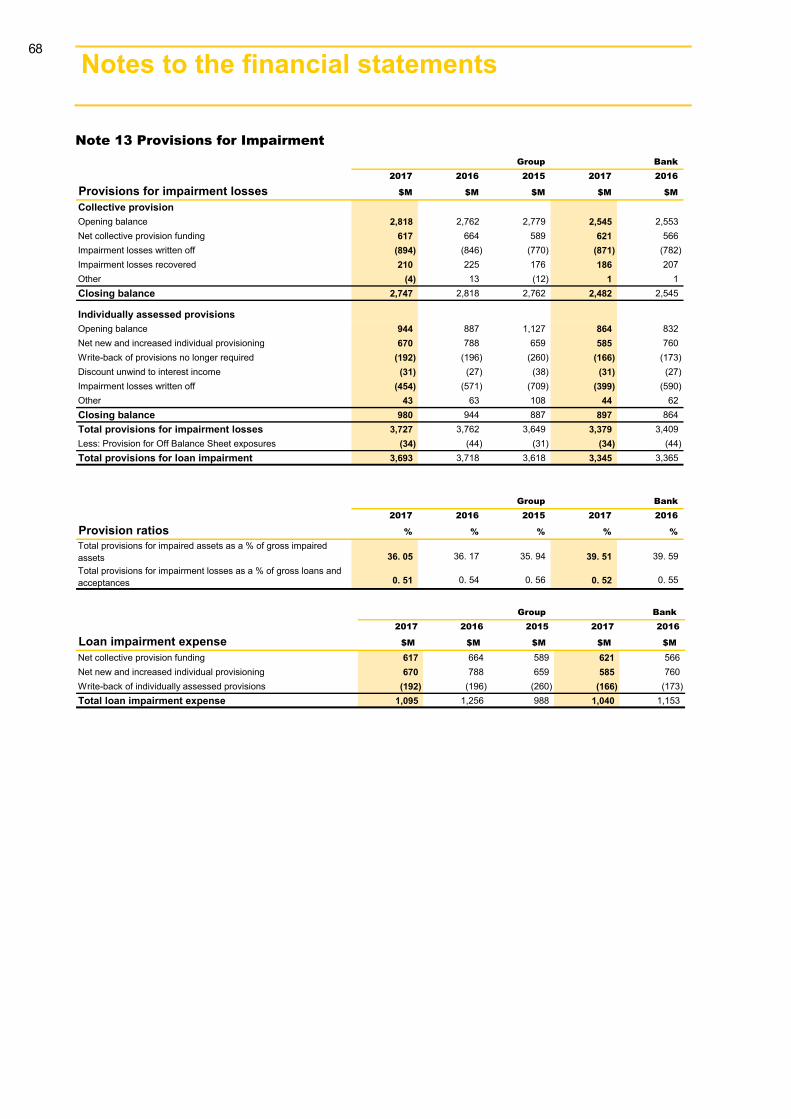
Notes to the financial statements 122
Note 13 Provisions for Impairment Group Bank
2017 2016 2015 2017 2016
Provisions for impairment losses $M $M $M $M $M
Collective provisionOpening balance 2,818 2,762 2,779 2,545 2,553Net collective provision funding 617 664 589 621 566Impairment losses written off (894) (846) (770) (871) (782)Impairment losses recovered 210 225 176 186 207Other (4) 13 (12) 1 1Closing balance 2,747 2,818 2,762 2,482 2,545
Individually assessed provisionsOpening balance 944 887 1,127 864 832Net new and increased individual provisioning 670 788 659 585 760Write-back of provisions no longer required (192) (196) (260) (166) (173)Discount unwind to interest income (31) (27) (38) (31) (27)Impairment losses written off (454) (571) (709) (399) (590)Other 43 63 108 44 62Closing balance 980 944 887 897 864Total provisions for impairment losses 3,727 3,762 3,649 3,379 3,409Less: Provision for Off Balance Sheet exposures (34) (44) (31) (34) (44)Total provisions for loan impairment 3,693 3,718 3,618 3,345 3,365
Group Bank2017 2016 2015 2017 2016
Provision ratios % % % % %Total provisions for impaired assets as a % of gross impaired assets 36. 05 36. 17 35. 94 39. 51 39. 59Total provisions for impairment losses as a % of gross loans and acceptances 0. 51 0. 54 0. 56 0. 52 0. 55
Group Bank2017 2016 2015 2017 2016
Loan impairment expense $M $M $M $M $M
Net collective provision funding 617 664 589 621 566Net new and increased individual provisioning 670 788 659 585 760Write-back of individually assessed provisions (192) (196) (260) (166) (173)Total loan impairment expense 1,095 1,256 988 1,040 1,153
68
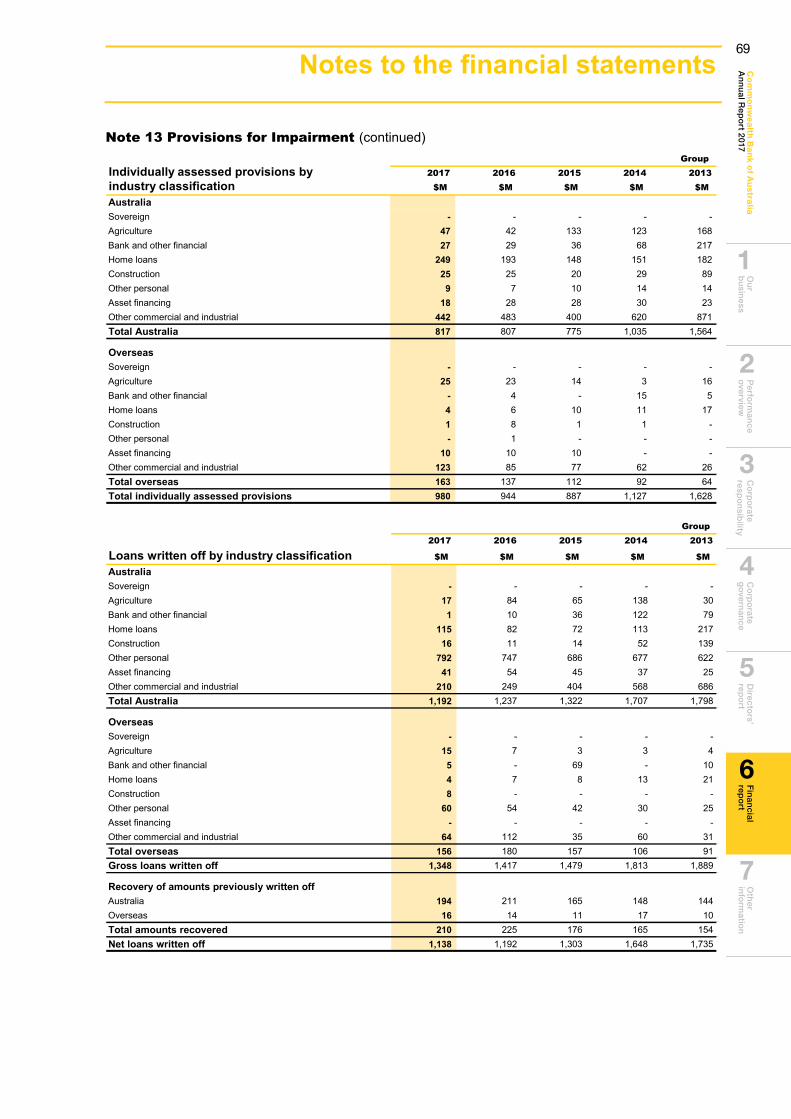
Ou
r b
usin
essP
erform
ance
overview
C
orp
orate
respo
nsib
ility C
orp
orate
go
vernan
ceD
irectors’
repo
rtO
ther
info
rmatio
nC
om
mo
nw
ea
lth Ba
nk o
f Au
stralia
An
nu
al Rep
ort 2017
Fin
ancial
repo
rt
6
2
1
3
4
5
7
Notes to the financial statements 123
Note 13 Provisions for Impairment (continued) Group
Individually assessed provisions by 2017 2016 2015 2014 2013industry classification $M $M $M $M $M
AustraliaSovereign - - - - -Agriculture 47 42 133 123 168Bank and other financial 27 29 36 68 217Home loans 249 193 148 151 182Construction 25 25 20 29 89Other personal 9 7 10 14 14Asset financing 18 28 28 30 23Other commercial and industrial 442 483 400 620 871Total Australia 817 807 775 1,035 1,564
OverseasSovereign - - - - -Agriculture 25 23 14 3 16Bank and other financial - 4 - 15 5Home loans 4 6 10 11 17Construction 1 8 1 1 -Other personal - 1 - - -Asset financing 10 10 10 - -Other commercial and industrial 123 85 77 62 26Total overseas 163 137 112 92 64Total individually assessed provisions 980 944 887 1,127 1,628
Group 2017 2016 2015 2014 2013
Loans written off by industry classification $M $M $M $M $M
AustraliaSovereign - - - - -Agriculture 17 84 65 138 30Bank and other financial 1 10 36 122 79Home loans 115 82 72 113 217Construction 16 11 14 52 139Other personal 792 747 686 677 622Asset financing 41 54 45 37 25Other commercial and industrial 210 249 404 568 686Total Australia 1,192 1,237 1,322 1,707 1,798
OverseasSovereign - - - - -Agriculture 15 7 3 3 4Bank and other financial 5 - 69 - 10Home loans 4 7 8 13 21Construction 8 - - - -Other personal 60 54 42 30 25Asset financing - - - - -Other commercial and industrial 64 112 35 60 31Total overseas 156 180 157 106 91Gross loans written off 1,348 1,417 1,479 1,813 1,889
Recovery of amounts previously written offAustralia 194 211 165 148 144Overseas 16 14 11 17 10Total amounts recovered 210 225 176 165 154Net loans written off 1,138 1,192 1,303 1,648 1,735
69
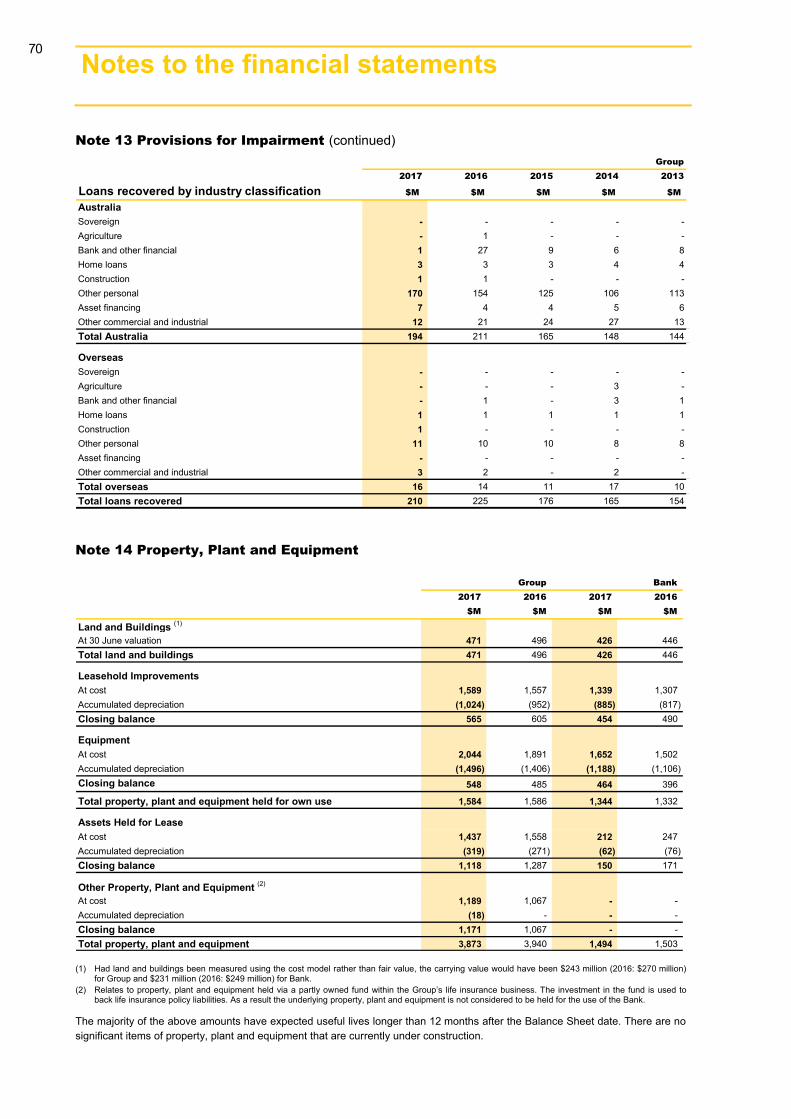
Notes to the financial statements 124
Note 13 Provisions for Impairment (continued) Group
2017 2016 2015 2014 2013
Loans recovered by industry classification $M $M $M $M $M
AustraliaSovereign - - - - -Agriculture - 1 - - -Bank and other financial 1 27 9 6 8Home loans 3 3 3 4 4Construction 1 1 - - -Other personal 170 154 125 106 113Asset financing 7 4 4 5 6Other commercial and industrial 12 21 24 27 13Total Australia 194 211 165 148 144
OverseasSovereign - - - - -Agriculture - - - 3 -Bank and other financial - 1 - 3 1Home loans 1 1 1 1 1Construction 1 - - - -Other personal 11 10 10 8 8Asset financing - - - - -Other commercial and industrial 3 2 - 2 -Total overseas 16 14 11 17 10Total loans recovered 210 225 176 165 154
Note 14 Property, Plant and Equipment
Group Bank2017 2016 2017 2016
$M $M $M $M
Land and Buildings (1)
At 30 June valuation 471 496 426 446Total land and buildings 471 496 426 446
Leasehold ImprovementsAt cost 1,589 1,557 1,339 1,307Accumulated depreciation (1,024) (952) (885) (817)Closing balance 565 605 454 490
EquipmentAt cost 2,044 1,891 1,652 1,502Accumulated depreciation (1,496) (1,406) (1,188) (1,106)Closing balance 548 485 464 396
Total property, plant and equipment held for own use 1,584 1,586 1,344 1,332
Assets Held for LeaseAt cost 1,437 1,558 212 247Accumulated depreciation (319) (271) (62) (76)Closing balance 1,118 1,287 150 171
Other Property, Plant and Equipment (2)
At cost 1,189 1,067 - -Accumulated depreciation (18) - - -Closing balance 1,171 1,067 - -Total property, plant and equipment 3,873 3,940 1,494 1,503
(1) Had land and buildings been measured using the cost model rather than fair value, the carrying value would have been $243 million (2016: $270 million) for Group and $231 million (2016: $249 million) for Bank.
(2) Relates to property, plant and equipment held via a partly owned fund within the Group’s life insurance business. The investment in the fund is used to back life insurance policy liabilities. As a result the underlying property, plant and equipment is not considered to be held for the use of the Bank.
The majority of the above amounts have expected useful lives longer than 12 months after the Balance Sheet date. There are no significant items of property, plant and equipment that are currently under construction.
70
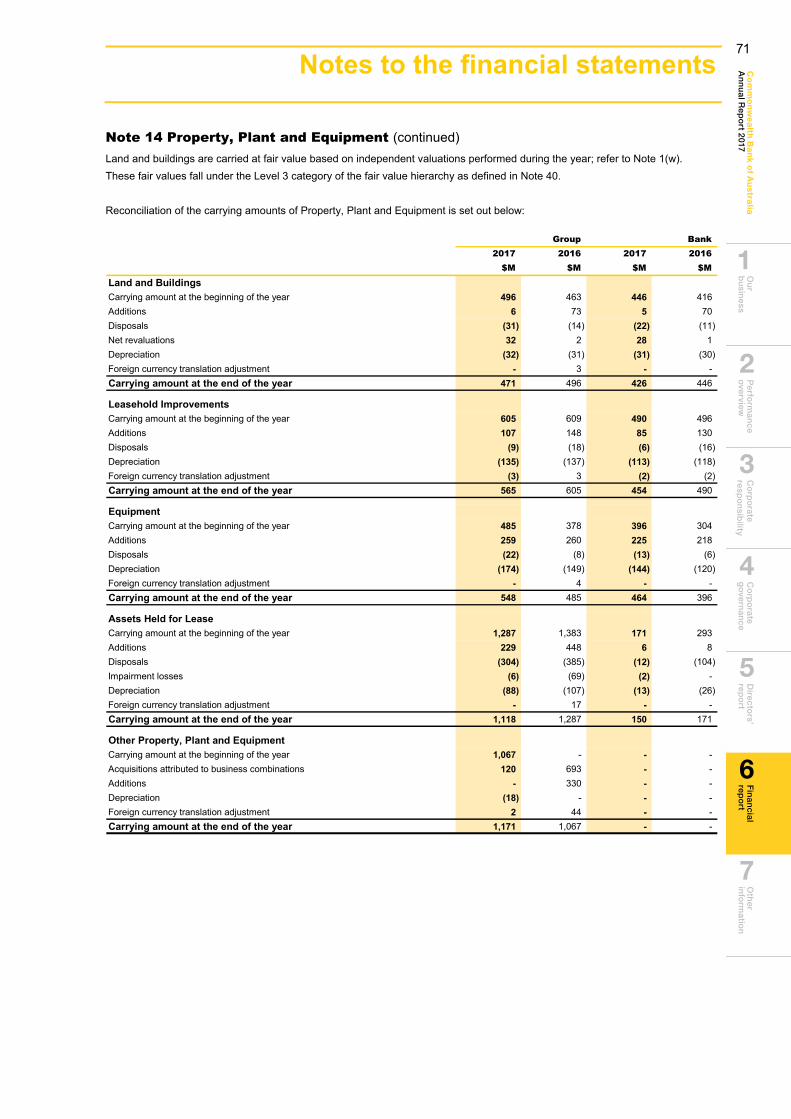
Ou
r b
usin
essP
erform
ance
overview
C
orp
orate
respo
nsib
ility C
orp
orate
go
vernan
ceD
irectors’
repo
rtO
ther
info
rmatio
nC
om
mo
nw
ea
lth Ba
nk o
f Au
stralia
An
nu
al Rep
ort 2017
Fin
ancial
repo
rt
6
2
1
3
4
5
7
Notes to the financial statements 125
Note 14 Property, Plant and Equipment (continued) Land and buildings are carried at fair value based on independent valuations performed during the year; refer to Note 1(w). These fair values fall under the Level 3 category of the fair value hierarchy as defined in Note 40.
Reconciliation of the carrying amounts of Property, Plant and Equipment is set out below:
Group Bank2017 2016 2017 2016
$M $M $M $M
Land and BuildingsCarrying amount at the beginning of the year 496 463 446 416Additions 6 73 5 70Disposals (31) (14) (22) (11)Net revaluations 32 2 28 1Depreciation (32) (31) (31) (30)Foreign currency translation adjustment - 3 - -Carrying amount at the end of the year 471 496 426 446
Leasehold ImprovementsCarrying amount at the beginning of the year 605 609 490 496Additions 107 148 85 130Disposals (9) (18) (6) (16)Depreciation (135) (137) (113) (118)Foreign currency translation adjustment (3) 3 (2) (2)Carrying amount at the end of the year 565 605 454 490
EquipmentCarrying amount at the beginning of the year 485 378 396 304Additions 259 260 225 218Disposals (22) (8) (13) (6)Depreciation (174) (149) (144) (120)Foreign currency translation adjustment - 4 - -Carrying amount at the end of the year 548 485 464 396
Assets Held for LeaseCarrying amount at the beginning of the year 1,287 1,383 171 293Additions 229 448 6 8Disposals (304) (385) (12) (104)Impairment losses (6) (69) (2) -Depreciation (88) (107) (13) (26)Foreign currency translation adjustment - 17 - -Carrying amount at the end of the year 1,118 1,287 150 171
Other Property, Plant and EquipmentCarrying amount at the beginning of the year 1,067 - - -Acquisitions attributed to business combinations 120 693 - -Additions - 330 - -Depreciation (18) - - -Foreign currency translation adjustment 2 44 - -Carrying amount at the end of the year 1,171 1,067 - -
71
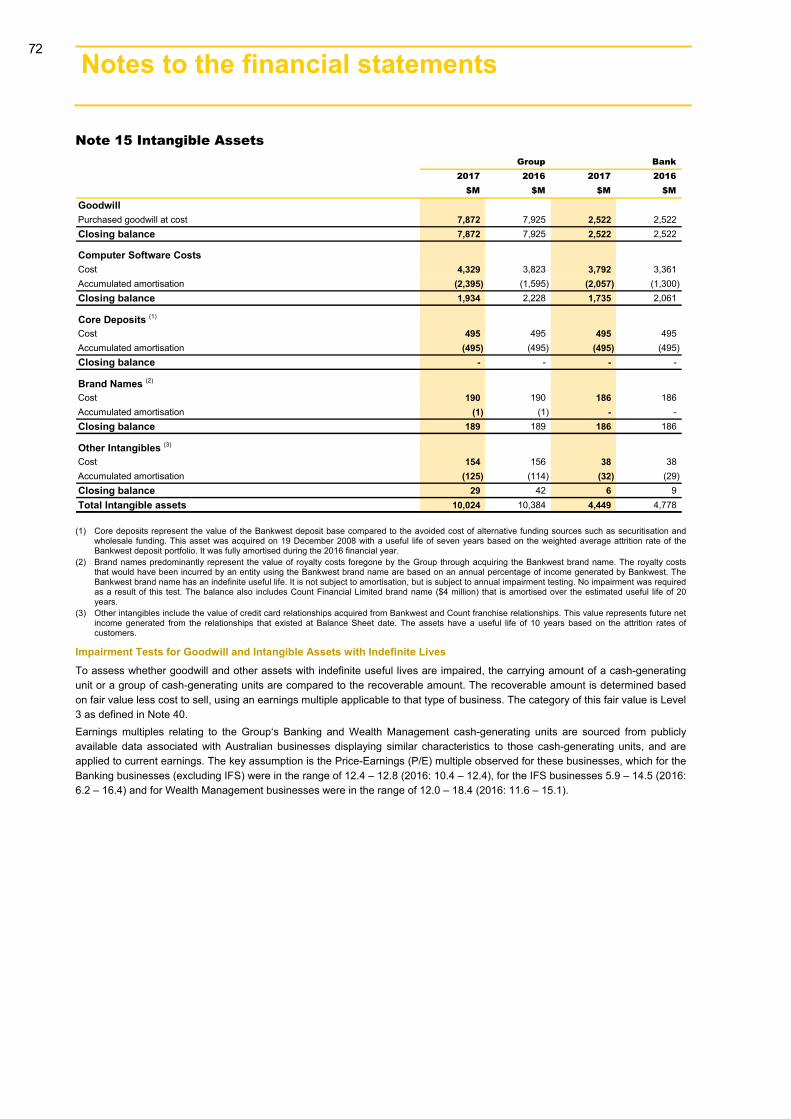
Notes to the financial statements 126
Note 15 Intangible Assets Group Bank
2017 2016 2017 2016$M $M $M $M
Goodwill Purchased goodwill at cost 7,872 7,925 2,522 2,522Closing balance 7,872 7,925 2,522 2,522
Computer Software CostsCost 4,329 3,823 3,792 3,361Accumulated amortisation (2,395) (1,595) (2,057) (1,300)Closing balance 1,934 2,228 1,735 2,061
Core Deposits (1)
Cost 495 495 495 495Accumulated amortisation (495) (495) (495) (495)Closing balance - - - -
Brand Names (2)
Cost 190 190 186 186Accumulated amortisation (1) (1) - -Closing balance 189 189 186 186
Other Intangibles (3)
Cost 154 156 38 38Accumulated amortisation (125) (114) (32) (29)Closing balance 29 42 6 9Total Intangible assets 10,024 10,384 4,449 4,778
(1) Core deposits represent the value of the Bankwest deposit base compared to the avoided cost of alternative funding sources such as securitisation and wholesale funding. This asset was acquired on 19 December 2008 with a useful life of seven years based on the weighted average attrition rate of the Bankwest deposit portfolio. It was fully amortised during the 2016 financial year.
(2) Brand names predominantly represent the value of royalty costs foregone by the Group through acquiring the Bankwest brand name. The royalty costs that would have been incurred by an entity using the Bankwest brand name are based on an annual percentage of income generated by Bankwest. The Bankwest brand name has an indefinite useful life. It is not subject to amortisation, but is subject to annual impairment testing. No impairment was required as a result of this test. The balance also includes Count Financial Limited brand name ($4 million) that is amortised over the estimated useful life of 20 years.
(3) Other intangibles include the value of credit card relationships acquired from Bankwest and Count franchise relationships. This value represents future netincome generated from the relationships that existed at Balance Sheet date. The assets have a useful life of 10 years based on the attrition rates ofcustomers.
Impairment Tests for Goodwill and Intangible Assets with Indefinite Lives To assess whether goodwill and other assets with indefinite useful lives are impaired, the carrying amount of a cash-generating unit or a group of cash-generating units are compared to the recoverable amount. The recoverable amount is determined based on fair value less cost to sell, using an earnings multiple applicable to that type of business. The category of this fair value is Level 3 as defined in Note 40. Earnings multiples relating to the Group‘s Banking and Wealth Management cash-generating units are sourced from publicly available data associated with Australian businesses displaying similar characteristics to those cash-generating units, and are applied to current earnings. The key assumption is the Price-Earnings (P/E) multiple observed for these businesses, which for the Banking businesses (excluding IFS) were in the range of 12.4 – 12.8 (2016: 10.4 – 12.4), for the IFS businesses 5.9 – 14.5 (2016: 6.2 – 16.4) and for Wealth Management businesses were in the range of 12.0 – 18.4 (2016: 11.6 – 15.1).
72
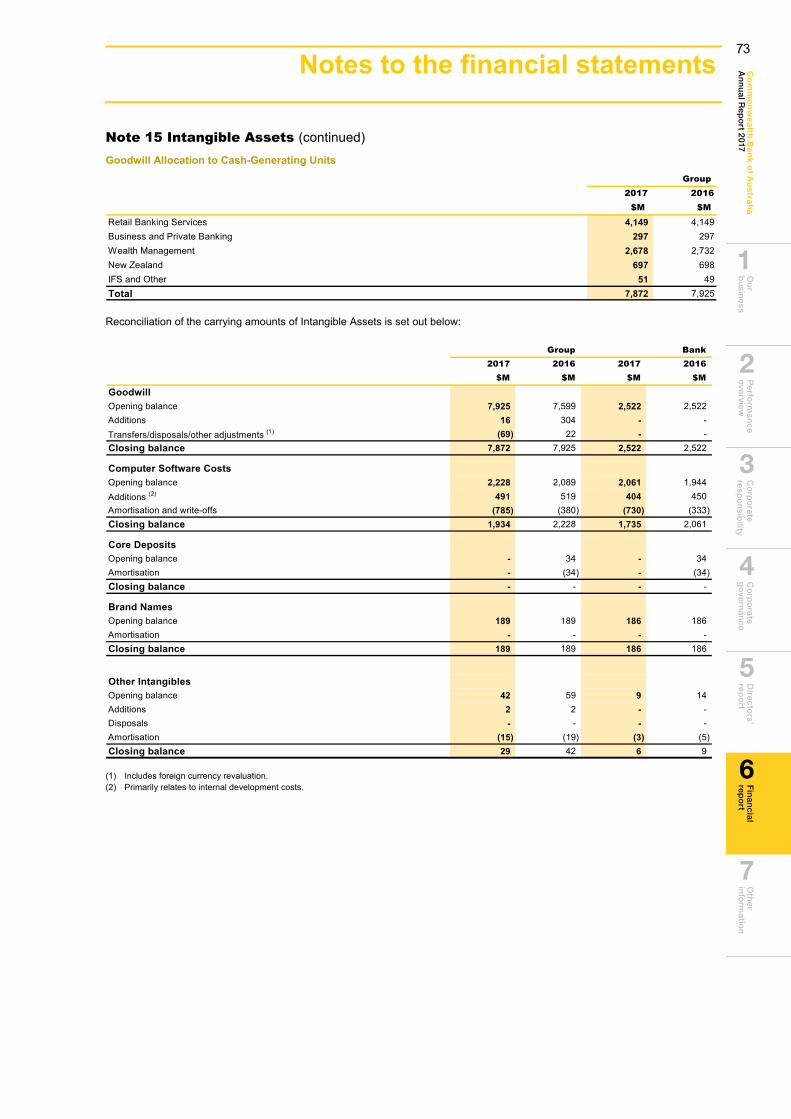
Ou
r b
usin
essP
erform
ance
overview
C
orp
orate
respo
nsib
ility C
orp
orate
go
vernan
ceD
irectors’
repo
rtO
ther
info
rmatio
nC
om
mo
nw
ea
lth Ba
nk o
f Au
stralia
An
nu
al Rep
ort 2017
Fin
ancial
repo
rt
6
2
1
3
4
5
7
Notes to the financial statements 127
Note 15 Intangible Assets (continued) Goodwill Allocation to Cash-Generating Units
Group 2017 2016
$M $M
Retail Banking Services 4,149 4,149Business and Private Banking 297 297Wealth Management 2,678 2,732New Zealand 697 698IFS and Other 51 49Total 7,872 7,925
Reconciliation of the carrying amounts of Intangible Assets is set out below:
Group Bank2017 2016 2017 2016
$M $M $M $M
Goodwill Opening balance 7,925 7,599 2,522 2,522Additions 16 304 - -Transfers/disposals/other adjustments (1) (69) 22 - -Closing balance 7,872 7,925 2,522 2,522
Computer Software CostsOpening balance 2,228 2,089 2,061 1,944Additions (2) 491 519 404 450Amortisation and write-offs (785) (380) (730) (333)Closing balance 1,934 2,228 1,735 2,061
Core DepositsOpening balance - 34 - 34Amortisation - (34) - (34)Closing balance - - - -
Brand NamesOpening balance 189 189 186 186Amortisation - - - -Closing balance 189 189 186 186
Other IntangiblesOpening balance 42 59 9 14Additions 2 2 - -Disposals - - - -Amortisation (15) (19) (3) (5)Closing balance 29 42 6 9
(1) Includes foreign currency revaluation.(2) Primarily relates to internal development costs.
73
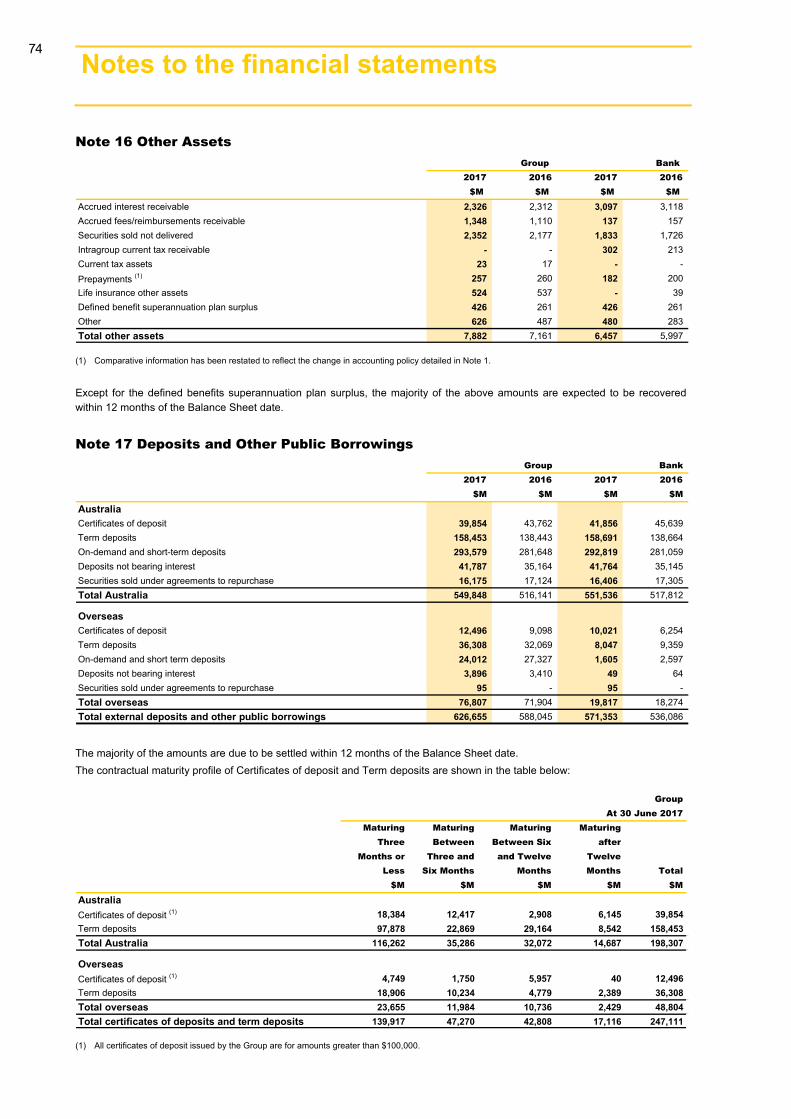
Notes to the financial statements 128
Note 16 Other Assets Group Bank
2017 2016 2017 2016$M $M $M $M
Accrued interest receivable 2,326 2,312 3,097 3,118Accrued fees/reimbursements receivable 1,348 1,110 137 157Securities sold not delivered 2,352 2,177 1,833 1,726Intragroup current tax receivable - - 302 213Current tax assets 23 17 - -Prepayments (1) 257 260 182 200Life insurance other assets 524 537 - 39Defined benefit superannuation plan surplus 426 261 426 261Other 626 487 480 283Total other assets 7,882 7,161 6,457 5,997
(1) Comparative information has been restated to reflect the change in accounting policy detailed in Note 1.
Except for the defined benefits superannuation plan surplus, the majority of the above amounts are expected to be recovered within 12 months of the Balance Sheet date.
Note 17 Deposits and Other Public Borrowings Group Bank
2017 2016 2017 2016$M $M $M $M
AustraliaCertificates of deposit 39,854 43,762 41,856 45,639Term deposits 158,453 138,443 158,691 138,664On-demand and short-term deposits 293,579 281,648 292,819 281,059Deposits not bearing interest 41,787 35,164 41,764 35,145Securities sold under agreements to repurchase 16,175 17,124 16,406 17,305Total Australia 549,848 516,141 551,536 517,812
OverseasCertificates of deposit 12,496 9,098 10,021 6,254Term deposits 36,308 32,069 8,047 9,359On-demand and short term deposits 24,012 27,327 1,605 2,597Deposits not bearing interest 3,896 3,410 49 64Securities sold under agreements to repurchase 95 - 95 -Total overseas 76,807 71,904 19,817 18,274Total external deposits and other public borrowings 626,655 588,045 571,353 536,086
The majority of the amounts are due to be settled within 12 months of the Balance Sheet date. The contractual maturity profile of Certificates of deposit and Term deposits are shown in the table below:
GroupAt 30 June 2017
Maturing Maturing Maturing MaturingThree Between Between Six after
Months or Three and and Twelve TwelveLess Six Months Months Months Total
$M $M $M $M $M
AustraliaCertificates of deposit (1) 18,384 12,417 2,908 6,145 39,854Term deposits 97,878 22,869 29,164 8,542 158,453Total Australia 116,262 35,286 32,072 14,687 198,307
OverseasCertificates of deposit (1) 4,749 1,750 5,957 40 12,496Term deposits 18,906 10,234 4,779 2,389 36,308Total overseas 23,655 11,984 10,736 2,429 48,804Total certificates of deposits and term deposits 139,917 47,270 42,808 17,116 247,111
(1) All certificates of deposit issued by the Group are for amounts greater than $100,000.
74

Ou
r b
usin
essP
erform
ance
overview
C
orp
orate
respo
nsib
ility C
orp
orate
go
vernan
ceD
irectors’
repo
rtO
ther
info
rmatio
nC
om
mo
nw
ea
lth Ba
nk o
f Au
stralia
An
nu
al Rep
ort 2017
Fin
ancial
repo
rt
6
2
1
3
4
5
7
Notes to the financial statements 129
Note 17 Deposits and Other Public Borrowings (continued) Group
At 30 June 2016Maturing Maturing Maturing Maturing
Three Between Between Six afterMonths or Three and and Twelve Twelve
Less Six Months Months Months Total$M $M $M $M $M
AustraliaCertificates of deposit (1) 21,571 11,370 653 10,168 43,762Term deposits 84,848 20,852 26,012 6,731 138,443Total Australia 106,419 32,222 26,665 16,899 182,205
OverseasCertificates of deposit (1) 6,906 1,452 532 208 9,098Term deposits 16,534 7,815 4,851 2,869 32,069Total overseas 23,440 9,267 5,383 3,077 41,167Total certificates of deposits and term deposits 129,859 41,489 32,048 19,976 223,372
(1) All certificates of deposit issued by the Group are for amounts greater than $100,000.
Note 18 Liabilities at Fair Value through Income Statement Group Bank
2017 2016 2017 2016$M $M $M $M
Deposits and other borrowings (1) 7,212 5,695 6,197 4,416Debt instruments (1) 655 1,848 267 276Trading liabilities 2,525 2,749 2,525 2,749Total liabilities at fair value through Income Statement 10,392 10,292 8,989 7,441
(1) These liabilities have been initially designated at fair value through the Income Statement.
Of the above amounts, trading liabilities are expected to be settled within 12 months of the Balance Sheet date for the Group and the Bank. For the Group, the majority of the other amounts are expected to be settled within 12 months of the Balance Sheet date. For the Bank, the majority of debt instruments are expected to be settled more than 12 months after the Balance Sheet date. The amount that would be contractually required to be paid at maturity to the holders of the financial liabilities designated at fair value through Income Statement for the Group is $7,878 million (2016: $7,345 million) and for the Bank is $6,437 million (2016: $4,501 million).
Note 19 Other Provisions Group Bank
2017 2016 2017 2016Note $M $M $M $M
Employee entitlements 847 823 757 730General insurance claims 273 260 - -Self insurance and non-lending losses 232 196 224 162Dividends 5 100 90 100 90Compliance, programs and regulation 69 78 69 78Restructuring costs 52 28 50 27Other 207 181 172 162Total other provisions 1,780 1,656 1,372 1,249
Maturity Distribution of Other Provisions Group Bank
2017 2016 2017 2016$M $M $M $M
Less than twelve months 1,441 1,320 1,089 968More than twelve months 339 336 283 281Total other provisions 1,780 1,656 1,372 1,249
75
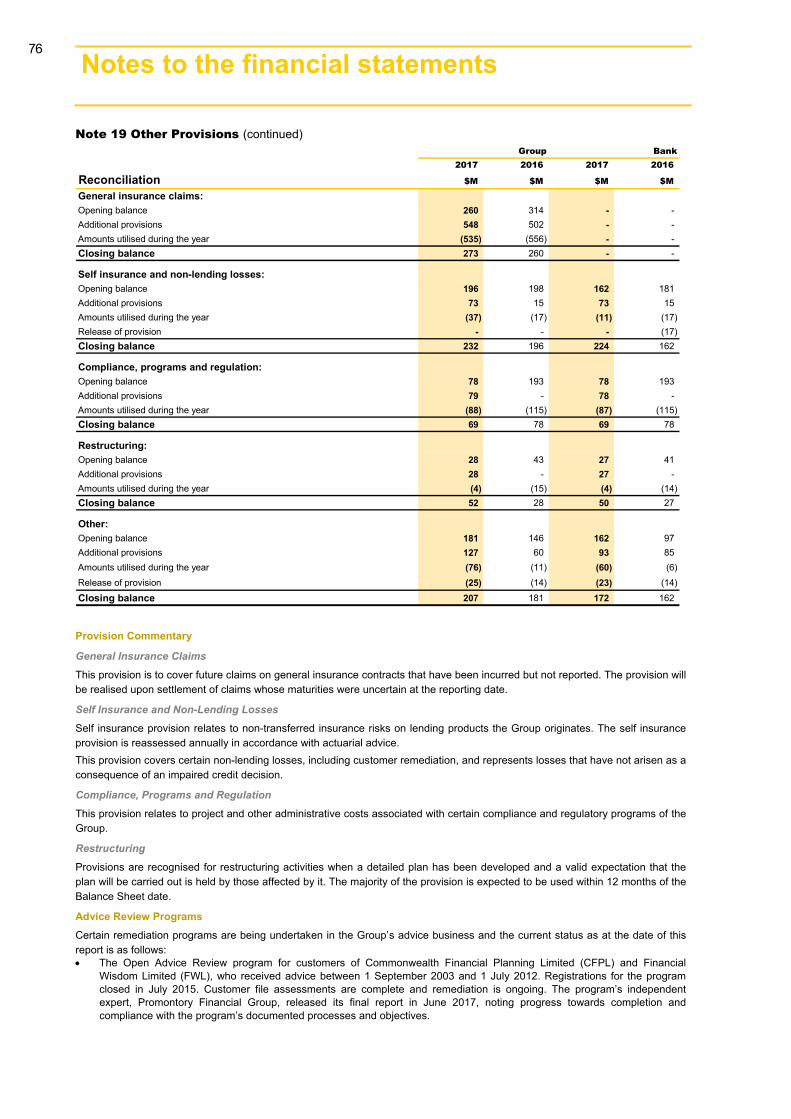
Notes to the financial statements 130
Note 19 Other Provisions (continued) Group Bank
2017 2016 2017 2016
Reconciliation $M $M $M $M
General insurance claims:Opening balance 260 314 - -Additional provisions 548 502 - -Amounts utilised during the year (535) (556) - -Closing balance 273 260 - -
Self insurance and non-lending losses: Opening balance 196 198 162 181Additional provisions 73 15 73 15Amounts utilised during the year (37) (17) (11) (17)Release of provision - - - (17)Closing balance 232 196 224 162
Compliance, programs and regulation:Opening balance 78 193 78 193Additional provisions 79 - 78 -Amounts utilised during the year (88) (115) (87) (115)Closing balance 69 78 69 78
Restructuring:Opening balance 28 43 27 41Additional provisions 28 - 27 -Amounts utilised during the year (4) (15) (4) (14)Closing balance 52 28 50 27
Other:Opening balance 181 146 162 97Additional provisions 127 60 93 85Amounts utilised during the year (76) (11) (60) (6)Release of provision (25) (14) (23) (14)Closing balance 207 181 172 162
Provision Commentary
General Insurance Claims
This provision is to cover future claims on general insurance contracts that have been incurred but not reported. The provision will be realised upon settlement of claims whose maturities were uncertain at the reporting date.
Self Insurance and Non-Lending Losses
Self insurance provision relates to non-transferred insurance risks on lending products the Group originates. The self insurance provision is reassessed annually in accordance with actuarial advice. This provision covers certain non-lending losses, including customer remediation, and represents losses that have not arisen as a consequence of an impaired credit decision.
Compliance, Programs and Regulation
This provision relates to project and other administrative costs associated with certain compliance and regulatory programs of the Group.
Restructuring
Provisions are recognised for restructuring activities when a detailed plan has been developed and a valid expectation that the plan will be carried out is held by those affected by it. The majority of the provision is expected to be used within 12 months of the Balance Sheet date.
Advice Review Programs Certain remediation programs are being undertaken in the Group’s advice business and the current status as at the date of this report is as follows: The Open Advice Review program for customers of Commonwealth Financial Planning Limited (CFPL) and Financial
Wisdom Limited (FWL), who received advice between 1 September 2003 and 1 July 2012. Registrations for the programclosed in July 2015. Customer file assessments are complete and remediation is ongoing. The program’s independentexpert, Promontory Financial Group, released its final report in June 2017, noting progress towards completion andcompliance with the program’s documented processes and objectives.
76
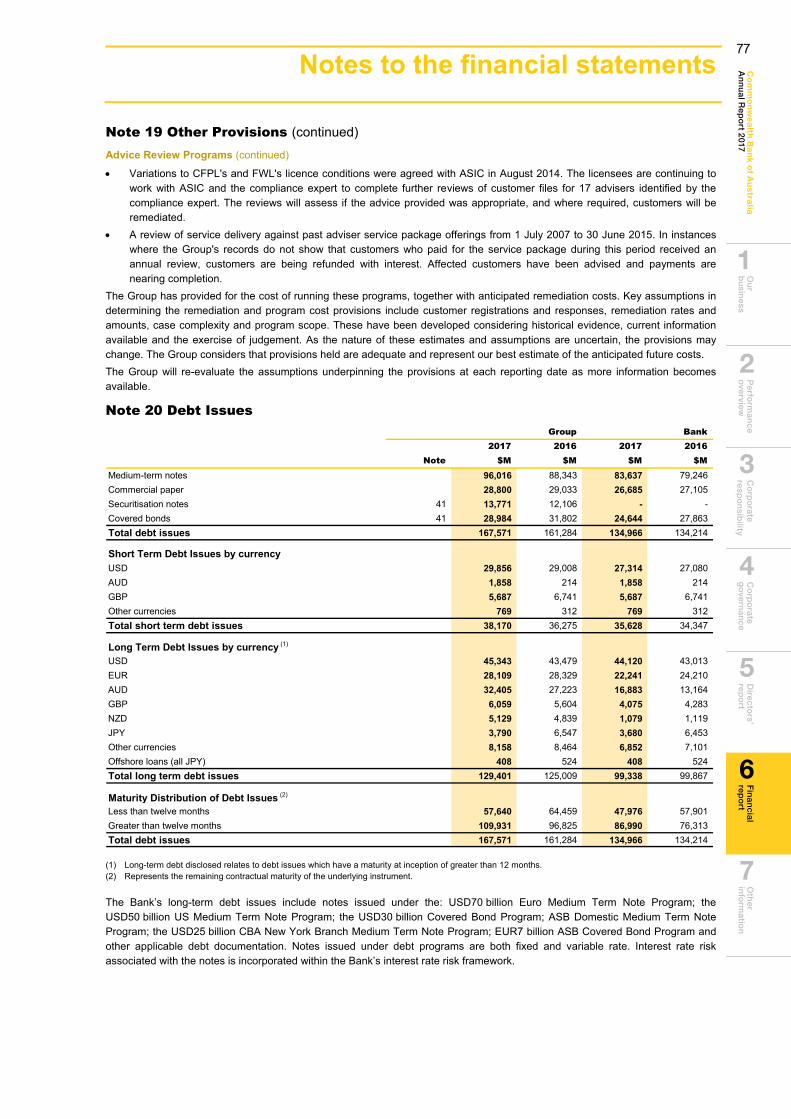
Ou
r b
usin
essP
erform
ance
overview
C
orp
orate
respo
nsib
ility C
orp
orate
go
vernan
ceD
irectors’
repo
rtO
ther
info
rmatio
nC
om
mo
nw
ea
lth Ba
nk o
f Au
stralia
An
nu
al Rep
ort 2017
Fin
ancial
repo
rt
6
2
1
3
4
5
7
Notes to the financial statements 131
Note 19 Other Provisions (continued) Advice Review Programs (continued)
Variations to CFPL's and FWL's licence conditions were agreed with ASIC in August 2014. The licensees are continuing towork with ASIC and the compliance expert to complete further reviews of customer files for 17 advisers identified by thecompliance expert. The reviews will assess if the advice provided was appropriate, and where required, customers will beremediated.
A review of service delivery against past adviser service package offerings from 1 July 2007 to 30 June 2015. In instanceswhere the Group's records do not show that customers who paid for the service package during this period received anannual review, customers are being refunded with interest. Affected customers have been advised and payments arenearing completion.
The Group has provided for the cost of running these programs, together with anticipated remediation costs. Key assumptions in determining the remediation and program cost provisions include customer registrations and responses, remediation rates and amounts, case complexity and program scope. These have been developed considering historical evidence, current information available and the exercise of judgement. As the nature of these estimates and assumptions are uncertain, the provisions may change. The Group considers that provisions held are adequate and represent our best estimate of the anticipated future costs. The Group will re-evaluate the assumptions underpinning the provisions at each reporting date as more information becomes available.
Note 20 Debt Issues Group Bank
2017 2016 2017 2016Note $M $M $M $M
Medium-term notes 96,016 88,343 83,637 79,246Commercial paper 28,800 29,033 26,685 27,105Securitisation notes 41 13,771 12,106 - -Covered bonds 41 28,984 31,802 24,644 27,863Total debt issues 167,571 161,284 134,966 134,214
Short Term Debt Issues by currencyUSD 29,856 29,008 27,314 27,080AUD 1,858 214 1,858 214GBP 5,687 6,741 5,687 6,741Other currencies 769 312 769 312Total short term debt issues 38,170 36,275 35,628 34,347
Long Term Debt Issues by currency (1)
USD 45,343 43,479 44,120 43,013EUR 28,109 28,329 22,241 24,210AUD 32,405 27,223 16,883 13,164GBP 6,059 5,604 4,075 4,283NZD 5,129 4,839 1,079 1,119JPY 3,790 6,547 3,680 6,453Other currencies 8,158 8,464 6,852 7,101Offshore loans (all JPY) 408 524 408 524Total long term debt issues 129,401 125,009 99,338 99,867
Maturity Distribution of Debt Issues (2)
Less than twelve months 57,640 64,459 47,976 57,901Greater than twelve months 109,931 96,825 86,990 76,313Total debt issues 167,571 161,284 134,966 134,214
(1) Long-term debt disclosed relates to debt issues which have a maturity at inception of greater than 12 months. (2) Represents the remaining contractual maturity of the underlying instrument.
The Bank’s long-term debt issues include notes issued under the: USD70 billion Euro Medium Term Note Program; the USD50 billion US Medium Term Note Program; the USD30 billion Covered Bond Program; ASB Domestic Medium Term Note Program; the USD25 billion CBA New York Branch Medium Term Note Program; EUR7 billion ASB Covered Bond Program and other applicable debt documentation. Notes issued under debt programs are both fixed and variable rate. Interest rate risk associated with the notes is incorporated within the Bank’s interest rate risk framework.
77
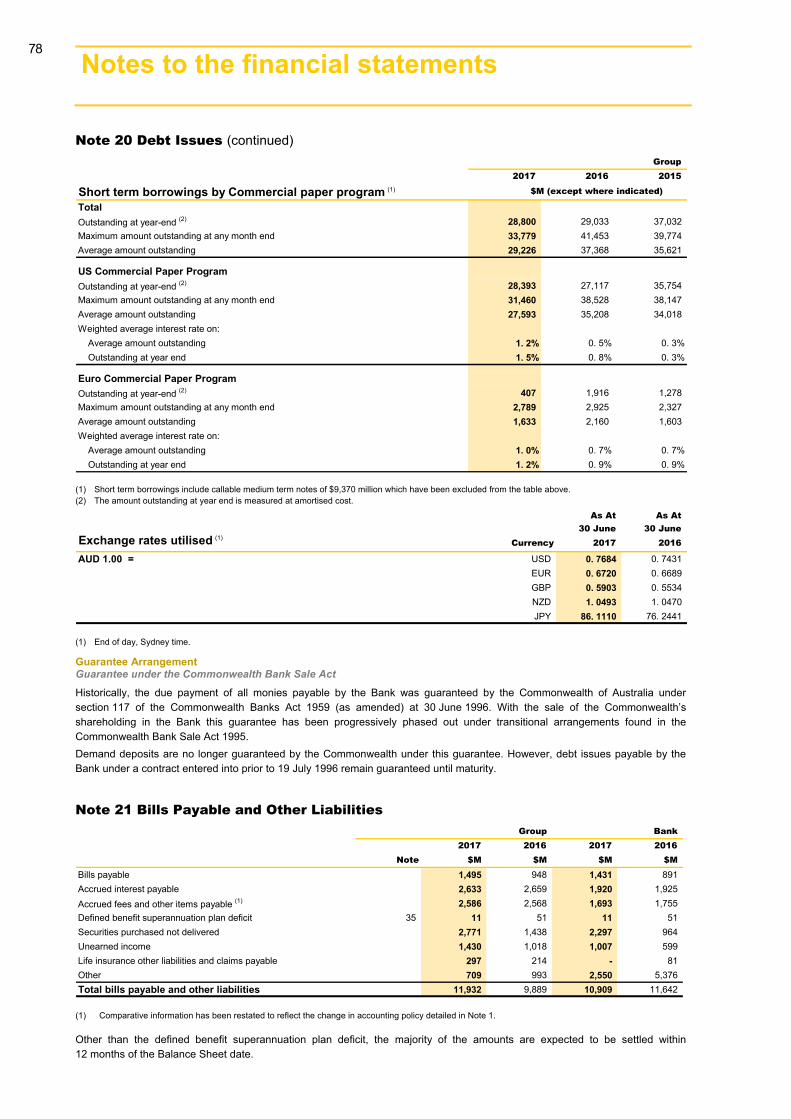
Notes to the financial statements 132
Note 20 Debt Issues (continued) Group
2017 2016 2015
Short term borrowings by Commercial paper program (1)
TotalOutstanding at year-end (2) 28,800 29,033 37,032Maximum amount outstanding at any month end 33,779 41,453 39,774Average amount outstanding 29,226 37,368 35,621
US Commercial Paper ProgramOutstanding at year-end (2) 28,393 27,117 35,754Maximum amount outstanding at any month end 31,460 38,528 38,147Average amount outstanding 27,593 35,208 34,018Weighted average interest rate on:
Average amount outstanding 1. 2% 0. 5% 0. 3%Outstanding at year end 1. 5% 0. 8% 0. 3%
Euro Commercial Paper ProgramOutstanding at year-end (2) 407 1,916 1,278Maximum amount outstanding at any month end 2,789 2,925 2,327Average amount outstanding 1,633 2,160 1,603Weighted average interest rate on:
Average amount outstanding 1. 0% 0. 7% 0. 7%Outstanding at year end 1. 2% 0. 9% 0. 9%
$M (except where indicated)
(1) Short term borrowings include callable medium term notes of $9,370 million which have been excluded from the table above.(2) The amount outstanding at year end is measured at amortised cost.
As At As At30 June 30 June
Currency 2017 2016
AUD 1.00 = USD 0. 7684 0. 7431EUR 0. 6720 0. 6689GBP 0. 5903 0. 5534NZD 1. 0493 1. 0470JPY 86. 1110 76. 2441
Exchange rates utilised (1)
(1) End of day, Sydney time.
Guarantee Arrangement Guarantee under the Commonwealth Bank Sale Act
Historically, the due payment of all monies payable by the Bank was guaranteed by the Commonwealth of Australia under section 117 of the Commonwealth Banks Act 1959 (as amended) at 30 June 1996. With the sale of the Commonwealth’s shareholding in the Bank this guarantee has been progressively phased out under transitional arrangements found in the Commonwealth Bank Sale Act 1995. Demand deposits are no longer guaranteed by the Commonwealth under this guarantee. However, debt issues payable by the Bank under a contract entered into prior to 19 July 1996 remain guaranteed until maturity.
Note 21 Bills Payable and Other Liabilities Group Bank
2017 2016 2017 2016Note $M $M $M $M
Bills payable 1,495 948 1,431 891Accrued interest payable 2,633 2,659 1,920 1,925Accrued fees and other items payable (1) 2,586 2,568 1,693 1,755Defined benefit superannuation plan deficit 35 11 51 11 51Securities purchased not delivered 2,771 1,438 2,297 964Unearned income 1,430 1,018 1,007 599Life insurance other liabilities and claims payable 297 214 - 81Other 709 993 2,550 5,376Total bills payable and other liabilities 11,932 9,889 10,909 11,642
(1) Comparative information has been restated to reflect the change in accounting policy detailed in Note 1.
Other than the defined benefit superannuation plan deficit, the majority of the amounts are expected to be settled within 12 months of the Balance Sheet date.
78

Ou
r b
usin
essP
erform
ance
overview
C
orp
orate
respo
nsib
ility C
orp
orate
go
vernan
ceD
irectors’
repo
rtO
ther
info
rmatio
nC
om
mo
nw
ea
lth Ba
nk o
f Au
stralia
An
nu
al Rep
ort 2017
Fin
ancial
repo
rt
6
2
1
3
4
5
7
Notes to the financial statements 133
Note 22 Loan Capital Group Bank
Currency 2017 2016 2017 2016Amount (M) Footnotes $M $M $M $M
Tier 1 Loan CapitalUndated FRN USD 100 (1) 130 135 130 135Undated PERLS VI AUD 2,000 (2) 1,994 1,990 1,994 1,990Undated PERLS VII AUD 3,000 (2) 2,979 2,978 2,979 2,978Undated PERLS VIII AUD 1,450 (2) 1,435 1,437 1,435 1,437Undated PERLS IX AUD 1,640 (2) 1,622 - 1,622 -Total Tier 1 Loan Capital 8,160 6,540 8,160 6,540
Tier 2 Loan CapitalAUD denominated (3) 1,773 1,772 1,773 1,772USD denominated (4) 3,047 2,145 3,047 2,145JPY denominated (5) 850 262 850 262GBP denominated (6) 254 270 254 270NZD denominated (7) 755 378 - -EUR denominated (8) 3,338 3,351 3,338 3,351Other currencies denominated (9) 293 202 293 202Total Tier 2 Loan Capital 10,310 8,380 9,555 8,002
Fair value hedge adjustments 256 624 244 596Total Loan Capital 18,726 15,544 17,959 15,138
As at the reporting date, the majority of securities of the Group and the Bank are not contractually due for redemption in the next 12 months (note the Group has the right to call some securities earlier than the contractual maturity date).
(1) USD100 million Floating Rate NotesOn 15 October 1986, the State Bank of Victoria issued USD125 million of floating rate notes, the current outstanding balance is USD100 million. The floating rate notes are perpetual but were able to be redeemed from October 1991. They were assigned to the Bank on 1 January 1991. The Bank entered into an agreement with the Commonwealth of Australia on 31 December 1991 which provides that, if certain events occur, the Bank may either issue CBA ordinary shares to the Commonwealth of Australia, or (with the consent of the Commonwealth of Australia) conduct a renounceable rights issue for CBA ordinary shares to all shareholders. The capital raised must be used to pay any amounts due and payable on the floating rate notes. The floating rate notes were issued into the international markets and are subject to English law. They qualify as Additional Tier 1 Capital of the Bank under the Basel III transitional arrangements for capital instruments as implemented by APRA. (2) PERLS VI, PERLS VII, PERLS VIII and PERLS IXOn 17 October 2012, the Bank issued $2,000 million of Perpetual Exchangeable Resaleable Listed Securities (PERLS VI). On 1 October 2014, the Bank issued $3,000 million of CommBank PERLS VII Capital Notes. (PERLS VII). On 30 March 2016, the Bank issued $1,450 million of CommBank PERLS VIII Capital Notes (PERLS VIII). On 31 March 2017, the Bank issued $1,640 million of CommBank PERLS IX Capital Notes (PERLS IX). PERLS VI, PERLS VII, PERLS VIII and PERLS IX are subordinated, unsecured notes. PERLS VI, PERLS VII, PERLS VIII and PERLS IX are listed on the ASX and are subject to New South Wales law. They qualify as Additional Tier 1 Capital of the Bank under Basel III as implemented by APRA.
(3) AUD denominated Tier 2 Loan Capital issuances $25 million subordinated floating rate notes, issued
April 1999, due April 2029; $1,000 million subordinated notes issued
November 2014, due November 2024; and $750 million subordinated notes issued June 2016, due
June 2026.(4) USD denominated Tier 2 Loan Capital issuances USD350 million subordinated fixed rate notes, issued
June 2003, due June 2018; and USD1,250 million subordinated notes issued December
2015, due December 2025; and USD750 million subordinated EMTN (Euro Medium
Term Notes) issued October 2016, due October 2026. (5) JPY denominated Tier 2 Loan Capital issuances JPY20 billion perpetual subordinated EMTN, issued
February 1999; JPY40 billion subordinated EMTNs issued December
2016 (three tranches JPY20 billion, JPY10 billion andJPY10 billion), due December 2026; and
JPY13.3 billion subordinated EMTN issued March 2017,due March 2027.
(6) GBP denominated Tier 2 Loan Capital issuances GBP150 million subordinated EMTN, issued June 2003,
due December 2023.(7) NZD denominated Tier 2 Loan Capital issuances NZD400 million subordinated, unsecured notes, issued
April 2014, due June 2024:On 17 April 2014, a wholly owned entity of the Bank(ASB Bank Limited) issued NZD400 millionsubordinated, unsecured notes (ASB Notes) with a facevalue of NZD1 each; and
79
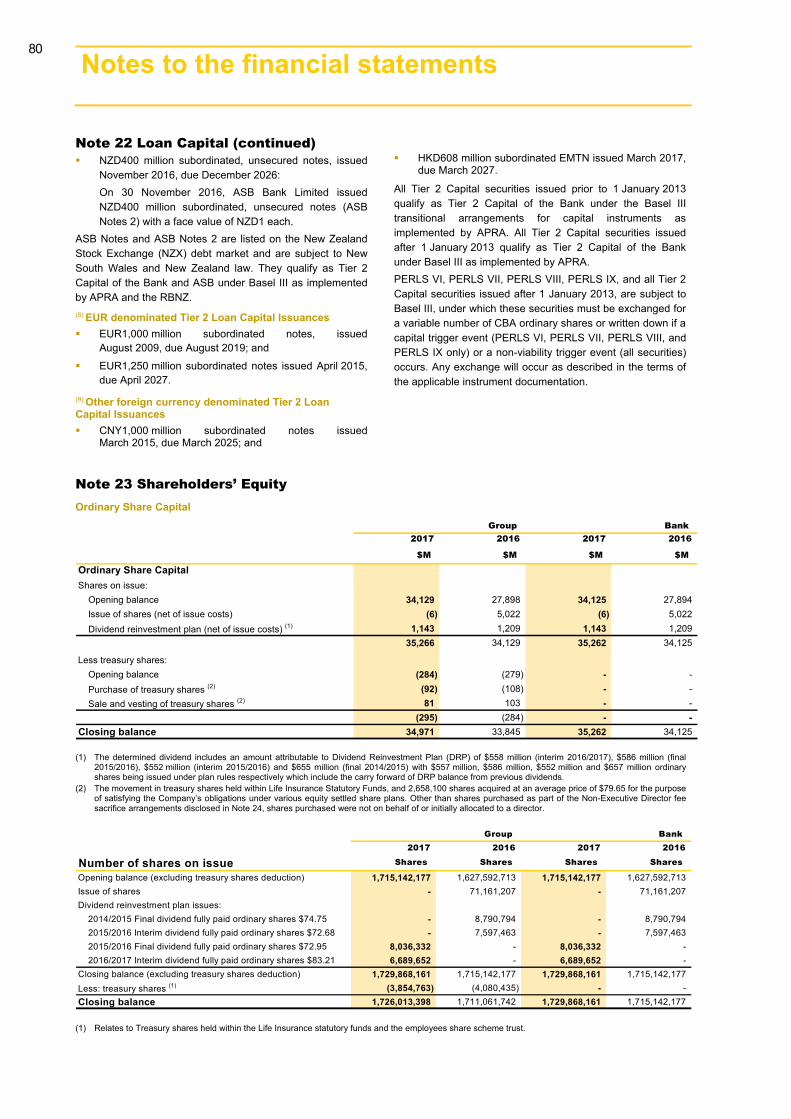
Notes to the financial statements 134
Note 22 Loan Capital (continued) NZD400 million subordinated, unsecured notes, issued
November 2016, due December 2026:On 30 November 2016, ASB Bank Limited issuedNZD400 million subordinated, unsecured notes (ASBNotes 2) with a face value of NZD1 each.
ASB Notes and ASB Notes 2 are listed on the New Zealand Stock Exchange (NZX) debt market and are subject to New South Wales and New Zealand law. They qualify as Tier 2 Capital of the Bank and ASB under Basel III as implemented by APRA and the RBNZ. (8) EUR denominated Tier 2 Loan Capital Issuances EUR1,000 million subordinated notes, issued
August 2009, due August 2019; and EUR1,250 million subordinated notes issued April 2015,
due April 2027.(9) Other foreign currency denominated Tier 2 LoanCapital Issuances CNY1,000 million subordinated notes issued
March 2015, due March 2025; and
HKD608 million subordinated EMTN issued March 2017,due March 2027.
All Tier 2 Capital securities issued prior to 1 January 2013 qualify as Tier 2 Capital of the Bank under the Basel III transitional arrangements for capital instruments as implemented by APRA. All Tier 2 Capital securities issued after 1 January 2013 qualify as Tier 2 Capital of the Bank under Basel III as implemented by APRA. PERLS VI, PERLS VII, PERLS VIII, PERLS IX, and all Tier 2 Capital securities issued after 1 January 2013, are subject to Basel III, under which these securities must be exchanged for a variable number of CBA ordinary shares or written down if a capital trigger event (PERLS VI, PERLS VII, PERLS VIII, and PERLS IX only) or a non-viability trigger event (all securities) occurs. Any exchange will occur as described in the terms of the applicable instrument documentation.
Note 23 Shareholders’ Equity Ordinary Share Capital
Group Bank2017 2016 2017 2016
$M $M $M $M
Ordinary Share CapitalShares on issue:
Opening balance 34,129 27,898 34,125 27,894Issue of shares (net of issue costs) (6) 5,022 (6) 5,022Dividend reinvestment plan (net of issue costs) (1) 1,143 1,209 1,143 1,209
35,266 34,129 35,262 34,125
Less treasury shares: Opening balance (284) (279) - -Purchase of treasury shares (2) (92) (108) - -Sale and vesting of treasury shares (2) 81 103 - -
(295) (284) - -Closing balance 34,971 33,845 35,262 34,125
(1) The determined dividend includes an amount attributable to Dividend Reinvestment Plan (DRP) of $558 million (interim 2016/2017), $586 million (final 2015/2016), $552 million (interim 2015/2016) and $655 million (final 2014/2015) with $557 million, $586 million, $552 million and $657 million ordinary shares being issued under plan rules respectively which include the carry forward of DRP balance from previous dividends.
(2) The movement in treasury shares held within Life Insurance Statutory Funds, and 2,658,100 shares acquired at an average price of $79.65 for the purpose of satisfying the Company’s obligations under various equity settled share plans. Other than shares purchased as part of the Non-Executive Director fee sacrifice arrangements disclosed in Note 24, shares purchased were not on behalf of or initially allocated to a director.
Group Bank2017 2016 2017 2016
Number of shares on issue Shares Shares Shares Shares
Opening balance (excluding treasury shares deduction) 1,715,142,177 1,627,592,713 1,715,142,177 1,627,592,713Issue of shares - 71,161,207 - 71,161,207Dividend reinvestment plan issues:
2014/2015 Final dividend fully paid ordinary shares $74.75 - 8,790,794 - 8,790,7942015/2016 Interim dividend fully paid ordinary shares $72.68 - 7,597,463 - 7,597,4632015/2016 Final dividend fully paid ordinary shares $72.95 8,036,332 - 8,036,332 -2016/2017 Interim dividend fully paid ordinary shares $83.21 6,689,652 - 6,689,652 -
Closing balance (excluding treasury shares deduction) 1,729,868,161 1,715,142,177 1,729,868,161 1,715,142,177Less: treasury shares (1) (3,854,763) (4,080,435) - -Closing balance 1,726,013,398 1,711,061,742 1,729,868,161 1,715,142,177
(1) Relates to Treasury shares held within the Life Insurance statutory funds and the employees share scheme trust.
80
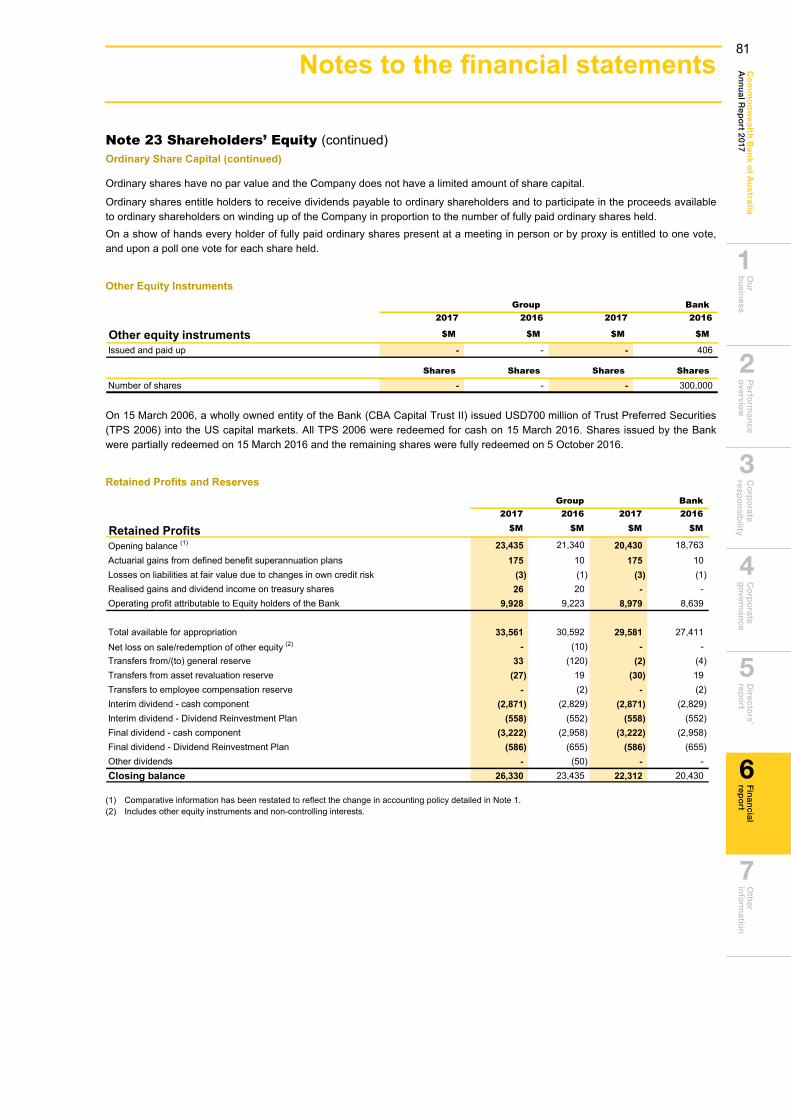
Ou
r b
usin
essP
erform
ance
overview
C
orp
orate
respo
nsib
ility C
orp
orate
go
vernan
ceD
irectors’
repo
rtO
ther
info
rmatio
nC
om
mo
nw
ea
lth Ba
nk o
f Au
stralia
An
nu
al Rep
ort 2017
Fin
ancial
repo
rt
6
2
1
3
4
5
7
Notes to the financial statements 135
Note 23 Shareholders’ Equity (continued) Ordinary Share Capital (continued)
Ordinary shares have no par value and the Company does not have a limited amount of share capital.
Ordinary shares entitle holders to receive dividends payable to ordinary shareholders and to participate in the proceeds available to ordinary shareholders on winding up of the Company in proportion to the number of fully paid ordinary shares held. On a show of hands every holder of fully paid ordinary shares present at a meeting in person or by proxy is entitled to one vote, and upon a poll one vote for each share held.
Other Equity Instruments Group Bank
2017 2016 2017 2016
Other equity instruments $M $M $M $M
Issued and paid up - - - 406
Shares Shares Shares Shares
Number of shares - - - 300,000
On 15 March 2006, a wholly owned entity of the Bank (CBA Capital Trust II) issued USD700 million of Trust Preferred Securities (TPS 2006) into the US capital markets. All TPS 2006 were redeemed for cash on 15 March 2016. Shares issued by the Bank were partially redeemed on 15 March 2016 and the remaining shares were fully redeemed on 5 October 2016.
Retained Profits and Reserves Group Bank
2017 2016 2017 2016
Retained Profits $M $M $M $M
Opening balance (1) 23,435 21,340 20,430 18,763Actuarial gains from defined benefit superannuation plans 175 10 175 10Losses on liabilities at fair value due to changes in own credit risk (3) (1) (3) (1)Realised gains and dividend income on treasury shares 26 20 - -Operating profit attributable to Equity holders of the Bank 9,928 9,223 8,979 8,639
Total available for appropriation 33,561 30,592 29,581 27,411Net loss on sale/redemption of other equity (2) - (10) - -Transfers from/(to) general reserve 33 (120) (2) (4)Transfers from asset revaluation reserve (27) 19 (30) 19Transfers to employee compensation reserve - (2) - (2)Interim dividend - cash component (2,871) (2,829) (2,871) (2,829)Interim dividend - Dividend Reinvestment Plan (558) (552) (558) (552)Final dividend - cash component (3,222) (2,958) (3,222) (2,958)Final dividend - Dividend Reinvestment Plan (586) (655) (586) (655)Other dividends - (50) - -Closing balance 26,330 23,435 22,312 20,430
(1) Comparative information has been restated to reflect the change in accounting policy detailed in Note 1. (2) Includes other equity instruments and non-controlling interests.
81
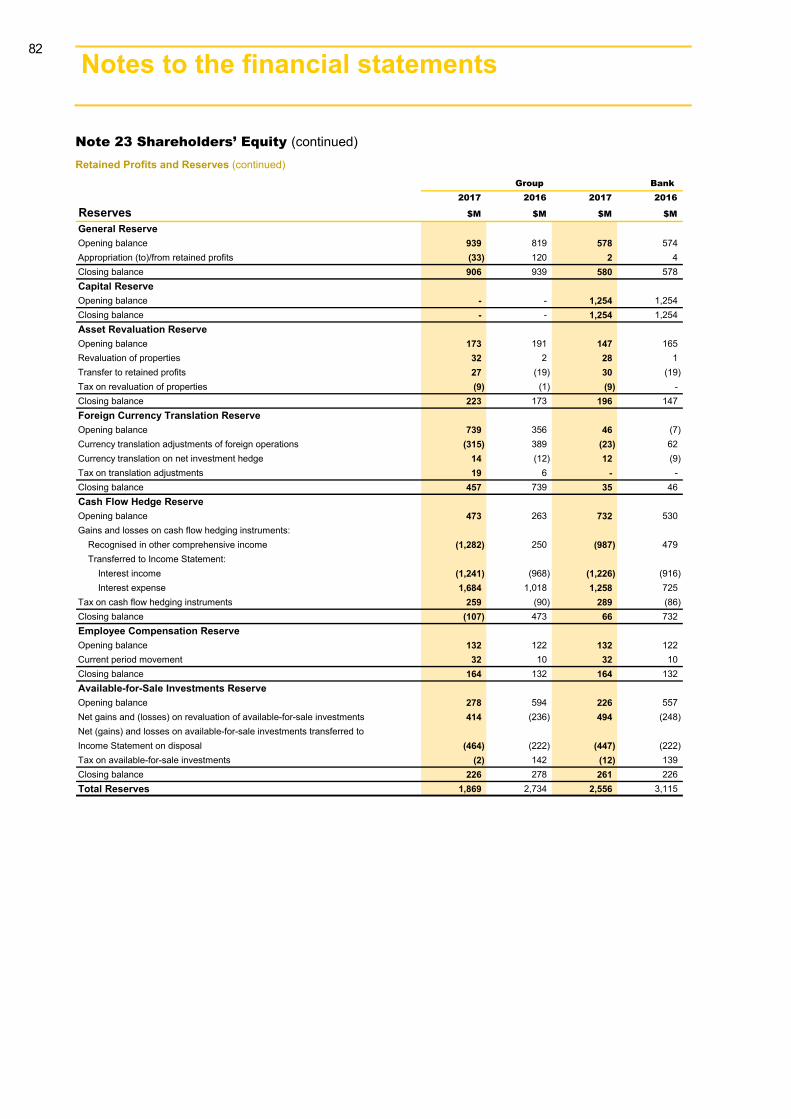
Notes to the financial statements 136
Note 23 Shareholders’ Equity (continued) Retained Profits and Reserves (continued)
Group Bank2017 2016 2017 2016
Reserves $M $M $M $M
General ReserveOpening balance 939 819 578 574Appropriation (to)/from retained profits (33) 120 2 4Closing balance 906 939 580 578Capital ReserveOpening balance - - 1,254 1,254Closing balance - - 1,254 1,254Asset Revaluation ReserveOpening balance 173 191 147 165Revaluation of properties 32 2 28 1Transfer to retained profits 27 (19) 30 (19)Tax on revaluation of properties (9) (1) (9) -Closing balance 223 173 196 147Foreign Currency Translation ReserveOpening balance 739 356 46 (7)Currency translation adjustments of foreign operations (315) 389 (23) 62Currency translation on net investment hedge 14 (12) 12 (9)Tax on translation adjustments 19 6 - -Closing balance 457 739 35 46Cash Flow Hedge ReserveOpening balance 473 263 732 530Gains and losses on cash flow hedging instruments:
Recognised in other comprehensive income (1,282) 250 (987) 479Transferred to Income Statement:
Interest income (1,241) (968) (1,226) (916)Interest expense 1,684 1,018 1,258 725
Tax on cash flow hedging instruments 259 (90) 289 (86)Closing balance (107) 473 66 732Employee Compensation ReserveOpening balance 132 122 132 122Current period movement 32 10 32 10Closing balance 164 132 164 132Available-for-Sale Investments ReserveOpening balance 278 594 226 557Net gains and (losses) on revaluation of available-for-sale investments 414 (236) 494 (248)Net (gains) and losses on available-for-sale investments transferred toIncome Statement on disposal (464) (222) (447) (222)Tax on available-for-sale investments (2) 142 (12) 139Closing balance 226 278 261 226Total Reserves 1,869 2,734 2,556 3,115
82
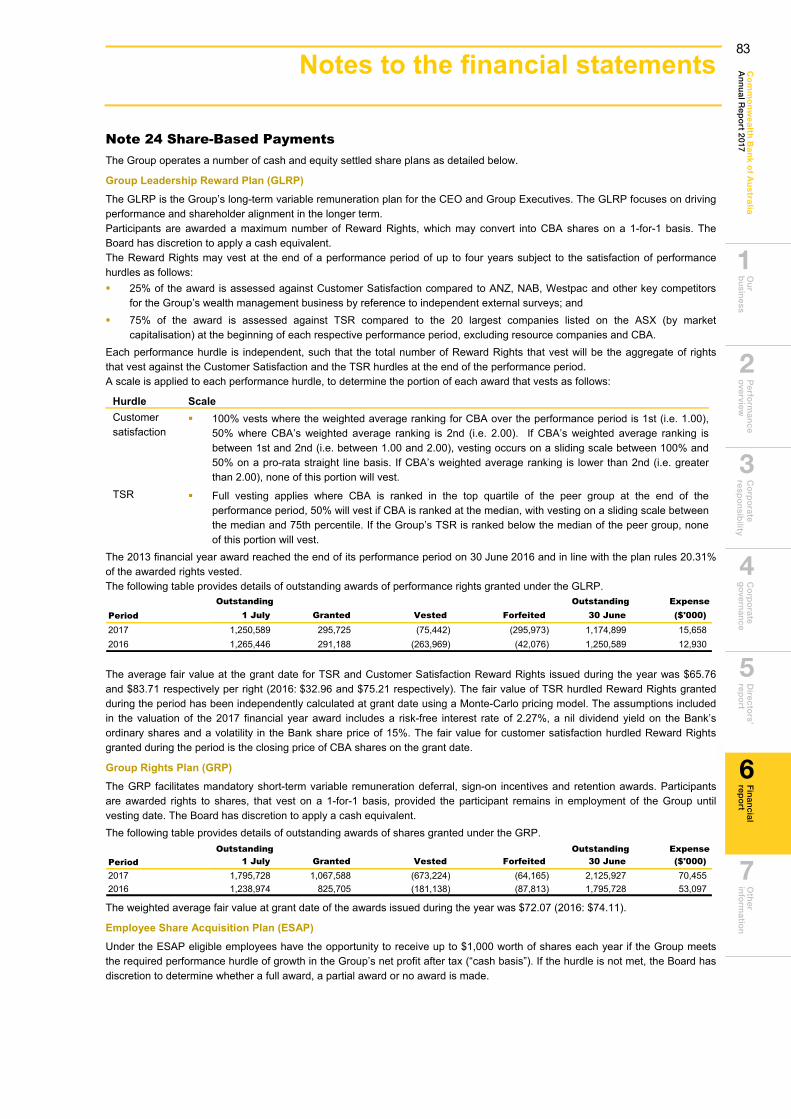
Ou
r b
usin
essP
erform
ance
overview
C
orp
orate
respo
nsib
ility C
orp
orate
go
vernan
ceD
irectors’
repo
rtO
ther
info
rmatio
nC
om
mo
nw
ea
lth Ba
nk o
f Au
stralia
An
nu
al Rep
ort 2017
Fin
ancial
repo
rt
6
2
1
3
4
5
7
137 Notes to the financial statements 137
Note 24 Share-Based Payments The Group operates a number of cash and equity settled share plans as detailed below.
Group Leadership Reward Plan (GLRP) The GLRP is the Group’s long-term variable remuneration plan for the CEO and Group Executives. The GLRP focuses on driving performance and shareholder alignment in the longer term. Participants are awarded a maximum number of Reward Rights, which may convert into CBA shares on a 1-for-1 basis. The Board has discretion to apply a cash equivalent. The Reward Rights may vest at the end of a performance period of up to four years subject to the satisfaction of performance hurdles as follows: 25% of the award is assessed against Customer Satisfaction compared to ANZ, NAB, Westpac and other key competitors
for the Group’s wealth management business by reference to independent external surveys; and 75% of the award is assessed against TSR compared to the 20 largest companies listed on the ASX (by market
capitalisation) at the beginning of each respective performance period, excluding resource companies and CBA.Each performance hurdle is independent, such that the total number of Reward Rights that vest will be the aggregate of rights that vest against the Customer Satisfaction and the TSR hurdles at the end of the performance period. A scale is applied to each performance hurdle, to determine the portion of each award that vests as follows:
Hurdle Scale Customer satisfaction
100% vests where the weighted average ranking for CBA over the performance period is 1st (i.e. 1.00),50% where CBA’s weighted average ranking is 2nd (i.e. 2.00). If CBA’s weighted average ranking isbetween 1st and 2nd (i.e. between 1.00 and 2.00), vesting occurs on a sliding scale between 100% and50% on a pro-rata straight line basis. If CBA’s weighted average ranking is lower than 2nd (i.e. greaterthan 2.00), none of this portion will vest.
TSR Full vesting applies where CBA is ranked in the top quartile of the peer group at the end of theperformance period, 50% will vest if CBA is ranked at the median, with vesting on a sliding scale betweenthe median and 75th percentile. If the Group’s TSR is ranked below the median of the peer group, noneof this portion will vest.
The 2013 financial year award reached the end of its performance period on 30 June 2016 and in line with the plan rules 20.31% of the awarded rights vested. The following table provides details of outstanding awards of performance rights granted under the GLRP.
Outstanding Outstanding ExpensePeriod 1 July Granted Vested Forfeited 30 June ($'000)
2017 1,250,589 295,725 (75,442) (295,973) 1,174,899 15,6582016 1,265,446 291,188 (263,969) (42,076) 1,250,589 12,930
The average fair value at the grant date for TSR and Customer Satisfaction Reward Rights issued during the year was $65.76 and $83.71 respectively per right (2016: $32.96 and $75.21 respectively). The fair value of TSR hurdled Reward Rights granted during the period has been independently calculated at grant date using a Monte-Carlo pricing model. The assumptions included in the valuation of the 2017 financial year award includes a risk-free interest rate of 2.27%, a nil dividend yield on the Bank’s ordinary shares and a volatility in the Bank share price of 15%. The fair value for customer satisfaction hurdled Reward Rights granted during the period is the closing price of CBA shares on the grant date.
Group Rights Plan (GRP) The GRP facilitates mandatory short-term variable remuneration deferral, sign-on incentives and retention awards. Participants are awarded rights to shares, that vest on a 1-for-1 basis, provided the participant remains in employment of the Group until vesting date. The Board has discretion to apply a cash equivalent. The following table provides details of outstanding awards of shares granted under the GRP.
Outstanding Outstanding ExpensePeriod 1 July Granted Vested Forfeited 30 June ($'000)2017 1,795,728 1,067,588 (673,224) (64,165) 2,125,927 70,4552016 1,238,974 825,705 (181,138) (87,813) 1,795,728 53,097
The weighted average fair value at grant date of the awards issued during the year was $72.07 (2016: $74.11).
Employee Share Acquisition Plan (ESAP) Under the ESAP eligible employees have the opportunity to receive up to $1,000 worth of shares each year if the Group meets the required performance hurdle of growth in the Group’s net profit after tax (“cash basis”). If the hurdle is not met, the Board has discretion to determine whether a full award, a partial award or no award is made.
83
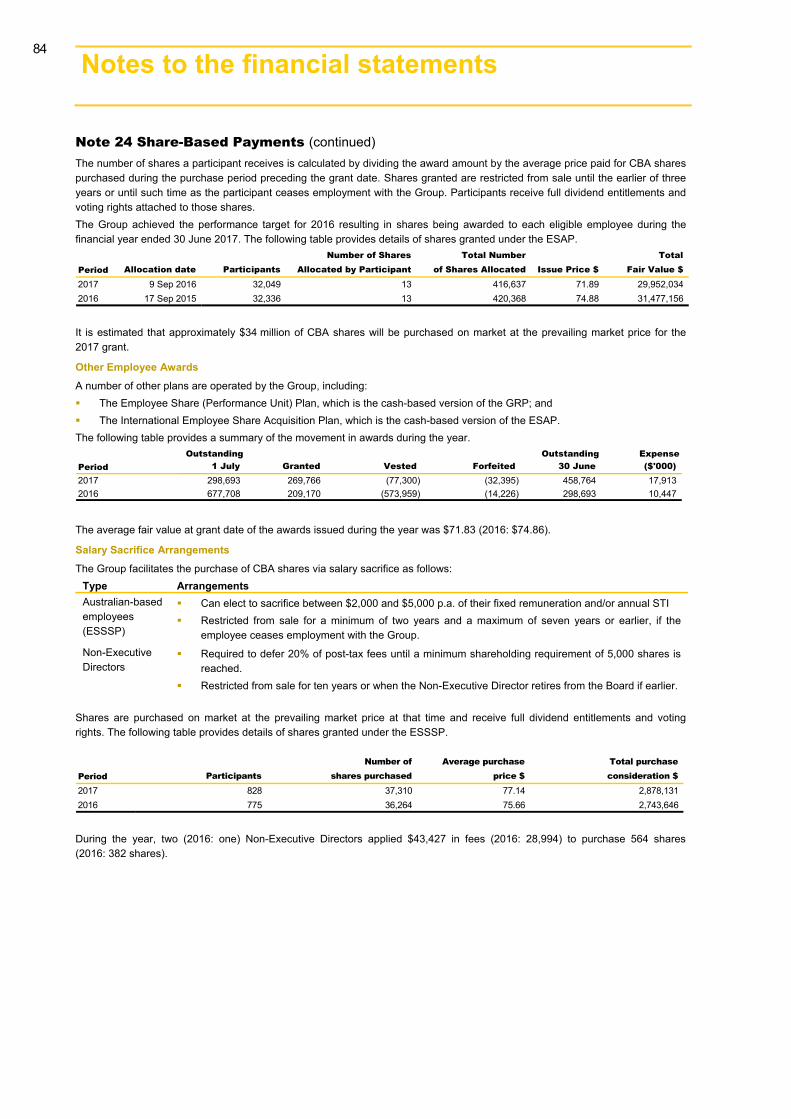
138 Notes to the financial statements
Note 24 Share-Based Payments (continued)The number of shares a participant receives is calculated by dividing the award amount by the average price paid for CBA shares purchased during the purchase period preceding the grant date. Shares granted are restricted from sale until the earlier of three years or until such time as the participant ceases employment with the Group. Participants receive full dividend entitlements and voting rights attached to those shares. The Group achieved the performance target for 2016 resulting in shares being awarded to each eligible employee during the financial year ended 30 June 2017. The following table provides details of shares granted under the ESAP.
Number of Shares Total Number TotalPeriod Allocation date Participants Allocated by Participant of Shares Allocated Issue Price $ Fair Value $
2017 9 Sep 2016 32,049 13 416,637 71.89 29,952,0342016 17 Sep 2015 32,336 13 420,368 74.88 31,477,156
It is estimated that approximately $34 million of CBA shares will be purchased on market at the prevailing market price for the 2017 grant.
Other Employee Awards A number of other plans are operated by the Group, including: The Employee Share (Performance Unit) Plan, which is the cash-based version of the GRP; and The International Employee Share Acquisition Plan, which is the cash-based version of the ESAP.The following table provides a summary of the movement in awards during the year.
Outstanding Outstanding ExpensePeriod 1 July Granted Vested Forfeited 30 June ($'000)2017 298,693 269,766 (77,300) (32,395) 458,764 17,9132016 677,708 209,170 (573,959) (14,226) 298,693 10,447
The average fair value at grant date of the awards issued during the year was $71.83 (2016: $74.86).
Salary Sacrifice Arrangements The Group facilitates the purchase of CBA shares via salary sacrifice as follows:
Type Arrangements Australian-based employees (ESSSP)
Can elect to sacrifice between $2,000 and $5,000 p.a. of their fixed remuneration and/or annual STI Restricted from sale for a minimum of two years and a maximum of seven years or earlier, if the
employee ceases employment with the Group.Non-Executive Directors
Required to defer 20% of post-tax fees until a minimum shareholding requirement of 5,000 shares isreached.
Restricted from sale for ten years or when the Non-Executive Director retires from the Board if earlier.
Shares are purchased on market at the prevailing market price at that time and receive full dividend entitlements and voting rights. The following table provides details of shares granted under the ESSSP.
Number of Average purchase Total purchasePeriod Participants shares purchased price $ consideration $
2017 828 37,310 77.14 2,878,1312016 775 36,264 75.66 2,743,646
During the year, two (2016: one) Non-Executive Directors applied $43,427 in fees (2016: 28,994) to purchase 564 shares (2016: 382 shares).
84
Ou
r b
usin
essP
erform
ance
overview
C
orp
orate
respo
nsib
ility C
orp
orate
go
vernan
ceD
irectors’
repo
rtO
ther
info
rmatio
nC
om
mo
nw
ea
lth Ba
nk o
f Au
stralia
An
nu
al Rep
ort 2017
Fin
ancial
repo
rt
6
2
1
3
4
5
7
Notes to the financial statements 139
Note 25 Capital Adequacy Capital ManagementThe Group is an Authorised Deposit-taking Institution (ADI) regulated by APRA under the authority of the Banking Act 1959. APRA has set minimum regulatory capital requirements for banks based on the Basel Committee on Banking Supervision (BCBS) guidelines. The Basel III measurement and monitoring of capital has been effective from 1 January 2013. APRA has adopted a more conservative approach than the minimum standards published by the BCBS and also adopted an accelerated timetable for implementation. The requirements define what is acceptable as capital and provide methods of measuring the risks incurred by the Bank. The regulatory capital requirements are measured for the Extended Licenced Entity Group (known as “Level 1”, comprising the Bank and APRA approved subsidiaries) and for the Bank and all of its banking subsidiaries, which includes ASB Bank (known as “Level 2” or the “Group”). All entities which are consolidated for accounting purposes are included within the Group capital adequacy calculations except for: The insurance and funds management operating
subsidiaries; and The entities through which securitisation of Group
assets are conducted.Regulatory capital is divided into Common Equity Tier 1 (CET1), Tier 1 and Tier 2 Capital. CET1 primarily consists of Shareholders’ Equity, less goodwill and other prescribed adjustments. Tier 1 Capital is comprised of CET1 plus other capital instruments acceptable to APRA. Tier 2 Capital is comprised primarily of hybrid and debt instruments acceptable to APRA. Total Capital is the aggregate of Tier 1 and Tier 2 Capital. The tangible component of the investment in the insurance and funds management operations are deducted 100% from CET1.
Capital adequacy is measured by means of a risk based capital ratio. The capital ratios reflect capital (CET1, Tier 1, Tier 2 or Total Capital) as a percentage of total Risk Weighted Assets (RWA). RWA represents an allocation of risks associated with the Group’s assets and other related exposures. The Group has a range of instruments and methodologies available to effectively manage capital. These include share issues and buybacks, dividend and DRP policies, hybrid capital raising and dated and undated subordinated loan capital issues. All major capital related initiatives require approval of the Board. The Group’s capital position is monitored on a continuous basis and reported monthly to the Executive Committee and at regular intervals throughout the year to the Risk Committee. Three-year capital forecasts are conducted on a quarterly basis with a detailed capital and strategic plan presented to the Board annually. The Group’s capital ratios throughout the 2016 and 2017 financial years were in compliance with both APRA minimum capital adequacy requirements and the Board Approved minimums. The Group is required to inform APRA immediately of any breach or potential breach of its minimum prudential capital adequacy requirements, including details of remedial action taken or planned to be taken.
85

140 Notes to the financial statements
Note 26 Financial Reporting by Segments The principal activities of the Group are carried out in the business segments below. These segments are based on the distribution channels through which the customer relationship is being managed. During the year, refinements have been made to the allocation of customer balances and associated revenue and expenses between business segments, including updated transfer pricing allocations. These changes have not impacted the Group’s net profit, but have resulted in changes to the presentation of the Income Statement and Balance Sheet of the affected segments. There have also been changes to the recognition of Global Asset Management long-term incentives in Wealth Management, as set out in Note 1 Accounting Policies, which have had a minor impact on the Group’s cash net profit. Comparative information has been restated to reflect these changes. The primary sources of revenue are interest and fee income (Retail Banking Services, Institutional Banking and Markets, Business and Private Banking, Bankwest, New Zealand, IFS and Other Divisions) and insurance premium and funds management income (Wealth Management, New Zealand, IFS and Other Divisions). Revenues and expenses occurring between segments are subject to transfer pricing arrangements. All intra-group profits are eliminated on consolidation. Business segments are managed on the basis of net profit after income tax (“cash basis”). Management uses “cash basis” to assess performance and it provides the basis for the determination of the Bank’s dividends. The “cash basis” presents a clear view of the Group’s underlying operating results, excluding a number of items that introduce volatility and/or one-off distortions of the Group’s current period performance. These items, such as hedging and IFRS volatility, are calculated consistently year on year and do not discriminate between positive and negative adjustments.
(i) Retail Banking ServicesRetail Banking Services provides home loan, consumer finance and retail deposit products and servicing to all Retail bank customers and non-relationship managed small business customers. In addition, commission is received for the distribution of Wealth Management products through the retail distribution network.
(ii) Business and Private BankingBusiness and Private Banking provides specialised banking services to relationship managed business and Agribusiness customers, private banking to high net worth individuals and margin lending and trading through CommSec.
(iii) Institutional Banking and MarketsInstitutional Banking and Markets services the Group’s major corporate, institutional and government clients using a relationship management model based on industry expertise and insights. The client offering includes debt raising, financial and commodities price risk management and transactional banking capabilities. Institutional Banking and Markets has international operations in London, New York, Houston, Japan, Singapore, Malta, Hong Kong, New Zealand, Beijing and Shanghai.
(iv) Wealth ManagementWealth Management includes Global Asset Management (including operations in Asia and Europe), Platform Administration and Financial Advice and Life and General Insurance businesses of the Australian operations.
(v) New ZealandNew Zealand includes the Banking, Funds Management and Insurance businesses operating in New Zealand (excluding Institutional Banking and Markets).
(vi) BankwestBankwest is active in all domestic market segments, with lending diversified between the business, rural, housing and personal markets, including a full range of deposit products.
(vii) IFS and Other DivisionsThe following parts of the business are included in IFS and Other Divisions: International Financial Services incorporates the Asian
retail and business banking operations (Indonesia,China, Vietnam and India), associate investments inChina and Vietnam, the life insurance operations inIndonesia and a financial services technology businessin South Africa. It does not include the Business andPrivate Banking, Institutional Banking and Markets andColonial First State Global Asset Managementbusinesses in Asia;
Corporate Centre includes the results of unallocatedGroup support functions such as Investor Relations,Group Strategy, Marketing, Secretariat and Treasury;and
Group wide elimination entries arising on consolidation,centrally raised provisions and other unallocatedrevenue and expenses.
86
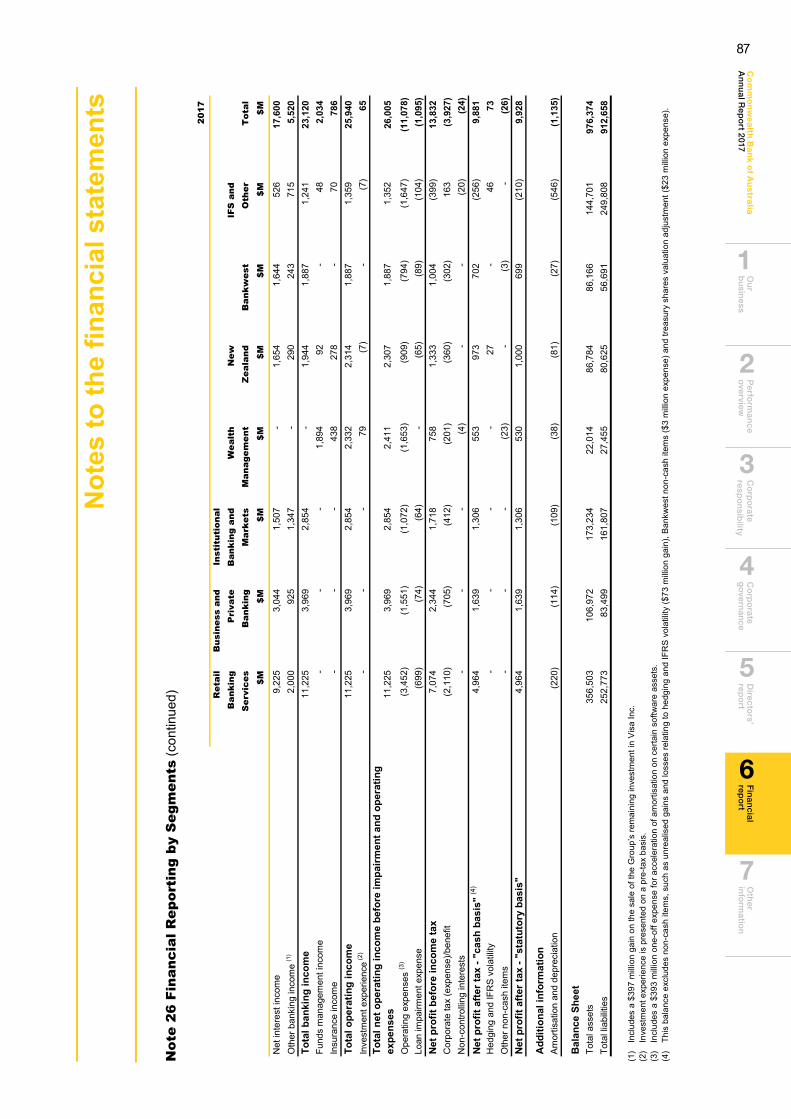
Ou
r b
usin
essP
erform
ance
overview
C
orp
orate
respo
nsib
ility C
orp
orate
go
vernan
ceD
irectors’
repo
rtO
ther
info
rmatio
nC
om
mo
nw
ea
lth Ba
nk o
f Au
stralia
An
nu
al Rep
ort 2017
Fin
ancial
repo
rt
6
2
1
3
4
5
7
141
Not
es to
the
finan
cial
sta
tem
ents
Not
e 26
Fin
anci
al R
epor
ting
by
Seg
men
ts (c
ontin
ued)
2017
Ret
ail
Bus
ines
s an
dIn
stit
utio
nal
Ban
king
Pri
vate
Ban
king
and
Wea
lth
New
IFS
and
Ser
vice
sB
anki
ngM
arke
tsM
anag
emen
tZ
eala
ndB
ankw
est
Oth
erT
otal
$M$M
$M$M
$M$M
$M$M
Net
inte
rest
inco
me
9,22
53,
044
1,50
7-
1,65
41,
644
526
17,6
00O
ther
ban
king
inco
me
(1)
2,00
092
51,
347
-29
024
371
55,
520
Tota
l ban
king
inco
me
11,2
253,
969
2,85
4-
1,94
41,
887
1,24
123
,120
Fund
s m
anag
emen
t inc
ome
--
-1,
894
92-
482,
034
Insu
ranc
e in
com
e-
--
438
278
-70
786
Tota
l ope
ratin
g in
com
e11
,225
3,96
92,
854
2,33
22,
314
1,88
71,
359
25,9
40In
vest
men
t exp
erie
nce (2
)-
--
79(7
)-
(7)
65To
tal n
et o
pera
ting
inco
me
befo
re im
pairm
ent a
nd o
pera
ting
expe
nses
11,2
253,
969
2,85
42,
411
2,30
71,
887
1,35
226
,005
Ope
ratin
g ex
pens
es (3
)(3
,452
)(1
,551
)(1
,072
)(1
,653
)(9
09)
(794
)(1
,647
)(1
1,07
8)Lo
an im
pairm
ent e
xpen
se(6
99)
(74)
(64)
-(6
5)(8
9)(1
04)
(1,0
95)
Net p
rofit
bef
ore
inco
me
tax
7,07
42,
344
1,71
875
81,
333
1,00
4(3
99)
13,8
32C
orpo
rate
tax
(exp
ense
)/ben
efit
(2,1
10)
(705
)(4
12)
(201
)(3
60)
(302
)16
3(3
,927
)N
on-c
ontro
lling
inte
rest
s-
--
(4)
--
(20)
(24)
Net p
rofit
afte
r tax
- "c
ash
basi
s" (4
)4,
964
1,63
91,
306
553
973
702
(256
)9,
881
Hed
ging
and
IFR
S vo
latil
ity-
--
-27
-46
73O
ther
non
-cas
h ite
ms
--
-(2
3)-
(3)
-(2
6)Ne
t pro
fit a
fter t
ax -
"sta
tuto
ry b
asis
"4,
964
1,63
91,
306
530
1,00
069
9(2
10)
9,92
8
Addi
tiona
l inf
orm
atio
nAm
ortis
atio
n an
d de
prec
iatio
n(2
20)
(114
)(1
09)
(38)
(81)
(27)
(546
)(1
,135
)
Bala
nce
Shee
tTo
tal a
sset
s35
6,50
310
6,97
217
3,23
422
,014
86,7
8486
,166
144,
701
976,
374
Tota
l lia
bilit
ies
252,
773
83,4
9916
1,80
727
,455
80,6
2556
,691
249,
808
912,
658
(1)
Incl
udes
a $
397
milli
on g
ain
on th
e sa
le o
f the
Gro
up’s
rem
aini
ng in
vest
men
t in
Visa
Inc.
(2)
Inve
stm
ent e
xper
ienc
e is
pre
sent
ed o
n a
pre-
tax
basi
s.(3
) In
clud
es a
$39
3 m
illion
one
-off
expe
nse
for a
ccel
erat
ion
of a
mor
tisat
ion
on c
erta
in s
oftw
are
asse
ts.
(4)
This
bal
ance
exc
lude
s no
n-ca
sh it
ems,
suc
h as
unr
ealis
ed g
ains
and
loss
es re
latin
g to
hed
ging
and
IFR
S vo
latil
ity ($
73 m
illion
gai
n), B
ankw
est n
on-c
ash
item
s ($
3 m
illion
exp
ense
) and
trea
sury
sha
res
valu
atio
n ad
just
men
t ($2
3 m
illion
exp
ense
).
87
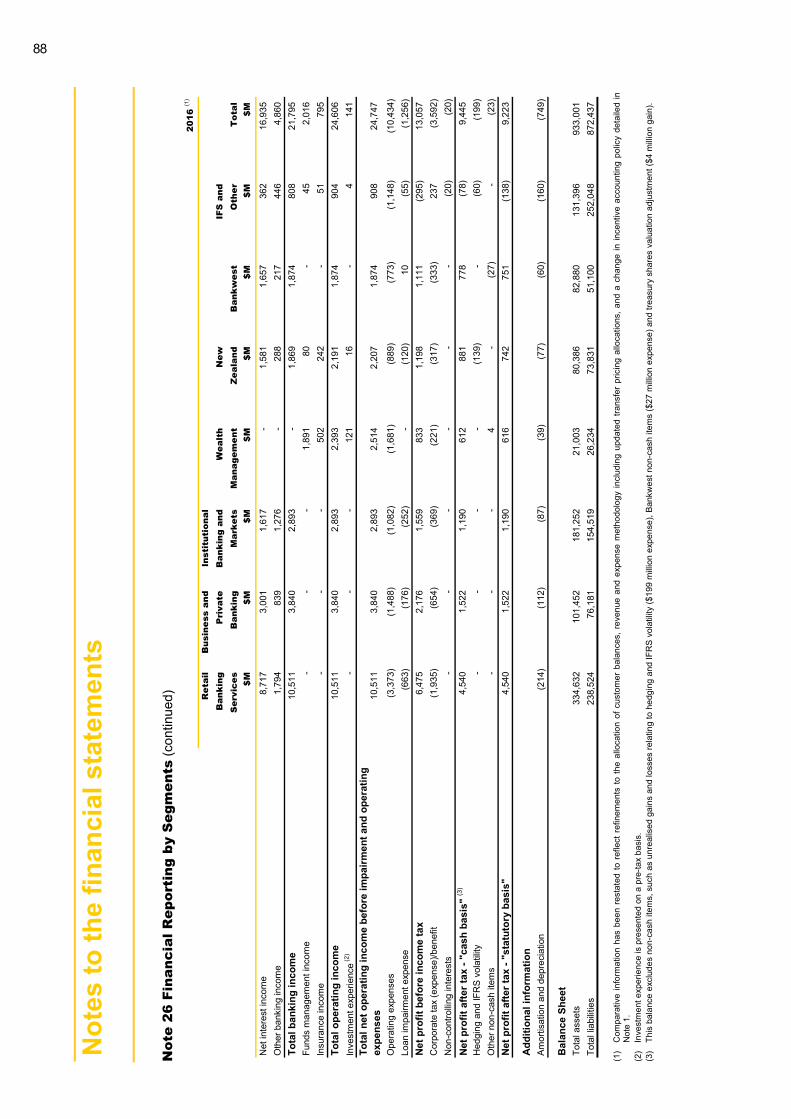
Not
es to
the
finan
cial
sta
tem
ents
142
Not
e 26
Fin
anci
al R
epor
ting
by
Seg
men
ts (c
ontin
ued)
20
16 (1
)
Ret
ail
Bus
ines
s an
dIn
stit
utio
nal
Ban
king
Pri
vate
Ban
king
and
Wea
lth
New
IFS
and
Ser
vice
sB
anki
ngM
arke
tsM
anag
emen
tZ
eala
ndB
ankw
est
Oth
erT
otal
$M$M
$M$M
$M$M
$M$M
Net
inte
rest
inco
me
8,71
73,
001
1,61
7-
1,58
11,
657
362
16,9
35O
ther
ban
king
inco
me
1,79
483
91,
276
-28
821
744
64,
860
Tota
l ban
king
inco
me
10,5
113,
840
2,89
3-
1,86
91,
874
808
21,7
95Fu
nds
man
agem
ent i
ncom
e-
--
1,89
180
-45
2,01
6In
sura
nce
inco
me
--
-50
224
2-
5179
5To
tal o
pera
ting
inco
me
10,5
113,
840
2,89
32,
393
2,19
11,
874
904
24,6
06In
vest
men
t exp
erie
nce (2
)-
--
121
16-
414
1To
tal n
et o
pera
ting
inco
me
befo
re im
pairm
ent a
nd o
pera
ting
expe
nses
10,5
113,
840
2,89
32,
514
2,20
71,
874
908
24,7
47
Ope
ratin
g ex
pens
es(3
,373
)(1
,488
)(1
,082
)(1
,681
)(8
89)
(773
)(1
,148
)(1
0,43
4)Lo
an im
pairm
ent e
xpen
se(6
63)
(176
)(2
52)
-(1
20)
10(5
5)(1
,256
)Ne
t pro
fit b
efor
e in
com
e ta
x6,
475
2,17
61,
559
833
1,19
81,
111
(295
)13
,057
Cor
pora
te ta
x (e
xpen
se)/b
enef
it(1
,935
)(6
54)
(369
)(2
21)
(317
)(3
33)
237
(3,5
92)
Non
-con
trollin
g in
tere
sts
--
--
--
(20)
(20)
Net p
rofit
afte
r tax
- "c
ash
basi
s" (3
)4,
540
1,52
21,
190
612
881
778
(78)
9,44
5H
edgi
ng a
nd IF
RS
vola
tility
--
--
(139
)-
(60)
(199
)O
ther
non
-cas
h ite
ms
--
-4
-(2
7)-
(23)
Net p
rofit
afte
r tax
- "s
tatu
tory
bas
is"
4,54
01,
522
1,19
061
674
275
1(1
38)
9,22
3
Addi
tiona
l inf
orm
atio
nAm
ortis
atio
n an
d de
prec
iatio
n(2
14)
(112
)(8
7)(3
9)(7
7)(6
0)(1
60)
(749
)
Bala
nce
Shee
tTo
tal a
sset
s33
4,63
210
1,45
218
1,25
221
,003
80,3
8682
,880
131,
396
933,
001
Tota
l lia
bilit
ies
238,
524
76,1
8115
4,51
926
,234
73,8
3151
,100
252,
048
872,
437
(1)
Com
para
tive
info
rmat
ion
has
been
res
tate
d to
ref
lect
ref
inem
ents
to th
e al
loca
tion
of c
usto
mer
bal
ance
s, r
even
ue a
nd e
xpen
se m
etho
dolo
gy in
clud
ing
upda
ted
trans
fer
pric
ing
allo
catio
ns, a
nd a
cha
nge
in in
cent
ive
acco
untin
g po
licy
deta
iled
inN
ote
1.
(2)
Inve
stm
ent e
xper
ienc
e is
pre
sent
ed o
n a
pre-
tax
basi
s.
(3)
This
bal
ance
exc
lude
s no
n-ca
sh it
ems,
suc
h as
unr
ealis
ed g
ains
and
loss
es re
latin
g to
hed
ging
and
IFR
S vo
latil
ity ($
199
milli
on e
xpen
se),
Bank
wes
t non
-cas
h ite
ms
($27
milli
on e
xpen
se) a
nd tr
easu
ry s
hare
s va
luat
ion
adju
stm
ent (
$4 m
illion
gai
n).
88
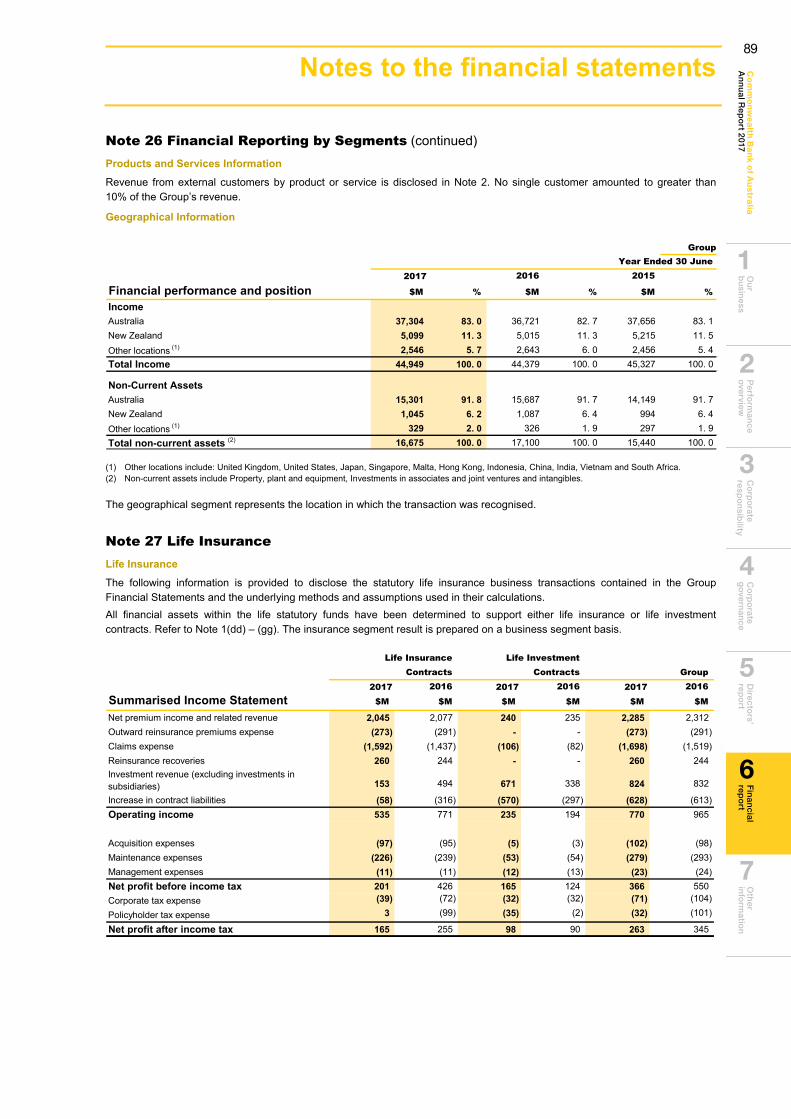
Ou
r b
usin
essP
erform
ance
overview
C
orp
orate
respo
nsib
ility C
orp
orate
go
vernan
ceD
irectors’
repo
rtO
ther
info
rmatio
nC
om
mo
nw
ea
lth Ba
nk o
f Au
stralia
An
nu
al Rep
ort 2017
Fin
ancial
repo
rt
6
2
1
3
4
5
7
143
Note 26 Financial Reporting by Segments (continued) Products and Services Information Revenue from external customers by product or service is disclosed in Note 2. No single customer amounted to greater than 10% of the Group’s revenue.
Geographical Information
GroupYear Ended 30 June
2017 2016 2015
Financial performance and position $M % $M % $M %
Income Australia 37,304 83. 0 36,721 82. 7 37,656 83. 1New Zealand 5,099 11. 3 5,015 11. 3 5,215 11. 5Other locations (1) 2,546 5. 7 2,643 6. 0 2,456 5. 4Total Income 44,949 100. 0 44,379 100. 0 45,327 100. 0
Non-Current AssetsAustralia 15,301 91. 8 15,687 91. 7 14,149 91. 7New Zealand 1,045 6. 2 1,087 6. 4 994 6. 4Other locations (1) 329 2. 0 326 1. 9 297 1. 9Total non-current assets (2) 16,675 100. 0 17,100 100. 0 15,440 100. 0
(1) Other locations include: United Kingdom, United States, Japan, Singapore, Malta, Hong Kong, Indonesia, China, India, Vietnam and South Africa.(2) Non-current assets include Property, plant and equipment, Investments in associates and joint ventures and intangibles.
The geographical segment represents the location in which the transaction was recognised.
Note 27 Life Insurance Life Insurance The following information is provided to disclose the statutory life insurance business transactions contained in the Group Financial Statements and the underlying methods and assumptions used in their calculations. All financial assets within the life statutory funds have been determined to support either life insurance or life investment contracts. Refer to Note 1(dd) – (gg). The insurance segment result is prepared on a business segment basis.
Life Insurance Life InvestmentContracts Contracts Group
2017 2016 2017 2016 2017 2016Summarised Income Statement $M $M $M $M $M $M
Net premium income and related revenue 2,045 2,077 240 235 2,285 2,312Outward reinsurance premiums expense (273) (291) - - (273) (291)Claims expense (1,592) (1,437) (106) (82) (1,698) (1,519)Reinsurance recoveries 260 244 - - 260 244Investment revenue (excluding investments in subsidiaries) 153 494 671 338 824 832
Increase in contract liabilities (58) (316) (570) (297) (628) (613)Operating income 535 771 235 194 770 965
Acquisition expenses (97) (95) (5) (3) (102) (98)Maintenance expenses (226) (239) (53) (54) (279) (293)Management expenses (11) (11) (12) (13) (23) (24)Net profit before income tax 201 426 165 124 366 550Corporate tax expense (39) (72) (32) (32) (71) (104)
Policyholder tax expense 3 (99) (35) (2) (32) (101)
Net profit after income tax 165 255 98 90 263 345
89
Notes to the financial statements
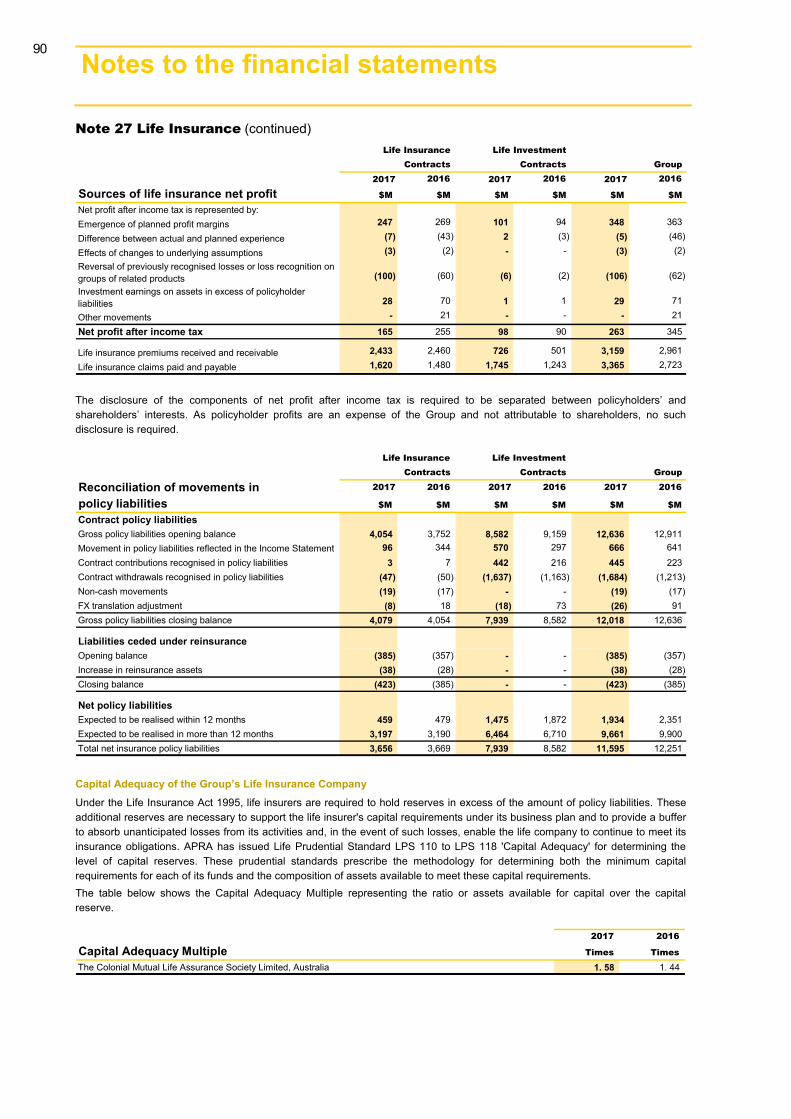
144 Notes to the financial statements 3
Note 27 Life Insurance (continued) Life Insurance Life Investment
Contracts Contracts Group2017 2016 2017 2016 2017 2016
Sources of life insurance net profit $M $M $M $M $M $M
Net profit after income tax is represented by:Emergence of planned profit margins 247 269 101 94 348 363
Difference between actual and planned experience (7) (43) 2 (3) (5) (46)
Effects of changes to underlying assumptions (3) (2) - - (3) (2)
Reversal of previously recognised losses or loss recognition on groups of related products (100) (60) (6) (2) (106) (62)
Investment earnings on assets in excess of policyholder liabilities 28 70 1 1 29 71
Other movements - 21 - - - 21
Net profit after income tax 165 255 98 90 263 345
Life insurance premiums received and receivable 2,433 2,460 726 501 3,159 2,961
Life insurance claims paid and payable 1,620 1,480 1,745 1,243 3,365 2,723
The disclosure of the components of net profit after income tax is required to be separated between policyholders’ and shareholders’ interests. As policyholder profits are an expense of the Group and not attributable to shareholders, no such disclosure is required.
Life Insurance Life InvestmentContracts Contracts Group
Reconciliation of movements in 2017 2016 2017 2016 2017 2016
policy liabilities $M $M $M $M $M $M
Contract policy liabilitiesGross policy liabilities opening balance 4,054 3,752 8,582 9,159 12,636 12,911Movement in policy liabilities reflected in the Income Statement 96 344 570 297 666 641Contract contributions recognised in policy liabilities 3 7 442 216 445 223Contract withdrawals recognised in policy liabilities (47) (50) (1,637) (1,163) (1,684) (1,213)Non-cash movements (19) (17) - - (19) (17)FX translation adjustment (8) 18 (18) 73 (26) 91Gross policy liabilities closing balance 4,079 4,054 7,939 8,582 12,018 12,636
Liabilities ceded under reinsuranceOpening balance (385) (357) - - (385) (357)Increase in reinsurance assets (38) (28) - - (38) (28)Closing balance (423) (385) - - (423) (385)
Net policy liabilitiesExpected to be realised within 12 months 459 479 1,475 1,872 1,934 2,351Expected to be realised in more than 12 months 3,197 3,190 6,464 6,710 9,661 9,900Total net insurance policy liabilities 3,656 3,669 7,939 8,582 11,595 12,251
Capital Adequacy of the Group’s Life Insurance Company Under the Life Insurance Act 1995, life insurers are required to hold reserves in excess of the amount of policy liabilities. These additional reserves are necessary to support the life insurer's capital requirements under its business plan and to provide a buffer to absorb unanticipated losses from its activities and, in the event of such losses, enable the life company to continue to meet its insurance obligations. APRA has issued Life Prudential Standard LPS 110 to LPS 118 'Capital Adequacy' for determining the level of capital reserves. These prudential standards prescribe the methodology for determining both the minimum capital requirements for each of its funds and the composition of assets available to meet these capital requirements. The table below shows the Capital Adequacy Multiple representing the ratio or assets available for capital over the capital reserve.
2017 2016
Capital Adequacy Multiple Times Times
The Colonial Mutual Life Assurance Society Limited, Australia 1. 58 1. 44
90
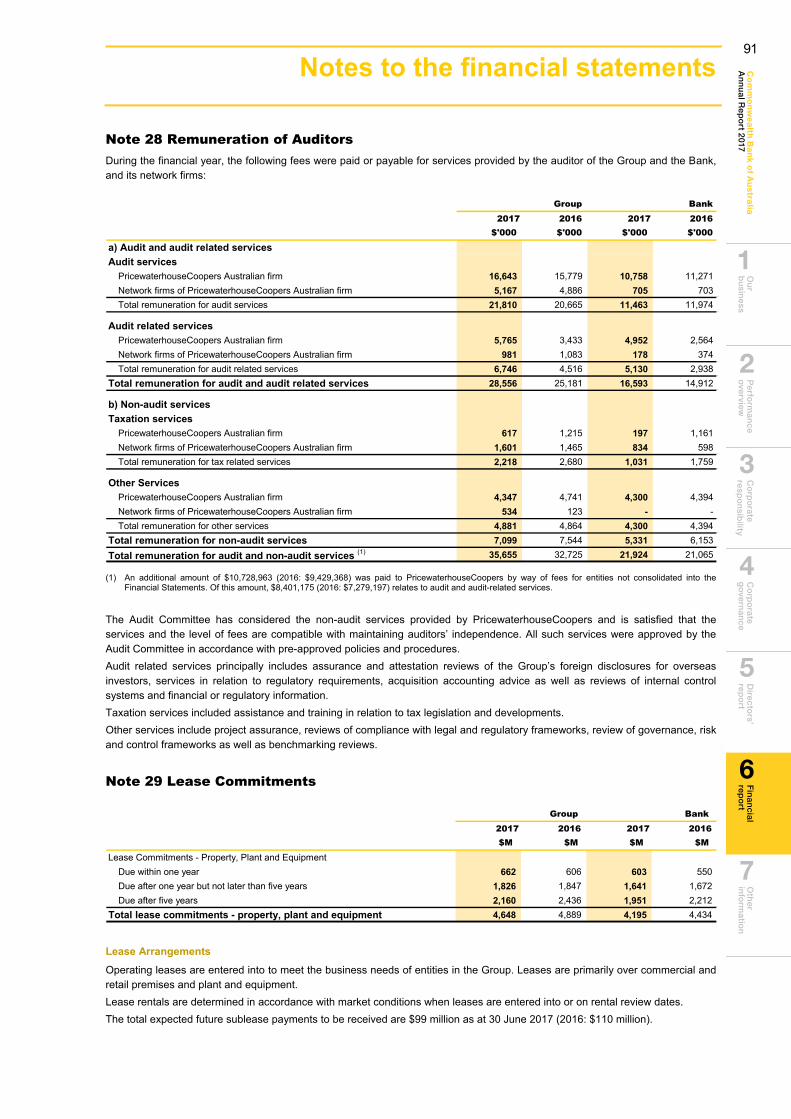
Ou
r b
usin
essP
erform
ance
overview
C
orp
orate
respo
nsib
ility C
orp
orate
go
vernan
ceD
irectors’
repo
rtO
ther
info
rmatio
nC
om
mo
nw
ea
lth Ba
nk o
f Au
stralia
An
nu
al Rep
ort 2017
Fin
ancial
repo
rt
6
2
1
3
4
5
7
145
Note 28 Remuneration of Auditors During the financial year, the following fees were paid or payable for services provided by the auditor of the Group and the Bank, and its network firms:
Group Bank2017 2016 2017 2016
$'000 $'000 $'000 $'000
a) Audit and audit related servicesAudit services
PricewaterhouseCoopers Australian firm 16,643 15,779 10,758 11,271Network firms of PricewaterhouseCoopers Australian firm 5,167 4,886 705 703Total remuneration for audit services 21,810 20,665 11,463 11,974
Audit related servicesPricewaterhouseCoopers Australian firm 5,765 3,433 4,952 2,564Network firms of PricewaterhouseCoopers Australian firm 981 1,083 178 374Total remuneration for audit related services 6,746 4,516 5,130 2,938
Total remuneration for audit and audit related services 28,556 25,181 16,593 14,912
b) Non-audit servicesTaxation services
PricewaterhouseCoopers Australian firm 617 1,215 197 1,161Network firms of PricewaterhouseCoopers Australian firm 1,601 1,465 834 598Total remuneration for tax related services 2,218 2,680 1,031 1,759
Other ServicesPricewaterhouseCoopers Australian firm 4,347 4,741 4,300 4,394Network firms of PricewaterhouseCoopers Australian firm 534 123 - -Total remuneration for other services 4,881 4,864 4,300 4,394
Total remuneration for non-audit services 7,099 7,544 5,331 6,153Total remuneration for audit and non-audit services (1) 35,655 32,725 21,924 21,065
(1) An additional amount of $10,728,963 (2016: $9,429,368) was paid to PricewaterhouseCoopers by way of fees for entities not consolidated into theFinancial Statements. Of this amount, $8,401,175 (2016: $7,279,197) relates to audit and audit-related services.
The Audit Committee has considered the non-audit services provided by PricewaterhouseCoopers and is satisfied that the services and the level of fees are compatible with maintaining auditors’ independence. All such services were approved by the Audit Committee in accordance with pre-approved policies and procedures. Audit related services principally includes assurance and attestation reviews of the Group’s foreign disclosures for overseas investors, services in relation to regulatory requirements, acquisition accounting advice as well as reviews of internal control systems and financial or regulatory information. Taxation services included assistance and training in relation to tax legislation and developments. Other services include project assurance, reviews of compliance with legal and regulatory frameworks, review of governance, risk and control frameworks as well as benchmarking reviews.
Note 29 Lease Commitments
Group Bank2017 2016 2017 2016$M $M $M $M
Lease Commitments - Property, Plant and EquipmentDue within one year 662 606 603 550Due after one year but not later than five years 1,826 1,847 1,641 1,672Due after five years 2,160 2,436 1,951 2,212
Total lease commitments - property, plant and equipment 4,648 4,889 4,195 4,434
Lease Arrangements Operating leases are entered into to meet the business needs of entities in the Group. Leases are primarily over commercial and retail premises and plant and equipment. Lease rentals are determined in accordance with market conditions when leases are entered into or on rental review dates. The total expected future sublease payments to be received are $99 million as at 30 June 2017 (2016: $110 million).
91
Notes to the financial statements
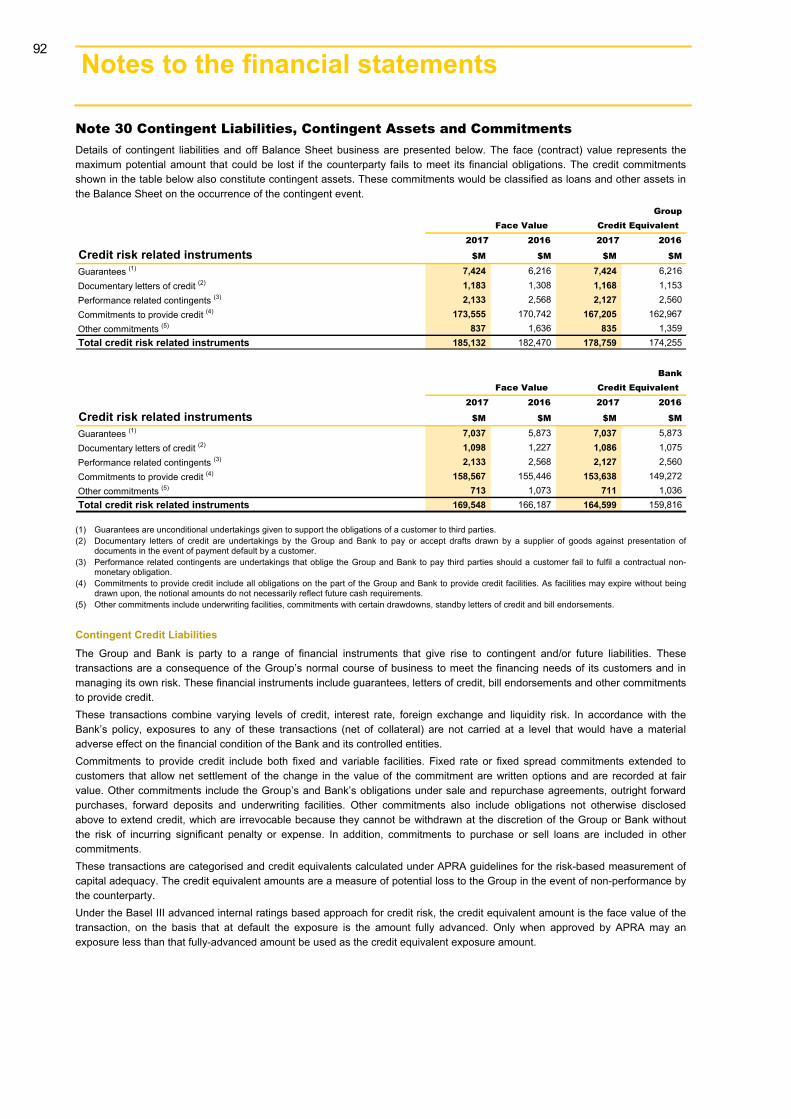
146 Notes to the financial statements 3
Note 30 Contingent Liabilities, Contingent Assets and Commitments Details of contingent liabilities and off Balance Sheet business are presented below. The face (contract) value represents the maximum potential amount that could be lost if the counterparty fails to meet its financial obligations. The credit commitments shown in the table below also constitute contingent assets. These commitments would be classified as loans and other assets in the Balance Sheet on the occurrence of the contingent event.
Group Face Value Credit Equivalent
2017 2016 2017 2016
Credit risk related instruments $M $M $M $M
Guarantees (1) 7,424 6,216 7,424 6,216Documentary letters of credit (2) 1,183 1,308 1,168 1,153Performance related contingents (3) 2,133 2,568 2,127 2,560Commitments to provide credit (4) 173,555 170,742 167,205 162,967Other commitments (5) 837 1,636 835 1,359Total credit risk related instruments 185,132 182,470 178,759 174,255
Bank Face Value Credit Equivalent
2017 2016 2017 2016
Credit risk related instruments $M $M $M $M
Guarantees (1) 7,037 5,873 7,037 5,873Documentary letters of credit (2) 1,098 1,227 1,086 1,075Performance related contingents (3) 2,133 2,568 2,127 2,560Commitments to provide credit (4) 158,567 155,446 153,638 149,272Other commitments (5) 713 1,073 711 1,036Total credit risk related instruments 169,548 166,187 164,599 159,816
(1) Guarantees are unconditional undertakings given to support the obligations of a customer to third parties. (2) Documentary letters of credit are undertakings by the Group and Bank to pay or accept drafts drawn by a supplier of goods against presentation of
documents in the event of payment default by a customer. (3) Performance related contingents are undertakings that oblige the Group and Bank to pay third parties should a customer fail to fulfil a contractual non-
monetary obligation. (4) Commitments to provide credit include all obligations on the part of the Group and Bank to provide credit facilities. As facilities may expire without being
drawn upon, the notional amounts do not necessarily reflect future cash requirements. (5) Other commitments include underwriting facilities, commitments with certain drawdowns, standby letters of credit and bill endorsements.
Contingent Credit Liabilities The Group and Bank is party to a range of financial instruments that give rise to contingent and/or future liabilities. These transactions are a consequence of the Group’s normal course of business to meet the financing needs of its customers and in managing its own risk. These financial instruments include guarantees, letters of credit, bill endorsements and other commitments to provide credit. These transactions combine varying levels of credit, interest rate, foreign exchange and liquidity risk. In accordance with the Bank’s policy, exposures to any of these transactions (net of collateral) are not carried at a level that would have a material adverse effect on the financial condition of the Bank and its controlled entities. Commitments to provide credit include both fixed and variable facilities. Fixed rate or fixed spread commitments extended to customers that allow net settlement of the change in the value of the commitment are written options and are recorded at fair value. Other commitments include the Group’s and Bank’s obligations under sale and repurchase agreements, outright forward purchases, forward deposits and underwriting facilities. Other commitments also include obligations not otherwise disclosed above to extend credit, which are irrevocable because they cannot be withdrawn at the discretion of the Group or Bank without the risk of incurring significant penalty or expense. In addition, commitments to purchase or sell loans are included in other commitments. These transactions are categorised and credit equivalents calculated under APRA guidelines for the risk-based measurement of capital adequacy. The credit equivalent amounts are a measure of potential loss to the Group in the event of non-performance by the counterparty. Under the Basel III advanced internal ratings based approach for credit risk, the credit equivalent amount is the face value of the transaction, on the basis that at default the exposure is the amount fully advanced. Only when approved by APRA may an exposure less than that fully-advanced amount be used as the credit equivalent exposure amount.
92
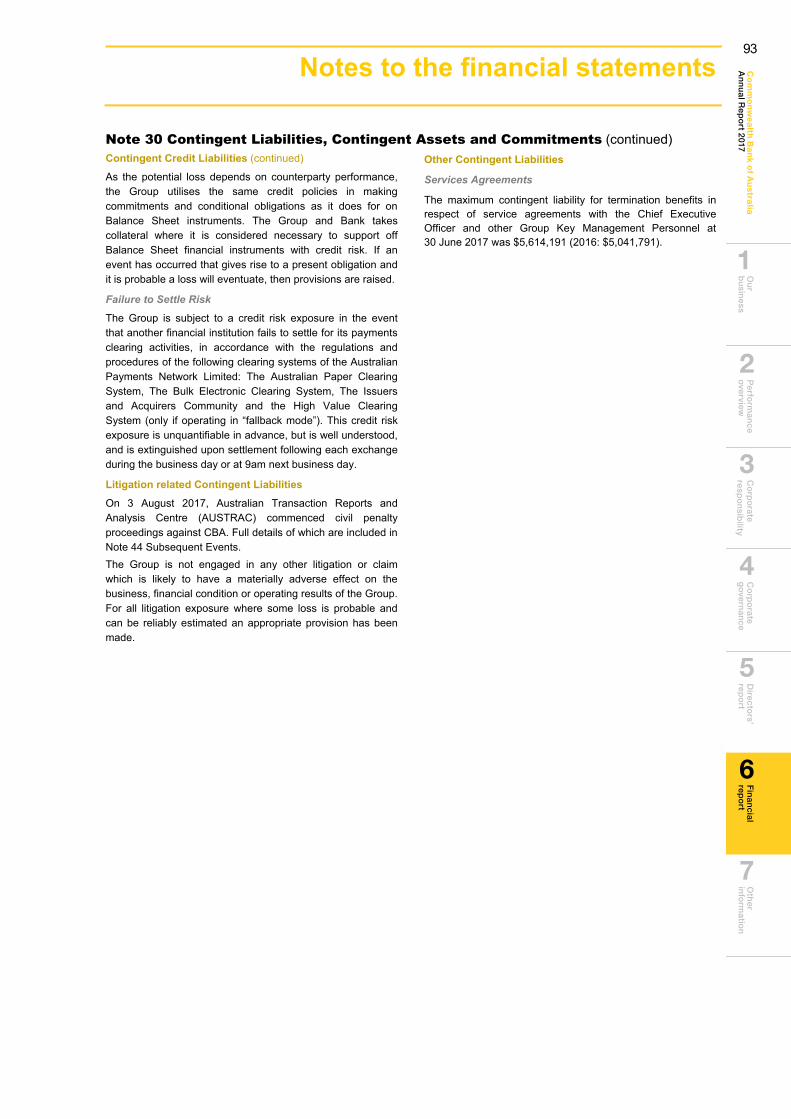
Ou
r b
usin
essP
erform
ance
overview
C
orp
orate
respo
nsib
ility C
orp
orate
go
vernan
ceD
irectors’
repo
rtO
ther
info
rmatio
nC
om
mo
nw
ea
lth Ba
nk o
f Au
stralia
An
nu
al Rep
ort 2017
Fin
ancial
repo
rt
6
2
1
3
4
5
7
147
Note 30 Contingent Liabilities, Contingent Assets and Commitments (continued) Contingent Credit Liabilities (continued)
As the potential loss depends on counterparty performance, the Group utilises the same credit policies in making commitments and conditional obligations as it does for on Balance Sheet instruments. The Group and Bank takes collateral where it is considered necessary to support off Balance Sheet financial instruments with credit risk. If an event has occurred that gives rise to a present obligation and it is probable a loss will eventuate, then provisions are raised.
Failure to Settle Risk
The Group is subject to a credit risk exposure in the event that another financial institution fails to settle for its payments clearing activities, in accordance with the regulations and procedures of the following clearing systems of the Australian Payments Network Limited: The Australian Paper Clearing System, The Bulk Electronic Clearing System, The Issuers and Acquirers Community and the High Value Clearing System (only if operating in “fallback mode”). This credit risk exposure is unquantifiable in advance, but is well understood, and is extinguished upon settlement following each exchange during the business day or at 9am next business day.
Litigation related Contingent Liabilities On 3 August 2017, Australian Transaction Reports and Analysis Centre (AUSTRAC) commenced civil penalty proceedings against CBA. Full details of which are included in Note 44 Subsequent Events. The Group is not engaged in any other litigation or claim which is likely to have a materially adverse effect on the business, financial condition or operating results of the Group. For all litigation exposure where some loss is probable and can be reliably estimated an appropriate provision has been made.
Other Contingent Liabilities
Services Agreements
The maximum contingent liability for termination benefits in respect of service agreements with the Chief Executive Officer and other Group Key Management Personnel at 30 June 2017 was $5,614,191 (2016: $5,041,791).
93
Notes to the financial statements
148 Notes to the financial statements 3
Note 31 Risk Management Risk Management Framework The Group has an embedded Risk Management Framework (Framework) that enables the appropriate development and implementation of strategies, policies and procedures to manage its risks. The Framework incorporates the requirements of APRA’s prudential standard for risk management (CPS 220), and is supported by the three key documentary components: The Group’s Risk Appetite Statement (RAS) articulates
the type and degree of risk the Board is prepared toaccept (Risk Appetite) and the maximum level of riskthat the institution must operate within (Risk Tolerances).
The Group’s Business Plan (Plan) summarises theGroup’s approach to the implementation of its strategicobjectives. The Plan has a rolling three year durationand reflects material risks arising from itsimplementation.
The Group’s Risk Management Strategy (RMS)describes each material risk, the approach taken tomanaging these risks and how this is operationalisedthrough governance, policies and procedures.
This framework requires each business to plan and manage the outcome of its risk-taking activities including proactively managing its risk profile within risk appetite levels; using risk-adjusted outcomes and considerations as part of its day-to-day business decision-making processes; and establishing and maintaining appropriate risk controls. These documents, together with the key operational elements described below, offer the Board the opportunity to direct management in its risk taking activities and facilitate dialogue between Board and management about risk management practices.
Risk Governance The Group is committed to ensuring that its risk management practices reflect a high standard of governance. This enables Management to undertake, in an effective manner, prudent risk-taking activities. The Board operates as the highest level of the Group’s risk governance as specified in its Charter. In addition, an annual declaration is made by the chairs of the Board and Risk Committee to APRA on Risk Management as set out in the prudential standard (CPS220). The Risk Committee oversees the Framework and helps formulate the Group’s risk appetite for consideration by the Board. In particular it: Reviews regular reports from Management on the
measurement of risk and the adequacy andeffectiveness of the Group’s risk management andinternal controls systems;
Monitors the health of the Group’s risk culture (via bothformal reports and through its dialogues with the riskleadership team and executive management) andreports any significant issues to the Board; and
Forms a view on the independence of the risk functionby meeting with the Group Chief Risk Officer (CRO) atthe will of the Committee or the CRO.
The Group risk management structure is a Three Lines of Defence (3LoD) model which supports the Framework by: Reinforcing that risk is best owned and managed where
it occurs – so the business (Line 1) is responsible for themanagement of risk;
Having a separate group of experienced staff withspecific risk management skills (Line 2) to facilitate thedevelopment of, and monitor / measure the effectivenessof the risk management process and systems used byLine 1; and
Having an independent third group (Line 3) provideassurance to the Board, regulators and otherstakeholders on the appropriateness and effectivenessof the activities of Lines 1 and 2.
Risk Culture Risk Culture is the collection of values, ideas, skills and habits that equip Group employees and directors to see and talk about risks, and make sound judgments in the absence of definitive rules, regulations or market signals. The Group regards risk culture as an aspect of overall culture. As such, the Group’s risk culture flourishes within an organisational context that emphasises and rewards integrity, accountability, collaboration, service and excellence. This encourages employees at all levels to “speak up” if they believe the Group as a whole, their part of the organisation or specific colleagues are conspicuously failing to uphold those values, damaging risk culture or taking ill-considered risks. APRA requires the Group Board to form a view regarding the effectiveness of the institution’s risk culture in keeping risk-taking within appetite, and to take any corrective action that may be appropriate. The Board discusses culture and values on a continuous basis, and takes action whenever necessary.
Risk Policies & Procedures
Risk Policies and Procedures provide guidance to the business on the management of each material risk. They support the Framework by: Summarising the principles and practices to be used by
the Group in identifying and assessing its material risks; Outlining a process for monitoring, communicating and
reporting risk issues, including escalation procedures forthe reporting of material risks; and
Quantifying the limits (risk tolerances) for major risks andstating risk actions to which the Group is intolerant.
94
Ou
r b
usin
essP
erform
ance
overview
C
orp
orate
respo
nsib
ility C
orp
orate
go
vernan
ceD
irectors’
repo
rtO
ther
info
rmatio
nC
om
mo
nw
ea
lth Ba
nk o
f Au
stralia
An
nu
al Rep
ort 2017
Fin
ancial
repo
rt
6
2
1
3
4
5
7
149
Note 31 Risk Management (continued)
Risk Management Infrastructure The Framework is supported by the following Group-wide processes: A Management Information System to measure and
aggregate material risks across the Group; A Risk-Adjusted-Performance Measurement (RAPM)
process which is a means of assessing the performance
of a business after adjustment for its risks and is used as a basis for executive incentives; and
An Internal Capital Adequacy Assessment Process(ICAAP) used, in combination with other riskmanagement practices (including Stress testing), tounderstand, manage and quantify the Group’s risks; theoutcomes of which are used to inform risk decisions, setcapital buffers and assist strategic planning.
Material Risks A description of the major risk classes and the Group’s approach to managing them is summarised in the following table:
Risk Type Description Governing Policies and Key Management Committees
Key Limits, Standards and Measurement Approaches
Credit Risk (refer to Note 32)
Credit risk is the potential for loss arising from the failure of a counterparty to meet their contractual obligations to the Group. At a portfolio level, credit risk includes concentration risk arising from interdependencies between customers, and concentrations of exposures to geographical regions and industry sectors.
Governing Policies: Group Credit Risk
Management Framework Group Level Credit Risk
Policies
Key Management Committee: Executive Risk Committee
The following key credit risk policies set credit portfolio concentration limits and standards: Large Credit Exposure Policy; Country Risk Exposure Policy; Industry Sector Concentration Policy;
and Exposure to consumer credit products
are managed within limits and standards set in the Group Level RAS, Business Unit (BU) Level RAS and Credit Portfolio & Product Standards.
The measurement of credit risk is primarily based on an APRA accredited Advanced Internal Ratings Based (AIRB) approach.
Market Risk (including Equity Risk) (refer to Note 33)
Market risk is the risk that market rates and prices will change and that this may have an adverse effect on the profitability and/or net worth of the Group. This includes changes in interest rates, foreign exchange rates, equity and commodity prices, credit spreads, and the resale value of assets underlying operating leases at maturity (lease residual value risk).
Governing Policies: The Group Market Risk
Manual The Group Market Risk Policy Trading Book Policy
Statement
Key Management Committee: Asset and Liability Committee
The Group Market Risk Policy sets limits and standards with respect to the following: Traded Market Risk; Interest Rates Risk in the Banking Book
(IRRBB); Residual Value Risk; Non-traded Equity Risk; and Market Risk in Insurance Businesses.
The respective measurement approaches for these risks include: Value at Risk, Stress Testing; Market Value Sensitivity, Net Interest
Earnings at Risk; Profit & Loss Adjustment Account
Balance, Aggregate Residual Value Risk Weighted Exposure, Aggregate Residual Value Risk Margin;
Aggregate Portfolio Limit; and Value at Risk
Liquidity and Funding Risk (refer to Note 34)
Liquidity risk is the combined risks of not being able to meet financial obligations as they fall due (funding liquidity risk), and that liquidity in financial markets, such as the market for debt securities, may reduce significantly (market liquidity risk).
Governing Policies: Group Liquidity Risk
Management Policy and Strategy
Key Management Committee: Asset and Liability Committee
The Group Liquidity Risk Management Policy and Strategy sets limits and standards with respect to the following: The Liquidity Coverage Ratio, which
requires liquid assets exceed modelled 30 day stress outflows;
Additional market and idiosyncratic stress test scenarios; and
Limits that set tolerances for the sources and tenor of funding.
The measurement of liquidity risk uses scenario analysis, covering both adverse and ordinary operating circumstances.
95
Notes to the financial statements
150 Notes to the financial statements 3
Note 31 Risk Management (continued) Material Risks (continued) Risk Type Description Governing Policies and Key
Management Committees Key Limits, Standards and Measurement Approaches
Operational Risk
Operational risk is the risk of economic loss arising from inadequate or failed internal processes, people, systems or external events.
Governing Policies: Group Operational Risk
Management Framework
Key Management Committee: Executive Committee
The Group Operational Risk Management Framework sets limits and standards with respect to the following: Investigation and reporting of loss, compliance
and near miss incidents; Comprehensive Risk and Control Self-
Assessment, control assurance and issues management processes; and
Comprehensive Scenario Analysis assessment process (also called Quantitative Risk Assessments).
The measurement of operational risk is based on an APRA accredited Advanced Measurement Approach. The approach combines internal and external loss experience and business judgements captured through Scenario Analysis.
Compliance Risk
Compliance risk is the risk of legal or regulatory sanctions, material financial loss, or loss of reputation that the Group may incur as a result of its failure to comply with its Compliance Obligations.
Compliance Obligations are formal requirements that may arise from various sources including but not limited to; laws; regulations; legislation; industry standards; rules; codes or guidelines.
Governing Policies: Group Operational Risk
Management Framework Compliance Risk Management
Framework Compliance Incident
Management Group Policy
Key Management Committee: Executive Committee
The key limits with respect to compliance risk are set via the Group Operational Risk Management Framework. The Group Compliance Risk Management Framework sets standards with respect to the understanding of obligations, establishing policies and procedures, managing non-compliance, monitoring and reporting.
The measurement of compliance risk is undertaken within the operational risk approach.
Insurance Risk
Insurance risk is the risk of loss due to increases in policy benefits arising from variations in the incidence or severity of insured events.
In the life insurance business this arises primarily through mortality (death) or morbidity (illness or injury) claims being greater than expected. In the general insurance business, variability arises mainly through weather related incidents and similar events, as well as general variability in home, motor and travel insurance claim amounts.
Insurance risk also covers inadequacy in product design, pricing, underwriting, claims management and reinsurance management as well as variations in policy lapses, servicing expenses, and option take up rates.
Governing Policies: Product Management Policy Underwriting Policy Claims Management Policy Reinsurance Management
Policy
Key Management Committee: Executive Committees of
insurance writing businesses
The key limits and standards with respect to insurance risk are set via the end-to-end policies of insurance writing businesses. The major methods include: Sound product design and pricing, to ensure
that customers understand the extent of their cover and that premiums are sufficient to cover the risk involved;
Regular review of insurance experience, so that product design, policy liabilities and pricing remains sound;
Claims management to ensure that claims are paid within the agreed policy terms and that genuine claims are paid as soon as possible after documentation is received and reasonable investigations are undertaken; and
Transferring a proportion of insurance risk to reinsurers to keep within risk appetite.
Insurance risk is measured using actuarial techniques which are used to establish the likelihood and severity of possible insurance claims. Insurance risk is further monitored with key financial and performance metrics, such as loss ratios, new business volumes and lapse rates.
96
Ou
r b
usin
essP
erform
ance
overview
C
orp
orate
respo
nsib
ility C
orp
orate
go
vernan
ceD
irectors’
repo
rtO
ther
info
rmatio
nC
om
mo
nw
ea
lth Ba
nk o
f Au
stralia
An
nu
al Rep
ort 2017
Fin
ancial
repo
rt
6
2
1
3
4
5
7
151
Note 31 Risk Management (continued) Material Risks (continued) Risk Type Description Governing Policies and Key
Management Committees Key Limits, Standards and Measurement Approaches
Strategic Business Risk
Strategic Risk is the risk of economic loss arising from changes in the business environment (caused by macroeconomic conditions, competitive forces at work, technology, regulatory or social trends) or internal weaknesses, such as a poorly implemented or flawed strategy.
Governing Policies: Group Risk Management
Strategy (RMS) Climate Policy Position
Statement
Key Management Committee: Executive Committee
The key limits and standards with respect to strategic risk are set via the Board’s consideration of Group and BU strategic plans and the most significant risks (current and emerging) arising from these.
Strategic risk is measured using a combination of judgemental assessments captured through Scenario Analysis and an internal profit simulation model. Potential adverse Climate Change impacts are measured and managed as an outcome of all other material risks. In addition, Corporate Responsibility programs and initiatives: Commit us to playing our part in limiting
climate change to well below two degrees in line with the Paris Agreement;
Support the responsible global transition to net zero emissions by 2050;
Outline our objectives for safeguarding the environment, whilst supporting economic growth and development;
Consider Environmental, Social and Governance (ESG) issues, including climate change impacts in assessing our relationships with customers and suppliers; and
Provide guidelines in monitoring and reducing our own greenhouse gas emissions and energy use.
Reputational Risk
Reputational risk arises from negative perception on the part of customers, counterparties, shareholders, investors, debt holders, market analysts, regulators and other relevant stakeholders of the Group.
Governing Policies: Group RMS Group Environment Policy Climate Policy Position
Statement Human Rights Position
Statement
Key Management Committee: Executive Committee
Potential adverse Reputational impacts are managed as an outcome of all other material risks. In addition, the Group: Sets a range of conduct codes to ensure
we provide a high level of service to our customers (as set out in Statement of Professional Practices); and
Has a corporate responsibility plan focused on driving positive change through education, innovation and good business practice.
97
Notes to the financial statements
152 Notes to the financial statements 3
Note 32 Credit Risk Credit Risk Management Principles and Portfolio Standards The Group has clearly defined credit policies for the approval and management of credit risk. Credit policies apply to all credit risks, with specific portfolio standards applying to all major lending areas. These set the minimum requirements in assessing the integrity and ability of counterparties to meet their contracted financial obligations for repayment, acceptable forms of collateral and security and the frequency of credit reviews. The credit policies and frameworks include concentration limits which are designed to achieve portfolio outcomes that are consistent with the Group’s risk appetite and risk/return expectations. The Credit Portfolio Assurance unit, part of Group Audit and Assurance, reviews credit portfolios and business unit compliance with credit policies, application of credit risk ratings and other key practices on a regular basis. The credit risk portfolio has two major segments:
(i) Retail Managed SegmentThis segment has sub-segments covering housing loans, credit cards, personal loans, some leasing products, some unsecured commercial lending and most secured commercial lending up to $1 million. Auto-decisioning is used to approve credit applications for eligible counterparties in this segment. Auto-decisioning uses a scorecard approach based on the Group’s historical experience on similar applications, information from a credit reference bureau and the Group’s existing knowledge of a counterparties behaviour and updated information provided by the counterparty. Loan applications that do not meet scorecard Auto-decisioning requirements may be referred to a Risk Management Officer with a Personal Credit Approval Authority (PCAA) for manual decisioning. After loan origination, these portfolios are managed using behavioural scoring systems and a delinquency band approach, e.g. actions taken when loan payments are greater than 30 days past due differ from actions when payments are greater than 60 days past due, and are reviewed by the relevant Risk Management or Business Unit Credit Support Team.
(ii) Risk-Rated SegmentThis segment comprises commercial exposures, including bank and sovereign exposures. Each exposure is assigned an internal Credit Risk-Rating (CRR) based on Probability of Default (PD) and Loss Given Default (LGD). For credit risk rated exposures either a PD Rating Tool or expert judgement is used to determine the PD. Expert judgement is used where the complexity of the transaction and/or the debtor is such that it is inappropriate to rely completely on a statistical model. External ratings may be used as inputs into the expert judgement assessment. The CRR is designed to: Aid in assessing changes to counterparty credit quality; Influence decisions on approval, management and
pricing of individual credit facilities; and Provide the basis for reporting details of the Group's
credit portfolio.
Credit risk-rated exposures are generally reviewed on an individual basis, at least annually, and fall within the following categories: “Pass” – these credit facilities qualify for approval of new
or increased exposure on normal commercial terms; and “Troublesome or Impaired Assets (TIAs)” – these credit
facilities are not eligible for new or increased exposure,unless it will protect or improve the Group’s position(maximising recovery prospects) or facilitaterehabilitation to “pass grade”. Where a counterparty is indefault but the facility is well secured, the facility may beclassed as troublesome but not impaired. Where acounterparty’s facility is not well secured and a loss isexpected, the facility is classed as impaired.Restructured facilities, where the original contractualarrangements have been modified to provideconcessions for the customer’s financial difficulties, arerendered non-commercial to the Group.
Default is usually consistent with one or more of the following: The customer is 90 days or more overdue on a
scheduled credit obligation repayment; or The customer is unlikely to repay their credit obligation
to the Group in full without taking action, such asrealising on available security.
Credit Risk Measurement The measurement of credit risk uses analytical tools to calculate both: (i) Expected, and (ii) Unexpected Loss probabilities for the credit portfolio. The use of analytical tools is governed by a Credit Rating Governance Committee.
(i) Expected LossExpected Loss (EL) is the product of: PD; Exposure at Default (EAD); and LGD.The PD, expressed as a percentage, is the estimate of the probability that a client will default within the next 12 months. The dollar amount of EAD is the estimate of the amount of a facility that will be outstanding in the event of default. Estimates are based on downturn economic conditions. The estimate is based on the actual amount outstanding, plus the undrawn amount multiplied by a credit conversion factor which represents the potential rate of conversion from undrawn 12 months prior to default to drawn at default. For most committed facilities, the Group applies a credit conversion factor of 100% to the undrawn amount. For uncommitted facilities the EAD will generally be the drawn balance only. For defaulted facilities it is the actual amount outstanding at default. For retail exposures, a modelling approach can be used based on factors including limit usage, arrears and loan type to segment accounts into homogeneous pools for the calculation. LGD expressed as a percentage, is the estimated proportion of a facility likely to be lost in the event of default. LGD is impacted by Type and level of any collateral held;
98
Ou
r b
usin
essP
erform
ance
overview
C
orp
orate
respo
nsib
ility C
orp
orate
go
vernan
ceD
irectors’
repo
rtO
ther
info
rmatio
nC
om
mo
nw
ea
lth Ba
nk o
f Au
stralia
An
nu
al Rep
ort 2017
Fin
ancial
repo
rt
6
2
1
3
4
5
7
153
Note 32 Credit Risk (continued)Credit Risk Measurement (continued)
Liquidity and volatility of collateral; Carrying costs (effectively the costs of providing a facility
that is not generating an interest return); and Realisation costs.Various factors are considered when calculating PD, EAD and LGD. Considerations include the potential for default by a borrower due to economic, management, industry and other risks, and the mitigating benefits of any collateral or security.
(ii) Unexpected LossIn addition to EL, a more stressed loss amount is calculated. This Unexpected Loss estimate directly affects the calculation of regulatory and internal economic capital requirements. Refer to the Performance Overview section and Note 25 for information relating to regulatory capital.
Credit Risk Mitigation, Collateral and Other Credit Enhancements The Group has policies and procedures in place setting out the circumstances where acceptable and appropriate collateral is to be taken to mitigate credit risk, including valuation parameters, review frequency and independence of valuation. The general nature of collateral that may be taken, and the balances held, are summarised below by financial asset classes.
Cash and Liquid Assets Collateral is not usually sought on the majority of Cash and liquid asset balances as these types of exposures are generally considered low risk. However, securities purchased under agreement to resell are collateralised by highly liquid debt securities. The collateral related to agreements to resell has been legally transferred to the Group subject to an agreement to return them for a fixed price. The Group’s cash and liquid asset balance included $20,307 million (2016: $11,629 million) deposited with central banks and is considered to carry less credit risk.
Receivables Due from Other Financial Institutions Collateral is usually not sought on these balances as exposures are generally considered to be of low risk. The exposures are mainly short term and to investment grade banks.
Trading Assets at Fair Value through Income Statement and Available-for-Sale (AFS) Investments These assets are carried at fair value, which accounts for the credit risk. Collateral is not generally sought from the issuer or counterparty however collateral may be implicit in the terms of the instrument (e.g asset-backed security). Credit derivatives have been used to a limited extent to mitigate the exposure to credit risk.
Insurance Assets These assets are carried at fair value, which accounts for the credit risk. Collateral is not generally sought or provided on these types of assets, other than a fixed charge over properties backing Australian mortgage investments. In most cases the credit risk of insurance assets is borne by
policyholders. However, on certain insurance contracts the Group retains exposure to credit risk. Other Assets at Fair Value through Income Statement These assets are carried at fair value, which accounts for the credit risk. Credit derivatives used to mitigate the exposure to credit risk are not significant. Derivative Assets The Group’s use of derivative contracts is outlined in Note 10. The Group is exposed to credit risk on derivative contracts. The Group’s exposure to counterparty credit risk is affected by the nature of the trades, the creditworthiness of the counterparty, netting, and collateral arrangements. Credit risk from derivatives is mitigated where possible (typically for financial markets counterparties, but less frequently for corporate or government counterparties) through netting agreements, whereby derivative assets and liabilities with the same counterparty can be offset and clearing of trades with Central Counterparties (CCPs). The International Swaps and Derivatives Association (ISDA) Master Agreement (or other derivative agreements) are used by the Group as an agreement for documenting Over-the-Counter (OTC) derivatives. Collateral is obtained against derivative assets, depending on the creditworthiness of the counterparty and/or nature of the transaction. The fair value of collateral held and the potential effect of offset obtained by applying master netting agreements are disclosed in Note 42.
Due from Controlled Entities Collateral is not generally taken on these intergroup balances.
Credit Commitments and Contingent Liabilities The Group applies fundamentally the same risk management policies for off Balance Sheet risks as it does for its on Balance Sheet risks. Collateral may be sought depending on the strength of the counterparty and the nature of the transaction. Of the Group’s off Balance Sheet exposures, $100,078 million (2016: $96,111 million) are secured.
Loans, Bills Discounted and Other Receivables The principal collateral types for loans and receivable balances are: Mortgages over residential and commercial real estate; Charges over business assets such as cash, shares,
inventory, fixed assets and accounts receivables; and Guarantees received from third parties.Collateral security, is generally taken except for government, bank and corporate counterparties that are often externally risk-rated and of strong financial standing. Longer term consumer finance, such as housing loans, are generally secured against real estate, while short term revolving consumer credit is generally not secured by formal collateral. The collateral mitigating credit risk of the key lending portfolios is addressed in the table ‘Collateral held against Loans, Bills Discounted and Other Receivables’ within this note.
99
Notes to the financial statements

154 Notes to the financial statements 3
Note 32 Credit Risk (continued) Maximum Exposure to Credit Risk by Industry and Asset Class before Collateral Held or Other Credit Enhancements The tables below detail the concentration of credit exposure assets by significant geographical locations and counterparty types. Disclosures do not take into account collateral held and other credit enhancements.
GroupAt 30 June 2017
Bank Asset OtherAgri- and Other Home Constr- Other Financ- Comm and
Sovereign culture Financial Loans uction Personal ing Indust. Other Total $M $M $M $M $M $M $M $M $M $M
AustraliaCredit risk exposures relating to on Balance Sheet assets:Cash and liquid assets 4,711 - 21,929 - - - - - - 26,640Receivables due from otherfinancial institutions - - 2,565 - - - - - - 2,565Assets at fair value throughIncome Statement:
Trading 18,107 - 1,545 - - - - 8,811 - 28,463Insurance 2,131 - 5,806 - - - - 3,535 - 11,472Other 51 - 607 - - - - 453 - 1,111
Derivative assets 1,181 56 20,037 - 53 - - 4,668 - 25,995Available-for-sale investments 41,323 - 27,126 - - - - 294 - 68,743Loans, bills discountedand other receivables (1) 18,085 8,784 15,425 436,184 3,765 23,183 7,872 120,638 - 633,936Bank acceptances - 2 - - 1 - - 38 - 41Other assets (2) 1,460 16 4,073 - 4 6 - 359 17,056 22,974Total on Balance Sheet Australia 87,049 8,858 99,113 436,184 3,823 23,189 7,872 138,796 17,056 821,940
Credit risk exposures relating to off Balance Sheet assets:Guarantees 50 16 1,092 8 510 - - 4,321 - 5,997Loan commitments 795 1,967 7,439 66,869 2,973 22,495 - 39,467 - 142,005Other commitments 42 30 1,040 1 962 - 10 1,849 - 3,934Total Australia 87,936 10,871 108,684 503,062 8,268 45,684 7,882 184,433 17,056 973,876
OverseasCredit risk exposures relating to on Balance Sheet assets:Cash and liquid assets 15,595 - 3,615 - - - - - - 19,210Receivables due from otherfinancial institutions 109 - 7,363 - - - - - - 7,472Assets at fair value throughIncome Statement:
Trading 2,264 - 1,712 - - - - 265 - 4,241Insurance 354 - 1,843 - - - - - - 2,197Other - - - - - - - - - -
Derivative assets 412 19 3,037 - - - - 2,261 - 5,729Available-for-sale investments 11,832 - 2,959 - - - - 1 - 14,792Loans, bills discountedand other receivables (1) 1,900 9,848 5,775 49,673 634 1,713 464 32,596 - 102,603Bank acceptances - - - - - - - 422 - 422Other assets (2) 41 - 413 - - 3 8 57 2,023 2,545Total on Balance Sheet overseas 32,507 9,867 26,717 49,673 634 1,716 472 35,602 2,023 159,211
Credit risk exposures relating to off Balance Sheet assets:Guarantees 1 2 1,086 - 37 - - 301 - 1,427Loan commitments 284 881 6,335 7,414 196 2,017 - 14,423 - 31,550Other commitments 26 5 1 - - - - 187 - 219Total overseas 32,818 10,755 34,139 57,087 867 3,733 472 50,513 2,023 192,407Total gross credit risk 120,754 21,626 142,823 560,149 9,135 49,417 8,354 234,946 19,079 1,166,283
(1) Loans, bills discounted and other receivables is presented gross of provisions for impairment and unearned income in line with Note 12.(2) For the purpose of reconciling to the Balance Sheet, “Other assets” predominantly comprises assets which do not give rise to credit exposure, including
Property, plant and equipment, Investment in Associates and Joint Ventures, Intangible assets, Deferred tax assets and Other assets.
100
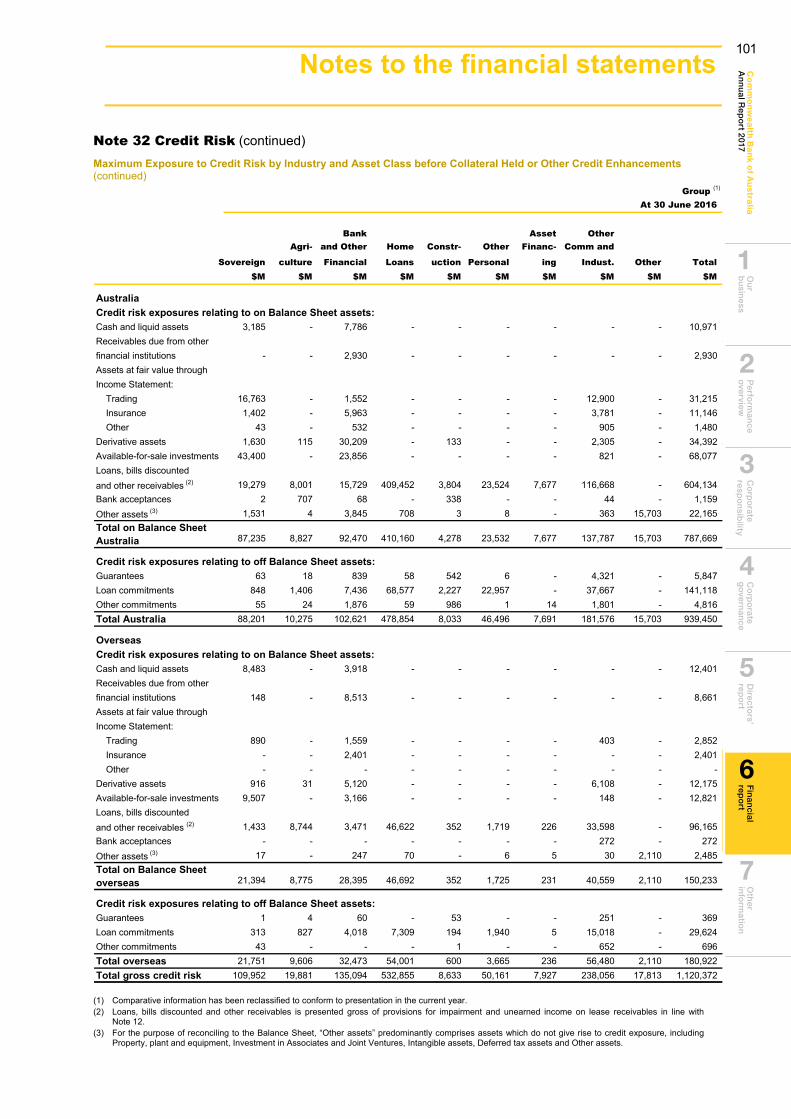
Ou
r b
usin
essP
erform
ance
overview
C
orp
orate
respo
nsib
ility C
orp
orate
go
vernan
ceD
irectors’
repo
rtO
ther
info
rmatio
nC
om
mo
nw
ea
lth Ba
nk o
f Au
stralia
An
nu
al Rep
ort 2017
Fin
ancial
repo
rt
6
2
1
3
4
5
7
Notes to the financial statements 155
Note 32 Credit Risk (continued) Maximum Exposure to Credit Risk by Industry and Asset Class before Collateral Held or Other Credit Enhancements (continued)
Group (1)
At 30 June 2016
Bank Asset OtherAgri- and Other Home Constr- Other Financ- Comm and
Sovereign culture Financial Loans uction Personal ing Indust. Other Total$M $M $M $M $M $M $M $M $M $M
AustraliaCredit risk exposures relating to on Balance Sheet assets:Cash and liquid assets 3,185 - 7,786 - - - - - - 10,971Receivables due from otherfinancial institutions - - 2,930 - - - - - - 2,930Assets at fair value throughIncome Statement:
Trading 16,763 - 1,552 - - - - 12,900 - 31,215Insurance 1,402 - 5,963 - - - - 3,781 - 11,146Other 43 - 532 - - - - 905 - 1,480
Derivative assets 1,630 115 30,209 - 133 - - 2,305 - 34,392Available-for-sale investments 43,400 - 23,856 - - - - 821 - 68,077Loans, bills discountedand other receivables (2) 19,279 8,001 15,729 409,452 3,804 23,524 7,677 116,668 - 604,134Bank acceptances 2 707 68 - 338 - - 44 - 1,159Other assets (3) 1,531 4 3,845 708 3 8 - 363 15,703 22,165Total on Balance SheetAustralia 87,235 8,827 92,470 410,160 4,278 23,532 7,677 137,787 15,703 787,669
Credit risk exposures relating to off Balance Sheet assets:Guarantees 63 18 839 58 542 6 - 4,321 - 5,847Loan commitments 848 1,406 7,436 68,577 2,227 22,957 - 37,667 - 141,118Other commitments 55 24 1,876 59 986 1 14 1,801 - 4,816Total Australia 88,201 10,275 102,621 478,854 8,033 46,496 7,691 181,576 15,703 939,450
OverseasCredit risk exposures relating to on Balance Sheet assets:Cash and liquid assets 8,483 - 3,918 - - - - - - 12,401Receivables due from otherfinancial institutions 148 - 8,513 - - - - - - 8,661Assets at fair value throughIncome Statement:
Trading 890 - 1,559 - - - - 403 - 2,852Insurance - - 2,401 - - - - - - 2,401Other - - - - - - - - - -
Derivative assets 916 31 5,120 - - - - 6,108 - 12,175Available-for-sale investments 9,507 - 3,166 - - - - 148 - 12,821Loans, bills discountedand other receivables (2) 1,433 8,744 3,471 46,622 352 1,719 226 33,598 - 96,165Bank acceptances - - - - - - - 272 - 272Other assets (3) 17 - 247 70 - 6 5 30 2,110 2,485Total on Balance Sheetoverseas 21,394 8,775 28,395 46,692 352 1,725 231 40,559 2,110 150,233
Credit risk exposures relating to off Balance Sheet assets:Guarantees 1 4 60 - 53 - - 251 - 369Loan commitments 313 827 4,018 7,309 194 1,940 5 15,018 - 29,624Other commitments 43 - - - 1 - - 652 - 696Total overseas 21,751 9,606 32,473 54,001 600 3,665 236 56,480 2,110 180,922Total gross credit risk 109,952 19,881 135,094 532,855 8,633 50,161 7,927 238,056 17,813 1,120,372
(1) Comparative information has been reclassified to conform to presentation in the current year.(2) Loans, bills discounted and other receivables is presented gross of provisions for impairment and unearned income on lease receivables in line with
Note 12.(3) For the purpose of reconciling to the Balance Sheet, “Other assets” predominantly comprises assets which do not give rise to credit exposure, including
Property, plant and equipment, Investment in Associates and Joint Ventures, Intangible assets, Deferred tax assets and Other assets.
Notes to the financial statements 155
Note 32 Credit Risk (continued) Maximum Exposure to Credit Risk by Industry and Asset Class before Collateral Held or Other Credit Enhancements (continued)
Group (1)
At 30 June 2016
Bank Asset OtherAgri- and Other Home Constr- Other Financ- Comm and
Sovereign culture Financial Loans uction Personal ing Indust. Other Total $M $M $M $M $M $M $M $M $M $M
AustraliaCredit risk exposures relating to on Balance Sheet assets:Cash and liquid assets 3,185 - 7,786 - - - - - - 10,971Receivables due from otherfinancial institutions - - 2,930 - - - - - - 2,930Assets at fair value throughIncome Statement:
Trading 16,763 - 1,552 - - - - 12,900 - 31,215Insurance 1,402 - 5,963 - - - - 3,781 - 11,146Other 43 - 532 - - - - 905 - 1,480
Derivative assets 1,630 115 30,209 - 133 - - 2,305 - 34,392Available-for-sale investments 43,400 - 23,856 - - - - 821 - 68,077Loans, bills discountedand other receivables (2) 19,279 8,001 15,729 409,452 3,804 23,524 7,677 116,668 - 604,134Bank acceptances 2 707 68 - 338 - - 44 - 1,159Other assets (3) 1,531 4 3,845 708 3 8 - 363 15,703 22,165Total on Balance Sheet Australia 87,235 8,827 92,470 410,160 4,278 23,532 7,677 137,787 15,703 787,669
Credit risk exposures relating to off Balance Sheet assets:Guarantees 63 18 839 58 542 6 - 4,321 - 5,847Loan commitments 848 1,406 7,436 68,577 2,227 22,957 - 37,667 - 141,118Other commitments 55 24 1,876 59 986 1 14 1,801 - 4,816Total Australia 88,201 10,275 102,621 478,854 8,033 46,496 7,691 181,576 15,703 939,450
OverseasCredit risk exposures relating to on Balance Sheet assets:Cash and liquid assets 8,483 - 3,918 - - - - - - 12,401Receivables due from otherfinancial institutions 148 - 8,513 - - - - - - 8,661Assets at fair value throughIncome Statement:
Trading 890 - 1,559 - - - - 403 - 2,852Insurance - - 2,401 - - - - - - 2,401Other - - - - - - - - - -
Derivative assets 916 31 5,120 - - - - 6,108 - 12,175Available-for-sale investments 9,507 - 3,166 - - - - 148 - 12,821Loans, bills discountedand other receivables (2) 1,433 8,744 3,471 46,622 352 1,719 226 33,598 - 96,165Bank acceptances - - - - - - - 272 - 272Other assets (3) 17 - 247 70 - 6 5 30 2,110 2,485Total on Balance Sheet overseas 21,394 8,775 28,395 46,692 352 1,725 231 40,559 2,110 150,233
Credit risk exposures relating to off Balance Sheet assets:Guarantees 1 4 60 - 53 - - 251 - 369Loan commitments 313 827 4,018 7,309 194 1,940 5 15,018 - 29,624Other commitments 43 - - - 1 - - 652 - 696Total overseas 21,751 9,606 32,473 54,001 600 3,665 236 56,480 2,110 180,922Total gross credit risk 109,952 19,881 135,094 532,855 8,633 50,161 7,927 238,056 17,813 1,120,372
(1) Comparative information has been reclassified to conform to presentation in the current year. (2) Loans, bills discounted and other receivables is presented gross of provisions for impairment and unearned income on lease receivables in line with
Note 12. (3) For the purpose of reconciling to the Balance Sheet, “Other assets” predominantly comprises assets which do not give rise to credit exposure, including
Property, plant and equipment, Investment in Associates and Joint Ventures, Intangible assets, Deferred tax assets and Other assets.
101
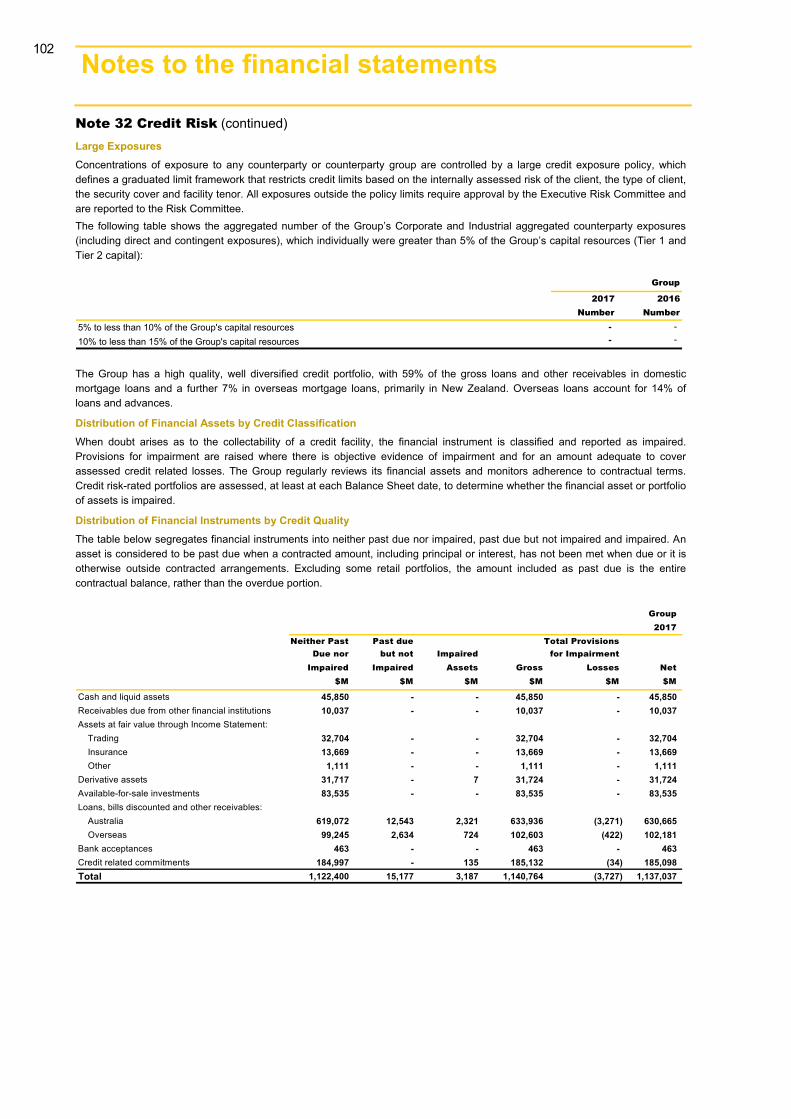
156 Notes to the financial statements 3
Note 32 Credit Risk (continued) Large Exposures Concentrations of exposure to any counterparty or counterparty group are controlled by a large credit exposure policy, which defines a graduated limit framework that restricts credit limits based on the internally assessed risk of the client, the type of client, the security cover and facility tenor. All exposures outside the policy limits require approval by the Executive Risk Committee and are reported to the Risk Committee. The following table shows the aggregated number of the Group’s Corporate and Industrial aggregated counterparty exposures (including direct and contingent exposures), which individually were greater than 5% of the Group’s capital resources (Tier 1 and Tier 2 capital):
Group
2017 2016Number Number
5% to less than 10% of the Group's capital resources - -10% to less than 15% of the Group's capital resources - -
The Group has a high quality, well diversified credit portfolio, with 59% of the gross loans and other receivables in domestic mortgage loans and a further 7% in overseas mortgage loans, primarily in New Zealand. Overseas loans account for 14% of loans and advances.
Distribution of Financial Assets by Credit Classification When doubt arises as to the collectability of a credit facility, the financial instrument is classified and reported as impaired. Provisions for impairment are raised where there is objective evidence of impairment and for an amount adequate to cover assessed credit related losses. The Group regularly reviews its financial assets and monitors adherence to contractual terms. Credit risk-rated portfolios are assessed, at least at each Balance Sheet date, to determine whether the financial asset or portfolio of assets is impaired.
Distribution of Financial Instruments by Credit Quality The table below segregates financial instruments into neither past due nor impaired, past due but not impaired and impaired. An asset is considered to be past due when a contracted amount, including principal or interest, has not been met when due or it is otherwise outside contracted arrangements. Excluding some retail portfolios, the amount included as past due is the entire contractual balance, rather than the overdue portion.
Group2017
Neither Past Past due Total Provisions Due nor but not Impaired for ImpairmentImpaired Impaired Assets Gross Losses Net
$M $M $M $M $M $M
Cash and liquid assets 45,850 - - 45,850 - 45,850Receivables due from other financial institutions 10,037 - - 10,037 - 10,037Assets at fair value through Income Statement:
Trading 32,704 - - 32,704 - 32,704Insurance 13,669 - - 13,669 - 13,669Other 1,111 - - 1,111 - 1,111
Derivative assets 31,717 - 7 31,724 - 31,724Available-for-sale investments 83,535 - - 83,535 - 83,535Loans, bills discounted and other receivables:
Australia 619,072 12,543 2,321 633,936 (3,271) 630,665Overseas 99,245 2,634 724 102,603 (422) 102,181
Bank acceptances 463 - - 463 - 463Credit related commitments 184,997 - 135 185,132 (34) 185,098Total 1,122,400 15,177 3,187 1,140,764 (3,727) 1,137,037
102

Ou
r b
usin
essP
erform
ance
overview
C
orp
orate
respo
nsib
ility C
orp
orate
go
vernan
ceD
irectors’
repo
rtO
ther
info
rmatio
nC
om
mo
nw
ea
lth Ba
nk o
f Au
stralia
An
nu
al Rep
ort 2017
Fin
ancial
repo
rt
6
2
1
3
4
5
7
157
Note 32 Credit Risk (continued) Group 2016
Neither Past Past Due Total Provisions
Due nor but not Impaired for ImpairmentImpaired Impaired Assets Gross Losses Net
$M $M $M $M $M $M
Cash and liquid assets 23,372 - - 23,372 - 23,372Receivables due from other financial institutions 11,591 - - 11,591 - 11,591Assets at fair value through Income Statement:
Trading 34,067 - - 34,067 - 34,067Insurance 13,547 - - 13,547 - 13,547Other 1,480 - - 1,480 - 1,480
Derivative assets 46,547 - 20 46,567 - 46,567Available-for-sale investments 80,898 - - 80,898 - 80,898Loans, bills discounted and other receivables:
Australia 588,634 13,104 2,396 604,134 (3,318) 600,816Overseas 93,245 2,337 583 96,165 (400) 95,765
Bank acceptances 1,431 - - 1,431 - 1,431Credit related commitments 182,353 - 117 182,470 (44) 182,426Total 1,077,165 15,441 3,116 1,095,722 (3,762) 1,091,960
Bank2017
Neither Past Past Due Total ProvisionsDue nor but not Impaired for Impairment
Impaired Impaired Assets Gross Losses Net$M $M $M $M $M $M
Cash and liquid assets 42,814 - - 42,814 - 42,814Receivables due from other financial institutions 8,678 - - 8,678 - 8,678Assets at fair value through Income Statement:
Trading 31,127 - - 31,127 - 31,127Insurance - - - - - -Other 796 - - 796 - 796
Derivative assets 32,088 - 6 32,094 - 32,094Available-for-sale investments 79,019 - - 79,019 - 79,019Loans, bills discounted and other receivables:
Australia 611,624 12,541 2,290 626,455 (3,262) 623,193Overseas 25,056 40 242 25,338 (83) 25,255
Bank acceptances 463 - - 463 - 463Shares in and loans to controlled entities 101,337 - - 101,337 - 101,337Credit related commitments 169,418 - 130 169,548 (34) 169,514Total 1,102,420 12,581 2,668 1,117,669 (3,379) 1,114,290
Bank2016
Neither Past Past Due Total ProvisionsDue nor but not Impaired for Impairment
Impaired Impaired Assets Gross Losses Net$M $M $M $M $M $M
Cash and liquid assets 21,582 - - 21,582 - 21,582Receivables due from other financial institutions 10,182 - - 10,182 - 10,182Assets at fair value through Income Statement:
Trading 32,985 - - 32,985 - 32,985Insurance - - - - - -Other 1,187 - - 1,187 - 1,187
Derivative assets 46,505 - 20 46,525 - 46,525Available-for-sale investments 76,361 - - 76,361 - 76,361Loans, bills discounted and other receivables:
Australia 582,155 13,098 2,358 597,611 (3,309) 594,302Overseas 24,512 19 119 24,650 (56) 24,594
Bank acceptances 1,413 - - 1,413 - 1,413Shares in and loans to controlled entities 145,953 - - 145,953 - 145,953Credit related commitments 166,075 - 112 166,187 (44) 166,143Total 1,108,910 13,117 2,609 1,124,636 (3,409) 1,121,227
103
Notes to the financial statements
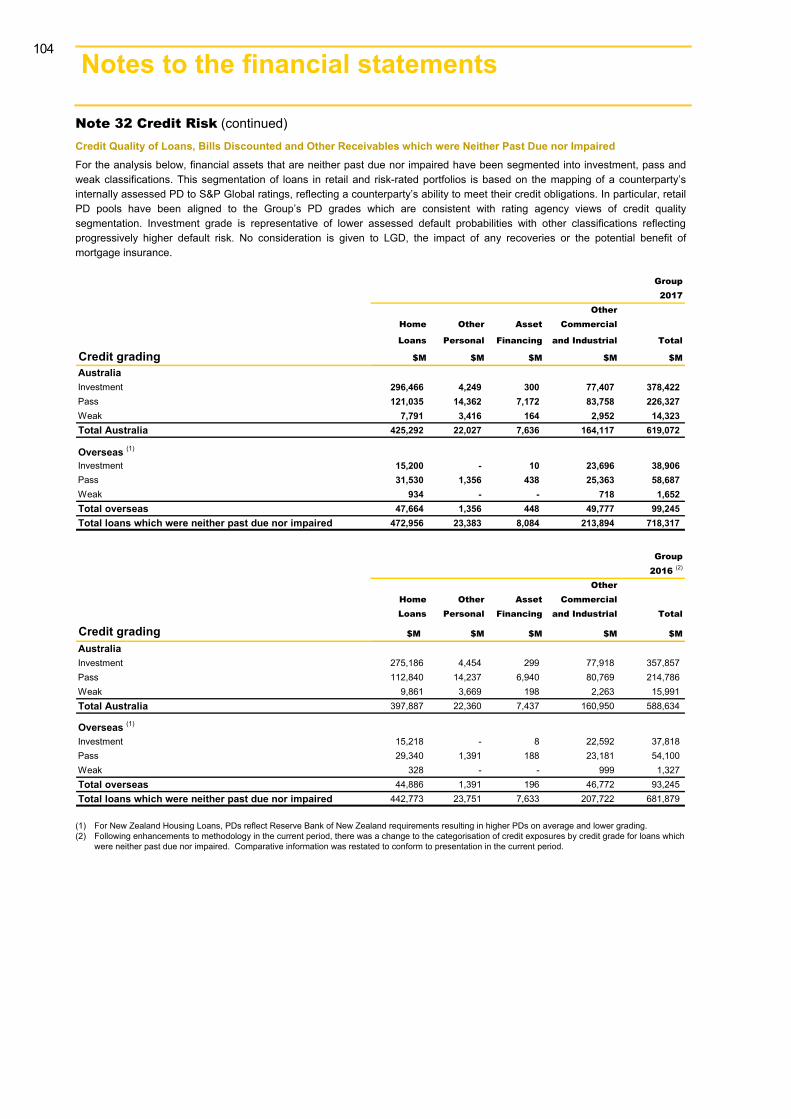
158 Notes to the financial statements 3
Note 32 Credit Risk (continued) Credit Quality of Loans, Bills Discounted and Other Receivables which were Neither Past Due nor Impaired For the analysis below, financial assets that are neither past due nor impaired have been segmented into investment, pass and weak classifications. This segmentation of loans in retail and risk-rated portfolios is based on the mapping of a counterparty’s internally assessed PD to S&P Global ratings, reflecting a counterparty’s ability to meet their credit obligations. In particular, retail PD pools have been aligned to the Group’s PD grades which are consistent with rating agency views of credit quality segmentation. Investment grade is representative of lower assessed default probabilities with other classifications reflecting progressively higher default risk. No consideration is given to LGD, the impact of any recoveries or the potential benefit of mortgage insurance.
Group2017
OtherHome Other Asset Commercial
Loans Personal Financing and Industrial Total
Credit grading $M $M $M $M $M
AustraliaInvestment 296,466 4,249 300 77,407 378,422Pass 121,035 14,362 7,172 83,758 226,327Weak 7,791 3,416 164 2,952 14,323Total Australia 425,292 22,027 7,636 164,117 619,072
Overseas (1)
Investment 15,200 - 10 23,696 38,906Pass 31,530 1,356 438 25,363 58,687Weak 934 - - 718 1,652Total overseas 47,664 1,356 448 49,777 99,245Total loans which were neither past due nor impaired 472,956 23,383 8,084 213,894 718,317
Group2016 (2)
OtherHome Other Asset CommercialLoans Personal Financing and Industrial Total
Credit grading $M $M $M $M $M
AustraliaInvestment 275,186 4,454 299 77,918 357,857Pass 112,840 14,237 6,940 80,769 214,786Weak 9,861 3,669 198 2,263 15,991Total Australia 397,887 22,360 7,437 160,950 588,634
Overseas (1)
Investment 15,218 - 8 22,592 37,818Pass 29,340 1,391 188 23,181 54,100Weak 328 - - 999 1,327Total overseas 44,886 1,391 196 46,772 93,245Total loans which were neither past due nor impaired 442,773 23,751 7,633 207,722 681,879
(1) For New Zealand Housing Loans, PDs reflect Reserve Bank of New Zealand requirements resulting in higher PDs on average and lower grading.(2) Following enhancements to methodology in the current period, there was a change to the categorisation of credit exposures by credit grade for loans which
were neither past due nor impaired. Comparative information was restated to conform to presentation in the current period.
104
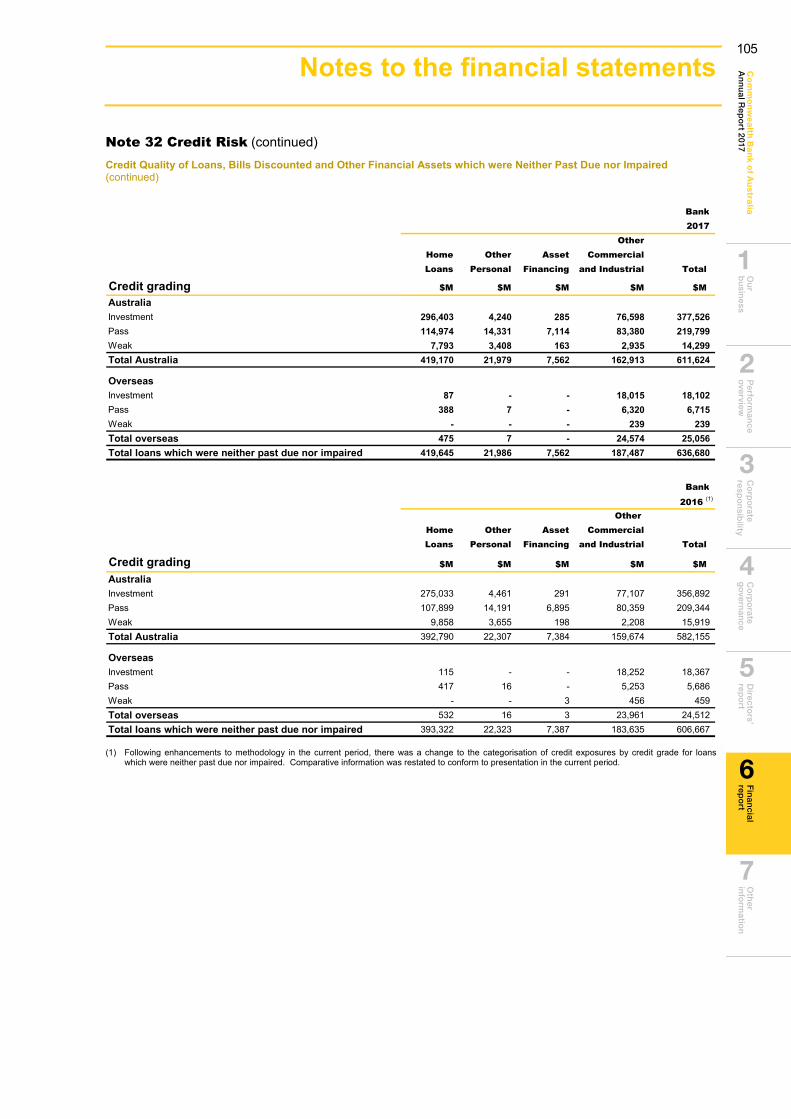
Ou
r b
usin
essP
erform
ance
overview
C
orp
orate
respo
nsib
ility C
orp
orate
go
vernan
ceD
irectors’
repo
rtO
ther
info
rmatio
nC
om
mo
nw
ea
lth Ba
nk o
f Au
stralia
An
nu
al Rep
ort 2017
Fin
ancial
repo
rt
6
2
1
3
4
5
7
159
Note 32 Credit Risk (continued) Credit Quality of Loans, Bills Discounted and Other Financial Assets which were Neither Past Due nor Impaired (continued)
Bank2017
OtherHome Other Asset CommercialLoans Personal Financing and Industrial Total
Credit grading $M $M $M $M $M
AustraliaInvestment 296,403 4,240 285 76,598 377,526Pass 114,974 14,331 7,114 83,380 219,799Weak 7,793 3,408 163 2,935 14,299Total Australia 419,170 21,979 7,562 162,913 611,624
OverseasInvestment 87 - - 18,015 18,102Pass 388 7 - 6,320 6,715Weak - - - 239 239Total overseas 475 7 - 24,574 25,056Total loans which were neither past due nor impaired 419,645 21,986 7,562 187,487 636,680
Bank
2016 (1)
Other Home Other Asset CommercialLoans Personal Financing and Industrial Total
Credit grading $M $M $M $M $M
AustraliaInvestment 275,033 4,461 291 77,107 356,892Pass 107,899 14,191 6,895 80,359 209,344Weak 9,858 3,655 198 2,208 15,919Total Australia 392,790 22,307 7,384 159,674 582,155
OverseasInvestment 115 - - 18,252 18,367Pass 417 16 - 5,253 5,686Weak - - 3 456 459Total overseas 532 16 3 23,961 24,512Total loans which were neither past due nor impaired 393,322 22,323 7,387 183,635 606,667
(1) Following enhancements to methodology in the current period, there was a change to the categorisation of credit exposures by credit grade for loanswhich were neither past due nor impaired. Comparative information was restated to conform to presentation in the current period.
105
Notes to the financial statements
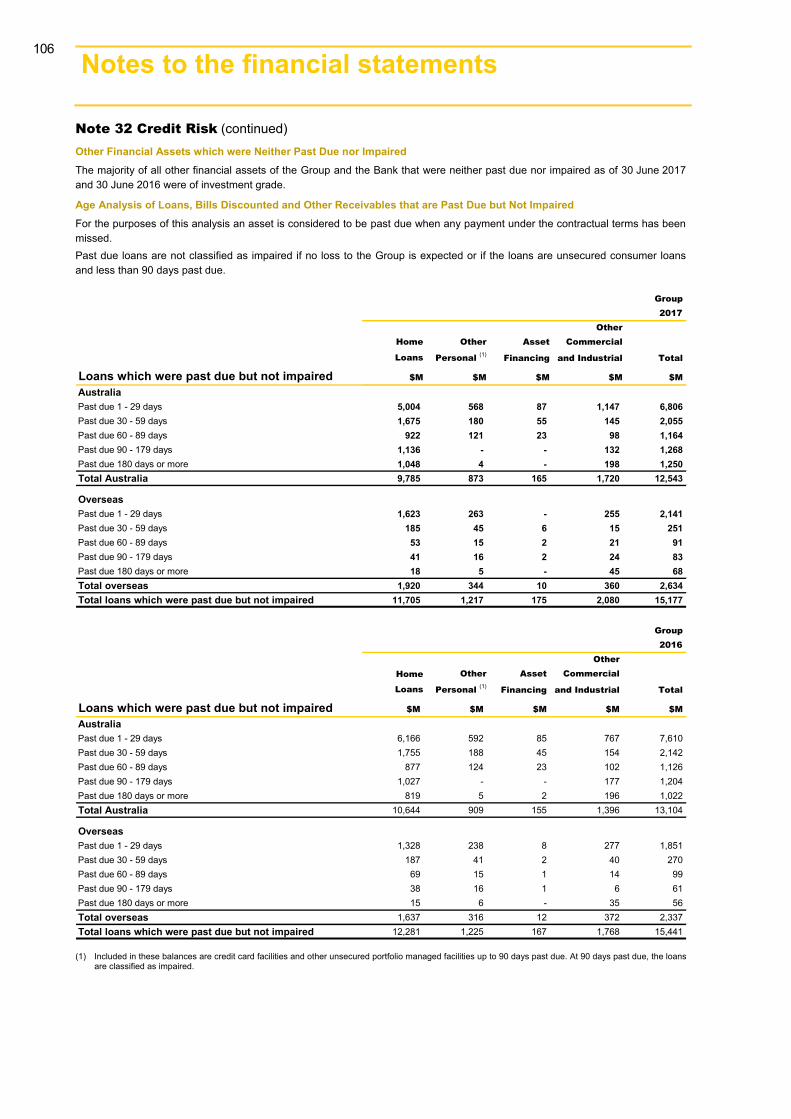
160 Notes to the financial statements 3
Note 32 Credit Risk (continued) Other Financial Assets which were Neither Past Due nor Impaired The majority of all other financial assets of the Group and the Bank that were neither past due nor impaired as of 30 June 2017 and 30 June 2016 were of investment grade.
Age Analysis of Loans, Bills Discounted and Other Receivables that are Past Due but Not Impaired For the purposes of this analysis an asset is considered to be past due when any payment under the contractual terms has been missed. Past due loans are not classified as impaired if no loss to the Group is expected or if the loans are unsecured consumer loans and less than 90 days past due.
Group 2017
OtherHome Other Asset Commercial
Loans Personal (1) Financing and Industrial Total
Loans which were past due but not impaired $M $M $M $M $M
AustraliaPast due 1 - 29 days 5,004 568 87 1,147 6,806Past due 30 - 59 days 1,675 180 55 145 2,055Past due 60 - 89 days 922 121 23 98 1,164Past due 90 - 179 days 1,136 - - 132 1,268Past due 180 days or more 1,048 4 - 198 1,250Total Australia 9,785 873 165 1,720 12,543
OverseasPast due 1 - 29 days 1,623 263 - 255 2,141Past due 30 - 59 days 185 45 6 15 251Past due 60 - 89 days 53 15 2 21 91Past due 90 - 179 days 41 16 2 24 83Past due 180 days or more 18 5 - 45 68Total overseas 1,920 344 10 360 2,634Total loans which were past due but not impaired 11,705 1,217 175 2,080 15,177
Group 2016
Other Home Other Asset Commercial
Loans Personal (1) Financing and Industrial Total
Loans which were past due but not impaired $M $M $M $M $M
AustraliaPast due 1 - 29 days 6,166 592 85 767 7,610Past due 30 - 59 days 1,755 188 45 154 2,142Past due 60 - 89 days 877 124 23 102 1,126Past due 90 - 179 days 1,027 - - 177 1,204Past due 180 days or more 819 5 2 196 1,022Total Australia 10,644 909 155 1,396 13,104
OverseasPast due 1 - 29 days 1,328 238 8 277 1,851Past due 30 - 59 days 187 41 2 40 270Past due 60 - 89 days 69 15 1 14 99Past due 90 - 179 days 38 16 1 6 61Past due 180 days or more 15 6 - 35 56Total overseas 1,637 316 12 372 2,337Total loans which were past due but not impaired 12,281 1,225 167 1,768 15,441
(1) Included in these balances are credit card facilities and other unsecured portfolio managed facilities up to 90 days past due. At 90 days past due, the loans are classified as impaired.
106
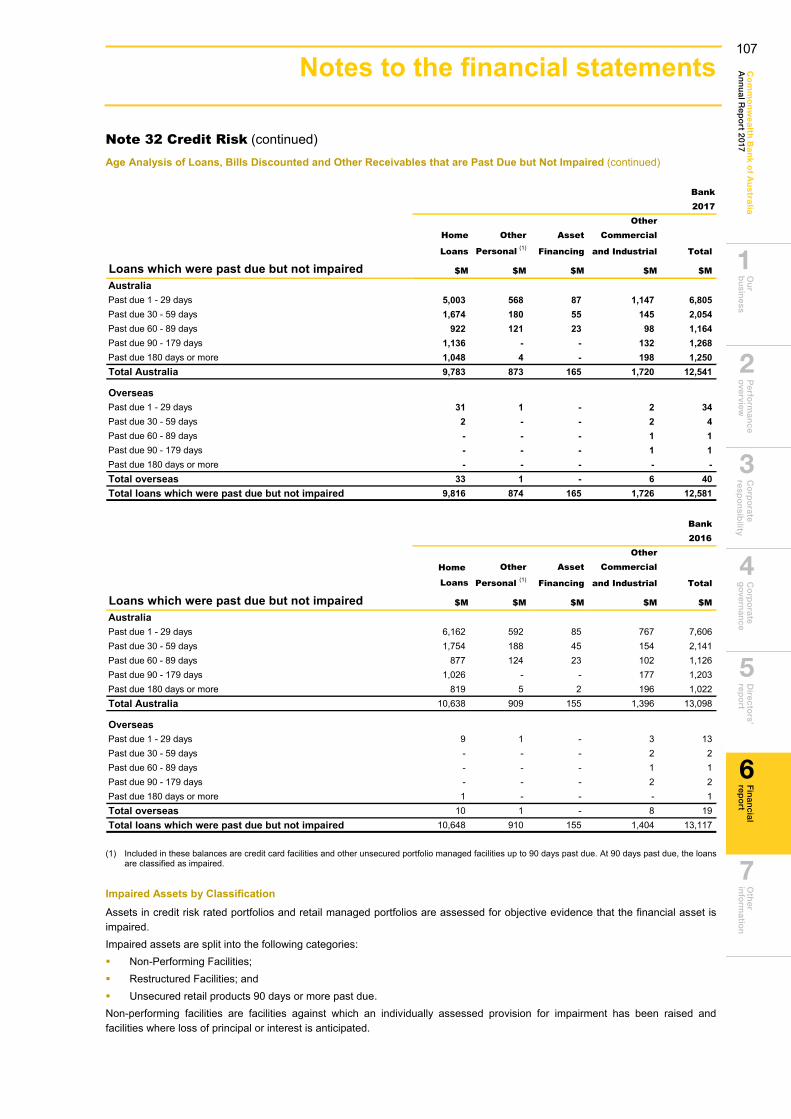
Ou
r b
usin
essP
erform
ance
overview
C
orp
orate
respo
nsib
ility C
orp
orate
go
vernan
ceD
irectors’
repo
rtO
ther
info
rmatio
nC
om
mo
nw
ea
lth Ba
nk o
f Au
stralia
An
nu
al Rep
ort 2017
Fin
ancial
repo
rt
6
2
1
3
4
5
7
161
Note 32 Credit Risk (continued) Age Analysis of Loans, Bills Discounted and Other Receivables that are Past Due but Not Impaired (continued)
Bank2017
OtherHome Other Asset Commercial
Loans Personal (1) Financing and Industrial Total
Loans which were past due but not impaired $M $M $M $M $M
AustraliaPast due 1 - 29 days 5,003 568 87 1,147 6,805Past due 30 - 59 days 1,674 180 55 145 2,054Past due 60 - 89 days 922 121 23 98 1,164Past due 90 - 179 days 1,136 - - 132 1,268Past due 180 days or more 1,048 4 - 198 1,250Total Australia 9,783 873 165 1,720 12,541
OverseasPast due 1 - 29 days 31 1 - 2 34Past due 30 - 59 days 2 - - 2 4Past due 60 - 89 days - - - 1 1Past due 90 - 179 days - - - 1 1Past due 180 days or more - - - - -Total overseas 33 1 - 6 40Total loans which were past due but not impaired 9,816 874 165 1,726 12,581
Bank 2016
OtherHome Other Asset Commercial
Loans Personal (1) Financing and Industrial Total
Loans which were past due but not impaired $M $M $M $M $M
AustraliaPast due 1 - 29 days 6,162 592 85 767 7,606Past due 30 - 59 days 1,754 188 45 154 2,141Past due 60 - 89 days 877 124 23 102 1,126Past due 90 - 179 days 1,026 - - 177 1,203Past due 180 days or more 819 5 2 196 1,022Total Australia 10,638 909 155 1,396 13,098
OverseasPast due 1 - 29 days 9 1 - 3 13Past due 30 - 59 days - - - 2 2Past due 60 - 89 days - - - 1 1Past due 90 - 179 days - - - 2 2Past due 180 days or more 1 - - - 1Total overseas 10 1 - 8 19Total loans which were past due but not impaired 10,648 910 155 1,404 13,117
(1) Included in these balances are credit card facilities and other unsecured portfolio managed facilities up to 90 days past due. At 90 days past due, the loans are classified as impaired.
Impaired Assets by Classification Assets in credit risk rated portfolios and retail managed portfolios are assessed for objective evidence that the financial asset is impaired. Impaired assets are split into the following categories: Non-Performing Facilities; Restructured Facilities; and Unsecured retail products 90 days or more past due.Non-performing facilities are facilities against which an individually assessed provision for impairment has been raised and facilities where loss of principal or interest is anticipated.
107
Notes to the financial statements
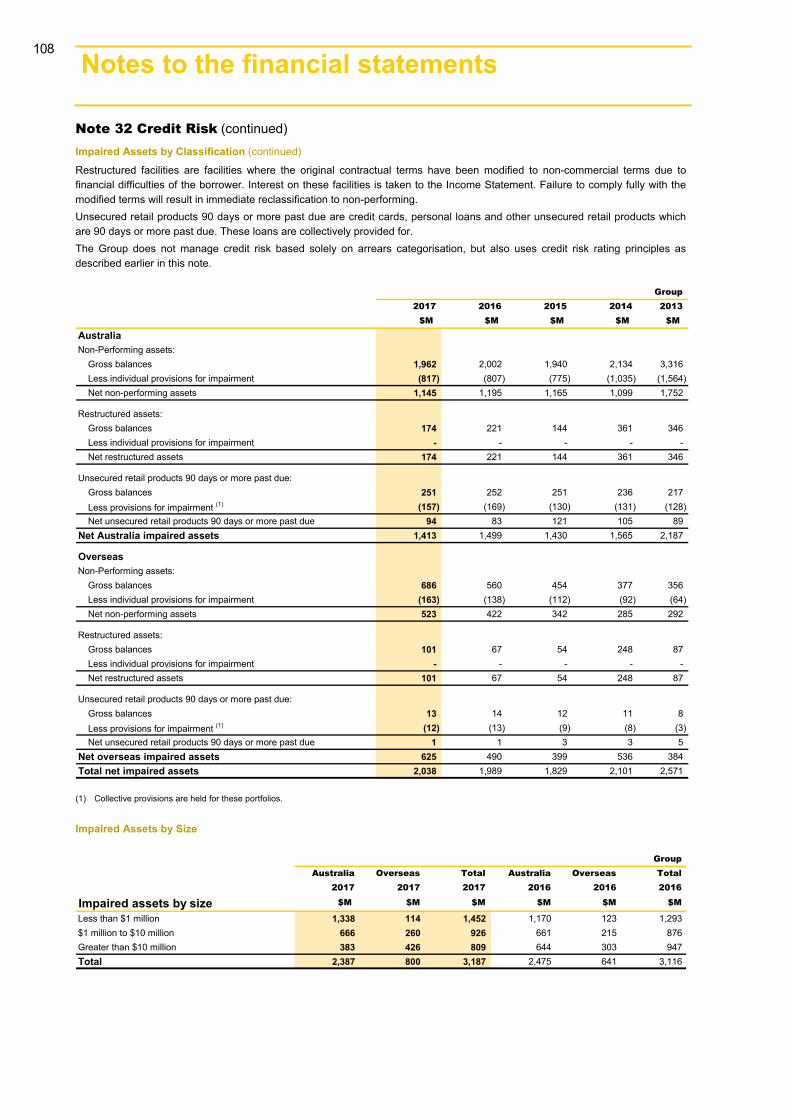
162 Notes to the financial statements 3
Note 32 Credit Risk (continued) Impaired Assets by Classification (continued)
Restructured facilities are facilities where the original contractual terms have been modified to non-commercial terms due to financial difficulties of the borrower. Interest on these facilities is taken to the Income Statement. Failure to comply fully with the modified terms will result in immediate reclassification to non-performing. Unsecured retail products 90 days or more past due are credit cards, personal loans and other unsecured retail products which are 90 days or more past due. These loans are collectively provided for. The Group does not manage credit risk based solely on arrears categorisation, but also uses credit risk rating principles as described earlier in this note.
Group2017 2016 2015 2014 2013
$M $M $M $M $M
AustraliaNon-Performing assets:
Gross balances 1,962 2,002 1,940 2,134 3,316Less individual provisions for impairment (817) (807) (775) (1,035) (1,564)Net non-performing assets 1,145 1,195 1,165 1,099 1,752
Restructured assets:Gross balances 174 221 144 361 346Less individual provisions for impairment - - - - -Net restructured assets 174 221 144 361 346
Unsecured retail products 90 days or more past due:Gross balances 251 252 251 236 217Less provisions for impairment (1) (157) (169) (130) (131) (128)Net unsecured retail products 90 days or more past due 94 83 121 105 89
Net Australia impaired assets 1,413 1,499 1,430 1,565 2,187
OverseasNon-Performing assets:
Gross balances 686 560 454 377 356Less individual provisions for impairment (163) (138) (112) (92) (64)Net non-performing assets 523 422 342 285 292
Restructured assets:Gross balances 101 67 54 248 87Less individual provisions for impairment - - - - -Net restructured assets 101 67 54 248 87
Unsecured retail products 90 days or more past due:Gross balances 13 14 12 11 8Less provisions for impairment (1) (12) (13) (9) (8) (3)Net unsecured retail products 90 days or more past due 1 1 3 3 5
Net overseas impaired assets 625 490 399 536 384Total net impaired assets 2,038 1,989 1,829 2,101 2,571
(1) Collective provisions are held for these portfolios.
Impaired Assets by Size
GroupAustralia Overseas Total Australia Overseas Total
2017 2017 2017 2016 2016 2016
Impaired assets by size $M $M $M $M $M $M
Less than $1 million 1,338 114 1,452 1,170 123 1,293$1 million to $10 million 666 260 926 661 215 876Greater than $10 million 383 426 809 644 303 947Total 2,387 800 3,187 2,475 641 3,116
108
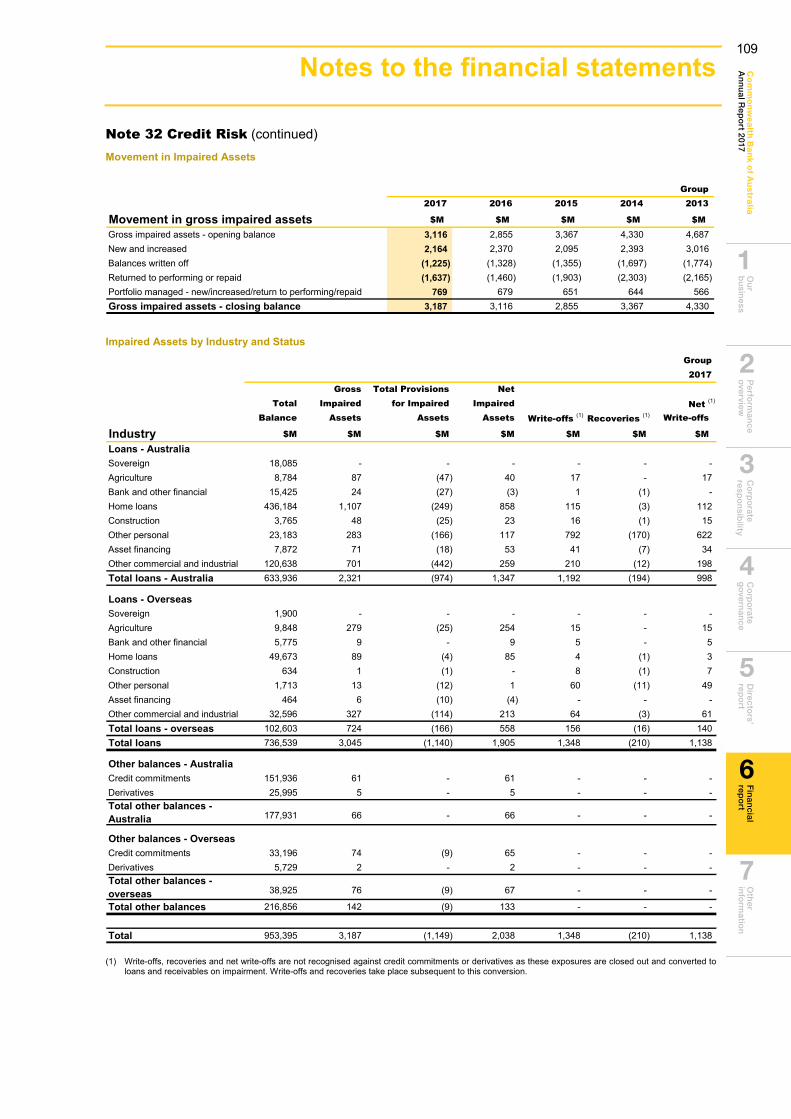
Ou
r b
usin
essP
erform
ance
overview
C
orp
orate
respo
nsib
ility C
orp
orate
go
vernan
ceD
irectors’
repo
rtO
ther
info
rmatio
nC
om
mo
nw
ea
lth Ba
nk o
f Au
stralia
An
nu
al Rep
ort 2017
Fin
ancial
repo
rt
6
2
1
3
4
5
7
163
Note 32 Credit Risk (continued) Movement in Impaired Assets
Group2017 2016 2015 2014 2013
Movement in gross impaired assets $M $M $M $M $M
Gross impaired assets - opening balance 3,116 2,855 3,367 4,330 4,687New and increased 2,164 2,370 2,095 2,393 3,016Balances written off (1,225) (1,328) (1,355) (1,697) (1,774)Returned to performing or repaid (1,637) (1,460) (1,903) (2,303) (2,165)Portfolio managed - new/increased/return to performing/repaid 769 679 651 644 566Gross impaired assets - closing balance 3,187 3,116 2,855 3,367 4,330
Impaired Assets by Industry and Status Group2017
Gross Total Provisions NetTotal Impaired for Impaired Impaired Net (1)
Balance Assets Assets Assets Write-offs (1) Recoveries (1) Write-offs
Industry $M $M $M $M $M $M $M
Loans - AustraliaSovereign 18,085 - - - - - -Agriculture 8,784 87 (47) 40 17 - 17Bank and other financial 15,425 24 (27) (3) 1 (1) -Home loans 436,184 1,107 (249) 858 115 (3) 112Construction 3,765 48 (25) 23 16 (1) 15Other personal 23,183 283 (166) 117 792 (170) 622Asset financing 7,872 71 (18) 53 41 (7) 34Other commercial and industrial 120,638 701 (442) 259 210 (12) 198Total loans - Australia 633,936 2,321 (974) 1,347 1,192 (194) 998
Loans - OverseasSovereign 1,900 - - - - - -Agriculture 9,848 279 (25) 254 15 - 15Bank and other financial 5,775 9 - 9 5 - 5Home loans 49,673 89 (4) 85 4 (1) 3Construction 634 1 (1) - 8 (1) 7Other personal 1,713 13 (12) 1 60 (11) 49Asset financing 464 6 (10) (4) - - -Other commercial and industrial 32,596 327 (114) 213 64 (3) 61Total loans - overseas 102,603 724 (166) 558 156 (16) 140Total loans 736,539 3,045 (1,140) 1,905 1,348 (210) 1,138
Other balances - AustraliaCredit commitments 151,936 61 - 61 - - -Derivatives 25,995 5 - 5 - - -Total other balances - Australia 177,931 66 - 66 - - -
Other balances - OverseasCredit commitments 33,196 74 (9) 65 - - -Derivatives 5,729 2 - 2 - - -Total other balances - overseas 38,925 76 (9) 67 - - -
Total other balances 216,856 142 (9) 133 - - -
Total 953,395 3,187 (1,149) 2,038 1,348 (210) 1,138
(1) Write-offs, recoveries and net write-offs are not recognised against credit commitments or derivatives as these exposures are closed out and converted to loans and receivables on impairment. Write-offs and recoveries take place subsequent to this conversion.
109
Notes to the financial statements
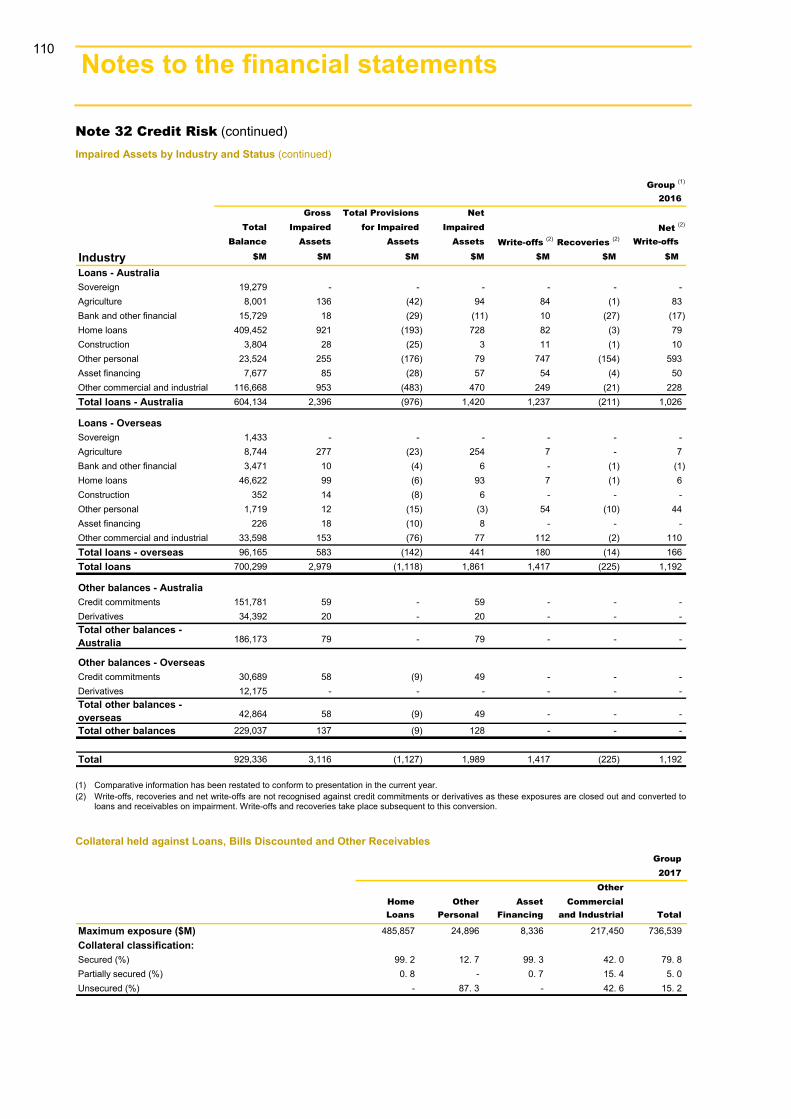
164 Notes to the financial statements 3
Note 32 Credit Risk (continued) Impaired Assets by Industry and Status (continued)
Group (1)
2016Gross Total Provisions Net
Total Impaired for Impaired Impaired Net (2)
Balance Assets Assets Assets Write-offs (2) Recoveries (2) Write-offs
Industry $M $M $M $M $M $M $M
Loans - AustraliaSovereign 19,279 - - - - - -Agriculture 8,001 136 (42) 94 84 (1) 83Bank and other financial 15,729 18 (29) (11) 10 (27) (17)Home loans 409,452 921 (193) 728 82 (3) 79Construction 3,804 28 (25) 3 11 (1) 10Other personal 23,524 255 (176) 79 747 (154) 593Asset financing 7,677 85 (28) 57 54 (4) 50Other commercial and industrial 116,668 953 (483) 470 249 (21) 228Total loans - Australia 604,134 2,396 (976) 1,420 1,237 (211) 1,026
Loans - OverseasSovereign 1,433 - - - - - -Agriculture 8,744 277 (23) 254 7 - 7Bank and other financial 3,471 10 (4) 6 - (1) (1)Home loans 46,622 99 (6) 93 7 (1) 6Construction 352 14 (8) 6 - - -Other personal 1,719 12 (15) (3) 54 (10) 44Asset financing 226 18 (10) 8 - - -Other commercial and industrial 33,598 153 (76) 77 112 (2) 110Total loans - overseas 96,165 583 (142) 441 180 (14) 166Total loans 700,299 2,979 (1,118) 1,861 1,417 (225) 1,192
Other balances - AustraliaCredit commitments 151,781 59 - 59 - - -Derivatives 34,392 20 - 20 - - -Total other balances - Australia 186,173 79 - 79 - - -
Other balances - OverseasCredit commitments 30,689 58 (9) 49 - - -Derivatives 12,175 - - - - - -Total other balances - overseas 42,864 58 (9) 49 - - -
Total other balances 229,037 137 (9) 128 - - -
Total 929,336 3,116 (1,127) 1,989 1,417 (225) 1,192
(1) Comparative information has been restated to conform to presentation in the current year. (2) Write-offs, recoveries and net write-offs are not recognised against credit commitments or derivatives as these exposures are closed out and converted to
loans and receivables on impairment. Write-offs and recoveries take place subsequent to this conversion.
Collateral held against Loans, Bills Discounted and Other Receivables Group2017
OtherHome Other Asset CommercialLoans Personal Financing and Industrial Total
Maximum exposure ($M) 485,857 24,896 8,336 217,450 736,539Collateral classification:Secured (%) 99. 2 12. 7 99. 3 42. 0 79. 8Partially secured (%) 0. 8 - 0. 7 15. 4 5. 0Unsecured (%) - 87. 3 - 42. 6 15. 2
110
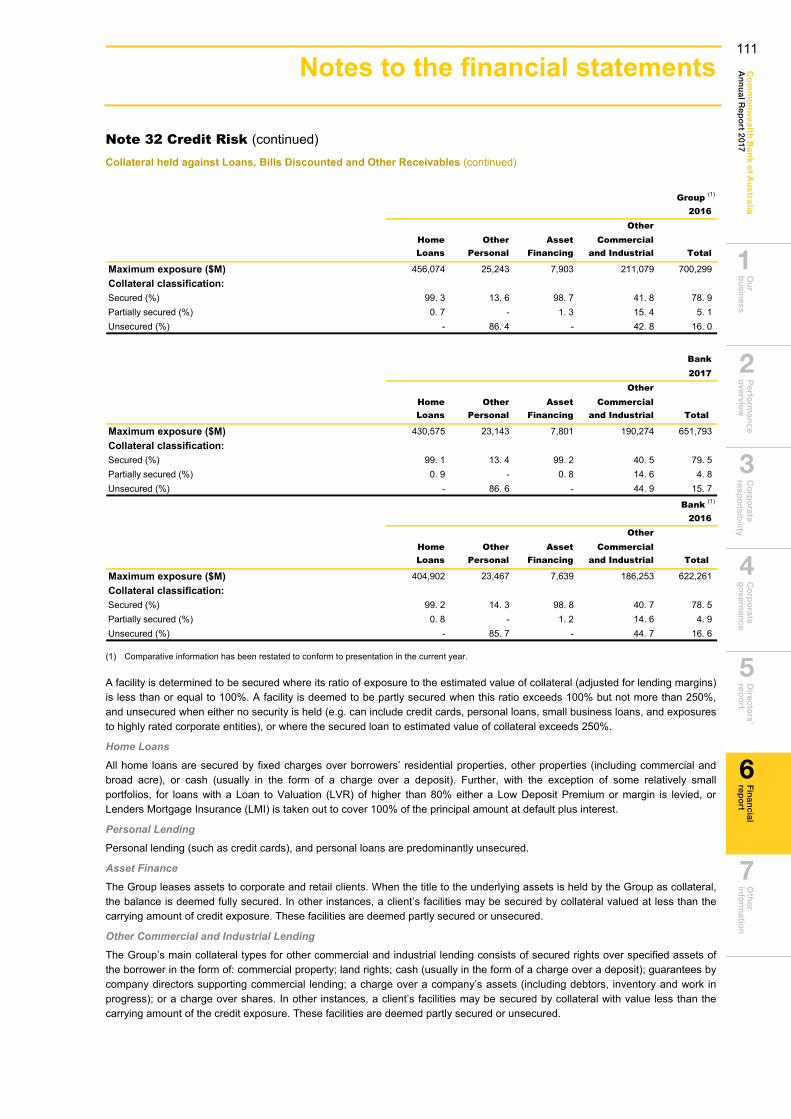
Ou
r b
usin
essP
erform
ance
overview
C
orp
orate
respo
nsib
ility C
orp
orate
go
vernan
ceD
irectors’
repo
rtO
ther
info
rmatio
nC
om
mo
nw
ea
lth Ba
nk o
f Au
stralia
An
nu
al Rep
ort 2017
Fin
ancial
repo
rt
6
2
1
3
4
5
7
165
Note 32 Credit Risk (continued) Collateral held against Loans, Bills Discounted and Other Receivables (continued)
Group (1)
2016Other
Home Other Asset CommercialLoans Personal Financing and Industrial Total
Maximum exposure ($M) 456,074 25,243 7,903 211,079 700,299Collateral classification:Secured (%) 99. 3 13. 6 98. 7 41. 8 78. 9Partially secured (%) 0. 7 - 1. 3 15. 4 5. 1Unsecured (%) - 86. 4 - 42. 8 16. 0
Bank2017
OtherHome Other Asset CommercialLoans Personal Financing and Industrial Total
Maximum exposure ($M) 430,575 23,143 7,801 190,274 651,793Collateral classification:Secured (%) 99. 1 13. 4 99. 2 40. 5 79. 5Partially secured (%) 0. 9 - 0. 8 14. 6 4. 8Unsecured (%) - 86. 6 - 44. 9 15. 7
Bank (1)
2016Other
Home Other Asset CommercialLoans Personal Financing and Industrial Total
Maximum exposure ($M) 404,902 23,467 7,639 186,253 622,261Collateral classification:Secured (%) 99. 2 14. 3 98. 8 40. 7 78. 5Partially secured (%) 0. 8 - 1. 2 14. 6 4. 9Unsecured (%) - 85. 7 - 44. 7 16. 6
(1) Comparative information has been restated to conform to presentation in the current year.
A facility is determined to be secured where its ratio of exposure to the estimated value of collateral (adjusted for lending margins) is less than or equal to 100%. A facility is deemed to be partly secured when this ratio exceeds 100% but not more than 250%, and unsecured when either no security is held (e.g. can include credit cards, personal loans, small business loans, and exposures to highly rated corporate entities), or where the secured loan to estimated value of collateral exceeds 250%.
Home Loans
All home loans are secured by fixed charges over borrowers’ residential properties, other properties (including commercial and broad acre), or cash (usually in the form of a charge over a deposit). Further, with the exception of some relatively small portfolios, for loans with a Loan to Valuation (LVR) of higher than 80% either a Low Deposit Premium or margin is levied, or Lenders Mortgage Insurance (LMI) is taken out to cover 100% of the principal amount at default plus interest.
Personal Lending
Personal lending (such as credit cards), and personal loans are predominantly unsecured.
Asset Finance
The Group leases assets to corporate and retail clients. When the title to the underlying assets is held by the Group as collateral, the balance is deemed fully secured. In other instances, a client’s facilities may be secured by collateral valued at less than the carrying amount of credit exposure. These facilities are deemed partly secured or unsecured.
Other Commercial and Industrial Lending
The Group’s main collateral types for other commercial and industrial lending consists of secured rights over specified assets of the borrower in the form of: commercial property; land rights; cash (usually in the form of a charge over a deposit); guarantees by company directors supporting commercial lending; a charge over a company’s assets (including debtors, inventory and work in progress); or a charge over shares. In other instances, a client’s facilities may be secured by collateral with value less than the carrying amount of the credit exposure. These facilities are deemed partly secured or unsecured.
111
Notes to the financial statements
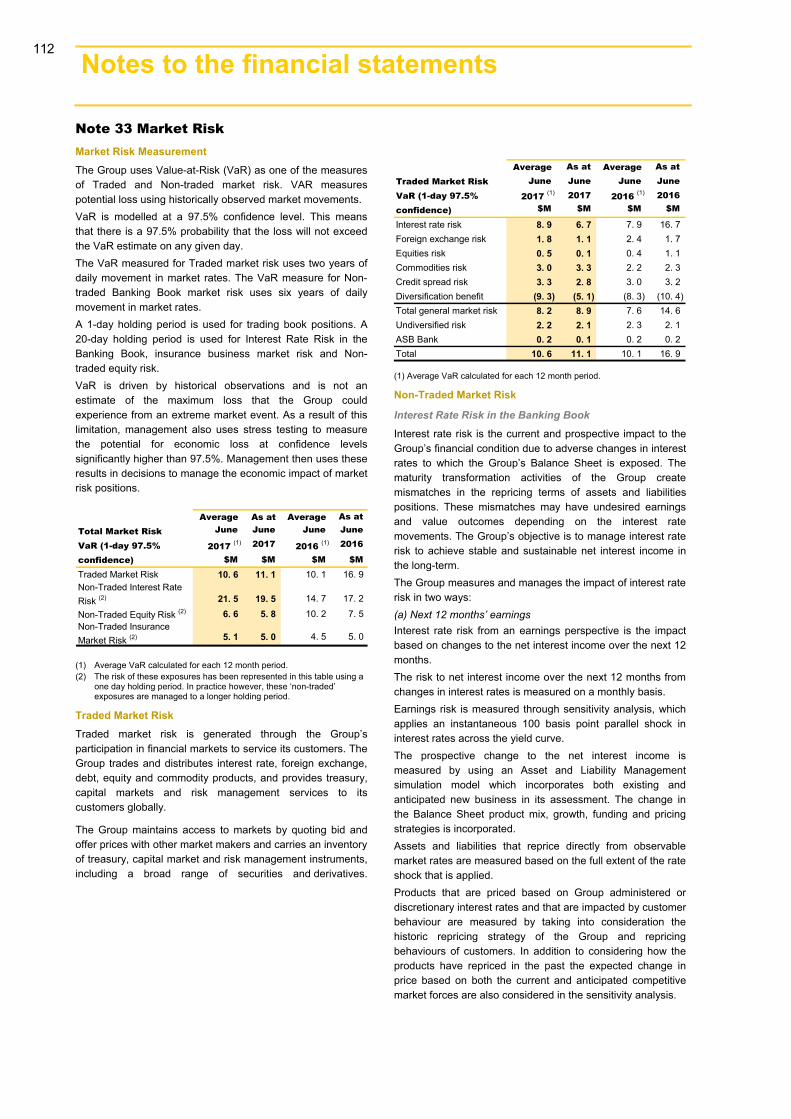
166 Notes to the financial statements 3
Note 33 Market Risk Market Risk Measurement The Group uses Value-at-Risk (VaR) as one of the measures of Traded and Non-traded market risk. VAR measures potential loss using historically observed market movements. VaR is modelled at a 97.5% confidence level. This means that there is a 97.5% probability that the loss will not exceed the VaR estimate on any given day. The VaR measured for Traded market risk uses two years of daily movement in market rates. The VaR measure for Non-traded Banking Book market risk uses six years of daily movement in market rates. A 1-day holding period is used for trading book positions. A 20-day holding period is used for Interest Rate Risk in theBanking Book, insurance business market risk and Non-traded equity risk.VaR is driven by historical observations and is not an estimate of the maximum loss that the Group could experience from an extreme market event. As a result of this limitation, management also uses stress testing to measure the potential for economic loss at confidence levels significantly higher than 97.5%. Management then uses these results in decisions to manage the economic impact of market risk positions.
Average As at Average As atTotal Market Risk June June June June
VaR (1-day 97.5% 2017 (1) 2017 2016 (1) 2016
confidence) $M $M $M $M
Traded Market Risk 10. 6 11. 1 10. 1 16. 9Non-Traded Interest Rate Risk (2) 21. 5 19. 5 14. 7 17. 2
Non-Traded Equity Risk (2) 6. 6 5. 8 10. 2 7. 5Non-Traded Insurance Market Risk (2) 5. 1 5. 0 4. 5 5. 0
(1) Average VaR calculated for each 12 month period.(2) The risk of these exposures has been represented in this table using a
one day holding period. In practice however, these ‘non-traded’ exposures are managed to a longer holding period.
Traded Market Risk Traded market risk is generated through the Group’s participation in financial markets to service its customers. The Group trades and distributes interest rate, foreign exchange, debt, equity and commodity products, and provides treasury, capital markets and risk management services to its customers globally.
The Group maintains access to markets by quoting bid and offer prices with other market makers and carries an inventory of treasury, capital market and risk management instruments, including a broad range of securities and derivatives.
(1) Average VaR calculated for each 12 month period.
Non-Traded Market Risk
Interest Rate Risk in the Banking Book
Interest rate risk is the current and prospective impact to the Group’s financial condition due to adverse changes in interest rates to which the Group’s Balance Sheet is exposed. The maturity transformation activities of the Group create mismatches in the repricing terms of assets and liabilities positions. These mismatches may have undesired earnings and value outcomes depending on the interest rate movements. The Group’s objective is to manage interest rate risk to achieve stable and sustainable net interest income in the long-term. The Group measures and manages the impact of interest rate risk in two ways: (a) Next 12 months’ earningsInterest rate risk from an earnings perspective is the impactbased on changes to the net interest income over the next 12months.The risk to net interest income over the next 12 months from changes in interest rates is measured on a monthly basis. Earnings risk is measured through sensitivity analysis, which applies an instantaneous 100 basis point parallel shock in interest rates across the yield curve. The prospective change to the net interest income is measured by using an Asset and Liability Management simulation model which incorporates both existing and anticipated new business in its assessment. The change in the Balance Sheet product mix, growth, funding and pricing strategies is incorporated. Assets and liabilities that reprice directly from observable market rates are measured based on the full extent of the rate shock that is applied. Products that are priced based on Group administered or discretionary interest rates and that are impacted by customer behaviour are measured by taking into consideration the historic repricing strategy of the Group and repricing behaviours of customers. In addition to considering how the products have repriced in the past the expected change in price based on both the current and anticipated competitive market forces are also considered in the sensitivity analysis.
Average As at Average As atTraded Market Risk June June June JuneVaR (1-day 97.5% 2017 (1) 2017 2016 (1) 2016confidence) $M $M $M $M
Interest rate risk 8. 9 6. 7 7. 9 16. 7Foreign exchange risk 1. 8 1. 1 2. 4 1. 7Equities risk 0. 5 0. 1 0. 4 1. 1Commodities risk 3. 0 3. 3 2. 2 2. 3Credit spread risk 3. 3 2. 8 3. 0 3. 2Diversification benefit (9. 3) (5. 1) (8. 3) (10. 4)Total general market risk 8. 2 8. 9 7. 6 14. 6Undiversified risk 2. 2 2. 1 2. 3 2. 1ASB Bank 0. 2 0. 1 0. 2 0. 2Total 10. 6 11. 1 10. 1 16. 9
112
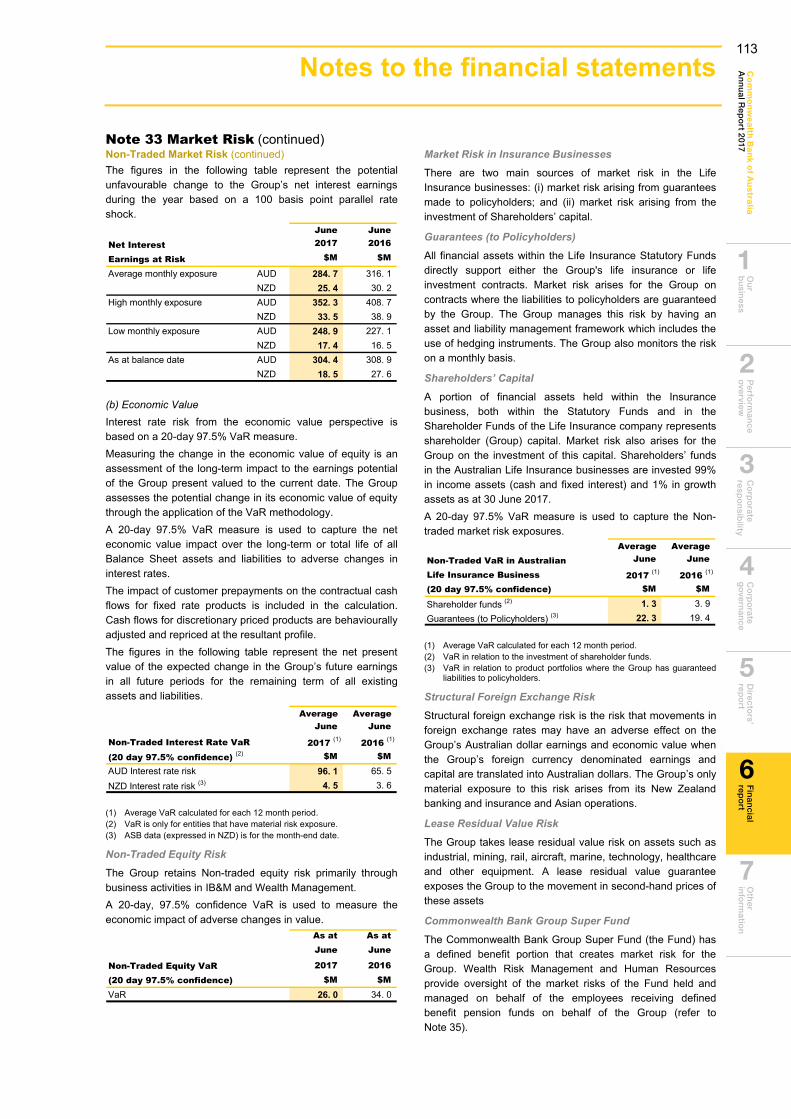
Ou
r b
usin
essP
erform
ance
overview
C
orp
orate
respo
nsib
ility C
orp
orate
go
vernan
ceD
irectors’
repo
rtO
ther
info
rmatio
nC
om
mo
nw
ea
lth Ba
nk o
f Au
stralia
An
nu
al Rep
ort 2017
Fin
ancial
repo
rt
6
2
1
3
4
5
7
167
Note 33 Market Risk (continued) Non-Traded Market Risk (continued) The figures in the following table represent the potential unfavourable change to the Group’s net interest earnings during the year based on a 100 basis point parallel rate shock.
June JuneNet Interest 2017 2016
Earnings at Risk $M $M
Average monthly exposure AUD 284. 7 316. 1NZD 25. 4 30. 2
High monthly exposure AUD 352. 3 408. 7NZD 33. 5 38. 9
Low monthly exposure AUD 248. 9 227. 1NZD 17. 4 16. 5
As at balance date AUD 304. 4 308. 9NZD 18. 5 27. 6
(b) Economic ValueInterest rate risk from the economic value perspective is based on a 20-day 97.5% VaR measure. Measuring the change in the economic value of equity is an assessment of the long-term impact to the earnings potential of the Group present valued to the current date. The Group assesses the potential change in its economic value of equity through the application of the VaR methodology. A 20-day 97.5% VaR measure is used to capture the net economic value impact over the long-term or total life of all Balance Sheet assets and liabilities to adverse changes in interest rates. The impact of customer prepayments on the contractual cash flows for fixed rate products is included in the calculation. Cash flows for discretionary priced products are behaviourally adjusted and repriced at the resultant profile. The figures in the following table represent the net present value of the expected change in the Group’s future earnings in all future periods for the remaining term of all existing assets and liabilities.
Average Average June June
Non-Traded Interest Rate VaR 2017 (1) 2016 (1)
(20 day 97.5% confidence) (2) $M $M
AUD Interest rate risk 96. 1 65. 5NZD Interest rate risk (3) 4. 5 3. 6
(1) Average VaR calculated for each 12 month period.(2) VaR is only for entities that have material risk exposure.(3) ASB data (expressed in NZD) is for the month-end date.
Non-Traded Equity Risk
The Group retains Non-traded equity risk primarily through business activities in IB&M and Wealth Management. A 20-day, 97.5% confidence VaR is used to measure the economic impact of adverse changes in value.
As at As atJune June
Non-Traded Equity VaR 2017 2016(20 day 97.5% confidence) $M $M
VaR 26. 0 34. 0
Market Risk in Insurance Businesses
There are two main sources of market risk in the Life Insurance businesses: (i) market risk arising from guarantees made to policyholders; and (ii) market risk arising from the investment of Shareholders’ capital.
Guarantees (to Policyholders)
All financial assets within the Life Insurance Statutory Funds directly support either the Group's life insurance or life investment contracts. Market risk arises for the Group on contracts where the liabilities to policyholders are guaranteed by the Group. The Group manages this risk by having an asset and liability management framework which includes the use of hedging instruments. The Group also monitors the risk on a monthly basis.
Shareholders’ Capital
A portion of financial assets held within the Insurance business, both within the Statutory Funds and in the Shareholder Funds of the Life Insurance company represents shareholder (Group) capital. Market risk also arises for the Group on the investment of this capital. Shareholders’ funds in the Australian Life Insurance businesses are invested 99% in income assets (cash and fixed interest) and 1% in growth assets as at 30 June 2017. A 20-day 97.5% VaR measure is used to capture the Non-traded market risk exposures.
Average Average Non-Traded VaR in Australian June June
Life Insurance Business 2017 (1) 2016 (1)
(20 day 97.5% confidence) $M $M
Shareholder funds (2) 1. 3 3. 9Guarantees (to Policyholders) (3) 22. 3 19. 4
(1) Average VaR calculated for each 12 month period.(2) VaR in relation to the investment of shareholder funds.(3) VaR in relation to product portfolios where the Group has guaranteed
liabilities to policyholders.
Structural Foreign Exchange Risk
Structural foreign exchange risk is the risk that movements in foreign exchange rates may have an adverse effect on the Group’s Australian dollar earnings and economic value when the Group’s foreign currency denominated earnings and capital are translated into Australian dollars. The Group’s only material exposure to this risk arises from its New Zealand banking and insurance and Asian operations.
Lease Residual Value Risk
The Group takes lease residual value risk on assets such as industrial, mining, rail, aircraft, marine, technology, healthcare and other equipment. A lease residual value guarantee exposes the Group to the movement in second-hand prices of these assets
Commonwealth Bank Group Super Fund
The Commonwealth Bank Group Super Fund (the Fund) has a defined benefit portion that creates market risk for the Group. Wealth Risk Management and Human Resources provide oversight of the market risks of the Fund held and managed on behalf of the employees receiving defined benefit pension funds on behalf of the Group (refer to Note 35).
113
Notes to the financial statements
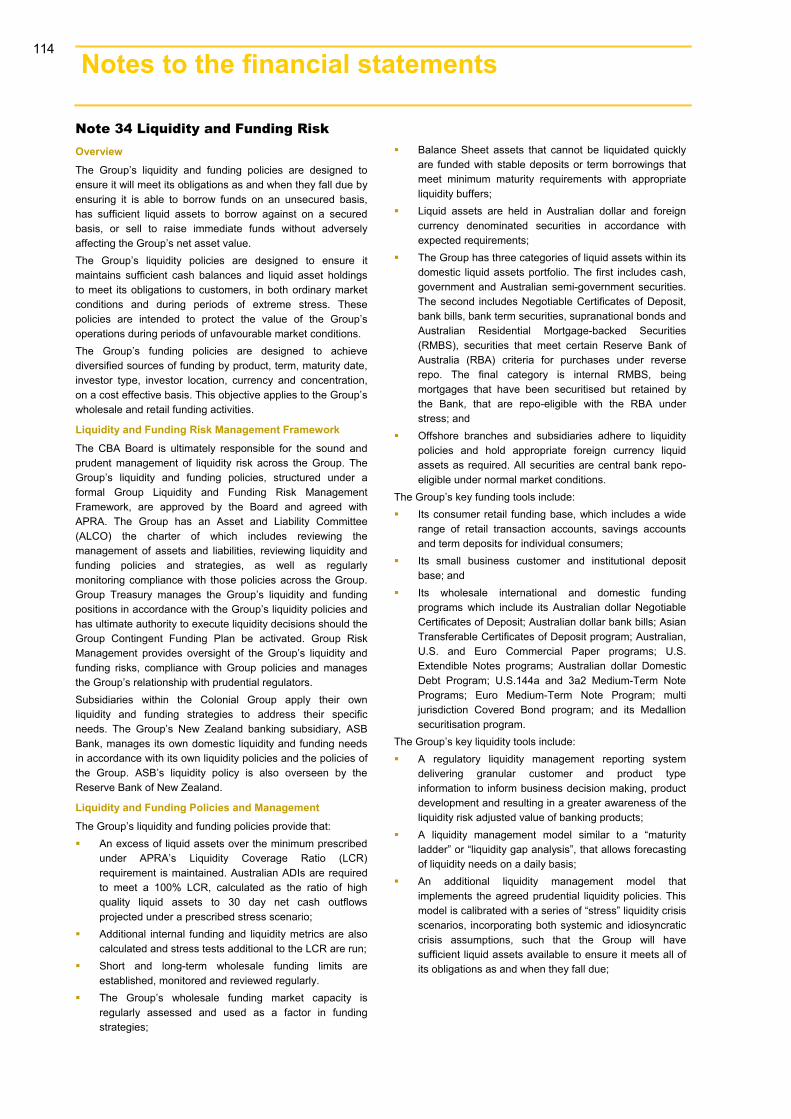
168 Notes to the financial statements 3
Note 34 Liquidity and Funding RiskOverview The Group’s liquidity and funding policies are designed to ensure it will meet its obligations as and when they fall due by ensuring it is able to borrow funds on an unsecured basis, has sufficient liquid assets to borrow against on a secured basis, or sell to raise immediate funds without adversely affecting the Group’s net asset value. The Group’s liquidity policies are designed to ensure it maintains sufficient cash balances and liquid asset holdings to meet its obligations to customers, in both ordinary market conditions and during periods of extreme stress. These policies are intended to protect the value of the Group’s operations during periods of unfavourable market conditions. The Group’s funding policies are designed to achieve diversified sources of funding by product, term, maturity date, investor type, investor location, currency and concentration, on a cost effective basis. This objective applies to the Group’s wholesale and retail funding activities.
Liquidity and Funding Risk Management Framework The CBA Board is ultimately responsible for the sound and prudent management of liquidity risk across the Group. The Group’s liquidity and funding policies, structured under a formal Group Liquidity and Funding Risk Management Framework, are approved by the Board and agreed with APRA. The Group has an Asset and Liability Committee (ALCO) the charter of which includes reviewing the management of assets and liabilities, reviewing liquidity and funding policies and strategies, as well as regularly monitoring compliance with those policies across the Group. Group Treasury manages the Group’s liquidity and funding positions in accordance with the Group’s liquidity policies and has ultimate authority to execute liquidity decisions should the Group Contingent Funding Plan be activated. Group Risk Management provides oversight of the Group’s liquidity and funding risks, compliance with Group policies and manages the Group’s relationship with prudential regulators. Subsidiaries within the Colonial Group apply their own liquidity and funding strategies to address their specific needs. The Group’s New Zealand banking subsidiary, ASB Bank, manages its own domestic liquidity and funding needs in accordance with its own liquidity policies and the policies of the Group. ASB’s liquidity policy is also overseen by the Reserve Bank of New Zealand.
Liquidity and Funding Policies and Management The Group’s liquidity and funding policies provide that: An excess of liquid assets over the minimum prescribed
under APRA’s Liquidity Coverage Ratio (LCR)requirement is maintained. Australian ADIs are requiredto meet a 100% LCR, calculated as the ratio of highquality liquid assets to 30 day net cash outflowsprojected under a prescribed stress scenario;
Additional internal funding and liquidity metrics are alsocalculated and stress tests additional to the LCR are run;
Short and long-term wholesale funding limits areestablished, monitored and reviewed regularly.
The Group’s wholesale funding market capacity isregularly assessed and used as a factor in fundingstrategies;
Balance Sheet assets that cannot be liquidated quicklyare funded with stable deposits or term borrowings thatmeet minimum maturity requirements with appropriateliquidity buffers;
Liquid assets are held in Australian dollar and foreigncurrency denominated securities in accordance withexpected requirements;
The Group has three categories of liquid assets within itsdomestic liquid assets portfolio. The first includes cash,government and Australian semi-government securities.The second includes Negotiable Certificates of Deposit,bank bills, bank term securities, supranational bonds andAustralian Residential Mortgage-backed Securities(RMBS), securities that meet certain Reserve Bank ofAustralia (RBA) criteria for purchases under reverserepo. The final category is internal RMBS, beingmortgages that have been securitised but retained bythe Bank, that are repo-eligible with the RBA understress; and
Offshore branches and subsidiaries adhere to liquiditypolicies and hold appropriate foreign currency liquidassets as required. All securities are central bank repo-eligible under normal market conditions.
The Group’s key funding tools include: Its consumer retail funding base, which includes a wide
range of retail transaction accounts, savings accountsand term deposits for individual consumers;
Its small business customer and institutional depositbase; and
Its wholesale international and domestic fundingprograms which include its Australian dollar NegotiableCertificates of Deposit; Australian dollar bank bills; AsianTransferable Certificates of Deposit program; Australian,U.S. and Euro Commercial Paper programs; U.S.Extendible Notes programs; Australian dollar DomesticDebt Program; U.S.144a and 3a2 Medium-Term NotePrograms; Euro Medium-Term Note Program; multijurisdiction Covered Bond program; and its Medallionsecuritisation program.
The Group’s key liquidity tools include: A regulatory liquidity management reporting system
delivering granular customer and product typeinformation to inform business decision making, productdevelopment and resulting in a greater awareness of theliquidity risk adjusted value of banking products;
A liquidity management model similar to a “maturityladder” or “liquidity gap analysis”, that allows forecastingof liquidity needs on a daily basis;
An additional liquidity management model thatimplements the agreed prudential liquidity policies. Thismodel is calibrated with a series of “stress” liquidity crisisscenarios, incorporating both systemic and idiosyncraticcrisis assumptions, such that the Group will havesufficient liquid assets available to ensure it meets all ofits obligations as and when they fall due;
114

Ou
r b
usin
essP
erform
ance
overview
C
orp
orate
respo
nsib
ility C
orp
orate
go
vernan
ceD
irectors’
repo
rtO
ther
info
rmatio
nC
om
mo
nw
ea
lth Ba
nk o
f Au
stralia
An
nu
al Rep
ort 2017
Fin
ancial
repo
rt
6
2
1
3
4
5
7
169
Note 34 Liquidity and Funding Risk (continued)Liquidity and Funding Policies and Management (continued)
Central bank repurchase agreement facilities includingthe RBA’s open-ended Committed Liquidity Facilitythat provide the Group with the ability to borrow fundson a secured basis, even when normal fundingmarkets are unavailable; and
A robust Contingent Funding Plan that is regularlytested so that it can be activated in case of need dueto a liquidity event.
International wholesale funding conditions were generally positive with credit spreads tracking tighter over the course of the financial year. Geopolitical events such as elections in the US, France and the United Kingdom had a smaller impact on debt markets than some had anticipated. The Group has managed its debt portfolio to avoid concentrations such as dependence on single sources of funding, by type or by investor, and continues to maintain a diversified funding base and significant funding capacity in the domestic and global unsecured and secured debt markets. Details of the Group’s regulatory capital management activities and processes are disclosed in Note 25.
Maturity Analysis of Monetary Liabilities Amounts shown in the tables below are based on contractual undiscounted cash flows for the remaining contractual maturities.
GroupMaturity Period as at 30 June 2017
0 to 3 3 to 12 1 to 5 Over 5 NotMonths Months Years Years Specified Total
$M $M $M $M $M $M
Monetary liabilitiesDeposits and other public borrowings (1) 509,615 98,303 20,132 272 - 628,322Payables due to other financial institutions 24,508 3,964 - - - 28,472Liabilities at fair value through Income Statement 6,188 1,553 1,168 1,682 - 10,591Derivative financial instruments:
Held for trading 21,283 - - - - 21,283Held for hedging purposes (net-settled) 77 204 1,595 1,201 - 3,077Held for hedging purposes (gross-settled):
Outflows 5,724 6,923 65,799 19,905 - 98,351Inflows (5,018) (6,159) (62,248) (18,940) - (92,365)
Bank acceptances 205 258 - - - 463Insurance policy liabilities - - - - 12,018 12,018Debt issues and loan capital 20,894 37,882 100,824 28,713 - 188,313Managed funds units on issue - - - - 2,577 2,577Other monetary liabilities 6,304 1,794 731 323 - 9,152Total monetary liabilities 589,780 144,722 128,001 33,156 14,595 910,254
Guarantees (2) 7,424 - - - - 7,424Loan commitments (2) 173,555 - - - - 173,555Other commitments (2) 4,153 - - - - 4,153Total off Balance Sheet items 185,132 - - - - 185,132Total monetary liabilities and off Balance Sheet items 774,912 144,722 128,001 33,156 14,595 1,095,386
(1) Includes deposits that are contractually at call, customer savings and cheque accounts. Historical experience is that such accounts provide a stable sourceof long-term funding for the Group.
(2) All off Balance Sheet items are included in the 0 to 3 months maturity band to reflect their earliest possible maturity.
115
Notes to the financial statements
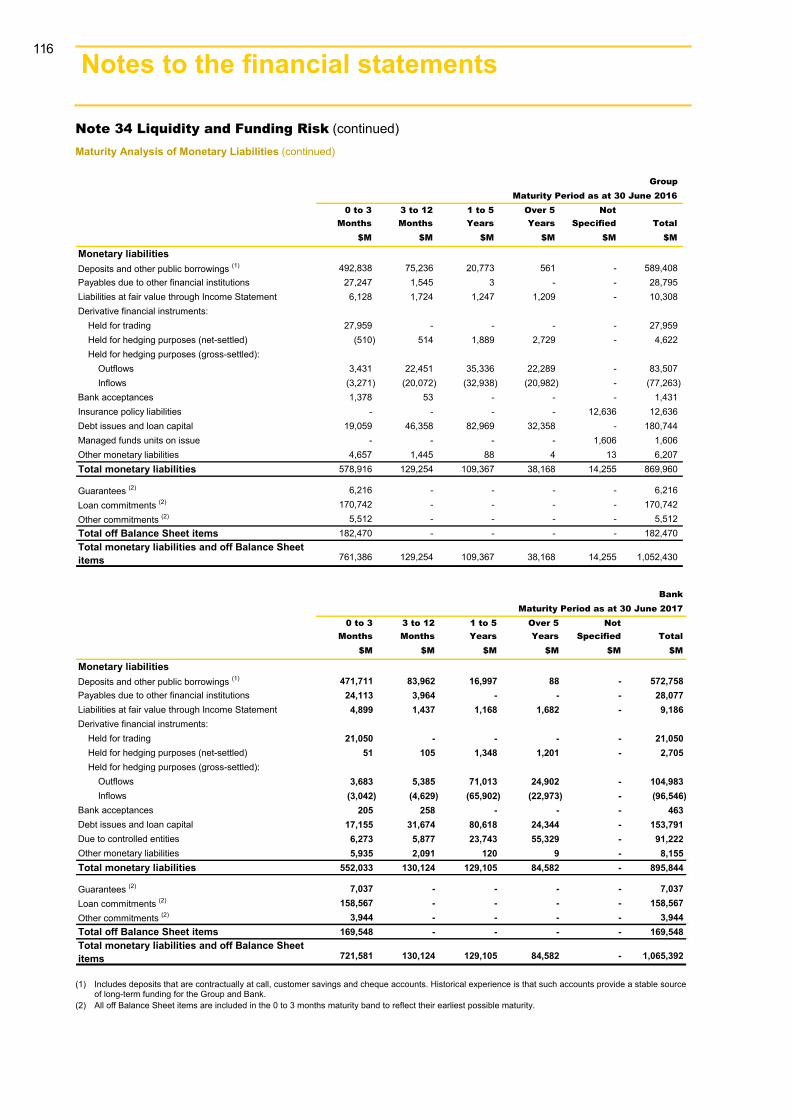
170 Notes to the financial statements 3
Note 34 Liquidity and Funding Risk (continued) Maturity Analysis of Monetary Liabilities (continued)
Group Maturity Period as at 30 June 2016
0 to 3 3 to 12 1 to 5 Over 5 NotMonths Months Years Years Specified Total
$M $M $M $M $M $M
Monetary liabilitiesDeposits and other public borrowings (1) 492,838 75,236 20,773 561 - 589,408Payables due to other financial institutions 27,247 1,545 3 - - 28,795Liabilities at fair value through Income Statement 6,128 1,724 1,247 1,209 - 10,308Derivative financial instruments:
Held for trading 27,959 - - - - 27,959Held for hedging purposes (net-settled) (510) 514 1,889 2,729 - 4,622Held for hedging purposes (gross-settled):
Outflows 3,431 22,451 35,336 22,289 - 83,507Inflows (3,271) (20,072) (32,938) (20,982) - (77,263)
Bank acceptances 1,378 53 - - - 1,431Insurance policy liabilities - - - - 12,636 12,636Debt issues and loan capital 19,059 46,358 82,969 32,358 - 180,744Managed funds units on issue - - - - 1,606 1,606Other monetary liabilities 4,657 1,445 88 4 13 6,207Total monetary liabilities 578,916 129,254 109,367 38,168 14,255 869,960
Guarantees (2) 6,216 - - - - 6,216Loan commitments (2) 170,742 - - - - 170,742Other commitments (2) 5,512 - - - - 5,512Total off Balance Sheet items 182,470 - - - - 182,470Total monetary liabilities and off Balance Sheet items 761,386 129,254 109,367 38,168 14,255 1,052,430
BankMaturity Period as at 30 June 2017
0 to 3 3 to 12 1 to 5 Over 5 NotMonths Months Years Years Specified Total
$M $M $M $M $M $M
Monetary liabilitiesDeposits and other public borrowings (1) 471,711 83,962 16,997 88 - 572,758Payables due to other financial institutions 24,113 3,964 - - - 28,077Liabilities at fair value through Income Statement 4,899 1,437 1,168 1,682 - 9,186Derivative financial instruments:
Held for trading 21,050 - - - - 21,050Held for hedging purposes (net-settled) 51 105 1,348 1,201 - 2,705Held for hedging purposes (gross-settled):
Outflows 3,683 5,385 71,013 24,902 - 104,983Inflows (3,042) (4,629) (65,902) (22,973) - (96,546)
Bank acceptances 205 258 - - - 463Debt issues and loan capital 17,155 31,674 80,618 24,344 - 153,791Due to controlled entities 6,273 5,877 23,743 55,329 - 91,222Other monetary liabilities 5,935 2,091 120 9 - 8,155Total monetary liabilities 552,033 130,124 129,105 84,582 - 895,844
Guarantees (2) 7,037 - - - - 7,037Loan commitments (2) 158,567 - - - - 158,567Other commitments (2) 3,944 - - - - 3,944Total off Balance Sheet items 169,548 - - - - 169,548Total monetary liabilities and off Balance Sheet items 721,581 130,124 129,105 84,582 - 1,065,392
(1) Includes deposits that are contractually at call, customer savings and cheque accounts. Historical experience is that such accounts provide a stable sourceof long-term funding for the Group and Bank.
(2) All off Balance Sheet items are included in the 0 to 3 months maturity band to reflect their earliest possible maturity.
116

Ou
r b
usin
essP
erform
ance
overview
C
orp
orate
respo
nsib
ility C
orp
orate
go
vernan
ceD
irectors’
repo
rtO
ther
info
rmatio
nC
om
mo
nw
ea
lth Ba
nk o
f Au
stralia
An
nu
al Rep
ort 2017
Fin
ancial
repo
rt
6
2
1
3
4
5
7
171
Note 34 Liquidity and Funding Risk (continued) Maturity Analysis of Monetary Liabilities (continued)
BankMaturity Period as at 30 June 2016
0 to 3 3 to 12 1 to 5 Over 5 NotMonths Months Years Years Specified Total
$M $M $M $M $M $M
Monetary liabilitiesDeposits and other public borrowings (1) 456,306 63,101 17,641 180 - 537,228Payables due to other financial institutions 26,804 1,545 3 - - 28,352Liabilities at fair value through Income Statement 3,844 1,151 1,247 1,210 - 7,452Derivative financial instruments:
Held for trading 27,672 - - - - 27,672Held for hedging purposes (net-settled) (604) 327 1,620 2,813 - 4,156Held for hedging purposes (gross-settled):
Outflows 3,143 26,209 40,622 35,132 - 105,106Inflows (2,906) (22,059) (36,762) (31,333) - (93,060)
Bank acceptances 1,359 54 - - - 1,413Debt issues and loan capital 16,495 41,229 65,816 27,965 - 151,505Due to controlled entities 6,681 6,365 24,266 92,735 - 130,047Other monetary liabilities 4,442 4,688 56 2 5 9,193Total monetary liabilities 543,236 122,610 114,509 128,704 5 909,064
Guarantees (2) 5,873 - - - - 5,873Loan commitments (2) 155,446 - - - - 155,446Other commitments (2) 4,868 - - - - 4,868Total off Balance Sheet items 166,187 - - - - 166,187Total monetary liabilities and off Balance Sheet items 709,423 122,610 114,509 128,704 5 1,075,251
(1) Includes deposits that are contractually at call, customer savings and cheque accounts. Historical experience is that such accounts provide a stable sourceof long-term funding for the Bank.
(2) All off Balance Sheet items are included in the 0 to 3 months maturity band to reflect their earliest possible maturity.
Note 35 Retirement Benefit Obligations
Name of Plan Type Form of Benefit Date of Last Actuarial Assessment of the Fund
Commonwealth Bank Group Super
Defined Benefits (1) and Accumulation
Indexed pension and lump sum 30 June 2015
Commonwealth Bank of Australia (UK) Staff Benefits Scheme (CBA (UK) SBS)
Defined Benefits (1) and Accumulation
Indexed pension and lump sum 30 June 2013 (2)
(1) The defined benefit formulae are generally comprised of final salary, or final average salary, and service. (2) The actuarial assessment of the Fund at 30 June 2016 is due to be finalised by September 2017. Demographic assumptions approved for the 30 June
2016 actuarial assessment have been applied in the 30 June 2017 valuation.
Regulatory Framework Both plans operate under trust law with the assets of the plans held separately in trust. The Trustee of Commonwealth Bank Group Super is Commonwealth Bank Officers Superannuation Corporation Pty Limited. The Trustee of CBA (UK) SBS is Commonwealth Bank of Australia (UK) Staff Benefits Scheme Trustee Company Limited. Both Trustees are wholly owned subsidiaries of the Group. The Trustees do not conduct any business other than trusteeship of the plans. The plans are managed and administered on behalf of the members in accordance with the terms of each trust deed and relevant legislation. The funding of the plans complies with regulations in Australia and the UK respectively.
Funding and Contributions An actuarial assessment as at 30 June 2015 showed Commonwealth Bank Group Super remained in funding surplus. The Bank agreed to continue contributions of $20 million per month to the plan. Employer contributions paid to the plan are subject to tax at the rate of 15% in the plan. An actuarial assessment of the CBA (UK) SBS as at 30 June 2013 confirmed a funding deficit of GBP62 million ($105 million). The Bank agreed to continue the deficit recovery contributions of GBP15 million per annum ($25 million) until 31 December 2017 to CBA (UK) SBS in addition to the regular GBP3 million per annum ($5 million) contributions for future defined benefit accruals.
117
Notes to the financial statements
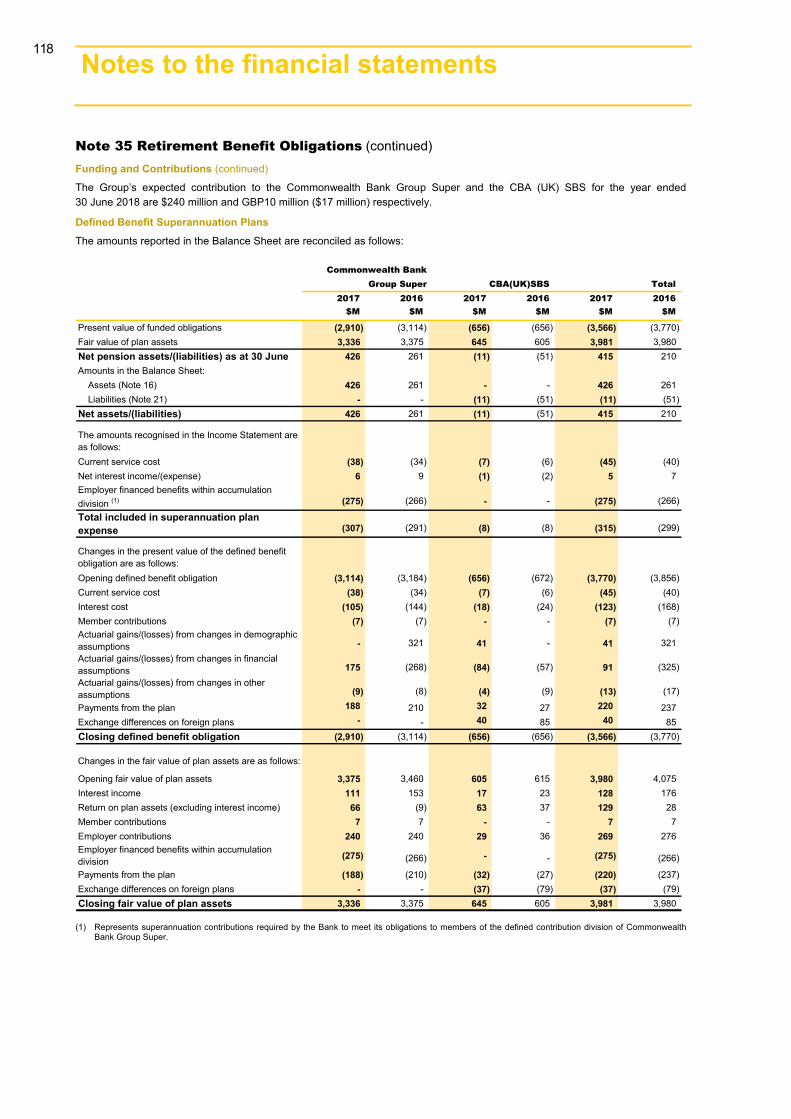
172 Notes to the financial statements 3
Note 35 Retirement Benefit Obligations (continued) Funding and Contributions (continued)
The Group’s expected contribution to the Commonwealth Bank Group Super and the CBA (UK) SBS for the year ended 30 June 2018 are $240 million and GBP10 million ($17 million) respectively.
Defined Benefit Superannuation Plans The amounts reported in the Balance Sheet are reconciled as follows:
CBA(UK)SBS Total2017 2016 2017 2016 2017 2016
$M $M $M $M $M $M
Present value of funded obligations (2,910) (3,114) (656) (656) (3,566) (3,770)Fair value of plan assets 3,336 3,375 645 605 3,981 3,980Net pension assets/(liabilities) as at 30 June 426 261 (11) (51) 415 210Amounts in the Balance Sheet:
Assets (Note 16) 426 261 - - 426 261Liabilities (Note 21) - - (11) (51) (11) (51)
Net assets/(liabilities) 426 261 (11) (51) 415 210
The amounts recognised in the Income Statement are as follows:Current service cost (38) (34) (7) (6) (45) (40)Net interest income/(expense) 6 9 (1) (2) 5 7Employer financed benefits within accumulation division (1) (275) (266) - - (275) (266)
Total included in superannuation plan expense (307) (291) (8) (8) (315) (299)
Changes in the present value of the defined benefit obligation are as follows:Opening defined benefit obligation (3,114) (3,184) (656) (672) (3,770) (3,856)Current service cost (38) (34) (7) (6) (45) (40)Interest cost (105) (144) (18) (24) (123) (168)Member contributions (7) (7) - - (7) (7)Actuarial gains/(losses) from changes in demographic assumptions - 321 41 - 41 321Actuarial gains/(losses) from changes in financial assumptions 175 (268) (84) (57) 91 (325)Actuarial gains/(losses) from changes in other assumptions (9) (8) (4) (9) (13) (17)
Payments from the plan 188 210 32 27 220 237Exchange differences on foreign plans - - 40 85 40 85Closing defined benefit obligation (2,910) (3,114) (656) (656) (3,566) (3,770)
Changes in the fair value of plan assets are as follows:
Opening fair value of plan assets 3,375 3,460 605 615 3,980 4,075Interest income 111 153 17 23 128 176Return on plan assets (excluding interest income) 66 (9) 63 37 129 28Member contributions 7 7 - - 7 7Employer contributions 240 240 29 36 269 276Employer financed benefits within accumulation division (275) (266) - - (275) (266)
Payments from the plan (188) (210) (32) (27) (220) (237)Exchange differences on foreign plans - - (37) (79) (37) (79)Closing fair value of plan assets 3,336 3,375 645 605 3,981 3,980
Commonwealth Bank Group Super
(1) Represents superannuation contributions required by the Bank to meet its obligations to members of the defined contribution division of Commonwealth Bank Group Super.
118
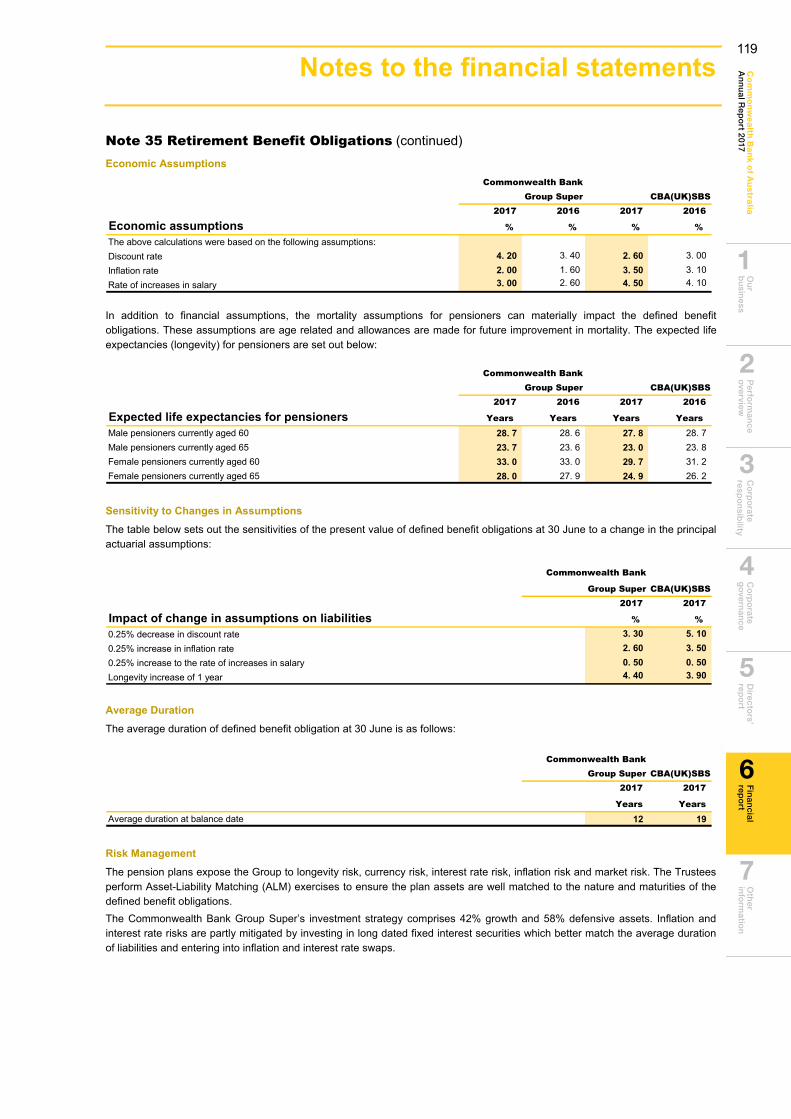
Ou
r b
usin
essP
erform
ance
overview
C
orp
orate
respo
nsib
ility C
orp
orate
go
vernan
ceD
irectors’
repo
rtO
ther
info
rmatio
nC
om
mo
nw
ea
lth Ba
nk o
f Au
stralia
An
nu
al Rep
ort 2017
Fin
ancial
repo
rt
6
2
1
3
4
5
7
173
Note 35 Retirement Benefit Obligations (continued) Economic Assumptions
Commonwealth BankGroup Super CBA(UK)SBS
2017 2016 2017 2016
Economic assumptions % % % %
The above calculations were based on the following assumptions:Discount rate 4. 20 3. 40 2. 60 3. 00Inflation rate 2. 00 1. 60 3. 50 3. 10Rate of increases in salary 3. 00 2. 60 4. 50 4. 10
In addition to financial assumptions, the mortality assumptions for pensioners can materially impact the defined benefit obligations. These assumptions are age related and allowances are made for future improvement in mortality. The expected life expectancies (longevity) for pensioners are set out below:
Commonwealth BankGroup Super CBA(UK)SBS
2017 2016 2017 2016
Expected life expectancies for pensioners Years Years Years Years
Male pensioners currently aged 60 28. 7 28. 6 27. 8 28. 7Male pensioners currently aged 65 23. 7 23. 6 23. 0 23. 8Female pensioners currently aged 60 33. 0 33. 0 29. 7 31. 2Female pensioners currently aged 65 28. 0 27. 9 24. 9 26. 2
Sensitivity to Changes in Assumptions The table below sets out the sensitivities of the present value of defined benefit obligations at 30 June to a change in the principal actuarial assumptions:
Commonwealth Bank
Group Super CBA(UK)SBS 2017 2017
Impact of change in assumptions on liabilities % %
0.25% decrease in discount rate 3. 30 5. 100.25% increase in inflation rate 2. 60 3. 500.25% increase to the rate of increases in salary 0. 50 0. 50Longevity increase of 1 year 4. 40 3. 90
Average Duration The average duration of defined benefit obligation at 30 June is as follows:
Commonwealth BankGroup Super CBA(UK)SBS
2017 2017
Years Years
Average duration at balance date 12 19
Risk Management The pension plans expose the Group to longevity risk, currency risk, interest rate risk, inflation risk and market risk. The Trustees perform Asset-Liability Matching (ALM) exercises to ensure the plan assets are well matched to the nature and maturities of the defined benefit obligations. The Commonwealth Bank Group Super’s investment strategy comprises 42% growth and 58% defensive assets. Inflation and interest rate risks are partly mitigated by investing in long dated fixed interest securities which better match the average duration of liabilities and entering into inflation and interest rate swaps.
119
Notes to the financial statements
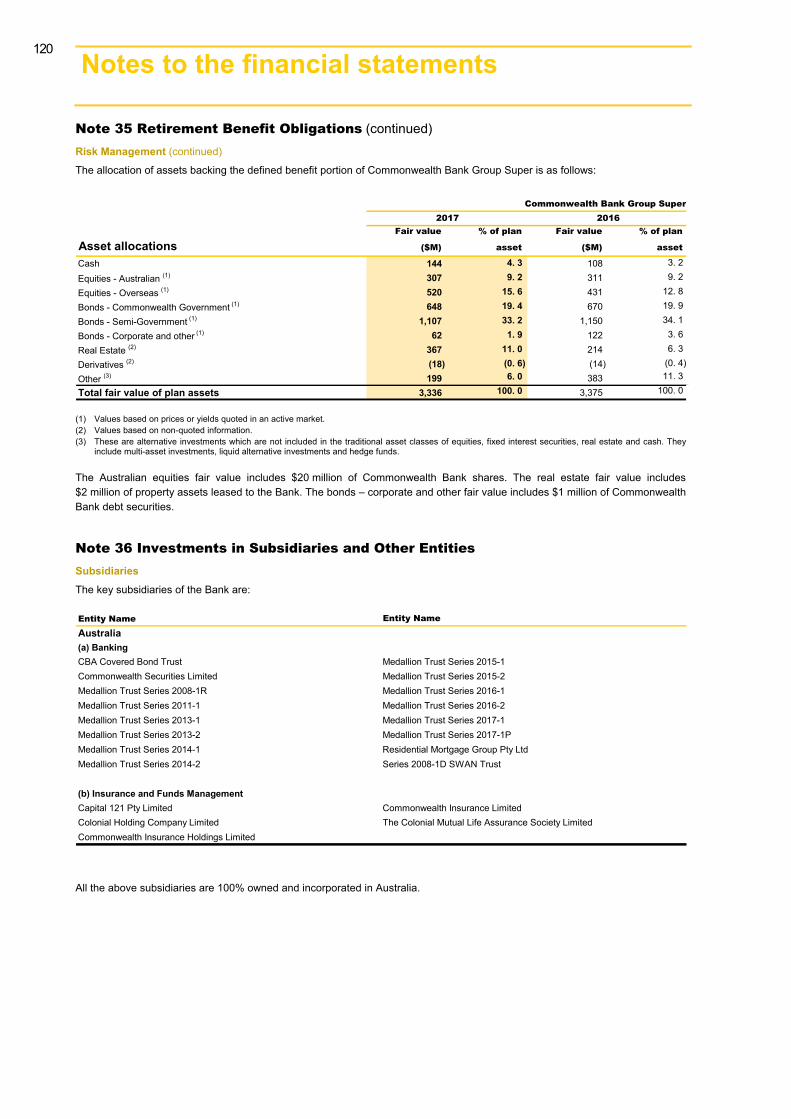
174 Notes to the financial statements 3
Note 35 Retirement Benefit Obligations (continued) Risk Management (continued) The allocation of assets backing the defined benefit portion of Commonwealth Bank Group Super is as follows:
Commonwealth Bank Group Super2017 2016
Fair value % of plan Fair value % of plan
Asset allocations ($M) asset ($M) asset
Cash 144 4. 3 108 3. 2
Equities - Australian (1) 307 9. 2 311 9. 2
Equities - Overseas (1) 520 15. 6 431 12. 8
Bonds - Commonwealth Government (1) 648 19. 4 670 19. 9
Bonds - Semi-Government (1) 1,107 33. 2 1,150 34. 1
Bonds - Corporate and other (1) 62 1. 9 122 3. 6
Real Estate (2) 367 11. 0 214 6. 3
Derivatives (2) (18) (0. 6) (14) (0. 4)
Other (3) 199 6. 0 383 11. 3
Total fair value of plan assets 3,336 100. 0 3,375 100. 0
(1) Values based on prices or yields quoted in an active market. (2) Values based on non-quoted information.(3) These are alternative investments which are not included in the traditional asset classes of equities, fixed interest securities, real estate and cash. They
include multi-asset investments, liquid alternative investments and hedge funds.
The Australian equities fair value includes $20 million of Commonwealth Bank shares. The real estate fair value includes $2 million of property assets leased to the Bank. The bonds – corporate and other fair value includes $1 million of Commonwealth Bank debt securities.
Note 36 Investments in Subsidiaries and Other Entities Subsidiaries The key subsidiaries of the Bank are:
Entity Name Entity Name
Australia(a) BankingCBA Covered Bond Trust Medallion Trust Series 2015-1Commonwealth Securities Limited Medallion Trust Series 2015-2Medallion Trust Series 2008-1R Medallion Trust Series 2016-1Medallion Trust Series 2011-1 Medallion Trust Series 2016-2Medallion Trust Series 2013-1 Medallion Trust Series 2017-1Medallion Trust Series 2013-2 Medallion Trust Series 2017-1PMedallion Trust Series 2014-1 Residential Mortgage Group Pty LtdMedallion Trust Series 2014-2 Series 2008-1D SWAN Trust
(b) Insurance and Funds ManagementCapital 121 Pty Limited Commonwealth Insurance LimitedColonial Holding Company Limited The Colonial Mutual Life Assurance Society LimitedCommonwealth Insurance Holdings Limited
All the above subsidiaries are 100% owned and incorporated in Australia.
120

Ou
r b
usin
essP
erform
ance
overview
C
orp
orate
respo
nsib
ility C
orp
orate
go
vernan
ceD
irectors’
repo
rtO
ther
info
rmatio
nC
om
mo
nw
ea
lth Ba
nk o
f Au
stralia
An
nu
al Rep
ort 2017
Fin
ancial
repo
rt
6
2
1
3
4
5
7
175
Note 36 Investments in Subsidiaries and Other Entities (continued) Subsidiaries (continued)
Extent of BeneficialEntity Name Interest if not 100% Incorporated in
New Zealand and Other Overseas(a) BankingASB Bank Limited New Zealand ASB Covered Bond Trust New Zealand ASB Finance Limited New Zealand ASB Holdings Limited New Zealand ASB Term Fund New Zealand CommBank Europe Limited Malta Medallion NZ Series Trust 2009-1R New Zealand PT Bank Commonwealth 99% Indonesia
(b) Insurance and Funds ManagementASB Group (Life) Limited New Zealand PT Commonwealth Life 80% Indonesia Sovereign Assurance Company Limited New Zealand
The Group also consolidates a number of unit trusts and other companies as part of the ongoing investment activities of the life insurance and wealth businesses. These investment vehicles are excluded from the above list.
Significant Judgements and Assumptions
Control and Voting Rights
Holding more than 50% of an entity’s voting rights typically indicates that the Group has control over the entity. Significant judgement is involved where the Group either holds more than 50% of the voting rights but does not control an entity, which occurs in the case of AHL Holdings Pty Limited (AHL) as outlined below or where the Group is deemed to control an entity despite holding less than 50% of the voting rights.
AHL Holdings Pty Limited (AHL)
Management have determined that the Group does not control AHL despite owning 80% of the issued share capital of this entity. According to the Shareholders Deed agreed between the shareholders of AHL, unanimous consent is required from all parties to the Deed for all key decisions. This results in joint control and hence the Group accounts for its investment in AHL as a joint venture using the equity method.
Agent or principal
The Group is deemed to have power over an investment fund when it holds either the responsible entity (RE) and/or the manager function of that fund. Whether that power translates to control depends on whether the Group is deemed to act as an agent or a principal of that fund. Management have determined that the Group acts as a principal and controls a fund when it cannot be easily removed as a manager or RE by investors and when its economic interest in that fund is substantial compared to the economic interest of other investors. In all other cases the Group acts as agent and does not control the fund.
Non-Controlling Interests Group
2017 2016$M $M
Shareholders' Equity 546 550Total non-controlling interests 546 550
The share capital above comprises predominantly New Zealand Perpetual Preference Shares (PPS) of AUD505 million. On 10 December 2002, ASB Capital Limited, a New Zealand subsidiary, issued NZD200 million (AUD182 million) of PPS. The PPS were issued into the New Zealand capital markets and are subject to New Zealand law. Such shares are non-redeemable and carry limited voting rights. Dividends are payable quarterly based on the New Zealand one year swap rate plus a margin of 1.3% and are non-cumulative. The payments of dividends are subject to a number of conditions including the satisfaction of solvency tests and the ability of the Board to cancel payments. On 22 December 2004, ASB Capital No.2 Limited, a New Zealand subsidiary, issued NZD350 million (AUD323 million) of PPS. The PPS were issued into the New Zealand capital markets and are subject to New Zealand law. Such shares are non-redeemable and carry limited voting rights. Dividends are payable quarterly on the New Zealand one year swap rate plus a margin of 1.0% and are non-cumulative. The payments of dividends are subject to a number of conditions including the satisfaction of solvency tests and the ability of the Board to cancel payments.
121
Notes to the financial statements
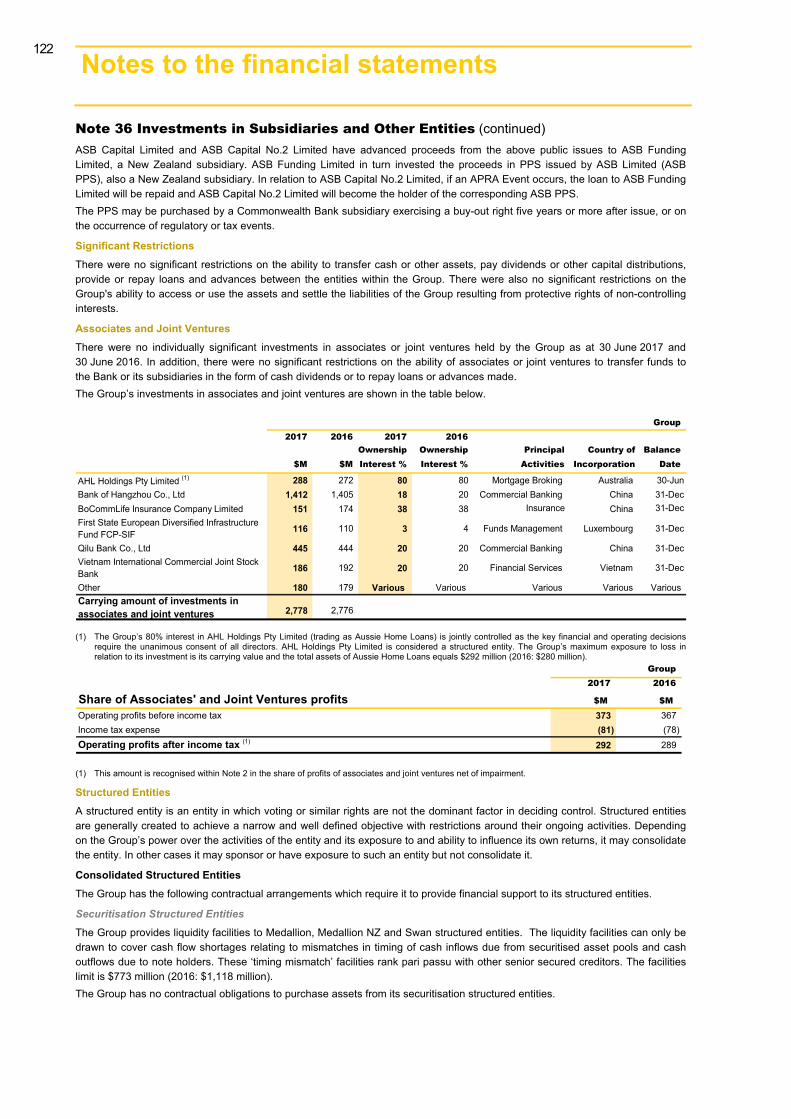
176 Notes to the financial statements 3
Note 36 Investments in Subsidiaries and Other Entities (continued) ASB Capital Limited and ASB Capital No.2 Limited have advanced proceeds from the above public issues to ASB Funding Limited, a New Zealand subsidiary. ASB Funding Limited in turn invested the proceeds in PPS issued by ASB Limited (ASB PPS), also a New Zealand subsidiary. In relation to ASB Capital No.2 Limited, if an APRA Event occurs, the loan to ASB Funding Limited will be repaid and ASB Capital No.2 Limited will become the holder of the corresponding ASB PPS. The PPS may be purchased by a Commonwealth Bank subsidiary exercising a buy-out right five years or more after issue, or on the occurrence of regulatory or tax events.
Significant Restrictions There were no significant restrictions on the ability to transfer cash or other assets, pay dividends or other capital distributions, provide or repay loans and advances between the entities within the Group. There were also no significant restrictions on the Group's ability to access or use the assets and settle the liabilities of the Group resulting from protective rights of non-controlling interests.
Associates and Joint Ventures There were no individually significant investments in associates or joint ventures held by the Group as at 30 June 2017 and 30 June 2016. In addition, there were no significant restrictions on the ability of associates or joint ventures to transfer funds to the Bank or its subsidiaries in the form of cash dividends or to repay loans or advances made. The Group’s investments in associates and joint ventures are shown in the table below.
Group2017 2016 2017 2016
Ownership Ownership Principal Country of Balance$M $M Interest % Interest % Activities Incorporation Date
AHL Holdings Pty Limited (1) 288 272 80 80 Mortgage Broking Australia 30-JunBank of Hangzhou Co., Ltd 1,412 1,405 18 20 Commercial Banking China 31-DecBoCommLife Insurance Company Limited 151 174 38 38 Insurance China 31-DecFirst State European Diversified Infrastructure Fund FCP-SIF 116 110 3 4 Funds Management Luxembourg 31-Dec
Qilu Bank Co., Ltd 445 444 20 20 Commercial Banking China 31-DecVietnam International Commercial Joint Stock Bank 186 192 20 20 Financial Services Vietnam 31-Dec
Other 180 179 Various Various Various Various VariousCarrying amount of investments in associates and joint ventures 2,778 2,776
(1) The Group’s 80% interest in AHL Holdings Pty Limited (trading as Aussie Home Loans) is jointly controlled as the key financial and operating decisions require the unanimous consent of all directors. AHL Holdings Pty Limited is considered a structured entity. The Group’s maximum exposure to loss in relation to its investment is its carrying value and the total assets of Aussie Home Loans equals $292 million (2016: $280 million).
Group2017 2016
Share of Associates' and Joint Ventures profits $M $M
Operating profits before income tax 373 367Income tax expense (81) (78)Operating profits after income tax (1) 292 289
(1) This amount is recognised within Note 2 in the share of profits of associates and joint ventures net of impairment.
Structured Entities A structured entity is an entity in which voting or similar rights are not the dominant factor in deciding control. Structured entities are generally created to achieve a narrow and well defined objective with restrictions around their ongoing activities. Depending on the Group’s power over the activities of the entity and its exposure to and ability to influence its own returns, it may consolidate the entity. In other cases it may sponsor or have exposure to such an entity but not consolidate it.
Consolidated Structured Entities The Group has the following contractual arrangements which require it to provide financial support to its structured entities.
Securitisation Structured Entities
The Group provides liquidity facilities to Medallion, Medallion NZ and Swan structured entities. The liquidity facilities can only be drawn to cover cash flow shortages relating to mismatches in timing of cash inflows due from securitised asset pools and cash outflows due to note holders. These ‘timing mismatch’ facilities rank pari passu with other senior secured creditors. The facilities limit is $773 million (2016: $1,118 million). The Group has no contractual obligations to purchase assets from its securitisation structured entities.
122
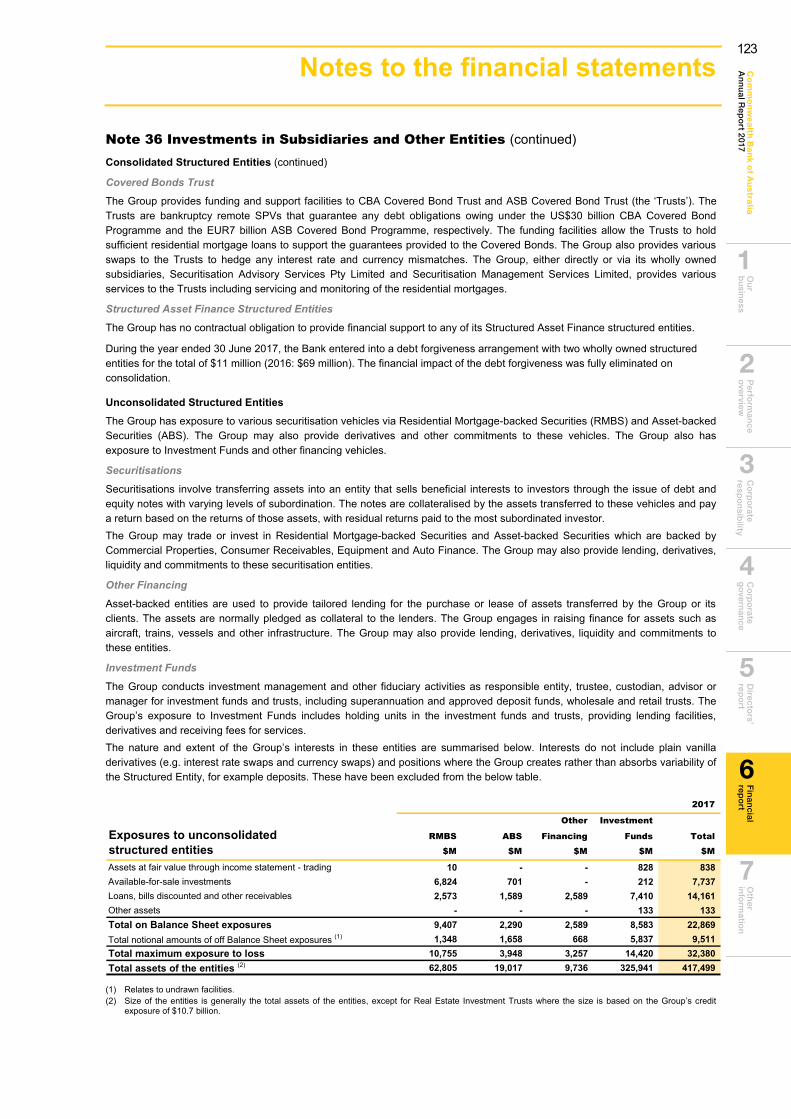
Ou
r b
usin
essP
erform
ance
overview
C
orp
orate
respo
nsib
ility C
orp
orate
go
vernan
ceD
irectors’
repo
rtO
ther
info
rmatio
nC
om
mo
nw
ea
lth Ba
nk o
f Au
stralia
An
nu
al Rep
ort 2017
Fin
ancial
repo
rt
6
2
1
3
4
5
7
177
Note 36 Investments in Subsidiaries and Other Entities (continued) Consolidated Structured Entities (continued)
Covered Bonds Trust
The Group provides funding and support facilities to CBA Covered Bond Trust and ASB Covered Bond Trust (the ‘Trusts’). The Trusts are bankruptcy remote SPVs that guarantee any debt obligations owing under the US$30 billion CBA Covered Bond Programme and the EUR7 billion ASB Covered Bond Programme, respectively. The funding facilities allow the Trusts to hold sufficient residential mortgage loans to support the guarantees provided to the Covered Bonds. The Group also provides various swaps to the Trusts to hedge any interest rate and currency mismatches. The Group, either directly or via its wholly owned subsidiaries, Securitisation Advisory Services Pty Limited and Securitisation Management Services Limited, provides various services to the Trusts including servicing and monitoring of the residential mortgages.
Structured Asset Finance Structured Entities
The Group has no contractual obligation to provide financial support to any of its Structured Asset Finance structured entities.
During the year ended 30 June 2017, the Bank entered into a debt forgiveness arrangement with two wholly owned structured entities for the total of $11 million (2016: $69 million). The financial impact of the debt forgiveness was fully eliminated on consolidation.
Unconsolidated Structured Entities The Group has exposure to various securitisation vehicles via Residential Mortgage-backed Securities (RMBS) and Asset-backed Securities (ABS). The Group may also provide derivatives and other commitments to these vehicles. The Group also has exposure to Investment Funds and other financing vehicles.
Securitisations
Securitisations involve transferring assets into an entity that sells beneficial interests to investors through the issue of debt and equity notes with varying levels of subordination. The notes are collateralised by the assets transferred to these vehicles and pay a return based on the returns of those assets, with residual returns paid to the most subordinated investor. The Group may trade or invest in Residential Mortgage-backed Securities and Asset-backed Securities which are backed by Commercial Properties, Consumer Receivables, Equipment and Auto Finance. The Group may also provide lending, derivatives, liquidity and commitments to these securitisation entities.
Other Financing
Asset-backed entities are used to provide tailored lending for the purchase or lease of assets transferred by the Group or its clients. The assets are normally pledged as collateral to the lenders. The Group engages in raising finance for assets such as aircraft, trains, vessels and other infrastructure. The Group may also provide lending, derivatives, liquidity and commitments to these entities.
Investment Funds
The Group conducts investment management and other fiduciary activities as responsible entity, trustee, custodian, advisor or manager for investment funds and trusts, including superannuation and approved deposit funds, wholesale and retail trusts. The Group’s exposure to Investment Funds includes holding units in the investment funds and trusts, providing lending facilities, derivatives and receiving fees for services. The nature and extent of the Group’s interests in these entities are summarised below. Interests do not include plain vanilla derivatives (e.g. interest rate swaps and currency swaps) and positions where the Group creates rather than absorbs variability of the Structured Entity, for example deposits. These have been excluded from the below table.
2017
Other Investment
Exposures to unconsolidated RMBS ABS Financing Funds Totalstructured entities $M $M $M $M $M
Assets at fair value through income statement - trading 10 - - 828 838Available-for-sale investments 6,824 701 - 212 7,737Loans, bills discounted and other receivables 2,573 1,589 2,589 7,410 14,161Other assets - - - 133 133Total on Balance Sheet exposures 9,407 2,290 2,589 8,583 22,869Total notional amounts of off Balance Sheet exposures (1) 1,348 1,658 668 5,837 9,511Total maximum exposure to loss 10,755 3,948 3,257 14,420 32,380Total assets of the entities (2) 62,805 19,017 9,736 325,941 417,499
(1) Relates to undrawn facilities.(2) Size of the entities is generally the total assets of the entities, except for Real Estate Investment Trusts where the size is based on the Group’s credit
exposure of $10.7 billion.
123
Notes to the financial statements

178 Notes to the financial statements 3
Note 36 Investments in Subsidiaries and Other Entities (continued) Unconsolidated Structured Entities (continued)
2016Other Investment
Exposures to unconsolidated RMBS ABS Financing Funds Totalstructured entities $M $M $M $M $M
Assets at fair value through income statement - trading 5 - - 1,078 1,083Available-for-sale investments 7,123 872 - 205 8,200Loans, bills discounted and other receivables 2,432 1,606 2,627 9,861 16,526Other assets - - - 123 123Total on Balance Sheet exposures 9,560 2,478 2,627 11,267 25,932Total notional amounts of off Balance Sheet exposures (1) 1,338 543 501 3,915 6,297Total maximum exposure to loss 10,898 3,021 3,128 15,182 32,229Total assets of the entities (2) 47,626 15,066 9,967 290,261 362,920
(1) Relates to undrawn facilities.(2) Size of the entities is generally the total assets of the entities, except for Real Estate Investment Trusts where the size is based on the Group’s credit
exposure of $11.2 billion.
The Group’s exposure to loss depends on the level of subordination of the interest which indicates the extent to which other parties are obliged to absorb credit losses before the Group. An overview of the Group’s interests, relative ranking and external credit rating, for vehicles that have credit subordination in place, is summarised in the table below, and include securitisation vehicles and other financing.
2017Other
Ranking and credit rating of exposures RMBS ABS Financing Totalto unconsolidated structured entities $M $M $M $M
Senior (1) 10,727 3,936 3,257 17,920
Mezzanine (2) 13 12 - 25Subordinated (3) 15 - - 15Total maximum exposure to loss 10,755 3,948 3,257 17,960
(1) All RMBS and ABS exposures, and $1,776 million of other financing exposures are rated investment grade, $1,481 million of other financing exposures aresub-investment grade.
(2) All RMBS and ABS exposures are rated investment grade.(3) All exposures are rated sub-investment grade.
2016Other
Ranking and credit rating of exposures RMBS ABS Financing Totalto unconsolidated structured entities $M $M $M $M
Senior (1) 10,853 3,008 3,128 16,989
Mezzanine (2) 18 13 - 31
Subordinated (3) 27 - - 27Total maximum exposure to loss 10,898 3,021 3,128 17,047
(1) $10,853 million of RMBS exposures, $3,008 million of ABS exposures and $1,522 million of other financing exposures are rated investment grade, the remaining $1,606 million exposures are rated sub-investment grade.
(2) All RMBS and ABS exposures are rated investment grade.(3) All exposures are rated sub-investment grade.
Sponsored Unconsolidated Structured Entities
For the purposes of this disclosure, the Group sponsors an entity when it manages or advises the entity’s program, places securities into the market on behalf of the entity, provides liquidity and/or credit enhancements to the entity, or the Group’s name appears in the Structured Entity. During the year ended 30 June 2017, the Group sponsored two unconsolidated structured entities being Security Holding Investment Entity Linking Deals Limited (SHIELD) and SHIELD Trust No. 2. A wholly owned subsidiary of the Group, Securitisation Advisory Services Pty Limited (SAS), was the manager of SHIELD and SHIELD was the trustee of SHIELD Trust No. 2. The Group deregistered SHIELD and wound up SHIELD Trust No. 2 during the year ended 30 June 2017. There was no significant income earned or expense incurred directly from these entities during the year ended 30 June 2017. There were no assets transferred by all parties to the sponsored entities during the year ended 30 June 2017.
124
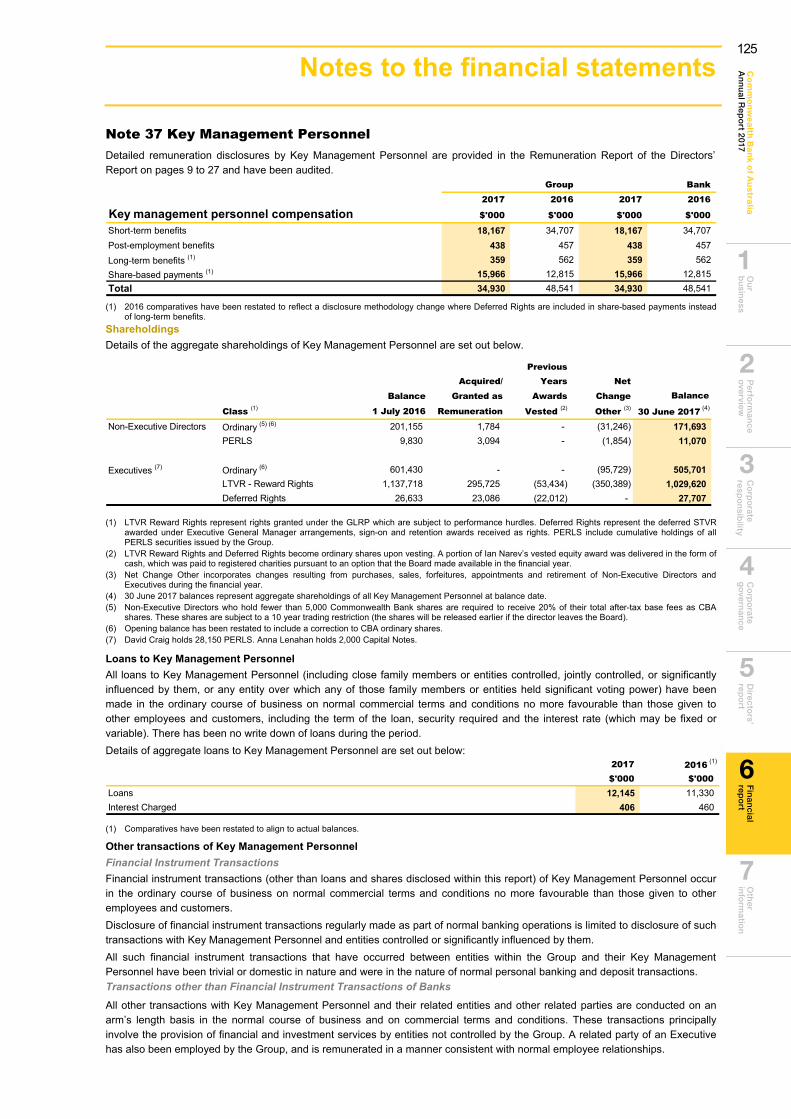
Ou
r b
usin
essP
erform
ance
overview
C
orp
orate
respo
nsib
ility C
orp
orate
go
vernan
ceD
irectors’
repo
rtO
ther
info
rmatio
nC
om
mo
nw
ea
lth Ba
nk o
f Au
stralia
An
nu
al Rep
ort 2017
Fin
ancial
repo
rt
6
2
1
3
4
5
7
179
Note 37 Key Management Personnel Detailed remuneration disclosures by Key Management Personnel are provided in the Remuneration Report of the Directors’ Report on pages 9 to 27 and have been audited.
Group Bank2017 2016 2017 2016
Key management personnel compensation $'000 $'000 $'000 $'000
Short-term benefits 18,167 34,707 18,167 34,707Post-employment benefits 438 457 438 457Long-term benefits (1) 359 562 359 562Share-based payments (1) 15,966 12,815 15,966 12,815Total 34,930 48,541 34,930 48,541
(1) 2016 comparatives have been restated to reflect a disclosure methodology change where Deferred Rights are included in share-based payments instead of long-term benefits.
Shareholdings Details of the aggregate shareholdings of Key Management Personnel are set out below.
PreviousAcquired/ Years Net
Balance Granted as Awards Change Balance
Class (1) 1 July 2016 Remuneration Vested (2) Other (3) 30 June 2017(4)
Non-Executive Directors Ordinary (5) (6) 201,155 1,784 - (31,246) 171,693PERLS 9,830 3,094 - (1,854) 11,070
Executives (7) Ordinary (6) 601,430 - - (95,729) 505,701LTVR - Reward Rights 1,137,718 295,725 (53,434) (350,389) 1,029,620Deferred Rights 26,633 23,086 (22,012) - 27,707
(1) LTVR Reward Rights represent rights granted under the GLRP which are subject to performance hurdles. Deferred Rights represent the deferred STVR awarded under Executive General Manager arrangements, sign-on and retention awards received as rights. PERLS include cumulative holdings of all PERLS securities issued by the Group.
(2) LTVR Reward Rights and Deferred Rights become ordinary shares upon vesting. A portion of Ian Narev’s vested equity award was delivered in the form ofcash, which was paid to registered charities pursuant to an option that the Board made available in the financial year.
(3) Net Change Other incorporates changes resulting from purchases, sales, forfeitures, appointments and retirement of Non-Executive Directors andExecutives during the financial year.
(4) 30 June 2017 balances represent aggregate shareholdings of all Key Management Personnel at balance date. (5) Non-Executive Directors who hold fewer than 5,000 Commonwealth Bank shares are required to receive 20% of their total after-tax base fees as CBA
shares. These shares are subject to a 10 year trading restriction (the shares will be released earlier if the director leaves the Board). (6) Opening balance has been restated to include a correction to CBA ordinary shares.(7) David Craig holds 28,150 PERLS. Anna Lenahan holds 2,000 Capital Notes.
Loans to Key Management Personnel All loans to Key Management Personnel (including close family members or entities controlled, jointly controlled, or significantly influenced by them, or any entity over which any of those family members or entities held significant voting power) have been made in the ordinary course of business on normal commercial terms and conditions no more favourable than those given to other employees and customers, including the term of the loan, security required and the interest rate (which may be fixed or variable). There has been no write down of loans during the period. Details of aggregate loans to Key Management Personnel are set out below:
2017 2016(1)
$'000 $'000Loans 12,145 11,330Interest Charged 406 460
(1) Comparatives have been restated to align to actual balances.
Other transactions of Key Management Personnel Financial Instrument Transactions Financial instrument transactions (other than loans and shares disclosed within this report) of Key Management Personnel occur in the ordinary course of business on normal commercial terms and conditions no more favourable than those given to other employees and customers. Disclosure of financial instrument transactions regularly made as part of normal banking operations is limited to disclosure of such transactions with Key Management Personnel and entities controlled or significantly influenced by them. All such financial instrument transactions that have occurred between entities within the Group and their Key Management Personnel have been trivial or domestic in nature and were in the nature of normal personal banking and deposit transactions. Transactions other than Financial Instrument Transactions of Banks
All other transactions with Key Management Personnel and their related entities and other related parties are conducted on an arm’s length basis in the normal course of business and on commercial terms and conditions. These transactions principally involve the provision of financial and investment services by entities not controlled by the Group. A related party of an Executive has also been employed by the Group, and is remunerated in a manner consistent with normal employee relationships.
125
Notes to the financial statements
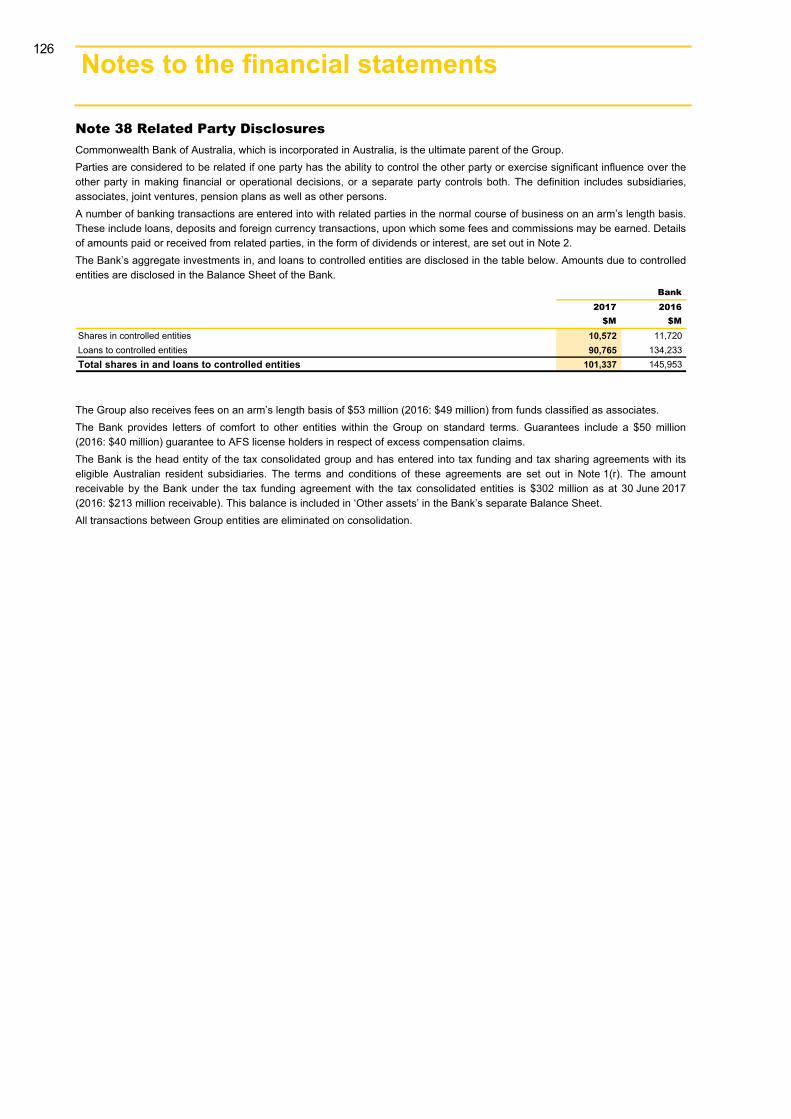
180 Notes to the financial statements 3
Note 38 Related Party Disclosures Commonwealth Bank of Australia, which is incorporated in Australia, is the ultimate parent of the Group. Parties are considered to be related if one party has the ability to control the other party or exercise significant influence over the other party in making financial or operational decisions, or a separate party controls both. The definition includes subsidiaries, associates, joint ventures, pension plans as well as other persons. A number of banking transactions are entered into with related parties in the normal course of business on an arm’s length basis. These include loans, deposits and foreign currency transactions, upon which some fees and commissions may be earned. Details of amounts paid or received from related parties, in the form of dividends or interest, are set out in Note 2. The Bank’s aggregate investments in, and loans to controlled entities are disclosed in the table below. Amounts due to controlled entities are disclosed in the Balance Sheet of the Bank.
Bank2017 2016
$M $M
Shares in controlled entities 10,572 11,720Loans to controlled entities 90,765 134,233Total shares in and loans to controlled entities 101,337 145,953
The Group also receives fees on an arm’s length basis of $53 million (2016: $49 million) from funds classified as associates. The Bank provides letters of comfort to other entities within the Group on standard terms. Guarantees include a $50 million (2016: $40 million) guarantee to AFS license holders in respect of excess compensation claims. The Bank is the head entity of the tax consolidated group and has entered into tax funding and tax sharing agreements with its eligible Australian resident subsidiaries. The terms and conditions of these agreements are set out in Note 1(r). The amount receivable by the Bank under the tax funding agreement with the tax consolidated entities is $302 million as at 30 June 2017 (2016: $213 million receivable). This balance is included in ‘Other assets’ in the Bank’s separate Balance Sheet. All transactions between Group entities are eliminated on consolidation.
126
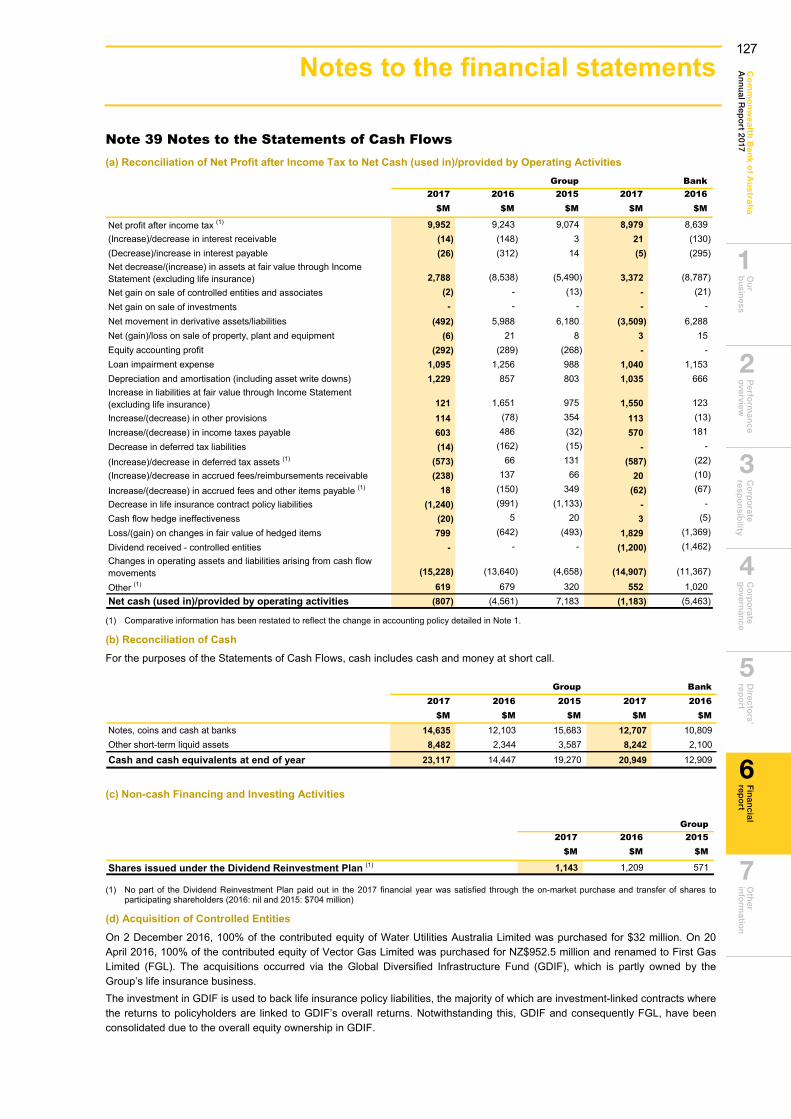
Ou
r b
usin
essP
erform
ance
overview
C
orp
orate
respo
nsib
ility C
orp
orate
go
vernan
ceD
irectors’
repo
rtO
ther
info
rmatio
nC
om
mo
nw
ea
lth Ba
nk o
f Au
stralia
An
nu
al Rep
ort 2017
Fin
ancial
repo
rt
6
2
1
3
4
5
7
181
Note 39 Notes to the Statements of Cash Flows (a) Reconciliation of Net Profit after Income Tax to Net Cash (used in)/provided by Operating Activities
Group Bank2017 2016 2015 2017 2016
$M $M $M $M $M
Net profit after income tax (1) 9,952 9,243 9,074 8,979 8,639(Increase)/decrease in interest receivable (14) (148) 3 21 (130)(Decrease)/increase in interest payable (26) (312) 14 (5) (295)Net decrease/(increase) in assets at fair value through Income Statement (excluding life insurance) 2,788 (8,538) (5,490) 3,372 (8,787)Net gain on sale of controlled entities and associates (2) - (13) - (21)Net gain on sale of investments - - - - -Net movement in derivative assets/liabilities (492) 5,988 6,180 (3,509) 6,288Net (gain)/loss on sale of property, plant and equipment (6) 21 8 3 15Equity accounting profit (292) (289) (268) - -Loan impairment expense 1,095 1,256 988 1,040 1,153Depreciation and amortisation (including asset write downs) 1,229 857 803 1,035 666Increase in liabilities at fair value through Income Statement (excluding life insurance) 121 1,651 975 1,550 123Increase/(decrease) in other provisions 114 (78) 354 113 (13)Increase/(decrease) in income taxes payable 603 486 (32) 570 181Decrease in deferred tax liabilities (14) (162) (15) - -
(Increase)/decrease in deferred tax assets (1) (573) 66 131 (587) (22)(Increase)/decrease in accrued fees/reimbursements receivable (238) 137 66 20 (10)
Increase/(decrease) in accrued fees and other items payable (1) 18 (150) 349 (62) (67)Decrease in life insurance contract policy liabilities (1,240) (991) (1,133) - -Cash flow hedge ineffectiveness (20) 5 20 3 (5)Loss/(gain) on changes in fair value of hedged items 799 (642) (493) 1,829 (1,369)Dividend received - controlled entities - - - (1,200) (1,462)Changes in operating assets and liabilities arising from cash flow movements (15,228) (13,640) (4,658) (14,907) (11,367)
Other (1) 619 679 320 552 1,020Net cash (used in)/provided by operating activities (807) (4,561) 7,183 (1,183) (5,463)
(1) Comparative information has been restated to reflect the change in accounting policy detailed in Note 1.
(b) Reconciliation of CashFor the purposes of the Statements of Cash Flows, cash includes cash and money at short call.
Group Bank2017 2016 2015 2017 2016
$M $M $M $M $M
Notes, coins and cash at banks 14,635 12,103 15,683 12,707 10,809Other short-term liquid assets 8,482 2,344 3,587 8,242 2,100Cash and cash equivalents at end of year 23,117 14,447 19,270 20,949 12,909
(c) Non-cash Financing and Investing Activities
Group2017 2016 2015
$M $M $M
Shares issued under the Dividend Reinvestment Plan (1) 1,143 1,209 571
(1) No part of the Dividend Reinvestment Plan paid out in the 2017 financial year was satisfied through the on-market purchase and transfer of shares to participating shareholders (2016: nil and 2015: $704 million)
(d) Acquisition of Controlled EntitiesOn 2 December 2016, 100% of the contributed equity of Water Utilities Australia Limited was purchased for $32 million. On 20 April 2016, 100% of the contributed equity of Vector Gas Limited was purchased for NZ$952.5 million and renamed to First Gas Limited (FGL). The acquisitions occurred via the Global Diversified Infrastructure Fund (GDIF), which is partly owned by the Group’s life insurance business. The investment in GDIF is used to back life insurance policy liabilities, the majority of which are investment-linked contracts where the returns to policyholders are linked to GDIF’s overall returns. Notwithstanding this, GDIF and consequently FGL, have been consolidated due to the overall equity ownership in GDIF.
127
Notes to the financial statements
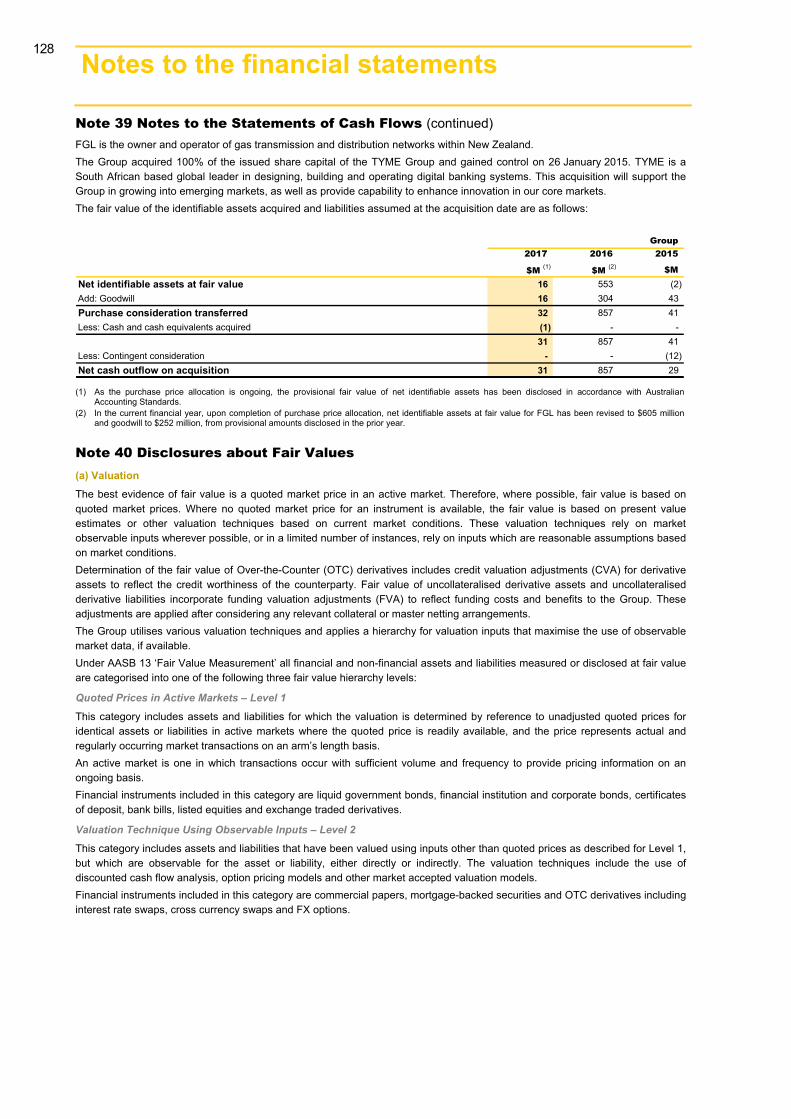
182 Notes to the financial statements 3
Note 39 Notes to the Statements of Cash Flows (continued) FGL is the owner and operator of gas transmission and distribution networks within New Zealand. The Group acquired 100% of the issued share capital of the TYME Group and gained control on 26 January 2015. TYME is a South African based global leader in designing, building and operating digital banking systems. This acquisition will support the Group in growing into emerging markets, as well as provide capability to enhance innovation in our core markets. The fair value of the identifiable assets acquired and liabilities assumed at the acquisition date are as follows:
Group2017 2016 2015
$M (1) $M (2) $MNet identifiable assets at fair value 16 553 (2)Add: Goodwill 16 304 43Purchase consideration transferred 32 857 41Less: Cash and cash equivalents acquired (1) - -
31 857 41Less: Contingent consideration - - (12)Net cash outflow on acquisition 31 857 29
(1) As the purchase price allocation is ongoing, the provisional fair value of net identifiable assets has been disclosed in accordance with AustralianAccounting Standards.
(2) In the current financial year, upon completion of purchase price allocation, net identifiable assets at fair value for FGL has been revised to $605 millionand goodwill to $252 million, from provisional amounts disclosed in the prior year.
Note 40 Disclosures about Fair Values (a) ValuationThe best evidence of fair value is a quoted market price in an active market. Therefore, where possible, fair value is based on quoted market prices. Where no quoted market price for an instrument is available, the fair value is based on present value estimates or other valuation techniques based on current market conditions. These valuation techniques rely on market observable inputs wherever possible, or in a limited number of instances, rely on inputs which are reasonable assumptions based on market conditions. Determination of the fair value of Over-the-Counter (OTC) derivatives includes credit valuation adjustments (CVA) for derivative assets to reflect the credit worthiness of the counterparty. Fair value of uncollateralised derivative assets and uncollateralised derivative liabilities incorporate funding valuation adjustments (FVA) to reflect funding costs and benefits to the Group. These adjustments are applied after considering any relevant collateral or master netting arrangements. The Group utilises various valuation techniques and applies a hierarchy for valuation inputs that maximise the use of observable market data, if available. Under AASB 13 ‘Fair Value Measurement’ all financial and non-financial assets and liabilities measured or disclosed at fair value are categorised into one of the following three fair value hierarchy levels:
Quoted Prices in Active Markets – Level 1
This category includes assets and liabilities for which the valuation is determined by reference to unadjusted quoted prices for identical assets or liabilities in active markets where the quoted price is readily available, and the price represents actual and regularly occurring market transactions on an arm’s length basis. An active market is one in which transactions occur with sufficient volume and frequency to provide pricing information on an ongoing basis. Financial instruments included in this category are liquid government bonds, financial institution and corporate bonds, certificates of deposit, bank bills, listed equities and exchange traded derivatives.
Valuation Technique Using Observable Inputs – Level 2
This category includes assets and liabilities that have been valued using inputs other than quoted prices as described for Level 1, but which are observable for the asset or liability, either directly or indirectly. The valuation techniques include the use of discounted cash flow analysis, option pricing models and other market accepted valuation models. Financial instruments included in this category are commercial papers, mortgage-backed securities and OTC derivatives including interest rate swaps, cross currency swaps and FX options.
128
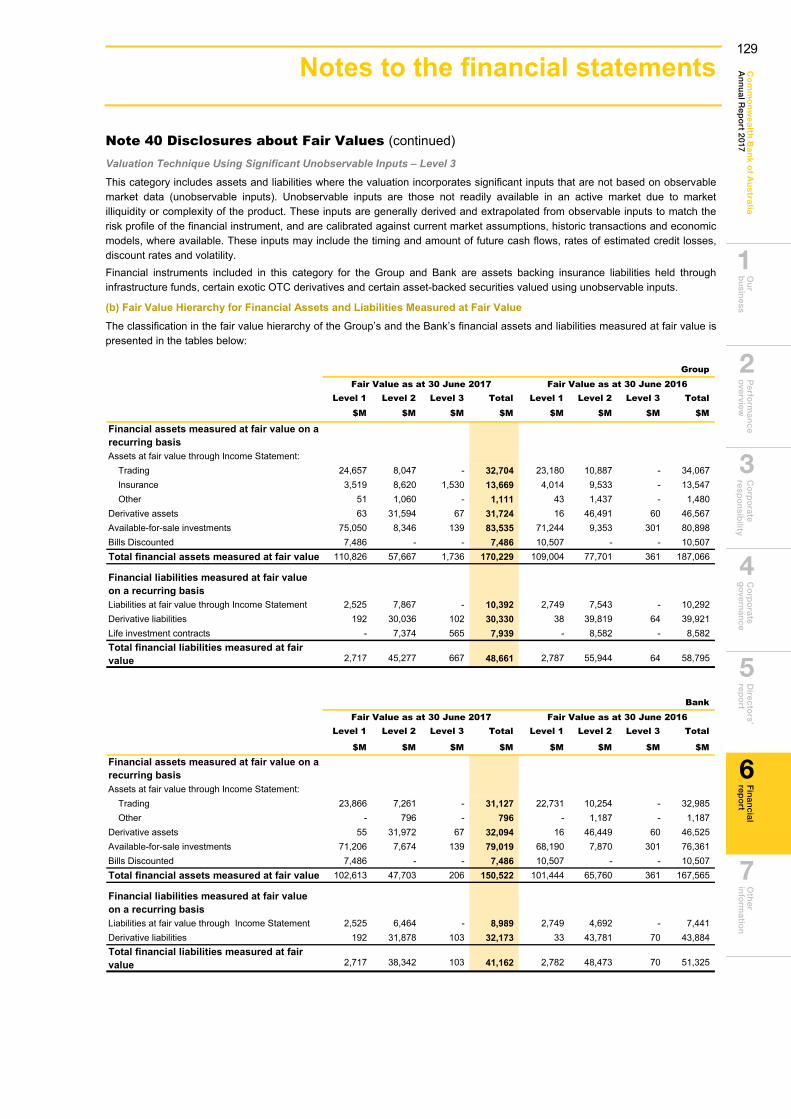
Ou
r b
usin
essP
erform
ance
overview
C
orp
orate
respo
nsib
ility C
orp
orate
go
vernan
ceD
irectors’
repo
rtO
ther
info
rmatio
nC
om
mo
nw
ea
lth Ba
nk o
f Au
stralia
An
nu
al Rep
ort 2017
Fin
ancial
repo
rt
6
2
1
3
4
5
7
183
Note 40 Disclosures about Fair Values (continued) Valuation Technique Using Significant Unobservable Inputs – Level 3
This category includes assets and liabilities where the valuation incorporates significant inputs that are not based on observable market data (unobservable inputs). Unobservable inputs are those not readily available in an active market due to market illiquidity or complexity of the product. These inputs are generally derived and extrapolated from observable inputs to match the risk profile of the financial instrument, and are calibrated against current market assumptions, historic transactions and economic models, where available. These inputs may include the timing and amount of future cash flows, rates of estimated credit losses, discount rates and volatility. Financial instruments included in this category for the Group and Bank are assets backing insurance liabilities held through infrastructure funds, certain exotic OTC derivatives and certain asset-backed securities valued using unobservable inputs.
(b) Fair Value Hierarchy for Financial Assets and Liabilities Measured at Fair ValueThe classification in the fair value hierarchy of the Group’s and the Bank’s financial assets and liabilities measured at fair value is presented in the tables below:
GroupFair Value as at 30 June 2017 Fair Value as at 30 June 2016
Level 1 Level 2 Level 3 Total Level 1 Level 2 Level 3 Total
$M $M $M $M $M $M $M $M
Financial assets measured at fair value on a recurring basisAssets at fair value through Income Statement:
Trading 24,657 8,047 - 32,704 23,180 10,887 - 34,067Insurance 3,519 8,620 1,530 13,669 4,014 9,533 - 13,547Other 51 1,060 - 1,111 43 1,437 - 1,480
Derivative assets 63 31,594 67 31,724 16 46,491 60 46,567Available-for-sale investments 75,050 8,346 139 83,535 71,244 9,353 301 80,898Bills Discounted 7,486 - - 7,486 10,507 - - 10,507Total financial assets measured at fair value 110,826 57,667 1,736 170,229 109,004 77,701 361 187,066
Financial liabilities measured at fair value on a recurring basisLiabilities at fair value through Income Statement 2,525 7,867 - 10,392 2,749 7,543 - 10,292Derivative liabilities 192 30,036 102 30,330 38 39,819 64 39,921Life investment contracts - 7,374 565 7,939 - 8,582 - 8,582Total financial liabilities measured at fair value 2,717 45,277 667 48,661 2,787 55,944 64 58,795
BankFair Value as at 30 June 2017 Fair Value as at 30 June 2016
Level 1 Level 2 Level 3 Total Level 1 Level 2 Level 3 Total
$M $M $M $M $M $M $M $M
Financial assets measured at fair value on a recurring basisAssets at fair value through Income Statement:
Trading 23,866 7,261 - 31,127 22,731 10,254 - 32,985Other - 796 - 796 - 1,187 - 1,187
Derivative assets 55 31,972 67 32,094 16 46,449 60 46,525Available-for-sale investments 71,206 7,674 139 79,019 68,190 7,870 301 76,361Bills Discounted 7,486 - - 7,486 10,507 - - 10,507Total financial assets measured at fair value 102,613 47,703 206 150,522 101,444 65,760 361 167,565
Financial liabilities measured at fair value on a recurring basisLiabilities at fair value through Income Statement 2,525 6,464 - 8,989 2,749 4,692 - 7,441Derivative liabilities 192 31,878 103 32,173 33 43,781 70 43,884Total financial liabilities measured at fair value 2,717 38,342 103 41,162 2,782 48,473 70 51,325
129
Notes to the financial statements

184 Notes to the financial statements 3
Note 40 Disclosures about Fair Values (continued) (c) Analysis of Movements between Fair Value Hierarchy LevelsDuring the year ended 30 June 2017, the Group reclassified $752 million of available-for-sale securities (30 June 2016: $547 million) from Level 2 to Level 1. The Group also had insurance assets reclassifications of $488 million (30 June 2016: $628 million) from Level 1 to Level 2. There were $20 million trading security reclassifications (30 June 2016: nil) from Level 2 to Level 1, due to changes in the observability of inputs. The tables below summarise movements in Level 3 balance during the year. Transfers have been reflected as if they had taken place at the end of the reporting periods. Transfers in and out of level 3 were due to changes in the observability of inputs.
Level 3 Movement Analysis for the year ended 30 June 2017 Group
Available LifeInsurance Derivative for Sale Derivative Investment
Assets Assets Investments Liabilities Contracts$M $M $M $M $M
As at 1 July 2015 - 80 115 (23) -Purchases - 13 4 - -Sales/Settlements - - (104) (46) -Gains/(losses) in the period:
Recognised in the Income Statement - (33) (2) 5 -Recognised in the Statement of Comprehensive Income - - - - -
Transfers in - - 305 - -Transfers out - - (17) - -As at 30 June 2016 - 60 301 (64) -
Gains/(losses) recognised in the Income Statement for financial instruments held as at 30 June 2016 - - 1 - -
As at 1 July 2016 - 60 301 (64) -Purchases - 3 - - -Sales/Settlements - - (160) 29 -Gains/(losses) in the period:
Recognised in the Income Statement - (4) - 6 -Recognised in the Statement of Comprehensive Income - - (2) - -
Transfers in 1,530 8 - (73) (565)Transfers out - - - - -As at 30 June 2017 1,530 67 139 (102) (565)
Gains/(losses) recognised in the Income Statement for financial instruments held as at 30 June 2017 - (4) - 6 -
Financial Assets Financial Liabilities
The valuation of insurance assets directly impacts the life investment contracts they are backing. The Group’s exposure to other financial instruments measured at fair value based in full or in part on non-market observable inputs is restricted to a small number of financial instruments, which comprise an insignificant component of the portfolios to which they belong. As such, changes in fair value assumptions on all these instruments due to size or backing by policy holder funds generally have minimal impact on the Group’s Income Statement and Shareholders’ Equity.
Notes to the financial statements 185
Note 40 Disclosures about Fair Values (continued)Level 3 Movement Analysis for the year ended 30 June 2017 (continued)
BankFinancial
LiabilitiesAvailable
Derivative for Sale Derivative
Assets Investments Liabilities$M $M $M
As at 1 July 2015 80 115 (25)Purchases 14 4 -Sales/Settlements - (104) (46)Gains/(losses) in the period:
Recognised in the Income Statement (34) (2) 1Recognised in the Statement of Comprehensive Income - - -
Transfers in - 305 -Transfers out - (17) -As at 30 June 2016 60 301 (70)
Gains/(losses) recognised in the Income Statement for financialinstruments held as at 30 June 2016 - 1 -
As at 1 July 2016 60 301 (70)
Purchases 3 - -Sales/Settlements - (160) 32Gains/(losses) in the period:
Recognised in the Income Statement (4) - 8Recognised in the Statement of Comprehensive Income - (2) -
Transfers in 8 - (73)Transfers out - - -As at 30 June 2017 67 139 (103)
Gains/(losses) recognised in the Income Statement for financialinstruments held as at 30 June 2017 (4) - 8
Financial Assets
130
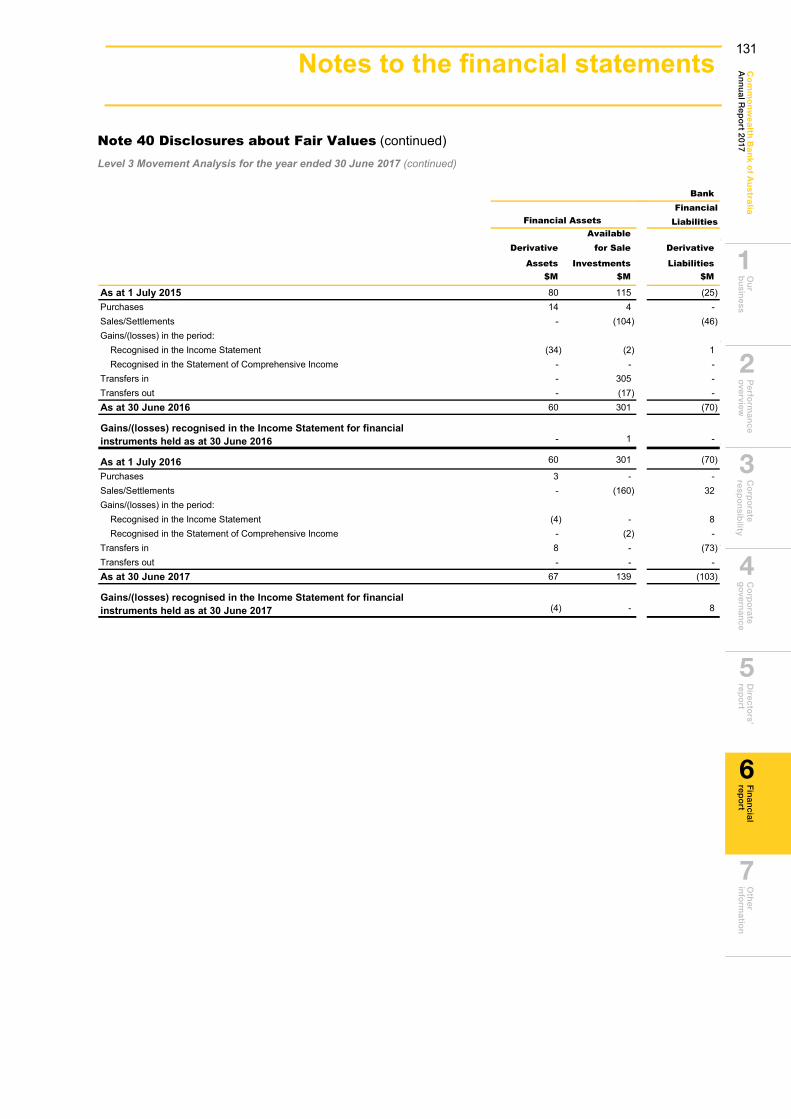
Ou
r b
usin
essP
erform
ance
overview
C
orp
orate
respo
nsib
ility C
orp
orate
go
vernan
ceD
irectors’
repo
rtO
ther
info
rmatio
nC
om
mo
nw
ea
lth Ba
nk o
f Au
stralia
An
nu
al Rep
ort 2017
Fin
ancial
repo
rt
6
2
1
3
4
5
7
Notes to the financial statements 185
Note 40 Disclosures about Fair Values (continued)Level 3 Movement Analysis for the year ended 30 June 2017 (continued)
BankFinancial
LiabilitiesAvailable
Derivative for Sale Derivative
Assets Investments Liabilities$M $M $M
As at 1 July 2015 80 115 (25)Purchases 14 4 -Sales/Settlements - (104) (46)Gains/(losses) in the period:
Recognised in the Income Statement (34) (2) 1Recognised in the Statement of Comprehensive Income - - -
Transfers in - 305 -Transfers out - (17) -As at 30 June 2016 60 301 (70)
Gains/(losses) recognised in the Income Statement for financialinstruments held as at 30 June 2016 - 1 -
As at 1 July 2016 60 301 (70)
Purchases 3 - -Sales/Settlements - (160) 32Gains/(losses) in the period:
Recognised in the Income Statement (4) - 8Recognised in the Statement of Comprehensive Income - (2) -
Transfers in 8 - (73)Transfers out - - -As at 30 June 2017 67 139 (103)
Gains/(losses) recognised in the Income Statement for financialinstruments held as at 30 June 2017 (4) - 8
Financial Assets
Notes to the financial statements 185
Note 40 Disclosures about Fair Values (continued) Level 3 Movement Analysis for the year ended 30 June 2017 (continued)
BankFinancial
Liabilities Available
Derivative for Sale Derivative
Assets Investments Liabilities$M $M $M
As at 1 July 2015 80 115 (25)Purchases 14 4 -Sales/Settlements - (104) (46)Gains/(losses) in the period:
Recognised in the Income Statement (34) (2) 1Recognised in the Statement of Comprehensive Income - - -
Transfers in - 305 -Transfers out - (17) -As at 30 June 2016 60 301 (70)
Gains/(losses) recognised in the Income Statement for financial instruments held as at 30 June 2016 - 1 -
As at 1 July 2016 60 301 (70)
Purchases 3 - -Sales/Settlements - (160) 32Gains/(losses) in the period:
Recognised in the Income Statement (4) - 8Recognised in the Statement of Comprehensive Income - (2) -
Transfers in 8 - (73)Transfers out - - -As at 30 June 2017 67 139 (103)
Gains/(losses) recognised in the Income Statement for financial instruments held as at 30 June 2017 (4) - 8
Financial Assets
131
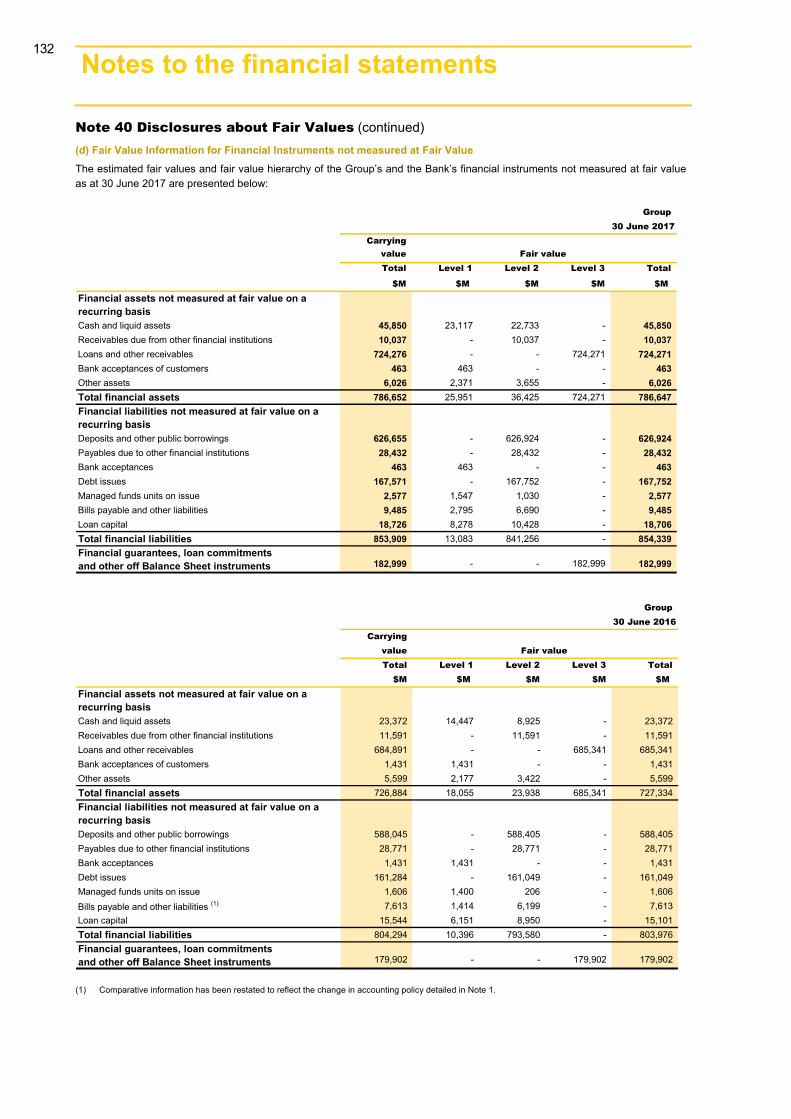
186 Notes to the financial statements 3
Note 40 Disclosures about Fair Values (continued) (d) Fair Value Information for Financial Instruments not measured at Fair ValueThe estimated fair values and fair value hierarchy of the Group’s and the Bank’s financial instruments not measured at fair value as at 30 June 2017 are presented below:
Group
Carryingvalue Fair valueTotal Level 1 Level 2 Level 3 Total
$M $M $M $M $M
Financial assets not measured at fair value on a recurring basisCash and liquid assets 45,850 23,117 22,733 - 45,850Receivables due from other financial institutions 10,037 - 10,037 - 10,037Loans and other receivables 724,276 - - 724,271 724,271Bank acceptances of customers 463 463 - - 463Other assets 6,026 2,371 3,655 - 6,026Total financial assets 786,652 25,951 36,425 724,271 786,647Financial liabilities not measured at fair value on a recurring basisDeposits and other public borrowings 626,655 - 626,924 - 626,924Payables due to other financial institutions 28,432 - 28,432 - 28,432Bank acceptances 463 463 - - 463Debt issues 167,571 - 167,752 - 167,752Managed funds units on issue 2,577 1,547 1,030 - 2,577Bills payable and other liabilities 9,485 2,795 6,690 - 9,485Loan capital 18,726 8,278 10,428 - 18,706Total financial liabilities 853,909 13,083 841,256 - 854,339Financial guarantees, loan commitmentsand other off Balance Sheet instruments 182,999 - - 182,999 182,999
30 June 2017
Group
Carryingvalue Fair valueTotal Level 1 Level 2 Level 3 Total
$M $M $M $M $M
Financial assets not measured at fair value on a recurring basisCash and liquid assets 23,372 14,447 8,925 - 23,372Receivables due from other financial institutions 11,591 - 11,591 - 11,591Loans and other receivables 684,891 - - 685,341 685,341Bank acceptances of customers 1,431 1,431 - - 1,431Other assets 5,599 2,177 3,422 - 5,599Total financial assets 726,884 18,055 23,938 685,341 727,334Financial liabilities not measured at fair value on a recurring basisDeposits and other public borrowings 588,045 - 588,405 - 588,405Payables due to other financial institutions 28,771 - 28,771 - 28,771Bank acceptances 1,431 1,431 - - 1,431Debt issues 161,284 - 161,049 - 161,049Managed funds units on issue 1,606 1,400 206 - 1,606Bills payable and other liabilities (1) 7,613 1,414 6,199 - 7,613Loan capital 15,544 6,151 8,950 - 15,101Total financial liabilities 804,294 10,396 793,580 - 803,976Financial guarantees, loan commitmentsand other off Balance Sheet instruments 179,902 - - 179,902 179,902
30 June 2016
(1) Comparative information has been restated to reflect the change in accounting policy detailed in Note 1.
132
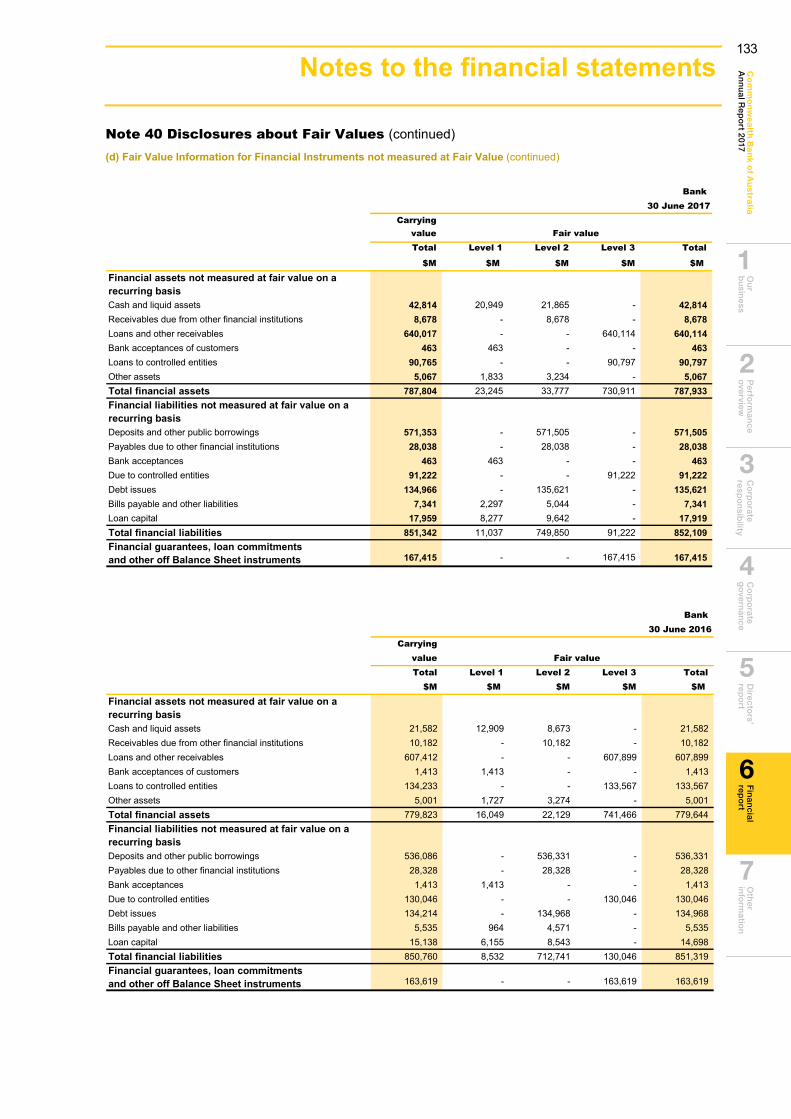
Ou
r b
usin
essP
erform
ance
overview
C
orp
orate
respo
nsib
ility C
orp
orate
go
vernan
ceD
irectors’
repo
rtO
ther
info
rmatio
nC
om
mo
nw
ea
lth Ba
nk o
f Au
stralia
An
nu
al Rep
ort 2017
Fin
ancial
repo
rt
6
2
1
3
4
5
7
187
Note 40 Disclosures about Fair Values (continued) (d) Fair Value Information for Financial Instruments not measured at Fair Value (continued)
Bank
Carryingvalue Fair valueTotal Level 1 Level 2 Level 3 Total
$M $M $M $M $M
Financial assets not measured at fair value on a recurring basisCash and liquid assets 42,814 20,949 21,865 - 42,814Receivables due from other financial institutions 8,678 - 8,678 - 8,678Loans and other receivables 640,017 - - 640,114 640,114Bank acceptances of customers 463 463 - - 463Loans to controlled entities 90,765 - - 90,797 90,797Other assets 5,067 1,833 3,234 - 5,067Total financial assets 787,804 23,245 33,777 730,911 787,933Financial liabilities not measured at fair value on a recurring basisDeposits and other public borrowings 571,353 - 571,505 - 571,505Payables due to other financial institutions 28,038 - 28,038 - 28,038Bank acceptances 463 463 - - 463Due to controlled entities 91,222 - - 91,222 91,222Debt issues 134,966 - 135,621 - 135,621Bills payable and other liabilities 7,341 2,297 5,044 - 7,341Loan capital 17,959 8,277 9,642 - 17,919Total financial liabilities 851,342 11,037 749,850 91,222 852,109Financial guarantees, loan commitmentsand other off Balance Sheet instruments 167,415 - - 167,415 167,415
30 June 2017
Bank
Carryingvalue Fair valueTotal Level 1 Level 2 Level 3 Total
$M $M $M $M $M
Financial assets not measured at fair value on a recurring basisCash and liquid assets 21,582 12,909 8,673 - 21,582Receivables due from other financial institutions 10,182 - 10,182 - 10,182Loans and other receivables 607,412 - - 607,899 607,899Bank acceptances of customers 1,413 1,413 - - 1,413Loans to controlled entities 134,233 - - 133,567 133,567Other assets 5,001 1,727 3,274 - 5,001Total financial assets 779,823 16,049 22,129 741,466 779,644Financial liabilities not measured at fair value on a recurring basisDeposits and other public borrowings 536,086 - 536,331 - 536,331Payables due to other financial institutions 28,328 - 28,328 - 28,328Bank acceptances 1,413 1,413 - - 1,413Due to controlled entities 130,046 - - 130,046 130,046Debt issues 134,214 - 134,968 - 134,968Bills payable and other liabilities 5,535 964 4,571 - 5,535Loan capital 15,138 6,155 8,543 - 14,698Total financial liabilities 850,760 8,532 712,741 130,046 851,319Financial guarantees, loan commitmentsand other off Balance Sheet instruments 163,619 - - 163,619 163,619
30 June 2016
133
Notes to the financial statements

188 Notes to the financial statements 3
Note 40 Disclosures about Fair Values (continued) (d) Fair Value Information for Financial Instruments not measured at Fair Value (continued)The fair values disclosed above represent estimates of prices at which these instruments could be sold or transferred in anorderly transaction between market participants. However, many of the instruments lack an available trading market and it is theintention to hold to maturity. Thus it is possible that realised amounts may differ to amounts disclosed above. Due to the widerange of valuation techniques and the numerous estimates that must be made, it may be difficult to make a reasonablecomparison of the fair value information disclosed here, against that disclosed by other financial institutions.The fair value estimates disclosed above have been derived as follows:
Loans and Other Receivables
The carrying value of loans and other receivables is net of accumulated collective and individually assessed provisions for impairment. Customer creditworthiness is regularly reviewed in line with the Group's credit policies and where necessary, pricing is adjusted in accordance with individual credit contracts. For the majority of variable rate loans, excluding impaired loans, the carrying amount is considered a reasonable estimate of fair value. For Institutional variable rate loans, the fair value is calculated using discounted cash flow models with a discount rate reflecting market rates offered on similar loans to customers with similar creditworthiness. The fair value of impaired loans is calculated by discounting estimated future cash flows using the loan's market interest rate. The fair value of fixed rate loans is calculated using discounted cash flow models where the discount rate reflects market rates offered for loans of similar remaining maturities and creditworthiness as the customer.
Deposits and Other Public Borrowings
Fair value of non-interest bearing, call and variable rate deposits, and fixed rate deposits repricing within six months, approximate their carrying value as they are short-term in nature or payable on demand. Fair value of term deposits are estimated using discounted cash flows, applying market rates offered for deposits of similar remaining maturities.
Debt Issues and Loan Capital
The fair values are calculated using quoted market prices, where available. Where quoted market prices are not available, discounted cash flow and option pricing models are used. The discount rate applied reflects the terms of the instrument, the timing of the cash flows and is adjusted for any change in the Group's applicable credit rating.
Other Financial Assets and Liabilities
For all other financial assets and liabilities fair value approximates carrying value due to their short-term nature, frequent repricing or high credit rating.
Note 41 Securitisation, Covered Bonds and Transferred Assets Transfer of Financial Assets In the normal course of business the Group enters into transactions by which it transfers financial assets to counterparties or directly to Special Purpose Vehicles (SPVs). These transfers do not give rise to derecognition of those financial assets for the Group.
Repurchase Agreements Securities sold under agreement to repurchase are retained on the Balance Sheet when substantially all the risks and rewards of ownership remain with the Group, and the counterparty liability is included separately on the Balance Sheet when cash consideration is received.
Securitisation Programs Residential mortgages securitised under the Group’s securitisation programs are equitably assigned to bankruptcy remote Special Purpose Vehicles (SPVs). The Group is entitled to any residual income of the securitisation program after all payments due to investors have been met. In addition, where derivatives are transacted between the SPV and the Bank, such that the Bank retains exposure to the variability in cash flows from the transferred residential mortgages, the mortgages will continue to be recognised on the Bank’s Balance Sheet. The investors have full recourse only to the residential mortgages segregated into an SPV. The Bank’s access to residential mortgages transferred to the SPV are subject to the conditions set out in the transaction documents.
Covered Bonds Programs To complement the existing wholesale funding sources, the Group has established two global covered bond programs for the Bank and ASB. Certain residential mortgages have been assigned to a bankruptcy remote SPV associated with covered bond programs to provide security for the obligations payable on the covered bonds issued by the Group. Similarly to securitisation programs, the Group is entitled to any residual income after all payments due to covered bonds investors have been met. As the Bank retains substantially all of the risks and rewards associated with the mortgages through derivatives transacted with the SPV, the Bank and ASB continue to recognise the mortgages on its Balance Sheet. The covered bond holders have dual recourse to the Bank and the covered pool assets. The Bank may repurchase loans from the SPV, subject to the conditions set out in the transaction documents.
134

Ou
r b
usin
essP
erform
ance
overview
C
orp
orate
respo
nsib
ility C
orp
orate
go
vernan
ceD
irectors’
repo
rtO
ther
info
rmatio
nC
om
mo
nw
ea
lth Ba
nk o
f Au
stralia
An
nu
al Rep
ort 2017
Fin
ancial
repo
rt
6
2
1
3
4
5
7
189
Note 41 Securitisation, Covered Bonds and Transferred Assets (continued) At the Balance Sheet date, transferred financial assets that did not qualify for derecognition and their associated liabilities are as follows:
GroupRepurchaseAgreements Covered Bonds Securitisation
2017 2016 2017 2016 2017 2016$M $M $M $M $M $M
Carrying amount of transferred assets 16,270 17,180 31,796 36,770 15,108 13,863Carrying amount of associated liabilities (1) 16,270 17,180 28,984 31,802 13,771 12,106For those liabilities that have recourse only to the transferred assets:
Fair value of transferred assets 15,116 13,874Fair value of associated liabilities 13,771 12,106
Net position 1,345 1,768
BankRepurchaseAgreements Covered Bonds Securitisation
2017 2016 2017 2016 2017 2016$M $M $M $M $M $M
Carrying amount of transferred assets 16,501 17,361 26,414 30,907 59,985 94,369Carrying amount of associated liabilities (2) 16,501 17,361 24,644 27,863 59,985 94,369For those liabilities that have recourse only to the transferred assets:
Fair value of transferred assets 60,020 94,433Fair value of associated liabilities 59,985 94,369
Net position 35 64
(1) Securitisation liabilities of the Group include RMBS notes issued by securitisation SPVs and held by external investors.(2) Securitisation liabilities of the Bank include borrowings from securitisation SPVs, including the SPVs that issue only internally held notes for repurchase
with central banks, recognised on transfer of residential mortgages by the Bank. The carrying amount of associated liabilities from securitisation SPVs is recorded under loans of controlled entities in Note 38.
Note 42 Collateral Arrangements Collateral Accepted as Security for Assets The Group takes collateral where it is considered necessary to support both on and off Balance Sheet financial instruments. The Group evaluates each customer’s creditworthiness on a case-by-case basis. The amount of collateral taken, if deemed necessary, is based on management’s credit evaluation of the counterparty. The Group has the right to sell, re-pledge, or otherwise use some of the collateral received. At Balance Sheet date the carrying value of cash accepted as collateral (and recognised on the Group’s and the Bank’s Balance Sheets) and the fair value of securities accepted as collateral (but not recognised on the Group’s or the Bank’s Balance Sheets) were as follows:
Group Bank2017 2016 2017 2016
$M $M $M $M
Cash 7,280 12,172 7,042 11,856Securities 22,733 8,925 21,865 8,673Collateral held 30,013 21,097 28,907 20,529
Collateral held which is re-pledged or sold - - - -
Assets Pledged As part of standard terms of transactions with other banks, the Group has provided collateral to secure liabilities. At Balance Sheet date, the carrying value of assets pledged as collateral to secure liabilities is as follows:
Group Bank2017 2016 2017 2016
$M $M $M $M
Cash 6,307 7,865 5,607 7,016Securities (1) 16,360 17,228 16,591 17,411Assets pledged 22,667 25,093 22,198 24,427
Asset pledged which can be re-pledged or re-sold by counterparty 16,360 17,228 16,591 17,411
(1) These balances include assets sold under repurchase agreements. The liabilities related to these repurchase agreements are disclosed in Note 17.
The Group and the Bank have pledged collateral as part of entering repurchase and derivative agreements. These transactions are governed by standard industry agreements.
135
Notes to the financial statements

Not
es to
the
finan
cial
sta
tem
ents
3
190
Not
e 43
Off
sett
ing
Fina
ncia
l Ass
ets
and
Fina
ncia
l Lia
bilit
ies
The
tabl
e be
low
iden
tifie
s am
ount
s th
at h
ave
been
offs
et o
n th
e Ba
lanc
e Sh
eet a
nd a
mou
nts
cove
red
by e
nfor
ceab
le n
ettin
g ar
rang
emen
ts o
r sim
ilar a
gree
men
ts th
at d
o no
t qua
lify
for s
et o
ff. C
ash
settl
ed
deriv
ativ
es th
at tr
ade
on a
n ex
chan
ge a
re d
eem
ed to
be
econ
omic
ally
set
tled
and
ther
efor
e ou
tsid
e th
e sc
ope
of th
ese
disc
losu
res.
G
roup
30 J
une
2017
Am
ount
s of
fset
on
the
Bal
ance
She
etA
mou
nts
not
offs
et o
n th
e B
alan
ce S
heet
Gro
ss B
alan
ceR
epor
ted
on t
heFi
nanc
ial
Fina
ncia
l Col
late
ral
Not
sub
ject
to
Tot
al B
alan
ceS
heet
Am
ount
Am
ount
off
set
Bal
ance
She
etIn
stru
men
ts (1
)(R
ecei
ved)
/ Ple
dged
(1)
Net
Am
ount
Net
ting
Agr
eem
ents
She
et a
mou
nt
Fina
ncia
l Ins
trum
ents
$M$M
$M$M
$M$M
$M$M
Der
ivat
ive
asse
ts33
,909
(5,5
01)
28,4
08(1
8,14
7)(6
,236
)4,
025
3,31
631
,724
Secu
ritie
s pu
rcha
sed
unde
r agr
eem
ents
to
rese
ll22
,733
-22
,733
(1,2
57)
(21,
289)
187
-22
,733
Equi
ty s
ecur
ities
sol
d no
t del
iver
ed
568
(213
)35
5-
-35
5-
355
Tota
l fin
anci
al a
sset
s57
,210
(5,7
14)
51,4
96(1
9,40
4)(2
7,52
5)4,
567
3,31
654
,812
Der
ivat
ive
liabi
litie
s(3
5,83
2)8,
383
(27,
449)
18,1
475,
448
(3,8
54)
(2,8
81)
(30,
330)
Secu
ritie
s so
ld u
nder
agr
eem
ents
to
repu
rcha
se(1
6,27
0)-
(16,
270)
1,25
715
,013
--
(16,
270)
Equi
ty s
ecur
ities
pur
chas
ed n
ot d
eliv
ered
(6
30)
213
(417
)-
-(4
17)
-(4
17)
Tota
l fin
anci
al li
abili
ties
(52,
732)
8,59
6(4
4,13
6)19
,404
20,4
61(4
,271
)(2
,881
)(4
7,01
7)
Sub
ject
to
Enf
orce
able
Mas
ter
Net
ting
or
Sim
ilar
Agr
eem
ents
Gro
up30
Jun
e 20
16
Am
ount
s of
fset
on
the
Bal
ance
She
etA
mou
nts
not
offs
et o
n th
e B
alan
ce S
heet
Gro
ss B
alan
ceR
epor
ted
on t
heFi
nanc
ial
Fina
ncia
l Col
late
ral
Not
sub
ject
to
Tot
al B
alan
ceS
heet
Am
ount
Am
ount
off
set
Bal
ance
She
etIn
stru
men
ts (1
)(R
ecei
ved)
/ Ple
dged
(1)
Net
Am
ount
Net
ting
Agr
eem
ents
She
et a
mou
nt
Fina
ncia
l Ins
trum
ents
$M$M
$M$M
$M$M
$M$M
Der
ivat
ive
asse
ts48
,681
(7,7
95)
40,8
86(2
3,07
7)(1
1,17
3)6,
636
5,68
146
,567
Secu
ritie
s pu
rcha
sed
unde
r agr
eem
ents
to
rese
ll8,
925
-8,
925
(489
)(8
,427
)9
-8,
925
Equi
ty s
ecur
ities
sol
d no
t del
iver
ed
915
(531
)38
4-
-38
4-
384
Tota
l fin
anci
al a
sset
s58
,521
(8,3
26)
50,1
95(2
3,56
6)(1
9,60
0)7,
029
5,68
155
,876
Der
ivat
ive
liabi
litie
s(4
7,62
2)11
,479
(36,
143)
23,0
777,
421
(5,6
45)
( 3,7
78)
(39,
921)
Secu
ritie
s so
ld u
nder
agr
eem
ents
to
repu
rcha
se(1
7,18
0)-
(17,
180)
489
16,6
91-
-(1
7,18
0)
Equi
ty s
ecur
ities
pur
chas
ed n
ot d
eliv
ered
(9
88)
531
(457
)-
-(4
57)
-(4
57)
Tota
l fin
anci
al li
abili
ties
(65,
790)
12,0
10(5
3,78
0)23
,566
24,1
12(6
,102
)(3
,778
)(5
7,55
8)
Sub
ject
to
Enf
orce
able
Mas
ter
Net
ting
or
Sim
ilar
Agr
eem
ents
(1)
For
the
purp
ose
of th
is d
iscl
osur
e, th
e re
late
d am
ount
s of
fina
ncia
l ins
trum
ents
and
fina
ncia
l col
late
ral n
ot s
et o
ff on
the
Bala
nce
Shee
t hav
e be
en c
appe
d by
rel
evan
t net
ting
agre
emen
ts s
o as
not
to e
xcee
d th
e ne
t am
ount
s of
fina
ncia
l ass
ets/
(liab
ilitie
s) re
porte
d on
the
Bala
nce
Shee
t, i.e
. ove
r-col
late
ralis
atio
n, w
here
it e
xist
s, is
not
refle
cted
in th
e ta
bles
. As
a re
sult
the
abov
e co
llate
ral b
alan
ces
will
not c
orre
spon
d to
the
tabl
es in
Not
e 42
.
136

Ou
r b
usin
essP
erform
ance
overview
C
orp
orate
respo
nsib
ility C
orp
orate
go
vernan
ceD
irectors’
repo
rtO
ther
info
rmatio
nC
om
mo
nw
ea
lth Ba
nk o
f Au
stralia
An
nu
al Rep
ort 2017
Fin
ancial
repo
rt
6
2
1
3
4
5
7
191
Not
es to
the
finan
cial
sta
tem
ents
191
Not
e 43
Off
sett
ing
Fina
ncia
l Ass
ets
and
Fina
ncia
l Lia
bilit
ies
Ban
k30
Jun
e 20
17
Am
ount
s of
fset
on
the
Bal
ance
She
etA
mou
nts
not
offs
et o
n th
e B
alan
ce S
heet
Gro
ss B
alan
ceR
epor
ted
on t
heFi
nanc
ial
Fina
ncia
l Col
late
ral
Not
sub
ject
to
Tot
al B
alan
ceS
heet
Am
ount
Am
ount
off
set
Bal
ance
She
etIn
stru
men
ts (1
)(R
ecei
ved)
/ Ple
dged
(1)
Net
Am
ount
Net
ting
Agr
eem
ents
She
et a
mou
nt
Fina
ncia
l Ins
trum
ents
$M$M
$M$M
$M$M
$M$M
Der
ivat
ive
asse
ts34
,517
(5,5
01)
29,0
16(1
8,93
6)(6
,133
)3,
947
3,07
832
,094
Secu
ritie
s pu
rcha
sed
unde
r agr
eem
ents
to
rese
ll21
,865
-21
,865
(1,2
85)
(20,
420)
160
-21
,865
Tota
l fin
anci
al a
sset
s56
,382
(5,5
01)
50,8
81(2
0,22
1)(2
6,55
3)4,
107
3,07
853
,959
Der
ivat
ive
liabi
litie
s(3
7,45
0)8,
383
(29,
067)
18,9
364,
702
(5,4
29)
(3,1
06)
(32,
173)
Secu
ritie
s so
ld u
nder
agr
eem
ents
to
repu
rcha
se(1
6,50
1)-
(16,
501)
1,28
515
,216
--
(16,
501)
Tota
l fin
anci
al li
abili
ties
(53,
951)
8,38
3(4
5,56
8)20
,221
19,9
18(5
,429
)(3
,106
)(4
8,67
4)
Sub
ject
to
Enf
orce
able
Mas
ter
Net
ting
or
Sim
ilar
Agr
eem
ents
Ban
k30
Jun
e 20
16
Am
ount
s of
fset
on
the
Bal
ance
She
etA
mou
nts
not
offs
et o
n th
e B
alan
ce S
heet
Gro
ss B
alan
ceR
epor
ted
on t
heFi
nanc
ial
Fina
ncia
l Col
late
ral
Not
sub
ject
to
Tot
al B
alan
ceS
heet
Am
ount
Am
ount
off
set
Bal
ance
She
etIn
stru
men
ts (1
)(R
ecei
ved)
/ Ple
dged
(1)
Net
Am
ount
Net
ting
Agr
eem
ents
She
et a
mou
nt
Fina
ncia
l Ins
trum
ents
$M$M
$M$M
$M$M
$M$M
Der
ivat
ive
asse
ts48
,975
(7,7
95)
41,1
80(2
3,65
3)(1
1,02
2)6,
505
5,34
546
,525
Secu
ritie
s pu
rcha
sed
unde
r agr
eem
ents
to
rese
ll8,
673
-8,
673
(489
)(8
,175
)9
-8,
673
Tota
l fin
anci
al a
sset
s57
,648
(7,7
95)
49,8
53(2
4,14
2)(1
9,19
7)6,
514
5,34
555
,198
Der
ivat
ive
liabi
litie
s(5
1,57
8)11
,479
(40,
099)
23,6
536,
607
(9,8
39)
(3,7
85)
(43,
884)
Secu
ritie
s so
ld u
nder
agr
eem
ents
to
repu
rcha
se
(17,
361)
-(1
7,36
1)48
916
,872
--
(17,
361)
Tota
l fin
anci
al li
abili
ties
(68,
939)
11,4
79(5
7,46
0)24
,142
23,4
79(9
,839
)(3
,785
)(6
1,24
5)
Sub
ject
to
Enf
orce
able
Mas
ter
Net
ting
or
Sim
ilar
Agr
eem
ents
(1)
For
the
purp
ose
of th
is d
iscl
osur
e, th
e re
late
d am
ount
s of
fina
ncia
l ins
trum
ents
and
fina
ncia
l col
late
ral n
ot s
et o
ff on
the
Bala
nce
Shee
t hav
e be
en c
appe
d by
rel
evan
t net
ting
agre
emen
ts s
o as
not
to e
xcee
d th
e ne
t am
ount
s of
fina
ncia
l ass
ets/
(liab
ilitie
s) re
porte
d on
the
Bala
nce
Shee
t, i.e
. ove
r-col
late
ralis
atio
n, w
here
it e
xist
s, is
not
refle
cted
in th
e ta
bles
. As
a re
sult
the
abov
e co
llate
ral b
alan
ces
will
not c
orre
spon
d to
the
tabl
es in
Not
e 42
.
137
Notes to the financial statements 192
Note 43 Offsetting Financial Assets and Financial Liabilities including Collateral Arrangements (continued) Related Amounts not Set Off on the Balance Sheet
Derivative Assets and Liabilities
The “Financial Instruments” column identifies financial assets and liabilities that are subject to set off under netting agreements, such as the ISDA Master Agreement. All outstanding transactions with the same counterparty can be offset and close-out netting applied if an event of default or other predetermined events occur. Financial collateral refers to cash and non-cash collateral obtained to cover the net exposure between counterparties by enabling the collateral to be realised in an event of default or if other predetermined events occur.
Repurchase and Reverse Repurchase Agreements and Security Lending Agreements
The “Financial Instruments” column identifies financial assets and liabilities that are subject to set off under netting agreements, such as global master repurchase agreements and global master securities lending agreements. Under these netting agreements, all outstanding transactions with the same counterparty can be offset and close-out netting applied if an event of default or other predetermined events occur. Financial collateral typically comprises highly liquid securities which are legally transferred and can be liquidated in the event of counterparty default.
Note 44 Subsequent Events The Bank expects the DRP for the final dividend for the year ended 30 June 2017 will be satisfied by the issue of shares of approximately $1.4 billion.
AUSTRAC Civil Proceedings
On 3 August 2017, Australian Transaction Reports and Analysis Centre (AUSTRAC) commenced civil penalty proceedings against CBA. CBA takes the allegations made by AUSTRAC very seriously and will file a defence in relation to this matter, which will take significant time to prepare. The actual outcome in this matter will be determined by a Court in accordance with established legal principles. The AUSTRAC statement of claim relates to alleged past and ongoing contraventions of four provisions of the Anti-Money Laundering and Counter-Terrorism Financing Act 2006 (Cth). To the extent that contraventions may be established, a Court will ordinarily take into account a range of factors in setting penalties. One factor is the extent to which any contraventions arise from a single course of conduct. For example, AUSTRAC alleges that approximately 53,000 threshold transaction reports were lodged late. Late lodgement carries a penalty of up to $18 million. However, these alleged contraventions could be considered to arise from a single course of conduct to the extent that they emanated from the same systems error. Ultimately, a Court will seek to ensure that, overall, any civil penalties are just and appropriate and do not exceed what is proper having regard to the totality of established contraventions. Under the Act, the only mechanism available to AUSTRAC to secure a pecuniary penalty from CBA is by taking court action. What we can say about these proceedings is limited until they have run their course. CBA is reviewing the allegations in the 580 page statement of claim and at this time it is not possible to reliably estimate the possible financial effect on the Group. It is not appropriate to disclose any detailed information about the subject matter of the claims as court proceedings are on foot and such information would be highly likely to be prejudicial to our position.
Aussie Home Loan Acquisition
On 4 August 2017, John Symond exercised his put option, which will require the Group to acquire a 20% interest in AHL. The purchase price for the remaining 20% interest will be determined in accordance with the terms agreed in 2012. The purchase consideration will be paid in the issue of CBA shares. The Group will consolidate AHL from completion of the acquisition which is currently expected to be in late August 2017.
Strategic Corporate Actions
We are committed to securing and enhancing the financial wellbeing of people, businesses and communities, and the provision of insurance products to our customers remains core to that vision. CommInsure and Sovereign are strong businesses with scale, expertise, competitive products and access to attractive distribution channels. We are in discussions with third parties in relation to their potential interest in our life insurance businesses in Australia and New Zealand. The outcome of those discussions is uncertain. While the discussions may lead to the divestment of those businesses, we will also consider a full range of alternatives, including retaining the businesses, reinsurance arrangements or other strategic options.
The Directors are not aware of any other matter or circumstance that has occurred since the end of the financial year that has significantly affected or may significantly affect the operations of the Group, the results of those operations or the state of affairs of the Group in subsequent financial years.
138

Ou
r b
usin
essP
erform
ance
overview
C
orp
orate
respo
nsib
ility C
orp
orate
go
vernan
ceD
irectors’
repo
rtO
ther
info
rmatio
nC
om
mo
nw
ea
lth Ba
nk o
f Au
stralia
An
nu
al Rep
ort 2017
Fin
ancial
repo
rt
6
2
1
3
4
5
7
193
Directors’ declaration 193
In accordance with a resolution of the Directors of the Commonwealth Bank of Australia (Bank), the Directors declare that:
(a) the Financial Statements and the accompanying notes for the financial year ended 30 June 2017 in relation to the Bank andthe consolidated entity (Group) are in accordance with the Corporations Act 2001, including:(i) s 296 (which requires the Financial Report, including the Financial Statements and the notes to the Financial
Statements, to comply with the accounting standards); and(ii) s 297 (which requires the Financial Statements, and the notes to the Financial Statements, to give a true and fair view
of the financial position and performance of the Group and the Bank);
(b) in compliance with the accounting standards, the notes to the Financial Statements include an explicit and unreservedstatement of compliance with International Financial Reporting Standards (see Note 1(a)); and
(c) in the opinion of the Directors, there are reasonable grounds to believe that the Bank will be able to pay its debts as andwhen they become due and payable.
The Directors have been given the declarations required by s 295A in respect of the financial year ended 30 June 2017.
Signed in accordance with a resolution of the Directors.
Catherine Livingstone AO Chairman 8 August 2017
Ian Narev Managing Director and Chief Executive Officer 8 August 2017
139

194
PricewaterhouseCoopers, ABN 52 780 433 757 One International Towers Sydney, Watermans Quay, Barangaroo, GPO Box 2650, Sydney, NSW 2001 T: +61 2 8266 0000, F: +61 2 8266 9999, www.pwc.com.au Liability limited by a scheme approved under Professional Standards Legislation.
Independent auditor’s report to the members of Commonwealth Bank of Australia
Report on the audit of the financial report
Our opinion on the financial report In our opinion the accompanying financial report of Commonwealth Bank of Australia (the ‘Company’) and its controlled entities (together ‘the Group’) is in accordance with the Corporations Act 2001, including:
giving a true and fair view of the Company and the Group’s financial positions as at 30 June 2017 and oftheir financial performance for the year then ended; and
complying with Australian Accounting Standards and the Corporations Regulations 2001.
What we have audited The Company and Group financial report comprises:
the Company and the Group’s balance sheets as at 30 June 2017; the Company and the Group’s income statements for the year then ended; the Company and the Group’s statements of comprehensive income for the year then ended; the Company and the Group’s statements of changes in equity for the year then ended; the Company and the Group’s statements of cash flows for the year then ended; the notes to the financial statements, which include a summary of significant accounting policies; and the directors’ declaration.
Basis for opinion We conducted our audit in accordance with Australian Auditing Standards. Our responsibilities under those standards are further described in the Auditor’s responsibilities for the audit of the financial report section of our report. We believe that the audit evidence we have obtained is sufficient and appropriate to provide a basis for our opinion.
Independence We are independent of the Group in accordance with the auditor independence requirements of the Corporations Act 2001 and the ethical requirements of the Accounting Professional and Ethical Standards Board’s APES 110 Code of Ethics for Professional Accountants (the Code) that are relevant to our audit of the financial report in Australia. We have also fulfilled our other ethical responsibilities in accordance with the Code.
Our audit approach An audit is designed to provide reasonable assurance about whether the financial report is free from material misstatement. Misstatements may arise due to fraud or error. They are considered material if individually or in aggregate, they could reasonably be expected to influence the economic decisions of users taken on the basis of the financial report.
We tailored the scope of our audit to ensure that we performed enough work to be able to give an opinion on the financial report as a whole, taking into account the geographic and management structure of the Group, its accounting processes and controls, and the financial services industry and the broader economies in which the Group operates. We also ensured that the audit team had the appropriate skills and competencies needed for the audit of a complex banking group. This included industry expertise in retail, business and institutional banking and wealth management services, as well as specialists and experts in IT, actuarial, tax, treasury and valuation.
The Group is structured into 7 business segments being Retail Banking Services (RBS), Business and Private Banking (B&PB), Institutional Banking and Markets (IB&M), Wealth Management (WM), New Zealand (NZ), Bankwest (BW), International Financial Services and Other (IFS and Other).
140
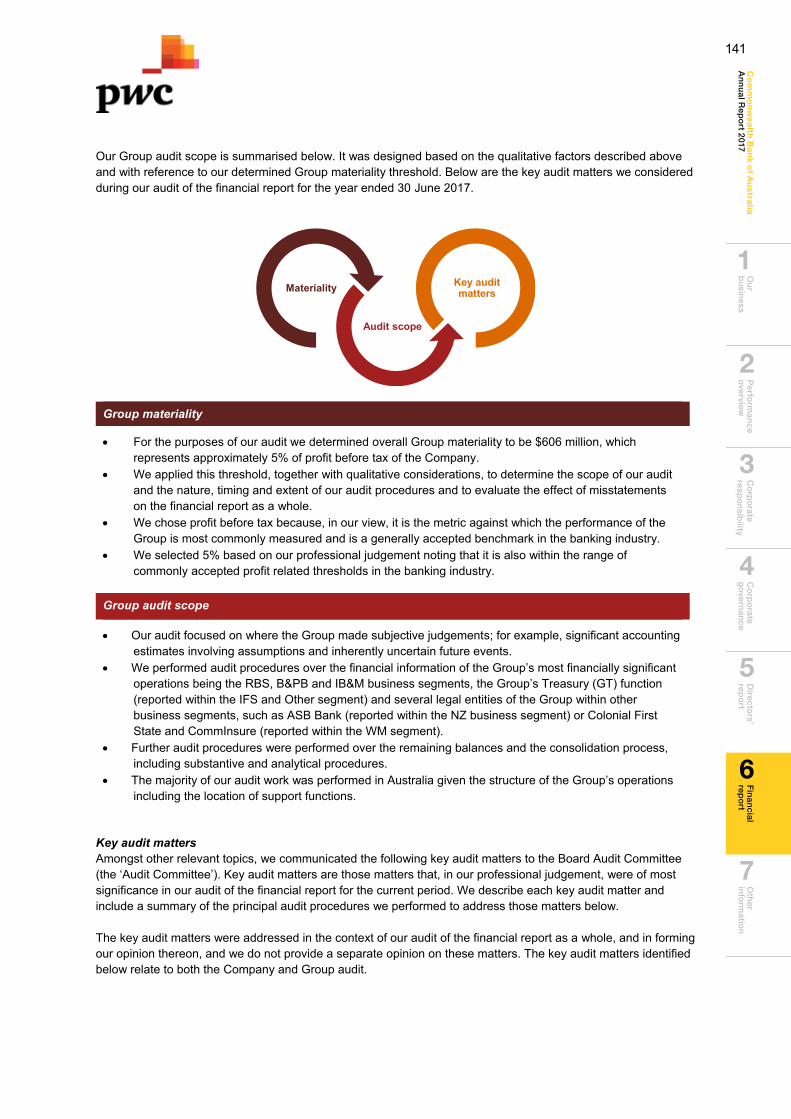
Ou
r b
usin
essP
erform
ance
overview
C
orp
orate
respo
nsib
ility C
orp
orate
go
vernan
ceD
irectors’
repo
rtO
ther
info
rmatio
nC
om
mo
nw
ea
lth Ba
nk o
f Au
stralia
An
nu
al Rep
ort 2017
Fin
ancial
repo
rt
6
2
1
3
4
5
7
195
Our Group audit scope is summarised below. It was designed based on the qualitative factors described above and with reference to our determined Group materiality threshold. Below are the key audit matters we considered during our audit of the financial report for the year ended 30 June 2017.
Group materiality
For the purposes of our audit we determined overall Group materiality to be $606 million, whichrepresents approximately 5% of profit before tax of the Company.
We applied this threshold, together with qualitative considerations, to determine the scope of our auditand the nature, timing and extent of our audit procedures and to evaluate the effect of misstatementson the financial report as a whole.
We chose profit before tax because, in our view, it is the metric against which the performance of theGroup is most commonly measured and is a generally accepted benchmark in the banking industry.
We selected 5% based on our professional judgement noting that it is also within the range ofcommonly accepted profit related thresholds in the banking industry.
Group audit scope
Our audit focused on where the Group made subjective judgements; for example, significant accountingestimates involving assumptions and inherently uncertain future events.
We performed audit procedures over the financial information of the Group’s most financially significantoperations being the RBS, B&PB and IB&M business segments, the Group’s Treasury (GT) function(reported within the IFS and Other segment) and several legal entities of the Group within otherbusiness segments, such as ASB Bank (reported within the NZ business segment) or Colonial FirstState and CommInsure (reported within the WM segment).
Further audit procedures were performed over the remaining balances and the consolidation process,including substantive and analytical procedures.
The majority of our audit work was performed in Australia given the structure of the Group’s operationsincluding the location of support functions.
Key audit matters Amongst other relevant topics, we communicated the following key audit matters to the Board Audit Committee (the ‘Audit Committee’). Key audit matters are those matters that, in our professional judgement, were of most significance in our audit of the financial report for the current period. We describe each key audit matter and include a summary of the principal audit procedures we performed to address those matters below.
The key audit matters were addressed in the context of our audit of the financial report as a whole, and in forming our opinion thereon, and we do not provide a separate opinion on these matters. The key audit matters identified below relate to both the Company and Group audit.
Materiality
Audit scope
Key audit matters
141

196
Key audit matter How our audit addressed the key audit matter
Provision for impairment of lending assets (Relevant business segments: RBS, B&PB, IB&M, NZ)
We considered this a key audit matter due to the subjective judgements made by management in determining when to recognise impairment provisions against lending assets and in estimating the size of such provisions.
Provisions for impairment of loans that exceed specific thresholds are individually assessed by management. These provisions are established based on the expected future cash repayments and estimated proceeds from the value of the collateral held by the Group in respect of those loans. During the financial year ended 30 June 2017, the majority of the Group’s individually assessed provisions for specific lending assets related primarily to business and corporate loans.
If an individually assessed loan is not impaired, it is then included in a group of loans with similar risk characteristics and, along with those loans below the specific thresholds noted above, is collectively assessed on a portfolio basis using models developed by management. These models use assumptions in their calculations which are based on the Group’s historical loss experience including both the frequency of defaults and the losses incurred where loans have defaulted.
Adjustments or overlays to the provisions are applied by management to take account of emerging trends and where models may fail to fully capture all risks in the loan portfolio. An example of an overlay is one which allows for the impact of the current macroeconomic environment (such as residential and consumer lending in mining towns). These overlays require significant judgement.
Relevant references in the financial report Refer notes 1 and 13 for further information.
We developed an understanding of the controls relevant to our audit over the following areas and assessed whether they were appropriately designed and were operating effectively throughout the year:
· Identification of impaired loans;· Reliability and integrity of credit information
maintained in the Group’s systems;· Transfer of data from the underlying source
systems to the impairment provisioningmodels; and
· Management’s assessment of the integrity ofthese models.
For a selection of individually assessed provisions for specific lending assets, we performed amongst others the following audit procedures:
· Examined management’s cashflow forecastssupporting the impairment calculation byassessing key judgements (in particular theamount and timing of recoveries) made bymanagement in the context of the borrowers’circumstances based on the detailed loan andcounterparty information known by the Group;and
· Compared key inputs in management’sestimates (such as valuation of collateral held)to external information where available.
To test the collectively assessed provisions, we together with our independent actuarial experts performed amongst others the following audit procedures:
· Tested the completeness and accuracy of keydata being transferred between the Group’ssystems and management’s collectiveprovisioning models;
· Compared management’s key assumptions tosupporting evidence and market practices;and
· Compared the modelled calculations to ourown calculated expectations on a samplebasis.
To assess the overlays to the provisions, we performed amongst others the following audit procedures:
· Considered management’s rationale for therecognition of overlays by considering thepotential for impairment to be affected by
142
Ou
r b
usin
essP
erform
ance
overview
C
orp
orate
respo
nsib
ility C
orp
orate
go
vernan
ceD
irectors’
repo
rtO
ther
info
rmatio
nC
om
mo
nw
ea
lth Ba
nk o
f Au
stralia
An
nu
al Rep
ort 2017
Fin
ancial
repo
rt
6
2
1
3
4
5
7
197
Key audit matter How our audit addressed the key audit matter
events not captured by management’s models; and
· Assessed management’s estimate of rangeson key drivers of credit loss using sensitivityanalysis. As part of this work, we consideredlocal and global external data to provideobjective support.
Determination of fair value for financial instruments (Relevant business segments: IB&M, GT, NZ)
The Group holds financial instruments representing 17% of the total assets and 5% of the total liabilities of the Group. The financial instruments held at fair value include:
· Derivative assets and liabilities;· Available for sale securities;· Life investment contracts; and· Bills discounted and other assets and liabilities
designated at fair value
The majority of the Group’s financial instruments are considered to be non-complex in nature as fair value is based on prices and rates that can be easily observed in the relevant markets. On this basis the majority of the Group’s financial instruments are classified under Australian Accounting Standards as either ‘Level 1’ (i.e. where key inputs to the valuation are based on quoted prices in the market) or ‘Level 2’ (i.e. where key inputs to the valuation are based on observable prices in the market). We considered these Level 1 and Level 2 financial instruments to be a key audit matter due to their financial significance to the Group.
The Group also holds a limited number of financial instruments considered to be ‘Level 3’ under Australian Accounting Standards in nature (i.e. where key inputs to the valuation require additional management judgement as observable inputs are not available in the market due to market illiquidity or complexity of the product) primarily in respect to complex derivatives, certain asset-backed securities and infrastructure funds. While the Group’s holdings of such instruments is limited relative to total financial instrument holdings, we considered their valuation to be a key audit matter because there is more judgement involved in determining their value.
Relevant references in the financial report Refer notes 1, 9, 10, 11, 18 and 40 for information.
We developed an understanding of the controls relevant to our financial statement audit over the following areas and assessed whether they were appropriately designed and were operating effectively throughout the year:
· Valuation model governance controlframework;
· Completeness and accuracy of data inputs;including sourcing independent market datainputs;
· Methodology for the determination of fair valueadjustments; and
· Management’s assessment of their ownmodels used to measure fair value.
In relation to the fair value of financial instruments as at 30 June 2017, together with our valuation experts, we compared the Group’s calculation of fair value to our own independent calculation across a sample of financial instruments. This involved sourcing independent inputs from market data providers and using our own valuation models. We considered the results to assess whether there was evidence of systemic bias or error in management’s calculation of fair value.
143
198
Key audit matter How our audit addressed the key audit matter
Provisions relating to conduct risk, litigation and regulatory action, including related disclosures (Relevant business segments: All)
We considered this a key audit matter as the Group is exposed to conduct risk related matters, legal cases and regulatory actions and investigations in various jurisdictions, which could give rise to significant liabilities of the Group.
In assessing and measuring such potential liabilities, management are required to make significant judgements based on available information in respect to the probability and estimation of potential financial outcomes. These outcomes may be dependent on legal and regulatory processes. Therefore provisions recognised and contingent liabilities disclosed are subject to inherent uncertainty.
In particular, management has had to assess the impact of civil penalty proceedings brought by the Australian Transactions Reports and Analysis Centre (AUSTRAC) on 3 August 2017 in respect to alleged contraventions of the Anti-Money Laundering and Counter-Terrorism Financing Act 2006 (Cth) as disclosed in Note 44 Subsequent Events in the financial report.
Relevant references in the financial report Refer notes 1, 19, 30 and 44 for further information.
Our procedures included amongst others developing an understanding of the Group’s processes for identifying and assessing the impact of conduct risk, legal and regulatory matters.
We read the minutes of the Group’s key governance meetings (i.e. Audit Committee, Risk Committee and Board of Directors), attended the Group’s Audit and Risk Committee meetings and considered key correspondence with relevant regulatory bodies.
We discussed ongoing legal and regulatory matters with management and sought and obtained written representations and access to relevant documents in order to develop our understanding of the matters. In relation to such matters we considered management’s judgement as to whether there is potential material financial exposure for the Group, and if so the amount of any provision required.
Where management determined that they were unable to reliably estimate the possible financial impact of a legal or regulatory action, we assessed the appropriateness of their conclusion. Our procedures included specific consideration of management’s treatment in the financial report of the civil penalty proceedings commenced by AUSTRAC.
In relation to all matters identified, we assessed the adequacy of related disclosures.
Valuation of insurance policyholder liabilities (Relevant business segments: WM, NZ)
We considered this a key audit matter because management’s valuation of the provisions for the settlement of future insurance claims involves complex and subjective judgements about future events, both internal and external to the business, for which small changes in assumptions can result in a material impact to the valuation of these liabilities. The Group’s insurance policyholder liabilities relate to the life insurance businesses.
In determining the valuation of the liabilities, the key actuarial assumptions made by management’s experts include:
To assess the assumptions used to determine the value of insurance policyholder liabilities, we along with our independent actuarial experts performed amongst others the following audit procedures:
· Compared the methodology and models usedby management to those commonly applied inthe industry and recognised by regulatorystandards;
· Developed an understanding of and evaluatedthe controls management has in place overkey processes relating to the valuation. Thisincluded management’s use of models, thequality of oversight and controls over keyassumptions within those models, and
144
Ou
r b
usin
essP
erform
ance
overview
C
orp
orate
respo
nsib
ility C
orp
orate
go
vernan
ceD
irectors’
repo
rtO
ther
info
rmatio
nC
om
mo
nw
ea
lth Ba
nk o
f Au
stralia
An
nu
al Rep
ort 2017
Fin
ancial
repo
rt
6
2
1
3
4
5
7
199
Key audit matter How our audit addressed the key audit matter
· Expected amount, timing and duration ofclaims and/or policy payments, likely lapserates of policies by policyholders, mortality andmorbidity rates, acquisition and maintenanceexpenses; and
· Long term economic assumptions includinginflation rates.
Relevant references in the financial report Refer notes 1 and 27 for further information.
management’s preparation of the manually calculated components of the liability;
· Compared key inputs (for example inflationrates) used by management in the calculationto relevant supporting evidence, such asexternal market data;
· Considered the impact of key changes inassumptions and methodologies over the yearand compared these to industry practice; and
· Compared the underlying supporting datarelating to policyholder information used inmanagement's valuation to sourcedocumentation on a sample basis.
Valuation of retirement benefit obligations (Relevant business segment: All)
We considered this a key audit matter because the Group operates defined benefit plans that are financially significant to the Group’s financial report.
The Group sponsors two defined benefit plans for employees, one in Australia and the other in the UK.
Management apply actuarial assumptions in their models used in determining the valuation of the retirement benefit obligation, including:
· Discount rates;· Salary inflation;· Life expectancy of members; and· Investment returns under the plans’ assets
Relevant references in the financial report Refer notes 1 and 35 for further information.
To assess the appropriateness of the assumptions used to determine the valuation of retirement benefit obligations, we along with our independent actuarial experts performed amongst others the following audit procedures:
· Tested the underlying data (e.g. fair value ofplan assets) used by management in theircalculation against source documentation ona sample basis;
· Assessed the reasonableness of theassumptions used within management’scalculation with reference to external marketdata; and
· Developed our own expectations for theobligations based on a range of possiblealternative outcomes and compared these tomanagement’s calculations.
Operation of financial reporting Information Technology (IT) systems and controls (Relevant business segments: All)
We focused on this area because the Group’s operations and financial reporting processes are heavily dependent on IT systems, including automated accounting procedures and IT dependent manual controls.
The Group’s controls over IT systems include:
· The framework of governance over ITsystems;
· Program development and changes;
Our procedures included evaluating and testing the design and operating effectiveness of certain controls over the continued integrity of the IT systems that are relevant to financial reporting.
We also carried out direct tests, on a sample basis, of system functionality that was key to our audit testing in order to assess the accuracy of certain system calculations, the generation of certain reports and the operation of certain system enforced access controls.
145

200
Key audit matter How our audit addressed the key audit matter
· Access to process, data and IT operations;and
· Governance over generic and privileged useraccounts.
Where we noted design or operating effectiveness matters relating to IT systems and applications controls relevant to our audit, we performed alternative or additional audit procedures.
Additional Information The directors and management are responsible for the Additional Information. The Additional Information comprises Our business, Performance overview, Corporate responsibility, Corporate governance, Directors’ report and Other information included in the Group’s annual report for the year ended 30 June 2017 but does not include the financial report and our auditor’s report thereon.
Our opinion on the financial report does not cover the Additional Information and accordingly we do not express any form of assurance conclusion thereon.
In connection with our audit of the financial report, our responsibility is to read the Additional Information identified above and, in doing so, consider whether the Additional Information is materially inconsistent with the financial report or our knowledge obtained in the audit, or otherwise appears to be materially misstated.
If, based on the work we have performed, we conclude that there is a material misstatement of this Additional Information, we are required to report that fact. We have nothing to report in this regard.
Responsibilities of the directors for the financial report The directors of the Company are responsible for the preparation of the financial report that gives a true and fair view in accordance with Australian Accounting Standards and the Corporations Act 2001 and for such internal control as the directors determine is necessary to enable the preparation of the financial report that gives a true and fair view and is free from material misstatement, whether due to fraud or error.
In preparing the financial report, the directors are responsible for assessing the ability of the Group to continue as a going concern, disclosing, as applicable, matters related to going concern and using the going concern basis of accounting unless the directors either intend to liquidate the Group or to cease operations, or has no realistic alternative but to do so.
Auditor’s responsibilities for the audit of the financial report Our objectives are to obtain reasonable assurance about whether the financial report as a whole is free from material misstatement, whether due to fraud or error, and to issue an auditor’s report that includes our opinion. Reasonable assurance is a high level of assurance, but is not a guarantee that an audit conducted in accordance with the Australian Auditing Standards will always detect a material misstatement when it exists. Misstatements can arise from fraud or error and are considered material if, individually or in the aggregate, they could reasonably be expected to influence the economic decisions of users taken on the basis of the financial report.
A further description of our responsibilities for the audit of the financial report is located at the Auditing and Assurance Standards Board website at: http://www.auasb.gov.au/auditors_responsibilities/ar1.pdf. This description forms part of our auditor’s report.
Report on the Remuneration Report
Our opinion on the Remuneration Report We have audited the Remuneration Report included in pages 9 to 27 of the Directors’ report for the year ended 30 June 2017.
In our opinion, the Remuneration Report of Commonwealth Bank of Australia, for the year ended 30 June 2017 complies with section 300A of the Corporations Act 2001.
146

Ou
r b
usin
essP
erform
ance
overview
C
orp
orate
respo
nsib
ility C
orp
orate
go
vernan
ceD
irectors’
repo
rtO
ther
info
rmatio
nC
om
mo
nw
ea
lth Ba
nk o
f Au
stralia
An
nu
al Rep
ort 2017
Fin
ancial
repo
rt
6
2
1
3
4
5
7
201
Responsibilities The directors of the Company are responsible for the preparation and presentation of the Remuneration Report in accordance with section 300A of the Corporations Act 2001. Our responsibility is to express an opinion on the Remuneration Report, based on our audit conducted in accordance with Australian Auditing Standards.
PricewaterhouseCoopers
Marcus Laithwaite Sydney Partner 8 August 2017
147

202 Shareholding information
Top 20 Holders of Fully Paid Ordinary Shares as at 2 August 2017
Rank Name of Holder Number of Shares %
1 HSBC Custody Nominees (Australia) Limited 376,380,123 21.752 J P Morgan Nominees Australia Limited 186,821,486 10.793 Citicorp Nominees Pty Limited 101,043,275 5.844 National Nominees Limited 59,912,985 3.465 BNP Paribas Noms Pty Limited 56,776,266 3.286 Bond Street Custodians Limited 16,812,646 0.977 Australian Foundation Investment Company limited 7,900,000 0.468 Pacific Custodians Pty Limited 4,812,429 0.289 Navigator Australia Limited 3,723,861 0.2210 Argo Investments Limited 3,203,731 0.1911 Milton Corporation Limited 3,111,148 0.1812 RBC Dexia Investor Services Australia Nominees Pty Limited 3,032,654 0.1813 Netwealth Investments Limited 2,364,986 0.1414 UBS Nominees Pty Ltd 2,339,250 0.1315 Nulis Nominees (Australia) Limited 2,191,295 0.1316 Invia Custodian Pty Limited 1,787,477 0.1017 IOOF Investment Management Limited 1,678,128 0.1018 Mr. Barry Martin Lambert 1,643,613 0.1019 ANZ Executors & Trustee 1,472,555 0.0920 McCusker Holdings Pty Ltd 1,430,000 0.08
The top 20 shareholders hold 838,437,908 shares which is equal to 48.47% of the total shares on issue.
Substantial Shareholding The following organisation has disclosed a substantial shareholding notice to ASX.
Name Number of
SharesPercentage ofVoting Power
BlackRock Group (1) 86,557,665 5.00
(1) Substantial shareholder notice dated 16 May 2017.
Stock Exchange Listing The shares of the Commonwealth Bank of Australia (Bank) are listed on the Australian Securities Exchange under the trade symbol CBA, with Sydney being the home exchange. Details of trading activity are published in most daily newspapers, generally under the abbreviation of CBA or C’wealth Bank. The Bank is not currently in the market conducting an on market buy-back of its shares.
Range of Shares (Fully Paid Ordinary Shares and Employee Shares) as at 2 August 2017
Range Number of
ShareholdersPercentage of Shareholders
Number ofShares
Percentage ofIssuedCapital
1 – 1,000 588,814 73.08 186,897,021 10.801,001 – 5,000 189,065 23.47 392,559,830 22.695,001 – 10,000 19,393 2.41 131,675,877 7.6110,001 – 100,000 8,206 1.02 154,412,567 8.93100,001 and over 186 0.02 864,322,866 49.97Total 805,664 100.00 1,729,868,161 100.00Less than marketable parcel of $500 13,400 1.66 34,134 0.00
Voting Rights Under the Bank’s Constitution, each person who is a voting Equity holder and who is present at a general meeting of the Bank in person or by proxy, attorney or official representative is entitled: On a show of hands – to one vote; and On a poll – to one vote for each share held or represented. Every voting Equity holder who casts a vote by direct vote, shall
also have one vote for each share held or represented.If a person present at a general meeting represents personally or by proxy, attorney or official representative more than one Equity holder, on a show of hands the person is entitled to one vote even though he or she represents more than one Equity holder.
148
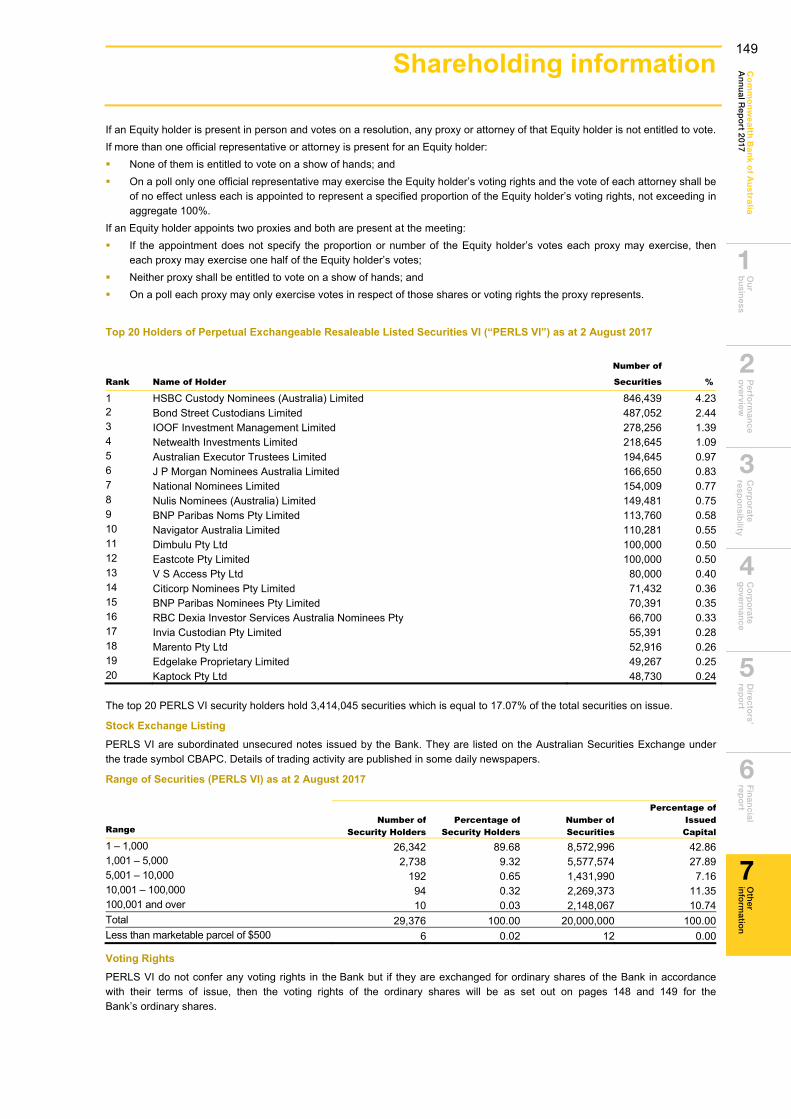
Ou
r b
usin
essP
erform
ance
overview
C
orp
orate
respo
nsib
ility C
orp
orate
go
vernan
ceD
irectors’
repo
rtO
ther
info
rmatio
nC
om
mo
nw
ea
lth Ba
nk o
f Au
stralia
An
nu
al Rep
ort 2017
Fin
ancial
repo
rt
6
2
1
3
4
5
7
203 203
Shareholding information 203
If an Equity holder is present in person and votes on a resolution, any proxy or attorney of that Equity holder is not entitled to vote. If more than one official representative or attorney is present for an Equity holder: None of them is entitled to vote on a show of hands; and On a poll only one official representative may exercise the Equity holder’s voting rights and the vote of each attorney shall be
of no effect unless each is appointed to represent a specified proportion of the Equity holder’s voting rights, not exceeding inaggregate 100%.
If an Equity holder appoints two proxies and both are present at the meeting: If the appointment does not specify the proportion or number of the Equity holder’s votes each proxy may exercise, then
each proxy may exercise one half of the Equity holder’s votes; Neither proxy shall be entitled to vote on a show of hands; and On a poll each proxy may only exercise votes in respect of those shares or voting rights the proxy represents.
Top 20 Holders of Perpetual Exchangeable Resaleable Listed Securities VI (“PERLS VI”) as at 2 August 2017
Rank Name of Holder
Number of
Securities %
1 HSBC Custody Nominees (Australia) Limited 846,439 4.23 2 Bond Street Custodians Limited 487,052 2.44 3 IOOF Investment Management Limited 278,256 1.39 4 Netwealth Investments Limited 218,645 1.09 5 Australian Executor Trustees Limited 194,645 0.97 6 J P Morgan Nominees Australia Limited 166,650 0.83 7 National Nominees Limited 154,009 0.77 8 Nulis Nominees (Australia) Limited 149,481 0.75 9 BNP Paribas Noms Pty Limited 113,760 0.58 10 Navigator Australia Limited 110,281 0.55 11 Dimbulu Pty Ltd 100,000 0.50 12 Eastcote Pty Limited 100,000 0.50 13 V S Access Pty Ltd 80,000 0.40 14 Citicorp Nominees Pty Limited 71,432 0.36 15 BNP Paribas Nominees Pty Limited 70,391 0.35 16 RBC Dexia Investor Services Australia Nominees Pty 66,700 0.33 17 Invia Custodian Pty Limited 55,391 0.28 18 Marento Pty Ltd 52,916 0.26 19 Edgelake Proprietary Limited 49,267 0.25 20 Kaptock Pty Ltd 48,730 0.24
The top 20 PERLS VI security holders hold 3,414,045 securities which is equal to 17.07% of the total securities on issue.
Stock Exchange Listing PERLS VI are subordinated unsecured notes issued by the Bank. They are listed on the Australian Securities Exchange under the trade symbol CBAPC. Details of trading activity are published in some daily newspapers.
Range of Securities (PERLS VI) as at 2 August 2017
Range Number of
Security HoldersPercentage of
Security HoldersNumber ofSecurities
Percentage of Issued Capital
1 – 1,000 26,342 89.68 8,572,996 42.86 1,001 – 5,000 2,738 9.32 5,577,574 27.89 5,001 – 10,000 192 0.65 1,431,990 7.16 10,001 – 100,000 94 0.32 2,269,373 11.35 100,001 and over 10 0.03 2,148,067 10.74 Total 29,376 100.00 20,000,000 100.00 Less than marketable parcel of $500 6 0.02 12 0.00
Voting Rights PERLS VI do not confer any voting rights in the Bank but if they are exchanged for ordinary shares of the Bank in accordance with their terms of issue, then the voting rights of the ordinary shares will be as set out on pages 148 and 149 for the Bank’s ordinary shares.
149
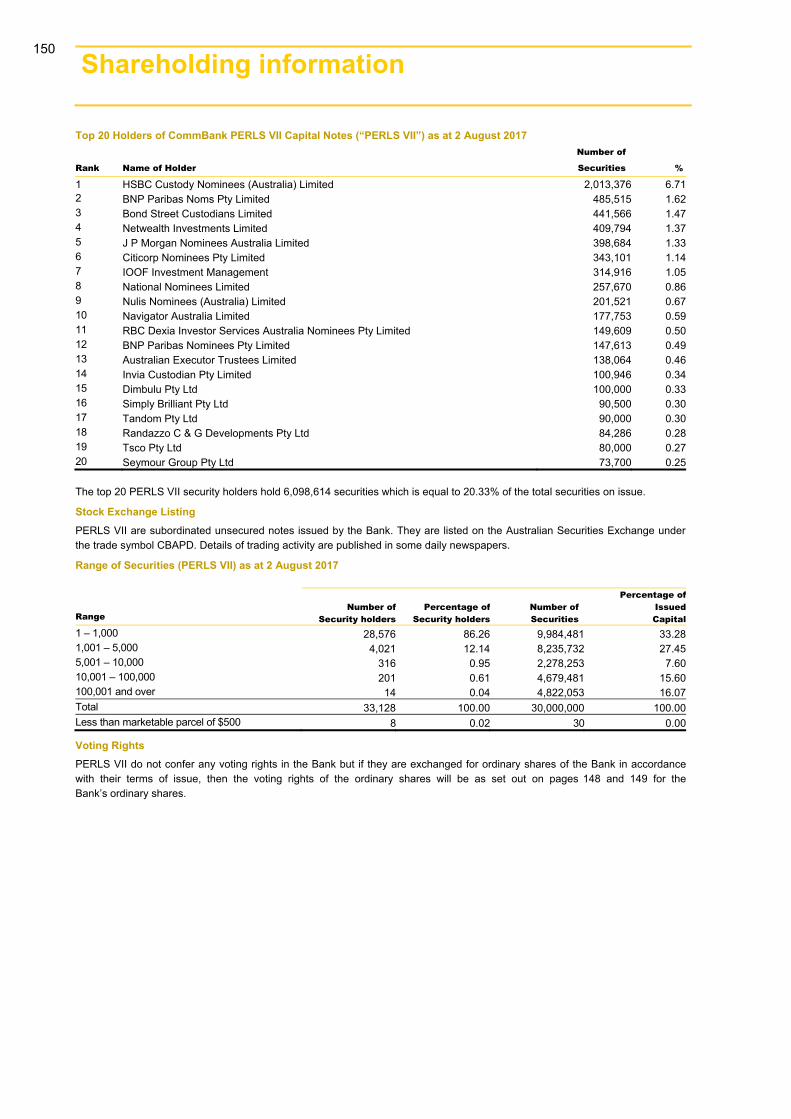
204 Shareholding information
Top 20 Holders of CommBank PERLS VII Capital Notes (“PERLS VII”) as at 2 August 2017
Rank Name of Holder
Number of
Securities %
1 HSBC Custody Nominees (Australia) Limited 2,013,376 6.712 BNP Paribas Noms Pty Limited 485,515 1.623 Bond Street Custodians Limited 441,566 1.474 Netwealth Investments Limited 409,794 1.375 J P Morgan Nominees Australia Limited 398,684 1.336 Citicorp Nominees Pty Limited 343,101 1.147 IOOF Investment Management 314,916 1.058 National Nominees Limited 257,670 0.869 Nulis Nominees (Australia) Limited 201,521 0.6710 Navigator Australia Limited 177,753 0.5911 RBC Dexia Investor Services Australia Nominees Pty Limited 149,609 0.5012 BNP Paribas Nominees Pty Limited 147,613 0.4913 Australian Executor Trustees Limited 138,064 0.4614 Invia Custodian Pty Limited 100,946 0.3415 Dimbulu Pty Ltd 100,000 0.3316 Simply Brilliant Pty Ltd 90,500 0.3017 Tandom Pty Ltd 90,000 0.3018 Randazzo C & G Developments Pty Ltd 84,286 0.2819 Tsco Pty Ltd 80,000 0.2720 Seymour Group Pty Ltd 73,700 0.25
The top 20 PERLS VII security holders hold 6,098,614 securities which is equal to 20.33% of the total securities on issue.
Stock Exchange Listing PERLS VII are subordinated unsecured notes issued by the Bank. They are listed on the Australian Securities Exchange under the trade symbol CBAPD. Details of trading activity are published in some daily newspapers.
Range of Securities (PERLS VII) as at 2 August 2017
Range Number of
Security holdersPercentage of
Security holdersNumber of Securities
Percentage of IssuedCapital
1 – 1,000 28,576 86.26 9,984,481 33.281,001 – 5,000 4,021 12.14 8,235,732 27.455,001 – 10,000 316 0.95 2,278,253 7.6010,001 – 100,000 201 0.61 4,679,481 15.60100,001 and over 14 0.04 4,822,053 16.07Total 33,128 100.00 30,000,000 100.00Less than marketable parcel of $500 8 0.02 30 0.00
Voting Rights PERLS VII do not confer any voting rights in the Bank but if they are exchanged for ordinary shares of the Bank in accordance with their terms of issue, then the voting rights of the ordinary shares will be as set out on pages 148 and 149 for the Bank’s ordinary shares.
150
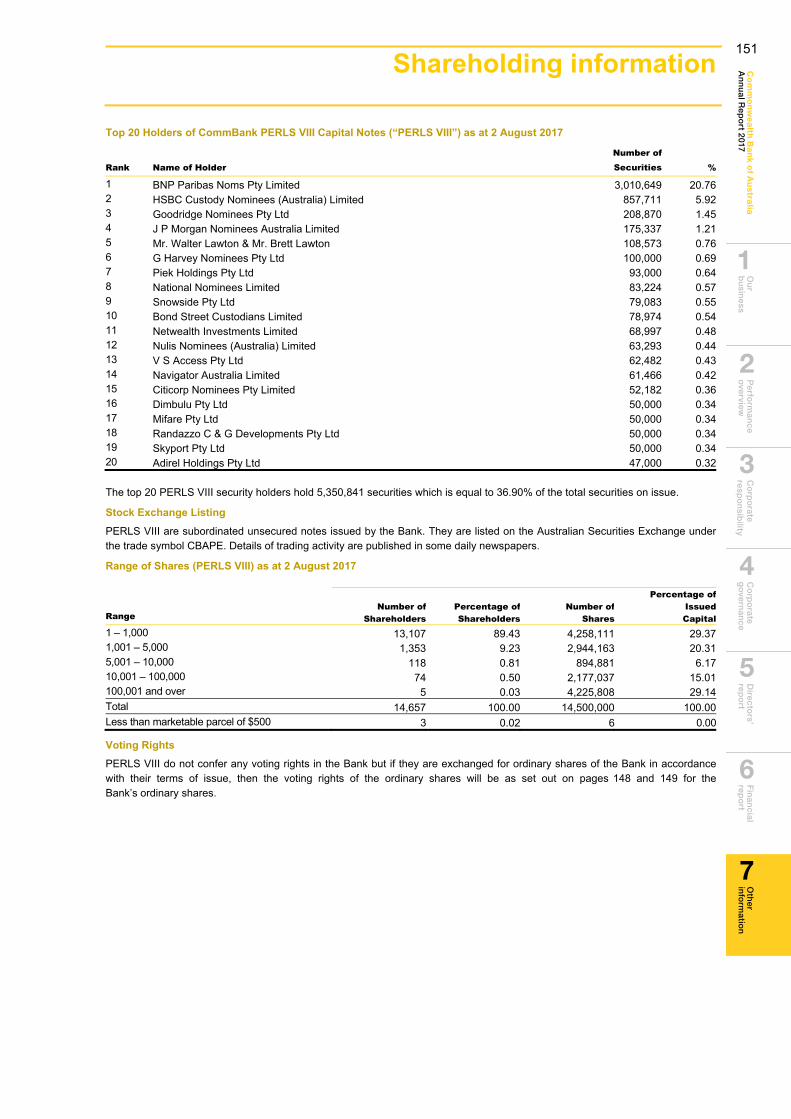
Ou
r b
usin
essP
erform
ance
overview
C
orp
orate
respo
nsib
ility C
orp
orate
go
vernan
ceD
irectors’
repo
rtO
ther
info
rmatio
nC
om
mo
nw
ea
lth Ba
nk o
f Au
stralia
An
nu
al Rep
ort 2017
Fin
ancial
repo
rt
6
2
1
3
4
5
7
205 205
Shareholding information 205
Top 20 Holders of CommBank PERLS VIII Capital Notes (“PERLS VIII”) as at 2 August 2017
Rank Name of Holder Number ofSecurities %
1 BNP Paribas Noms Pty Limited 3,010,649 20.76 2 HSBC Custody Nominees (Australia) Limited 857,711 5.92 3 Goodridge Nominees Pty Ltd 208,870 1.45 4 J P Morgan Nominees Australia Limited 175,337 1.21 5 Mr. Walter Lawton & Mr. Brett Lawton 108,573 0.76 6 G Harvey Nominees Pty Ltd 100,000 0.69 7 Piek Holdings Pty Ltd 93,000 0.64 8 National Nominees Limited 83,224 0.57 9 Snowside Pty Ltd 79,083 0.55 10 Bond Street Custodians Limited 78,974 0.54 11 Netwealth Investments Limited 68,997 0.48 12 Nulis Nominees (Australia) Limited 63,293 0.44 13 V S Access Pty Ltd 62,482 0.43 14 Navigator Australia Limited 61,466 0.42 15 Citicorp Nominees Pty Limited 52,182 0.36 16 Dimbulu Pty Ltd 50,000 0.34 17 Mifare Pty Ltd 50,000 0.34 18 Randazzo C & G Developments Pty Ltd 50,000 0.34 19 Skyport Pty Ltd 50,000 0.34 20 Adirel Holdings Pty Ltd 47,000 0.32
The top 20 PERLS VIII security holders hold 5,350,841 securities which is equal to 36.90% of the total securities on issue.
Stock Exchange Listing PERLS VIII are subordinated unsecured notes issued by the Bank. They are listed on the Australian Securities Exchange under the trade symbol CBAPE. Details of trading activity are published in some daily newspapers.
Range of Shares (PERLS VIII) as at 2 August 2017
Range Number of
ShareholdersPercentage of Shareholders
Number ofShares
Percentage of Issued Capital
1 – 1,000 13,107 89.43 4,258,111 29.37 1,001 – 5,000 1,353 9.23 2,944,163 20.31 5,001 – 10,000 118 0.81 894,881 6.17 10,001 – 100,000 74 0.50 2,177,037 15.01 100,001 and over 5 0.03 4,225,808 29.14 Total 14,657 100.00 14,500,000 100.00 Less than marketable parcel of $500 3 0.02 6 0.00
Voting Rights PERLS VIII do not confer any voting rights in the Bank but if they are exchanged for ordinary shares of the Bank in accordance with their terms of issue, then the voting rights of the ordinary shares will be as set out on pages 148 and 149 for the Bank’s ordinary shares.
151
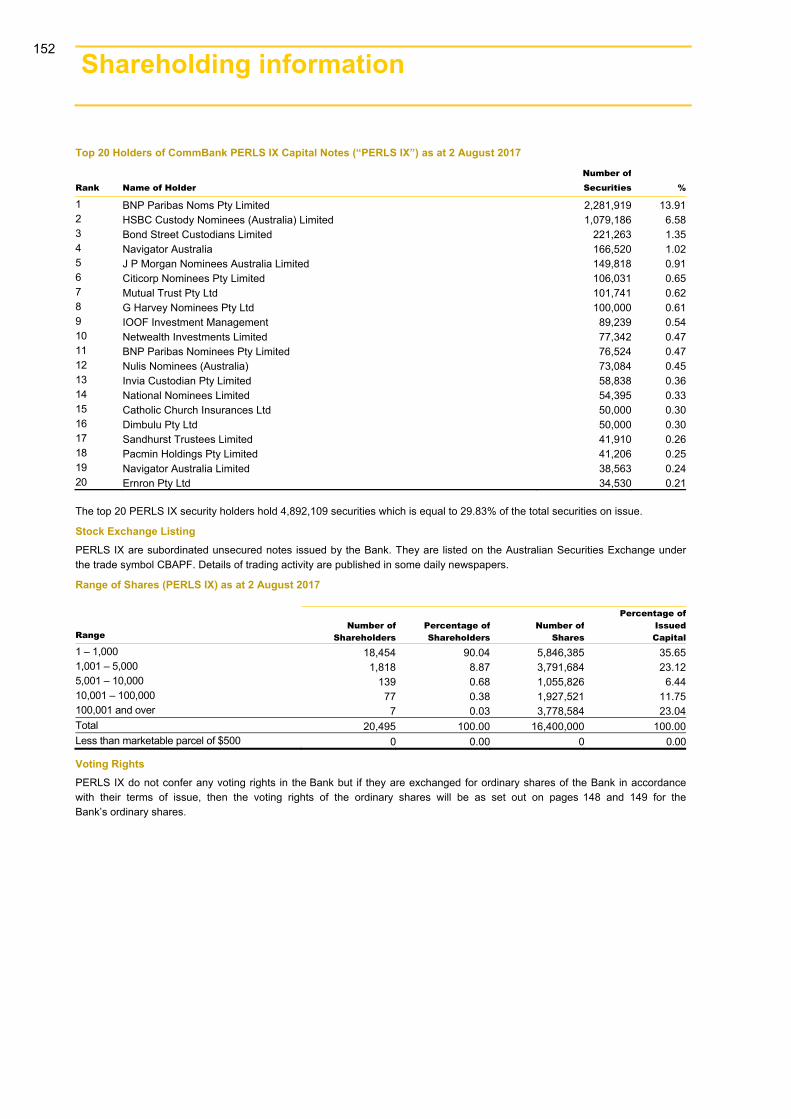
206 Shareholding information
Top 20 Holders of CommBank PERLS IX Capital Notes (“PERLS IX”) as at 2 August 2017
Rank Name of Holder Number of Securities %
1 BNP Paribas Noms Pty Limited 2,281,919 13.912 HSBC Custody Nominees (Australia) Limited 1,079,186 6.583 Bond Street Custodians Limited 221,263 1.354 Navigator Australia 166,520 1.025 J P Morgan Nominees Australia Limited 149,818 0.916 Citicorp Nominees Pty Limited 106,031 0.657 Mutual Trust Pty Ltd 101,741 0.628 G Harvey Nominees Pty Ltd 100,000 0.619 IOOF Investment Management 89,239 0.5410 Netwealth Investments Limited 77,342 0.4711 BNP Paribas Nominees Pty Limited 76,524 0.4712 Nulis Nominees (Australia) 73,084 0.4513 Invia Custodian Pty Limited 58,838 0.3614 National Nominees Limited 54,395 0.3315 Catholic Church Insurances Ltd 50,000 0.3016 Dimbulu Pty Ltd 50,000 0.3017 Sandhurst Trustees Limited 41,910 0.2618 Pacmin Holdings Pty Limited 41,206 0.2519 Navigator Australia Limited 38,563 0.2420 Ernron Pty Ltd 34,530 0.21
The top 20 PERLS IX security holders hold 4,892,109 securities which is equal to 29.83% of the total securities on issue.
Stock Exchange Listing PERLS IX are subordinated unsecured notes issued by the Bank. They are listed on the Australian Securities Exchange under the trade symbol CBAPF. Details of trading activity are published in some daily newspapers.
Range of Shares (PERLS IX) as at 2 August 2017
Range Number of
ShareholdersPercentage of Shareholders
Number ofShares
Percentage ofIssuedCapital
1 – 1,000 18,454 90.04 5,846,385 35.651,001 – 5,000 1,818 8.87 3,791,684 23.125,001 – 10,000 139 0.68 1,055,826 6.4410,001 – 100,000 77 0.38 1,927,521 11.75100,001 and over 7 0.03 3,778,584 23.04Total 20,495 100.00 16,400,000 100.00Less than marketable parcel of $500 0 0.00 0 0.00
Voting Rights PERLS IX do not confer any voting rights in the Bank but if they are exchanged for ordinary shares of the Bank in accordance with their terms of issue, then the voting rights of the ordinary shares will be as set out on pages 148 and 149 for the Bank’s ordinary shares.
152
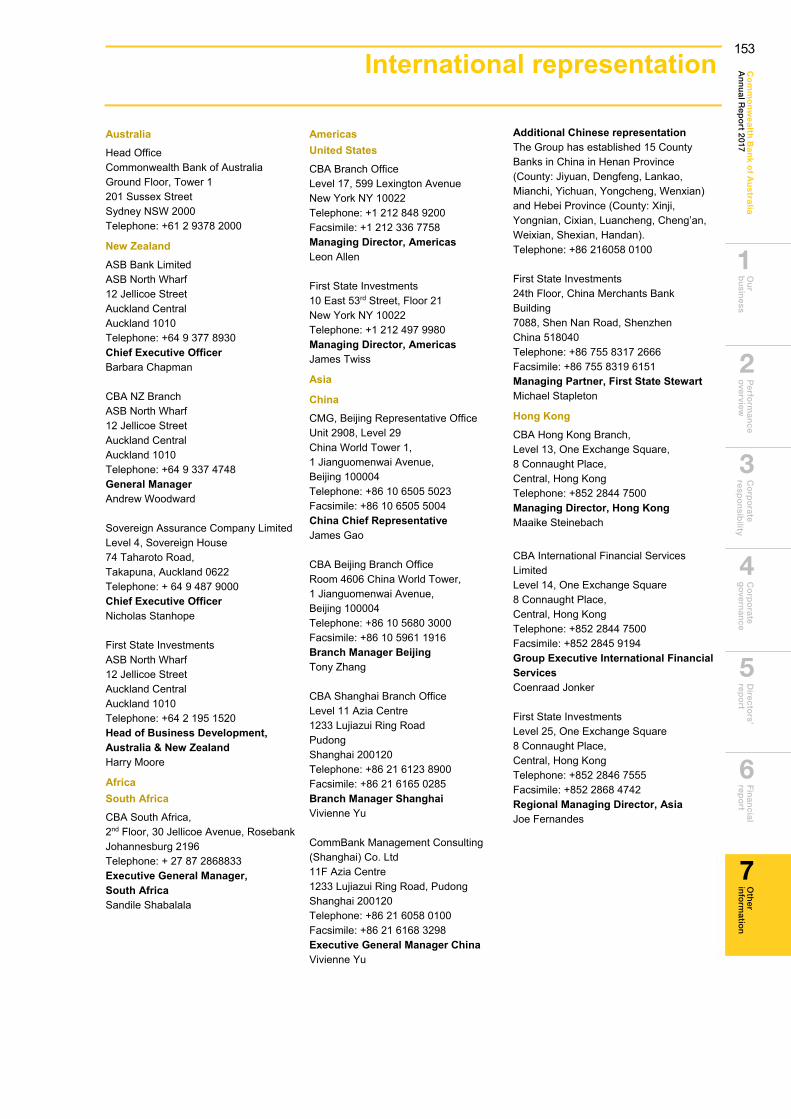
Ou
r b
usin
essP
erform
ance
overview
C
orp
orate
respo
nsib
ility C
orp
orate
go
vernan
ceD
irectors’
repo
rtO
ther
info
rmatio
nC
om
mo
nw
ea
lth Ba
nk o
f Au
stralia
An
nu
al Rep
ort 2017
Fin
ancial
repo
rt
6
2
1
3
4
5
7
215 215 International representation 215
Australia Head Office Commonwealth Bank of Australia Ground Floor, Tower 1 201 Sussex Street Sydney NSW 2000 Telephone: +61 2 9378 2000
New Zealand ASB Bank Limited ASB North Wharf 12 Jellicoe Street Auckland Central Auckland 1010 Telephone: +64 9 377 8930 Chief Executive Officer Barbara Chapman
CBA NZ Branch ASB North Wharf 12 Jellicoe Street Auckland Central Auckland 1010 Telephone: +64 9 337 4748 General Manager Andrew Woodward
Sovereign Assurance Company Limited Level 4, Sovereign House 74 Taharoto Road, Takapuna, Auckland 0622 Telephone: + 64 9 487 9000 Chief Executive Officer Nicholas Stanhope
First State Investments ASB North Wharf 12 Jellicoe Street Auckland Central Auckland 1010 Telephone: +64 2 195 1520 Head of Business Development, Australia & New Zealand Harry Moore
Africa South Africa CBA South Africa, 2nd Floor, 30 Jellicoe Avenue, Rosebank Johannesburg 2196 Telephone: + 27 87 2868833 Executive General Manager, South Africa Sandile Shabalala
Americas United States CBA Branch Office Level 17, 599 Lexington Avenue New York NY 10022 Telephone: +1 212 848 9200 Facsimile: +1 212 336 7758 Managing Director, Americas Leon Allen
First State Investments 10 East 53rd Street, Floor 21 New York NY 10022 Telephone: +1 212 497 9980 Managing Director, Americas James Twiss
Asia
China CMG, Beijing Representative Office Unit 2908, Level 29 China World Tower 1, 1 Jianguomenwai Avenue, Beijing 100004 Telephone: +86 10 6505 5023 Facsimile: +86 10 6505 5004 China Chief Representative James Gao
CBA Beijing Branch Office Room 4606 China World Tower, 1 Jianguomenwai Avenue, Beijing 100004 Telephone: +86 10 5680 3000 Facsimile: +86 10 5961 1916 Branch Manager Beijing Tony Zhang
CBA Shanghai Branch Office Level 11 Azia Centre 1233 Lujiazui Ring Road Pudong Shanghai 200120 Telephone: +86 21 6123 8900 Facsimile: +86 21 6165 0285 Branch Manager Shanghai Vivienne Yu
CommBank Management Consulting (Shanghai) Co. Ltd 11F Azia Centre 1233 Lujiazui Ring Road, Pudong Shanghai 200120 Telephone: +86 21 6058 0100 Facsimile: +86 21 6168 3298 Executive General Manager China Vivienne Yu
Additional Chinese representation The Group has established 15 County Banks in China in Henan Province (County: Jiyuan, Dengfeng, Lankao, Mianchi, Yichuan, Yongcheng, Wenxian) and Hebei Province (County: Xinji, Yongnian, Cixian, Luancheng, Cheng’an, Weixian, Shexian, Handan). Telephone: +86 216058 0100
First State Investments 24th Floor, China Merchants Bank Building 7088, Shen Nan Road, Shenzhen China 518040 Telephone: +86 755 8317 2666 Facsimile: +86 755 8319 6151 Managing Partner, First State Stewart Michael Stapleton
Hong Kong CBA Hong Kong Branch, Level 13, One Exchange Square, 8 Connaught Place, Central, Hong Kong Telephone: +852 2844 7500 Managing Director, Hong Kong Maaike Steinebach
CBA International Financial Services Limited Level 14, One Exchange Square 8 Connaught Place, Central, Hong Kong Telephone: +852 2844 7500 Facsimile: +852 2845 9194 Group Executive International Financial Services Coenraad Jonker
First State Investments Level 25, One Exchange Square 8 Connaught Place, Central, Hong Kong Telephone: +852 2846 7555 Facsimile: +852 2868 4742 Regional Managing Director, Asia Joe Fernandes
153

216 International representation
Indonesia PT Bank Commonwealth World Trade Centre 6, 3A Floor Jl. Jendral Sudirman Kav. 29-31 Jakarta 12920 Telephone: +62 21 5296 1222 Facsimile: +62 21 5296 2293 President Director Lauren Sulistiawati
PT Commonwealth Life World Trade Centre 6, 8th Floor, JI. Jendral Sudirman Kav. 29-31 Jakarta 12920 Telephone: +62 21 570 5000 Facsimile: +62 21 520 5353 President Director Elvis Liongosari
First State Investments 29th Floor, Gedung Artha Graha Sudirman Central Business District Jl. Jend. Sudirman Kav. 52-53 Jakarta 12190 Telephone: +62 21 515 0088 Facsimile: +62 21 515 0033 Regional Managing Director, Asia Hario Soeprobo
Japan CBA Branch Office 8th Floor, Toranomon Waiko Building 12-1 Toranomon 5-chomeMinato-ku, Tokyo 105-0001Telephone: +81 3 5400 7280Facsimile: +81 3 5400 7288Branch Head TokyoMartin Spann
First State Investments 8th Floor, Toranomon Waiko Building 12-1 Toranomon 5-chomeMinato-ku, Tokyo 105-0001Telephone: +81 3 5402 4831Facsimile: +81 3 5402 4839Regional Managing Director, AsiaJoe Fernandes
Singapore CBA Branch Office 38 Beach Road 06-11 South Beach TowerSingapore 189767Telephone: +65 6349 7000Facsimile: +65 6224 5812Managing Director, SingaporeScott Speedie
First State Investments 38 Beach Road 06-11 South Beach TowerSingapore 189767Telephone: +65 6538 0008Facsimile: +65 6538 0800Regional Managing Director, AsiaJoe Fernandes
UAE First State Investments Level 14, The Gate Building P.O Box 74777, DubaiTelephone: +971 14 4019340Managing Director, EMEAChris Turpin
Vietnam CBA Representative Office Suite 603-604 Central Building 31 Hai Ba Trung, Hanoi Telephone: +84 4 3824 3213 Facsimile: +84 4 3824 3961 Chief Representative and Director of Investment and Banking Hanh Nguyen
CBA Ho Chi Minh City Branch Hoa Lam Building 4B Ton Duc Thang, Dist. 1 Ho Chi Minh City Telephone: +84 8 3824 1525 Facsimile: +84 8 3824 2703 General Director Shane O’Connor
CBA Digital Solutions Company Limited Levels 7-11, 4B Ton Duc Thang, Dist. 1 Ho Chi Minh City Telephone: +842838246276 General Director Hanh Nguyen
Europe
France First State Investments 14, Avenue d’Eylau 75016 Paris Telephone: +33 1 7302 4674 Managing Director, EMEA Chris Turpin
Germany First State Investments Westhafen Tower Westhafenplatz 1 60327 Frankfurt a.M. Telephone: +49 0 69 710456 - 302 Managing Director, EMEA Chris Turpin
Malta CommBank Europe Limited Level 3 Strand Towers 36 The Strand Sliema SLM07 Telephone: +356 2132 0812 Facsimile: +356 2132 0811 Chief Financial Officer Greg Williams
United Kingdom England CBA Branch Office 1 New Ludgate 60 Ludgate Hill London EC4V 4HA Telephone: +44 20 7710 3999 Facsimile: +44 20 7710 3939 Managing Director, Europe Paul Orchart
First State Investments Finsbury Circus House 15 Finsbury Circus London EC2M 7EB Telephone: +44 0 20 7332 6500 Facsimile: +44 0 20 7332 6501 Managing Director, EMEA Chris Turpin
Scotland First State Investments 23 St Andrew Square Edinburgh EH2 1BB Telephone: +44 0 131 473 2200 Facsimile: +44 0 131 473 2222 Managing Director, EMEA Chris Turpin
154

Ou
r b
usin
essP
erform
ance
overview
C
orp
orate
respo
nsib
ility C
orp
orate
go
vernan
ceD
irectors’
repo
rtO
ther
info
rmatio
nC
om
mo
nw
ea
lth Ba
nk o
f Au
stralia
An
nu
al Rep
ort 2017
Fin
ancial
repo
rt
6
2
1
3
4
5
7
217217Corporate directory 217
132 221 General Enquiries For your everyday banking including paying bills using BPAY® our automated service is available 24 hours a day, 7 days a week.
132 221 Lost, Stolen or Damaged Cards To report a lost or stolen card 24 hours a day, 7 days a week. From overseas call +61 2 9999 3283. Operator assistance is available 24 hours a day, 7 days a week. ® Registered to BPAY Pty Ltd ABN 69 079 137 518
132 224 Home Loans and Investment Home Loans To apply for a new home loan or investment home loan or to maintain an existing loan. Available from 8am to 8pm, 7 days a week.
131 431 Personal Loan Sales To apply for a new personal loan. Available from 8am to 8pm, 7 days a week.
1800 805 605 Customer Relations If you would like to pay us a compliment or are dissatisfied with any aspect of the service you have received.
Internet Banking You can apply for a home loan, credit card, personal loan, term deposit or a savings account on the internet by visiting our website at www.commbank.com.au available 24 hours a day, 7 days a week. Do your everyday banking on our internet banking service NetBank at www.commbank.com.au/netbank available 24 hours a day, 7 days a week. To apply for access to NetBank, call 132 221. Available 24 hours a day, 7 days a week. Do your business banking on our Business Internet Banking Service CommBiz at www.commbank.com.au/CommBiz available 24 hours a day, 7 days a week. To apply for access to CommBiz, call 132 339. Available 24 hours a day, 7 days a week.
Special Telephony Services Customers who are hearing or speech impaired can contact us via the National Relay Service (www.relayservice.com.au) available 24 hours a day, 7 days a week. Telephone Typewriter (TTY) service users can be
connected to any of our telephone numbers via 133 677. Speak and Listen (speech-to-speech relay) users can
also connect to any of our telephone numbers by calling1300 555 727.
Internet relay users can be connected to our telephonenumbers via National Relay Service.
131 519 CommSec (Commonwealth Securities) For enquiries about CommSec products and services visit www.commsec.com.au.
Available from 8am to 7pm (Sydney Time), Monday to Friday, for share trading and stock market enquiries, and 8am to 7pm 7 days a week for Commsec Cash Management. A 24 hour lost and stolen card line is available 24 hours, 7 days a week.
131 709 CommSec Margin Loan Enables you to expand your portfolio by borrowing against your existing shares and managed funds. To find out more simply call 131 709 8am to 6pm (Sydney Time) Monday to Friday or visit www.commsec.com.au.
1800 019 910 Corporate Financial Services For a full range of financial solutions for medium-size and larger companies. Available from 8am to 6pm (Sydney Time), Monday to Friday.
131 998 Local Business Banking A dedicated team of Business Banking Specialists, supporting a network of branch business bankers, will help you with your financial needs. Available 24 hours a day, 7 days a week or visit www.commbank.com.au/lbb.
1300 772 968 (1300 AGLINE) AgriLine A dedicated team of Agribusiness Specialists will help you with your financial needs. With our Business Banking team living in regional and rural Australia, they understand the challenges you face. Available 24 hours a day, 7 days a week.
Colonial First State Existing investors can call 131 336 from 8am to 7pm (Sydney Time) Monday to Friday. New investors without a financial adviser can call 1300 360 645. Financial advisers can call 131 836. Alternatively, visit www.colonialfirststate.com.au.
1300 362 081 Commonwealth Private Commonwealth Private offers clients with significant financial resources a comprehensive range of services, advice and opportunities to meet their specific needs. For a confidential discussion about how Commonwealth Private can help you, call 1300 362 081 between 8am to 5:30pm (Sydney time), Monday to Friday or visit www.commbank.com.au/commonwealthprivate.
132 015 Commonwealth Financial Services For enquiries on retirement and superannuation products, or managed investments. Available from 8.30am to 6pm (Sydney Time), Monday to Friday. Unit prices are available 24 hours a day, 7 days a week.
CommInsure For all your general insurance needs call 132 423 8am to 8pm (Sydney Time), Monday to Friday and 8am to 5pm (Sydney Time) on Saturday. For all your life insurance needs call 131 056 8am to 8pm (Sydney Time), Monday to Friday. Alternatively, visit www.comminsure.com.au.
155
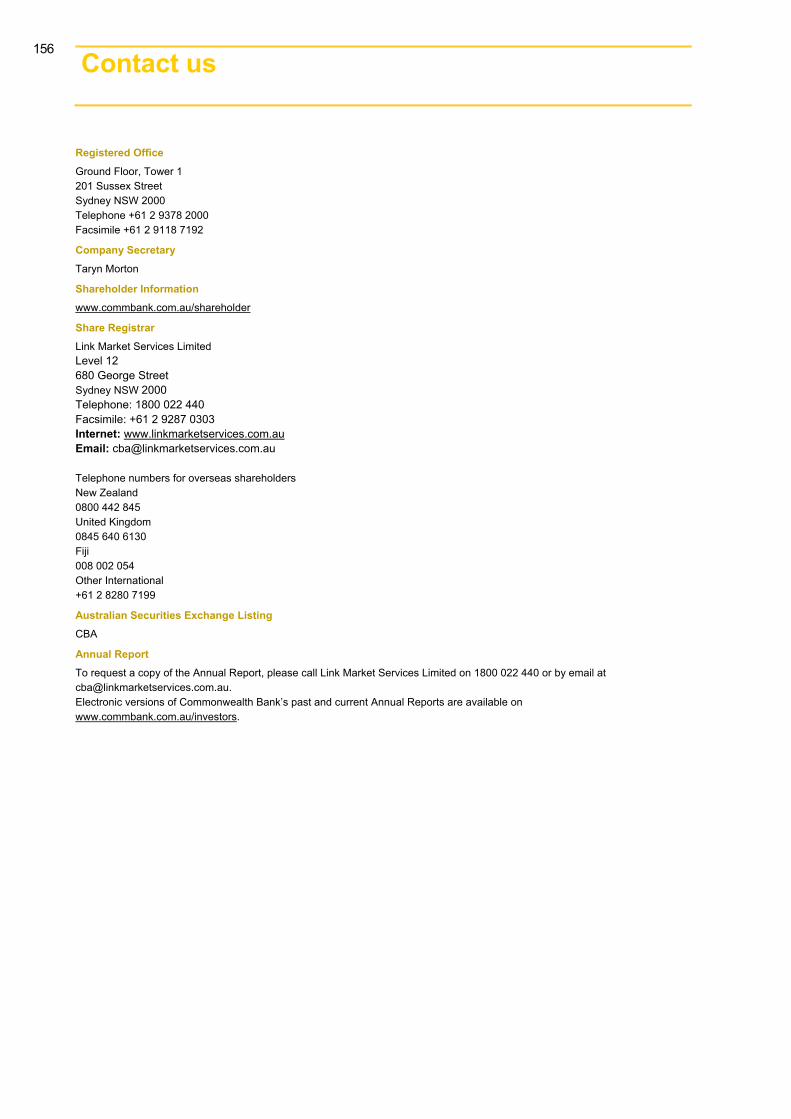
218 Contact us
Registered Office Ground Floor, Tower 1 201 Sussex Street Sydney NSW 2000 Telephone +61 2 9378 2000 Facsimile +61 2 9118 7192
Company Secretary Taryn Morton
Shareholder Information www.commbank.com.au/shareholder
Share Registrar Link Market Services Limited Level 12 680 George Street Sydney NSW 2000 Telephone: 1800 022 440 Facsimile: +61 2 9287 0303 Internet: www.linkmarketservices.com.au Email: [email protected]
Telephone numbers for overseas shareholders New Zealand 0800 442 845 United Kingdom 0845 640 6130 Fiji 008 002 054 Other International +61 2 8280 7199
Australian Securities Exchange Listing CBA
Annual Report To request a copy of the Annual Report, please call Link Market Services Limited on 1800 022 440 or by email at [email protected]. Electronic versions of Commonwealth Bank’s past and current Annual Reports are available on www.commbank.com.au/investors.
156