financial resource requirements...
TRANSCRIPT
Financial Resource Requirements
2012-2013As of 1 October 2012
Partners in the Global Polio eradication initiative

Global Polio eradication initiative
© World Health Organization 2012
All rights reserved. Publications of the World Health Organization are available on the WHO web site (www.who.int) or can be purchased from WHO Press, World Health Organization, 20 Avenue Appia, 1211 Geneva 27, Switzerland (tel.: +41 22 791 3264; fax: +41 22 791 4857; e-mail: [email protected]). Requests for permission to reproduce or translate WHO publications – whether for sale or for noncommercial distribution – should be addressed to WHO Press through the WHO web site (http://www.who.int/about/licensing/copyright_form/en/index.html).
The designations employed and the presentation of the material in this publication do not imply the expression of any opinion whatsoever on the part of the World Health Organization concerning the legal status of any country, territory, city or area or of its authorities, or concerning the delimitation of its frontiers or boundaries. Dotted lines on maps represent approximate border lines for which there may not yet be full agreement.
The mention of specific companies or of certain manufacturers’ products does not imply that they are endorsed or recommended by the World Health Organization in preference to others of a similar nature that are not mentioned. Errors and omissions excepted, the names of proprietary products are distinguished by initial capital letters.
All reasonable precautions have been taken by the World Health Organization to verify the information contained in this publication. However, the published material is being distributed without warranty of any kind, either expressed or implied. The responsibility for the interpretation and use of the material lies with the reader. In no event shall the World Health Organization be liable for damages arising from its use.
Photo front cover: UNICEF/2012/L. Andriamasinoro. Sani, 4, from Kano State, receives the oral polio vaccine during a door-to-door campaign in Northern Nigeria. He is so proud to show his fingermark. Fingermarking is essential to make sure that not a single child is missed during campaigns.
Photo back cover: WHO/Sona Bari. Children during an SIA in March 2012 in Islamabad, Pakistan. Pakistan remains one of the three endemic countries. Persistent wild poliovirus transmission is restricted to three groups of districts: (1) Karachi city, (2) a group of districts in Balochistan Province, and (3) districts in the Federally Administered Tribal Areas (FATA) and the North-West Frontier Province. The Government of Pakistan and partners have launched an informative new website outlining the latest in the country’s polio eradication effort. The website is www.Endpolio.com.pk.
Design: philippecasse.chLayout: Paprika-annecy.com

1global polio eradication initiative
Financial resource requirements 2012–2013 | As of 1 october 2012
1 | ExEcutivE summary ......................................................................................................................3
2 | Financial rEsOurcE rEquirEmEnts 2012-2013 ......................................................................6
3 | rOlEs and rEspOnsibilitiEs OF spEarHEading partnErs ................................................7
4 | dEFinitiOn OF tHE gpEi activitiEs and budgEt EstimatEs ................................................7
5 | pOliO rEsEarcH ............................................................................................................................14
6 | rEviEW OF tHE gpEi budgEts and allOcatiOn OF Funds ..................................................15
7 | dOnOrs ............................................................................................................................................16
8 | annExEs ..........................................................................................................................................17
table of contents
WHO/POLIO/12.06
“Our cOmmitmEnt tO tHE nExt gEnEratiOn: tHE lEgacy OF a pOliO-FrEE WOrld”, un gEnEral assEmbly, nEW yOrk, 27 sEptEmbEr 2012
Pictured from left to right, Canada’s International Cooperation Minister Julian Fantino, UK’s International Development Minister Alan Duncan, President Hamid Karzai of Afghanistan, President Asif Ali Zardari of Pakistan, Bill Gates, co-chair and trustee of the Bill & Melinda Gates Foundation, President Goodluck Jonathan of Nigeria, Wilfred J. Wilkinson, chair Rotary Foundation Trustees, and Dr. Margaret Chan, director-general of World Health Organisation, Aseefa Bhutto Zardari, Pakistan polio ambassador and daughter of the President, Dr. Ahmad Mohammad Ali Al-Madani, President, Islamic Development Bank Group, Thomas Frieden, Executive Director of the US Centers for Disease Control and Prevention, Anthony Lake, Executive Director UNICEF at a high level event, ‘The Legacy of a Polio-Free World’, at the United Nations. The event highlighted global solidarity to urgently complete polio eradication. (Stuart Ramson/Insider Images for UN Foundation)

2 global polio eradication initiative
Financial resource requirements 2012–2013 | As of 1 october 2012
acronyms and abbreviations
ausaid Australian Government Overseas Aid Program
afP Acute flaccid paralysis
bmGf Bill & Melinda Gates Foundation
boPv Bivalent oral polio vaccine
cdc US Centers for Disease Control and Prevention
cida Canadian International Development Agency
dfid UK Department for International Development
eaP Global Polio Emergency Action Plan
frr Financial Resource Requirements
GPei Global Polio Eradication Initiative
idb Islamic Development Bank
Jica Japan International Cooperation Agency
moPv Monovalent oral polio vaccine
nids National Immunization Days
oPv Oral polio vaccine
Psc Programme support costs
sias Supplementary Immunization Activities
snids Sub-national Immunization Days
toPv Trivalent oral polio vaccine
Unicef United Nations Children’s Fund
Usaid United States Agency for International Development
vaPP Vaccine-associated paralytic polio
vdPv Vaccine-derived poliovirus
Who World Health Organization
WPv Wild poliovirus

3global polio eradication initiative
Financial resource requirements 2012–2013 | As of 1 october 2012
the Financial Resource Requirements series (FRR) details the funding – required and currently available – to
finance activities identified by the Global Polio Eradication Initiative (GPEI) for the 2012-2013 period to interrupt wild poliovirus transmission globally and prepare for the post-eradication era. The FRR is updated quarterly. Programmatic and financial scenarios for the polio eradication endgame strategy and legacy plan (2013-2018) will be presented in an upcoming edition of the FRR. This current edition of the FRR summarizes financial developments in the past quarter in the relevant epidemiological context.
As of 1 October, the 2012-2013 GPEI budget estimates for core costs, planned supplementary immunization activities and emergency response is US$ 2.18 billion, against which there is a funding gap of US$ 700 million (US$ 15 million for 2012 and US$ 685 million for 2013). New contributions of US$ 261 million for 2012-2013 were received during the period from June to September 2012 from Bangladesh, the Bill & Melinda Gates Foundation (BMGF), Estonia, JICA Loan Conversion (Pakistan), India, Nigeria, Nepal, Norway, Turkey, UNICEF, United Kingdom (DFID), USAID and US CDC. The Initiative is also tracking US$ 360 million in firm prospects; if donors fulfill these commitments then the overall funding gap for 2012-2013 will be further reduced to US$ 340 million.
The budget estimate of US$ 2.18 billion represents a slight decrease (US$ 6 million) compared to the May 2012 estimate. Although there were budget cuts across most budget lines, there were significant increases in operations costs (US$ 28 million) and technical assistance surge capacity (US$ 37 million) for the three remaining endemic countries (Afghanistan, Pakistan and Nigeria), primarily for 2013.
table 1 | gpEi 2012-2013 budget, as at October 2012 (all figures in US$ millions)
Budget, as at May 2,188.00
Budget Decreases -6.00
new budget (rounded) 2,182.00
Gap, as at May 945.00
Adjustments to confirmed funding* +24.00
Budget decreases -6.00
New Contributions -261.00
new gap (rounded) 700.00*Reconciliation of earlier projections with actual contributions.
India has shown irrefutably the technical feasibility of eradication. Global success is now a question of political and societal will, and sufficient and timely financing. Recognizing both the epidemiological opportunity and the significant and deadly consequences of failure, and to tip the balance in the
Global Polio Eradication Initiative’s (GPEI) favour, the World Health Assembly (WHA) in May 2012 adopted a Resolution declaring the completion of polio eradication a programmatic emergency for global public health. The three remaining endemic countries – Nigeria, Pakistan, Afghanistan – launched national polio emergency action plans, with the oversight of their respective Heads of State. Partner agencies of the GPEI also moved to an emergency footing, operating under the auspices of the Global Emergency Action Plan 2012-2013, to rapidly support countries’ efforts through increased technical assistance at the district level.
The emergency approaches are having an impact, with the lowest number of new cases in fewer districts of fewer countries than at any previous time. This year, as of 25 September 2012, 150 cases have been reported from Nigeria, Pakistan, Afghanistan and Chad. But the risks of not taking advantage of this once-in-a-generation opportunity remain high, if these emergency efforts are not fully and effectively implemented in the last few remaining countries, or are not fully funded. An acute cash shortage in 2012 forced the scaling back or cutting of activities in 24 high-risk countries, putting children in these areas at increased danger of contracting the disease. The Independent Monitoring Board (IMB), in its June 2012 report, underscored the potential consequences associated with the lack of financing, which it called ‘not compatible with the ambitious goal of stopping polio transmission globally’, and describing it as the ‘primary risk’ to eradication. Full financing and effective implementation of the Global Emergency Action Plan 2012-2013 can realistically and rapidly achieve a polio-free world. The May 2012 WHA Resolution declaring polio an emergency clearly outlines the role each stakeholder has to play to attain a polio-free world. It calls on remaining infected countries to fully implement the polio emergency action plans, and urges all Member States to ‘make available urgently the financial resources required for the full and continued implementation, to the end of 2013, of the necessary strategic approaches to interrupt wild poliovirus transmission globally.’ The implementing partners of the GPEI are also working through a new architecture that ensures greater accountability and the full engagement and oversight of the heads of agencies. Success is a global responsibility, and the benefits of success will be shared equally by all countries and peoples across the world.
On 27 September, the United Nations Secretary-General Ban Ki-moon hosted a high level event at the United Nations General Assembly called “Our Commitment to the Next Generation: The Legacy of a Polio-free World”, where leaders from around the world vowed to step up polio eradication efforts. Heads of state from Afghanistan, Nigeria and Pakistan stood alongside donor government officials and new donors from the public and private sector to outline what is needed to stamp out this disease forever: long-term commitment of resources, applying innovative best practices, and continued
1 | execUtive sUmmary

4 global polio eradication initiative
Financial resource requirements 2012–2013 | As of 1 october 2012
leadership and accountability at all levels of government in the endemic countries. Rotary International, which already has contributed US$ 1.2 billion to polio eradication, announced additional funding of $75 million over three years to GPEI. Canada announced an initiative to engage civil society to match funds to GPEI through Rotary and BMGF. In addition to expanding its grant support for Afghanistan, the Islamic Development Bank (IDB) announced a three-year $227 million financing package to Pakistan which will cover the majority of the country’s polio vaccination campaign costs. The United Kingdom also provided £25 million as part of its 5-year pledge to the GPEI.
In closing Dr Margaret Chan, Director-General of the World Health Organization said “Failure to eradicate polio is unforgiveable, forever. Failure is not an option. No single one of us can bring this long, hard drive over the last hurdle. But together we can.”
The GPEI is currently developing and budgeting a polio eradication endgame strategy and legacy plan 2013-2018. The initial budget estimate is US$ 5.5 billion over 6 years. The draft strategy will include the following components: eradication strategies, including strengthening routine immunization; management of associated risks; a process for developing the legacy options, and an indicative 2013-2018 budget. The endgame strategy, following a consultative process, will be shared with the Strategic Advisory Group of Experts on Immunization (SAGE) in November 2012 and then submitted to the WHO Executive Board in January 2013.
table 2 | summary of external resource requirements by major category of activity, 2012-2013 (all figures in US$ millions)
cOrE cOsts 2012 2013 2012-2013Emergency Response (OPV) $5.50 $20.00 $25.50Emergency Response (Ops) $20.00 $40.00 $60.00Emergency Response (Soc Mob) $1.50 $6.00 $7.50Surveillance and Running Costs (Incl. Security) $61.72 $63.47 $125.19Surge Capacity* $39.22 $33.23 $72.45Laboratory $11.13 $11.33 $22.46Technical Assistance (WHO) $128.47 $128.35 $256.81Technical Assistance (UNICEF) $28.75 $33.39 $62.15Certification and Containment $5.00 $5.00 $10.00Product Development for OPV Cessation $10.00 $10.00 $20.00Post-eradication OPV Stockpile $12.30 $0.00 $12.30
supplEmEntary immunizatiOn activitiEs 2012 2013 2012-2013Oral Polio Vaccine $295.40 $291.41 $586.82NIDs/SNIDs Operations (WHO-Bilateral) $332.10 $274.37 $606.47NIDs/SNIDs Operations (UNICEF) $21.30 $28.28 $49.58Social Mobilization for SIAs $71.98 $85.62 $157.60
subtotal $1,044.38 $1,030.45 $2,074.83Programme support costs (estimated)** $52.61 $54.53 $107.13
Grand total $1,096.99 $1,084.97 $2,181.96contributions $1,082.04 $399.38 $1,481.42funding Gap $14.95 $685.59 $700.54funding Gap (rounded) $15.00 $685.00 $700.00
* UNICEF Social Mobilization surge activities are included under SIA costs for the expanded activities.** Programme Support Costs (PSC) estimates are calculated based on sources and channel of funds.

5global polio eradication initiative
Financial resource requirements 2012–2013 | As of 1 october 2012
Figure 1 | annual expenditure 1988-2011, contributions and funding gap 2012-2013 (all figures in US$ millions)
1988-2011Total expended: US$ 9 billion
2012Funding Gap: US$ 15 million
2013Funding Gap: US$ 685 million
Figure 2 | Financing 2012-2013, us$ 1.48 billion contributions
Multilateral Sector 6%
Private Sector 20%
Domestic Resources23%
Non-G8OECD/Other 2%
Rotary International
Bill & Melinda Gates Foundation
World Bank
IFFIm
WHOUNICEF
JICA Loan Conversion
Canada USAID USCDC Russian FederationEC
India
Nigeria
Angola
AustraliaLuxembourg
Others
Bangladesh
UKJapan
G8 14%
Current Funding Gap: US$ 700 m of US$ 2.18 b budget
Firm Prospects: US$ 360 m Best Case Gap: US$ 340 m
‘Other’ includes: the Governments of Austria, Brunei Darussalam, Estonia, Finland, Monaco, Nepal and Turkey, plus other Institutions: Chevron (Angola), Central Emergency Response Fund (CERF), Common Humanitarian Fund (South Sudan), the GOOGLE Foundation/Matching Grant, Total E&P (Angola) and WHO core resources.

6 global polio eradication initiative
Financial resource requirements 2012–2013 | As of 1 october 2012
Figure 3 | comparison of budgets for countries conducting sias in 2012 as a % of country-level costs)
India
Nigeria
Pakist
an
Afghan
istan
DR Congo
Angola
Cha
dSu
dan
South
Suda
nNige
rMali
Burkin
a Fas
o
Côte d'
Ivoire
Ethiop
ia
Somali
a
Guinea
Ugand
aKen
ya
Yemen
Benin
CARGha
na
Sene
gal
Camero
on
Sierra
Leon
e
Liberi
a
Maurita
nia Togo
Congo
Guinea
Bissau
Gambia
Eritrea
Cape V
erde
Djibou
ti
Bangla
desh
Nepal
$0
Polio-endemic/Recently-endemic
countries 69%
$50
$100
$150
$200
$250
$300
$350
32%
18%
14%
4%
Re-establishedtransmission
15%Countries with recurrent importations
14%
Other importation-affected countries
2%
This Financial Resource Requirements (FRR) outlines the budget to implement the core strategies to stop polio and to institutionalize innovations to improve the quality of intensified SIAs, increase technical assistance to countries with re-established polio transmission, enhance surveillance, systematize the synergies between immunization systems and polio eradication and expand pre-planned vaccination campaigns across the “WPV importation belt” of sub-Saharan Africa. Filling sub-national surveillance gaps, revitalizing surveillance in polio-free Regions, implementing new global surveillance strategies and intensifying social mobilization work are also costed in the 2012–2013 budget.
With the launch of the Global Polio Emergency Action Plan 2012–2013 (EAP) in May 2012, the Initiative continues to work under an emergency operating framework. The financial requirements outlined in this document reflect the strategic and geographic priorities of the framework as well as the continued implementation of key activities of the Strategic Plan. The financial requirements incorporate the full scope of the Emergency Plan.
The FRR is updated regularly based on evolving epidemiology; this is the third issue of the year1. Financial requirements detailed here represent country requirements and are inclusive of agency (i.e. WHO and UNICEF) overhead costs.
Endemic/recently-endemic2 countries account for 69% of the country budgets; countries with re-established transmission for 15%; and, other importation-affected countries for 16%.
Just as high-cost control of polio transmission is not sustainable, low-cost control is not effective, since depending on routine immunization alone would lead to 200,000–250,000 cases per year. Neither scenario is optimal when eradication is feasible3. Previous cost-effectiveness studies4 have demonstrated that US$ 10 billion would be needed over a 20-year period to simply maintain polio cases at current levels, in contrast to the US$ 2.19 billion presented here. Financial modelling in 20105 estimated the financial benefits of polio eradication at US$ 40–50 billion. Most of those savings (85%) are expected in low-income countries.
2 | financial resoUrce reqUirements 2012–2013
1 While the FRR provides overall budget estimates, detailed budgets are available upon request.2 As of 28 February 2012, India is no longer considered to be a polio-endemic country. For the purposes of the current FRR, it is considered “recently-endemic”.3 Barrett S, Economics of eradication vs control of infectious diseases, Bulletin of the WHO, Volume 82, Number 9, September 2004, 639-718. http://www.who.int/bul-
letin/volumes/82/9/en/index.html4 Thompson KM, Tebbens RJ. Eradication versus control for poliomyelitis: an economic analysis. Lancet. 2007; 369(9570): 1363-71.5 Tebbens RD, et al. The Economic analysis of the global polio eradication initiative. Vaccine 2010, doi:10.1016/j.vaccine.2010.10.25.

7global polio eradication initiative
Financial resource requirements 2012–2013 | As of 1 october 2012
The spearheading partners of the GPEI are the World Health Organization (WHO), Rotary International, the US Centers for Disease Control and Prevention (CDC) and UNICEF. Rotary International is the leading private-sector donor to polio eradication, advocates with governments and communities and provides field-level support in SIA implementation and social mobilization. CDC deploys a wide range of public health assistance in the form of staff and consultants, provides specialized laboratory and diagnostic expertise and contributes funding.
UNICEF is the lead partner in support of communications and social mobilization, and in the procurement and distribution of oral polio vaccine for supplementary immunization activities. UNICEF also works with partners to strengthen routine immunization, including support to cold chain and vaccine distribution mechanisms at national and sub-national levels.
WHO is responsible for the systematic collection, collation and dissemination of standardized information on strategy implementation and impact, particularly in the areas of surveillance and supplementary immunization activities.
WHO also leads operational and basic research, provides technical and operational support to ministries of health, and coordinates training and deployment of human resources for supplementary technical assistance. WHO also serves as secretariat to the certification process and facilitates implementation and monitoring of bio containment activities.
The budgets that underpin the FRR are prepared by WHO, UNICEF and the national governments that manage the polio eradication activities. The funds to finance the activities flow from multiple channels, primarily through these stakeholders. Both UN agencies support the governments in the preparation and implementation of SIAs.
3 | roles and resPonsibilities of sPearheadinG Partners
A robust system of estimating costs drives the development of the global budget estimates from the micro-level up. A schedule for SIAs is drawn up based on the guidance of national Technical Advisory Groups (TAGs), Ministries of Health and the country offices of WHO and UNICEF. In 2011, for example, more than 2.35 billion doses of OPV were administered to more than 430 million children during 300 polio vaccination campaigns in 54 countries6.
The recommended schedule of SIAs is used by national governments, working with WHO and UNICEF, to develop budget estimates. These are based on plans drawn up for
SIAs at the local level and take into consideration local costs for all elements of an activity – trainings, community meetings, posters, announcements, vaccinator payments, vehicles, fuel, supplies, etc.
4.1. cost drivers of the GPei bUdGetThe key cost drivers of the GPEI budget are OPV and SIA operations, followed by technical assistance, social mobilization and surveillance7 (See Table 2).
4.1.1. oral polio vaccineUNICEF is the agency that procures vaccine for the GPEI, and works to ensure OPV supply security (with
4 | definition of the GPei activities and bUdGet estimates
6 In 2011, OPV was given during 144 National Immunization Days, 129 Sub-national Immunization Days, 10 mop-up campaigns and 17 Child Health Days. Children may have received more than one dose of OPV.
7 For 2012-2013, for example, OPV accounts for 29% of the budget, operations for 32%, technical assistance for 16%, social mobilization for 9% and surveillance for 6%, with the remainder being dedicated to emergency response, surge capacity, laboratories, research activities, etc.

8 global polio eradication initiative
Financial resource requirements 2012–2013 | As of 1 october 2012
0
500
1,000
1,500
2,000
2,500
3,000
0
0.02
0.04
0.06
0.08
0.1
0.12
0.14
0.16
0.18
MIL
LIO
NS
DO
SES
US$
PR
ICE
PER
DO
SE
tOPV
mOPV1
mOPV3
bOPV
2000 2001 2002 2003 2004 2005 2006 2007 2008 2009 2010 2011 2012 WAP
Figure 4 | Opv supply and weighted average price, 2000–2012
multiple suppliers), at a price that is both affordable to governments and donors and reasonably covers the minimum needs of manufacturers. In 2011, more than 1.6 billion doses of OPV were required for activities in areas with active poliovirus transmission.
Since 2005 the supply landscape has become more complex with the introduction of two types of monovalent OPV (types 1 and 3) and, in 2010, bivalent OPV. This has contributed to a rise in the weighted average price of OPV from US$ 0.08 per dose to approximately US$ 0.14
per dose since 2000. The flexibility of manufacturers, to adjust production based on the OPV formulation required, comes at a cost. Currency fluctuations, the demand for high titres and the finite lifespan of OPV – for which demand will drop after the eradication of polio – also contribute to this price increase.
Despite these factors, the weighted average price of each OPV dose in 2011 (US$ 0.128) and 2012 (US$ 0.127) show decreases since 2010.
4.1.2. operations costsSIAs are vast operations to deliver vaccine to every household: micro-plans have to be drawn up or updated for every dwelling in the area to be covered, whether a single district or an entire country. Vaccine has to be delivered to distribution centres throughout the target area. Vaccinators have to be trained to vaccinate children and mark fingers and houses, to document their work, to report their activities, to communicate with families appropriately, and so on. Vaccinators have to visit every household; supervisors and monitors have to scour every street for unvaccinated children.
Major factors affecting operations costs are the relative strength of the local infrastructure – whether it be roads, telecommunications or any of a host of facilities – and the local health system, the local economy, availability of semi-skilled workers, security conditions and population density. In 2011, 1.44 million paid vaccinators worked in SIAs; vaccinator per diems – to cover basic needs such as food and transport – constitute a large portion of operations costs8.
8 Based on local rates for semi-skilled labour and government remuneration for similar tasks.

9global polio eradication initiative
Financial resource requirements 2012–2013 | As of 1 october 2012
$ 0.00
$ 0.10
$ 0.20
$ 0.30
$ 0.40
$0.50
$ 0.60
$ 0.70
$ 0.80
$ 0.90
$ 1.00
Polio-endemic/Recently-endemic
countriesRe-establishedtransmission
Countries withrecurrent importations
Other importation-affected countries
Afghan
istan
Nigeria
Pakist
anInd
ia
South
Suda
nCha
d
Suda
n
Angola
DR Congo
Maurita
nia
Cape V
erde
Centra
l Afric
an Rep
.
Sierra
Leon
e
Liberi
a
Gambia
Kenya
Guinea
Bissau
Congo
Sene
gal
Somali
a
Ethiop
iaNige
r
Burkin
a Fas
o
Côte d'
Ivoire Mali
Ugand
aBen
in
Guinea
Ghana
Togo
Camero
on
Tajik
istan
Nepal
Bangla
desh
Figure 5 | Operations costs per child for sias, 2012 (all figures in US$, excluding PSC)
4.1.3. surveillanceSurveillance budgets cover the detection and reporting of acute flaccid paralysis (AFP) cases, through both an extensive informant network of people who first report cases of AFP and active searches in health facilities for such cases. Subsequent case investigation is followed by collection of two stool samples, transportation to the appropriate laboratory, testing and genetic sequencing, the range of activities related to the management of the information and data generated. The Global Polio Laboratory Network comprises 145 facilities, which in 2011 tested over 201,000 stool samples (from nearly 104,000 cases of AFP and other sources).
Some of the other activities included under surveillance budget lines are the training of personnel to carry out each of the steps outlined above, as well as regular reviews of the surveillance systems and the purchase and maintenance of equipment, from photocopiers to vehicles. In locations where there are security risks for polio staff, items such as armoured vehicles and appropriate communication equipment may be included in the surveillance budgets. The average cost per AFP case reported dropped from a high of more than US$ 1,500 in the year 2000, when there was heavy investment in establishing the infrastructure for AFP surveillance to approximately US$ 581 in 2010. The range among countries in cost per AFP case investigated is based on factors similar to those which affect differences in SIA costs.

10 global polio eradication initiative
Financial resource requirements 2012–2013 | As of 1 october 2012
Figure 7 | average cost per aFp case reported (aFr, Emr, sEar) (all figures in US$)*
0
500
1,000
1,500
2,000
2000 2001 2002 2003 2004 2005 2006 2007 2008 2009 2010
$ 1,711
$ 1,096 $ 1,106$ 1,194
$ 1,128
$ 866$ 815
$ 741 $ 722$772
$ 692
2011
$ 615
*Adjusted for inflation (2011 US$).
$ 0
$ 3,000
$ 6,000
$ 9,000
Polio-endemic/Recently-endemic
countriesRe-establishedtransmission
Countries withrecurrent importations
Otherimportation-
affectedcountries
Nigeria
Afghan
istan
Pakist
anInd
ia
Angola
Suda
nCha
d
DR Congo
Liberi
a
Somali
a
Centra
l Afric
an Rep
.
Maurita
nia
Ethiop
iaNige
rTo
go
Camero
onBen
inGha
na
Sierra
Leon
eMali
Burkin
a Fas
o
Guinea
Ugand
aKen
ya
Côte d'
Ivoire
Yemen
Eritrea
Nepal
Figure 6 | surveillance cost per aFp case analysis, 2011 (all figures in US$)*
*Figures represent 80% of 2011 data.

11global polio eradication initiative
Financial resource requirements 2012–2013 | As of 1 october 2012
EmErgEncy ‘surgE’ tO suppOrt EndEmic cOuntry EFFOrts
As part of the global emergency efforts, WHO and UNICEF have deployed significant new technical assistance to highest-risk areas to more effectively support the endemic countries’ eradication efforts.
In total, over 5,000 extra staff have been deployed in the three remaining endemic countries. The bulk of the new staff were already in place by mid-year, and the agencies’ surge in capacity is going hand-in-hand with the Governments, which are undertaking similar activities to scale up technical capacity.
The level of technical support is now significantly higher than that in place in the successful India eradication programme (when comparing ratio of staff to population size). The overriding priority is now to rapidly integrate the newly expanded workforce into a well-functioning operational outfit. Activities are therefore focusing on ensuring the necessary management and training is in place, with relevant administrative support, to ensure the scaled-up workforce can operate in the most efficient – and accountable – manner possible, and to begin making an impact on operations and epidemiology as quickly as possible.
nigeria pakistan
WHO
As of September 2012 1,800 301
End of 2012 (projected) 2,207 680
unicEF
As of September 2012 2,100 1,056
End of 2012 (projected) 2,500 1,200
total, end 2012 4,707 1,880
4.1.4. technical assistanceGPEI-funded technical assistance (staff and consultants) is deployed to fill capacity gaps when relevant skills are not available within a national health system, to build capacity and to facilitate international information exchange. The priorities for technical assistance are therefore driven by the relative strength of health systems in polio-affected countries as well as how critical the country is to global polio eradication. Matched against the number of children under the age of five years (i.e. the “target population”).
In the 2012 budget, technical assistance is heavily weighted towards the polio-endemic countries, with the next concentration of funds in countries with re-established transmission and recurrent importations areas, followed by polio-free regions, Regional Offices and Headquarters (Tables 3a + 3b).
This assistance provides the human resources necessary for immunization campaign planning, including communication and social mobilization strategy development and implementation, micro-planning, logistics, forecasting and supply management. Funding ensures resources are in place for overall communication capacity development, management skills in strategic planning, finance, human resources and social mobilization in a programme that manages some 20 million workers and volunteers, and communication efforts that help reach over 400 million children each year multiple times with OPV. Finally, technical assistance maintains the surveillance network, which provides reporting on AFP incidence from every district in the world on a weekly basis.
12 global polio eradication initiative
Financial resource requirements 2012–2013 | As of 1 october 2012
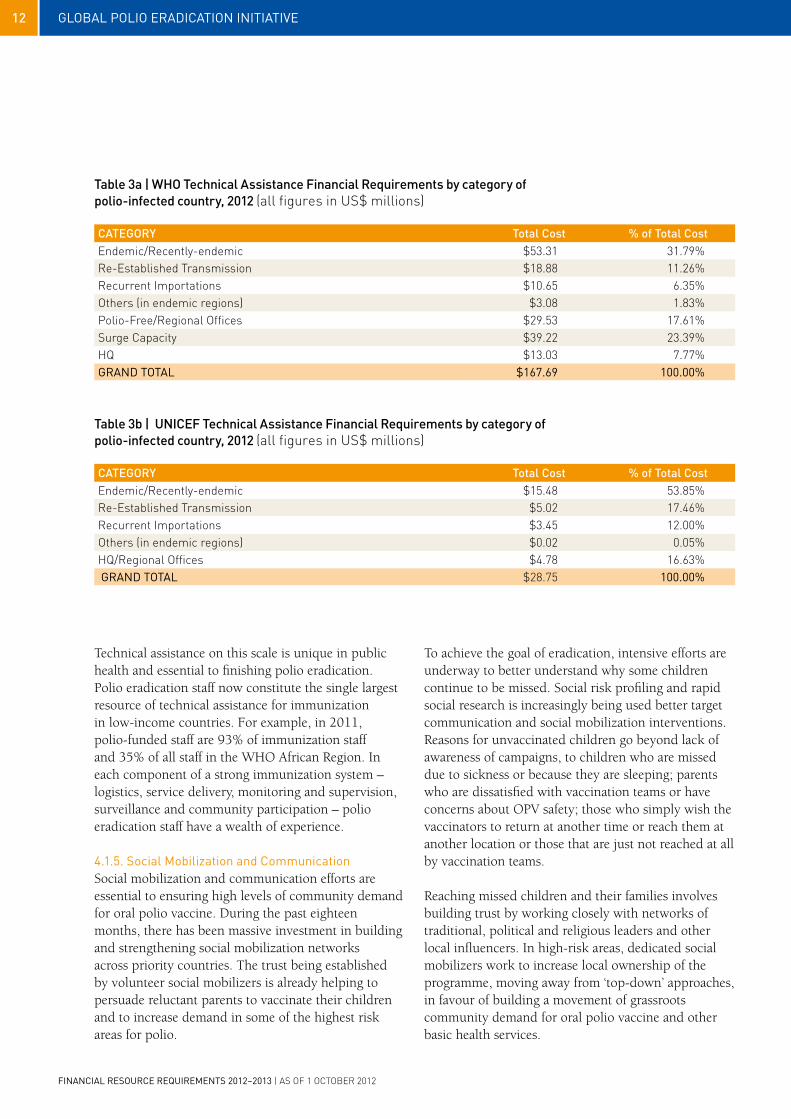
table 3a | WHO technical assistance Financial requirements by category of polio-infected country, 2012 (all figures in US$ millions)
catEgOry total cost % of total costEndemic/Recently-endemic $53.31 31.79%Re-Established Transmission $18.88 11.26%Recurrent Importations $10.65 6.35%Others (in endemic regions) $3.08 1.83%Polio-Free/Regional Offices $29.53 17.61%Surge Capacity $39.22 23.39%HQ $13.03 7.77%Grand total $167.69 100.00%
table 3b | unicEF technical assistance Financial requirements by category of polio-infected country, 2012 (all figures in US$ millions)
catEgOry total cost % of total costEndemic/Recently-endemic $15.48 53.85%Re-Established Transmission $5.02 17.46%Recurrent Importations $3.45 12.00%Others (in endemic regions) $0.02 0.05%HQ/Regional Offices $4.78 16.63% Grand total $28.75 100.00%
Technical assistance on this scale is unique in public health and essential to finishing polio eradication. Polio eradication staff now constitute the single largest resource of technical assistance for immunization in low-income countries. For example, in 2011, polio-funded staff are 93% of immunization staff and 35% of all staff in the WHO African Region. In each component of a strong immunization system – logistics, service delivery, monitoring and supervision, surveillance and community participation – polio eradication staff have a wealth of experience.
4.1.5. social mobilization and communicationSocial mobilization and communication efforts are essential to ensuring high levels of community demand for oral polio vaccine. During the past eighteen months, there has been massive investment in building and strengthening social mobilization networks across priority countries. The trust being established by volunteer social mobilizers is already helping to persuade reluctant parents to vaccinate their children and to increase demand in some of the highest risk areas for polio.
To achieve the goal of eradication, intensive efforts are underway to better understand why some children continue to be missed. Social risk profiling and rapid social research is increasingly being used better target communication and social mobilization interventions. Reasons for unvaccinated children go beyond lack of awareness of campaigns, to children who are missed due to sickness or because they are sleeping; parents who are dissatisfied with vaccination teams or have concerns about OPV safety; those who simply wish the vaccinators to return at another time or reach them at another location or those that are just not reached at all by vaccination teams.
Reaching missed children and their families involves building trust by working closely with networks of traditional, political and religious leaders and other local influencers. In high-risk areas, dedicated social mobilizers work to increase local ownership of the programme, moving away from ‘top-down’ approaches, in favour of building a movement of grassroots community demand for oral polio vaccine and other basic health services.

13global polio eradication initiative
Financial resource requirements 2012–2013 | As of 1 october 2012
Figure 8 | 2012-2013 social mobilization requirements, us$ 156.97 million*
Endemic/Recently-endemic 59.4%
Re-established 20.2%
Outbreak Countries plus unplanned activities 20.4%
* Includes requirements for unplanned activities.
The intensification of efforts to engage key community members requires increased financial resources. Pakistan’s plans for scale-up of the newly established Communication Network (COMNet) in the highest risk areas, has required a revised financial budget ($22.4 million) which constitutes a large proportion of the overall social mobilization requirements in this FRR publication. This level of community engagement significantly increases the cost per child reached in the high-risk areas, but is vital to ensure high campaign coverage and polio eradication as evidenced by the key role of Social Mobilization Network (SMNet) in India’s recent progress. The SMNet in India has been the driving force of community support for OPV demand; within communities, social mobilizers motivate teachers, religious leaders and local influencers to support polio eradication. India has now been polio-free for more than twelve months (and is no longer considered endemic).
In the 2012-2013 budget, 59.4% is allocated for the endemic/recently endemic and 20.2% for re-established countries. This includes the costs of intensified social mobilization in targeting chronically missed children in the high-risk areas of Pakistan and Nigeria, where new networks of local-level mobilizers, 1,200 and 2,500 in each country respectively, will be in the field by the end of 2012. The budget also includes the costs of maintaining the more than 9,000 community mobilizers that make up India’s SMNet.
As the GPEI operates in emergency mode, continued funding for social mobilization and communication is critical to enhance the existing capacities of endemic and re-established countries that have scaled-up activities in the last twelve months; and to maintain efforts in those countries that have persistent transmission such as Niger, Côte d’Ivoire, Mali, Cameroon, and the Central African Republic.

14 global polio eradication initiative
Financial resource requirements 2012–2013 | As of 1 october 2012
The role of research continues to expand with emphasis on the acceleration of both eradication activities and preparations for post-certification.
The research agenda to accelerate eradication helps identify ways to reach more children and to enhance both humoral and mucosal immunity in targeted populations. Scientific and operational research are guided by the Polio Research Committee, composed of experts in epidemiology, public health communications, virology and immunology. Throughout 2012, innovative new approaches evaluated in 2011, will be scaled up, such as the use of Geographic Information Systems (GIS) to improve microplan development and implementation, and use of mobile phone technology to facilitate real-time data collection and analysis. Lot Quality Assurance Sampling (LQAS), to more accurately verify quality of supplementary immunization activities, will be increasingly used in key endemic and outbreak settings. The Short Interval Additional Dose (SIAD) strategy, an approach used by the programme to more rapidly build population immunity through the successive administration of two doses of vaccine within a 1–2 week period, will be fully evaluated in a trial in Pakistan.
Research continues to play a critical part in evaluating implementation of eradication activities, and further sensitizing tactical approaches. Research is further evaluating the programmatic benefits of bivalent OPV in improving population immunity, assess programme performance, better tracking the evolving epidemiology of virus transmission, assessing and improving the quality of SIAs and related monitoring efforts, and evaluating new tools and strategies to predict and stop outbreaks and limit new international spread of virus.
For post-certification, research is assessing post-eradication risks and facilitating the development of new products and approaches to mitigate those risks (i.e. affordable inactivated poliovirus vaccine – IPV – options, antivirals, new diagnostics).
To develop affordable IPV options, a number of strategies are being pursued, including a schedule
5 | Polio research
reduction (the administration of fewer doses in a routine schedule); a reduction of the antigen dose (i.e., fractional-dose inactivated poliovirus vaccine); the use of adjuvants, resulting in a decreased need for antigen; optimization of production processes (i.e., increasing cell densities, creating new cell lines, or using alternative inactivation agents); and the development of an IPV produced from Sabin strains or further attenuated strains that would be appropriate for production in developing countries.
The goal of these strategies is to achieve a “break-even” IPV price of approximately US$ 0.50 per dose against OPV so that any country can adopt IPV in their routine immunization schedule after eradication.
Social data is an area where more innovation is needed, and UNICEF is working closely with partners to look at alternative methods and means – including the use of new technologies – for collecting, analysing and harnessing this vital information more quickly.
A number of countries, including Angola, Chad, DR Congo and Nigeria, have undertaken rapid qualitative social research in recent months to gain a deeper understanding of why children are missed. These studies are already revealing critical insights into local cultural beliefs around immunization. These findings are being used to fashion localized communication strategies, as well as – we hope – contribute to more effective operational approaches. Across the countries the research points to low risk perception of the disease, as well as concerns about OPV safety, and poor vaccinator team behavior and communication skills.
The on-going lack of systematic and reliable data on missed children – to reveal who, and why they go unvaccinated - continues to hamper communication and operational planning on the ground. Revising monitoring systems and forms will help bring greater intelligence and focus to programme strategies. This is an urgent priority in all countries, and until it is remedied, programmes are not reaching their potential, and children continue to be missed.

15global polio eradication initiative
Financial resource requirements 2012–2013 | As of 1 october 2012
The GPEI budget development is paired with a regular, interactive process of reviewing and reprioritizing activities in light of evolving epidemiology and available resources.
The GPEI reviews the epidemiology of poliovirus globally and the SIA priorities on an ongoing basis, guided by the advice of national and regional Technical Advisory Groups as well as the Strategic Advisory Group of Experts on Immunization (SAGE). The Independent Monitoring Board (IMB), started in December 2010 to evaluate – on a quarterly basis – the progress towards each of the major milestones of the GPEI Strategic Plan 2010–2012, determines the impact of any ‘mid-course corrections’ that are deemed necessary, and advise on additional measures appropriate.
An in-depth weekly epidemiological review is complemented by weekly and bi-weekly teleconference check-ins between WHO and UNICEF headquarters and regional offices which provide opportunities to adjust allocations. The FRR is therefore updated regularly to adapt to the changing epidemiology and priorities.
After a budget review process at the regional office and headquarters levels, funds for country SIAs are released from WHO and UNICEF headquarters to regions and then countries. For staff and surveillance, funds are disbursed on a quarterly or semi-annual basis, depending on the GPEI cash flow. For most countries, funds for OPV are released by UNICEF six to eight weeks before SIAs.
6 | revieW of the GPei bUdGets and allocation of fUnds

16 global polio eradication initiative
Financial resource requirements 2012–2013 | As of 1 october 2012
table 4 | donor profiles for 1985–2014 (contributions in US$ millions)
contribution Public sector Partners development banks Private sector Partners
›1,000United Kingdom,
United States of AmericaBill & Melinda Gates Foundation,
Rotary International500–1,000 World Bank250–499 Canada, Germany, Japan
100–249European Commission,
GAVI/IFFIm, Netherlands, UNICEF, WHO
50–99 Australia, Norway
25–49 Denmark, France, Italy, Russian Federation, Sweden United Nations Foundation
5–24 Ireland, Luxembourg, Saudi Arabia, Spain
American Red Cross, Crown Prince of Abu Dhabi, IFPMA,
Sanofi Pasteur, UNICEF National Committees,
Oil for Food Program
1–4
Austria, Belgium, Finland, Kuwait, Malaysia, Monaco, New Zealand, Portugal, Switzerland,
United Arab Emirates
African Development Bank, Inter-American Development
Bank
Advantage Trust (HK), Central Emergency Response Fund (CERF), De Beers, Google Foundation, International
Federation of Red Cross and Red Crescent Societies, OPEC, Pew Charitable Trust, Wyeth,
Shinnyo-en
Since the 1988 World Health Assembly (WHA) resolution to eradicate polio, funding commitments have totalled over US$ 9 billion. In addition to contributions by national governments to their own polio eradication efforts, 52 public and private donors have each given more than US$ 1 million, with 21 of these having given US$ 25 million or more.
Donors to the GPEI include a wide range of donor governments, private foundations (e.g. Rotary International, BMGF, United Nations Foundation), multilateral organizations, development banks, NGOs and corporate partners. Several of these partners have contributed in excess of US$ 250 million to the global eradication effort, including the United States of America, Rotary International, BMGF, India, the United Kingdom, the World Bank, Japan, Germany, and Canada.
7 | donors
International contributions to national polio eradication efforts have been complemented by domestic resources. As of 1 October 2012, domestic funding pledged towards the 2012–2013 budget continues to surpass G8 contributions. India, who has largely self-financed for the past several years, provided US$ 416 million in 2010–2011 and is projected to contribute US$ 240.5 million for 2012 and US$ 207 million for 2013. Nigeria, Pakistan and Angola have also provided substantial domestic resources towards eradicating polio. Other contributions from polio-affected countries – including both financial and non-monetary expenditures, and in-kind contributions such as the time spent by volunteers, health workers and others in the planning and implementation of SIAs – are estimated to have a dollar value approximately equal to that of international financial contributions.9
9 Aylward R, et al, Politics and practicalities of polio eradication, Global Public Goods for Health. Health Economic and Public Health Perspectives, editors Smith R, Beaglehole R, Woodward D, Drager N. Oxford University Press, 2003.
17global polio eradication initiative
Financial resource requirements 2012–2013 | As of 1 october 2012
Countries with poliovirus within the last 6 months Countries with poliovirus between 6 and 12 months
Countries with no poliovirus for more than 12 months Not conducted (Jan-June)/ At-risk (July-December)
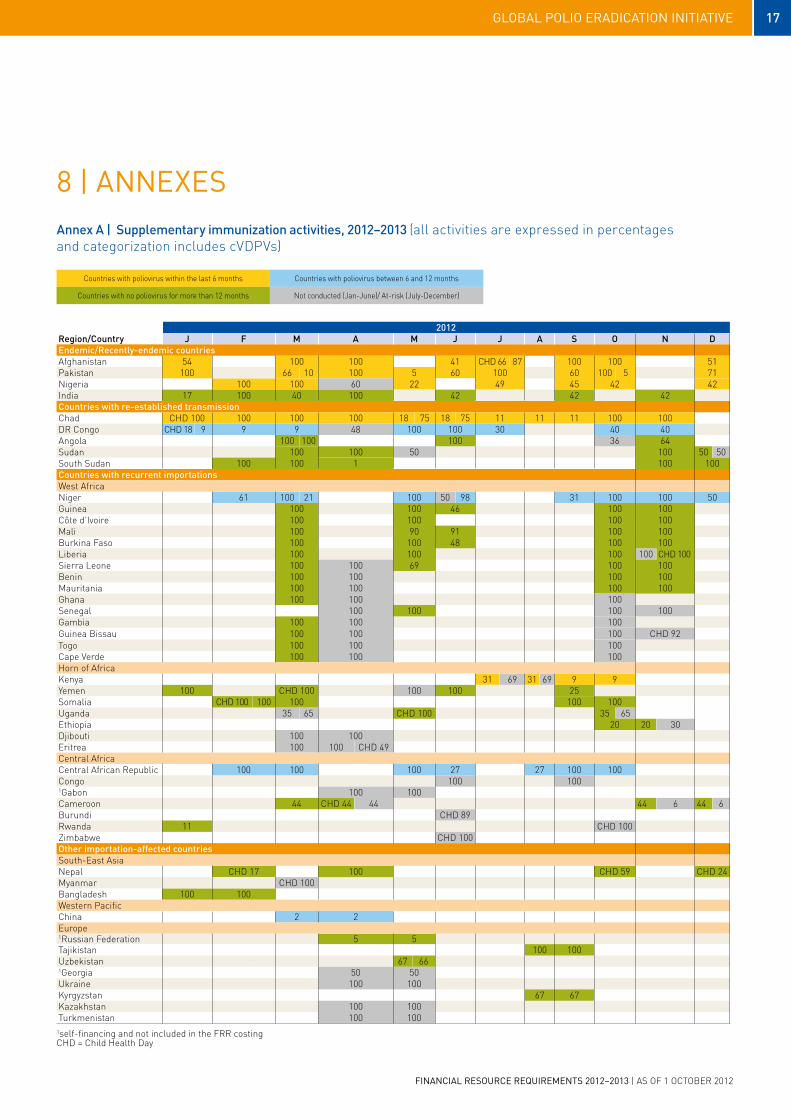
2012region/country J F m a m J J a s O n dEndemic/recently-endemic countriesAfghanistan 54 100 100 41 CHD 66 87 100 100 51Pakistan 100 66 10 100 5 60 100 60 100 5 71Nigeria 100 100 60 22 49 45 42 42India 17 100 40 100 42 42 42countries with re-established transmissionChad CHD 100 100 100 100 18 75 18 75 11 11 11 100 100DR Congo CHD 18 9 9 9 48 100 100 30 40 40Angola 100 100 100 36 64Sudan 100 100 50 100 50 50South Sudan 100 100 1 100 100countries with recurrent importationsWest AfricaNiger 61 100 21 100 50 98 31 100 100 50Guinea 100 100 46 100 100Côte d’Ivoire 100 100 100 100Mali 100 90 91 100 100Burkina Faso 100 100 48 100 100Liberia 100 100 100 100 CHD 100Sierra Leone 100 100 69 100 100Benin 100 100 100 100Mauritania 100 100 100 100Ghana 100 100 100Senegal 100 100 100 100Gambia 100 100 100Guinea Bissau 100 100 100 CHD 92Togo 100 100 100Cape Verde 100 100 100Horn of AfricaKenya 31 69 31 69 9 9Yemen 100 CHD 100 100 100 25Somalia CHD 100 100 100 100 100Uganda 35 65 CHD 100 35 65Ethiopia 20 20 30Djibouti 100 100Eritrea 100 100 CHD 49Central AfricaCentral African Republic 100 100 100 27 27 100 100Congo 100 1001Gabon 100 100Cameroon 44 CHD 44 44 44 6 44 6Burundi CHD 89Rwanda 11 CHD 100Zimbabwe CHD 100Other importation-affected countriesSouth-East Asia Nepal CHD 17 100 CHD 59 CHD 24Myanmar CHD 100Bangladesh 100 100Western PacificChina 2 2Europe1Russian Federation 5 5Tajikistan 100 100Uzbekistan 67 661Georgia 50 50Ukraine 100 100Kyrgyzstan 67 67Kazakhstan 100 100Turkmenistan 100 100
1self-financing and not included in the FRR costingCHD = Child Health Day
annex a | supplementary immunization activities, 2012–2013 (all activities are expressed in percentages and categorization includes cVDPVs)
8 | annexes

18 global polio eradication initiative
Financial resource requirements 2012–2013 | As of 1 october 2012
2013region/country J F m a m J J a s O n dEndemic/recently-endemic countriesAfghanistan 30 100 30 100 100 30 100 30Pakistan 100 10 40 50 100 100 50 100 50Nigeria 100 100 40 40 40 40 40 40India 100 100 50 50 50 50countries with re-established transmissionChad 100 100 100 100DR Congo 100 100 50 50Angola 100 100 50 50Sudan 100 100 50 50South Sudan 100 100 100 100countries with recurrent importationsWest AfricaNiger 100 100 100 100Guinea 100 100 100Côte d’Ivoire 100 100 100Mali 100 100 100Burkina Faso 100 100 100Liberia 100 100 100Sierra Leone 100 100 100Benin 100 100 100 100Mauritania 100 100Ghana 100 100Senegal 100 100Gambia 100 100Guinea Bissau 100 100Togo 100 100Cape Verde 100 100Horn of AfricaKenya 35 35Yemen 100 100Somalia 100 100 100Uganda 35 35Ethiopia 100 100Djibouti 100 100Eritrea 100 100Central AfricaCentral African Republic 100 100 100Congo 100 100Cameroon 50 50Other importation-affected countriesSouth-East Asia Nepal 100 100Bangladesh 100 100EuropeTajikistan 50 50Uzbekistan 50 501Georgia 50 50Kyrgyzstan 50 50
annex a (continued)
Countries with poliovirus within the last 6 months Countries with poliovirus between 6 and 12 months Countries with no poliovirus for more than 12 months

19global polio eradication initiative
Financial resource requirements 2012–2013 | As of 1 october 2012
annex b | details of external funding requirements in polio-endemic and highest-risk countries, 2012–2013, excluding programme support costs (all figures in US$ millions)
2012
country afP surveillance
social moblization
technical assistance oPv op costs total costs
2012Endemic/recently-endemic countriesAfghanistan $2.35 $2.56 $9.24 $8.42 $14.83 $37.40India $6.72 $16.01 $18.81 $128.52 $124.19 $294.26Pakistan $3.23 $22.42 $19.69 $51.08 $31.17 $127.59Nigeria $12.50 $4.22 $52.52 $39.70 $63.41 $172.36countries with re-established transmissionChad $0.88 $5.67 $7.90 $4.22 $6.72 $25.39Angola $1.85 $2.55 $9.44 $3.79 $9.04 $26.67DR Congo $2.19 $5.14 $10.50 $10.45 $20.34 $48.61Sudan $0.52 $0.96 $1.16 $4.19 $10.12 $16.94South Sudan $1.24 $1.46 $4.48 $2.29 $7.33 $16.80countries with recurrent importationsWest Africa Niger $0.57 $1.05 $1.49 $5.08 $8.48 $16.66Côte d'Ivoire $0.28 $0.79 $1.31 $4.38 $4.76 $11.52Mali $0.25 $0.83 $0.19 $5.03 $7.71 $14.00Guinea $0.18 $0.31 $0.33 $2.13 $3.14 $6.09Burkina Faso $0.26 $0.82 $0.35 $4.58 $6.94 $12.95Liberia $0.22 $0.25 $0.54 $0.70 $1.72 $3.43Sierra Leone $0.22 $0.42 $0.47 $0.77 $1.72 $3.59Ghana $0.35 $0.33 $0.18 $0.96 $2.54 $4.36Mauritania $0.18 $0.54 $0.16 $0.34 $1.10 $2.31Senegal $0.31 $0.61 $0.16 $0.52 $2.73 $4.33Benin $0.18 $0.48 $0.45 $1.72 $2.42 $5.24Gambia $0.05 $0.11 $0.07 $0.05 $0.21 $0.50Guinea Bissau $0.06 $0.17 $0.14 $0.05 $0.30 $0.73Togo $0.13 $0.21 $0.19 $0.29 $0.84 $1.66Cape Verde $0.04 $0.04 $0.01 $0.02 $0.10 $0.21Horn of AfricaKenya $0.43 $0.26 $1.08 $1.03 $2.41 $5.21Ethiopia $2.98 $0.30 $1.86 $0.86 $3.61 $9.60Uganda $0.39 $0.32 $0.58 $1.80 $2.89 $5.97Somalia $0.62 $0.15 $2.17 $0.50 $2.93 $6.37Djibouti $0.05 - $0.01 $0.00 $0.00 $0.06Eritrea $0.13 - $0.18 $0.00 $0.00 $0.31Yemen $0.19 - $0.24 $2.12 $2.93 $5.49Central Africa Congo $0.13 $0.00 $0.54 $0.00 $0.00 $0.67Cameroon $0.39 $0.55 $0.63 $0.96 $1.64 $4.17Central African Republic $0.46 $0.80 $0.80 $0.48 $1.95 $4.49Madagascar $0.39 - $0.07 $0.00 $0.11 $0.58Other importation-affected countriesSouth-East Asia Nepal $0.45 - $1.64 $1.10 $0.48 $3.67Bangladesh $1.03 - $1.45 $7.26 $2.60 $12.34EuropeTajikistan $0.12 - - - - $0.12Uzbekistan $0.04 - - - - $0.04Georgia* $0.04 - - - - $0.04Kyrgystan $0.01 - - - - $0.01
*Self-financing

20 global polio eradication initiative
Financial resource requirements 2012–2013 | As of 1 october 2012
annex b (continued)
2013
country afP surveillance
social moblization
technical assistance oPv op costs total costs
2013Endemic/recently-endemic countriesAfghanistan $2.42 $4.19 $9.16 $8.62 $13.12 $37.51India $6.80 $16.54 $18.25 $133.48 $81.66 $256.74Pakistan $3.33 $23.34 $17.61 $47.23 $27.44 $118.95Nigeria $12.88 $3.92 $49.58 $35.16 $68.60 $170.13countries with re-established transmissionChad $0.90 $6.56 $8.10 $2.57 $3.36 $21.49Angola $1.91 $2.18 $9.43 $3.39 $10.61 $27.53DR Congo $2.25 $4.42 $12.67 $9.42 $18.07 $46.83Sudan $0.53 $0.83 $1.24 $3.88 $7.53 $14.01South Sudan $1.27 $1.88 $5.01 $2.48 $7.40 $18.03countries with recurrent importationsWest Africa Niger $0.59 $1.47 $1.41 $3.23 $5.54 $12.24Côte d'Ivoire $0.29 $0.81 $1.31 $3.09 $4.46 $9.96Mali $0.25 $0.98 $0.15 $3.35 $4.93 $9.66Guinea $0.18 $0.21 $0.33 $1.59 $2.30 $4.61Burkina Faso $0.27 $0.71 $0.35 $3.13 $4.79 $9.25Liberia $0.23 $0.24 $0.54 $0.41 $1.33 $2.75Sierra Leone $0.23 $0.93 $0.47 $0.62 $1.44 $3.68Ghana $0.36 $0.78 $0.19 $1.91 $2.69 $5.93Mauritania $0.18 $0.81 $0.12 $0.24 $0.76 $2.10Senegal $0.32 $0.65 $0.17 $1.04 $0.93 $3.12Benin $0.18 $0.93 $0.44 $2.90 $3.35 $7.80Gambia $0.05 $0.12 $0.06 $0.11 $0.21 $0.56Guinea Bissau $0.06 $0.30 $0.14 $0.10 $0.29 $0.90Togo $0.14 $0.14 $0.19 $0.59 $0.88 $1.93Cape Verde $0.05 $0.01 $0.01 $0.04 $0.10 $0.21Horn of AfricaKenya $0.44 $0.64 $0.85 $0.75 $1.54 $4.22Ethiopia $3.07 $1.23 $1.68 $5.32 $11.01 $22.31Uganda $0.40 $0.08 $0.58 $0.78 $1.17 $3.01Somalia $0.64 $0.50 $1.37 $1.07 $2.30 $5.87Djibouti $0.01 - $0.01 $0.00 $0.32 $0.34Eritrea $0.14 $0.06 $0.18 $0.00 $0.28 $0.65Yemen $0.19 - $0.26 $1.26 $4.09 $5.80Central Africa Congo $0.14 $0.44 $0.55 $0.33 $0.73 $2.18Cameroon $0.41 $0.78 $0.63 $0.92 $0.98 $3.71Central African Republic $0.47 $1.12 $0.60 $0.44 $1.09 $3.73Madagascar - - - - - $0.00Other importation-affected countriesSouth-East Asia Nepal $0.49 $0.22 $1.65 $1.86 $2.48 $6.69Bangladesh $1.06 $0.90 $1.21 $9.18 $2.65 $15.01EuropeTajikistan $0.13 - - $0.22 $0.38 $0.73Uzbekistan $0.04 $0.20 - $0.53 $0.92 $1.68Georgia* $0.04 - - $0.04 $0.08 $0.16Kyrgyzstan $0.01 - - $0.12 $0.21 $0.35
*Self-financing

21global polio eradication initiative
Financial resource requirements 2012–2013 | As of 1 october 2012
annex b (continued)
2012-2013
country total afP surveillance
total social moblization
total tech. assistance total oPv total op costs total costs
2012-2013Endemic/recently-endemic countriesAfghanistan $4.78 $6.75 $18.40 $17.04 $27.95 $74.91India $13.52 $32.55 $37.06 $262.00 $205.86 $551.00Pakistan $6.56 $45.76 $37.30 $98.31 $58.61 $246.55Nigeria $25.38 $8.14 $102.10 $74.86 $132.01 $342.49countries with re-established transmissionChad $1.78 $12.23 $16.00 $6.80 $10.08 $46.89Angola $3.76 $4.73 $18.88 $7.18 $19.65 $54.20DR Congo $4.44 $9.56 $23.17 $19.87 $38.41 $95.45Sudan $1.05 $1.79 $2.40 $8.07 $17.64 $30.94South Sudan $2.51 $3.34 $9.48 $4.78 $14.73 $34.83countries with recurrent importationsWest Africa Niger $1.16 $2.52 $2.91 $8.31 $14.02 $28.90Côte d'Ivoire $0.57 $1.60 $2.61 $7.48 $9.22 $21.48Mali $0.50 $1.81 $0.34 $8.38 $12.64 $23.66Guinea $0.36 $0.52 $0.65 $3.73 $5.44 $10.69Burkina Faso $0.53 $1.53 $0.70 $7.71 $11.73 $22.20Liberia $0.44 $0.49 $1.08 $1.11 $3.05 $6.18Sierra Leone $0.44 $1.35 $0.94 $1.38 $3.16 $7.27Ghana $0.71 $1.11 $0.37 $2.87 $5.23 $10.29Mauritania $0.36 $1.35 $0.28 $0.58 $1.86 $4.41Senegal $0.62 $1.26 $0.33 $1.57 $3.67 $7.45Benin $0.36 $1.41 $0.89 $4.62 $5.77 $13.04Gambia $0.11 $0.23 $0.13 $0.16 $0.42 $1.05Guinea Bissau $0.12 $0.47 $0.29 $0.15 $0.60 $1.63Togo $0.27 $0.35 $0.37 $0.88 $1.72 $3.58Cape Verde $0.09 $0.05 $0.02 $0.06 $0.20 $0.42Horn of AfricaKenya $0.87 $0.91 $1.93 $1.78 $3.94 $9.43Ethiopia $6.04 $1.53 $3.53 $6.18 $14.62 $31.91Uganda $0.78 $0.39 $1.16 $2.58 $4.06 $8.98Somalia $1.25 $0.65 $3.53 $1.57 $5.23 $12.24Djibouti $0.06 - $0.02 $0.00 $0.32 $0.40Eritrea $0.27 $0.06 $0.36 $0.00 $0.28 $0.96Yemen $0.38 $0.00 $0.50 $3.39 $7.02 $11.29Central Africa Congo $0.27 $0.44 $1.09 $0.33 $0.73 $2.85Cameroon $0.80 $1.33 $1.26 $1.88 $2.62 $7.89Central African Republic $0.92 $1.92 $1.41 $0.92 $3.04 $8.22Madagascar $0.39 - $0.07 $0.00 $0.11 $0.58Other importation-affected countriesSouth-East Asia Nepal $0.95 $0.22 $3.29 $2.96 $2.96 $10.37Bangladesh $2.09 $0.90 $2.66 $16.44 $5.25 $27.35EuropeTajikistan $0.25 $0.00 - $0.22 $0.38 $0.85Uzbekistan $0.07 $0.20 - $0.53 $0.92 $1.72Georgia* $0.07 $0.00 - $0.04 $0.08 $0.19Kyrgyzstan $0.02 - $0.00 $0.12 $0.21 $0.36
*Self-financing

22 global polio eradication initiative
Financial resource requirements 2012–2013 | As of 1 october 2012
WHO african region 2012Algeria $0.03Angola $1.85Benin $0.18Botswana $0.09Burkina Faso $0.26Burundi $0.09Cameroon $0.39Cape Verde $0.04Central African Republic $0.46Chad $0.88Comoros $0.04Congo $0.13Côte d'Ivoire $0.28DR Congo $2.19Equatorial Guinea $0.04Eritrea $0.13Ethiopia $2.98Gabon $0.09Gambia $0.05Ghana $0.35Guinea $0.18Guinea-Bissau $0.06Kenya $0.43Lesotho $0.04Liberia $0.22Madagascar $0.39Malawi $0.18Mali $0.25Mauritania $0.18Mauritius $0.02Mozambique $0.26Namibia $0.13Niger $0.57Nigeria $12.50Rwanda $0.11Sao Tome and Principe $0.01Senegal $0.31Seychelles $0.01Sierra Leone $0.22South Africa $0.26Swaziland $0.07Togo $0.13Uganda $0.39United Republic of Tanzania $0.39Zambia $0.35Zimbabwe $0.24Regional surveillance and laboratory $5.29Subtotal $33.72
WHO Western pacific region 2012Regional surveillance and laboratory $0.82
WHO Eastern mediterranean region 2012Afghanistan $2.35Djibouti $0.05Egypt $0.37Iraq $0.06Pakistan $3.23Somalia $0.62Sudan $0.52South Sudan $1.24Yemen $0.19Regional surveillance and laboratory $1.50Subtotal $10.13
annex c | surveillance and laboratory costs by country and region, 2012 (all figures in US$ millions)
WHO European region 2012Armenia $0.01Azerbaijan $0.03Bosnia and Herzegovina $0.08Georgia $0.04Kazakhstan $0.01Kyrgyzstan $0.01Moldova $0.01Tajikistan $0.12Turkey $0.01Turkmenistan $0.04Ukraine $0.04Uzbekistan $0.04Regional surveillance and laboratory $1.48Subtotal $1.89
WHO south-East asia region 2012Bangladesh $1.03India $6.72Indonesia $0.76Myanmar $0.40Nepal $0.45Regional surveillance and laboratory $5.01Subtotal $14.39
WHO/Hq 2012WHO/HQ $11.31
WHO region of the americas 2012Regional surveillance and laboratory $0.60
global 2012Total $72.85

23global polio eradication initiative
Financial resource requirements 2012–2013 | As of 1 october 2012
WHO african region 2013Algeria $0.03Angola $1.91Benin $0.18Botswana $0.09Burkina Faso $0.27Burundi $0.09Cameroon $0.41Cape Verde $0.05Central African Republic $0.47Chad $0.90Comoros $0.05Congo $0.14Côte d'Ivoire $0.29DR Congo $2.25Equatorial Guinea $0.05Eritrea $0.14Ethiopia $3.07Gabon $0.09Gambia $0.05Ghana $0.36Guinea $0.18Guinea-Bissau $0.06Kenya $0.44Lesotho $0.05Liberia $0.23Madagascar $0.40Malawi $0.18Mali $0.25Mauritania $0.18Mauritius $0.02Mozambique $0.27Namibia $0.14Niger $0.59Nigeria $12.88Rwanda $0.11Sao Tome and Principe $0.01Senegal $0.32Seychelles $0.01Sierra Leone $0.23South Africa $0.27Swaziland $0.07Togo $0.14Uganda $0.40United Republic of Tanzania $0.41Zambia $0.36Zimbabwe $0.25Regional surveillance and laboratory $5.45Subtotal $34.73
WHO Western pacific region 2013Regional surveillance and laboratory $0.84
WHO Eastern mediterranean region 2013Afghanistan $2.42Djibouti $0.05Egypt $0.38Iraq $0.06Pakistan $3.33Somalia $0.64Sudan $0.53South Sudan $1.27Yemen $0.19Regional surveillance and laboratory $1.55Subtotal $10.42
WHO European region 2013Armenia $0.01Azerbaijan $0.03Bosnia and Herzegovina $0.08Georgia $0.04Kazakhstan $0.01Kyrgyzstan $0.01Moldova $0.01Tajikistan $0.13Turkey $0.01Turkmenistan $0.04Ukraine $0.04Uzbekistan $0.04Regional surveillance and laboratory $1.39Subtotal $1.82
WHO south-East asia region 2013Bangladesh $1.06India $6.80Indonesia $0.79Myanmar $0.42Nepal $0.49Regional surveillance and laboratory $5.17Subtotal $14.72
WHO/Hq 2013WHO/HQ $11.65
WHO region of the americas 2013Regional surveillance and laboratory $0.62
global 2013Total $74.79
annex c (continued)

24 global polio eradication initiative
Financial resource requirements 2012–2013 | As of 1 october 2012
annex d | technical assistance, country-level details 2012-2013, excluding programme support costs (all figures in US$ millions)
WHO african region 2012Angola $7.22Benin $0.25Botswana $0.15Burkina Faso $0.23Burundi $0.04Cameroon $0.55Central African Republic $0.60Chad $2.84Congo $0.33Côte d'Ivoire $1.06DR Congo $6.29Equatorial Guinea $0.13Eritrea $0.18Ethiopia $1.51Gabon $0.27Gambia $0.06Ghana $0.12Guinea $0.08Guinea-Bissau $0.13Kenya $0.85Lesotho $0.09Liberia $0.48Madagascar $0.07Malawi $0.10Mali $0.15Mauritania $0.06Mozambique $0.41Namibia $0.24Niger $1.16Nigeria $23.83Rwanda $0.19Senegal $0.14Sierra Leone $0.43South Africa $0.69Swaziland $0.15Togo $0.19Uganda $0.41United Republic of Tanzania $0.40Zambia $0.65Zimbabwe $0.18IST (Central block) $1.12IST (South/East block) $1.60IST (West block) $1.21Regional Office $1.29Subtotal $58.11
WHO Eastern mediterranean region 2012Afghanistan $4.73Djibouti $0.01Egypt $0.07Iran $0.01Pakistan $8.15Somalia $1.44Sudan $1.10South Sudan $3.66Yemen $0.24Regional Office $1.78Subtotal $21.20
surge capacity 2012Afghanistan $1.06Angola $1.69Chad $3.13DR Congo $2.52Nigeria $22.45Pakistan $7.97Kenya $0.04United Republic of Tanzania $0.03Uganda $0.03Regional Office $0.31Subtotal $39.22
WHO European region 2012Regional Office/Countries $1.60Subtotal $1.60
WHO 2012WHO/HQ $13.03Short Term Tech Assistance $11.46Subtotal $24.49
unicEF 2012UNICEF HQ/RO $4.78Afghanistan $3.45India $2.22Pakistan $3.57Nigeria $6.24Chad $1.93Angola $0.54DR Congo $1.68Sudan $0.06South Sudan $0.82Niger $0.33Côte d'Ivoire $0.25Mali $0.04Guinea $0.25Burkina Faso $0.12Liberia $0.06Sierra Leone $0.04Ghana $0.07Mauritania $0.10Senegal $0.03Benin $0.19Gambia $0.01Guinea Bissau $0.01Togo $0.00Cape Verde $0.01Kenya $0.23Ethiopia $0.35Uganda $0.17Somalia $0.73Congo $0.21Cameroon $0.08Central African Republic $0.20Nepal $0.02Subtotal $28.75
global WHO-unicef 2012Total $196.44
WHO south-East asia region 2012Bangladesh $1.45India $16.59Indonesia $0.80Myanmar $0.39Nepal $1.63Regional Office $1.56Subtotal $22.41
WHO Western pacific region 2012Regional Office $0.66Subtotal $0.66
* IST= Inter-country Support Team

25global polio eradication initiative
Financial resource requirements 2012–2013 | As of 1 october 2012
annex d (continued)
WHO african region 2013Angola $7.22Benin $0.25Botswana $0.15Burkina Faso $0.23Burundi $0.04Cameroon $0.55Central African Republic $0.60Chad $2.84Congo $0.33Côte d'Ivoire $1.06DR Congo $6.29Equatorial Guinea $0.13Eritrea $0.18Ethiopia $1.51Gabon $0.27Gambia $0.06Ghana $0.12Guinea $0.08Guinea-Bissau $0.13Kenya $0.85Lesotho $0.09Liberia $0.48Madagascar $0.07Malawi $0.10Mali $0.15Mauritania $0.06Mozambique $0.41Namibia $0.24Niger $1.16Nigeria $23.83Rwanda $0.19Senegal $0.14Sierra Leone $0.43South Africa $0.69Swaziland $0.15Togo $0.19Uganda $0.41United Republic of Tanzania $0.40Zambia $0.65Zimbabwe $0.18IST (Central block) $1.12IST (South/East block) $1.60IST (West block) $1.21Regional Office $1.29Subtotal $58.11
WHO Eastern mediterranean region 2013Afghanistan $4.97Djibouti $0.01Egypt $0.07Iraq $0.01Pakistan $7.32Somalia $1.51Sudan $1.15South Sudan $3.84Yemen $0.26Regional Office $1.87Subtotal $21.02
surge capacity 2013Afghanistan $1.11Angola $1.69Chad $3.13DR Congo $2.52Nigeria $16.52Pakistan $7.85Kenya $0.04United Republic of Tanzania $0.03Uganda $0.03Regional Office $0.31Subtotal $33.23
WHO European region 2013Regional Office/Countries $1.65Subtotal $1.65
WHO 2013WHO/HQ $13.42Short Term Tech Assistance $11.81Subtotal $25.23
unicEF 2013UNICEF HQ/RO $6.23Afghanistan $3.08India $1.90Pakistan $2.45Nigeria $9.23Chad $2.13Angola $0.54DR Congo $3.86Sudan $0.09South Sudan $1.17Niger $0.25Benin $0.19Burkina Faso $0.12Côte d'Ivoire $0.25Sierra Leone $0.04Guinea $0.25Liberia $0.06Mauritania $0.06Senegal $0.03Guinea Bissau $0.01Cape Verde $0.01Togo $0.00Ghana $0.07Ethiopia $0.17Somalia $0.73Uganda $0.17Cameroon $0.08Congo $0.22Nepal $0.02Subtotal $33.39
global WHO-unicef 2013Total $194.97
WHO south-East asia region 2013Bangladesh $1.21India $16.35Indonesia $0.52Myanmar $0.39Nepal $1.63Regional Office $1.56Subtotal $21.66
WHO Western pacific region 2013Regional Office $0.68Subtotal $0.68
* IST= Inter-country Support Team

26 global polio eradication initiative
Financial resource requirements 2012–2013 | As of 1 october 2012
annex E | confirmed/tentative* funding and funding gaps for polio-endemic, recently-endemic and re-established transmission countries (all amounts in US$ millions, excluding indirect (overhead) costs)
2012 2013 2012–2013national immunization days (nids) 4 4 8sub-national immunization days (snids) 4 4 8
ORAL POLIO VACCINErequirements $8.42 $8.62 $17.04confirmed funding CIDA $3.53 $0.00 $3.53AusAID $0.62 $0.00 $0.62Japan $3.79 $0.00 $3.79National Committee for UNICEF (Saudi Arabia) $0.48 $0.00 $0.48
total $8.42 $0.00 $8.42tentative funding World Bank Grant $0.00 $7.82 $7.82Japan $0.00 $0.80 $0.80
total $0.00 $8.62 $8.62Funding gap (exclusive of tentative funding) $0.00 $8.62 $8.62Funding gap (inclusive of tentative funding) $0.00 $0.00 $0.00
OPERATIONAL COSTSrequirements $14.83 $13.12 $27.95Operational Costs (WHO) $5.12 $3.28 $8.40Operational Costs (UNICEF) $9.71 $9.84 $19.55confirmed funding CIDA (UNICEF) $5.40 $4.23 $9.63Rotary International (UNICEF) $1.01 $0.00 $1.01Japan ( UNICEF) $0.10 $0.00 $0.10UNICEF RR $2.00 $0.00 $2.00USAID (UNICEF) $0.02 $0.00 $0.02BMGF (WHO) $0.86 $0.00 $0.86CIDA (WHO) $4.00 $1.66 $5.66Rotary International (WHO) $0.26 $0.00 $0.26
total $13.65 $5.89 $19.54tentative funding Saudi Arabia (WHO) $0.00 $0.18 $0.18Rotary International (UNICEF) $0.00 $1.40 $1.40Japan (UNICEF) $0.00 $3.03 $3.03
total $0.00 $4.61 $4.61Funding gap (exclusive of tentative funding) $1.18 $7.23 $8.41WHO $0.00 $1.62 $1.62UNICEF $1.18 $5.61 $6.79Funding gap (inclusive of tentative funding) $1.18 $2.62 $3.80WHO $0.00 $1.44 $1.44UNICEF $1.18 $1.18 $2.36
WHO SURVEILLANCErequirements $2.35 $2.42 $4.77confirmed fundingCIDA $0.00 $1.25 $1.25USAID $2.17 $0.00 $2.17AusAID $0.18 $0.00 $0.18
total $2.35 $1.25 $3.60Funding gap (exclusive of tentative funding) $0.00 $1.17 $1.17
TECHNICAL ASSISTANCErequirements $9.24 $9.15 $18.39Technical assistance (WHO) $4.73 $4.97 $9.70Technical assistance (UNICEF) $3.45 $3.07 $6.52Surge Capacity $1.06 $1.11 $2.17confirmed funding CIDA (WHO) $4.59 $3.18 $7.77AusAID (WHO) $0.02 $0.00 $0.02CDC (WHO) $0.38 $0.00 $0.38Japan (UNICEF) $0.00 $0.37 $0.37BMGF (UNICEF) $1.00 $0.00 $1.00CIDA (UNICEF) $1.47 $0.90 $2.37
total $7.46 $4.45 $11.91tentative funding Rotary International (UNICEF) $0.00 $0.08 $0.08
total $0.00 $0.08 $0.08Funding gap (exclusive of tentative funding) $1.78 $4.70 $6.48WHO $0.80 $2.90 $3.70UNICEF $0.98 $1.80 $2.78Funding gap (inclusive of tentative funding) $1.78 $4.62 $6.40WHO $0.80 $2.90 $3.70UNICEF $0.98 $1.72 $2.70
UNICEF SOCIAL MOBILIZATIONrequirements $2.56 $4.19 $6.75confirmed funding BMGF $1.81 $0.00 $1.81Japan $0.00 $1.05 $1.05Rotary $0.75 $0.00 $0.75
total $2.56 $1.05 $3.61Funding gap (exclusive of tentative funding) $0.00 $3.14 $3.14
SUMMARYtotal requirements $37.40 $37.50 $74.90WHO $13.26 $11.78 $25.04UNICEF $24.14 $25.72 $49.86Funding gap (exclusive of tentative funding) $2.96 $24.86 $27.82WHO $0.80 $5.69 $6.49UNICEF $2.16 $19.17 $21.33
afGhanistan
*Tentative funding is indicative and subject to change pending final negotiations and formal agreements.

27global polio eradication initiative
Financial resource requirements 2012–2013 | As of 1 october 2012
2012 2013 2012–2013national immunization days (nids) 3 2 5sub-national immunization days (snids) 1 2 3
ORAL POLIO VACCINErequirements $3.79 $3.39 $7.18confirmed funding Japan $1.03 $0.48 $1.51CDC $2.77 $0.00 $2.77
total $3.79 $0.48 $4.27Funding gap (exclusive of tentative funding) $0.00 $2.91 $2.91
OPERATIONAL COSTSrequirements $9.04 $10.61 $19.65Operational Costs (WHO) $1.20 $8.06 $9.26Operational Costs (UNICEF) $0.09 $2.55 $2.64Operational Costs (Govt of Angola) $7.75 $0.00 $7.75confirmed funding Total E&P Angola (UNICEF) $0.09 $0.00 $0.09BMGF (WHO $1.20 $0.00 $1.20Govt of Angola $4.52 $0.00 $4.52
total $5.81 $0.00 $5.81tentative funding Govt of Angola $3.23 $8.49 $11.72
total $3.23 $8.49 $11.72Funding gap (exclusive of tentative funding) $3.23 $10.61 $13.84WHO $0.00 $8.06 $8.06UNICEF $0.00 $2.55 $2.55Govt of Angola $3.23 $0.00 $3.23Funding gap (inclusive of tentative funding) $0.00 $2.12 $2.12WHO $0.00 $1.18 $1.18UNICEF $0.00 $0.94 $0.94Govt of Angola $0.00 $0.00 $0.00
WHO SURVEILLANCErequirements $1.85 $1.91 $3.76confirmed fundingBMGF $0.93 $1.02 $1.95USAID $0.78 $0.00 $0.78
total $1.71 $1.02 $2.73Funding gap (exclusive of tentative funding) $0.14 $0.89 $1.03
TECHNICAL ASSISTANCErequirements $9.44 $9.45 $18.89Technical assistance (WHO) $7.22 $7.22 $14.44Technical assistance (UNICEF) $0.53 $0.54 $1.07Surge Capacity $1.69 $1.69 $3.38confirmed fundingAustralia (WHO) $1.24 $0.00 $1.24BMGF (WHO) $1.03 $0.00 $1.03CDC (WHO) $0.09 $0.00 $0.09DFID(WHO) $1.88 $0.00 $1.88Rotary International (WHO) $1.49 $0.00 $1.49Russia (WHO) $0.93 $0.00 $0.93BMGF (UNICEF) $0.53 $0.41 $0.94
total $7.19 $0.41 $7.60Funding gap (exclusive of tentative funding) $2.25 $9.04 $11.29WHO $2.25 $8.91 $11.16UNICEF $0.00 $0.13 $0.13
UNICEF SOCIAL MOBILIZATIONrequirements $2.55 $2.18 $4.73confirmed fundingBMGF $1.59 $0.00 $1.59Rotary International $0.76 $0.00 $0.76Japan $0.20 $0.00 $0.20
total $2.55 $0.00 $2.55Funding gap (exclusive of tentative funding) $0.00 $2.18 $2.18
SUMMARYtotal requirements $26.67 $27.54 $54.21WHO $11.96 $18.88 $30.84UNICEF $6.96 $8.66 $15.62Govt of Angola $7.75 $0.00 $7.75Funding gap (exclusive of tentative funding) $5.62 $25.63 $31.25WHO $2.39 $17.86 $20.25UNICEF $0.00 $7.77 $7.77Govt of Angola $3.23 $0.00 $3.23Funding gap (inclusive of tentative funding) $2.39 $17.14 $19.53WHO $2.39 $10.98 $13.37UNICEF $0.00 $6.16 $6.16Govt of Angola $0.00 $0.00 $0.00
anGola

28 global polio eradication initiative
Financial resource requirements 2012–2013 | As of 1 october 2012
2012 2013 2012–2013national immunization days (nids) 5 4 9sub-national immunization days (snids) 3 0 3
ORAL POLIO VACCINErequirements $4.22 $2.57 $6.79confirmed fundingCDC $2.30 $0.00 $2.30BMGF $1.36 $2.57 $3.93Japan $0.35 $0.00 $0.35Saudi Arabia $0.21 $0.00 $0.21
total $4.22 $2.57 $6.79Funding gap (exclusive of tentative funding) $0.00 $0.00 $0.00
OPERATIONAL COSTSrequirements $6.72 $3.36 $10.08confirmed fundingBMGF $4.76 $0.00 $4.76Rotary International $0.89 $0.00 $0.89
total $5.65 $0.00 $5.65Funding gap (exclusive of tentative funding) $1.07 $3.36 $4.43
WHO SURVEILLANCErequirements $0.88 $0.90 $1.78confirmed fundingBMGF $0.66 $0.00 $0.66CIDA $0.22 $0.00 $0.22
total $0.88 $0.00 $0.88Funding gap (exclusive of tentative funding) $0.00 $0.90 $0.90
TECHNICAL ASSISTANCErequirements $7.90 $8.10 $16.00Technical assistance (WHO) $2.84 $2.84 $5.68Technical assistance (UNICEF) $1.93 $2.13 $4.06Surge Capacity $3.13 $3.13 $6.26confirmed fundingAustralia (WHO) $1.28 $0.00 $1.28BMGF(WHO) $2.42 $0.00 $2.42Rotary International (WHO) $1.45 $0.00 $1.45CDC (WHO) $0.06 $0.00 $0.06CDC (UNICEF) $0.28 $0.00 $0.28BMGF (UNICEF) $1.05 $0.75 $1.80Rotary International (UNICEF) $0.60 $0.00 $0.60
total $7.14 $0.75 $7.89tentative funding Rotary International (UNICEF) $0.00 $0.58 $0.58
total $0.00 $0.58 $0.58Funding gap (exclusive of tentative funding) $0.76 $7.35 $8.11WHO $0.76 $5.97 $6.73UNICEF $0.00 $1.38 $1.38Funding gap (inclusive of tentative funding) $0.76 $6.77 $7.53WHO $0.76 $5.97 $6.73UNICEF $0.00 $0.80 $0.80
UNICEF SOCIAL MOBILIZATION requirements $5.67 $6.56 $12.23confirmed fundingBMGF $1.59 $0.00 $1.59Rotary $2.15 $0.00 $2.15Japan $1.93 $0.00 $1.93
total $5.67 $0.00 $5.67Funding gap (exclusive of tentative funding) $0.00 $6.56 $6.56
SUMMARYtotal requirements $25.39 $21.49 $46.88WHO $13.57 $10.23 $23.80UNICEF $11.82 $11.26 $23.08Funding gap (exclusive of tentative funding) $1.84 $18.17 $20.01WHO $1.84 $10.23 $12.07UNICEF $0.00 $7.94 $7.94Funding gap (inclusive of tentative funding) $1.84 $17.59 $19.43WHO $1.84 $10.23 $12.07UNICEF $0.00 $7.36 $7.36
chad

29global polio eradication initiative
Financial resource requirements 2012–2013 | As of 1 october 2012
2012 2013 2012–2013national immunization days (nids) 2 2 4sub-national immunization days (snids) 4 2 6child Health day (cHd) 1 0 1
ORAL POLIO VACCINErequirements $10.45 $9.42 $19.87confirmed fundingJICA $0.50 $0.00 $0.50UNICEF $0.85 $0.00 $0.85CDC $5.83 $0.00 $5.83BMGF $3.27 $1.50 $4.77
total $10.45 $1.50 $11.95tentative FundingJICA $0.00 $0.80 $0.80
total $0.00 $0.80 $0.80Funding gap (exclusive of tentative funding) $0.00 $7.92 $7.92Funding gap (inclusive of tentative funding) $0.00 $7.12 $7.12
OPERATIONAL COSTSrequirements $20.34 $18.07 $38.41Operational costs (UNICEF) $2.10 $2.05 $4.15Operational costs (WHO) $18.24 $16.02 $34.26confirmed fundingJICA (UNICEF) $0.20 $0.00 $0.20USAID (UNICEF) $1.17 $0.00 $1.17Rotary International (UNICEF) $0.73 $0.00 $0.73BMGF (WHO) $12.68 $0.00 $12.68Rotary International (WHO) $2.56 $0.00 $2.56
total $17.34 $0.00 $17.34tentative FundingWorld Bank (WHO) $3.00 $0.00 $3.00USAID (UNICEF) $0.00 $1.26 $1.26Rotary International (UNICEF) $0.00 $0.00 $0.00
total $3.00 $1.26 $4.26Funding gap (exclusive of tentative funding) $3.00 $18.07 $21.07WHO $3.00 $16.02 $19.02UNICEF $0.00 $2.05 $2.05Funding gap (inclusive of tentative funding) $0.00 $16.81 $16.81WHO $0.00 $16.02 $16.02UNICEF $0.00 $0.79 $0.79
WHO SURVEILLANCErequirements $2.19 $2.25 $4.44confirmed fundingBMGF $1.64 $0.00 $1.64CIDA $0.30 $0.00 $0.30USAID $0.25 $0.00 $0.25
total $2.19 $0.00 $2.19Funding gap (exclusive of tentative funding) $0.00 $2.25 $2.25Funding gap (inclusive of tentative funding) $0.00 $2.25 $2.25
TECHNICAL ASSISTANCErequirements $10.49 $12.67 $23.16Technical assistance (WHO) $6.29 $6.29 $12.58Technical assistance (UNICEF) $1.68 $3.86 $5.54Surge Capacity $2.52 $2.52 $5.04confirmed fundingAustralia(WHO) $1.97 $0.00 $1.97BMGF (WHO) $2.43 $0.00 $2.43CIDA(WHO) $1.18 $0.00 $1.18Rotary International (WHO) $3.23 $0.00 $3.23Rotary International (UNICEF) $1.07 $0.00 $1.07BMGF (UNICEF) $0.61 $0.79 $1.40AusAID (UNICEF) $0.00 $0.65 $0.65
total $10.49 $1.44 $11.93tentative FundingRotary International (UNICEF) $0.00 $0.40 $0.40
total $0.00 $0.40 $0.40Funding gap (exclusive of tentative funding) $0.00 $11.23 $11.23WHO $0.00 $8.81 $8.81UNICEF $0.00 $2.42 $2.42Funding gap (exclusive of tentative funding) $0.00 $10.83 $10.83WHO $0.00 $8.81 $8.81UNICEF $0.00 $2.02 $2.02
UNICEF SOCIAL MOBILIZATION requirements $5.14 $4.42 $9.56Social mobilization costs $5.14 $4.42 $9.56confirmed fundingBMGF $3.81 $0.00 $3.81USAID $0.20 $0.00 $0.20Rotary International $1.03 $0.84 $1.87CDC $0.10 $0.00 $0.10
total $5.14 $0.84 $5.98tentative fundingUSAID $0.00 $0.55 $0.55
total $0.00 $0.55 $0.55Funding gap (exclusive of tentative funding) $0.00 $3.58 $3.58Funding gap (inclusive of tentative funding) $0.00 $3.03 $3.03
SUMMARYtotal requirements $48.61 $46.83 $95.44WHO $29.24 $27.08 $56.32UNICEF $19.37 $19.75 $39.12Funding gap (exclusive of tentative funding) $3.00 $43.05 $46.05WHO $3.00 $27.08 $30.08UNICEF $0.00 $15.97 $15.97Funding gap (inclusive of tentative funding) $0.00 $40.44 $40.44WHO $0.00 $27.08 $27.08UNICEF $0.00 $12.96 $12.96
dr conGo

30 global polio eradication initiative
Financial resource requirements 2012–2013 | As of 1 october 2012
2012 2013 2012–2013national immunization days (nids) 2 2 4sub-national immunization days (snids) 4 4 8
ORAL POLIO VACCINErequirements $128.52 $133.48 $262.00 projected and confirmed FundingGovernment of India (GoI) $127.13 $132.25 $259.38Japan $1.39 $0.00 $1.39
total $128.52 $132.25 $260.77 tentative funding Japan $0.00 $1.23 $1.23
total $0.00 $1.23 $1.23Funding gap (exclusive of tentative funding) $0.00 $1.23 $1.23Funding gap (inclusive of tentative funding) $0.00 $0.00 $0.00
OPERATIONAL COSTSrequirements $113.69 $73.51 $187.20 Government of India (GoI) $113.69 $73.51 $187.20 Funding gap (exclusive of tentative funding) $0.00 $0.00 $0.00
WHO OPERATIONAL COSTS (non-GoI budget)requirements $10.51 $8.15 $18.66 confirmed Funding BMGF $9.68 $0.00 $9.68
total $9.68 $0.00 $9.68 tentative funding BMGF $0.00 $2.04 $2.04
total $0.00 $2.04 $2.04Funding gap (exclusive of tentative funding) $0.83 $8.15 $8.98Funding gap (inclusive of tentative funding) $0.83 $6.11 $6.94
UNICEF SOCIAL MOBILIZATION COSTS (non-GoI budget)requirements $16.01 $16.53 $32.54 confirmed fundingBMGF $9.08 $1.92 $11.00 Rotary International $5.30 $0.00 $5.30 UNICEF Regular Resources $0.00 $0.00 $0.00 Japan $0.18 $0.00 $0.18 USAID $1.45 $1.24 $2.69
total $16.01 $3.16 $19.17 tentative funding Rotary International $0.00 $2.58 $2.58 UNICEF Regular Resources $0.00 $0.50 $0.50 Japan $0.00 $0.29 $0.29
total $0.00 $3.37 $3.37 Funding gap (exclusive of tentative funding) $0.00 $13.37 $13.37Funding gap (inclusive of tentative funding) $0.00 $10.00 $10.00
SURVEILLANCE & TECHNICAL ASSISTANCErequirements $25.53 $25.05 $50.58 Surveillance Costs $6.72 $6.80 $13.52 Technical assistance (WHO) $16.59 $16.35 $32.94 Technical assistance (UNICEF) $2.22 $1.90 $4.12 confirmed fundingBMGF (UNICEF) $1.96 $1.20 $3.16 CDC (UNICEF) $0.26 $0.00 $0.26 Rotary International (UNICEF) $0.00 $0.00 $0.00 BMGF (WHO) $1.20 $0.00 $1.20 DFID(WHO) $16.19 $0.00 $16.19 Rotary International (WHO) $2.10 $0.00 $2.10 CDC (WHO) $1.05 $0.00 $1.05 USAID (WHO) $2.77 $0.00 $2.77
total $25.53 $1.20 $26.73 tentative funding CDC (UNICEF) $0.00 $0.20 $0.20 Rotary International (UNICEF) $0.00 $0.50 $0.50
total $0.00 $0.70 $0.70 Funding gap (exclusive of tentative funding) $0.00 $23.85 $23.85WHO $0.00 $23.15 $23.15UNICEF $0.00 $0.70 $0.70Funding gap (inclusive of tentative funding) $0.00 $23.15 $23.15WHO $0.00 $23.15 $23.15UNICEF $0.00 $0.00 $0.00
SUMMARYtotal requirements $294.25 $256.72 $550.97 WHO $33.82 $31.30 $65.12 UNICEF $146.75 $151.91 $298.66 Govt of India $113.69 $73.51 $187.20 Funding gap (exclusive of tentative funding) $0.83 $46.60 $47.43 WHO $0.83 $31.30 $32.13 UNICEF $0.00 $14.07 $14.07 Govt of India $0.00 $1.23 $1.23 Funding gap (inclusive of tentative funding) $0.83 $39.26 $40.09WHO $0.83 $29.26 $30.09UNICEF $0.00 $10.00 $10.00Govt of India $0.00 $0.00 $0.00
india

31global polio eradication initiative
Financial resource requirements 2012–2013 | As of 1 october 2012
2012 2013 2012–2013national immunization days (nids) 2 2 4sub-national immunization days (snids) 5 6 11
ORAL POLIO VACCINErequirements $39.70 $35.16 $74.86confirmed fundingWorld Bank Buy-down $24.23 $0.00 $24.23UNICEF Regular Resources $6.22 $0.00 $6.22BMGF $0.00 $0.00 $0.00Germany $0.98 $0.00 $0.98Japan $6.55 $0.00 $6.55
total $37.98 $0.00 $37.98tentative fundingWorld Bank (Buy-down) $1.72 $35.16 $36.88
total $1.72 $35.16 $36.88Funding gap (exclusive of tentative funding) $1.72 $35.16 $36.88Funding gap (inclusive of tentative funding) $0.00 $0.00 $0.00
OPERATIONAL COSTSrequirements $63.41 $68.59 $132.00Operational Costs (WHO)* $58.02 $59.12 $117.14Operational Costs (UNICEF) $5.39 $9.47 $14.86confirmed fundingBMGF (WHO) $6.78 $0.00 $6.78European Commission (WHO) $6.83 $0.00 $6.83Government of Nigeria, 2011 carry-over (WHO) $4.68 $0.00 $4.68Government of Nigeria, 2012 (WHO) $24.70 $0.00 $24.70Rotary International (WHO) $9.44 $0.00 $9.44USAID (WHO) $1.38 $0.00 $1.38GAVI (WHO) $0.95 $0.00 $0.95Rotary International (UNICEF) $2.91 $0.00 $2.91UNICEF Regular Resources $0.11 $0.00 $0.11
total $57.78 $0.00 $57.78tentative fundingGovernment of Nigeria, 2013 (WHO) $0.00 $30.00 $30.00BMGF(WHO) $0.00 $15.05 $15.05Germany(WHO) $0.00 $6.82 $6.82Canada(WHO) $3.26 $7.25 $10.51Rotary International (UNICEF) $2.37 $0.00 $2.37Germany (UNICEF) $0.00 $2.75 $2.75
total $5.63 $61.87 $67.50Funding gap (exclusive of tentative funding) $5.63 $68.56 $74.22WHO $3.26 $59.12 $62.38UNICEF $2.37 $9.47 $11.84Funding gap (inclusive of tentative funding) $0.00 $6.72 $6.72WHO1 $0.00 $0.00 $0.00UNICEF $0.00 $6.72 $6.72
WHO SURVEILLANCErequirements $12.50 $12.88 $25.38confirmed fundingBMGF $5.15 $0.00 $5.15CIDA $3.75 $0.00 $3.75
total $8.90 $0.00 $8.90tentative fundingCanada (WHO) $0.00 $2.50 $2.50
total $0.00 $2.50 $2.50Funding gap (exclusive of tentative funding) $3.61 $12.88 $16.49Funding gap (inclusive of tentative funding) $3.61 $10.38 $13.99
TECHNICAL ASSISTANCErequirements $52.52 $49.58 $102.10Technical assistance (WHO) $23.83 $23.83 $47.66Technical assistance (UNICEF) $6.24 $9.23 $15.47Surge Capacity $22.45 $16.52 $38.97confirmed fundingAustralia (WHO) $0.22 $0.00 $0.22BMGF (WHO) $16.50 $0.00 $16.50CDC (WHO) $2.13 $0.00 $2.13CIDA (WHO) $3.75 $0.00 $3.75DFID (WHO) $17.70 $0.00 $17.70Spain (WHO) $0.25 $0.00 $0.25Rotary International (WHO) $0.44 $0.00 $0.44BMGF (UNICEF) $2.25 $2.04 $4.29Rotary International (UNICEF) $1.49 $0.00 $1.49CDC (UNICEF) $0.15 $0.00 $0.15UNICEF Regular Resources $2.35 $0.00 $2.35
total $47.23 $2.04 $49.27tentative fundingRotary Internationa (UNICEF) $0.00 $0.43 $0.43
total $0.00 $0.43 $0.43Funding gap (exclusive of tentative funding) $5.29 $47.54 $52.83WHO $5.29 $40.35 $45.64UNICEF $0.00 $7.19 $7.19Funding gap (inclusive of tentative funding) $5.29 $47.11 $52.40WHO $5.29 $40.35 $45.64UNICEF $0.00 $6.76 $6.76
UNICEF SOCIAL MOBILIZATION requirements $4.22 $3.92 $8.14confirmed fundingBMGF $3.22 $0.00 $3.22CDC $0.23 $0.00 $0.23Rotary International $0.53 $0.00 $0.53
total $3.98 $0.00 $3.98tentative fundingGermany $0.00 $1.39 $1.39Rotary International $0.24 $2.43 $2.67
total $0.24 $3.82 $4.06Funding gap (exclusive of tentative funding) $0.24 $3.92 $4.16Funding gap (inclusive of tentative funding) $0.00 $0.10 $0.10
SUMMARYtotal requirements $172.35 $170.13 $342.48WHO $116.80 $112.35 $229.15UNICEF $55.55 $57.78 $113.33Funding gap (exclusive of tentative funding) $16.49 $168.09 $184.58WHO $12.16 $112.35 $124.51UNICEF $4.34 $55.74 $60.08Funding gap (inclusive of tentative funding) $8.89 $64.31 $73.20WHO $8.90 $50.73 $59.63UNICEF $0.00 $13.58 $13.58
* Operational cost under WHO includes traditional leaders engagement
niGeria

32 global polio eradication initiative
Financial resource requirements 2012–2013 | As of 1 october 2012
2012 2013 2012–2013national immunization days (nids) 4 4 8sub-national immunization days (snids) 4 4 8
ORAL POLIO VACCINErequirements $51.08 $47.23 $98.31confirmed funding World Bank Buy-down (Supplement) $25.60 $0.00 $25.60Japan $1.84 $0.00 $1.84JICA Loan Conversion $23.64 $6.38 $30.02
total $51.08 $6.38 $57.46tentative funding World Bank Buy-down (Supplement) $0.00 $23.00 $23.00Islamic Development Bank (IDB) $0.00 $17.85 $17.85
total $0.00 $40.85 $40.85Funding gap (exclusive of tentative funding) $0.00 $40.85 $40.85Funding gap (inclusive of tentative funding) $0.00 $0.00 $0.00
OPERATIONAL COSTSrequirements $31.17 $27.44 $58.61confirmed funding BMGF $0.94 $0.00 $0.94JICA Loan Conversion $27.23 $0.00 $27.23
total $28.17 $0.00 $28.17tentative funding Saudi Arabia $0.00 $0.94 $0.94Islamic Development Bank (IDB) $0.00 $26.50 $26.50Japan* $8.30 $0.00 $8.30
total $8.30 $27.44 $35.74Funding gap (exclusive of tentative funding) $3.00 $27.44 $30.44Funding gap (inclusive of tentative funding) -$5.30 $0.00 -$5.30
WHO SURVEILLANCErequirements $3.23 $3.33 $6.56confirmed fundingBMGF $2.01 $0.00 $2.01CDC $0.10 $0.00 $0.10USAID $0.50 $0.00 $0.50
total $2.61 $0.00 $2.61tentative funding
$0.00 $0.00 $0.00total $0.00 $0.00 $0.00
Funding gap (exclusive of tentative funding) $0.62 $3.33 $3.95Funding gap (inclusive of tentative funding) $0.62 $3.33 $3.95
TECHNICAL ASSISTANCErequirements $19.69 $17.61 $37.30Technical assistance (WHO) $8.15 $7.31 $15.46Technical assistance (UNICEF) $3.57 $2.45 $6.02Surge Capacity $7.97 $7.85 $15.82confirmed fundingBMGF (WHO) $2.60 $0.00 $2.60DFID (WHO) $7.36 $0.00 $7.36Rotary International (WHO) $1.86 $0.00 $1.86CDC (WHO) $1.11 $0.00 $1.11USAID (WHO) $1.87 $0.00 $1.87BMGF (UNICEF) $1.30 $2.07 $3.37Rotary International (UNICEF) $0.72 $0.00 $0.72CDC (UNICEF) $0.16 $0.00 $0.16USAID (UNICEF) $1.39 $0.00 $1.39
total $18.37 $2.07 $20.44tentative fundingRotary International (UNICEF) $0.00 $0.38 $0.38
total $0.00 $0.38 $0.38Funding gap (exclusive of tentative funding) $1.32 $15.54 $16.86WHO $1.32 $15.16 $16.48UNICEF $0.00 $0.38 $0.38Funding gap (inclusive of tentative funding) $1.32 $15.16 $16.48WHO $1.32 $15.16 $16.48UNICEF $0.00 $0.00 $0.00
UNICEF SOCIAL MOBILIZATION requirements $22.42 $23.34 $45.76confirmed fundingBMGF $9.78 $0.00 $9.78USAID $10.11 $0.00 $10.11Japan $0.40 $0.00 $0.40Rotary International $2.13 $0.00 $2.13
total $22.42 $0.00 $22.42tentative fundingRotary International $0.00 $3.41 $3.41Islamic Development Bank (IDB) $0.00 $19.93 $19.93
total $0.00 $23.34 $23.34Funding gap (exclusive of tentative funding) $0.00 $23.34 $23.34Funding gap (inclusive of tentative funding) $0.00 $0.00 $0.00
SUMMARYtotal requirements $127.59 $118.95 $246.54WHO $50.52 $45.93 $96.45UNICEF $77.07 $73.02 $150.09Funding gap (exclusive of tentative funding) $4.94 $110.50 $115.44WHO $4.94 $45.93 $50.87UNICEF $0.00 $64.57 $64.57Funding gap (inclusive of tentative funding) -$3.36 $18.49 $15.13WHO -$3.36 $18.49 $15.13UNICEF $0.00 $0.00 $0.00
PaKistan
* The operational cost surplus is tentative pending the finalization of Japan’s funding commitment and any future adjustments to campaign activities.

33global polio eradication initiative
Financial resource requirements 2012–2013 | As of 1 october 2012
2012 2013 2012–2013national immunization days (nids) 4 4 8sub-national immunization days (snids) 0 0 0
ORAL POLIO VACCINErequirements $2.29 $2.48 $4.77confirmed funding Common Humanitarian Funds $0.52 $0.00 $0.52Japan $1.10 $0.00 $1.10CERF $0.40 $0.00 $0.40OFDA $0.26 $0.00 $0.26BMGF $0.00 $1.24 $1.24
total $2.29 $1.24 $3.53tentative funding
total $0.00 $0.00 $0.00Funding gap (exclusive of tentative funding) $0.00 $1.24 $1.24Funding gap (inclusive of tentative funding) $0.00 $1.24 $1.24
OPERATIONAL COSTSrequirements $7.33 $7.40 $14.73Operational costs(WHO) $3.32 $3.03 $6.35Operational costs(UNICEF) $4.01 $4.37 $8.38confirmed funding Rotary International (UNICEF) $2.08 $1.07 $3.15UNICEF Regular Resources $1.70 $0.00 $1.70CHF (UNICEF) $0.08 $0.00 $0.08CERF (UNICEF) $0.15 $0.00 $0.15BMGF (WHO) $3.32 $0.00 $3.32
total $7.33 $1.07 $8.40tentative funding Rotary International (UNICEF) $0.00 $1.87 $1.87
total $0.00 $1.87 $1.87Funding gap (exclusive of tentative funding) $0.00 $6.33 $6.33WHO $0.00 $3.03 $3.03UNICEF $0.00 $3.30 $3.30Funding gap (inclusive of tentative funding) $0.00 $4.46 $4.46WHO $0.00 $3.03 $3.03UNICEF $0.00 $1.43 $1.43
WHO SURVEILLANCErequirements $1.24 $1.27 $2.51confirmed fundingBMGF $0.30 $0.00 $0.30USAID $0.33 $0.00 $0.33
total $0.63 $0.00 $0.63Funding gap (exclusive of tentative funding) $0.61 $1.27 $1.88
TECHNICAL ASSISTANCErequirements $4.48 $5.01 $9.49Technical assistance (WHO) $3.66 $3.84 $7.50Technical assistance (UNICEF) $0.82 $1.17 $1.99confirmed fundingDFID (WHO) $2.23 $0.00 $2.23Rotary International (WHO) $0.45 $0.00 $0.45CDC (WHO) $0.12 $0.00 $0.12BMGF (UNICEF) $0.57 $0.37 $0.94Rotary International (UNICEF) $0.25 $0.31 $0.56
total $3.62 $0.68 $4.30tentative funding Rotary International (UNICEF) $0.00 $0.31 $0.31
total $0.00 $0.31 $0.31Funding gap (exclusive of tentative funding) $0.86 $4.33 $5.19WHO $0.86 $3.84 $4.70UNICEF $0.00 $0.49 $0.49Funding gap (inclusive of tentative funding) $0.86 $4.02 $4.88WHO $0.86 $3.84 $4.70UNICEF $0.00 $0.18 $0.18
UNICEF SOCIAL MOBILIZATIONrequirements $1.46 $1.88 $3.34confirmed fundingBMGF $1.46 $0.00 $1.46AusAID $0.00 $0.25 $0.25
total $1.46 $0.25 $1.71Funding gap (exclusive of tentative funding) $0.00 $1.63 $1.63
SUMMARYtotal requirements $16.80 $18.04 $34.84WHO $8.22 $8.14 $16.36UNICEF $8.58 $9.90 $18.48Funding gap (exclusive of tentative funding) $1.46 $14.80 $16.26WHO $1.47 $8.14 $9.61UNICEF $0.00 $6.66 $6.66Funding gap (inclusive of tentative funding) $1.46 $12.62 $14.08WHO $1.47 $8.14 $9.61UNICEF $0.00 $4.48 $4.48
soUth sUdan
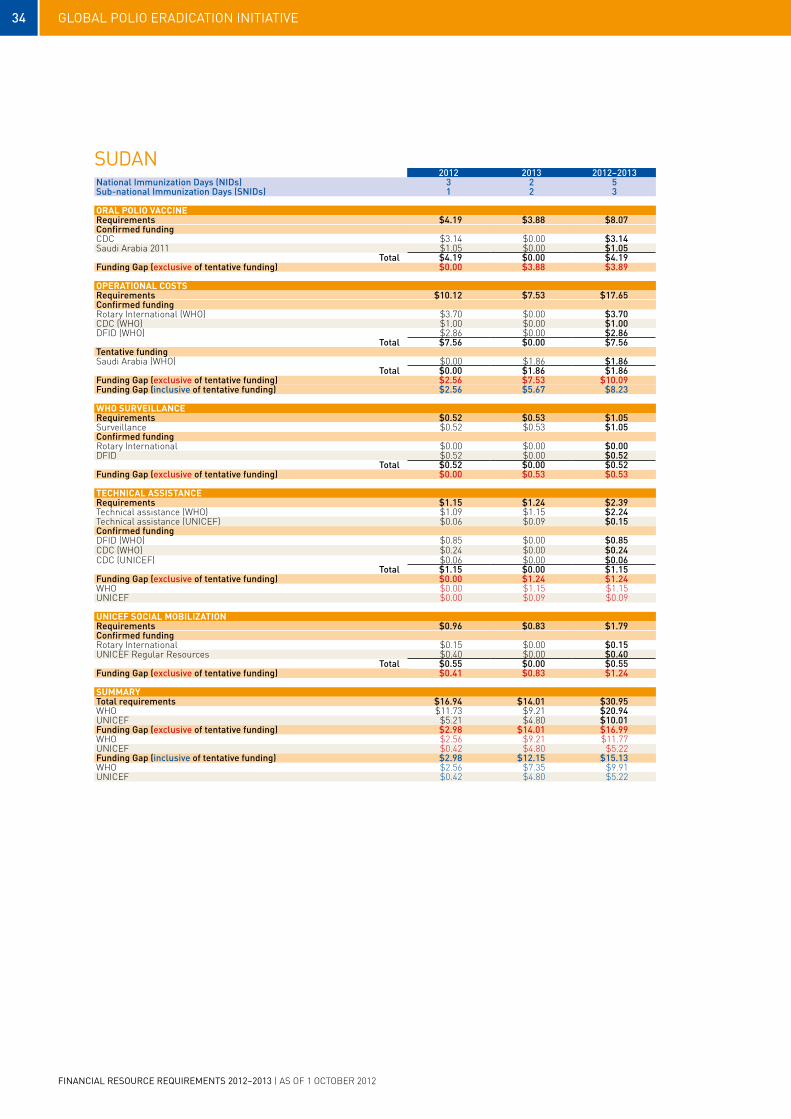
34 global polio eradication initiative
Financial resource requirements 2012–2013 | As of 1 october 2012
2012 2013 2012–2013national immunization days (nids) 3 2 5sub-national immunization days (snids) 1 2 3
ORAL POLIO VACCINErequirements $4.19 $3.88 $8.07confirmed funding CDC $3.14 $0.00 $3.14Saudi Arabia 2011 $1.05 $0.00 $1.05
total $4.19 $0.00 $4.19Funding gap (exclusive of tentative funding) $0.00 $3.88 $3.89
OPERATIONAL COSTSrequirements $10.12 $7.53 $17.65confirmed funding Rotary International (WHO) $3.70 $0.00 $3.70CDC (WHO) $1.00 $0.00 $1.00DFID (WHO) $2.86 $0.00 $2.86
total $7.56 $0.00 $7.56tentative funding Saudi Arabia (WHO) $0.00 $1.86 $1.86
total $0.00 $1.86 $1.86Funding gap (exclusive of tentative funding) $2.56 $7.53 $10.09Funding gap (inclusive of tentative funding) $2.56 $5.67 $8.23
WHO SURVEILLANCErequirements $0.52 $0.53 $1.05Surveillance $0.52 $0.53 $1.05confirmed funding Rotary International $0.00 $0.00 $0.00DFID $0.52 $0.00 $0.52
total $0.52 $0.00 $0.52Funding gap (exclusive of tentative funding) $0.00 $0.53 $0.53
TECHNICAL ASSISTANCErequirements $1.15 $1.24 $2.39Technical assistance (WHO) $1.09 $1.15 $2.24Technical assistance (UNICEF) $0.06 $0.09 $0.15confirmed funding DFID (WHO) $0.85 $0.00 $0.85CDC (WHO) $0.24 $0.00 $0.24CDC (UNICEF) $0.06 $0.00 $0.06
total $1.15 $0.00 $1.15Funding gap (exclusive of tentative funding) $0.00 $1.24 $1.24WHO $0.00 $1.15 $1.15UNICEF $0.00 $0.09 $0.09
UNICEF SOCIAL MOBILIZATIONrequirements $0.96 $0.83 $1.79confirmed fundingRotary International $0.15 $0.00 $0.15UNICEF Regular Resources $0.40 $0.00 $0.40
total $0.55 $0.00 $0.55Funding gap (exclusive of tentative funding) $0.41 $0.83 $1.24
SUMMARYtotal requirements $16.94 $14.01 $30.95WHO $11.73 $9.21 $20.94UNICEF $5.21 $4.80 $10.01Funding gap (exclusive of tentative funding) $2.98 $14.01 $16.99WHO $2.56 $9.21 $11.77UNICEF $0.42 $4.80 $5.22Funding gap (inclusive of tentative funding) $2.98 $12.15 $15.13WHO $2.56 $7.35 $9.91UNICEF $0.42 $4.80 $5.22
sUdan

www.polioeradication.org