financial results briefing for the 2q of fy2016 october 1 ... · financial results briefing for the...
TRANSCRIPT

Financial results briefing for the 2Q of FY2016(October 1, 2015-March 31, 2016)
h t t p : / / c o r p . g m o - p g . c o m /
Themes: Achieving continued high growth as a result of our initiatives driving the expansion of the EC market
May 2, 2016
GMO Payment Gateway, Inc.(3769: Tokyo Stock Exchange section-1)
The 45th IR Meeting
2Copyright (C) 1995 GMO Payment Gateway, Inc. All Rights Reserved.
The contents of this document are based on generally recognized economic and social conditions, as well as premises judged to be reasonable by GMO Payment Gateway as of May 2, 2016. However, please note that they are subject to change without prior notice in the event of changes in the business environment or other unforeseen occurrences.
A Cautionary Note About the Contents of this Document
3Copyright (C) 1995 GMO Payment Gateway, Inc. All Rights Reserved.
1. Summary of Financial Results for 2Q FY2016
2. Progress of the growth strategy
3. Financial highlights
Agenda
4Copyright (C) 1995 GMO Payment Gateway, Inc. All Rights Reserved.
1. Summary of Financial Results for 2Q FY2016
5Copyright (C) 1995 GMO Payment Gateway, Inc. All Rights Reserved.
(Million yen)1H of
FY20151Q of FY2016
2Q of FY2015
2Q of FY2016
Actual Forecast Actual A/F% Change Change% Actual Actual Change%
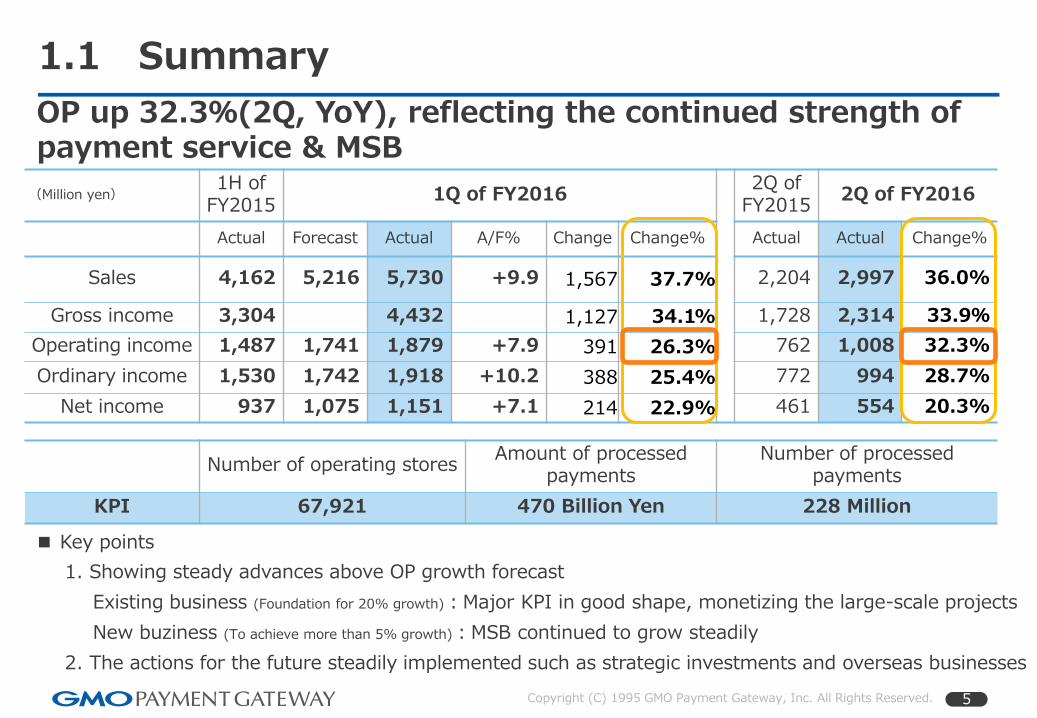
Sales 4,162 5,216 5,730 +9.9 1,567 37.7% 2,204 2,997 36.0%
Gross income 3,304 4,432 1,127 34.1% 1,728 2,314 33.9%
Operating income 1,487 1,741 1,879 +7.9 391 26.3% 762 1,008 32.3%
Ordinary income 1,530 1,742 1,918 +10.2 388 25.4% 772 994 28.7%
Net income 937 1,075 1,151 +7.1 214 22.9% 461 554 20.3%
Number of operating storesAmount of processed
paymentsNumber of processed
payments
KPI 67,921 470 Billion Yen 228 Million
1.1 Summary
OP up 32.3%(2Q, YoY), reflecting the continued strength of payment service & MSB
1. Showing steady advances above OP growth forecast
Existing business (Foundation for 20% growth):Major KPI in good shape, monetizing the large-scale projects
New buziness (To achieve more than 5% growth):MSB continued to grow steadily
2. The actions for the future steadily implemented such as strategic investments and overseas businesses
■ Key points
6Copyright (C) 1995 GMO Payment Gateway, Inc. All Rights Reserved.
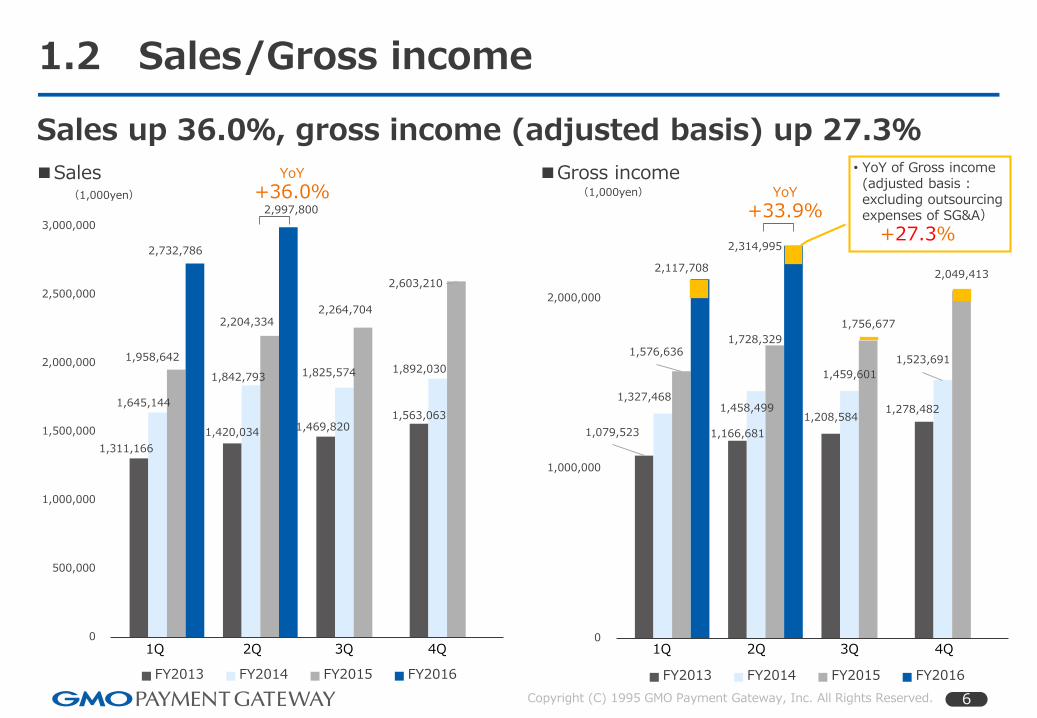
1,311,166
1,420,0341,469,820
1,563,0631,645,144
1,842,793 1,825,574 1,892,0301,958,642
2,204,3342,264,704
2,603,210
2,732,786
2,997,800
0
500,000
1,000,000
1,500,000
2,000,000
2,500,000
3,000,000
(1,000yen)
FY2013 FY2014 FY2015 FY2016
1.2 Sales/Gross income
Sales up 36.0%, gross income (adjusted basis) up 27.3%
1Q 2Q 3Q 4Q
■Sales
1,079,523 1,166,681
1,208,5841,278,482
1,327,4681,458,499
1,459,601
1,523,6911,576,636
1,728,329
1,756,677
2,049,413 2,117,708
2,314,995
0
1,000,000
2,000,000
(1,000yen)
FY2013 FY2014 FY2015 FY2016
YoY
+33.9%
1Q 2Q 3Q 4Q
■Gross income • YoY of Gross income (adjusted basis : excluding outsourcing expenses of SG&A)
+27.3%
YoY
+36.0%
7Copyright (C) 1995 GMO Payment Gateway, Inc. All Rights Reserved.
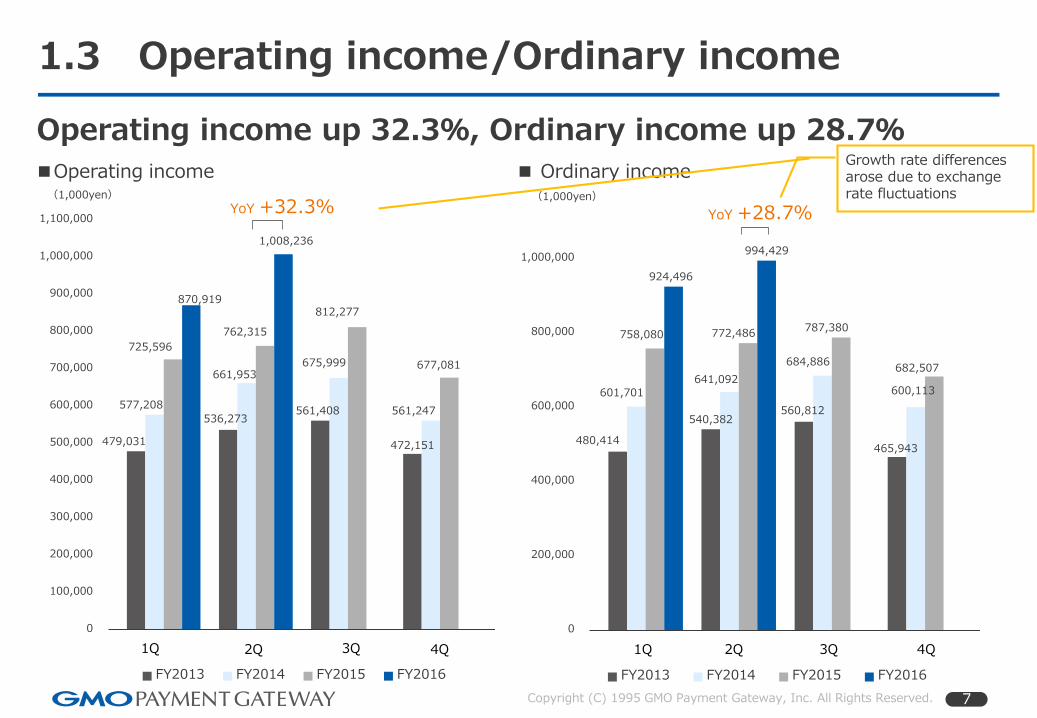
479,031
536,273561,408
472,151
577,208
661,953675,999
561,247
725,596
762,315
812,277
677,081
870,919
1,008,236
0
100,000
200,000
300,000
400,000
500,000
600,000
700,000
800,000
900,000
1,000,000
1,100,000
(1,000yen)
FY2013 FY2014 FY2015 FY2016
1Q 2Q 3Q 4Q 1Q 2Q 3Q 4Q
■ Ordinary income
YoY +32.3%
1.3 Operating income/Ordinary income
Operating income up 32.3%, Ordinary income up 28.7%
■Operating income
480,414
540,382560,812
465,943
601,701641,092
684,886
600,113
758,080 772,486787,380
682,507
924,496
994,429
0
200,000
400,000
600,000
800,000
1,000,000
(1,000yen)
FY2013 FY2014 FY2015 FY2016
YoY +28.7%
Growth rate differences arose due to exchange rate fluctuations
8Copyright (C) 1995 GMO Payment Gateway, Inc. All Rights Reserved.
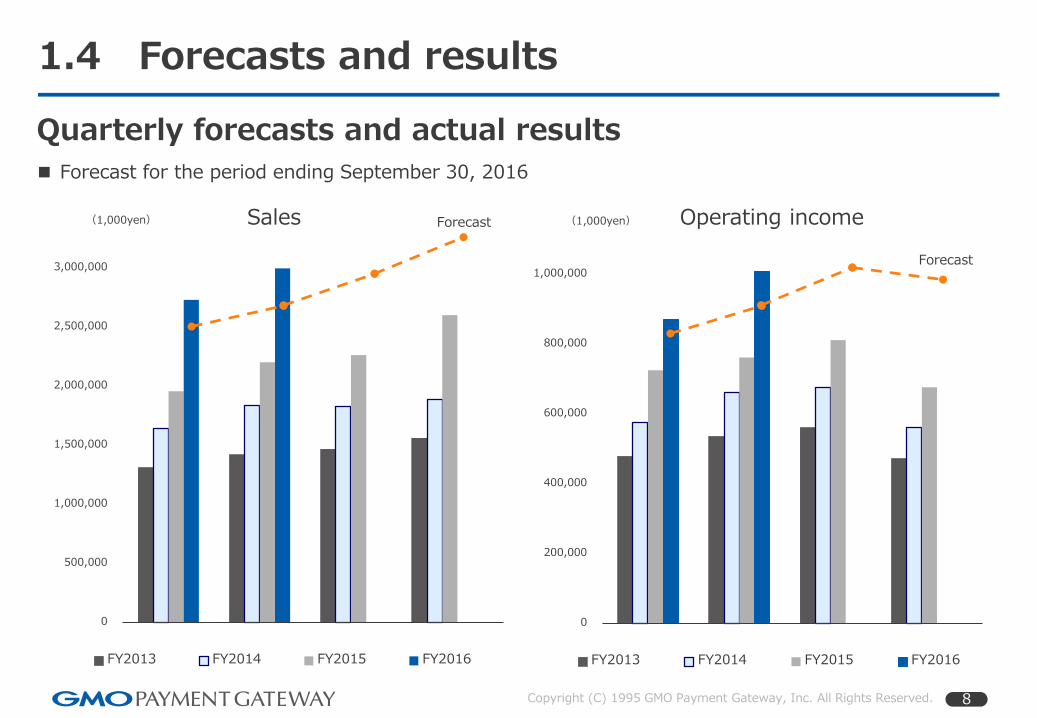
1.4 Forecasts and results
Quarterly forecasts and actual results
■ Forecast for the period ending September 30, 2016
0
500,000
1,000,000
1,500,000
2,000,000
2,500,000
3,000,000
(1,000yen)
FY2013 FY2014 FY2015 FY2016
0
200,000
400,000
600,000
800,000
1,000,000
(1,000yen)
FY2013 FY2014 FY2015 FY2016
Sales Operating incomeForecast
Forecast
9Copyright (C) 1995 GMO Payment Gateway, Inc. All Rights Reserved.
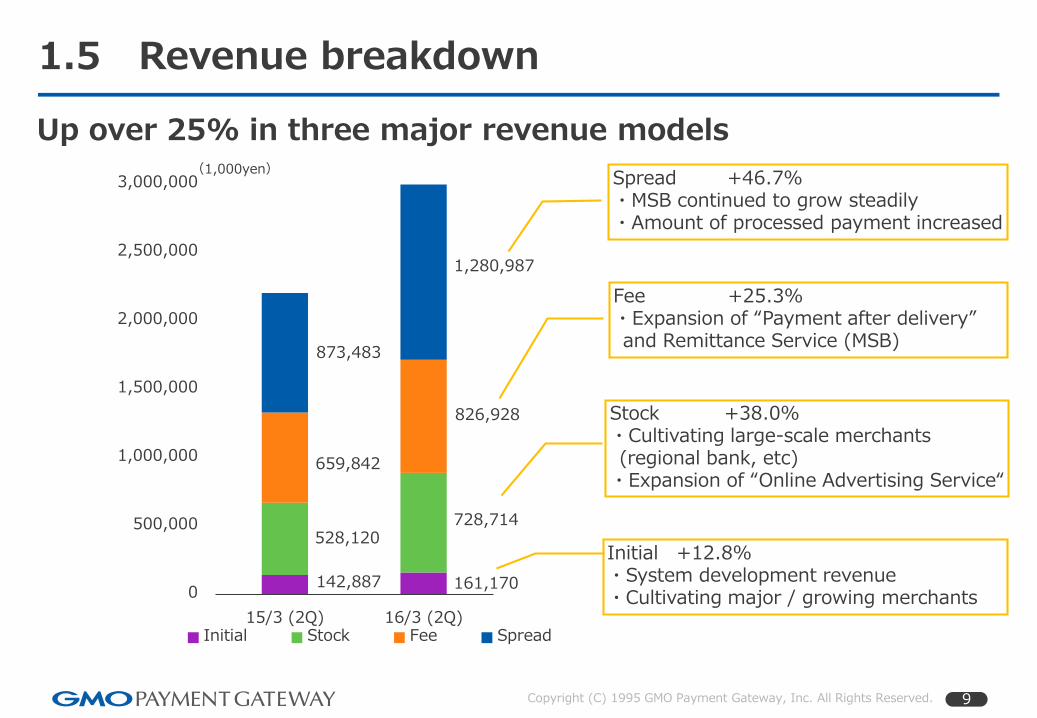
1.5 Revenue breakdown
Up over 25% in three major revenue models
142,887 161,170
528,120728,714
659,842
826,928
873,483
1,280,987
0
500,000
1,000,000
1,500,000
2,000,000
2,500,000
3,000,000
15/3 (2Q) 16/3 (2Q)
(1,000yen)
Initial Stock Fee Spread
Initial +12.8%・System development revenue・Cultivating major / growing merchants
Stock +38.0%・Cultivating large-scale merchants (regional bank, etc)
・Expansion of “Online Advertising Service“
Fee +25.3%・Expansion of “Payment after delivery” and Remittance Service (MSB)
Spread +46.7%・MSB continued to grow steadily・Amount of processed payment increased
10Copyright (C) 1995 GMO Payment Gateway, Inc. All Rights Reserved.
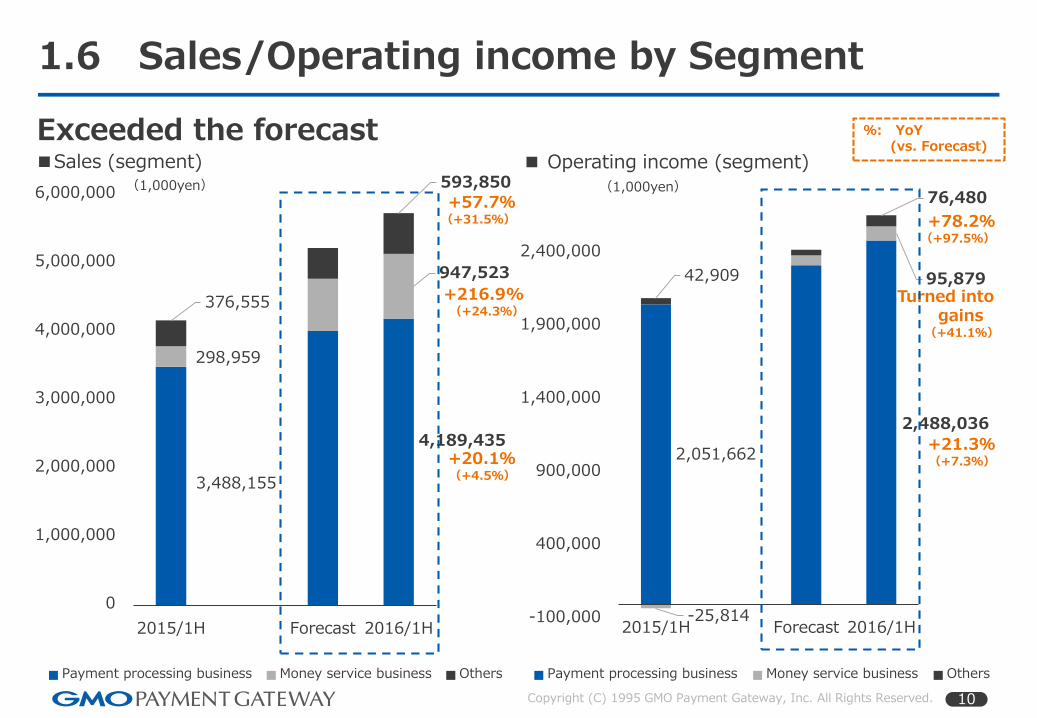
1.6 Sales/Operating income by Segment
3,488,155
4,189,435
298,959
947,523
376,555
593,850
0
1,000,000
2,000,000
3,000,000
4,000,000
5,000,000
6,000,000
2015/1H Forecast 2016/1H
(1,000yen)
Payment processing business Money service business Others
2,051,662
2,488,036
-25,814
95,87942,909
76,480
-100,000
400,000
900,000
1,400,000
1,900,000
2,400,000
2015/1H Forecast 2016/1H
(1,000yen)
Payment processing business Money service business Others
Exceeded the forecast
+78.2%(+97.5%)
Turned into gains
(+41.1%)
+21.3%(+7.3%)
+57.7%(+31.5%)
+216.9%(+24.3%)
+20.1%(+4.5%)
■ Operating income (segment)■Sales (segment)
%: YoY(vs. Forecast)
Copyright (C) 1995 GMO Payment Gateway, Inc. All Rights Reserved. 11
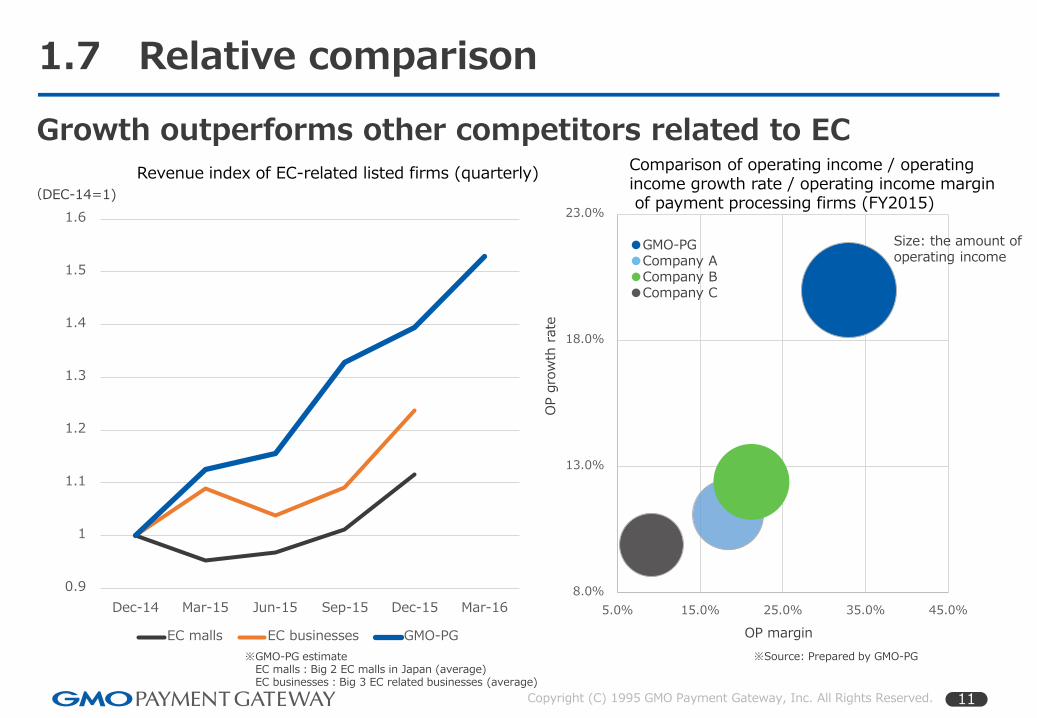
Revenue index of EC-related listed firms (quarterly)
8.0%
13.0%
18.0%
23.0%
5.0% 15.0% 25.0% 35.0% 45.0%
1.7 Relative comparison
Growth outperforms other competitors related to ECComparison of operating income / operating income growth rate / operating income marginof payment processing firms (FY2015)
●GMO-PG●Company A●Company B●Company C
Size: the amount of operating income
OP margin
OP g
row
th r
ate
0.9
1
1.1
1.2
1.3
1.4
1.5
1.6
Dec-14 Mar-15 Jun-15 Sep-15 Dec-15 Mar-16
EC malls EC businesses GMO-PG
※GMO-PG estimateEC malls:Big 2 EC malls in Japan (average)EC businesses:Big 3 EC related businesses (average)
※Source: Prepared by GMO-PG
(DEC-14=1)
12Copyright (C) 1995 GMO Payment Gateway, Inc. All Rights Reserved.
2. Progress of the growth strategy

13Copyright (C) 1995 GMO Payment Gateway, Inc. All Rights Reserved.
・Cultivate large merchants withinand outside Japan
・Approaching to all EC market(BtoC, CtoC, BtoB)
2
Sustaining more than 25% income growth is our mission
2.1 Quantitative performance targets
Growth of existing business (Foundation for 20% profit growth)
Developing new business areas (To achieve more than 5% profit growth)
・FinTech / Money Service Business
・Upfront investments (Global business)
20% growth line
25% growth line
2005 2016 Around 2025Around 2020
¥0.19bil ¥3.7bil ¥10bil ¥25bilOrdinary income
※Ordinary income:2005:actual, 2016:forecast, Other number: targets
1
4
3
14Copyright (C) 1995 GMO Payment Gateway, Inc. All Rights Reserved.
-2
-1.5
-1
-0.5
0
0.5
1
1.5
10-12. 1- 3.
2015
4- 6. 7- 9. 10-12. 1- 3.
2016
4- 6. 7- 9.
1000000
1200000
1400000
1600000
1800000
2000000
2200000
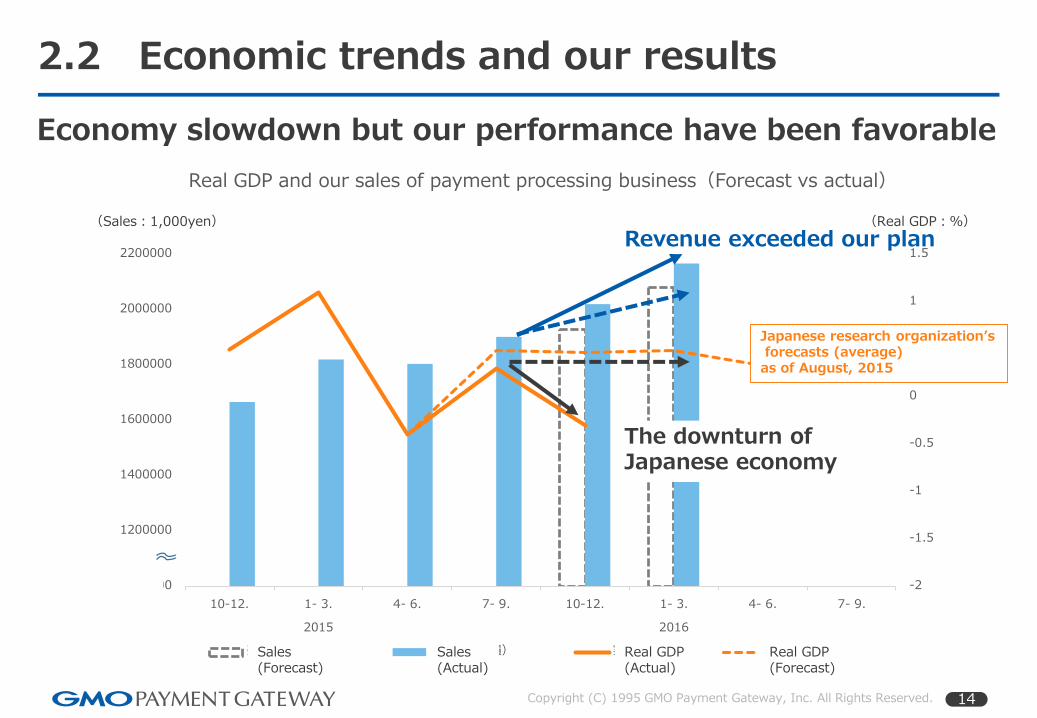
Real GDP and our sales of payment processing business(Forecast vs actual)
売上高(予想) 売上高(実績) 実質GDP 実質GDP予想
Revenue exceeded our plan
The downturn ofJapanese economy
2.2 Economic trends and our results
Economy slowdown but our performance have been favorable
Japanese research organization’sforecasts (average)
as of August, 2015
(Sales:1,000yen) (Real GDP:%)
Sales (Forecast)
Sales (Actual)
Real GDP(Actual)
Real GDP(Forecast)

15Copyright (C) 1995 GMO Payment Gateway, Inc. All Rights Reserved.
2.3.1 Existing business:Online payment
Cultivating major/growing merchantsSales composition by scale of merchants(compared with the same period)
※non-consolidated sales analysis, ex MSB related sales
0
100,000
200,000
300,000
400,000
500,000
600,000
Mar.2015 Mar.2016
TOP100 Others
Total+29.9%
Top100+34.5%
Cultivating major merchants(Project with system development, etc)
The sales composition ratio of new merchantsMar.2015 Mar.2016
1.0% → 3.5%
Positive factors
Growth of our merchants(Cultivating growing merchants)(Expanding our value-added service)
Comparable 79 merchants of the Top100
Sales growth ratio (average):+57.6%
Goods +41.0%
Apparel +36.3%
Digital contents +33.9%
Service commerce +25.2%
Growing sector
Others+25.2%
1
(1,000yen)
16Copyright (C) 1995 GMO Payment Gateway, Inc. All Rights Reserved.
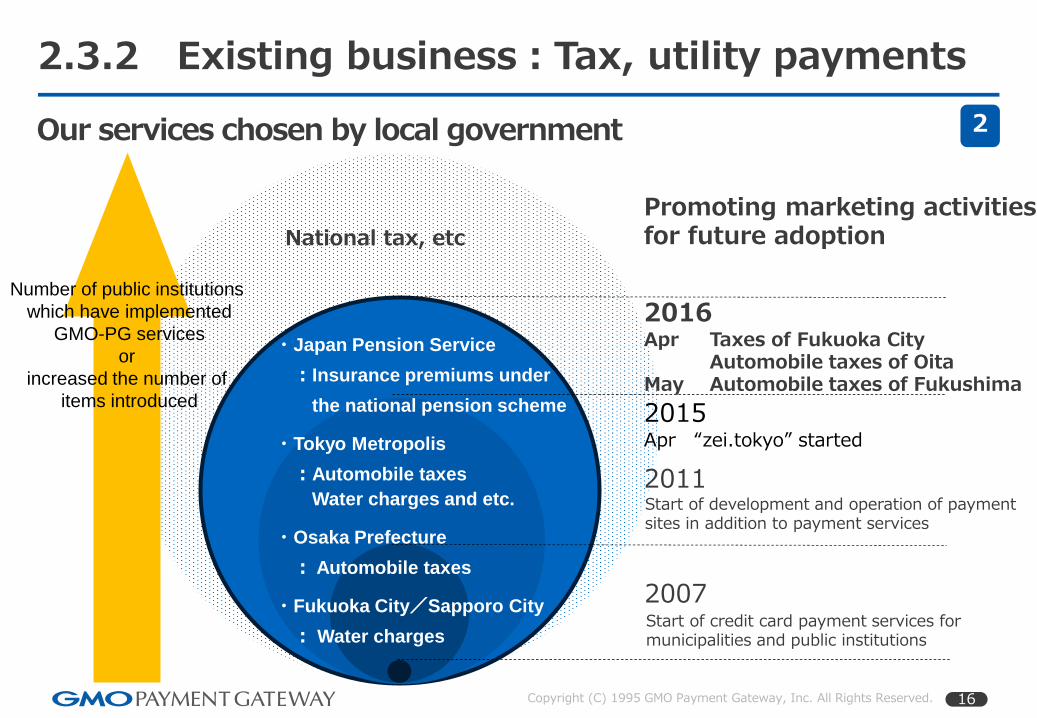
2007
2016Apr Taxes of Fukuoka City
Automobile taxes of OitaMay Automobile taxes of Fukushima
Start of development and operation of payment sites in addition to payment services
Start of credit card payment services for municipalities and public institutions
2.3.2 Existing business:Tax, utility payments
Our services chosen by local government
2015Apr “zei.tokyo” started
Promoting marketing activitiesfor future adoption
2
National tax, etc
Number of public institutions
which have implemented
GMO-PG services
or
increased the number of
items introduced
・Japan Pension Service
:Insurance premiums under
the national pension scheme
・Tokyo Metropolis
:Automobile taxes
Water charges and etc.
・Osaka Prefecture
: Automobile taxes
・Fukuoka City/Sapporo City
: Water charges
2011
17Copyright (C) 1995 GMO Payment Gateway, Inc. All Rights Reserved.
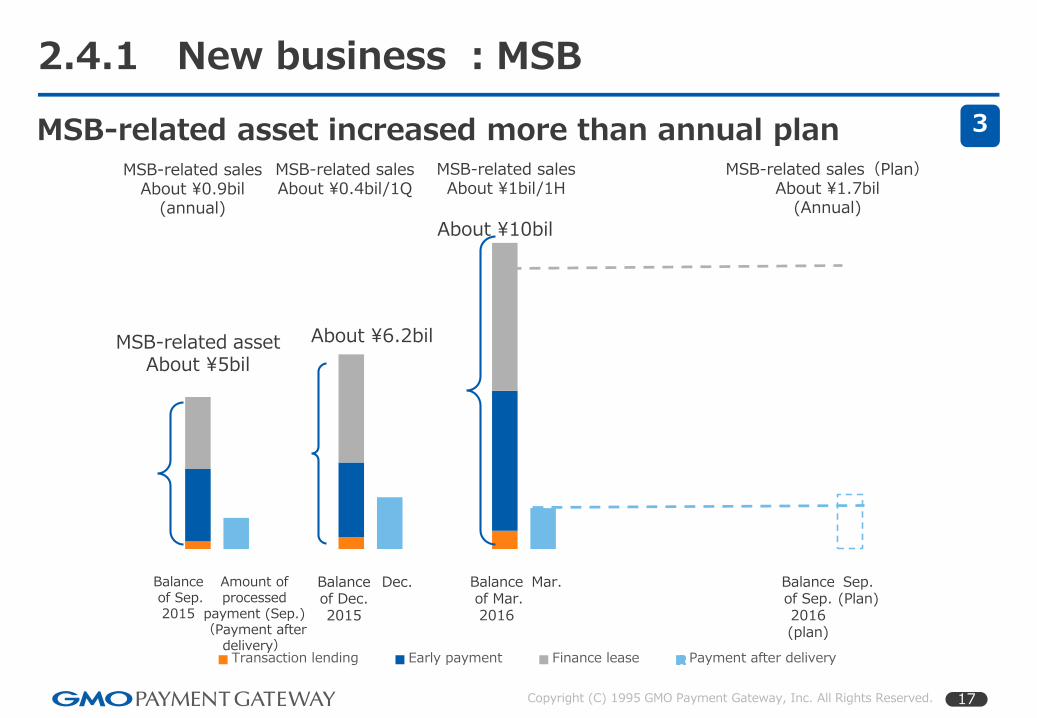
Transaction lending Early payment Finance lease Payment after delivery
Balanceof Sep.2016(plan)
Sep.(Plan)
Amount of processed
payment (Sep.)(Payment after
delivery)
2.4.1 New business :MSB
MSB-related sales(Plan)About ¥1.7bil
(Annual)
Dec.
MSB-related salesAbout ¥0.9bil
(annual)
About ¥6.2bil
MSB-related asset increased more than annual plan
MSB-related assetAbout ¥5bil
About ¥10bil
MSB-related salesAbout ¥0.4bil/1Q
MSB-related salesAbout ¥1bil/1H
Balanceof Sep. 2015
Mar.
3
Balanceof Dec.2015
Balanceof Mar.2016

18Copyright (C) 1995 GMO Payment Gateway, Inc. All Rights Reserved.
To develop lending businesses in stages
Representativecontract
(Spread)
Payment duetwice
×2 Lending TransactionLending
Early payment(Upgrade)
About ¥800bil(Amount of processed payments:
representative contract)
About ¥4.4bil(Balance of Mar. 2016)
About ¥0.6bil(Balance of Mar. 2016)
2.4.2 New business:MSB
0.5% 0.08%
Measures to increase conversion rate・Speed up the credit review process・Expanding the scope of target merchant・Expansion of credit limit / addition of function
3
19Copyright (C) 1995 GMO Payment Gateway, Inc. All Rights Reserved.
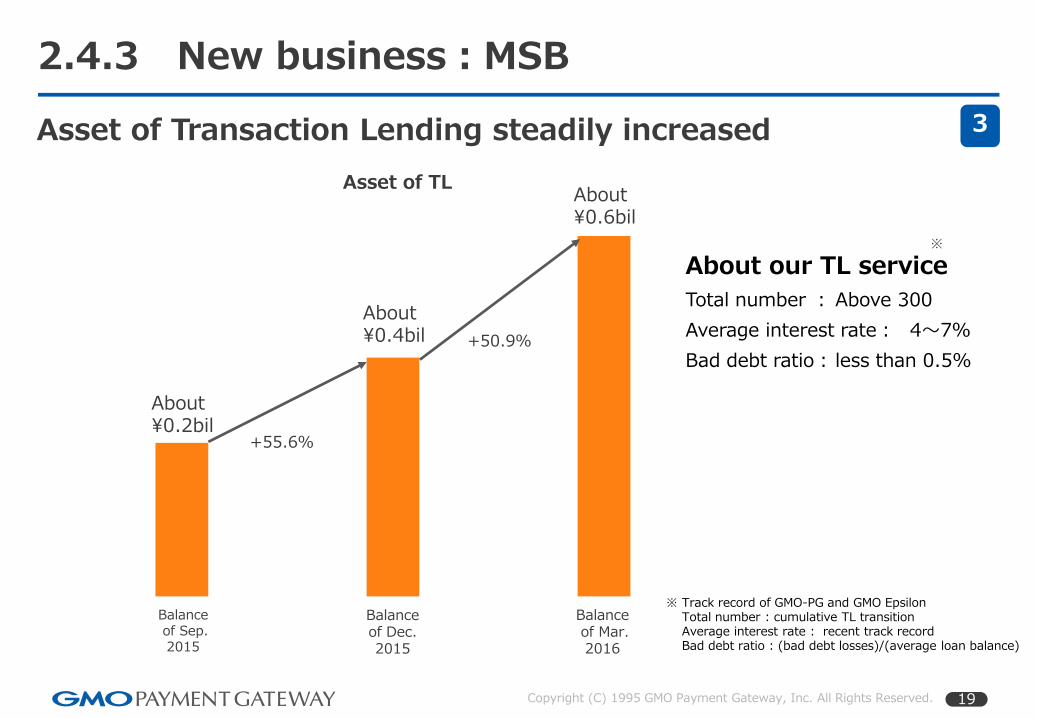
Balanceof Sep. 2015
Balanceof Dec.2015
Balanceof Mar.2016
2.4.3 New business:MSB
About ¥0.4bil
Asset of Transaction Lending steadily increased
About ¥0.2bil
About ¥0.6bil
※ Track record of GMO-PG and GMO EpsilonTotal number : cumulative TL transitionAverage interest rate : recent track recordBad debt ratio : (bad debt losses)/(average loan balance)
About our TL service
Total number : Above 300
Average interest rate: 4~7%
Bad debt ratio: less than 0.5%
+55.6%
+50.9%
3
Asset of TL
※
20Copyright (C) 1995 GMO Payment Gateway, Inc. All Rights Reserved.
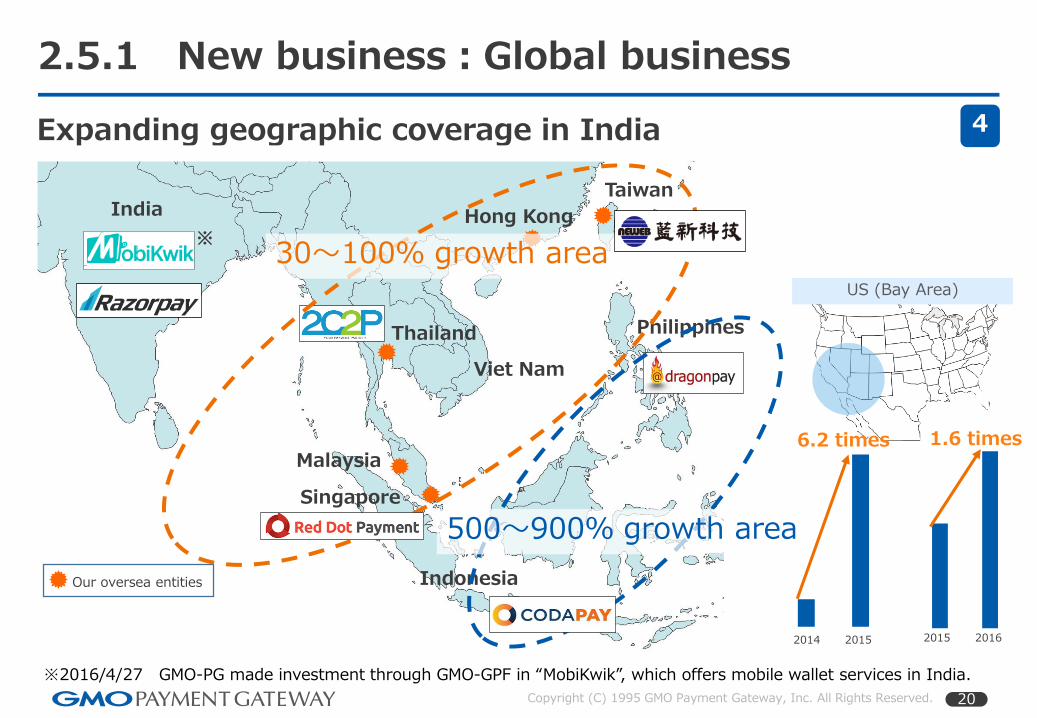
US (Bay Area)
20152014 20162015
6.2 times 1.6 times
Taiwan
Hong Kong
Thailand
Singapore
Malaysia
Viet Nam
Philippines
Indonesia
India
Our oversea entities
2.5.1 New business:Global business
4Expanding geographic coverage in India
30~100% growth area
500~900% growth area
※2016/4/27 GMO-PG made investment through GMO-GPF in “MobiKwik”, which offers mobile wallet services in India.
※
21Copyright (C) 1995 GMO Payment Gateway, Inc. All Rights Reserved.
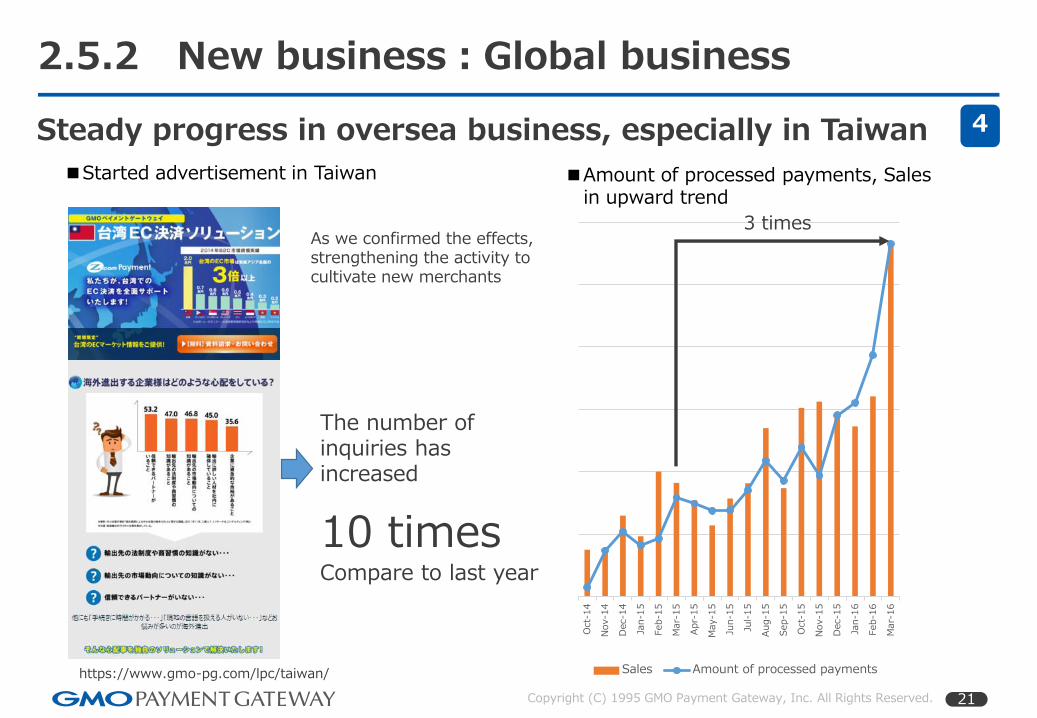
■Started advertisement in Taiwan
https://www.gmo-pg.com/lpc/taiwan/
As we confirmed the effects, strengthening the activity to cultivate new merchants
Oct-
14
Nov-1
4
Dec-1
4
Jan-1
5
Feb-1
5
Mar-
15
Apr-
15
May-1
5
Jun-1
5
Jul-
15
Aug-1
5
Sep-1
5
Oct-
15
Nov-1
5
Dec-1
5
Jan-1
6
Feb-1
6
Mar-
16
Sales Amount of processed payments
2.5.2 New business:Global business
Steady progress in oversea business, especially in Taiwan
■Amount of processed payments, Salesin upward trend
3 times
4
The number of inquiries has increased
10 timesCompare to last year
22Copyright (C) 1995 GMO Payment Gateway, Inc. All Rights Reserved.
3. Financial highlights

23Copyright (C) 1995 GMO Payment Gateway, Inc. All Rights Reserved.
3.1 Summary of the consolidated results
Sales and income exceed the forecast
(Million yen)
1H of FY2016 YoY 1H of FY2015
ActualSales
compositionGrowth Growth rate Actual
Sales composition
Sales 5,730 100.0 1,567 37.7% 4,162 100.0
Cost of sales 1,297 22.6 439 51.3% 858 20.6
Gross income 4,432 77.4 1,127 34.1% 3,304 79.4
SG&A 2,553 44.6 736 40.5% 1,817 43.6
Operating income 1,879 32.8 391 26.3% 1,487 35.7
Ordinary income 1,918 33.5 388 25.4% 1,530 36.8
Net income 1,151 20.1 214 22.9% 937 22.5
Net incomeper share(Yen) 31.01 - - - 27.14 -
※Our company issued 2,587,300 shares of common stock through a third-party allotment with a payment date of June 25, 2015

24Copyright (C) 1995 GMO Payment Gateway, Inc. All Rights Reserved.
3.2 Summary of the consolidated balance sheets
MSB linked to current assets(Million yen)
Results for 2Q, FY2016
Results for 2Q, FY2015 Change
Current assets 43,788 29,178 14,609
Cash and deposits 31,171 26,068 5,103
Lease receivables 4,713 143 4,570
Advance payments 3,191 943 2,248
Accounts receivable 1,354 776 578
Allowance for
doubtful accounts△258 △123 △134
Other current assets 3,617 1,371 2,246
Fixed assets 5,414 2,734 2,680
Tangible fixed assets 204 209 △4
Intangible fixed assets 1,153 819 333
Software 810 673 136
Investments and
other assets4,056 1,705 2,351
Total assets 49,203 31,912 17,290
(Million yen)Results for 2Q, FY2016
Results for 2Q, FY2015 Change
Current liabilities 32,355 24,470 7,884
Deposits 26,923 22,166 4,756
Accounts payable 2,574 1,119 1,455
Other current
liabilities2,858 1,185 1,673
Non-current liabilities 217 177 39
Shareholders’ equity 16,548 7,150 9,398
Capital stock 4,712 710 4,002
Total Accumulated other comprehensive income
80 110 △30
Total net assets 16,630 7,264 9,365
Total of liabilities and net assets
49,203 31,912 17,290
Deposits by merchants through representative merchant service
*Discrepancy occurs with the pace of merchants’ sales growth due to change in merchants’ cutoff date and payment cycle
Increase in investment securities and investments in other securities of subsidiaries and affiliates
Third-party allotment
Increase of Early Payment Service
Increase of Payment after delivery
Related to Finance Lease
Short-term loan receivables (=TL-related asset) is included in “Other current assets”
25Copyright (C) 1995 GMO Payment Gateway, Inc. All Rights Reserved.
93,072117,872 112,981 127,249 127,499
183,609
108,580147,110
105,579142,887 127,279
150,905 142,188161,170
363,264
374,667 396,019425,963
464,560483,241
501,688 499,083 516,330528,120
565,664594,679
663,581
728,714
390,290401,280 431,131
441,038470,792
505,369526,041 540,507
584,529
659,842681,844
708,637
771,471
826,928
464,540
526,214 529,688568,811 582,291
670,573689,264
705,327752,202
873,483889,917
1,148,9871,155,545
1,280,987
0
200,000
400,000
600,000
800,000
1,000,000
1,200,000
12/12 (1Q) 13/3 (2Q) 13/6 (3Q) 13/9 (4Q) 13/12 (1Q) 14/3 (2Q) 14/6 (3Q) 14/9 (4Q) 14/12 (1Q) 15/3 (2Q) 15/6 (3Q) 15/9 (4Q) 15/12 (1Q) 16/3 (2Q)
(1,000yen)
Initial Stock Fee Spread
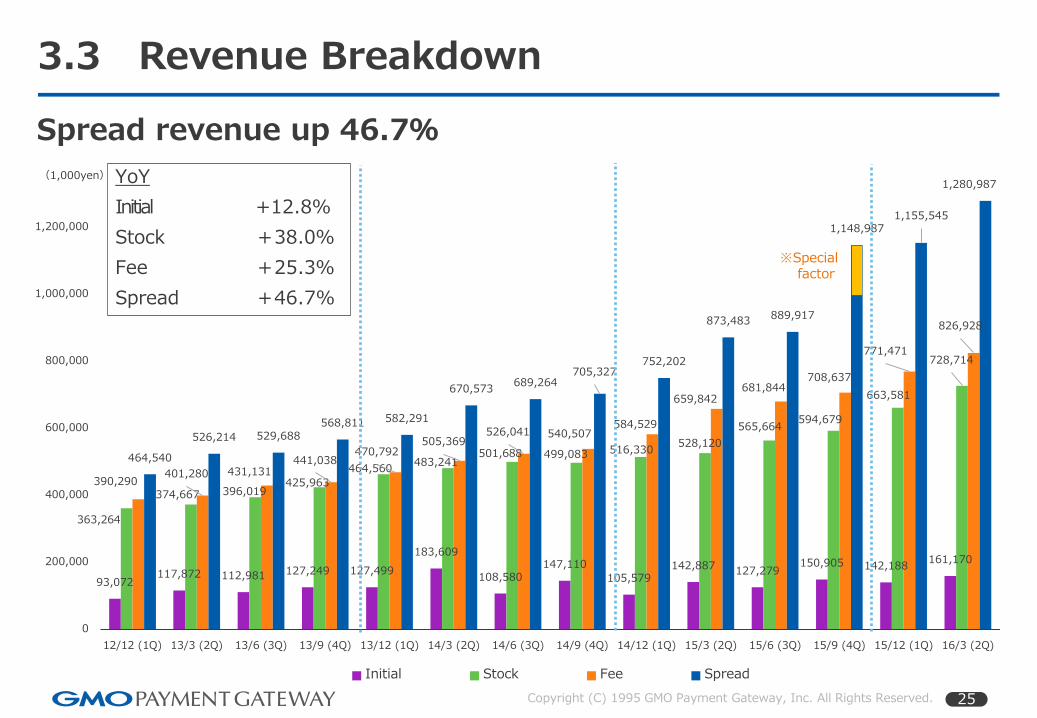
3.3 Revenue Breakdown
Spread revenue up 46.7%
YoY
Initial +12.8%
Stock +38.0%
Fee +25.3%
Spread +46.7%
※Special factor
26Copyright (C) 1995 GMO Payment Gateway, Inc. All Rights Reserved.
1,311,166
1,420,0341,469,820
1,563,0631,645,144
1,842,793 1,825,5741,892,030
1,958,642
2,204,334 2,264,704
2,603,210
2,732,786
2,997,800
231,643 253,353 261,235 284,580317,675
384,293 365,973 368,339 382,006476,005
508,027 553,797615,078
682,804
600,491 630,407 647,175
806,331 750,260 796,546 783,601 962,443
851,039966,013 944,400 1,372,331
1,246,788
1,306,75917.7% 17.8% 17.8%
18.2%19.3%
20.9%20.0% 19.5%
19.5%21.6% 22.4%
21.3% 22.5% 22.8%
45.8% 44.4% 44.0%
51.6%
45.6%43.2%
42.9%
50.9%
43.5% 43.8%
41.7%
52.7%
45.6% 43.6%
0.0%
10.0%
20.0%
30.0%
40.0%
50.0%
0
500,000
1,000,000
1,500,000
2,000,000
2,500,000
3,000,000
12/12 (1Q) 13/3 (2Q) 13/6 (3Q) 13/9 (4Q) 13/12 (1Q) 14/3 (2Q) 14/6 (3Q) 14/9 (4Q) 14/12 (1Q) 15/3(2Q) 15/6(3Q) 15/9(4Q) 15/12(1Q) 16/3(2Q)
(1,000yen)
Sales Sales-cost SG&A Sales-cost ratio Sales-SG&A ratio
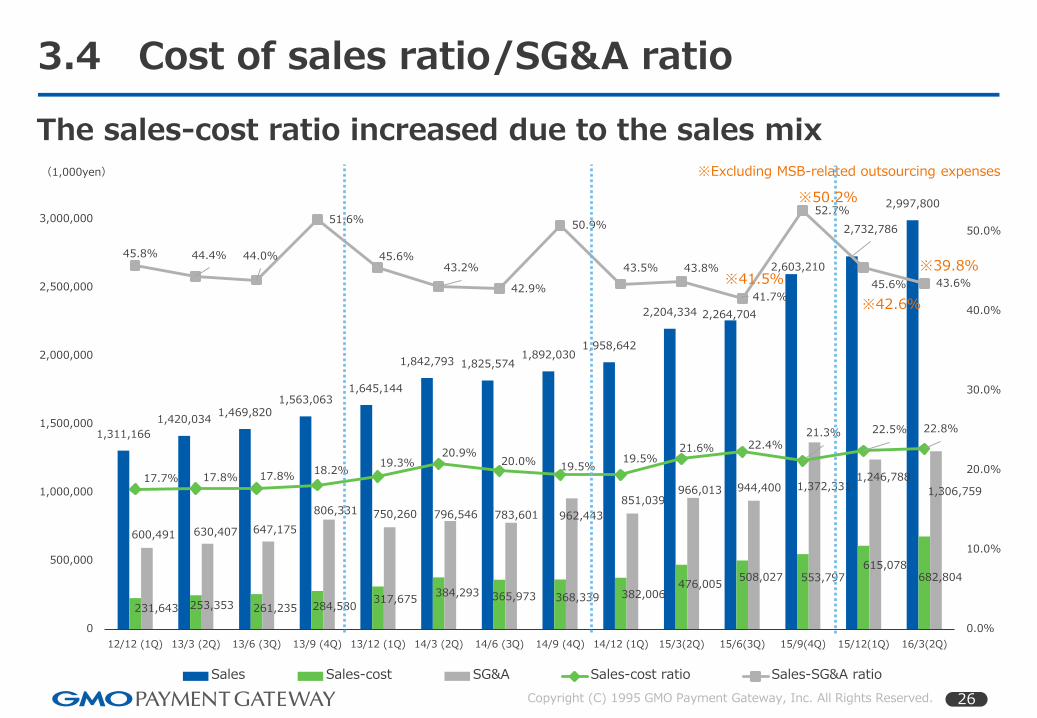
3.4 Cost of sales ratio/SG&A ratio
The sales-cost ratio increased due to the sales mix※Excluding MSB-related outsourcing expenses
※50.2%
※42.6%
※41.5%※39.8%
27Copyright (C) 1995 GMO Payment Gateway, Inc. All Rights Reserved.
0
5,000
10,000
15,000
20,000
0
10,000
20,000
30,000
40,000
50,000
60,000
10/6 10/9 10/12 11/3 11/6 11/9 11/12 12/3 12/6 12/9 12/12 13/3 13/6 13/9 13/12 14/3 14/6 14/9 14/12 15/3 15/6 15/9 15/12 16/3
Recurring payment Online Payment Number of operating stores
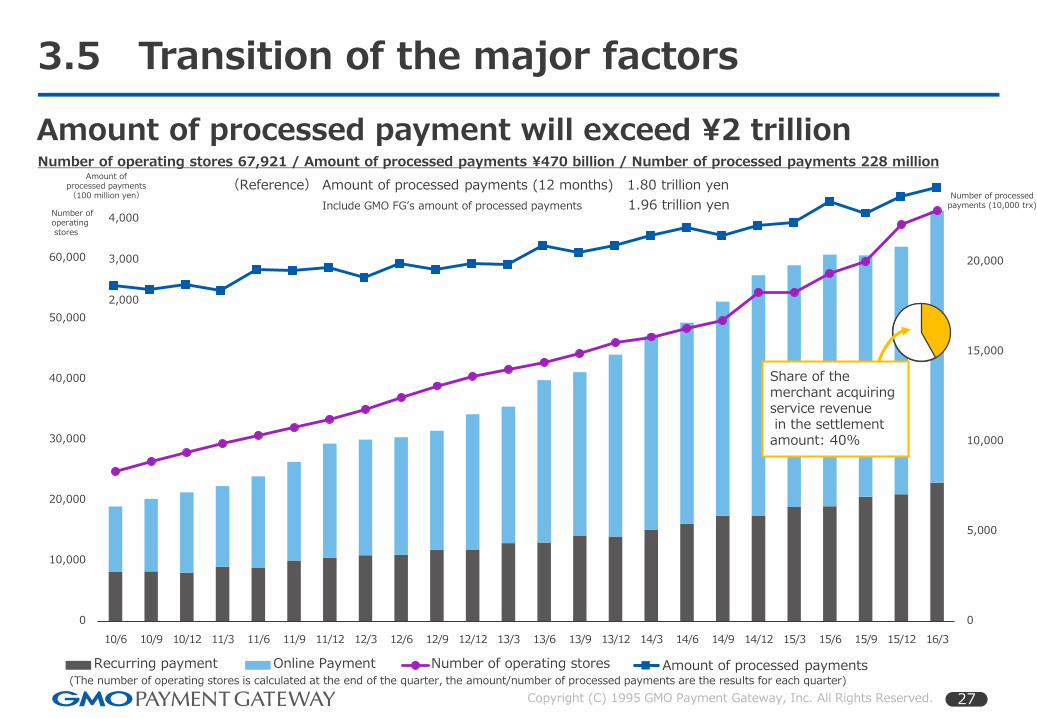
3.5 Transition of the major factors
Amount of processed payment will exceed ¥2 trillion
4,000
3,000
2,000
Number of operating stores 67,921 / Amount of processed payments ¥470 billion / Number of processed payments 228 million
(Reference) Amount of processed payments (12 months) 1.80 trillion yen
Include GMO FG’s amount of processed payments 1.96 trillion yen
Amount of processed payments(100 million yen)
Number of operatingstores
Number of processed payments (10,000 trx)
Amount of processed payments(The number of operating stores is calculated at the end of the quarter, the amount/number of processed payments are the results for each quarter)
Share of the merchant acquiring service revenuein the settlement amount: 40%
28Copyright (C) 1995 GMO Payment Gateway, Inc. All Rights Reserved.
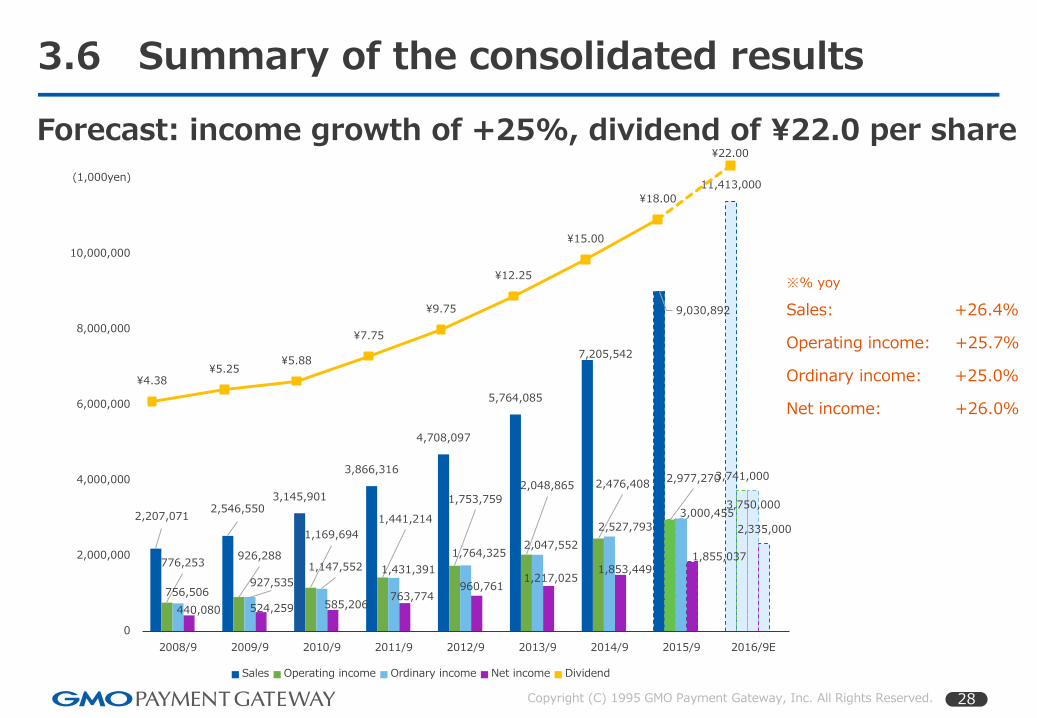
2,207,0712,546,550
3,145,901
3,866,316
4,708,097
5,764,085
7,205,542
9,030,892
11,413,000
776,253926,288
1,169,694
1,441,214
1,753,759
2,048,865 2,476,4082,977,2703,741,000
756,506927,535
1,147,552 1,431,391
1,764,3252,047,552
2,527,793
3,000,4553,750,000
440,080 524,259 585,206763,774
960,7611,217,025
1,853,4491,855,037
2,335,000
0
2,000,000
4,000,000
6,000,000
8,000,000
10,000,000
2008/9 2009/9 2010/9 2011/9 2012/9 2013/9 2014/9 2015/9 2016/9E
(1,000yen)
Sales Operating income Ordinary income Net income Dividend
3.6 Summary of the consolidated results
Forecast: income growth of +25%, dividend of ¥22.0 per share
※% yoy
Sales: +26.4%
Operating income: +25.7%
Ordinary income: +25.0%
Net income: +26.0%
¥4.38 ¥5.25
¥5.88
¥7.75
¥9.75
¥12.25
¥15.00
¥18.00
¥22.00

29Copyright (C) 1995 GMO Payment Gateway, Inc. All Rights Reserved.
0
2,000,000
4,000,000
6,000,000
8,000,000
10,000,000
2008/9 2009/9 2010/9 2011/9 2012/9 2013/9 2014/9 2015/9 2016/9E
Spread 529,138 666,209 934,441 1,274,419 1,636,774 2,089,254 2,647,458 3,664,591 4,918,924
Fee 816,868 897,658 1,060,123 1,235,737 1,418,822 1,663,741 2,042,710 2,634,854 3,265,310
Stock 608,236 702,946 839,522 1,022,263 1,251,675 1,559,914 1,948,574 2,204,794 2,513,386
Initial 252,828 279,735 311,813 333,895 400,823 451,175 566,799 526,652 716,252
(1,000yen)
※% yoy
+ 12.6%
+ 24.6%
+ 17.3%
+ 27.6%
+24.6%
+1.9%
+4.1%
+46.9%
+ 11.5%
+ 19.4%
+ 18.1%
+ 40.3%
+10.6%
+15.6%
+9.9%
+25.9%
+ 7.1%
+ 21.8%
+ 16.6%
+ 36.4%
+ 20.0%
+ 22.4%
+ 14.8%
+ 28.4%
3.7 Revenue Breakdown
Action plans to realize the growth
+ 25.6%
+ 24.9%
+ 22.8%
+ 26.7%
-7.1%
+ 13.2%
+ 29.0%
+ 38.4%
+ 34.2%
+23.9%
+14.0%
+36.0%
・Cultivate growing merchants
・Service to increase the merchants’ sales
・Expansion of MSB such as Transaction Lending, Early payment
・Cultivating large-scale merchants
・GMO payment later”expansion
・”Remittance service” expansion
・Cultivating large-scale merchants
・ “Online Advertising Service“ expansion
・System developmentand Services for large-sized enterprises
・Cultivating large-scale merchants
Thank you very much!
GMO Payment Gateway Inc.
URL https://corp.gmo-pg.com/en
( T S E : 3 7 6 9 )
For more information, please contact the Corporate Value Creation Strategy Division
Investor relations office TEL:+81-3-3464-0182