financial results briefing materials - furuno
TRANSCRIPT

FURUNO ELECTRIC CO., LTD. All Rights Reserved.
October 13, 2020
2nd Quarter of FY 2/2021
Financial Results Briefing Materials
Points to Note: This document is a translation of the Japanese original. The Japanese original is authoritative. The information listed in these materials the Company’s future prospects as determined by management, based on the information available at the time of announcement, and potential risks and uncertainties. It should be noted that the actual results may differ substantially from these forecasts, due to these various elements. The numerical values shown in these materials are the monetary amounts listed in the consolidated balance sheet, consolidated profit-and-loss statement, consolidated statement of changes in shareholders’ equity, and notes to consolidated financial statements. Shown values of less than one unit are truncated, and ratios and other values are rounded off. * “FY” in this material indicates the fiscal year ending February 28(29) of the succeeding year. ** “2Q” or “2nd Quarter” in this material represents the six-month period beginning on March 1 and ending on.

FURUNO ELECTRIC CO., LTD. All Rights Reserved.
FY 2/2021 2nd Quarterly Points of the Results
2
Performance: Decrease in sales and profit
Revenue and profit decreased due to factors such as the impact of economic stagnation associated with measures for stopping the spread of the novel coronavirus infection COVID-19. However, business started to recover during the 2nd quarter (June to August).
Full-year earnings forecast: Upward revision
Based on actual results in the 2nd quarter and the outlook for business conditions, we have revised upwards the net sales and profit figures announced on August 19. We have left the annual dividend forecast as is.

FURUNO ELECTRIC CO., LTD. All Rights Reserved.
R&D expenses 2,234 2,353 +120 +5.4% ( Sales ratio ) (5.2%) ( 6.0% ) ( +0.8 )
Capital investment expenses 1,028 1,467 +439 +42.7%
( Sales ratio ) (2.4%) ( 3.7% ) ( + 1.3) Depreciation expenses 1,562 1,540 -22 -1.4%
( Sales ratio ) (3.6%) ( 3.9% ) ( +0.3 ) Unit: Yen, annual average exchange rate
1USD 111 109 -2 -2.0% 1EUR 124 120 -5 -3.7%
FY 2/2021 2nd Quarterly Results Highlights
Unit: Millions of Yen FY 2/2020 2nd Quarter
FY 2/2021 2nd Quarter
Year-over-year ( amount )
Year-over-year ( ratio )
Net sales 43,040 39,274 -3,765 -8.7% Gross profit 15,557 14,553 -1,004 -6.5%
( Sales ratio ) ( 36.1% ) ( 37.1% ) ( -1.0 ) Operating income 2,297 1,667 -630 -27.4%
( Sales ratio ) ( 5.3% ) ( 4.2% ) ( -1.1 ) Ordinary income 2,430 1,956 -474 -19.5%
( Sales ratio ) ( 5.6% ) ( 5.0% ) ( -0.6 ) Profit attributable to owners of parent 2,188 1,546 -642 -29.3%
( Sales ratio ) ( 5.1% ) ( 3.9% ) ( -1.2 )
3

FURUNO ELECTRIC CO., LTD. All Rights Reserved.
430.4
392.7
FY 2/2020 2nd Quarter
Japan -2.7 America
-0.4 Europe -5.6
Asia -20.6
Other Region -2.2
Foreign Exchange
Effect -5.2
PNT -7.9
Healthcare +0.7
Wireless LAN
Systems +7.7
FY 2/2021 2nd Quarter
Others -1.5
360
370
380
390
400
410
420
430
440
(Unit: 100 Millions of Yen)
*Exchange Rate Sensitivity (actual results as of February 29, 2020) [USD] Net sales 1.1 100M yen , Operating income 0.5 100M yen [Euro] Net sales 1.6 100M yen , Operating income 0.7 100M yen
Analysis of Increase/Decrease in Net Sales
4
Marine Business -36.7
In d u s t r i a l B u s i n e ss
-8.7
“100M” in this material indicates 100 Million

FURUNO ELECTRIC CO., LTD. All Rights Reserved.
0
5
10
15
20
25
Analysis of Increase/Decrease in Operating income
5
FY 2/2021 2nd Quarter
FY 2/2020 2nd Quarter
(Unit: 100 millions of Yen)
Marine Business Net sales Decrease -13.6
Marine Business
Gross profit margin
Decrease -0.6
Industrial Business Net sales Decrease
-2.1
Others -0.3
Strategic investment
-3.6
Other SG & A expenses
decrease +7.5
Industrial Business
Gross profit margin
Increase +0.8
Wireless LAN Systems
Gross profit Margin
Increase +1.0
Wireless LAN Systems
Sales Increase +4.7
A fall in revenue in the Marine Business and the impact of a decline in profits associated with strategic investments and other factors were covered to some extent by a rise in revenue in Wireless LAN Systems and a decrease in sales, general, and administrative expenses, etc.
※ Foreign exchange impact on operating income: -2.4 100M yen
23.0 16.7
Operating income -6.3
FURUNO ELECTRIC CO., LTD. All Rights Reserved.
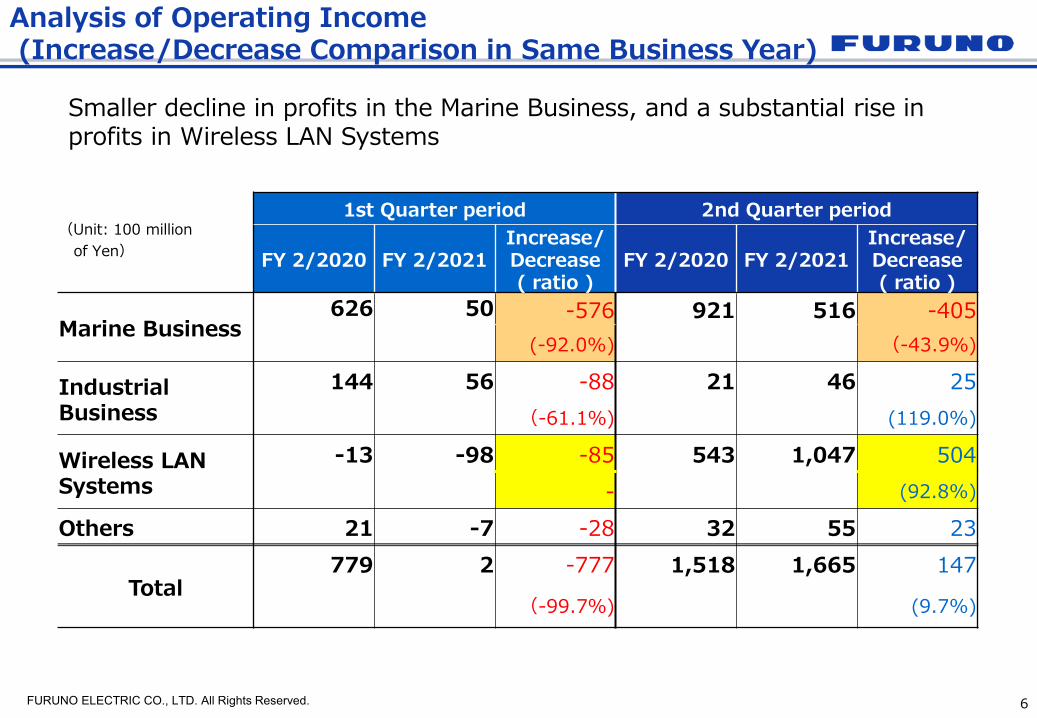
Analysis of Operating Income (Increase/Decrease Comparison in Same Business Year)
6
Smaller decline in profits in the Marine Business, and a substantial rise in profits in Wireless LAN Systems
(Unit: 100 million of Yen)
1st Quarter period 2nd Quarter period
FY 2/2020 FY 2/2021 Increase/ Decrease ( ratio )
FY 2/2020 FY 2/2021 Increase/ Decrease ( ratio )
Marine Business 626 50 -576 921 516 -405
(-92.0%) (-43.9%)
Industrial Business
144 56 -88 21 46 25 (-61.1%) (119.0%)
Wireless LAN Systems
-13 -98 -85 543 1,047 504 - (92.8%)
Others 21 -7 -28 32 55 23
Total 779 2 -777 1,518 1,665 147
(-99.7%) (9.7%)

FURUNO ELECTRIC CO., LTD. All Rights Reserved.
Overview of Marine Business
Marine Business: Net sales 312 100M yen(-10.5% year on year) Segment Profit 5.7 100M yen(-9.8 100M yen)
⇒ Most of the fall in revenue and subsequent decrease in profits were in Asia and Europe; however, business started to recover during the 2nd quarter
7
Japan: Net sales 102 100M yen (-2.6%) Business started to recover during the 2nd quarter,
and performance remains at the previous year’s levels
America: Net sales 39 100M yen ( -2.3%) The impact of the novel coronavirus was limited,
and performance remains at the previous year’s levels
Europe: Net sales 82 100M yen (-10.2%) Revenue fell due to the impact of foreign exchange
and the novel coronavirus; however, the decline stopped during the 2nd quarter
Asia: Net sales 77 100M yen (-22.0%) Revenue fell mostly due to the impact of reduced
operations at manufacturing sites during the 1st quarter; however, business started to recover during the 2nd quarter
93 105 102
42 40 39
96 91 82
86 98 77
15 15
13
0
100
200
300
400
2019年2月期 第2四半期
2020年2月期 第2四半期
2021年2月期 第2四半期
日本 米州 欧州 アジア その他
Net sales by Marine Business /Sales by Region
(Unit: 100Millions of Yen)
FY 2/2021 2nd Quarter
FY 2/2020 2nd Quarter
FY 2/2019 2nd Quarter
“100M” in this material indicates 100 Million
■Japan ■America ■Europe ■Asia ■Other

FURUNO ELECTRIC CO., LTD. All Rights Reserved.
42 41 33
9 9
10
7 8
6
20 22 30
0
30
60
90
2019年2月期 第2四半期
2020年2月期 第2四半期
2021年2月期 第2四半期
Overview of Industrial Business, Wireless LAN Systems
(Unit: 100 Millions of Yen)
8
Net sales by Industrial Business & Wireless LAN Access Point/ Sales by Products
FY 2/2021 2nd Quarter
FY 2/2020 2nd Quarter
FY 2/2019 2nd Quarter
PNT Business: Net sales 33.0 100M yen (-19.3%) Healthcare: Net sales 9.8 100M yen(+7.7%)
Wireless LAN Systems: Net sales 30.1 100M yen (+38.5% year on year) Segment profit 9.5 100M yen (+4.2 100M yen)
⇒ Wireless LAN Access Point sales grew substantially in the educational market, where the Global and Innovation Gateway for All (GIGA) school project is being promoted
⇒ Substantial rise in both revenue and profit
Industrial Business: Net sales 49 100M yen (-15.0% year on year) Segment profit 1.0 100M yen(-0.6 100M yen) ⇒ PNT Business recorded a fall in sales of ETC on-
board devices, due to factors such as refraining from long-distance travel as a result of the novel coronavirus
⇒ Healthcare recorded strong sales of clinical chemistry analyzers
■Wireless LAN Systems ■Other Industrial ■Healthcare ■PNT

FURUNO ELECTRIC CO., LTD. All Rights Reserved.
Awareness of the business environment after 3rd Quarter of FY 2/2021
9
Marine Business
【Merchant Vessel】 Will remain weak 【Fishing Vessel】 Already recovering overall, even with the impact of temporary economic stagnation 【Pleasure Boat】 Benefiting from a strong global pleasure boat market
Industrial Business
【PNT】 ETC on-board devices are recovering Time synchronization and other markets are generally strong 【Healthcare】 Not particularly impacted by the novel coronavirus 【Other Industrial】 Generally performing as planned
Wireless LAN Systems
【Wireless LAN Access Point 】 Substantial growth in demand this period coming from the GIGA school project 【Handheld Terminal】 Some customer-based variability,
but generally slow growth

FURUNO ELECTRIC CO., LTD. All Rights Reserved. 10
Full year earnings forecast and dividend forecast of FY 2/2021
Based on the cumulative actual results of the 2nd quarter and our understanding of business conditions from the 3rd quarter onwards, we have revised upwards our previous forecasts (announced on August 19, 2020)
(Unit: 100 Millions of Yen) FY 2/2021 Last forecast
FY 2/2021 Forecast this time
Increase/ Decrease
( amount)
Increase/ Decrease
( ratio)
Net sales 79,000 82,000 +3,000 +3.8%
Operating income 1,500 3,000 +1,500 +100.0% (Sales ratio ) ( 1.8% ) ( 3.6% ) ( +1.8 )
Ordinary income 2,000 3,500 +1,500 +75.0% ( Sales ratio ) ( 2.5% ) ( 4.2% ) ( +1.7 )
Profit attributable to owners of parent 1,500 3,000 +1,500 +100.0%
( Sales ratio ) ( 1.9% ) ( 3.6% ) ( +1.7 )
(Unit: Yen) End of 2nd Quarter Year end Year round Consolidated
payout ratio FY 2/2020 10 10 20 30.9% FY 2/2021 forecast 10 10 20 21.0%
Dividend forecast

FURUNO ELECTRIC CO., LTD. All Rights Reserved.
Corporate Profile
11

FURUNO ELECTRIC CO., LTD. All Rights Reserved. 12
Outline
Company Name FURUNO ELECTRIC CO., LTD. Headquarters Nishinomiya City, Hyogo, Japan Incorporated May 23, 1951
Business Manufacturing and sale of maritime and industrial electronic products
Paid-in Capital ¥7,534 million President Yukio Furuno
Since commercializing the world's first fish finder in 1948, FURUNO has supplied many types of products for the marine electronics market. By using its exclusive knowledge of ultrasonic and electronics technologies, FURUNO has developed a wide array of products that have been world firsts and Japan firsts.
As of Feb 29, 2020
Investor Relations⇒ http://www.furuno.co.jp/en/ir/ Products Site⇒ http://www.furuno.com/en/
Corporate Movie⇒ http://www.furuno.com/special/en/corporatemovie/

FURUNO ELECTRIC CO., LTD. All Rights Reserved.
Radar
Satellite Communications
Equipment
Fish Finder/Sonar Multi Beam
Sonar
Automatic Identification System (AIS)
GPS/GNSS Disciplined Oscillator
GPS/GNSS Receiver for Car
Navigation System
GPS Plotter Ultrasound
Bone Densitometer
ETC
Voyage Data Recorder (VDR)
Wireless LAN Access Point
Clinical Chemistry Analyzer
GPS/GNSS Displacement Continuous
Remote Monitoring System
FURUNO's Business Fields
Meteorological Monitoring and
Analyzing System
13