financial results for fiscal 2017 and forecast for fiscal 2018 · 4 financial results for fy2017...
TRANSCRIPT
1 ©Rolls-Royce
Financial Results for Fiscal 2017
and Forecast for Fiscal 2018
April 27, 2018 KOBE STEEL, LTD.
< IR Meeting Material>

- CONTENTS -
2
1.Financial Results for Fiscal 2017
2.Forecast for Fiscal 2018
3.Financial Strategy
4.Reference Information
1.Financial Results for Fiscal 2017
3

4
Financial Results for FY2017 (Billions of yen)
※ Gain on sale of investment securities: 9.1 billion yen, customer compensation expenses: (4.3 billion yen),
dismantlement related expenses: (2.7 billion yen)
Actual
①
Forecast
②
Actual
③③-① ③-②
Net Sales 1,695.8 1,890.0 1,881.1 185.2 (8.9)
Operating Income 9.7 75.0 88.9 79.1 13.9
Ordinary Income (Loss) (19.1) 60.0 71.1 90.2 11.1
Excluding inventory valuation (15.6) 46.5 56.1 71.7 9.6
Extraordinary Income 8.1 9.1 2.0 (6.1) (7.1)
Net Income (Loss) Attributable
to Owners of the Parent(23.0) 45.0 63.1 86.2 18.1
FY2016 FY2017 Change
※

5
Net Sales by Segment (Billions of yen)
Net Sales
Actual
①
Forecast
②
Actual
③③-① ③-②
Iron & Steel 620.6 715.0 715.5 94.9 0.5
Welding 82.2 80.0 80.5 (1.6) 0.5
Aluminum & Copper 323.3 345.0 349.5 26.2 4.5
Machinery 150.7 171.0 161.3 10.6 (9.7)
Engineering 121.1 128.0 122.8 1.6 (5.2)
Construction Machinery 310.4 355.0 364.5 54.0 9.5
Electric Power 70.6 72.0 72.1 1.5 0.1
Other Businesses 74.8 69.0 68.8 (5.9) (0.2)
Adjustment (58.2) (45.0) (54.3) 3.9 (9.3)
Total 1,695.8 1,890.0 1,881.1 185.2 (8.9)
FY2016 FY2017 Change

6
Ordinary Income (Loss) by Segment (Billions of yen)
Ordinary Income (Loss)
Actual
①
Forecast
②
Actual
③③-① ③-②
Iron & Steel (29.5) 15.0 17.3 46.8 2.3
Welding 6.8 5.0 4.9 (1.9) (0.1)
Aluminum & Copper 12.0 8.0 11.8 (0.1) 3.8
Machinery 5.8 3.5 2.3 (3.5) (1.2)
Engineering 2.8 5.0 6.9 4.1 1.9
Construction Machinery (31.3) 18.0 21.9 53.3 3.9
Electric Power 13.0 6.0 7.9 (5.1) 1.9
Other Businesses 7.6 4.5 5.4 (2.1) 0.9
Adjustment (6.4) (5.0) (7.5) (1.1) (2.5)
Total (19.1) 60.0 71.1 90.2 11.1
FY2016 FY2017 Change
7
Dividend
Dividends
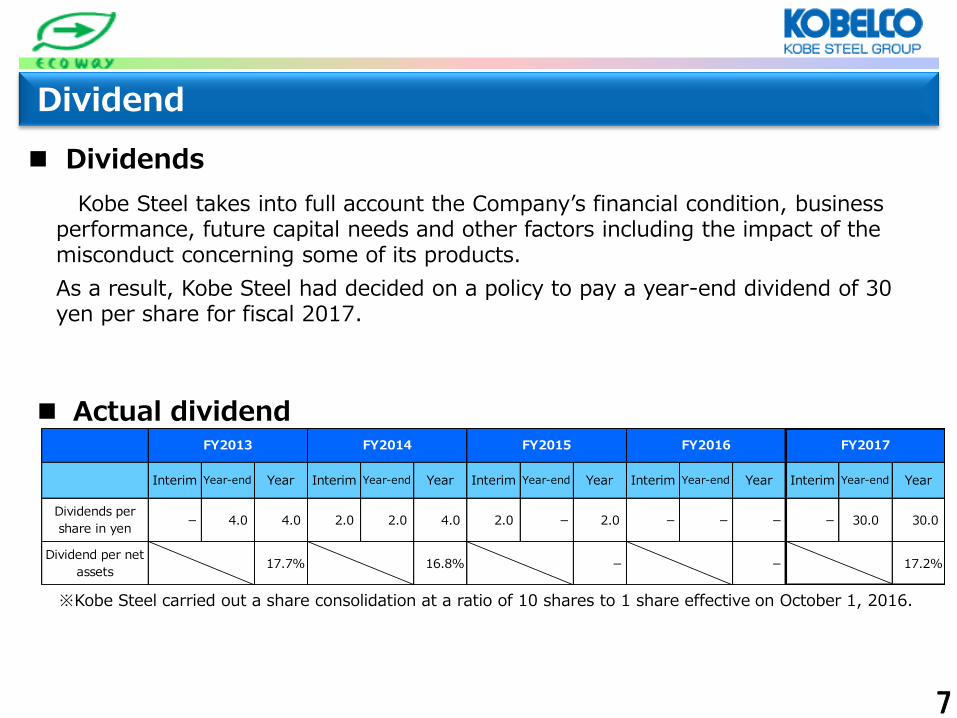
Kobe Steel takes into full account the Company’s financial condition, business performance, future capital needs and other factors including the impact of the misconduct concerning some of its products.
As a result, Kobe Steel had decided on a policy to pay a year-end dividend of 30 yen per share for fiscal 2017.
Actual dividend
※Kobe Steel carried out a share consolidation at a ratio of 10 shares to 1 share effective on October 1, 2016.
Interim Year-end Year Interim Year-end Year Interim Year-end Year Interim Year-end Year Interim Year-end Year
- 4.0 4.0 2.0 2.0 4.0 2.0 - 2.0 - - - - 30.0 30.0
17.7% 16.8% - - 17.2%
Dividends per
share in yen
Dividend per net
assets
FY2017FY2013 FY2014 FY2015 FY2016
8
2.Forecast for Fiscal 2018

9
Forecast for FY2018 (Billions of yen)
※ Gain on sale of investment securities: 30.0 billion yen
1H 2H Full year
①
1H 2H Full year
②②-①
Net Sales 907.0 974.0 1,881.1 960.0 1,030.0 1,990.0 108.9
Operating Income 51.4 37.4 88.9 15.0 40.0 55.0 (33.9)
Ordinary Income 45.7 25.3 71.1 5.0 30.0 35.0 (36.1)
Excluding inventory valuation 41.2 14.8 56.1 4.0 29.0 33.0 (23.1)
Extraordinary Income 9.0 (7.0) 2.0 30.0 ー 30.0 28.0
Net Income Attributable to
Owners of the Parent39.3 23.8 63.1 25.0 20.0 45.0 (18.1)
FY2017 FY2018 Change
※
10
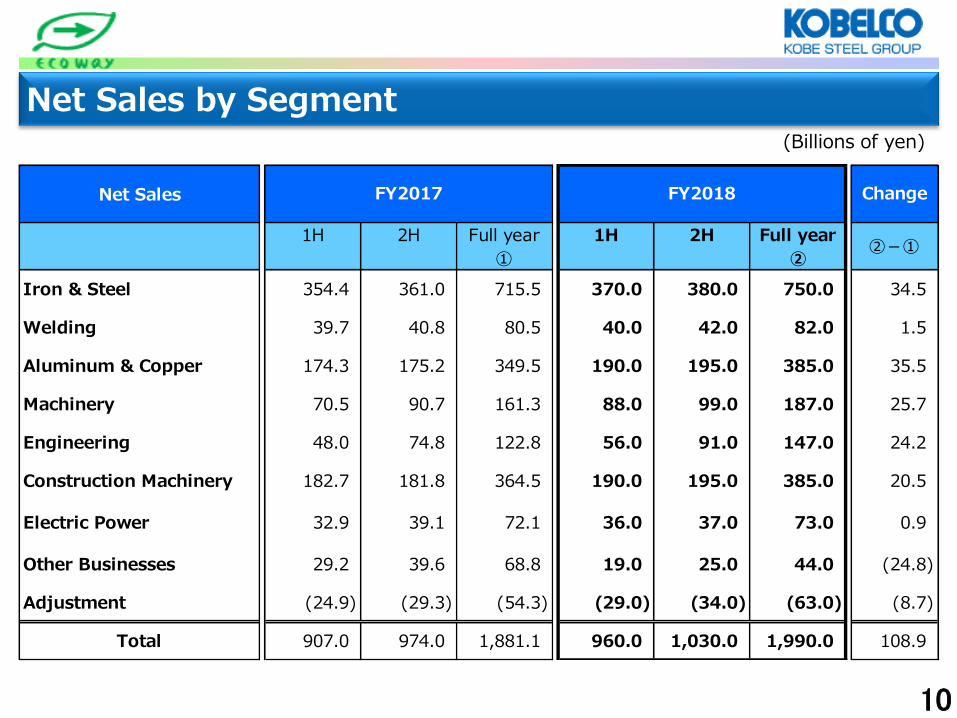
Net Sales by Segment (Billions of yen)
Net Sales
1H 2H Full year
①
1H 2H Full year
②②-①
Iron & Steel 354.4 361.0 715.5 370.0 380.0 750.0 34.5
Welding 39.7 40.8 80.5 40.0 42.0 82.0 1.5
Aluminum & Copper 174.3 175.2 349.5 190.0 195.0 385.0 35.5
Machinery 70.5 90.7 161.3 88.0 99.0 187.0 25.7
Engineering 48.0 74.8 122.8 56.0 91.0 147.0 24.2
Construction Machinery 182.7 181.8 364.5 190.0 195.0 385.0 20.5
Electric Power 32.9 39.1 72.1 36.0 37.0 73.0 0.9
Other Businesses 29.2 39.6 68.8 19.0 25.0 44.0 (24.8)
Adjustment (24.9) (29.3) (54.3) (29.0) (34.0) (63.0) (8.7)
Total 907.0 974.0 1,881.1 960.0 1,030.0 1,990.0 108.9
FY2017 FY2018 Change

11
Ordinary Income(Loss)by Segment (Billions of yen)
Ordinary Income (Loss)
1H 2H Full year
①
1H 2H Full year
②②-①
Iron & Steel 18.4 (1.0) 17.3 3.0 10.0 13.0 (4.3)
Welding 2.5 2.3 4.9 1.5 3.0 4.5 (0.4)
Aluminum & Copper 7.9 3.8 11.8 0.0 2.0 2.0 (9.8)
Machinery (0.4) 2.8 2.3 2.5 5.0 7.5 5.2
Engineering 1.7 5.1 6.9 (0.5) 5.0 4.5 (2.4)
Construction Machinery 11.4 10.5 21.9 12.5 8.5 21.0 (0.9)
Electric Power 3.3 4.5 7.9 (5.0) 3.0 (2.0) (9.9)
Other Businesses 1.7 3.6 5.4 (1.0) 4.0 3.0 (2.4)
Adjustment (0.9) (6.6) (7.5) (8.0) (10.5) (18.5) (11.0)
Total 45.7 25.3 71.1 5.0 30.0 35.0 (36.1)
FY2017 FY2018 Change

12
【Iron & Steel】
Demand for automobiles and large redevelopment projects in the Tokyo area is
expected to remain firm.
Kobe Steel will strive to increase margins and steadily implement cost reduction
measures including consolidation of upstream operations in Kakogawa Works.
On the other hand, in addition to lower inventory valuation impact and anticipated
higher fixed costs, we anticipate lower profits, taking into consideration uncertain
factors in our business as certain risks.
FY2018
(Billions of yen)
Change
1H 2H Full Year
①
1H 2H Full Year
②②-①
Net Sales 354.4 361.0 715.5 370.0 380.0 750.0 34.5
Ordinary Income
(Loss)18.4 (1.0) 17.3 3.0 10.0 13.0 (4.3)
Inventory Valuation 2.5 6.5 9.0 0.0 1.0 1.0 (8.0)
FY2017 FY2018

【Iron & Steel】 Strengthening Profitability
△100
△14.9
150
Profitability is steadily improving owing to capital investment, cost cuts at the production level, and lower raw material costs.
Additional measures to improve profitability
(Impact from improved profitability +30 billion yen/ cumulative 5 years)
FY16 + 8.5(actual)
FY17 + 18.0(actual)
FY18 + 26.5(forecast)
FY20 + 30.0(plan)
Start-up of related equipment has
progressed as planned. Consolidated
operations started in Nov. 2017.
Consolidation of upstream operations
(Impact from improved profitability +15 billion yen/year)
FY2017 + 6.5 (actual) FY2018 + 15.0(forecast)
+8.5
・・
FY2016 (Actual)
△29.5
FY16⇒FY17 : Main factors of cost changes Relining of a blast furnace +12.0 Consolidation of upstream operations + 6.5 Additional measures to improve profitability + 9.5
Total+28.0
(In billions of yen) Margin and product mix Production & shipments +15.5 Raw material prices (10.0) Exchange rate changes ± 0.0
Margin and product mix Production & shipments +70.5 Raw material prices (53.0) Exchange rate changes (6.5)
Others
(3.0)
+11.0
(8.0)
13.0
+28.0
17.3
(29.5)
FY2017 (Actual)
Overall costs
reduction
Inventory valuation
Inventory valuation
FY17 ⇒ FY18 forecast Consolidation of upstream operations +8.5 Additional measures to improve profitability +8.5 Other factors of cost changes (11.0) Total +6.0
FY2018 (Forecast)
+7.0
+5.5
+6.0
Overall costs
reduction
Others
+8.5
+0.8 (7.8)
13

【Iron & Steel】 Production & Sales
14
FY2018
1H 2H Full year 1H 2H Full yearFull year
Forecast
Japan's Domestic crude
steel production
(Millions of
tons)52.6 52.6 105.2 52.0 52.8 104.8
<Domestic steel inventory trend>
Ordinary steel products(Millions of
tons)5.6 5.4 -- 5.7 5.8
Rolled sheets(Millions of
tons)4.0 3.8 -- 4.2 4.1
<Domestic steel inventory trend>
Finished auto production(Millions of
cars)4.4 5.0 9.4 4.7 4.1
<KOBE STEEL, LTD.>
Crude steel production(Millions of
tons)3.8 3.4 7.2 3.9 3.5 7.5 about 7.0
Sales volume(Millions of
tons)2.9 3.0 5.9 3.0 2.9 6.0 about 5.9
(Domestic) (2.0) (2.2) (4.2) (2.2) (2.1) (4.4)
(Exports) (0.9) (0.8) (1.7) (0.8) (0.8) (1.6)
Average steel selling price(Thousands of
yen/ton)68.0 73.1 70.6 81.5 81.5 81.5
Export ratio (value basis) 29.5% 27.7% 28.6% 26.4% 28.0% 27.2%
FY2017FY2016
end of Feb.
end of Feb.
end of Feb.
15
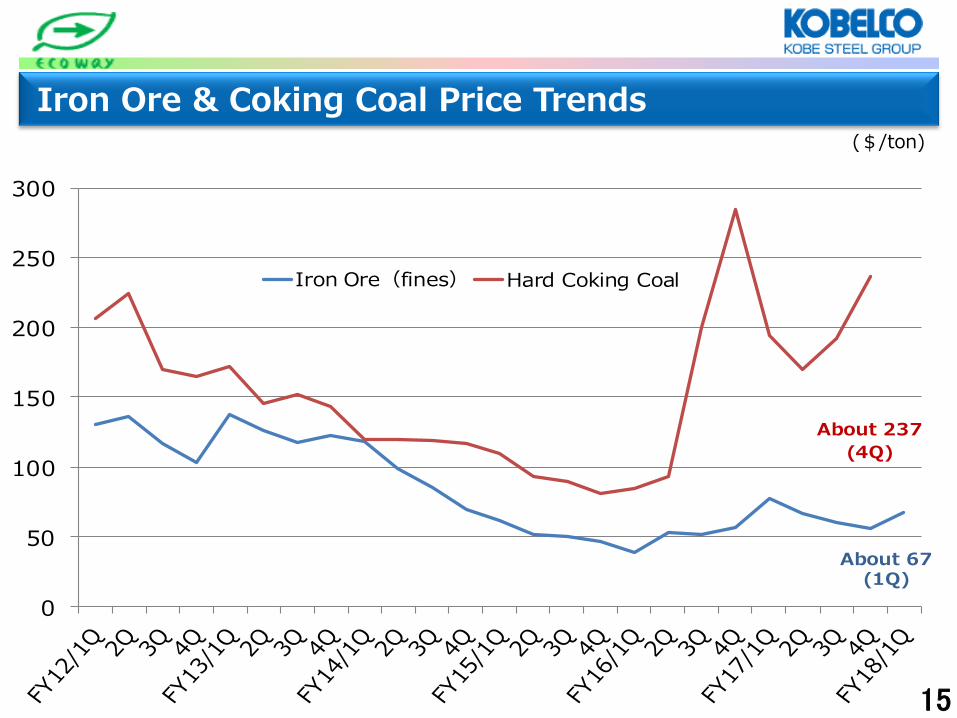
Iron Ore & Coking Coal Price Trends ($/ton)
0
50
100
150
200
250
300
Iron Ore(fines) Hard Coking Coal
About 67(1Q)
About 237
(4Q)

16
Steel Product Price Trends at Kobe Steel (Thousands of yen /ton)
60
70
80
90
100
82 (4Q)
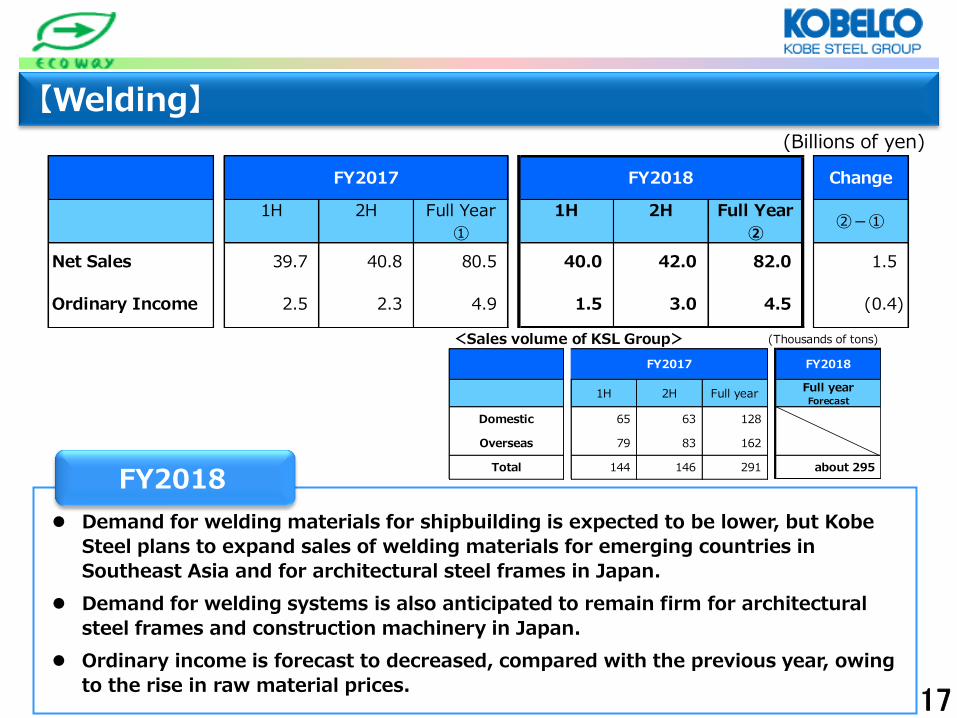
【Welding】
Demand for welding materials for shipbuilding is expected to be lower, but Kobe
Steel plans to expand sales of welding materials for emerging countries in
Southeast Asia and for architectural steel frames in Japan.
Demand for welding systems is also anticipated to remain firm for architectural
steel frames and construction machinery in Japan.
Ordinary income is forecast to decreased, compared with the previous year, owing
to the rise in raw material prices.
FY2018
(Billions of yen)
<Sales volume of KSL Group> (Thousands of tons)
FY2018
1H 2H Full yearFull yearForecast
Domestic 65 63 128
Overseas 79 83 162
Total 144 146 291 about 295
FY2017
17
Change
1H 2H Full Year
①
1H 2H Full Year
②②-①
Net Sales 39.7 40.8 80.5 40.0 42.0 82.0 1.5
Ordinary Income 2.5 2.3 4.9 1.5 3.0 4.5 (0.4)
FY2017 FY2018

18
【Aluminum & Copper】
Demand for aluminum and copper rolled products is anticipated to continue to
remain firm. On the other hand, the misconduct will impact this business to a
certain degree.
Ordinary income is forecast to decrease compared with the previous year due to
the lower impact of inventory valuation, higher fixed costs, and increased energy
cost.
FY2018
(Billions of yen)
Change
1H 2H Full Year
①
1H 2H Full Year
②②-①
Net Sales 174.3 175.2 349.5 190.0 195.0 385.0 35.5
Ordinary Income 7.9 3.8 11.8 0.0 2.0 2.0 (9.8)
Inventory Valuation 2.0 4.0 6.0 1.0 0.0 1.0 (5.0)
FY2017 FY2018
<Sales volume of KSL> (Thousands of tons)
FY2018
1H 2H Full YearFull YearForecast
( Domestic ) 153 132 285 about285
( Exports ) 40 38 78 about80
71 70 142 about145
Aluminum Rolled Products
Copper Rolled Products
FY2017

19
【Machinery】
Orders are forecast to be higher than the previous year owing to
recovering demand for compressors in China, strengthening product
competitiveness by lowering costs, and expanding the after-sales
service business.
Ordinary income in fiscal 2018 is forecast to increase, compared with
the previous year, due to increased sales and types of orders.
FY2018
(Billions of yen)
Change
1H 2H Full Year
①
1H 2H Full Year
②②-①
Net Sales 70.5 90.7 161.3 88.0 99.0 187.0 25.7
Ordinary Income
(Loss)(0.4) 2.8 2.3 2.5 5.0 7.5 5.2
Orders 67.1 83.9 151.1 - - about 165 about14
FY2017 FY2018

20
【Engineering】
Orders in fiscal 2018 are forecast to be similar to fiscal 2017 as a
certain amount of orders is anticipated in the waste treatment sector
and other factors.
Ordinary income is forecast to decrease, compared with the previous
year, owing to changes in the types of orders.
FY2018
(Billions of yen)
Change
1H 2H Full Year
①
1H 2H Full Year
②②-①
Net Sales 48.0 74.8 122.8 56.0 91.0 147.0 24.2
Ordinary Income
(Loss)1.7 5.1 6.9 (0.5) 5.0 4.5 (2.4)
Orders 55.9 63.3 119.2 - - about 120 about 1
FY2017 FY2018

21
【Construction Machinery】 (Billions of yen)
Unit sales of hydraulic excavators in fiscal 2018 are forecast to be
higher than fiscal 2017 as demand is anticipated to remain firm mainly
in China.
However, ordinary income in fiscal 2018 is forecast to decrease
compared with fiscal 2017 owing to the rise in raw material prices and
other factors.
FY2018
Change
1H 2H Full Year
①
1H 2H Full Year
②②-①
Net Sales 182.7 181.8 364.5 190.0 195.0 385.0 20.5
Ordinary Income 11.4 10.5 21.9 12.5 8.5 21.0 (0.9)
FY2017 FY2018

22
【Electric Power】
Ordinary income in fiscal 2018 is forecast to decrease compared with
fiscal 2017 because of the posting of a one-time expense for the
financing of new projects.
Kobe Steel strives to continue stable operation at the Kobe Power Plant
and promote a new project.
FY2018
(Billions of yen)
Change
1H 2H Full Year
①
1H 2H Full Year
②②-①
Net Sales 32.9 39.1 72.1 36.0 37.0 73.0 0.9
Ordinary Income
(Loss)3.3 4.5 7.9 (5.0) 3.0 (2.0) (9.9)
FY2017 FY2018
23
3. Financial Strategy

Financial Strategy
24 24
Consider and implement cash generation measures on a scale of 100.0 billion yen to steadily implement growth investments, while maintaining financial discipline.
Cash generation measures already implemented
from FY2016 to FY2017
Improve working capital 19 billion yen Asset sales 18 billion yen, etc.
Total: about 37 billion yen
Cash generation measures
In principle, business cash flows are used to finance large strategic investments to grow the materials and machinery businesses, as well as for regular investments that support the business foundation.
D/E ratio 1 time or less
Basic policy
《Free cash flow》 《Debt ・ D/E ratio》
※1 ※1
(times)
: Project Finance
: Debt
: D/E Ratio
*1
(103.8) (131.9)(160.7)
(70.0)
85.8 126.7
191.8
60.0
(18.0) (5.2)31.1
(10.0)
△ 210
△ 160
△ 110
△ 60
△ 10
40
90
140
190
FY2015 FY2016 FY2017 FY2018
: Cash flows from operating activities
: Cash flows from investing activities
: Free cash flow
776.0 789.6 726.0 675.0
13.4 7.2 12.9 65.0
1.101.17
0.98
0.40
0.60
0.80
1.00
1.20
1.40
1.60
400.0
600.0
800.0
1000.0
FY2015 FY2016 FY2017 FY2018
(Billions of yen)
(Billions of yen)
D/E Ratio excluding advance
borrowing of 117.6 billion yen
1.00 time
D/E Ratio excluding advance
borrowing of 90 billion yen
0.97 times
(Forecast)
Around
0.9 times
(Forecast) (Forecast)

25
4.Reference Information
26
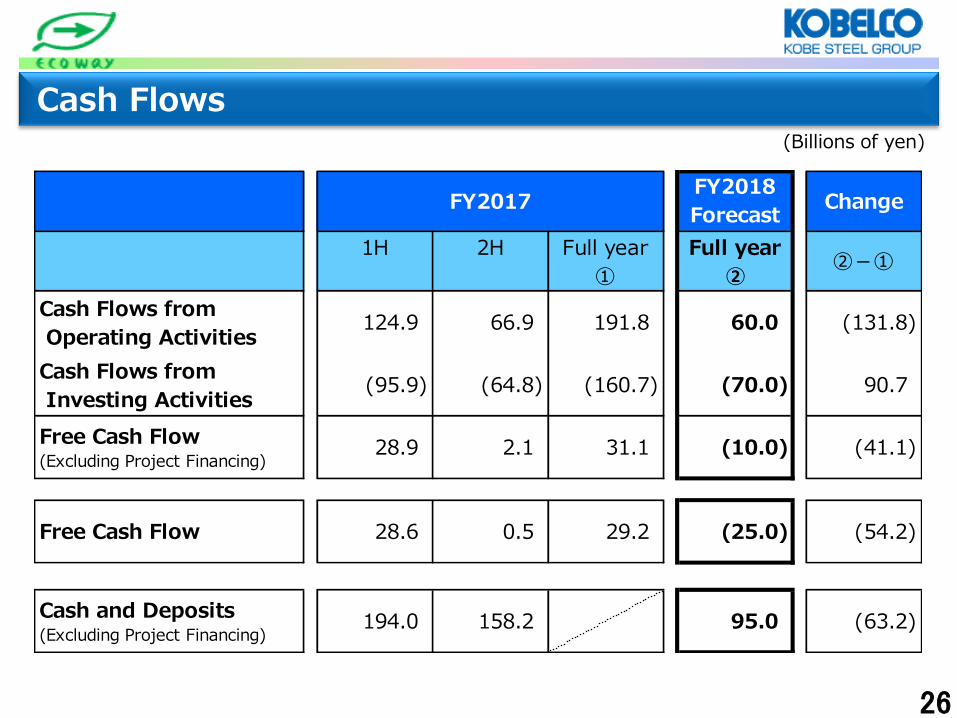
Cash Flows (Billions of yen)
*2 Change
1H 2H Full year
①
Full year
②②-①
Cash Flows from
Operating Activities124.9 66.9 191.8 60.0 (131.8)
Cash Flows from
Investing Activities(95.9) (64.8) (160.7) (70.0) 90.7
Free Cash Flow(Excluding Project Financing)
28.9 2.1 31.1 (10.0) (41.1)
Free Cash Flow 28.6 0.5 29.2 (25.0) (54.2)
Cash and Deposits(Excluding Project Financing)
194.0 158.2 95.0 (63.2)
FY2017FY2018
Forecast
27
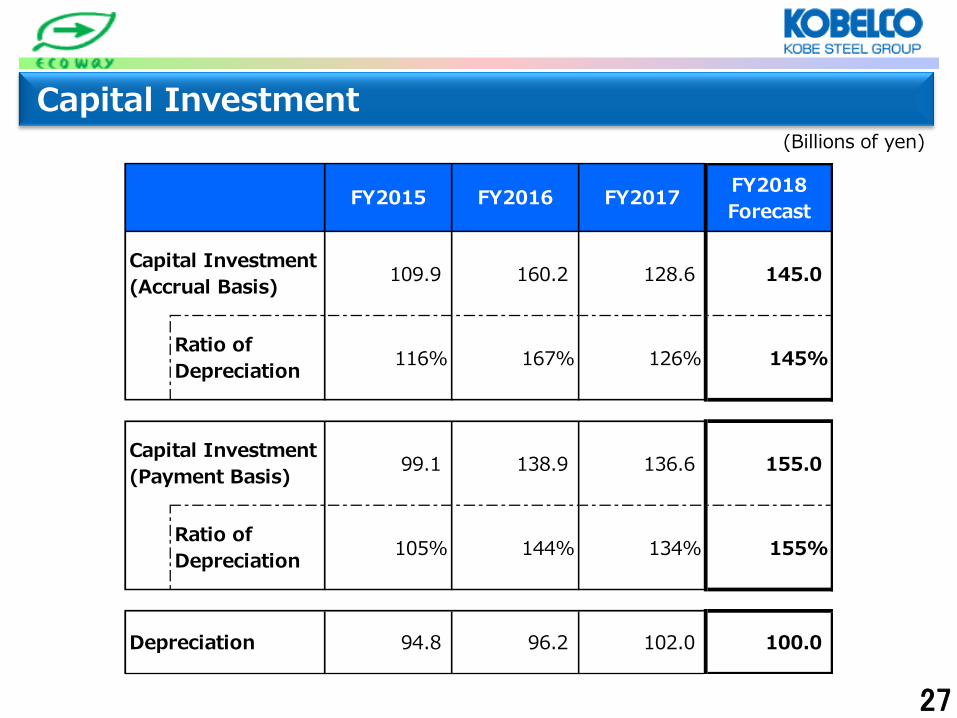
Capital Investment (Billions of yen)
FY2015 FY2016 FY2017FY2018
Forecast
109.9 160.2 128.6 145.0
Ratio of
Depreciation116% 167% 126% 145%
99.1 138.9 136.6 155.0
Ratio of
Depreciation105% 144% 134% 155%
94.8 96.2 102.0 100.0
Capital Investment
(Accrual Basis)
Capital Investment
(Payment Basis)
Depreciation

28
Financial Indices
FY2015 FY2016 FY2017FY2018
Forecast
1.6% (1.1%) 3.8% 1.8%
(59.34 yen) (63.54 yen) 174.43 yen 124.22 yen
(※4) 1.10 (※5)1.17 about 0.98 about 0.9
1.3% (0.8%) 3.1% 1.5%
(2.9%) (3.4%) 8.9% 5.9%
※1:ROS=Ordinary Income / Net Sales
※2:Kobe Steel carried out a share consolidation at a ratio of 10 shares to 1 share effective on October 1, 2016.
Therefore, net income per share takes into account this share consolidation.
D/E ratio 0.97 times (excluding early procurement of borrowings)
※5:Includes early procurement of borrowings for FY2017 (117.6 billion yen)
D/E ratio 1.00 time (excluding early procurement of borrowings)
※6:ROA=Ordinary Income / Total Assets
※7:ROE=Net Income / Equity
※3:D/E ratio: Debt (excluding IPP project finance)/stockholders' equity (FY2015 shareholders' equity)
※4:Includes early procurement of borrowings for FY2016 (90 billion yen)
D/E ratio(※3)
ROS (※1)
Net Income (loss) per share
(※2)
ROE (※7)
ROA (※6)
29
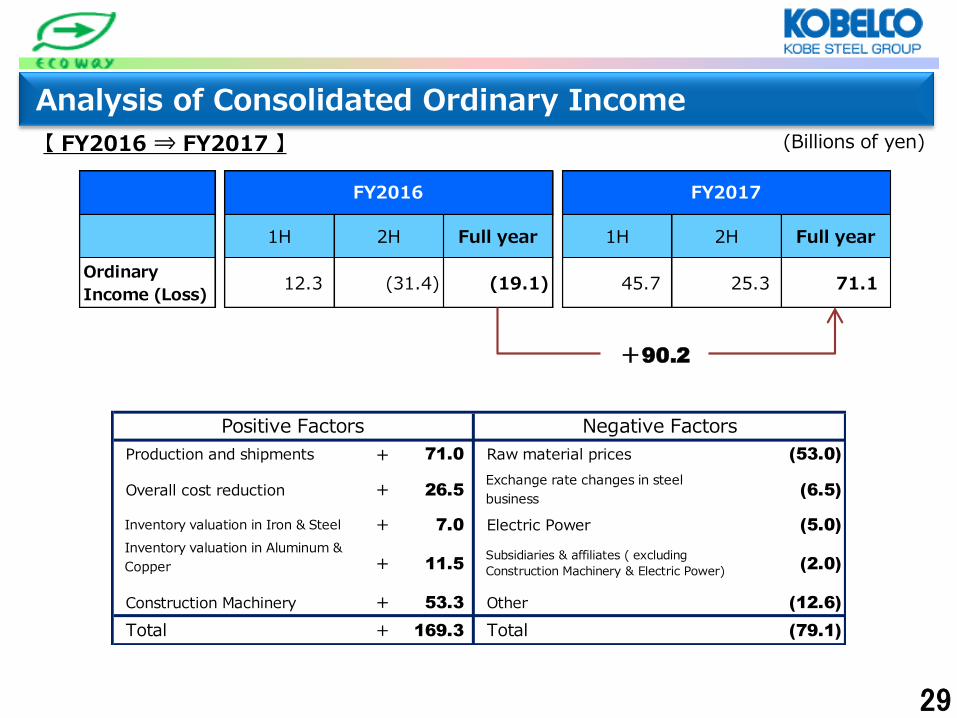
(Billions of yen)
Analysis of Consolidated Ordinary Income
【 FY2016 ⇒ FY2017 】
1H 2H Full year 1H 2H Full year
Ordinary
Income (Loss)12.3 (31.4) (19.1) 45.7 25.3 71.1
FY2016 FY2017
+90.2
Production and shipments + 71.0 Raw material prices (53.0)
Overall cost reduction + 26.5
Exchange rate changes in steel
business(6.5)
Inventory valuation in Iron & Steel + 7.0 Electric Power (5.0)
Inventory valuation in Aluminum &
Copper + 11.5 Subsidiaries & affiliates ( excluding
Construction Machinery & Electric Power) (2.0)
Construction Machinery + 53.3 Other (12.6)
Total + 169.3 Total (79.1)
Positive Factors Negative Factors
30
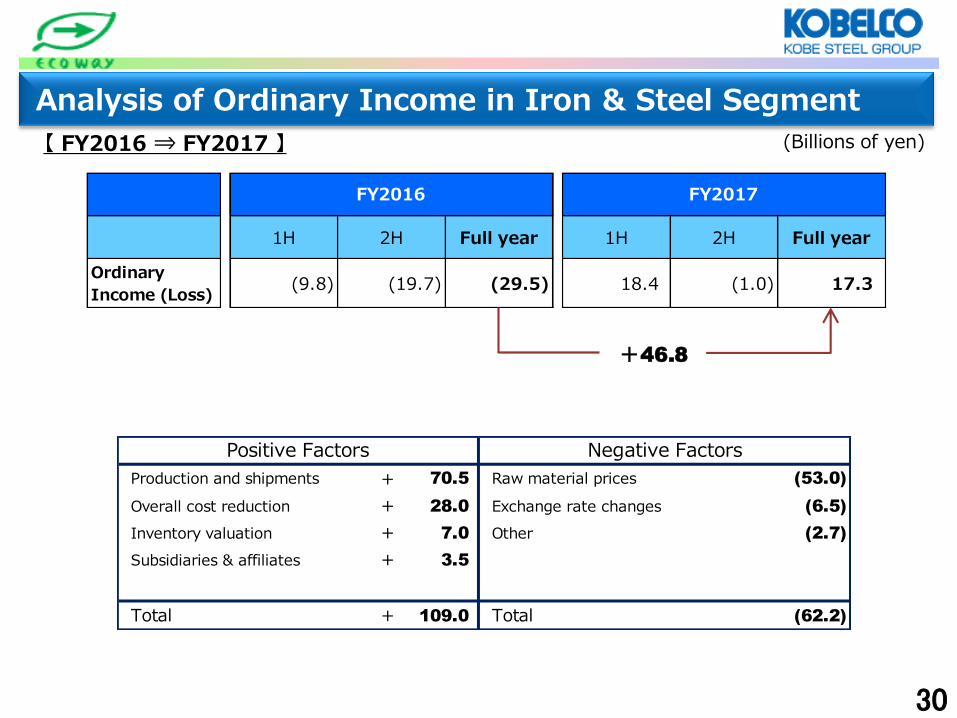
Analysis of Ordinary Income in Iron & Steel Segment
(Billions of yen) 【 FY2016 ⇒ FY2017 】
1H 2H Full year 1H 2H Full year
Ordinary
Income (Loss)(9.8) (19.7) (29.5) 18.4 (1.0) 17.3
FY2016 FY2017
+46.8
Production and shipments + 70.5 Raw material prices (53.0)
Overall cost reduction + 28.0 Exchange rate changes (6.5)
Inventory valuation + 7.0 Other (2.7)
Subsidiaries & affiliates + 3.5
Total + 109.0 Total (62.2)
Positive Factors Negative Factors
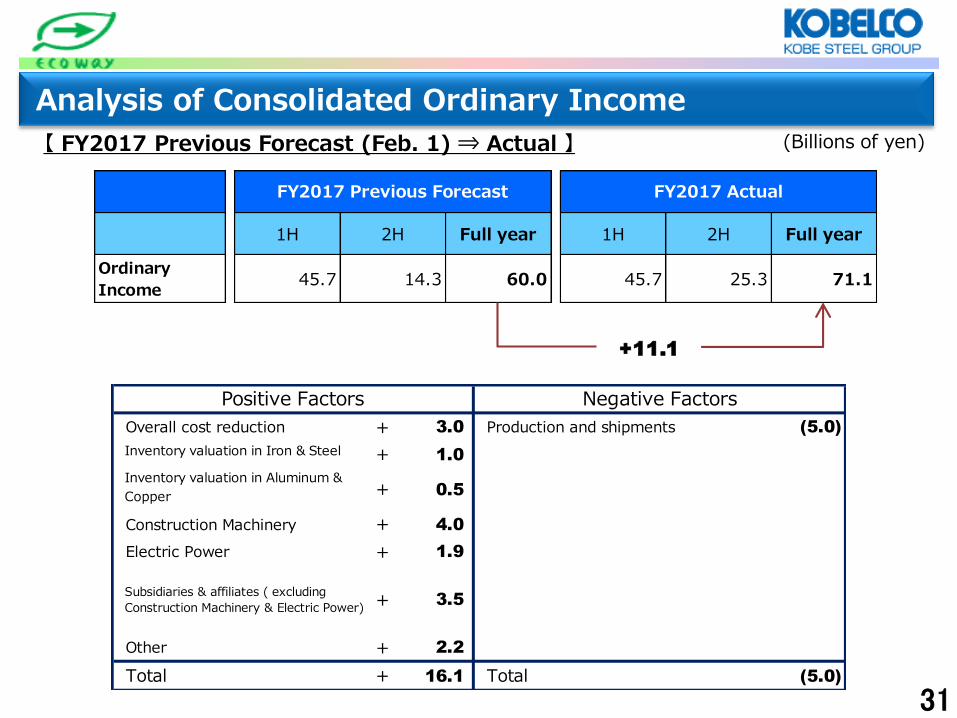
31
(Billions of yen)
Analysis of Consolidated Ordinary Income
【 FY2017 Previous Forecast (Feb. 1) ⇒ Actual 】
Overall cost reduction + 3.0 Production and shipments (5.0)
Inventory valuation in Iron & Steel + 1.0
Inventory valuation in Aluminum &
Copper + 0.5
Construction Machinery + 4.0
Electric Power + 1.9
Subsidiaries & affiliates ( excluding
Construction Machinery & Electric Power) + 3.5
Other + 2.2
Total + 16.1 Total (5.0)
Positive Factors Negative Factors
1H 2H Full year 1H 2H Full year
Ordinary
Income45.7 14.3 60.0 45.7 25.3 71.1
FY2017 Previous Forecast FY2017 Actual
+11.1

32
Analysis of Ordinary Income in Iron & Steel Segment
(Billions of yen) 【 FY2017 Previous Forecast (Feb. 1) ⇒ Actual 】
Raw material prices ± 0.0 Production and shipments (5.0)
Overall cost reduction + 1.5
Inventory valuation + 1.0
Subsidiaries & affiliates + 1.0
Exchange rate changes ± 0.0
Other + 3.8
Total + 7.3 Total (5.0)
Positive Factors Negative Factors
1H 2H Full year 1H 2H Full year
Ordinary
Income (Loss)18.4 (3.4) 15.0 18.4 (1.0) 17.3
FY2017 Previous Forecast FY2017 Actual
+2.3
33
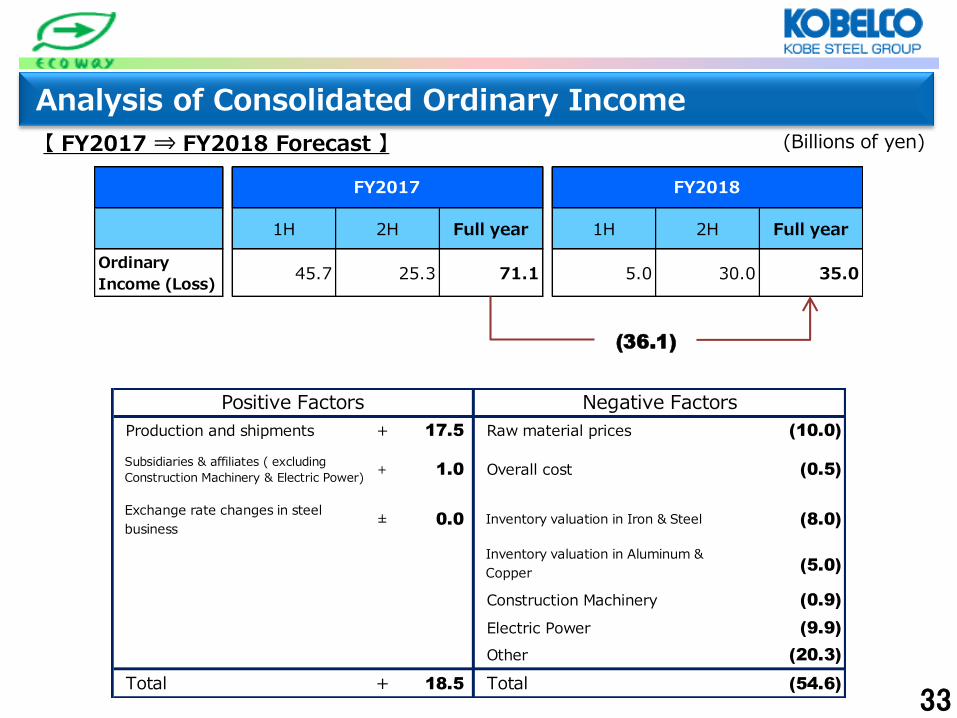
(Billions of yen)
Analysis of Consolidated Ordinary Income
【 FY2017 ⇒ FY2018 Forecast 】
1H 2H Full year 1H 2H Full year
Ordinary
Income (Loss)45.7 25.3 71.1 5.0 30.0 35.0
FY2017 FY2018
(36.1)
Production and shipments + 17.5 Raw material prices (10.0)
Subsidiaries & affiliates ( excluding
Construction Machinery & Electric Power)+ 1.0 Overall cost (0.5)
Exchange rate changes in steel
business± 0.0 Inventory valuation in Iron & Steel (8.0)
Inventory valuation in Aluminum &
Copper(5.0)
Construction Machinery (0.9)
Electric Power (9.9)
Other (20.3)
Total + 18.5 Total (54.6)
Negative FactorsPositive Factors

34
Analysis of Ordinary Income in Iron & Steel Segment
(Billions of yen) 【 FY2017 ⇒ FY2018 Forecast 】
1H 2H Full year 1H 2H Full year
Ordinary
Income (Loss)18.4 (1.0) 17.3 3.0 10.0 13.0
FY2017 FY2018
(4.3)
Production and shipments + 15.5 Raw material prices (10.0)
Overall cost reduction + 6.0 Inventory valuation (8.0)
Exchange rate changes ± 0.0 Subsidiaries & affiliates (0.5)
Other (7.3)
Total + 21.5 Total (25.8)
Positive Factors Negative Factors

35
Thorough implementation of measures to prevent the recurrence of misconduct concerning some of the products
II. Management: Ensuring quality
control
Overview of measures to prevent recurrence
The Kobe Steel Group would again like to express its sincerest apologies to its customers, business partners, shareholders and other stakeholders for having caused substantial trouble due to the misconduct of Kobe Steel and its group. To fulfill our responsibility regarding the quality issue and once again earn your confidence, we will go back to the basics of monozukuri. We will renew our awareness that solid quality is at the heart of confidence and strive to prevent recurrence with an unwavering resolution.
I. Governance: Building a quality
governance system
*See the next page for details.
III. Process: Strengthening
the quality control process
The administrative offices at head- quarters play a leading role in implementing the measures
Independent Quality
Supervision Committee
Regular progress reports to
the Board of Directors
36
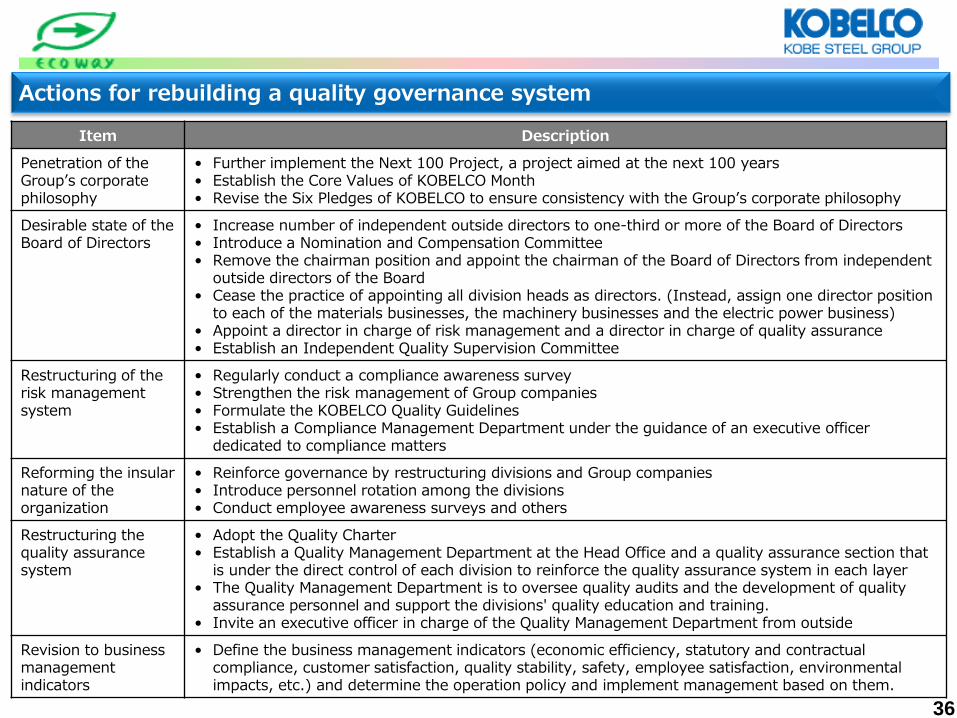
Actions for rebuilding a quality governance system
Item Description
Penetration of the Group’s corporate philosophy
• Further implement the Next 100 Project, a project aimed at the next 100 years • Establish the Core Values of KOBELCO Month • Revise the Six Pledges of KOBELCO to ensure consistency with the Group’s corporate philosophy
Desirable state of the Board of Directors
• Increase number of independent outside directors to one-third or more of the Board of Directors • Introduce a Nomination and Compensation Committee • Remove the chairman position and appoint the chairman of the Board of Directors from independent
outside directors of the Board • Cease the practice of appointing all division heads as directors. (Instead, assign one director position
to each of the materials businesses, the machinery businesses and the electric power business) • Appoint a director in charge of risk management and a director in charge of quality assurance • Establish an Independent Quality Supervision Committee
Restructuring of the risk management system
• Regularly conduct a compliance awareness survey • Strengthen the risk management of Group companies • Formulate the KOBELCO Quality Guidelines • Establish a Compliance Management Department under the guidance of an executive officer
dedicated to compliance matters
Reforming the insular nature of the organization
• Reinforce governance by restructuring divisions and Group companies • Introduce personnel rotation among the divisions • Conduct employee awareness surveys and others
Restructuring the quality assurance system
• Adopt the Quality Charter • Establish a Quality Management Department at the Head Office and a quality assurance section that
is under the direct control of each division to reinforce the quality assurance system in each layer • The Quality Management Department is to oversee quality audits and the development of quality
assurance personnel and support the divisions' quality education and training. • Invite an executive officer in charge of the Quality Management Department from outside
Revision to business management indicators
• Define the business management indicators (economic efficiency, statutory and contractual compliance, customer satisfaction, quality stability, safety, employee satisfaction, environmental impacts, etc.) and determine the operation policy and implement management based on them.
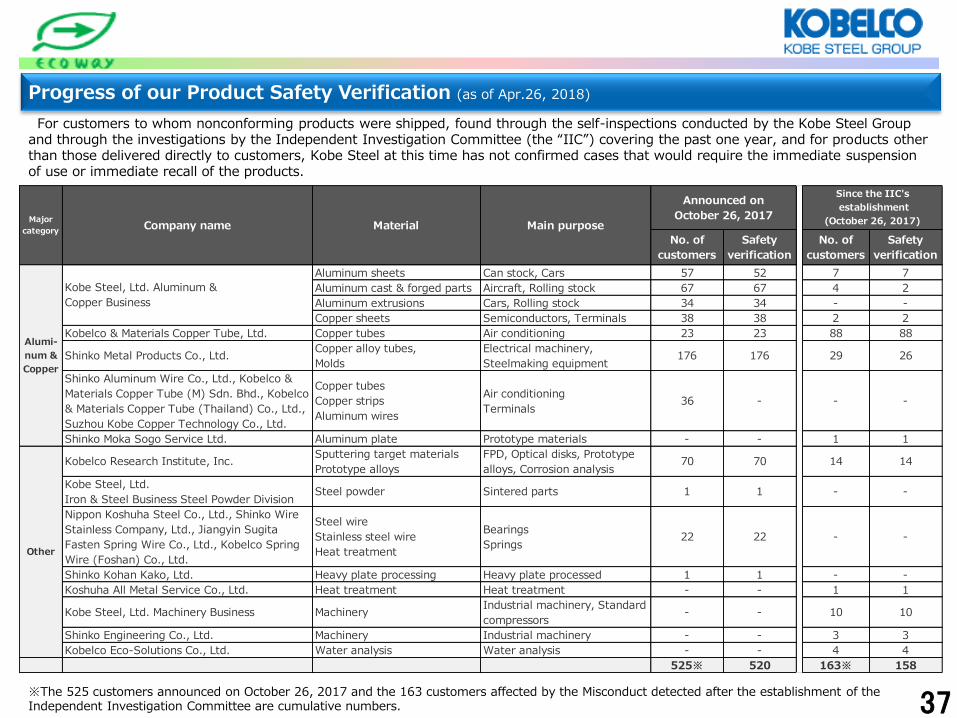
Progress of our Product Safety Verification (as of Apr.26, 2018)
37
For customers to whom nonconforming products were shipped, found through the self-inspections conducted by the Kobe Steel Group and through the investigations by the Independent Investigation Committee (the “IIC”) covering the past one year, and for products other than those delivered directly to customers, Kobe Steel at this time has not confirmed cases that would require the immediate suspension of use or immediate recall of the products.
※The 525 customers announced on October 26, 2017 and the 163 customers affected by the Misconduct detected after the establishment of the Independent Investigation Committee are cumulative numbers.
No. of
customers
Safety
verification
No. of
customers
Safety
verification
Aluminum sheets Can stock, Cars 57 52 7 7
Aluminum cast & forged parts Aircraft, Rolling stock 67 67 4 2
Aluminum extrusions Cars, Rolling stock 34 34 - -
Copper sheets Semiconductors, Terminals 38 38 2 2
Kobelco & Materials Copper Tube, Ltd. Copper tubes Air conditioning 23 23 88 88
Shinko Metal Products Co., Ltd.Copper alloy tubes,
Molds
Electrical machinery,
Steelmaking equipment176 176 29 26
Shinko Aluminum Wire Co., Ltd., Kobelco &
Materials Copper Tube (M) Sdn. Bhd., Kobelco
& Materials Copper Tube (Thailand) Co., Ltd.,
Suzhou Kobe Copper Technology Co., Ltd.
Copper tubes
Copper strips
Aluminum wires
Air conditioning
Terminals36 - - -
Shinko Moka Sogo Service Ltd. Aluminum plate Prototype materials - - 1 1
Kobelco Research Institute, Inc.Sputtering target materials
Prototype alloys
FPD, Optical disks, Prototype
alloys, Corrosion analysis70 70 14 14
Kobe Steel, Ltd.
Iron & Steel Business Steel Powder DivisionSteel powder Sintered parts 1 1 - -
Nippon Koshuha Steel Co., Ltd., Shinko Wire
Stainless Company, Ltd., Jiangyin Sugita
Fasten Spring Wire Co., Ltd., Kobelco Spring
Wire (Foshan) Co., Ltd.
Steel wire
Stainless steel wire
Heat treatment
Bearings
Springs22 22 - -
Shinko Kohan Kako, Ltd. Heavy plate processing Heavy plate processed 1 1 - -
Koshuha All Metal Service Co., Ltd. Heat treatment Heat treatment - - 1 1
Kobe Steel, Ltd. Machinery Business MachineryIndustrial machinery, Standard
compressors- - 10 10
Shinko Engineering Co., Ltd. Machinery Industrial machinery - - 3 3
Kobelco Eco-Solutions Co., Ltd. Water analysis Water analysis - - 4 4
525※ 520 163※ 158
Since the IIC's
establishment
(October 26, 2017)
Alumi-
num &
Copper
Kobe Steel, Ltd. Aluminum &
Copper Business
Other
Major
categoryCompany name Material Main purpose
Announced on
October 26, 2017
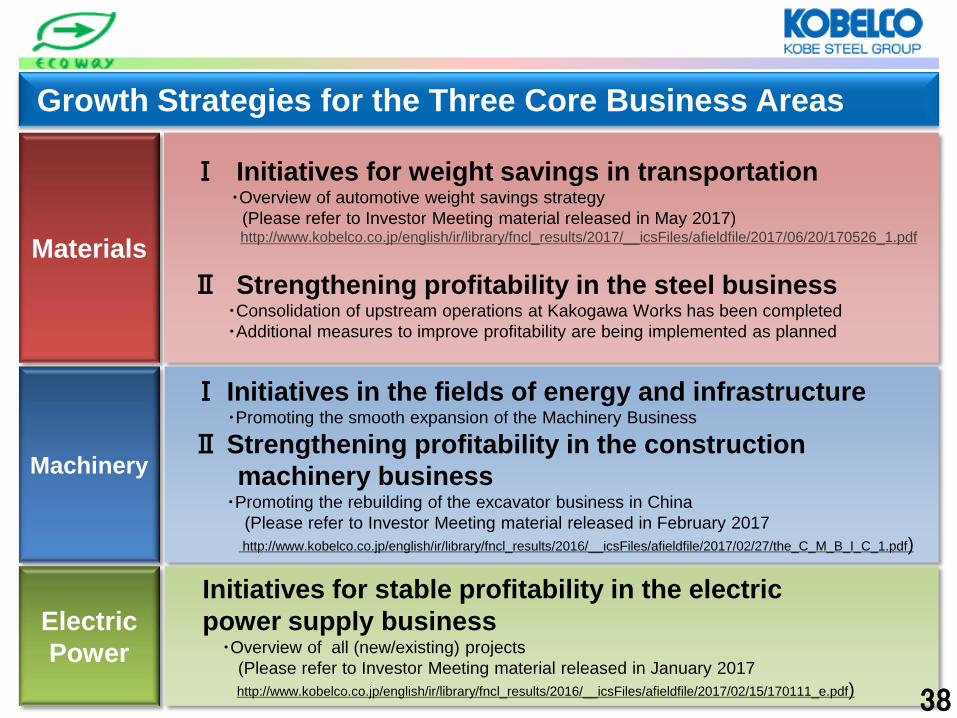
Growth Strategies for the Three Core Business Areas
Machinery
Materials
Electric
Power
Ⅰ Initiatives for weight savings in transportation
・Overview of automotive weight savings strategy
(Please refer to Investor Meeting material released in May 2017) http://www.kobelco.co.jp/english/ir/library/fncl_results/2017/__icsFiles/afieldfile/2017/06/20/170526_1.pdf
Ⅱ Strengthening profitability in the steel business ・Consolidation of upstream operations at Kakogawa Works has been completed
・Additional measures to improve profitability are being implemented as planned
Ⅰ Initiatives in the fields of energy and infrastructure ・Promoting the smooth expansion of the Machinery Business
Ⅱ Strengthening profitability in the construction
machinery business ・Promoting the rebuilding of the excavator business in China
(Please refer to Investor Meeting material released in February 2017
http://www.kobelco.co.jp/english/ir/library/fncl_results/2016/__icsFiles/afieldfile/2017/02/27/the_C_M_B_I_C_1.pdf)
Initiatives for stable profitability in the electric
power supply business ・Overview of all (new/existing) projects
(Please refer to Investor Meeting material released in January 2017
http://www.kobelco.co.jp/english/ir/library/fncl_results/2016/__icsFiles/afieldfile/2017/02/15/170111_e.pdf) 38
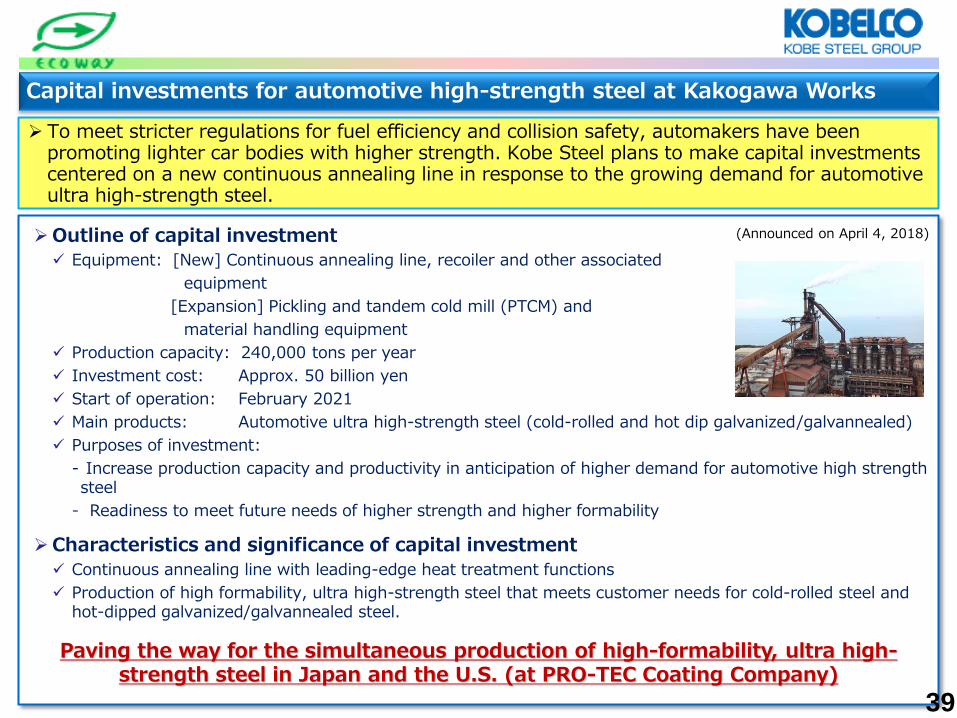
Capital investments for automotive high-strength steel at Kakogawa Works
Outline of capital investment
Equipment: [New] Continuous annealing line, recoiler and other associated
equipment
[Expansion] Pickling and tandem cold mill (PTCM) and
material handling equipment
Production capacity: 240,000 tons per year
Investment cost: Approx. 50 billion yen
Start of operation: February 2021
Main products: Automotive ultra high-strength steel (cold-rolled and hot dip galvanized/galvannealed)
Purposes of investment:
- Increase production capacity and productivity in anticipation of higher demand for automotive high strength steel
- Readiness to meet future needs of higher strength and higher formability
Characteristics and significance of capital investment
Continuous annealing line with leading-edge heat treatment functions
Production of high formability, ultra high-strength steel that meets customer needs for cold-rolled steel and hot-dipped galvanized/galvannealed steel.
To meet stricter regulations for fuel efficiency and collision safety, automakers have been promoting lighter car bodies with higher strength. Kobe Steel plans to make capital investments centered on a new continuous annealing line in response to the growing demand for automotive ultra high-strength steel.
Paving the way for the simultaneous production of high-formability, ultra high- strength steel in Japan and the U.S. (at PRO-TEC Coating Company)
(Announced on April 4, 2018)
39

Joint development of a robot system to join dissimilar metals
A robot system was developed, incorporating element arc spot welding (EASW), a dissimilar metals joining method invented by Kobe Steel to join ultra high-strength steel to aluminum, with FANUC’s robot, engineering and sensor technologies.
This robot system automatically performs a series of actions at high speed, such as the detection of joining positions with the image sensor, accurate movement, pressurization, feeding and engagement of elements, and arc welding.
Kobe Steel and FANUC Corporation jointly develop a robot system to join dissimilar metals, amid the trend toward multi-material applications, in which the optimum materials are combined for the most appropriate use. They plan to propose the new robot system to automakers while working toward commercialization.
(Announced on April 19, 2018)
40
Prototype of a robot system with the highest joining strength compared with existing methods
Advantages of the EASW method
High joining strength
Joining ultra high-strength steel sheet not only to aluminum, but also to another ultra high-strength steel sheet
Applicable to any type of aluminum
One-side access is possible
Exterior view of the prototype
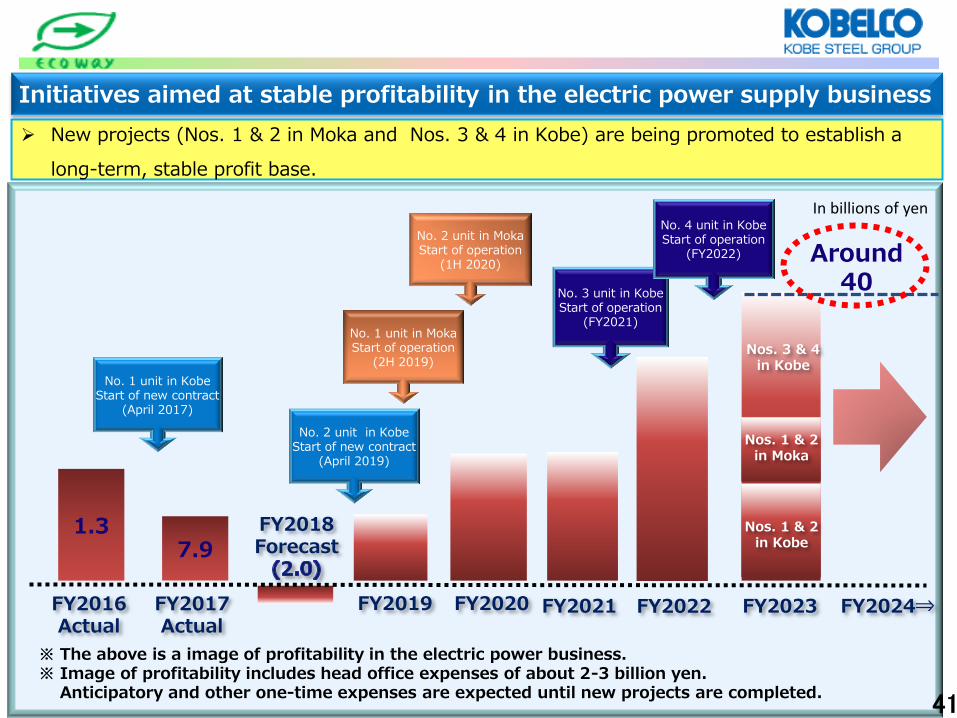
Initiatives aimed at stable profitability in the electric power supply business
FY2016 Actual
1.3
FY2023 FY2022 FY2021 FY2020 FY2019
FY2018 Forecast
FY2017 Actual
FY2024⇒
※ The above is a image of profitability in the electric power business. ※ Image of profitability includes head office expenses of about 2-3 billion yen. Anticipatory and other one-time expenses are expected until new projects are completed.
Around 40
In billions of yen
7.9
New projects (Nos. 1 & 2 in Moka and Nos. 3 & 4 in Kobe) are being promoted to establish a
long-term, stable profit base.
41
Nos. 3 & 4 in Kobe
Nos. 1 & 2 in Kobe
Nos. 1 & 2 in Moka
No. 1 unit in Kobe Start of new contract
(April 2017)
No. 2 unit in Kobe Start of new contract
(April 2019)
No. 1 unit in Moka Start of operation
(2H 2019)
No. 3 unit in Kobe Start of operation
(FY2021)
No. 4 unit in Kobe Start of operation
(FY2022)
No. 2 unit in Moka Start of operation
(1H 2020)
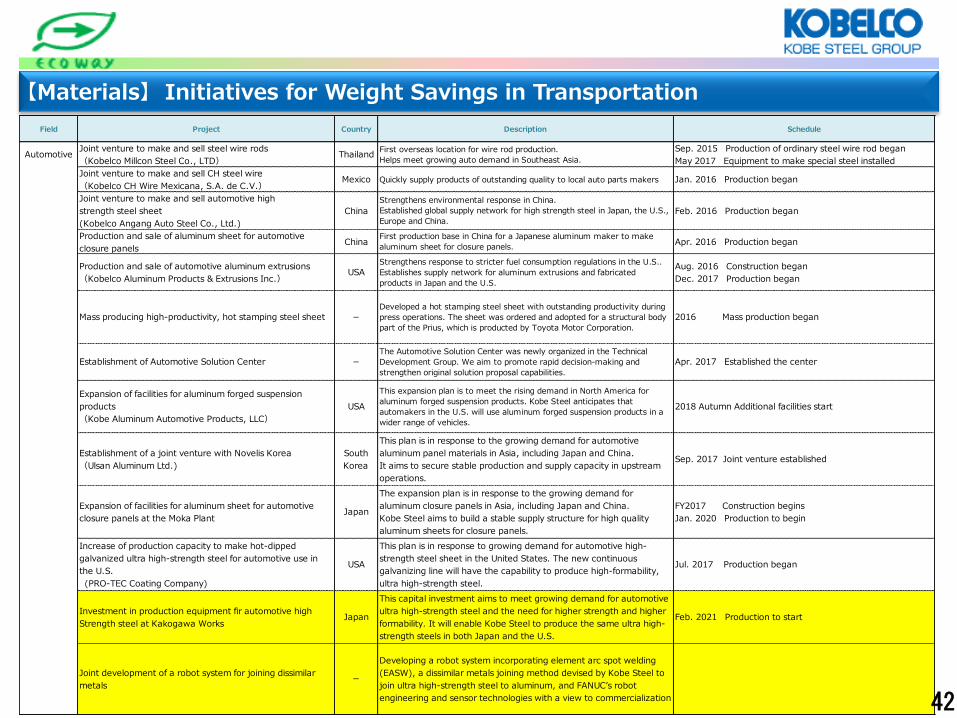
【Materials】 Initiatives for Weight Savings in Transportation
Field Project Country Description Schedule
AutomotiveJoint venture to make and sell steel wire rods
(Kobelco Millcon Steel Co., LTD)Thailand
First overseas location for wire rod production.
Helps meet growing auto demand in Southeast Asia.
Sep. 2015 Production of ordinary steel wire rod began
May 2017 Equipment to make special steel installed
Joint venture to make and sell CH steel wire
(Kobelco CH Wire Mexicana, S.A. de C.V.)Mexico Quickly supply products of outstanding quality to local auto parts makers Jan. 2016 Production began
Joint venture to make and sell automotive high
strength steel sheet
(Kobelco Angang Auto Steel Co., Ltd.)
China
Strengthens environmental response in China.
Established global supply network for high strength steel in Japan, the U.S.,
Europe and China.
Feb. 2016 Production began
Production and sale of aluminum sheet for automotive
closure panelsChina
First production base in China for a Japanese aluminum maker to make
aluminum sheet for closure panels.Apr. 2016 Production began
Production and sale of automotive aluminum extrusions
(Kobelco Aluminum Products & Extrusions Inc.)USA
Strengthens response to stricter fuel consumption regulations in the U.S..
Establishes supply network for aluminum extrusions and fabricated
products in Japan and the U.S.
Aug. 2016 Construction began
Dec. 2017 Production began
Mass producing high-productivity, hot stamping steel sheet -Developed a hot stamping steel sheet with outstanding productivity during
press operations. The sheet was ordered and adopted for a structural body
part of the Prius, which is producted by Toyota Motor Corporation.
2016 Mass production began
Establishment of Automotive Solution Center -The Automotive Solution Center was newly organized in the Technical
Development Group. We aim to promote rapid decision-making and
strengthen original solution proposal capabilities.
Apr. 2017 Established the center
Expansion of facilities for aluminum forged suspension
products
(Kobe Aluminum Automotive Products, LLC)
USA
This expansion plan is to meet the rising demand in North America for
aluminum forged suspension products. Kobe Steel anticipates that
automakers in the U.S. will use aluminum forged suspension products in a
wider range of vehicles.
2018 Autumn Additional facilities start
Establishment of a joint venture with Novelis Korea
(Ulsan Aluminum Ltd.)
South
Korea
This plan is in response to the growing demand for automotive
aluminum panel materials in Asia, including Japan and China.
It aims to secure stable production and supply capacity in upstream
operations.
Sep. 2017 Joint venture established
Expansion of facilities for aluminum sheet for automotive
closure panels at the Moka PlantJapan
The expansion plan is in response to the growing demand for
aluminum closure panels in Asia, including Japan and China.
Kobe Steel aims to build a stable supply structure for high quality
aluminum sheets for closure panels.
FY2017 Construction begins
Jan. 2020 Production to begin
Increase of production capacity to make hot-dipped
galvanized ultra high-strength steel for automotive use in
the U.S.
(PRO-TEC Coating Company)
USA
This plan is in response to growing demand for automotive high-
strength steel sheet in the United States. The new continuous
galvanizing line will have the capability to produce high-formability,
ultra high-strength steel.
Jul. 2017 Production began
Investment in production equipment fir automotive high
Strength steel at Kakogawa WorksJapan
This capital investment aims to meet growing demand for automotive
ultra high-strength steel and the need for higher strength and higher
formability. It will enable Kobe Steel to produce the same ultra high-
strength steels in both Japan and the U.S.
Feb. 2021 Production to start
Joint development of a robot system for joining dissimilar
metalsー
Developing a robot system incorporating element arc spot welding
(EASW), a dissimilar metals joining method devised by Kobe Steel to
join ultra high-strength steel to aluminum, and FANUC’s robot
engineering and sensor technologies with a view to commercialization 42
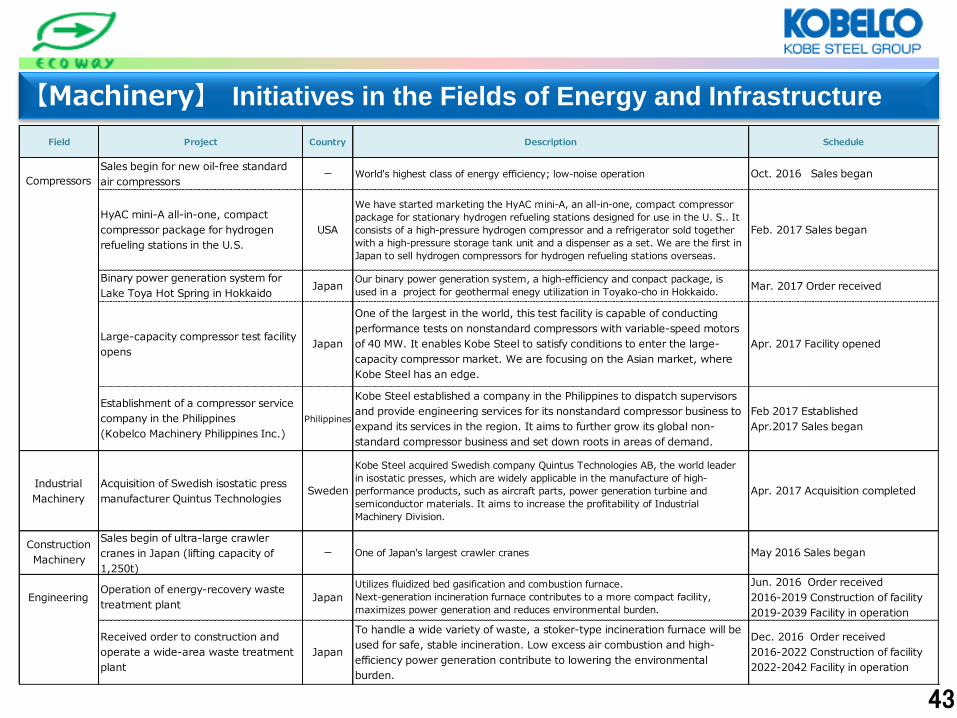
【Machinery】 Initiatives in the Fields of Energy and Infrastructure
43
Field Project Country Description Schedule
Sales begin for new oil-free standard
air compressorsー World's highest class of energy efficiency; low-noise operation Oct. 2016 Sales began
HyAC mini-A all-in-one, compact
compressor package for hydrogen
refueling stations in the U.S.
USA
We have started marketing the HyAC mini-A, an all-in-one, compact compressor
package for stationary hydrogen refueling stations designed for use in the U. S.. It
consists of a high-pressure hydrogen compressor and a refrigerator sold together
with a high-pressure storage tank unit and a dispenser as a set. We are the first in
Japan to sell hydrogen compressors for hydrogen refueling stations overseas.
Feb. 2017 Sales began
Binary power generation system for
Lake Toya Hot Spring in HokkaidoJapan
Our binary power generation system, a high-efficiency and conpact package, is
used in a project for geothermal enegy utilization in Toyako-cho in Hokkaido.Mar. 2017 Order received
Large-capacity compressor test facility
opensJapan
One of the largest in the world, this test facility is capable of conducting
performance tests on nonstandard compressors with variable-speed motors
of 40 MW. It enables Kobe Steel to satisfy conditions to enter the large-
capacity compressor market. We are focusing on the Asian market, where
Kobe Steel has an edge.
Apr. 2017 Facility opened
Establishment of a compressor service
company in the Philippines
(Kobelco Machinery Philippines Inc.)
Philippines
Kobe Steel established a company in the Philippines to dispatch supervisors
and provide engineering services for its nonstandard compressor business to
expand its services in the region. It aims to further grow its global non-
standard compressor business and set down roots in areas of demand.
Feb 2017 Established
Apr.2017 Sales began
Industrial
Machinery
Acquisition of Swedish isostatic press
manufacturer Quintus TechnologiesSweden
Kobe Steel acquired Swedish company Quintus Technologies AB, the world leader
in isostatic presses, which are widely applicable in the manufacture of high-
performance products, such as aircraft parts, power generation turbine and
semiconductor materials. It aims to increase the profitability of Industrial
Machinery Division.
Apr. 2017 Acquisition completed
Sales begin of ultra-large crawler
cranes in Japan (lifting capacity of
1,250t)
ー One of Japan's largest crawler cranes May 2016 Sales began
Operation of energy-recovery waste
treatment plantJapan
Utilizes fluidized bed gasification and combustion furnace.
Next-generation incineration furnace contributes to a more compact facility,
maximizes power generation and reduces environmental burden.
Jun. 2016 Order received
2016-2019 Construction of facility
2019-2039 Facility in operation
Received order to construction and
operate a wide-area waste treatment
plant
Japan
To handle a wide variety of waste, a stoker-type incineration furnace will be
used for safe, stable incineration. Low excess air combustion and high-
efficiency power generation contribute to lowering the environmental
burden.
Dec. 2016 Order received
2016-2022 Construction of facility
2022-2042 Facility in operation
Compressors
Construction
Machinery
Engineering

44
【Electric Power】 Initiatives for Stable Profitability
in the Electric Power Supply Business
Field Project Country Description Schedule
Electric
Power
Nos. 1 & 2 units in Kobe
(Kobelco Power Kobe, Inc.)Japan
Pulverized coal-fired, supercritical pressure
power generation equipment, started from
2002. New contracts were formed to replace
current contracts as they expire.
Capacity: 1.4 mil. kW (700,000 kW × 2)
Apr. 2002 No. 1 unit starts up
Apr. 2004 No. 2 unit starts up
[Start of new contracts]
No.1 unit: from Apr. 2017
No.2 unit: from Apr. 2019
Nos. 1 & 2 units in Moka
(Kobelco Power Moka, Inc.)Japan
Japan's first full-scale inland power plant. Will
have one of Japan's highest levels of generation
efficiency. Method is gas turbine combined
cycle, using city gas as fuel.
Capacity: 1.248 mil. kW (624,000 kW X2)
Jun. 2016 Construction began
2H 2019 No. 1 Unit starts up
1H 2020 No. 2 Unit starts up
Nos. 3 & 4 units in Kobe
(provisional name: Kobe Works Thermal
Power Plant)
Japan
To feature cutting-edge coal-fired, ultra-
supercritical generation equipment
Capacity: 1.3 mil. kW (650,000 kW x 2)
FY2021 No. 3 unit to start up
FY2022 No. 4 unit to start up

45
Core Values of KOBELCO 1. We provide technologies, products and services that win the trust
and confidence of our customers we serve and the society in which we live.
2. We value each employee and support his and her growth on an individual basis, while creating a cooperative and harmonious environment.
3. Through continuous and innovative changes, we create new values for the society of which we are a member.
Six Pledges of KOBELCO Men and Women 1. Heightened Sense of Ethics and Professionalism 2. Contribution to the Society by Providing Superior Products and Services
Quality Charter
Guided by our "Quality Charter," we provide safe, sound, and innovative products and services to our customers, and thereby ensure customer satisfaction and contribute to the advancement of the society.
3. Establishing a Comfortable but Challenging Work Environment 4. Living in Harmony with Local Community 5. Contribution to a Sustainable Environment 6. Respect for Each Stakeholder
46
Cautionary Statement • Certain statements in this presentation contain forward-looking
statements concerning forecasts, assertions, prospects, intentions and strategies. The decisions and assumptions leading to these statements were based on information currently available to Kobe Steel. Due to possible changes in decisions and assumptions, future business operation, and internal and external conditions, actual results may differ materially from the projected forward-looking statements. Kobe Steel is not obligated to revise the forward-looking contents of this presentation.
• Uncertain and variable factors include, but are not limited to: – Changes in economic outlook, demand and market conditions – Political situation and trade and other regulations – Changes in currency exchange rates – Availability and market conditions of raw materials – Products and services of competing companies, pricing policy,
alliances, and business development including M&As – Strategy changes of alliance partners