financial results for q4 and full year 2020
TRANSCRIPT

Financial Results for Q4 and Full Year 2020
January 28, 2021

This presentation contains forward-looking statements regarding Teradyne’s future business prospects, the impact of the COVID-19 pandemic, results of operations, market
conditions, earnings per share, the payment of a quarterly dividend, the repurchase of Teradyne common stock pursuant to a share repurchase program, and the impact of U.S.
and Chinese export and tariff laws. Such statements are based on the current assumptions and expectations of Teradyne’s management and are neither promises nor
guarantees of future performance, events, earnings per share, use of cash, payment of dividends, repurchases of common stock, payment of the senior convertible notes, the
impact of the COVID-19 pandemic, or the impact of U.S. and Chinese export and tariff laws. There can be no assurance that management’s estimates of Teradyne’s future results
or other forward-looking statements will be achieved. Additionally, the current dividend and share repurchase programs may be modified, suspended or discontinued at any
time.
On May 16, 2019, Huawei and 68 of its affiliates, including HiSilicon, were added to the U.S. Department of Commerce Entity List under U.S. Export Administration Regulations
(the “EAR”). This action by the U.S. Department of Commerce imposed new export licensing requirements on exports, re-exports, and in-country transfers of all U.S. - regulated
products, software and technology to the designated Huawei entities. While most of Teradyne’s products are not subject to the EAR and therefore not affected by the Entity List
restrictions, some of its products are currently manufactured in the U.S. and thus subject to the Entity List restrictions.
On August 17, 2020, the U.S. Department of Commerce published final regulations expanding the scope of the U.S. EAR to include additional products that would become
subject to export restrictions relating to Huawei entities including HiSilicon. These new regulations restrict the sale to Huawei and the designated Huawei entities of certain non-
U.S. made items, such as semiconductor devices, manufactured for or sold to Huawei entities including HiSilicon under specific, detailed conditions set forth in the new
regulations. These new regulations have impacted our sales to to Huawei, HiSilicon and their suppliers. Teradyne is taking appropriate actions, including filing for licenses with
the U.S. Department of Commerce and working with the U.S. regulators to clarify the scope of the restrictions. However, Teradyne cannot be certain that the actions it takes will
mitigate the risks associated with the new export controls that impact its business. It is uncertain the extent these new regulations and any other additional regulations that may
be implemented by the U.S. Department of Commerce or other government agency may have on Teradyne’s business and financial results.
On April 28, 2020, the U.S. Department of Commerce published new export control regulations for certain U.S. products and technology sold to military end users or for military
end-use in China, Russia and Venezuela. The definition of military end user is broad. The regulations went into effect on June 29, 2020. In December 2020, the U.S. Department
of Commerce issued a list of companies in China and other countries that it considered to be military end users. Teradyne does not expect that compliance with the new export
controls will significantly impact its ability to sell products to its customers in China or to manufacture products in China. The new export controls, however, could disrupt the
Company’s supply chain, increase compliance costs and impact the demand for the Company’s products in China and, thus, have a material adverse impact on Teradyne’s
business, financial condition or results of operations. In addition, while the Company maintains an export compliance program, its compliance controls could be circumvented,
exposing the Company to legal liabilities. Teradyne will continue to assess the potential impact of the new export controls on its business and operations and take appropriate
actions, including filing for licenses with the U.S. Department of Commerce, to minimize any disruption. However, Teradyne cannot be certain that the actions it takes will
mitigate all the risks associated with the new export controls that may impact its business.
In response to the regulations issued by the U.S. Department of Commerce, the Chinese government has passed new laws that may impact Teradyne’s business activities in
China. The Company is assessing the potential impact of these new Chinese laws and monitoring relevant laws and regulations issued by the Chinese government.
2
SAFE HARBOR (page 1 of 2)
The global pandemic of the novel strain of the coronavirus (COVID-19) has resulted in authorities implementing numerous measures to try to contain the virus, such as travel
bans and restrictions, quarantines, shelter in place orders, and shutdowns. These measures have impacted and may further impact Teradyne’s workforce and operations, the
operations of its customers, and those of its contract manufacturers and suppliers. The COVID-19 pandemic has adversely impacted the Company’s results of operations,
including increased costs company-wide and decreased sales in its industrial automation businesses. The Company cannot accurately estimate the amount of the impact on
Teradyne’s 2020 financial results and to its future financial results. There is considerable uncertainty regarding the impact on Teradyne’s business from the measures in place
and potential future measures, and restrictions on Teradyne’s access to its manufacturing facilities or on its support operations or workforce, or similar limitations for its
contractor manufacturers and suppliers, and restrictions or disruptions of transportation, such as reduced availability of transportation and increased border controls or closures,
could limit Teradyne’s capacity to meet customer demand and have a material adverse effect on its financial condition and results of operations. The COVID-19 outbreak has
significantly increased economic and demand uncertainty in Teradyne’s markets. This uncertainty has resulted in a significant decrease in demand for certain Teradyne products
and could continue to impact demand for an uncertain period of time. The spread of COVID-19 has caused Teradyne to modify its business practices (including employee travel,
employees working remotely, and cancellation of physical participation in meetings, events and conferences), and the Company may take further actions as may be required by
government authorities or that it determines are in the best interests of its employees, customers, contract manufacturers and suppliers. There is uncertainty that such
measures will be sufficient to mitigate the risks posed by the virus, and Teradyne’s ability to perform critical functions could be impacted. The degree to which COVID-19 impacts
Teradyne’s results will depend on future developments, which are highly uncertain and cannot be predicted, including, but not limited to, the duration and continued spread of
the virus, its severity, the actions to contain the virus or the availability and impact of vaccines, and how quickly and to what extent normal economic and operating conditions
can resume.
Important factors that could cause actual results, earnings per share, use of cash, dividend payments, repurchases of common stock, or payment of the senior convertible notes
to differ materially from those presently expected include: conditions affecting the markets in which Teradyne operates; decreased or delayed product demand from one or
more significant customers; development, delivery and acceptance of new products; the ability to grow the Industrial Automation business; increased research and development
spending; deterioration of Teradyne’s financial condition; the continued impact of the COVID-19 pandemic and related government responses on the market and demand for
Teradyne’s products, on its contract manufacturers and supply chain, and on its workforce; the consummation and success of any mergers or acquisitions; unexpected cash
needs; insufficient cash flow to make required payments and pay the principal amount on the senior convertible notes; the business judgment of the board of directors that a
declaration of a dividend or the repurchase of common stock is not in the company’s best interests; additional U.S. tax regulations or IRS guidance; the impact of any tariffs or
export controls imposed in the U.S. or China; compliance with trade protection measures or export restrictions; the impact of U.S. Department of Commerce or other
government agency regulations relating to Huawei and HiSilicon; and other events, factors and risks disclosed in filings with the SEC, including, but not limited to, the “Risk
Factors” sections of Teradyne’s Annual Report on Form 10-K for the fiscal year ended December 31, 2019 and Quarterly Report on Form 10-Q for the fiscal quarter ended
September 27, 2020. The forward-looking statements provided by Teradyne in this presentation represent management’s views as of the date of this presentation. Teradyne
anticipates that subsequent events and developments may cause management’s views to change. However, while Teradyne may elect to update these forward-looking
statements at some point in the future, Teradyne specifically disclaims any obligation to do so. These forward-looking statements should not be relied upon as representing
Teradyne’s views as of any date subsequent to the date of this presentation.
3
SAFE HARBOR (page 2 of 2)

Business Update and Outlook
4
Mark Jagiela, Teradyne President and CEO

Q4’20 and 2020 Summary
5
(1) See appendix for GAAP to Non-GAAP reconciliation(2) Q1’21 Revenue is Mid-Guidance(3) CAGR reflects 2016-2020
• Q4’20 sales up 16% and non-GAAP EPS up 25% from Q4’19
• Q4’20 Semiconductor test strength in mobility
• IA up 4% vs Q4’19 and 34% from Q3’20
• Q4’20 Universal Robots sales up 6% from Q4’19, 41% from Q3’20
Q4’20 Semiconductor Test and Industrial Automation Segment Revenue Grew Quarter on Quarter and Year on Year2020 Sales of $3,121M, Non-GAAP EPS of $4.62
• Sales up 36% from 2019
• Full year 2020 Non-GAAP EPS of $4.62 up 62% from 2019
• Four year sales CAGR of 16%
• Four year Non-GAAP EPS CAGR of 32%
Quarterly Sales by Year Full Year Sales/Non-GAAP EPS(1)
$0
$200
$400
$600
$800
$1,000
Q1 Q2 Q3 Q4
2018 2019 2020 2021E(2)
$1.8B
$2.1B $2.1B$2.3B
$3.1B
$1.51
$2.34 $2.37$2.86
$4.62
$-
$1.00
$2.00
$3.00
$4.00
$5.00
$0.0B
$0.5B
$1.0B
$1.5B
$2.0B
$2.5B
$3.0B
$3.5B
2016 2017 2018 2019 2020
Sales EPS

$0
$500
$1,000
$1,500
$2,000
$2,500
$3,000
$3,500
$4,000
'14/'15 Avg 2016 2017 2018 2019 2020E 2021E
SOC Memory
$3,550
$900
2021 Market Sizes
SOC
Memory
8% CAGR
11% CAGR
Semiconductor Test Markets are Growing
6
1) SOC data includes product and service; market data from SEMI WWSEMS report and internal estimates2) 2021 represents midpoint of guided range, CAGR’s based on midpoint of 2021 range
-
8
%
(1)
(1)
Semiconductor Test
SOC market powered by unit growth, complexity,
new technology adoption
Memory test driven by bit growth, diversity,
higher bandwidth
(1)(2)
(2)
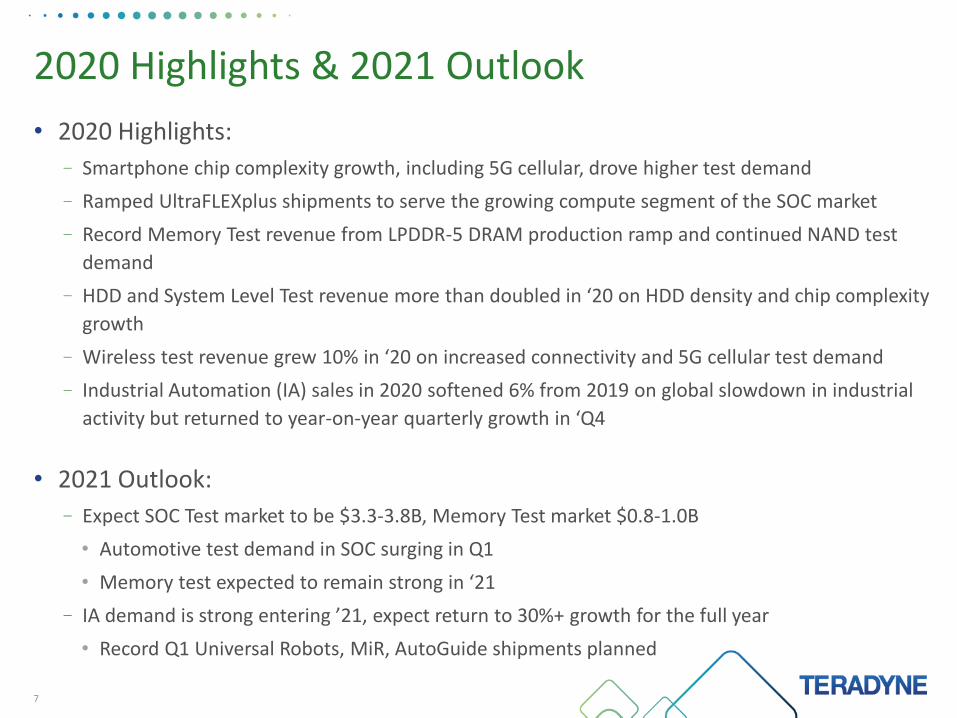
• 2020 Highlights:
– Smartphone chip complexity growth, including 5G cellular, drove higher test demand
– Ramped UltraFLEXplus shipments to serve the growing compute segment of the SOC market
– Record Memory Test revenue from LPDDR-5 DRAM production ramp and continued NAND test
demand
–HDD and System Level Test revenue more than doubled in ‘20 on HDD density and chip complexity
growth
–Wireless test revenue grew 10% in ‘20 on increased connectivity and 5G cellular test demand
– Industrial Automation (IA) sales in 2020 softened 6% from 2019 on global slowdown in industrial
activity but returned to year-on-year quarterly growth in ‘Q4
• 2021 Outlook:
– Expect SOC Test market to be $3.3-3.8B, Memory Test market $0.8-1.0B
• Automotive test demand in SOC surging in Q1
• Memory test expected to remain strong in ‘21
– IA demand is strong entering ’21, expect return to 30%+ growth for the full year
• Record Q1 Universal Robots, MiR, AutoGuide shipments planned
7
2020 Highlights & 2021 Outlook

Fourth Quarter and Full Year 2020 Financial Results and First Quarter 2021 Guidance
8
Sanjay Mehta, Teradyne Vice President and Chief Financial Officer

Q4’20 Non-GAAP Results
9 (1) See attached appendix for GAAP to non-GAAP reconciliations
$s in millions, except EPS Q4’19 Actual(1) Q3’20 Actual(1) Q4’20 Actual(1)
Sales $655M $819M $759M
Gross Margin 58.5% $383M 56.0% $459M 59.3% $450M
R&D 13.3% $87M 11.6% $95M 13.2% $100M
SG&A 17.9% $117M 14.1% $116M 16.3% $124M
OPEX 31.2% $204M 25.7% $211M 29.5% $224M
Operating Profit 27.4% $179M 30.3% $248M 29.7% $226M
Income Taxes (& effective tax rate)
17.0% $30M 17.4% $43M 14.5% $33M
EPS $0.88 $1.18 $1.10
Diluted Shares 175M 175M 177M

Sales growth of 10% in 2020 vs 2019 on strong
Connectivity and early 5G demand
WiFi 6, UWB, and other connectivity standards along with 5G expected to drive demand in 2021
Q4’20 and 2020 Segment Summary
10
UR sales down 12%, MiR sales up 1% in 2020
vs 2019
IA sales troughed in Q2’20 and returned to
y/y growth in Q4’20
Sales up 43% in 2020 vs 2019
Storage Test grew 110% in 2020 vs 2019 on
higher capacity HDDs and increased System
Level Test demand
Mobility and Compute related test demand
strong. Analog demand grew through year end
Record memory test shipments driven by
success in LPDDR5 DRAM test market
$104M $40M4th
Q
uar
ter
Sale
s2
02
0 K
ey H
igh
ligh
ts
$92M$524M
Semiconductor Test
Industrial Automation
System Test Wireless Test
Semi Product
$438M
Semi Service
$86M
SemiTest Sales
4th
Qu
arte
r Sa
les
Det
ail
Total Company Service: $111M(1) Pie chart has been corrected to show proper geographic distribution
24%
38%
33%
5%
Industrial Automation Revenue
Asia
Europe
North America
Rest of World
Q1’21 Non-GAAP Guidance
11 (1) See attached appendix for GAAP to non-GAAP reconciliations.
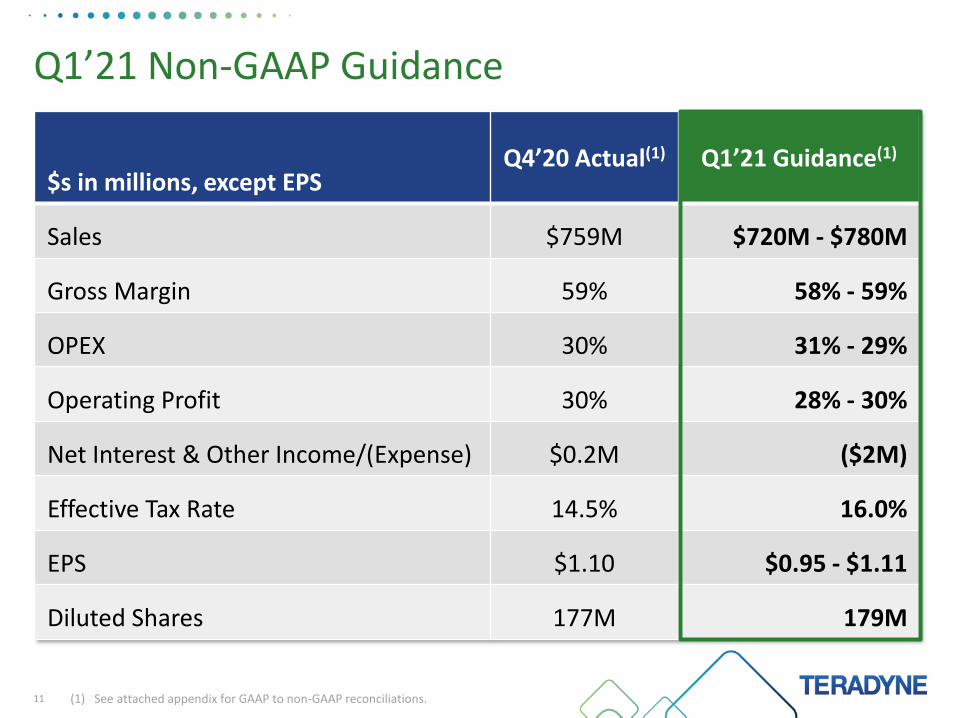
$s in millions, except EPSQ4’20 Actual(1) Q1’21 Guidance(1)
Sales $759M $720M - $780M
Gross Margin 59% 58% - 59%
OPEX 30% 31% - 29%
Operating Profit 30% 28% - 30%
Net Interest & Other Income/(Expense) $0.2M ($2M)
Effective Tax Rate 14.5% 16.0%
EPS $1.10 $0.95 - $1.11
Diluted Shares 177M 179M

Teradyne OPEX History and Outlook
12
(1) See attached appendix for GAAP to non-GAAP reconciliations.(2) Commencing from date of acquisitions. Energid February 26th, 2018 onwards, MiR April 25th, 2018 onwards, AutoGuide November 13th, 2019 onwards
OPEX increasing 8%-10% in 2021 to further drive mid-term earnings growth
2017 2018 2019 2020 2021E
Industrial Automation(2) $62M $114M $149M $157M
Test $507M $502M $523M $553M
Variable Comp $87M $76M $86M $129M ~flat
Total OPEX $656M $692M $758M $839M
Annual Non-GAAP OPEX(1)
Teradyne Non-GAAP Earnings Model
13
Financial Model
’19/’20 Sales Mix
2024 Sales MixIndustrial
Automation
Automated
Test
2024E Model Assumptions
(1) See attached appendix for GAAP to non-GAAP reconciliations(2) 2024E sales mix is at mid-point of model range
=$2,708M
=$3,875M(2)
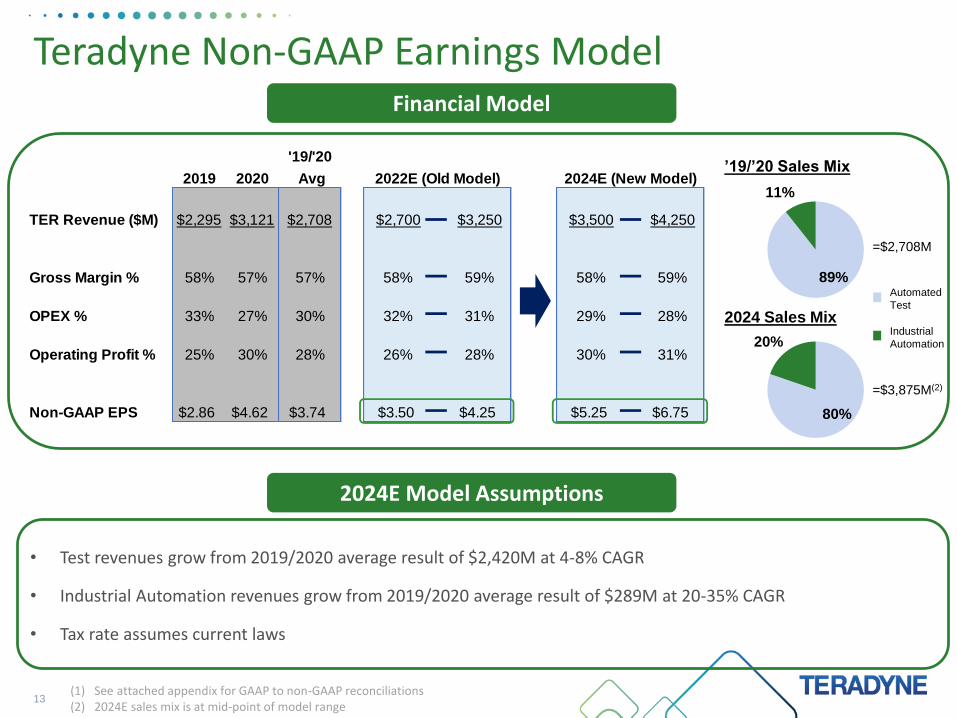
• Test revenues grow from 2019/2020 average result of $2,420M at 4-8% CAGR
• Industrial Automation revenues grow from 2019/2020 average result of $289M at 20-35% CAGR
• Tax rate assumes current laws
80%
20%
89%
11%
'19/'20
2019 2020 Avg
TER Revenue ($M) $2,295 $3,121 $2,708 $2,700 $3,250 $3,500 $4,250
Gross Margin % 58% 57% 57% 58% 59% 58% 59%
OPEX % 33% 27% 30% 32% 31% 29% 28%
Operating Profit % 25% 30% 28% 26% 28% 30% 31%
Non-GAAP EPS $2.86 $4.62 $3.74 $3.50 $4.25 $5.25 $6.75
2024E (New Model)2022E (Old Model)

• Q4 Sales up 16% and non-GAAP EPS up 25% from Q4’19
• 2020 sales of $3.1B, up 36%; Non-GAAP EPS of $4.62, up 62% on strength in all test
segments
• Generated $684 million in free cash in 2020
• Expect 2021 SOC Test market to be $3.3-3.8B, Memory Test market $0.8-1.0B
• Semiconductor Test demand trends favorable entering ‘21
• Industrial Automation demand improved significantly in Q4’20 and is expected to
continue in ‘21, driving 30%+ segment growth
• Increased mid-term earnings model targets; project growth in both test and IA leading to
$5.25-6.75 in non-GAAP EPS in 2024
• $2B share repurchase program announced with minimum of $600 million in repurchases
planned in 2021
14
January 2021 Summary

Supplemental Information
15

Annual Non-GAAP Results
(1) See attached appendix for GAAP to non-GAAP reconciliations.16
$s in millions, except EPS 2019(1) 2020(1)
Sales $2,295M $3,121M
Gross Margin 58% $1,340M 57% $1,786M
R&D 14% $323M 12% $375M
SG&A 19% $435M 15% $464M
OPEX 33% $758M 27% $839M
Operating Profit 25% $582M 30% $948M
Income Taxes (& effective tax rate)17.0% $98M 15.25% $144M
EPS $2.86 $4.62
Diluted Shares 175M 175M

Balance Sheet & Capital Return
17
(1) Includes MiR and AutoGuide(2) Includes depreciation, stock based compensation, amortization of acquired intangible assets and amortization of the non-cash convertible debt discount(3) Teradyne calculates free cash flow as: GAAP Cash flow from operations, excluding discontinued operations, less property, plant and equipment additions; see GAAP to
non–GAAP reconciliations.
Q4’19Actual
Q3’20Actual
Q4’20Actual
Cash and Marketable Securities $1,016M $1,341M $1,554M
Inventory $197M $191M $222M
DSO 51 Days 65 Days 62 Days
Acquisition Earn-out Accruals(1) $40M $23M $7M
Capital Additions $39M $63M $38M
Depreciation and Amortization(2) $41M $42M $44M
Free Cash Flow(3) $178M $280M $222M
Capital Return$131M $0M $0M
$15M $17M $17M
Buybacks
Dividends
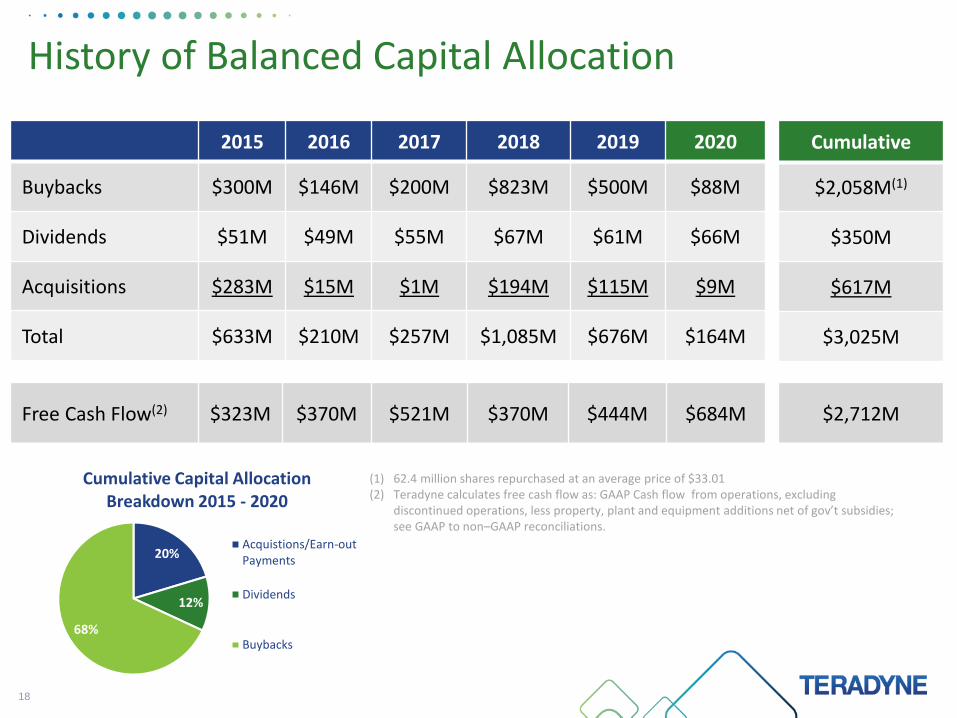
History of Balanced Capital Allocation
18
2015 2016 2017 2018 2019 2020
Buybacks $300M $146M $200M $823M $500M $88M
Dividends $51M $49M $55M $67M $61M $66M
Acquisitions $283M $15M $1M $194M $115M $9M
Total $633M $210M $257M $1,085M $676M $164M
Cumulative
$2,058M(1)
$350M
$617M
$3,025M
Free Cash Flow(2) $323M $370M $521M $370M $444M $684M $2,712M
(1) 62.4 million shares repurchased at an average price of $33.01(2) Teradyne calculates free cash flow as: GAAP Cash flow from operations, excluding
discontinued operations, less property, plant and equipment additions net of gov’t subsidies; see GAAP to non–GAAP reconciliations.
20%
12%
68%
Cumulative Capital Allocation Breakdown 2015 - 2020
Acquistions/Earn-outPayments
Dividends
Buybacks

In addition to disclosing results that are determined in accordance with GAAP, Teradyne also discloses in this presentation and on the earnings call non-GAAP results of operations that exclude certain income items and charges. These results are provided as a complement to results provided in accordance with GAAP. These non-GAAP performance measures are used to make operational decisions, to determine employee compensation, to forecast future operational results, and for comparison with the Company’s business plan, historical operating results and the operating results of the Company’s competitors. Management believes each of these non-GAAP performance measures provides useful supplemental information for investors, allowing greater transparency to the information used by management in its operational decision making and in the review of the Company’s financial and operational performance, as well as facilitating meaningful comparisons of the Company’s results in the current period compared with those in prior and future periods. A reconciliation of each available GAAP to non-GAAP financial measure discussed in this presentation is contained in the following slides and on the Teradyne website at www.teradyne.com by clicking on "Investors" and then selecting the "GAAP to Non-GAAP Reconciliation" link. The non-GAAP performance measures discussed in this presentation may not be comparable to similarly titled measures used by other companies. The presentation of non-GAAP measures is not meant to be considered in isolation, as a substitute for, or superior to, financial measures or information provided in accordance with GAAP.
19
Appendix | GAAP to Non-GAAP Reconciliation

20
Appendix | GAAP to Non-GAAP Reconciliation
GAAP to Non-GAAP Earnings Reconciliation
(In millions, except per share amounts)
Quarter EndedDecember 31,
2020
% of Net
Revenues
September 27,
2020
% of Net
Revenues
December 31,
2019
% of Net
Revenues
Net revenues 759.0$ 819.5$ 654.7$
Gross profit GAAP 449.8$ 59.3% 458.9$ 56.0% 383.2$ 58.5%
Inventory step-up - - 0.1 0.0% 0.1 0.0%Gross profit non-GAAP 449.8$ 59.3% 459.0$ 56.0% 383.3$ 58.5%
Income from operations - GAAP 234.1$ 30.8% 269.7$ 32.9% 171.7$ 26.2%
Restructuring and other (1) (15.1) -2.0% (27.7) -3.4% (2.1) -0.3%
Acquired intangible assets amortization 5.8 0.8% 6.2 0.8% 9.8 1.5%
Equity modification charge 0.8 0.1% - - - -
Inventory step-up - - 0.1 0.0% 0.1 0.0%
Income from operations - non-GAAP 225.6$ 29.7% 248.3$ 30.3% 179.5$ 27.4%
December 31,
2020
% of Net
Revenues Basic Diluted
September 27,
2020
% of Net
Revenues Basic Diluted
December 31,
2019
% of Net
Revenues Basic Diluted
Net income - GAAP 196.3$ 25.9% 1.18$ 1.05$ 222.7$ 27.2% 1.34$ 1.21$ 125.1$ 19.1% 0.75$ 0.69$
Restructuring and other (1) (15.1) -2.0% (0.09) (0.08) (27.7) -3.4% (0.17) (0.15) (2.1) -0.3% (0.01) (0.01)
Acquired intangible assets amortization 5.8 0.8% 0.03 0.03 6.2 0.8% 0.04 0.03 9.8 1.5% 0.06 0.05
Interest and other (2) 3.7 0.5% 0.02 0.02 3.6 0.4% 0.02 0.02 18.5 2.8% 0.11 0.10
Pension mark-to-market adjustment (2) 7.7 1.0% 0.05 0.04 2.7 0.3% 0.02 0.01 7.7 1.2% 0.05 0.04
Equity modification charge 0.8 0.1% 0.00 0.00 - - - - - - - -
Inventory step-up - - - - 0.1 0.0% 0.00 0.00 0.1 0.0% 0.00 0.00
Exclude discrete tax adjustments (3) (2.1) -0.3% (0.01) (0.01) (4.4) -0.5% (0.03) (0.02) 1.4 0.2% 0.01 0.01
Non-GAAP tax adjustments (3.9) -0.5% (0.02) (0.02) 2.2 0.3% 0.01 0.01 (7.7) -1.2% (0.05) (0.04)
Convertible share adjustment (4) - - - 0.06 - - - 0.06 - - - 0.03
Net income - non-GAAP 193.2$ 25.5% 1.16$ 1.10$ 205.4$ 25.1% 1.24$ 1.18$ 152.8$ 23.3% 0.91$ 0.88$
166.1 166.0 167.3
186.8 184.3 181.8
Exclude dilutive shares related to convertible note transaction (10.0) (9.2) (7.3)
176.8 175.2 174.5 Non-GAAP weighted average common shares - diluted
Net Income
per Common Share
Net Income
per Common Share
Net Income
per Common Share
GAAP weighted average common shares - diluted
GAAP and non-GAAP weighted average common shares - basic

21
Appendix | GAAP to Non-GAAP Reconciliation
(1) Restructuring and other consists of:
Quarter EndedDecember 31,
2020
September 27,
2020
December 31,
2019
Contingent consideration fair value adjustment (15.3)$ (27.2)$ (2.8)$
Acquisition related expenses and compensation (0.9) (1.1) 0.2
Employee severance 1.1 0.5 0.5
Contract termination settlement fee - - -
Other - 0.1 -
(15.1)$ (27.7)$ (2.1)$
(2)
(3)
(4)
For the quarters ended December 31, 2020, September 27, 2020, and December 31, 2019, Interest and other included non-cash convertible debt interest expense. For the quarters ended December 31, 2020, September 27, 2020, and
December 31, 2019, adjustments to exclude actuarial (gain) loss recognized under GAAP in accordance with Teradyne's mark-to-market pension accounting. For the quarter ended December 31, 2019, adjustment to exclude impairment charge
related to Realwear.
For the quarters ended December 31, 2020, September 27, 2020, and December 31, 2019, adjustment to exclude discrete income tax items.
For the quarters ended December 31, 2020, September 27, 2020, and December 31, 2019, the non-GAAP diluted EPS calculation adds back $1.3 million of convertible debt interest expense to non-GAAP net income, and non-GAAP weighted
average diluted common shares include 8.9 million, 7.8 million, and 5.4 million shares, respectively, from the convertible note hedge transaction.

22
Appendix | GAAP to Non-GAAP Reconciliation
Twelve Months Ended
December 31,
2020
% of Net
Revenues
December 31,
2019
% of Net
Revenues
Net Revenues 3,121.5$ 2,295.0$
Gross profit GAAP 1,785.7$ 57.2% 1,339.8$ 58.4%
Inventory step-up 0.4 0.0% 0.4 0.0%
Gross profit non-GAAP 1,786.1$ 57.2% 1,340.2$ 58.4%
Income from operations - GAAP 928.4$ 29.7% 553.7$ 24.1%
Acquired intangible assets amortization 30.8 1.0% 40.1 1.7%
Restructuring and other (1) (13.2) -0.4% (13.9) -0.6%
Inventory step-up 0.4 0.0% 0.4 0.0%
Equity modification charge (2) 0.8 0.0% 2.1 0.1%
Income from operations - non-GAAP 947.2$ 30.3% 582.4$ 25.4%
December 31,
2020
% of Net
Revenues Basic Diluted
December 31,
2019
% of Net
Revenues Basic Diluted
Net income - GAAP 784.1$ 25.1% 4.72$ 4.28$ 467.5$ 20.4% 2.74$ 2.60$
Acquired intangible assets amortization 30.8 1.0% 0.19 0.17 40.1 1.7% 0.24 0.22
Interest and other (3) 14.4 0.5% 0.09 0.08 28.7 1.3% 0.17 0.16
Pension mark-to-market adjustments (3) 10.3 0.3% 0.06 0.06 8.2 0.4% 0.05 0.05
Restructuring and other (1) (13.2) -0.4% (0.08) (0.07) (13.9) -0.6% (0.08) (0.08)
Inventory step-up 0.4 0.0% 0.00 0.00 0.4 0.0% 0.00 0.00
Equity modification charge (2) 0.8 0.0% 0.00 0.00 2.1 0.1% 0.01 0.01
Exclude discrete tax adjustments (4) (15.2) -0.5% (0.09) (0.08) (22.6) -1.0% (0.13) (0.13)
Non-GAAP tax adjustments (11.9) -0.4% (0.07) (0.07) (16.7) -0.7% (0.10) (0.09)
Convertible share adjustment (5) - - - 0.25 - - - 0.11
Net income - non-GAAP 800.5$ 25.6% 4.82$ 4.62$ 493.8$ 21.5% 2.90$ 2.86$
166.1 170.4
183.0 179.5
Exclude dilutive shares from convertible note (8.5) (4.9)
174.5 174.6
Net Income
per Common Share
Net Income
per Common Share
GAAP and non-GAAP weighted average common shares - basic
GAAP weighted average common shares - diluted
Non-GAAP weighted average common shares - diluted

23
Appendix | GAAP to Non-GAAP Reconciliation
(1) Restructuring and other consists of:
Twelve Months Ended
December 31,
2020
December 31,
2019
Contingent consideration fair value adjustment (23.3)$ (19.3)$
Contract termination settlement fee 4.0 -
Acquisition related expenses and compensation 2.5 2.5
Employee severance 2.3 2.9 Other 1.2 - -
(13.2)$ (13.9)$
(2)
(3)
(4)
(5)
For the twelve months ended December 31, 2020 and December 31, 2019, Interest and other included non-cash convertible debt interest expense. For the twelve months ended December 31, 2020
and December 31, 2019, adjustments to exclude actuarial (gain) loss recognized under GAAP in accordance with Teradyne's mark-to-market pension accounting. For the twelve months ended
December 31, 2019, adjustment to exclude impairment charge related to Realwear.
For the twelve months ended December 31, 2020 and December 31, 2019, adjustment to exclude discrete income tax items. For the twelve months ended December 31, 2019, income tax (benefit) provision includes
a $26 million tax benefit from the release of uncertain tax position reserves due to the IRS completion of its audit of Teradyne's 2015 Federal tax return and includes a $15 million tax provision related to the finalization
For the twelve months ended December 31, 2020 and December 31, 2019, the non-GAAP diluted EPS calculation adds back $5.3 million and $5.2 million, respectively, of convertible debt interest expense to non-GAAP net income and non-GAAP
weighted average diluted common shares include 7.0 million and 2.7 million shares, respectively, from the convertible note hedge transaction.
For the twelve months ended December 31, 2019, selling and administrative expenses include an equity charge for the modification of Teradyne's retired CFO's outstanding equity awards to allow continued vesting
and maintain the original term in connection with his July 17, 2019 retirement.

24
Appendix | GAAP to Non-GAAP Reconciliation
Twelve Months EndedDecember 31,
2019
% of Net
Revenues
December 31,
2018
% of Net
Revenues
Net Revenues 2,295.0$ 2,100.8$
Gross profit GAAP 1,339.8$ 58.4% 1,220.4$ 58.1%
Inventory step-up 0.4 0.0% 0.4 0.0%
Gross profit non-GAAP 1,340.2$ 58.4% 1,220.8$ 58.1%
Income from operations - GAAP 553.7$ 24.1% 473.8$ 22.6%
Acquired intangible assets amortization 40.1 1.7% 39.2 1.9%
Equity modification charge (1) 2.1 0.1% - -
Restructuring and other (2) (13.9) -0.6% 15.2 0.7%
Inventory step-up 0.4 0.0% 0.4 0.0%
Income from operations - non-GAAP 582.4$ 25.4% 528.6$ 25.2%
December 31,
2019
% of Net
Revenues Basic Diluted
December 31,
2018
% of Net
Revenues Basic Diluted
Net income - GAAP 467.5$ 20.4% 2.74$ 2.60$ 451.8$ 21.5% 2.41$ 2.35$
Acquired intangible assets amortization 40.1 1.7% 0.24 0.22 39.2 1.9% 0.21 0.20
Interest and other (3) 28.7 1.3% 0.17 0.16 13.1 0.6% 0.07 0.07
Equity modification charge (1) 2.1 0.1% 0.01 0.01 - - - -
Restructuring and other (2) (13.9) -0.6% (0.08) (0.08) 15.2 0.7% 0.08 0.08
Inventory step-up 0.4 0.0% 0.00 0.00 0.4 0.0% 0.00 0.00
Pension mark-to-market adjustment (3) 8.2 0.4% 0.05 0.05 (3.3) -0.2% (0.02) (0.02)
Exclude discrete tax adjustments (4) (22.6) -1.0% (0.13) (0.13) (59.4) -2.8% (0.32) (0.31)
Non-GAAP tax adjustments (16.7) -0.7% (0.10) (0.09) (8.4) -0.4% (0.04) (0.04)
Convertible share adjustment (5) - - - 0.11 - - - 0.04
Net income - non-GAAP (5) 493.8$ 21.5% 2.90$ 2.86$ 448.6$ 21.4% 2.39$ 2.37$
170.4 187.7
179.5 192.6
Exclude dilutive shares from convertible note (4.9) (3.2)
174.6 189.4
GAAP and non-GAAP weighted average common shares - basic
GAAP weighted average common shares - diluted
Non-GAAP weighted average common shares - diluted (5)
Net Income per common share Net Income per common share

25
Appendix | GAAP to Non-GAAP Reconciliation
Twelve Months Ended
December 31,
2017
% of Net
Revenues
December 31,
2016
% of Net
Revenues
Net Revenues 2,136.6$ 1,753.3$
Gross profit - GAAP 1,223.9$ 57.3% 959.6$ 54.7%
Pension mark-to-market adjustment (1) (2.8) -0.1% (1.0) -0.1%
Gross profit - non-GAAP 1,221.1$ 57.2% 958.6$ 54.7%
Income (loss) from operations - GAAP 530.0$ 24.8% (60.0)$ -3.4%
Acquired intangible assets amortization 30.5 1.4% 52.6 3.0%
Restructuring and other (2) 9.4 0.4% 21.9 1.2%
Pension mark-to-market adjustment (1) (6.3) -0.3% (3.2) -0.2%
Goodwill impairment (3) - - 254.9 14.5%
Acquired intangible assets impairment (3) - - 83.3 4.8%
Income from operations - non-GAAP 563.6$ 26.4% 349.5$ 19.9%
December 31,
2017
% of Net
Revenues Basic Diluted
December 31,
2016
% of Net
Revenues Basic Diluted
Net income (loss) - GAAP 257.7$ 12.1% 1.30$ 1.28$ (43.4)$ -2.5% (0.21)$ (0.21)$
Acquired intangible assets amortization 30.5 1.4% 0.15 0.15 52.6 3.0% 0.26 0.26
Interest and other (4) 12.4 0.6% 0.06 0.06 0.6 0.0% 0.00 0.00
Restructuring and other (2) 9.4 0.4% 0.05 0.05 21.9 1.2% 0.11 0.11
Pension mark-to-market adjustment (1) (6.3) -0.3% (0.03) (0.03) (3.2) -0.2% (0.02) (0.02)
Goodwill impairment (3) - - - - 254.9 14.5% 1.26 1.25
Acquired intangible assets impairment (3) - - - - 83.3 4.8% 0.41 0.41
Exclude discrete tax adjustments (5) 178.3 8.3% 0.90 0.89 (4.5) -0.3% (0.02) (0.02)
Non-GAAP tax adjustments (6) (12.8) -0.6% (0.06) (0.06) (53.3) -3.0% (0.26) (0.26)
Net income - non-GAAP 469.2$ 22.0% 2.37$ 2.34$ 308.9$ 17.6% 1.52$ 1.51$
198.1 202.6
201.6 202.6
Exclude dilutive shares from convertible note (1.3) -
Include dilutive shares - 1.8
200.3 204.4
Net Income
per Common Share
Net (Loss) Income
per Common Share
GAAP and non-GAAP weighted average common shares - basic
GAAP weighted average common shares - diluted
Non-GAAP weighted average common shares - diluted

Appendix | GAAP to Non-GAAP Reconciliation
26
Year Ended
December 31,
2016
% of Net
Revenues
December 31,
2015
% of Net
Revenues
Net Revenues 1,753.3$ 1,639.6$
Gross profit - GAAP 959.6$ 54.7% 915.6$ 55.8%
Inventory step-up - - 1.6 0.1%
Pension mark-to-market adjustments (1) (1.0) -0.1% 8.3 0.5%
Gross profit - non-GAAP 958.6$ 54.7% 925.5$ 56.4%
(Loss) income from operations - GAAP (60.0)$ -3.4% 243.0$ 14.8%
Goodwill impairment (2) 254.9 14.5% - -
Acquired intangible assets impairment (2) 83.3 4.8% - -
Acquired intangible assets amortization 52.6 3.0% 69.0 4.2%
Restructuring and other (3) 21.9 1.2% 5.1 0.3%
Pension mark-to-market adjustments (1) (3.2) -0.2% 17.7 1.1%
Inventory step-up - - 1.6 0.1%
Income from operations - non-GAAP 349.5$ 19.9% 336.4$ 20.5%
December 31,
2016
% of Net
Revenues Basic Diluted
December 31,
2015
% of Net
Revenues Basic Diluted
Net (loss) income - GAAP (43.4)$ -2.5% (0.21)$ (0.21)$ 206.5$ 12.6% 0.98$ 0.97$
Goodwill impairment (2) 254.9 14.5% 1.26 1.25 - - - - Acquired intangible assets impairment (2) 83.3 4.8% 0.41 0.41 - - - - Acquired intangible assets amortization 52.6 3.0% 0.26 0.26 69.0 4.2% 0.33 0.32
Restructuring and other (3) 21.9 1.2% 0.11 0.11 5.1 0.3% 0.02 0.02
Pension mark-to-market adjustments (1) (3.2) -0.2% (0.02) (0.02) 17.7 1.1% 0.08 0.08
Interest and other (4) 0.6 0.0% 0.00 0.00 (5.4) -0.3% (0.03) (0.03)
Inventory step-up - - - - 1.6 0.1% 0.01 0.01
Exclude discrete tax adjustments (5) (4.5) -0.3% (0.02) (0.02) (4.9) -0.3% (0.02) (0.02) Tax effect of non-GAAP adjustments (53.3) -3.0% (0.26) (0.26) (18.5) -1.1% (0.09) (0.09)
Net income - non-GAAP 308.9$ 17.6% 1.52$ 1.51$ 271.1$ 16.5% 1.28$ 1.27$
202.6 211.5
202.6 213.3
Include dilutive shares 1.8 -
204.4 213.3
Net (Loss) Income
per Common Share
Net Income
per Common Share
GAAP and non-GAAP weighted average common shares - basic
GAAP weighted average common shares - diluted
Non-GAAP weighted average common shares - diluted
27
Appendix | GAAP to Non-GAAP Reconciliation
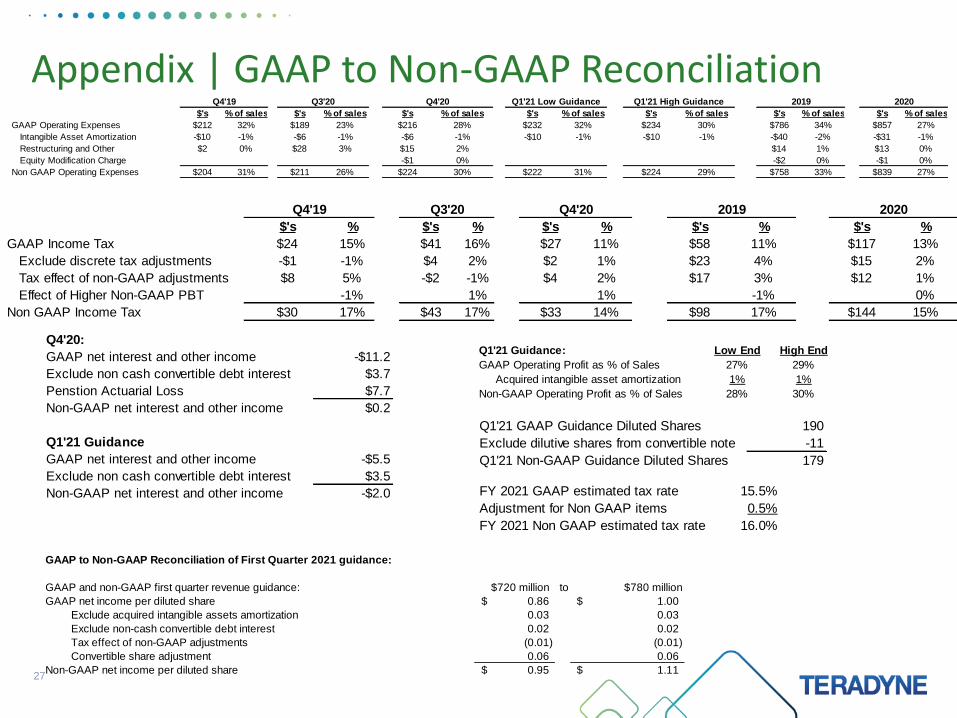
GAAP to Non-GAAP Reconciliation of First Quarter 2021 guidance:
GAAP and non-GAAP first quarter revenue guidance: $720 million to $780 million
GAAP net income per diluted share 0.86$ 1.00$
Exclude acquired intangible assets amortization 0.03 0.03
0.02 0.02
Tax effect of non-GAAP adjustments (0.01) (0.01)
Convertible share adjustment 0.06 0.06
0.95$ 1.11$ Non-GAAP net income per diluted share
Exclude non-cash convertible debt interest
$'s % $'s % $'s % $'s % $'s %
GAAP Income Tax $24 15% $41 16% $27 11% $58 11% $117 13%
Exclude discrete tax adjustments -$1 -1% $4 2% $2 1% $23 4% $15 2%
Tax effect of non-GAAP adjustments $8 5% -$2 -1% $4 2% $17 3% $12 1%
Effect of Higher Non-GAAP PBT -1% 1% 1% -1% 0%
Non GAAP Income Tax $30 17% $43 17% $33 14% $98 17% $144 15%
Q4'19 Q3'20 Q4'20 2019 2020
Q1'21 Guidance: Low End High End
GAAP Operating Profit as % of Sales 27% 29%
Acquired intangible asset amortization 1% 1%
Non-GAAP Operating Profit as % of Sales 28% 30%
Q4'20:
GAAP net interest and other income -$11.2
Exclude non cash convertible debt interest $3.7
Penstion Actuarial Loss $7.7
Non-GAAP net interest and other income $0.2
Q1'21 Guidance
GAAP net interest and other income -$5.5
Exclude non cash convertible debt interest $3.5
Non-GAAP net interest and other income -$2.0
$'s % of sales $'s % of sales $'s % of sales $'s % of sales $'s % of sales $'s % of sales $'s % of sales
GAAP Operating Expenses $212 32% $189 23% $216 28% $232 32% $234 30% $786 34% $857 27%
Intangible Asset Amortization -$10 -1% -$6 -1% -$6 -1% -$10 -1% -$10 -1% -$40 -2% -$31 -1%
Restructuring and Other $2 0% $28 3% $15 2% $14 1% $13 0%
Equity Modification Charge -$1 0% -$2 0% -$1 0%
Non GAAP Operating Expenses $204 31% $211 26% $224 30% $222 31% $224 29% $758 33% $839 27%
2019 2020Q4'19 Q3'20 Q4'20 Q1'21 Low Guidance Q1'21 High Guidance
Q1'21 GAAP Guidance Diluted Shares 190
Exclude dilutive shares from convertible note -11
Q1'21 Non-GAAP Guidance Diluted Shares 179
FY 2021 GAAP estimated tax rate 15.5%
Adjustment for Non GAAP items 0.5%
FY 2021 Non GAAP estimated tax rate 16.0%

28
Appendix | GAAP to Non-GAAP Reconciliation
Q4'20 Q3'20 Q4'19 FY2020 FY2019
GAAP SG&A expense 124 116 117 465 437
Exclude stock compensation expense related to equity modification (1) - - (1) (2)
Non-GAAP SG&A expense 124 116 117 464 435
29
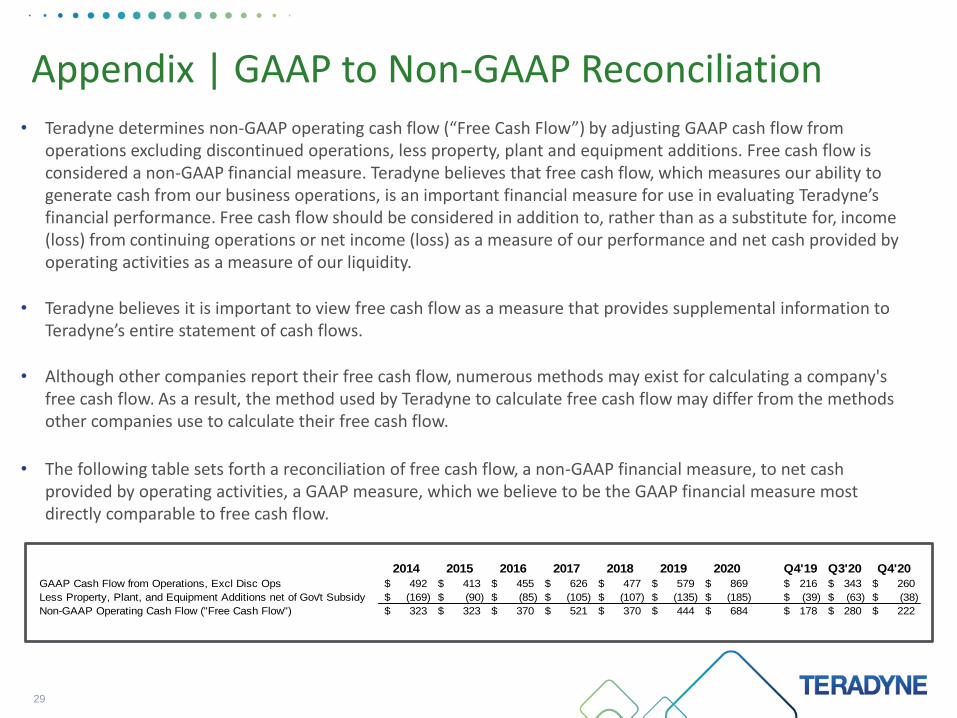
Appendix | GAAP to Non-GAAP Reconciliation• Teradyne determines non-GAAP operating cash flow (“Free Cash Flow”) by adjusting GAAP cash flow from
operations excluding discontinued operations, less property, plant and equipment additions. Free cash flow is considered a non-GAAP financial measure. Teradyne believes that free cash flow, which measures our ability to generate cash from our business operations, is an important financial measure for use in evaluating Teradyne’s financial performance. Free cash flow should be considered in addition to, rather than as a substitute for, income (loss) from continuing operations or net income (loss) as a measure of our performance and net cash provided by operating activities as a measure of our liquidity.
• Teradyne believes it is important to view free cash flow as a measure that provides supplemental information to Teradyne’s entire statement of cash flows.
• Although other companies report their free cash flow, numerous methods may exist for calculating a company's free cash flow. As a result, the method used by Teradyne to calculate free cash flow may differ from the methods other companies use to calculate their free cash flow.
• The following table sets forth a reconciliation of free cash flow, a non-GAAP financial measure, to net cash provided by operating activities, a GAAP measure, which we believe to be the GAAP financial measure most directly comparable to free cash flow.
2014 2015 2016 2017 2018 2019 2020 Q4'19 Q3'20 Q4'20
GAAP Cash Flow from Operations, Excl Disc Ops 492$ 413$ 455$ 626$ 477$ 579$ 869$ 216$ 343$ 260$
Less Property, Plant, and Equipment Additions net of Gov't Subsidy (169)$ (90)$ (85)$ (105)$ (107)$ (135)$ (185)$ (39)$ (63)$ (38)$
Non-GAAP Operating Cash Flow ("Free Cash Flow") 323$ 323$ 370$ 521$ 370$ 444$ 684$ 178$ 280$ 222$

Appendix | GAAP to Non-GAAP Reconciliation
30
2020 2019 2018 2017
GAAP Operating Expenses 857 786 747 696
Less Goodwill Impairment Charge - - -
Less Intangible Asset Impairment - - -
Less Intangible Asset Amortization (31) (40) (39) (31)
Less Restructuring and Other 13 14 (15) (9)
Pension Mark to Market Adjustment - -
Less Inventory Step Up (0) (0)
Less Equity Modification Charge (1) (2) - -
Non GAAP Operating Expenses 839 758 692 656
2020 2019 2018 2017
IA GAAP Operating Expenses 189 184 153 93
Less Intangible Asset Amortization (29) (34) (32) (24)
Less Restructuring and Other (2) (1) (7) (7)
Less Equity Modification Charge (1) - - -
IA non GAAP Operating Expenses 157 149 114 62
2020 2019 2018 2017
Test GAAP Operating Expenses (1) 668 602 594 603
Less Goodwill Impairment Charge - - -
Less Intangible Asset Impairment - - -
Less Intangible Asset Amortization (2) (6) (7) (7)
Less Restructuring and Other 16 15 (9) (2)
Pension Mark to Market Adjustment - - - -
Less Equity Modification Charge - (2) - -
Test Non GAAP Operating Expenses (1) 682 609 578 594
(1) = Includes Variable Compensation of $129, $86, $76M, $87M, for 2020, 2019, 2018, 2017 respectively.

31
Appendix | GAAP to Non-GAAP Reconciliation
FY 2024 Low FY 2024 High
2024 Estimated GAAP Operating Expenses as a % of Sales 29% 29%
Less Intangible Asset Amortization as a % of Sales 1% 0%
2024 Estimated Non-GAAP Operating Expenses as a % of Sales 29% 28%
FY 2024 Low FY 2024 High
2024 Estimated GAAP Operating Profit as a % of Sales 29% 31%
Add back Intangible Asset Amortization as a % of Sales 1% 0%
2024 Estimated Non-GAAP Operating Profit as a % of Sales 30% 31%
FY 2024 Low FY 2024 High
2024 Estimated GAAP Diluted EPS 5.15$ 6.65$
Add back Intangible Asset Amortization 0.10$ 0.10$
2024 Estimates Non-GAAP Diluted EPS 5.25$ 6.75$

32
Appendix | GAAP to Non-GAAP Reconciliation
FY 2022 Low FY 2022 High
2022 Estimated GAAP Operating Expenses as a % of Sales 33% 32%
Less Intangible Asset Amortization as a % of Sales 1% 1%
2022 Estimated Non-GAAP Operating Expenses as a % of Sales 32% 31%
FY 2022 Low FY 2022 High
2022 Estimated GAAP Operating Profit as a % of Sales 25% 27%
Add back Intangible Asset Amortization as a % of Sales 1% 1%
2022 Estimated Non-GAAP Operating Profit as a % of Sales 26% 28%
FY 2022 Low FY 2022 High
2022 Estimated GAAP Diluted EPS 3.18$ 3.87$
Add back Intangible Asset Amortization 0.09$ 0.10$
Add back Non Cash Convertible Debt Interest 0.07$ 0.07$
Convertible share adjustment 0.15$ 0.21$
2022 Estimated Non-GAAP Diluted EPS 3.50$ 4.25$
FY 2022 High Old
2022 Estimated GAAP Diluted EPS (Old) 3.73$
Add back Intangible Asset Amortization 0.07$
Add back Non Cash Convertible Debt Interest 0.08$
Convertible share adjustment 0.13$
2022 Estimated Non-GAAP Diluted EPS 4.00$
MiR's revenue increase for the period January 1, 2019 to December 31, 2019 compared to the period April 23, 2018 to December 31, 2018 is 84%. MiR's pro-forma revenue increase for
the period January 1, 2019 to December 31, 2019 compared to the period January 1, 2018 to December 31, 2018 is 43%.
Industrial Automation GAAP revenue increase for the period January 1, 2019 to December 31, 2019 compared to the period January 1, 2018 to December 31, 2018 is 14%. Industrial
Automation's pro-forma revenue increase for the period January 1, 2019 to December 31, 2019 compared to the period January 1, 2018 to December 31, 2018 is 12%.