financial results fy2016 (ended march 2017) - fujitsu...
TRANSCRIPT
FUJITSU GENERAL LIMITED
11
Financial ResultsFY2016 (Ended March 2017)
April 2017Fujitsu General Limited
Any forward-looking statement in this report speaks only as of the date on which it is made; Forward-looking statements are based on the company's current assumptions regarding future business and financial performance; these statements by their nature address matters that are uncertain to different degrees. Forward-looking statements involve a number of risks, uncertainties and other factors that could cause actual results to be materially different.
Note:
This report is a translation of Japanese version. In case of any difference between English version and Japanese version, Japanese version shall prevail.
FUJITSU GENERAL LIMITED
22Index
1. Financial Results for FY2016Sales by Segment ・・・・・・・・・・・・・・・・・・・・ 3Overseas A/C Sales by Geographic area ・・・・・・・・・・・・ 4Consolidated Financial Results ・・・・・・・・・・・・・・・ 5Analysis of Consolidated Operating income [FY2016] (vs previous year)・・・ 6Segment information ・・・・・・・・・・・・・・・・・・・ 7Analysis of Financial Results・・・・・・・・・・・・・・・・・ 8Consolidated Balance Sheets ・・・・・・・・・・・・・・・・ 9Main Financial Data ・・・・・・・・・・・・・・・・・・・・ 10
2. Financial Plan for FY2017Sales by Segment ・・・・・・ ・ ・・・・・・・・・・・・・・ 11Overseas A/C Sales by Geographic area ・・・・・・・・・・ ・・・ 12Consolidated Financial Plan ・・・・・・・・・・・・・・・・・・ 13Analysis of Consolidated Operating income [FY2017] (vs previous year) ・・・ 14Segment Information, R&D Expenses,
Capital Expenditures, Depreciation Expenses ・・・・・・・・・・ 15Analysis of Financial Plan ・・・・・・・・・・・・・・・・・・ 16Analysis of Consolidated Operating income [FY2017] (vs previous year)・・・ 17<Reference Information> ・・・・・・・・・・・・・・・・・・・ 18

FUJITSU GENERAL LIMITED
3
Sales by Segment(Hundred Million Yen)
83% 2,331 89% 2,324 6% -7 6% -%
(529) (555) (26) (5%)
(1,802) (1,769) (-33) (7%) (-2%)
365 146 -219 -60%
Electronic devices 100 117 17 17%
16% 465 10% 263 -6% -202 -44%
1% 14 1% 14 -% - 3%
Total 100% 2,810 100% 2,601 -% -209 -2% -7%
Japan 36% 1,000 32% 823 -4% -177 -18%
Overseas 64% 1,810 68% 1,778 4% -32 -2%
FY2015 FY2016
Actual
Change
Actual %
Air conditioners
Others
Telecommunications andElectronic devices
(Japan)
(Overseas)
Telecommunications
1.Financial Results for FY2016
〔Note1: subscripts(%) of sales is proportion to Total〕 〔Note2: subscripts(%) of change % is local currency base〕
FUJITSU GENERAL LIMITEDOverseas A/C Sales by Geographic area4
(Hundred Million Yen)
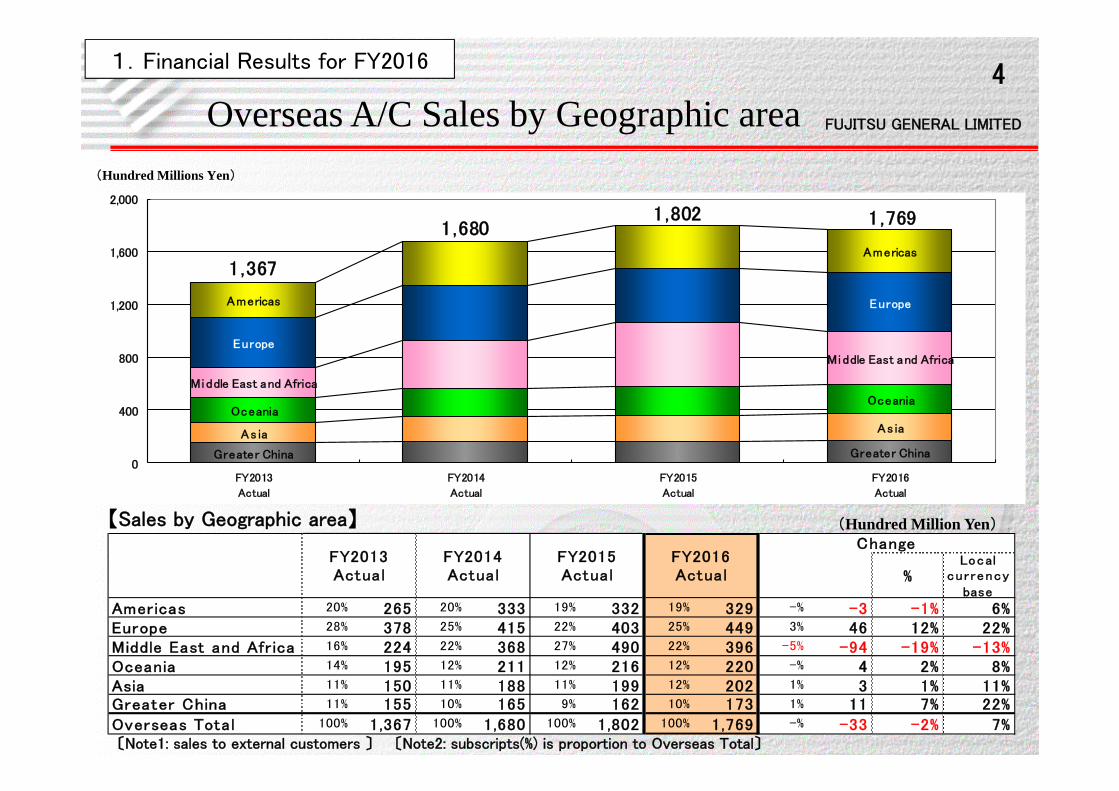
〔Note1: sales to external customers 〕 〔Note2: subscripts(%) is proportion to Overseas Total〕
%Local
cur rencybase
Americas 20% 265 20% 333 19% 332 19% 329 -% -3 -1% 6%Europe 28% 378 25% 415 22% 403 25% 449 3% 46 12% 22%
16% 224 22% 368 27% 490 22% 396 -5% -94 -19% -13%Oceania 14% 195 12% 211 12% 216 12% 220 -% 4 2% 8%Asia 11% 150 11% 188 11% 199 12% 202 1% 3 1% 11%Greater China 11% 155 10% 165 9% 162 10% 173 1% 11 7% 22%
Overseas Total 100% 1,367 100% 1,680 100% 1,802 100% 1,769 -% -33 -2% 7%
Middle East and Africa
FY2013Actual
FY2014Actual
FY2015Actual
FY2016Actual
Change
(Hundred Millions Yen)
【Sales by Geographic area】
1.Financial Results for FY2016
Greater China Greater China
As ia As ia
OceaniaOceania
Middle East and Africa
Middle East and Africa
Europe
EuropeAmericas
Americas
1,367
1,6801,802 1,769
0
400
800
1,200
1,600
2,000
FY2013
Actual
FY2014
Actual
FY2015
Actual
FY2016
Actual

FUJITSU GENERAL LIMITED
5
(Hundred Million Yen)
Consolidated Financial Results
Foreign Exchange rate Average (Closing) Average (Closing) Average (Closing) Yen/1USD 120 ( 113) 110 ( 112) -10 ( -1) Yen/1AUD 88 ( 86) 81 ( 86) -7 ( -) Yen/1EUR 131 ( 128) 120 ( 120) -11 ( -8) BAHT/1USD 34.7 ( 35.1) 35.0 ( 34.3) 0.3 ( -0.8) RMB/1USD 6.29 ( 6.46) 6.69 ( 6.90) 0.40 ( 0.44)
Consolidated Statements of Income
51.Financial Results for FY2016
〔Note: subscripts(%) of change % is local currency base 〕
Actual (ratio) Actual (ratio)
2,810 (100.0%) 2,601 (100.0%) -209 -2% -7%
786 (28.0%) 787 (30.3%) 1 -%
275 (9.8%) 265 (10.2%) -10 -4%Non-operatingprofit or loss
-16 (-0.6%) -25 (-1.0%) -9 -%
(exchange gain and loss) (-18) (-0.6%) (-28) (-1.1%) (-10) ( -%)
259 (9.2%) 240 (9.2%) -19 -8%
- ( -%) 80 (3.1%) 80 -%
175 (6.2%) 100 (3.9%) -75 -43% ※Net income attr ibutable to Owners of the Parent
¥167.55 ¥95.88 ¥-71.67
FY 2015
%
Change
Net income per share
Extraordinary loss
FY 2016
Operating income
Net sales
Gross profit
Ordinary income
Net income※

FUJITSU GENERAL LIMITED
6
275
-84
-35
-4263
41
48-1
265
▲150
▲100
▲50
-
50
100
150
200
250
300
0
50
100
150
200
250
Decline in Price
Change
-10
+75
-84 -1
(Hundred Million Yen)
Analysis of Consolidated Ordinary income[FY2016] (vs previous year)
1.Financial Results for FY2016
FY2015
ActualFY2016
Actual
Telecomm andElectronic devices
Segment
StrategicInvestment
Cost reduction
Sales volume
Impact of Foreign
Exchange rate
Other Segment
Other Segment
Air conditioners SegmentTelecomm andElectronic
devices Segment

FUJITSU GENERAL LIMITED
77
Segment Information
(Hundred Million Yen)
FY2015 FY2016
Actual Actual
Net sales 2,331 2,324 -7 6% -%
Operating income 171 246 75 44%
(Operating income margin) (7.3%) (10.6%) (3.3%)
Net sales 465 263 -202 -44%
Operating income 108 24 -84 -77%
(Operating income margin) (23.3%) (9.3%) (-14.0%)
Net sales 14 14 - 3%
Operating income -4 -5 -1 -%
(Operating income margin) (-30.1%) (-40.0%) (-9.9%)
Net sales 2,810 2,601 -209 -2% -7%
Operating income 275 265 -10 -4%
(Operating income margin) (9.8%) (10.2%) (0.4%)
Total
Telecommunicationsand
Electronic devices
Change
Air conditioners
Others
%
1.Financial Results for FY2016
〔Note1: sales to external customers〕 〔Note2: subscripts(%) of change % is local currency base〕
FUJITSU GENERAL LIMITED
88
Analysis of Financial Results
1.Financial Results for FY2016
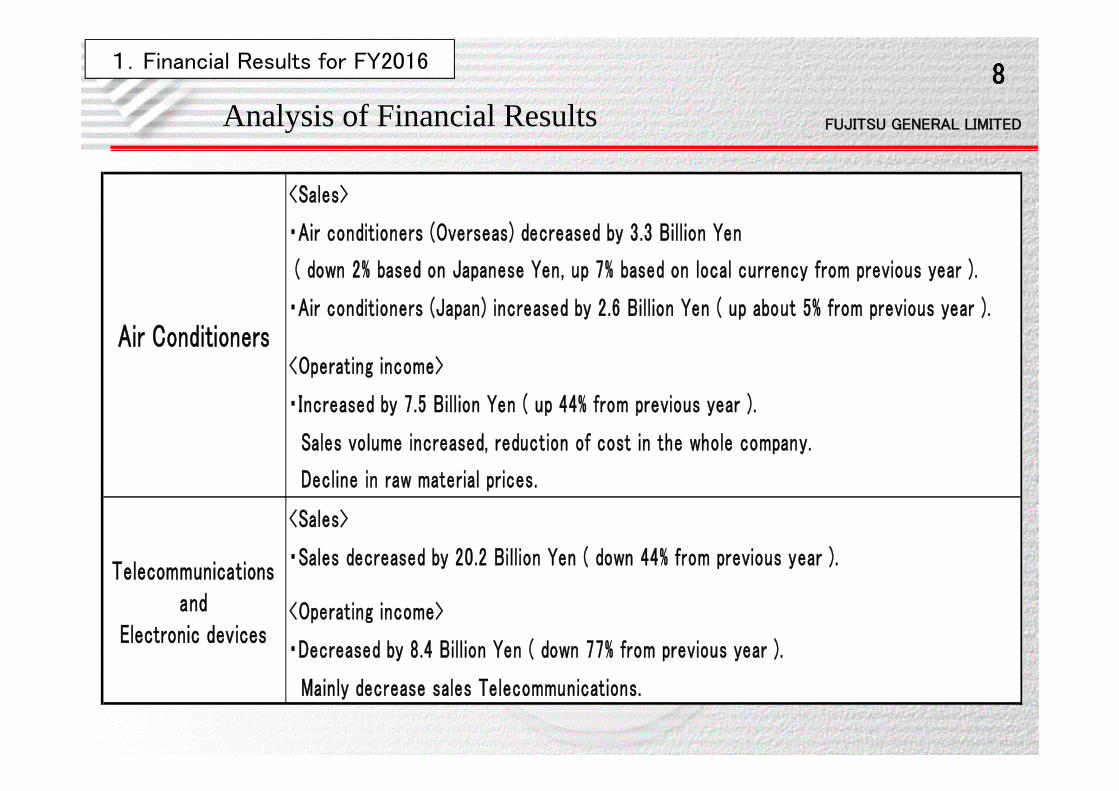
<Sales>
・Air conditioners (Overseas) decreased by 3.3 Billion Yen
<Operating income>
・Increased by 7.5 Billion Yen ( up 44% from previous year ).
Sales volume increased, reduction of cost in the whole company.
<Sales>
・Sales decreased by 20.2 Billion Yen ( down 44% from previous year ).
<Operating income>
・Decreased by 8.4 Billion Yen ( down 77% from previous year ).
Mainly decrease sales Telecommunications.
Air Conditioners
Decline in raw material prices.
・Air conditioners (Japan) increased by 2.6 Billion Yen ( up about 5% from previous year ).
Telecommunicationsand
Electronic devices
( down 2% based on Japanese Yen, up 7% based on local currency from previous year ).

FUJITSU GENERAL LIMITED
9
(Hundred Million Yen)
Consolidated Balance Sheets
Actual ratio Actual ratio
Current assets 1,331 73% 1,455 75% 124
(216) (408) (192)
(812) (714) (-98)
(200) (233) (33)
(103) (100) (-3)
Noncurrent assets 480 27% 484 25% 4
Total assets 1,811 100% 1,939 100% 128
Current liabilities 749 41% 785 41% 36
(385) (377) (-8)
(364) (408) (44)
Noncurrent liabilities 188 11% 197 10% 9
Total liabilities 937 52% 982 51% 45
Shareholders' equity 814 45% 891 46% 77
36 2% 37 2% 1
Non-controlling interests 24 1% 29 1% 5
Total net assets 874 48% 957 49% 83
Total liabilities and net assets 1,811 100% 1,939 100% 128
Accumulated other comprehensive income
(Others)
FY2016
(Cash and deposits)
Change
(Notes and accounts payable)
FY2015
(Notes and accounts receivable)
(Inventories)
(Others)
1.Financial Results for FY2016

FUJITSU GENERAL LIMITED
1010
Main Financial Data(Hundred Million Yen)
%232 268 36 16%-68 -49 19 -28%164 219 55 34%
4.4% 124 4.7% 121 0.3% -3 -2%50 55 5 10%46 54 8 18%
22.0% 11.3% -10.7% 47.0% 47.8% 0.8%
200 233 33 31.1days 31.7days 0.6days 81.8days 74.5days -7.3days
-0.25 -0.44 -0.19
Free Cash Flow
Depreciation Expense
Net D/E ratio (times)CCC*
ROE
Actual
Days Inventory Outstanding
Inventory
Change
Shareholders' equity ratio
R&D Expense
Investing Cash FlowOperating Cash Flow
Capital Expenditures
FY2015 FY2016Actual
〔Note: subscripts(%) is proportion to Net sales〕
*CCC (Cash Conversion Cycle): Days Sales Outstanding + Days Inventory Outstanding – Days Payable Outstanding
1.Financial Results for FY2016

FUJITSU GENERAL LIMITED
1111
Sales by Segment(Hundred Million Yen)
Air conditioners 1,105 1,219 89% 2,324 1,140 1,505 91% 2,645 32111%
14%
(Japan) (333) (222) (555) (350) (230) (580) (25) (4%)
(Overseas) (772) (997) (1,769) (790) (1,275) (2,065) (296)(13%)
(17%)
55 91 146 45 80 125 -21 -14%
57 60 117 60 60 120 3 3%
112 151 10% 263 105 140 9% 245 -18 -7%
Others 7 7 1% 14 5 5 -% 10 -4 -30%
Total 1,224 1,377 100% 2,601 1,250 1,650 100% 2,900 2999%
12%
Japan 447 376 32% 823 460 375 29% 835 12 2%
Overseas 777 1,001 68% 1,778 790 1,275 71% 2,065 287 16%
Change
FullYear
%
Telecommunications
FullYear
FY2016(Actual) FY2017(Plan)
Electronic devices
Telecommunications andElectronic devices
2nd Half1st Half 1st Half 2nd HalfFullYear
〔Note1: subscripts(%) is proportion to Total〕 〔Note2: subscripts(%) of change % is local currency base〕
2.Financial Plan for FY2017
FUJITSU GENERAL LIMITED
12
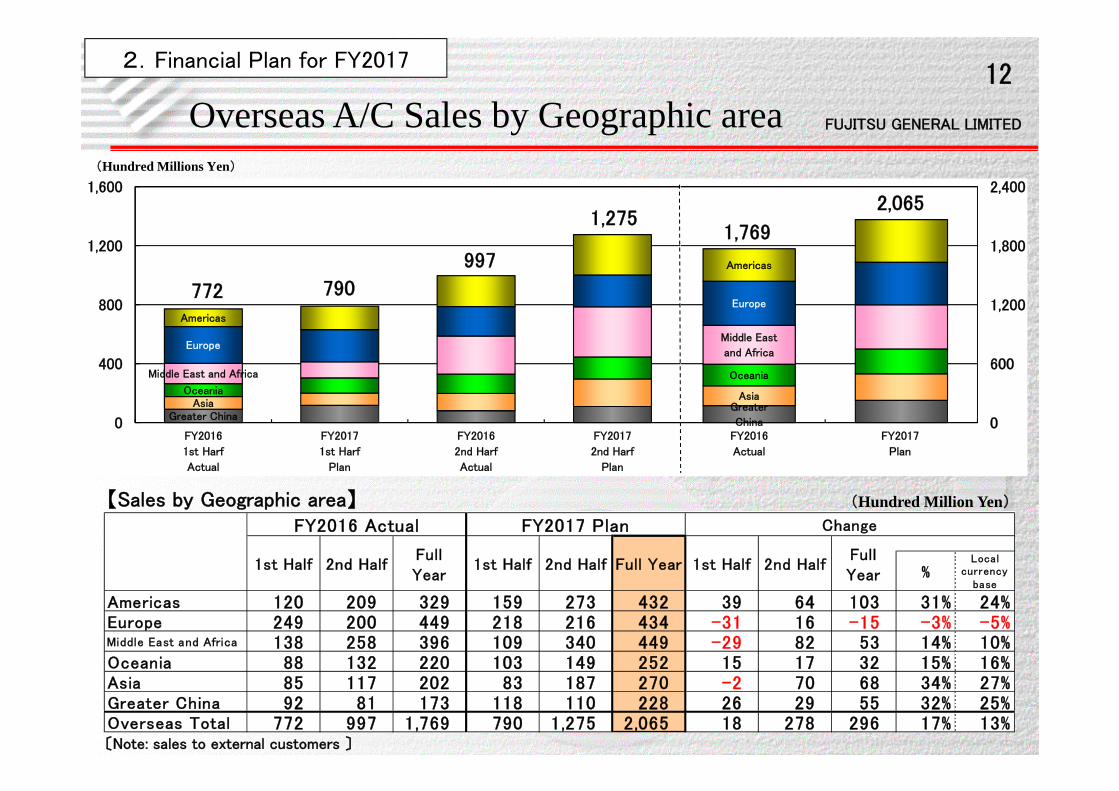
%Local
currencybase
Americas 120 209 329 159 273 432 39 64 103 31% 24%Europe 249 200 449 218 216 434 -31 16 -15 -3% -5%Middle East and Africa 138 258 396 109 340 449 -29 82 53 14% 10%Oceania 88 132 220 103 149 252 15 17 32 15% 16%Asia 85 117 202 83 187 270 -2 70 68 34% 27%Greater China 92 81 173 118 110 228 26 29 55 32% 25%Overseas Total 772 997 1,769 790 1,275 2,065 18 278 296 17% 13%
1st Half 2nd HalfFullYear
FullYear
1st Half 2nd Half Full Year
ChangeFY2017 PlanFY2016 Actual
1st Half 2nd Half
Greater
China
Asia
Oceania
Middle East
and Africa
Europe
Americas
1,769
2,065
0
600
1,200
1,800
2,400
FY2016
Actual
FY2017
Plan
Greater ChinaAsia
Oceania
Middle East and Africa
Europe
Americas
772 790
997
1,275
0
400
800
1,200
1,600
FY2016
1st Harf
Actual
FY2017
1st Harf
Plan
FY2016
2nd Harf
Actual
FY2017
2nd Harf
Plan
2.Financial Plan for FY2017
Overseas A/C Sales by Geographic area(Hundred Millions Yen)
【Sales by Geographic area】
〔Note: sales to external customers 〕
(Hundred Million Yen)

FUJITSU GENERAL LIMITED
13
(Hundred Million Yen)
1,224 1,377 2,601 1,250 1,650 2,900 299 9% 12%
126 139 265 60 170 230 -35 -13%
(10.3%) (10.1%) (10.2%) (4.8%) (10.3%) (7.9%) (-2.3%)
89 151 240 60 170 230 -10 -4%
(7.2%) (11.0%) (9.2%) (4.8%) (10.3%) (7.9%) (-1.3%)
- 80 80 - - - -80 -%
57 43 100 40 120 160 60 60%
(4.7%) (3.1%) (3.9%) (3.2%) (7.3%) (5.5%) (1.6%)
※Net income attr ibutable to owners of the parent
11 11 22 12 12 24 2
(Net income margin※)
Operating income
(Ordinary income margin)
Change
FullYear
FullYear
2nd Half %
Net income※
Dividend per share (Yen)
(Operating income margin)
Ordinary income
Extraordinary loss
Net sales
FY2016(Actual)
1st Half
FY2017(Plan)
2nd Half1st HalfFullYear
Consolidated Financial Plan2.Financial Plan for FY2017
Foreign Exchange Rate (Average) Yen/1USD 106 113 110 115 115 115 5
Yen/1AUD 78 83 81 80 80 80 -1
Yen/1EUR 118 120 120 120 120 120 -
BAHT/1USD 34.9 35.1 35.0 34.5 34.5 34.5 -0.5
RMB/1USD 6.57 6.87 6.69 6.80 6.80 6.80 0.11
22.9% 15.7%
〔Note2: subscripts(%) of dividend per share is dividend payout ratio〕
〔Note1: subscripts(%) of change % is local currency base〕

FUJITSU GENERAL LIMITED
14
265
-30
-22-18
-22
66-9 -
230
▲50
-
50
100
150
200
250
300
0
50
100
150
200
250
Telecomm and Electronic
devices Segment
Change
-35
―-26
-9
2.Financial Plan for FY2017
Analysis of consolidated Operating income[FY2017](vs previous year)
(Hundred Million Yen)
FY2016Actual
FY2017Plan
Impact of Foreign
Exchange rate
Cost reduction
Decline in Price Strategic
InvestmentSales volume
Telecomm andElectronic devices
Segment
Other Segment
Other Segment
Air conditioners Segment

FUJITSU GENERAL LIMITED
1515
(Hundred Million Yen)
Net sales 1,105 1,219 2,324 1,140 1,505 2,645 321 11% 14%
Operating income 122 124 246 60 160 220 - 26 -11%
(Operating income margin) (11.0%) (10.2%) (10.6%) (5.3%) (10.6%) (8.3%) (-2.3%)
Net sales 112 151 263 105 140 245 - 18 -7%
Operating income 6 18 24 2 13 15 - 9 -39%
(Operating income margin) (5.8%) (12.0%) (9.3%) (1.9%) (9.3%) (6.1%) (-3.2%)
Net sales 7 7 14 5 5 10 - 4 -30%
Operating income - 2 - 3 - 5 - 2 - 3 - 5 - -%
(Operating income margin) (-31.0%) (-49.4%) (-40.0%) (-40.0%) (-60.0%) (-50.0%) (-10.0%)
Net sales 1,224 1,377 2,601 1,250 1,650 2,900 299 9% 12%
Operating income 126 139 265 60 170 230 - 35 -13%
(Operating income margin) (10.3%) (10.1%) (10.2%) (4.8%) (10.3%) (7.9%) (-2.3%)
59 62 121 64 66 130 9 7%
27 28 55 38 32 70 15 26%
30 24 54 27 28 55 1 2%Depreciation Expenses
Total
Telecommunicationsand
Electronic devices
Air conditioners
Others
R&D Expenses
FullYear
Capital Expenditures
1st Half 2nd HalfFullYear
%
FY2016(Actual) FY2017(Plan) Change
1st Half 2nd HalfFullYear
Segment Information, R&D Expenses, Capital Expenditures, Depreciation Expenses
4.8%
〔Note1: sales to external customers〕 〔Note2: subscripts(%) of change % is local currency base〕
〔Note3: subscripts(%) is proportion to Total Net sales〕
4.5% 4.7% 5.1% 4.0% 4.5% -0.2%
2.Financial Plan for FY2017

FUJITSU GENERAL LIMITED
16
・Air conditioners (Overseas) increased by 29.6 Billion Yen
( up 17% based on Japanese Yen, up 13% based on local currency from previous year ).
・Air conditioners (Japan) increased by 2.5 Billion Yen ( up about 4% from previous year ).
<Operating income>
・Decreased by 2.6 Billion Yen ( down 11% from previous year ).
Due to change of external environment such as unfavor exchange rate and
raising raw material prices, although plan to increase sales and reduction of cost
in the whole company.
<Sales>
・Sales decreased by 1.8 Billion Yen ( down 7% from previous year ).
<Operating income>
・Decreased by 9 Billion Yen ( down 39% from previous year ).
Mainly decrease sales Telecommunications.
Air Conditioners
Telecommunicationsand
Electronic devices
<Sales>
Analysis of Financial Plan
2.Financial Plan for FY2017
FUJITSU GENERAL LIMITED
17
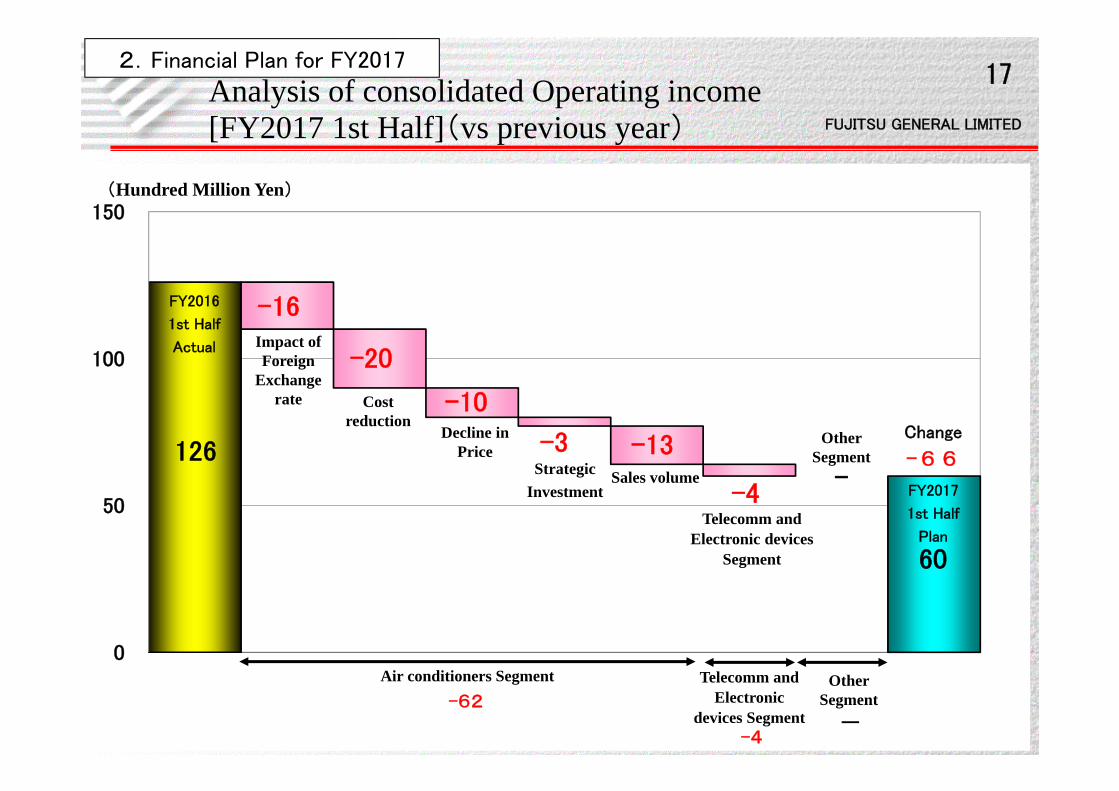
126
-16
-20
-10
-3 -13
-4-
60
▲40
▲20
-
20
40
60
80
100
120
140
0
50
100
150
FY2017
1st Half
Plan
Change
-66
―-62
-4
FY2016
1st Half
Actual
(Hundred Million Yen)
Impact of Foreign
Exchange rate Cost
reductionDecline in
PriceStrategic
InvestmentSales volume
Telecomm andElectronic devices
Segment
Other Segment
Air conditioners Segment Telecomm and Electronic
devices Segment
Other Segment
Analysis of consolidated Operating income[FY2017 1st Half](vs previous year)
2.Financial Plan for FY2017
FUJITSU GENERAL LIMITED
18
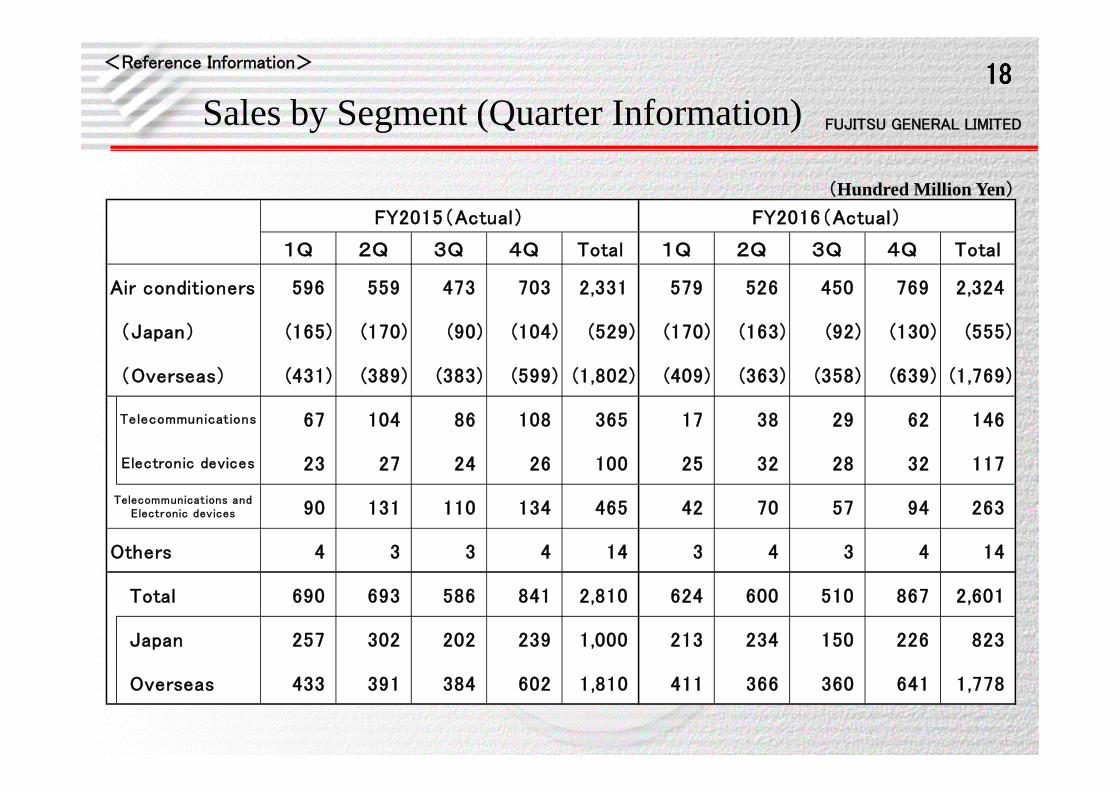
1Q 2Q 3Q 4Q Total 1Q 2Q 3Q 4Q Total
Air conditioners 596 559 473 703 2,331 579 526 450 769 2,324
(Japan) (165) (170) (90) (104) (529) (170) (163) (92) (130) (555)
(Overseas) (431) (389) (383) (599) (1,802) (409) (363) (358) (639) (1,769)
67 104 86 108 365 17 38 29 62 146
23 27 24 26 100 25 32 28 32 117
90 131 110 134 465 42 70 57 94 263
Others 4 3 3 4 14 3 4 3 4 14
Total 690 693 586 841 2,810 624 600 510 867 2,601
Japan 257 302 202 239 1,000 213 234 150 226 823
Overseas 433 391 384 602 1,810 411 366 360 641 1,778
Telecommunications andElectronic devices
FY2015(Actual)
Telecommunications
Electronic devices
FY2016(Actual)
18
Sales by Segment (Quarter Information)<Reference Information>
(Hundred Million Yen)

FUJITSU GENERAL LIMITED
19
1Q 2Q 3Q 4Q Total 1Q 2Q 3Q 4Q Total690 693 586 841 2,810 624 600 510 867 2,601 66 37 63 109 275 92 34 33 106 265
(9.6%) (5.3%) (10.8%) (13.0%) (9.8%) (14.8%) (5.6%) (6.6%) (12.2%) (10.2%)
80 18 67 94 259 62 27 55 96 240 (11.6%) (2.6%) (11.4%) (11.2%) (9.2%) (9.9%) (4.4%) (10.9%) (11.0%) (9.2%)
55 12 46 62 175 41 16 -29 72 100 (8.1%) (1.6%) (7.9%) (7.4%) (6.2%) (6.6%) (2.7%) (-5.9%) (8.4%) (3.9%)
<Supplementary Information>Overseas A/C Sales by Geographic area(Quarter Information)
1Q 2Q 3Q 4Q Total 1Q 2Q 3Q 4Q TotalAmericas 62 77 71 122 332 51 69 71 138 329 Europe 88 68 109 138 403 151 98 62 138 449
106 123 103 158 490 68 70 102 156 396 Oceania 31 60 54 71 216 35 53 54 78 220
94 18 15 72 199 55 30 37 80 202 50 43 31 38 162 49 43 32 49 173
431 389 383 599 1,802 409 363 358 639 1,769
Net salesOperating income
※Net income attr ibutable to owners of the parent
Overseas Total
Greater China
(Net income margin※)
Ordinary income
Asia
FY2016(Actual)
(Ope rat in g in come margin)
Middle East and Africa
FY2015(Actual)
FY2015(Actual)
(Ordinary i ncome marg in)
Net income※
FY2016(Actual)
〔Note: sales to external customers 〕
19Consolidated Statements of Income(Quarter Information)
<Reference Information>
(Hundred Million Yen)

FUJITSU GENERAL LIMITED
20
109
-14
-14
-12 24
15
1
-3
106
▲40
▲20
-
20
40
60
80
100
120
0
50
100
150
Cost reduction
FY2016
4Q
Actual
Change
-3FY2015
4Q
Actual
+14
-14-3
Analysis of consolidated Operating income[FY2016 4th Quarter](vs previous year)
<Reference Information>
(Hundred Million Yen)
Telecomm andElectronic devices
Segment
Decline in Price
Strategic Investment
Sales volume
Impact of Foreign
Exchange rate
Air conditioners Segment Other Segment
Other Segment
Telecomm andElectronic devices
Segment