financial review - bellir.co.za · change distribution model –dealer reliance improving global...
TRANSCRIPT

8/12/2008
1
Growing Our Business & ProfitabilityGrowing Our Business & Profitability
BELL EQUIPMENT LTD
2008 Interim Results Announcement
&
Business Review
August 2008
Growing Our Business & ProfitabilityGrowing Our Business & Profitability Growing Our Business & ProfitabilityGrowing Our Business & Profitability
Review
• Financial Report
• Understanding BELL Equipment
• Business Drivers
• Growth Strategy
• Key Risk Analysis
• Powering Ahead ....
• Questions?
Growing Our Business & ProfitabilityGrowing Our Business & Profitability
Financial Review for the
6 months ended
June 2008
Growing Our Business & ProfitabilityGrowing Our Business & Profitability
Highlights – June 2008
Revenue R2,79 billion Up 35%
Operating Profit Up 55%
Earnings per Share Up 44%
NAV per Share Up 48%
Employment Up 22%
Positive Outlook for Mining and Civil Construction in
Southern Africa, Middle East and Asia
Growing Our Business & Profitability
Operating Profit Impacted by: Improved Price
Realisation and increased Volumes and
Currency shift
8/12/2008
2
Growing Our Business & ProfitabilityGrowing Our Business & Profitability
Condensed Income StatementCondensed Income Statement
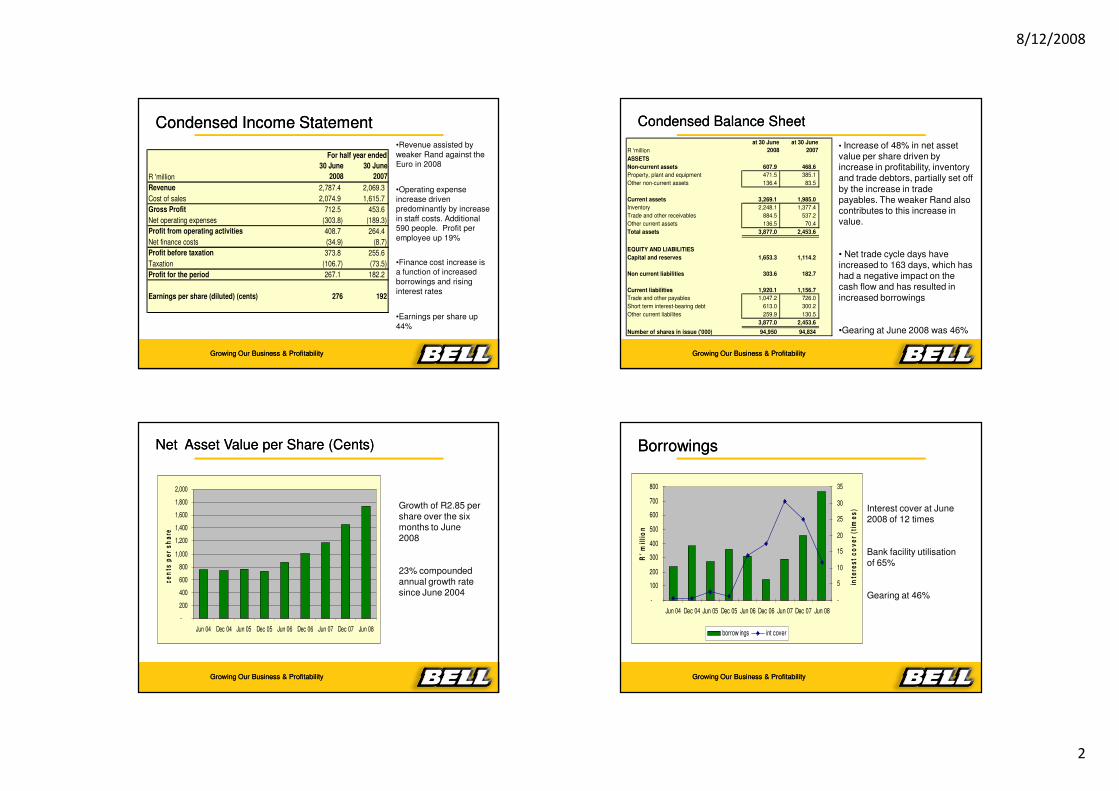
•Revenue assisted by
weaker Rand against the
Euro in 2008
•Operating expense
increase driven
predominantly by increase
in staff costs. Additional
590 people. Profit per
employee up 19%
•Finance cost increase is
a function of increased
borrowings and rising
interest rates
•Earnings per share up
44%
R 'million
30 June
2008
30 June
2007
Revenue 2,787.4 2,069.3
Cost of sales 2,074.9 1,615.7
Gross Profit 712.5 453.6
Net operating expenses (303.8) (189.3)
Profit from operating activities 408.7 264.4
Net finance costs (34.9) (8.7)
Profit before taxation 373.8 255.6
Taxation (106.7) (73.5)
Profit for the period 267.1 182.2
Earnings per share (diluted) (cents) 276 192
For half year ended
Growing Our Business & ProfitabilityGrowing Our Business & Profitability
Condensed Balance SheetCondensed Balance Sheet
• Increase of 48% in net asset value per share driven by increase in profitability, inventory and trade debtors, partially set off
by the increase in trade payables. The weaker Rand also contributes to this increase in value.
• Net trade cycle days have increased to 163 days, which has had a negative impact on the cash flow and has resulted in
increased borrowings
•Gearing at June 2008 was 46%
R 'million
at 30 June
2008
at 30 June
2007
ASSETS
Non-current assets 607.9 468.6
Property, plant and equipment 471.5 385.1
Other non-current assets 136.4 83.5
Current assets 3,269.1 1,985.0
Inventory 2,248.1 1,377.4
Trade and other receivables 884.5 537.2
Other current assets 136.5 70.4
Total assets 3,877.0 2,453.6
EQUITY AND LIABILITIES
Capital and reserves 1,653.3 1,114.2
Non current liabilities 303.6 182.7
Current liabilities 1,920.1 1,156.7
Trade and other payables 1,047.2 726.0
Short term interest-bearing debt 613.0 300.2
Other current liabilites 259.9 130.5
3,877.0 2,453.6
Number of shares in issue ('000) 94,950 94,834
Growing Our Business & ProfitabilityGrowing Our Business & Profitability
Net Asset Value per Share Net Asset Value per Share ((Cents)Cents)
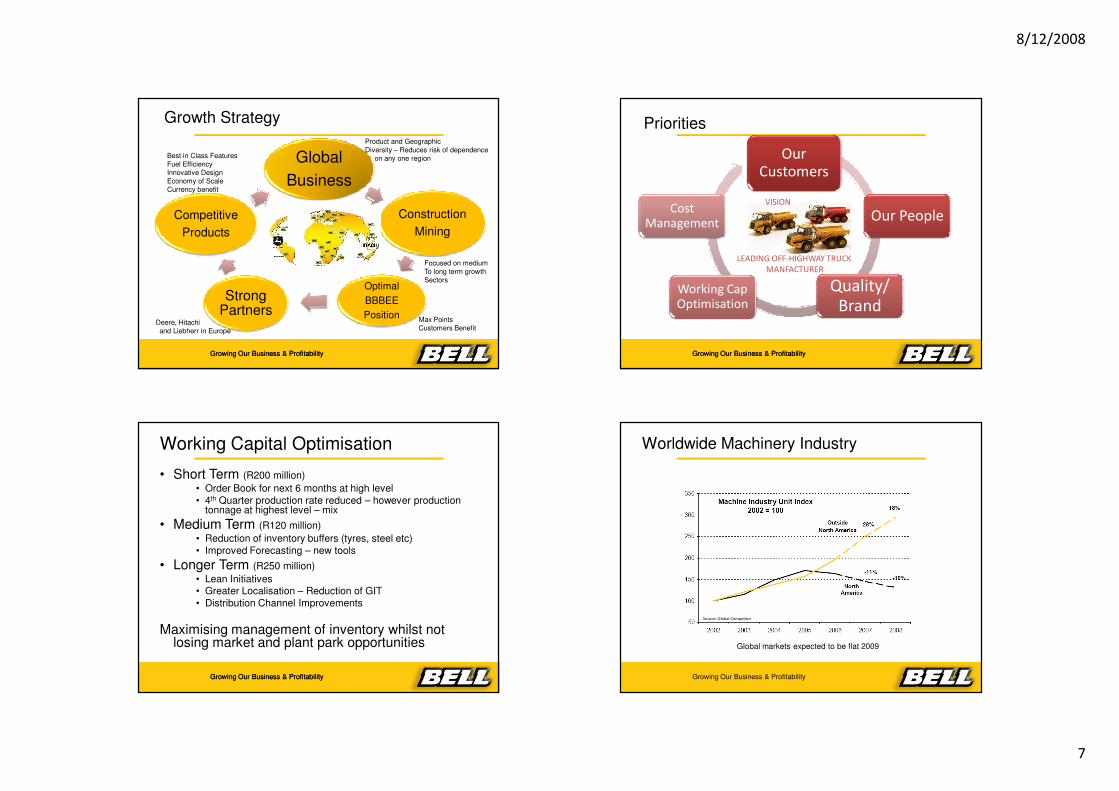
Growth of R2.85 per share over the six months to June 2008
23% compounded annual growth rate since June 2004
-
200
400
600
800
1,000
1,200
1,400
1,600
1,800
2,000
Jun 04 Dec 04 Jun 05 Dec 05 Jun 06 Dec 06 Jun 07 Dec 07 Jun 08
ce
nts
pe
r s
ha
re
Growing Our Business & ProfitabilityGrowing Our Business & Profitability
BorrowingsBorrowings
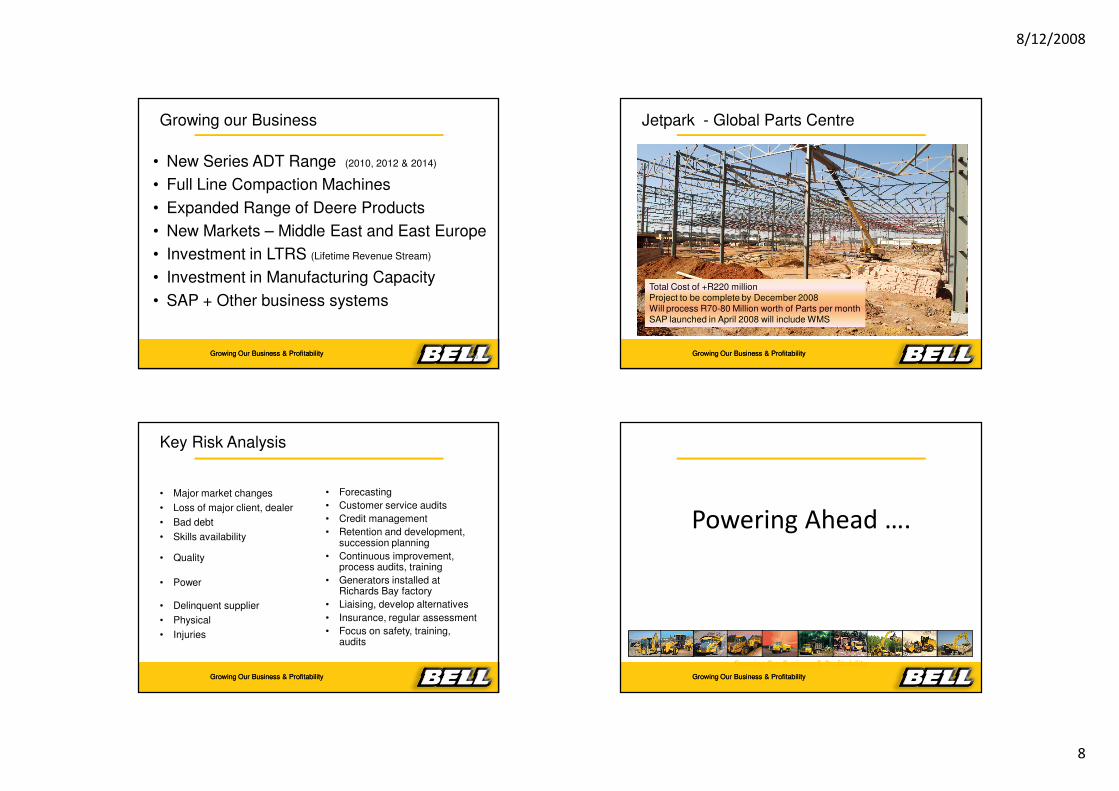
Interest cover at June 2008 of 12 times
Bank facility utilisation of 65%
Gearing at 46%-
100
200
300
400
500
600
700
800
Jun 04 Dec 04 Jun 05 Dec 05 Jun 06 Dec 06 Jun 07 Dec 07 Jun 08
R'
mil
lio
n
-
5
10
15
20
25
30
35
inte
res
t c
ov
er
(tim
es
)
borrow ings int cover

8/12/2008
3
Growing Our Business & ProfitabilityGrowing Our Business & Profitability
Working Capital
31.4%
29.4%28.5%
25.8%
22.1%21.3%
16.5%
10.8%
0.0%
5.0%
10.0%
15.0%
20.0%
25.0%
30.0%
35.0%
Co B Bell Co C Co A Co T Co O Co M Deere
Peer Working Capital as % of Sales –
BECSA Manufacturing
37.4%
45.7%
25.0%
30.0%
35.0%
40.0%
45.0%
50.0%
Bell Co J
Peer Working Capital as % of Sales –
Group (Manuf + Retail)
Challenges:
Distance from Suppliers
Distance to Customers
Current component Lead-times
Growing Our Business & ProfitabilityGrowing Our Business & Profitability
Working Capital
0.0%
10.0%
20.0%
30.0%
40.0%
50.0%
Inventory as % of Sales
Raw Materials WIP Finished Goods
Opportunities:
Process change and move to DFT (Build to Order)
Change Distribution Model – Dealer reliance
Improving Global Supply situation
... Possibility exists
to release hundreds
of millions of Rands
from Inventory.
Projects:
Build to Order
Supplier rationalisation
Forecast improvement
Lean Initiatives
Growing Our Business & ProfitabilityGrowing Our Business & Profitability
Understanding BELL Equipment ...
Growing Our Business & Profitability Growing Our Business & ProfitabilityGrowing Our Business & Profitability
Our Products
�Articulated Trucks
�Designed and built in Richards Bay
�Exported to Asia; sold under Hitachi brand
�Built in Germany and distributed in Europe
�Deere licensed to build Bell product in USA; sold under Deere brand
�Front End Loaders
�Deere licenses Bell built in R/Bay
�Tractor Loader Backhoes
�Deere licenses Bell built in R/Bay
�Sugar and Forestry machines
�Designed and built in Richards Bay
�Branded Machines
� Imported: Graders Bulldozers Excavators
� Imported: Compaction & Road building
�Parts and Service (Lifetime Revenue Stream)

8/12/2008
4
Growing Our Business & ProfitabilityGrowing Our Business & Profitability
Growing Global Network +120 Outlets
Growing Our Business & ProfitabilityGrowing Our Business & Profitability
Strong & Diversified Revenue Base
• 2007/6 Operating Profit up 34% with Revenue up 31%
• 1H2008/7 Operating Profit up 55% with Revenue up 35%
RSA46%
Asia10%
USA1%
UK11%
France5%
Spain1%
Germany7%
Africa19% Other
0%
1H 2008
Growing Our Business & Profitability
... Geographic dependence reduced
-
1,000
2,000
3,000
Jun
04
Dec
04
Jun
05
Dec
05
Jun
06
Dec
06
Jun
07
Dec
07
Jun
08
Financial period
Re
ve
nu
e (
R'm
)
(50)-
50
100150200
250300350
400450
Op
era
tin
g p
rofi
t (R
'm)
R2,79 Billion
Growing Our Business & ProfitabilityGrowing Our Business & Profitability
Products and RSA Market Position
No1
No2
No3
No2
No6
No6
No2
No1
No3
No1No1
No3
No1
CURRENTLY
TARGET TARGET
No1
Growing Our Business & ProfitabilityGrowing Our Business & Profitability
Contribution to Turnover - Products
New Units68%
Parts12%
Branded Units10%
Kits1%
Used5%
Service3%
Rental1% 2008 YTD
R2,79 Billion

8/12/2008
5
Growing Our Business & ProfitabilityGrowing Our Business & Profitability
Industry Segmentation / Diversity
Construct28%
Forestry6%
Government4%
Industrial6%
Mining27%
Plant Hire27%
Quarrying2%YTD 2008
R2,79 Bn
Growing Our Business & Profitability Growing Our Business & ProfitabilityGrowing Our Business & Profitability
Business DriversInfrastructure – Civil Construction
Mining – Commodities
Energy – Coal (Driven by Oil)
Growing Our Business & ProfitabilityGrowing Our Business & Profitability
Civil Infrastructure Spending
0
5000
10000
15000
20000
25000
30000
35000
40000
70 72 74 76 78 80 82 84 86 88 90 92 94 96 98 20 2 4 6 8 10 12 14 16 18 20 22 24
Civil Engineering Turnover: 2025
CIVOPT CIVPES Civil Reality
Growing Our Business & ProfitabilityGrowing Our Business & Profitability
Private Sector - RSA Projects
– 87 Projects announced worth R134.9 bill
– Manufacturing R68.2 bill
– Mining R32 bill for next 5 years
– Most large Construction Groups enjoying
record order books
Nedbank Project Listing

8/12/2008
6
Growing Our Business & ProfitabilityGrowing Our Business & Profitability
Eskom’s capacity project’s funnel is well defined
Delta
Build1000
800
1775
165Feasibility, Business
Case, Contract Concluding
Pre-feasibility
Research Opportunity
Identification
PBMR
1500
Echo
2100
Alpha
1128
Grootvlei
1520
Camden
300
Arnot P1&P2
November
600
Juliett
3500
Oscar
6000
Mike
1000
Lima
1332
Hotel
600
India
Romeo
1600
Sierra
1050
OCGT
1600
*Papa
1300
Kilo
4000
Golf
3600
4000
Bravo
961
Komati UCG
14 575 MW 20 800 MW 10 382 MW
1050
Quebec
800
Tango
90
ContingencyProgramme
2000
112
2100
Charlie
4000
Foxtrot
Concentrating
Solar
100
-Coal
W -Hydro
-Nuclear
-Gas-Coal
-Coal
W - Hydro
- Nuclear
- Gas
- Coal
Solar-ContingencyProgramme-
SADC Studies
500
Transmission-
Songo Apollo
HVDC Link Capacity Upgrade
1775
* Possible 2400MW Mid
Merit
Trans KalahariInterconnector
0
0
Discard Coal
0
New Coal Supply
0
Growing Our Business & ProfitabilityGrowing Our Business & Profitability
Global Commodities
Growing Our Business & ProfitabilityGrowing Our Business & Profitability
Global Mining & Energy – Positive Future
Commodity curve still at all time High
Growing energy needs – drives Coal production
Copper, Platinum and other base Metals
Prolonged underinvestment in Key sectors
Growing Our Business & Profitability Growing Our Business & ProfitabilityGrowing Our Business & Profitability
Growth Strategy ...
Growing Our Business & Profitability
8/12/2008
7
Growing Our Business & ProfitabilityGrowing Our Business & Profitability
Growth Strategy
Global
Business
Construction
Mining
Optimal
BBBEE
Position
Strong Partners
Competitive
Products
Product and Geographic
Diversity – Reduces risk of dependence
on any one region
Focused on medium
To long term growth
Sectors
Max Points
Customers BenefitDeere, Hitachi
and Liebherr in Europe
Best in Class Features
Fuel Efficiency
Innovative Design
Economy of Scale
Currency benefit
Growing Our Business & ProfitabilityGrowing Our Business & Profitability
Priorities
Our Customers
Our People
Quality/ Brand
Working Cap Optimisation
Cost Management
VISION
LEADING OFF-HIGHWAY TRUCK
MANFACTURER
Growing Our Business & ProfitabilityGrowing Our Business & Profitability
Working Capital Optimisation
• Short Term (R200 million)
• Order Book for next 6 months at high level
• 4th Quarter production rate reduced – however production tonnage at highest level – mix
• Medium Term (R120 million)
• Reduction of inventory buffers (tyres, steel etc)
• Improved Forecasting – new tools
• Longer Term (R250 million)
• Lean Initiatives• Greater Localisation – Reduction of GIT
• Distribution Channel Improvements
Maximising management of inventory whilst not losing market and plant park opportunities
Growing Our Business & ProfitabilityGrowing Our Business & Profitability
Worldwide Machinery Industry
Global markets expected to be flat 2009
Growing Our Business & Profitability
Source: Global Competitor
8/12/2008
8
Growing Our Business & ProfitabilityGrowing Our Business & Profitability
Growing our Business
• New Series ADT Range (2010, 2012 & 2014)
• Full Line Compaction Machines
• Expanded Range of Deere Products
• New Markets – Middle East and East Europe
• Investment in LTRS (Lifetime Revenue Stream)
• Investment in Manufacturing Capacity
• SAP + Other business systems
29Growing Our Business & ProfitabilityGrowing Our Business & Profitability
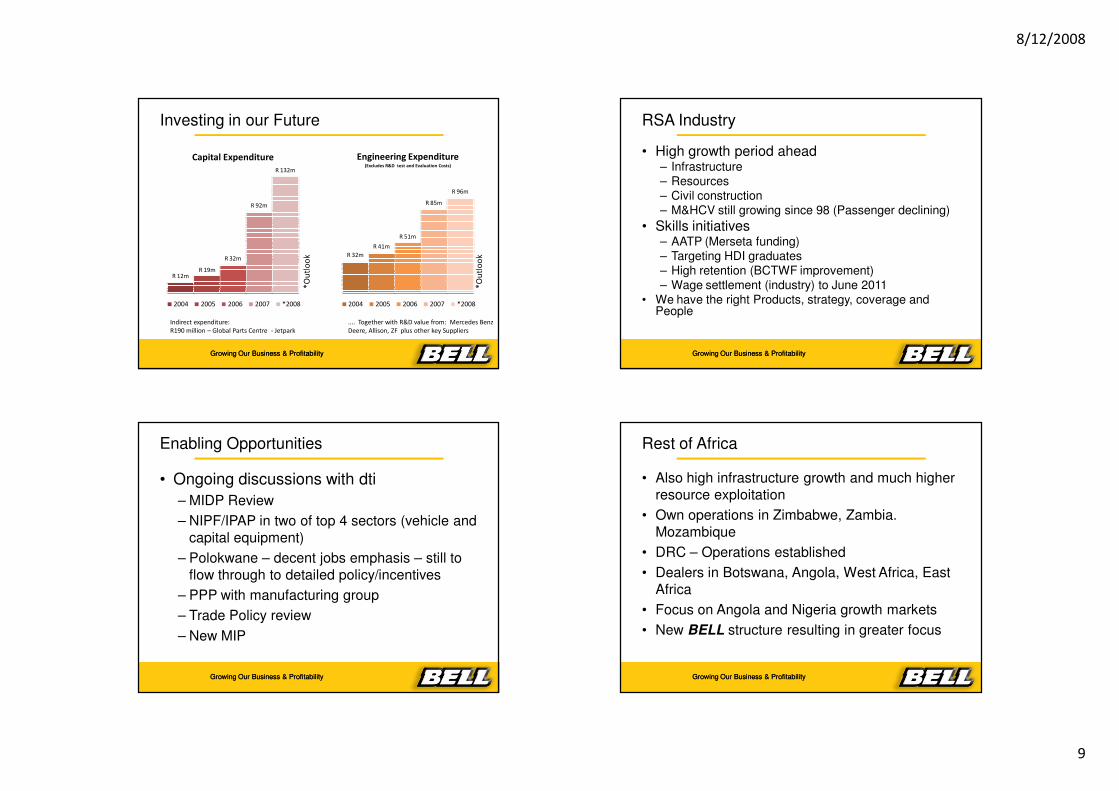
Jetpark - Global Parts Centre
Total Cost of +R220 millionProject to be complete by December 2008Will process R70-80 Million worth of Parts per monthSAP launched in April 2008 will include WMS
Growing Our Business & ProfitabilityGrowing Our Business & Profitability
Key Risk Analysis
• Major market changes
• Loss of major client, dealer
• Bad debt
• Skills availability
• Quality
• Power
• Delinquent supplier
• Physical
• Injuries
• Forecasting
• Customer service audits
• Credit management
• Retention and development, succession planning
• Continuous improvement, process audits, training
• Generators installed at Richards Bay factory
• Liaising, develop alternatives
• Insurance, regular assessment
• Focus on safety, training, audits
Growing Our Business & ProfitabilityGrowing Our Business & Profitability
Powering Ahead ….
Growing Our Business & Profitability
8/12/2008
9
Growing Our Business & ProfitabilityGrowing Our Business & Profitability
Investing in our Future
R 12mR 19m
R 32m
R 92m
R 132m
Capital Expenditure
2004 2005 2006 2007 *2008
*O
utl
oo
kR 32m
R 41m
R 51m
R 85m
R 96m
Engineering Expenditure(Excludes R&D test and Evaluation Costs)
2004 2005 2006 2007 *2008*
Ou
tlo
ok
.... Together with R&D value from: Mercedes Benz
Deere, Allison, ZF plus other key Suppliers
Indirect expenditure:
R190 million – Global Parts Centre - Jetpark
Growing Our Business & ProfitabilityGrowing Our Business & Profitability
RSA Industry
• High growth period ahead – Infrastructure– Resources– Civil construction– M&HCV still growing since 98 (Passenger declining)
• Skills initiatives– AATP (Merseta funding)– Targeting HDI graduates– High retention (BCTWF improvement)– Wage settlement (industry) to June 2011
• We have the right Products, strategy, coverage and People
Growing Our Business & ProfitabilityGrowing Our Business & Profitability
Enabling Opportunities
• Ongoing discussions with dti
– MIDP Review
– NIPF/IPAP in two of top 4 sectors (vehicle and
capital equipment)
– Polokwane – decent jobs emphasis – still to
flow through to detailed policy/incentives
– PPP with manufacturing group
– Trade Policy review
– New MIP
Growing Our Business & ProfitabilityGrowing Our Business & Profitability
Rest of Africa
• Also high infrastructure growth and much higher
resource exploitation
• Own operations in Zimbabwe, Zambia.
Mozambique
• DRC – Operations established
• Dealers in Botswana, Angola, West Africa, East
Africa
• Focus on Angola and Nigeria growth markets
• New BELL structure resulting in greater focus

8/12/2008
10
Growing Our Business & ProfitabilityGrowing Our Business & Profitability
European Network +65 Dealers
• France – good prospects
• Spain – Market slowed
• Germany – Strongest European market
• UK – Pricing pressure
• Rest of Europe – Dealer network growth
• Eastern Europe/CIS developing
• Middle East thrust – Growing support Infrastructure
• North African Opportunities
Growing Our Business & ProfitabilityGrowing Our Business & Profitability
Medium Term Outlook (5-6 Years)
• Expect growth in World economy – and positive environment for our end Markets
• BELL No25 of 250 manufacturers globally
• Investment in new Products and Technology will ensure our Growth
• Focus on Safety, Quality, Cost and Lean principles will keep us Globally competitive
• Delivering on our Strategy will be rewarding for all our Stakeholders
• Global foothold will be strengthened and expanded
Growing Our Business & ProfitabilityGrowing Our Business & Profitability
Concluding….
• BELL is a South African Group that is competing successfully in Global markets.• We add value locally to SA raw materials and create many entry level and skilled
jobs directly and indirectly.
• BELL will :– Continue to strengthen its Distribution channels
– Invest in its People and Manufacturing Capacity– Grow its Global machine park and “Life Time Revenue Stream”– Lead in Technology of its core products
• BELL will benefit from the global Commodity and Energy boom that is expected continue. Together with domestic infrastructure spend.
– Supported by the large and sustained increase in demand for commodities largely from the Far East.
– Planned infrastructure spend in Southern Africa and Middle East– Coal demand driven by record Oil prices– New Market Opportunities to the North
Growing Our Business & ProfitabilityGrowing Our Business & Profitability
Contact Details:
Gary Bell: [email protected]
Phone: 035 9079100www.bellequipment.com
Thank You
QUESTIONS ?