financial risks due to long-term care
TRANSCRIPT

FINANCIAL RISKS DUE TO LONG-TERM CARE
August 15, 2016 Constantijn W.A. Panis, PhD Advanced Analytical Consulting Group, Inc.213-784-6400 [email protected]
Michael J. Brien, PhD Deloitte Transaction and Business Analytics LLP 202-378-5096 [email protected]

i
SUMMARY
This report characterizes the current landscape and outlook of long-term care utilization, its costs, and its financing through out-of-pocket payments, private insurance, and public insurance. We draw on academic and trade literature and present new statistics based on primary research. In particular, we analyze cost reports of skilled nursing facilities (SNFs), Form 5500 Annual Return/Report of Employee Benefit Plan (“Form 5500”) filings, and the Health and Retirement Study (HRS). Approximately one-half of Baby Boomers are projected to require paid, formal long-term care in the home, an adult day care center, an assisted living facility, or a nursing home. Paying for care out of pocket will rapidly exhaust retirement savings of many Americans, forcing them to eventually rely on Medicaid. Indeed, more than one-half of nursing home patients who have been resident for five years or longer are Medicaid beneficiaries. The size of the Baby Boom generation is expected to drive up demand for and prices of long-term care, creating a troublesome outlook for the elderly’s personal finances and the Medicaid program. In light of the strained finances of Medicaid and other public payors, potential solutions will likely involve expanded private insurance. At present, only about 7 million Americans are covered by long-term care insurance. We discuss several options for reducing risks for insurers and consumers alike, public-private partnerships which incentivize private insurance, and policy options to promote long-term care insurance benefits in the workplace. However, fundamental economic interactions between private insurance and the Medicaid program pose a challenge to simultaneously preserving a safety net for low-income Americans and ensuring fiscal sustainability of the Medicaid program.

ii
CONTENTS
Abbreviations ................................................................................................ ii
1. Introduction ............................................................................................. 3
2. Literature and External Statistics on Utilization and Costs ....................... 3
3. Cost Reports of Skilled Nursing Facilities ................................................. 9
4. Long-Term Care Insurance ..................................................................... 11 State Medicaid Partnership Programs .......................................................... 15 Employer-Provided Long-Term Care Benefits ................................................ 16
5. Analysis of Health and Retirement Study Data ....................................... 18
6. Policy Implications ................................................................................. 26
References .................................................................................................. 28
Appendix A. Median Prices of Long-Term Care Services, by State (2015) ... 31
Appendix B. Sample Long-Term Care Insurance policy ............................... 33
Disclaimer ................................................................................................... 37
ABBREVIATIONS
AALTCI American Association for Long-Term Care Insurance ADL Activity of Daily Living BLS Bureau of Labor Statistics CBO Congressional Budget Office CMS Centers for Medicare and Medicaid Services HIPAA Health Insurance Portability and Accountability Act of 1996 HCRIS Healthcare Cost Report Information System HRS Health and Retirement Study IADL Instrumental Activity of Daily Living LTC Long-term care LTCI Long-term care insurance LTSS Long-term services and support NAIC National Association of Insurance Commissioners NCHS National Center for Health Statistics SNF Skilled Nursing Facility
3
1. INTRODUCTION
Caring for the elderly and the disabled in the United States is posing increasingly large financial risks for patients, their family, and the Medicaid and Medicare programs. Medical costs have outpaced general inflation over the past four decades (BLS 2016) and retiring Baby Boomers are expected to increase demand for long-term care (LTC) services. This report documents long-term care utilization, costs, and financing mechanisms, and reviews policy options for addressing long-term care’s financial risks. We draw on a variety of sources including external literature and primary analyses of the cost reports of skilled nursing facilities (SNFs), Form 5500 Annual Return/Report of Employee Benefit Plan (“Form 5500”) filings, and the Health and Retirement Study (HRS). Mirroring the gradual increase in need for assistance as the body ages, long-term care encompasses a range of services. Much of it is non-medical in nature, such as assistance with cleaning, shopping, bathing, dressing, or eating. Services may be provided in the home by relatives or friends, homemakers, or home health aides; at adult day care centers; at assisted living facilities; at hospices, or at nursing homes.1 Given the wide range of services, some authors refer to long-term care as long-term services and support (LTSS). This document uses the two terms interchangeably. The remainder of this report is organized as follows. Section 2 summarizes academic and trade literature and provides external national statistics on long-term care utilization and costs. Section 3 adds to these statistics from our own analysis of annual cost reports that skilled nursing facilities (SNFs) submit to the Medicare program of the Centers for Medicare and Medicaid Services (CMS). Section 4 discusses trends in long-term care insurance (LTCI) and its typical features. It also includes our analysis of Form 5500 filings to shed a light on employer-sponsored long-term care insurance. Section 5 presents our analysis of HRS data with respect to long-term care utilization and its financial consequences. Section 6 concludes with a discussion of policy implications.
2. LITERATURE AND EXTERNAL STATISTICS ON UTILIZATION AND COSTS
In the United States, long-term care services are provided informally, by family and friends, and formally, by about 12,200 home health agencies, 4,800 adult day services centers, 22,200 assisted living and similar residential care communities, 15,700 nursing homes, and 3,700 hospices (NCHS 2013). On a typical day in 2011 or 2012 (NCHS 2013), approximately: 1 This document uses the terms Skilled Nursing Facility and nursing home interchangeably. Some authors make a distinction, where SNFs are certified and covered by Medicare and offer skilled medical and rehabilitative services, whereas nursing homes offer custodial care. Typically, facilities offer both types of services.

4
4.7 million patients received services from home health agencies, 273,000 participants were enrolled in adult day services centers, 713,000 residents were living in residential care communities, 1.4 million residents were living in nursing homes, and 1.2 million patients received services from hospices.
Demand for LTC services in the United States is expected to grow substantially in the coming decades, largely due to the aging of the population and increased prevalence of disability among middle-aged populations. These factors increase the share of the population that has functional limitations and may require assistance performing everyday activities. The baby-boom generation, a cohort of 75 million individuals, was born between 1946 and 1964. In 2016 the oldest baby-boomers are turning 70 years old, and by 2031, they will turn 85 years old. The aging of this generation is causing significant shifts in the age distribution of the population (CBO 2013). In 2000, the share of the U.S. population that was 65 or older was 12%, but by 2050 that share is expected to exceed 20%. Over the same time period, the share of the population age 85 or older is expected to grow from 1.5% to 4.1%. Functional limitations and disability tend to increase with age. For example, from 2000 to 2010, 18% of 65-74 year olds living in the community reported difficulty performing Activities of Daily Living (ADLs) or Instrumental Activities of Daily Living (IADLs), while 54% of those aged 85 or older reported difficulties performing at least one of these (CBO 2013).2 Similarly, the Census Bureau (2012) found that, excluding those in nursing homes, the fraction of people reporting needing assistance with activities of daily living increased with age from 7% among 65-69 year-olds to 30% among people age 80 or older (Table 1). As noted in their report, the magnitude of disability estimates would likely be higher if the nursing home population were included.
Table 1. Disability Prevalence and the Need for Assistance among the Non-Institutionalized Population by Age, 2010
2 ADLs include bathing, dressing, eating, walking, transferring out of a bed or a chair, and using the toilet; IADLs include preparing meals, shopping, using the telephone, managing money, and taking medications.
AgeAny
disabilitySevere
disabilityNeeds
assistanceUnder 15 8.4% 4.2% 0.5%15 to 24 10.2% 5.3% 1.4%25 to 44 11.0% 7.3% 2.0%45 to 54 19.7% 13.8% 3.6%55 to 64 28.7% 20.4% 6.0%65 to 69 35.0% 24.7% 6.9%70 to 74 42.6% 29.6% 10.8%75 to 79 53.6% 37.5% 15.4%80 and over 70.5% 55.8% 30.2%Source: Census Bureau (2012). "Any disability" indicates difficulty to perform ADLs/IADLs or similar activities, and "severe disability" indicates inability to perform such activities. For details see Figure 1 in Census Bureau (2012).

5
While a general consensus has formed that the health of the elderly improved on several measures throughout the 1980s and 1990s, there has been a surge in disability among younger generations, in particular those under 50 years old (Lakdawalla et al., 2003). While the root causes have not been fully investigated, there is some evidence that obesity and such chronic illnesses as asthma and diabetes may be part of the problem.3 This will likely contribute to an even greater increase in disability rates and institutionalization in a SNF in the coming decades than as suggested by projected aging of the population. When analyzing cohorts aged 65 and older in the late 1990s, Lakdawalla et al. (2004) forecast that the younger cohorts will likely have a higher rate of disability at older ages than the older cohorts did. This evidence aligns with increasing levels of disability among 50- to 59-year olds between 1984 and 1996.4 The aging of the population and the growth in disability among the middle-aged is likely to lead to increased future demand for both informal and formal LTC services. The Congressional Budget Office (CBO 2013) estimated that in 2011 the economic value of informal and formal LTC services for elderly people in the United States was $426 billion, of which $234 billion (55%) was in the form of informal care.5 The remaining $192 billion was spent on institutional care (31% of total) and community-based care (14% of total).6 While 31% of the total economic value was in institutional care, it related to only 18% of elderly people who were receiving LTC services in 2010. This reflects the high cost of institutional nursing care relative to community-based care; see Table 4 below. Four-out-of-five (80%) of elderly people who received LTC services lived in private homes, receiving informal care or community-based care in the form of home health aides, visits to adult day care facilities, and other non-institutional care. Based on a microsimulation of people from around age 65 in 2015 to the end of their lives, Favreault and Dey (2016) forecast the ADL limitations of future elderly and their need for long-term care services. The goal of this exercise was to better understand the near-term future trends in this area and to forecast the average level of spending required. Specifically, the authors focused on the need for long-term services and support because of a disability that meets the criteria set in the 1996 3 Other explanations include changes in disability insurance laws (greater incentives to report disabilities that otherwise went unreported) and technological advances in medicine (new treatments can delay death for those who are chronically frail and otherwise would have died at a younger age). 4 The forecasts of Lakdawalla et al. (2003) are not without some controversy. Manton (2003) argued that the use of certain data and assumptions in Lakdawalla et al. (2003) resulted in an incorrect conclusion. He expected nursing home use will continue to decline. 5 The CBO calculated this figure by multiplying the average wage earned by a home health aide ($21 per hour) by the 11.2 billion hours of donated care extrapolated from responses to the HRS. It did not account for forgone earnings of the caregiver in excess of $21 per hour. 6 The CBO defines the economic value of institutional care as the cost of stays, including room and board as well as assistive services, in skilled nursing facilities, nursing homes, and nursing facilities housed inside continuing care retirement communities. It defines the economic value of community-based care as the cost of assistive services provided in all other settings, including private homes, adult day care facilities, and facilities that are not nursing homes.

6
Health Insurance Portability and Accountability Act (HIPAA), namely a need for assistance with at least two ADLs that is expected to last at least 90 days or a need for substantial supervision for health and safety threats due to severe cognitive impairment. The study found that 52% of people who turn 65 years old in 2015-2019 will at some time in their lives need (informal or formal) long-term services and support because of such a disability. Excluding informal care by relatives or friends, 47% will need formal long-term services and support, including 23% who will need it for less than one year and 6% who will need it for five years or more (see Table 2). Including elderly who will not need any formal care, this cohort will need formal assistance for one year on average. Women are more likely to need assistance than men (52% versus 42%), people with lower incomes are somewhat more likely to need assistance than those with higher incomes, and the need for assistance is, as expected, greater for those in poor health than those in good health at age 65.
Table 2. Projected Use of Paid LTSS for Persons Turning 65 in 2015-2019, by Gender, Income Quintile and Self-Reported Health Status at Age 65
Favreault and Dey (2016) further projected that formal long-term services and support will cost an average of $138,100 per person turning 65 in 2015-2019, expressed in 2015 dollars. This average translates into $266,000 per user of formal care. Of this amount, community-based care will cost 53% and care at nursing facilities 47%. Assuming current finance mechanisms, the majority (52%) of formal long-term services and support is expected to be paid out of pocket. The authors expect Medicare to pay 10%, Medicaid 34%, and private insurance 3%.
Distribution for all
None <1 year
1.00-1.99 years
2.00-4.99 years
>5 years
GenderMen 0.7 42.0 58.0 22.2 8.5 8.0 3.4Women 1.3 52.1 47.9 23.1 9.5 11.2 8.3
Income Quintile at Age 65Lowest 1.2 49.0 51.0 20.7 9.1 11.2 8.1Second 1.2 48.1 52.0 21.1 8.7 11.0 7.3Middle 1.1 48.7 51.3 22.5 9.7 9.6 6.8Fourth 0.9 45.2 54.8 22.7 8.4 8.7 5.4Highest 0.8 46.3 53.7 24.9 9.2 8.8 3.5
Health Status at Age 65Excellent 1.0 46.8 53.2 24.0 7.6 9.9 5.4Very good 0.9 46.1 53.9 23.1 8.7 9.5 4.8Good 1.1 47.1 52.9 22.1 8.4 10.0 6.6Fair/poor 1.1 49.0 51.0 22.0 10.8 9.4 6.7
Marital Status at Age 65Married 0.9 45.8 54.2 23.2 8.6 8.9 5.1Unmarried 1.2 50.0 50.0 21.5 9.9 11.2 7.5Total 1.0 47.2 52.8 22.7 9.0 9.7 5.9
Source: Favreault and Dey (2016).
Average years of
formal LTSS use
Percent with any
formal LTSS use

7
While different sources suggest different payor mixes, financing long-term care at nursing homes is largely through government-funded Medicaid and Medicare programs.7 According to a study by The Kaiser Family Foundation, Medicaid was the primary payor for 63% of nursing facility residents in 2011, 14% were primarily covered by Medicare, and 22% were private payors (Kaiser Family Foundation 2013). The Kaiser study was based on the Online Survey, Certification, and Reporting (OSCAR) system, a database that contains detailed information on Medicaid and Medicare certified nursing facilities. Our own analysis of a different but related data source, SNF cost reports, suggests that Medicaid was the primary payor for 53% of resident-days in 2014, Medicare for 13%, and private payors for 34% (see Section 3), with only minor changes in this distribution since 2011. The daily reimbursement of SNFs by Medicare tends to be higher than that by Medicaid. Mostly depending on a patient’s care needs, Medicare payments range from approximately $195 to $803 per day in 2016 (CMS 2015). Medicaid payments vary by state and are typically a flat rate per day, irrespective of care needs, with limited adjustments for cost differences across geographies. For example, in Florida in 2015, the 10th and 90th percentiles of daily reimbursements were approximately $203 and $257, respectively (authors’ calculations based on Florida AHCA 2015). For formal care as a whole, CBO (2013) found that out of the $192 billion in payments for formal care in 2011, $68 billion was paid through Medicare, $60 billion through Medicaid, $39 billion was paid out of pocket (including beneficiaries’ cost sharing for Medicare and Medicaid), and $12 billion was covered through private insurance. The remaining $12 billion were from such other sources as the Department of Defense, the Department of Veterans Affairs, and charitable donations. See Table 3, which also shows the expenditures for community-based and institutional settings (defined in footnote 6).
Table 3. Expenditures for Long-Term Care Services for Elderly People (2011)
Payors differ in their length of coverage. For example, Medicare and private health insurance offer short-term coverage for post-acute care rehabilitative services in the form of nursing home stays and home health visits (about three months coverage or less). Medicaid and private LTC insurance offer much longer coverage periods (three-
7 Medicare offers limited coverage for skilled nursing care in a SNF. Among other restrictions, the stay must be preceded by an acute-care hospital stay. If eligibility conditions are met, Medicare generally pays the full cost for up to 20 days and requires co-insurance payments of $161 per day (in 2016) for days 21-100. It does not cover stays beyond 100 days.
Source of paymentCommunity-Based
($ bn)Institutional
($ bn)Total Care
($bn)Medicare 31 37 68Medicaid 20 40 60Out of Pocket 3 36 39Private Insurance 2 10 12Other 1 11 12Total 58 134 192Source: CBO (2013).

8
to five-year terms) and will cover without a previous acute health episode. According to the CBO (2013), the distribution of LTC insurance and Medicaid coverage for the elderly population living in the community varies by level of disability. Those with three or more functional limitations are five times more likely to be covered by Medicaid (24%, on average, from 2000 to 2010) than those with no functional limitations (5%). While only 5% of those with no functional limitations were Medicaid beneficiaries, 15% were covered by LTC insurance. As shown in Table 4, the costs of long-term care can be substantial. The nationwide median cost of in-home assistance by a homemaker or home health aide was $20 per hour in 2015 (Genworth 2015). Assuming four hours of assistance per day, five days a week, this amounts to $20,800 annually.8 The median rate for adult day care was $69 per day ($17,940 per year at five days per week). An intermediate level of personal care and health services, less extensive than in a nursing home, is offered by assisted living facilities, which charge a median of $3,600 per month ($43,200 per year). Finally, the median cost of nursing homes was $220 per day ($80,300 per year) for a semi-private room and $250 per day ($91,250 per year) for a private room. These rates reflect prices that are payable out of pocket or with private insurance and may differ from those reimbursed by public programs.
Table 4. Nationwide Median Prices of Long-Term Care Services (2015)
According to Genworth (2015), the costs for institutionalized long-term care have outpaced those for in-home care. From 2010 to 2015, nursing home costs increased by 3.5%-4.0% annually, compared with 1.0%-1.6% annually for homemakers and home health aides. Similarly, CBO (2013) reported annual nursing home cost increases of 4.0%-4.5% between 2002 and 2012, compared with 1.6% annually for home health aides. Table 4 displays national median costs, but LTC costs vary widely across states. Alaska tends to have the highest costs, with the statewide median cost of a private room in a nursing home exceeding the national median by 208%. Other states with very high costs include Connecticut (+74%), Massachusetts (+53%), New York (+50%), and Hawaii (+48%), while relatively low-cost states include Oklahoma (-34%), Missouri (-33%), Louisiana (-32%), Kansas (-28%), and Arkansas (-28%). See Appendix A for a list of median LTC prices by state.
8 Home health care is typically provided on a part-time basis. MetLife (2012), which compiled similar price data as Genworth (2015), assumed four hours per day, five days per week, 52 weeks per year to annualize its figures.
Rate AnnualNursing home, private room $250 per day $91,250Nursing home, semi-private room $220 per day $80,300Assisted living facility $3,600 per month $43,200Adult day care $69 per day $17,940Home health aid care $20 per hour $20,800Source: Genworth (2015).Annual rates for home care are based on 4 hours per day, 5 days per week; annual rates for adult day services are based on 5 days per week.

9
3. COST REPORTS OF SKILLED NURSING FACILITIES
SNFs that participate in the Medicare program are required to annually submit a cost report to CMS. Among many other items, these cost reports list the number of resident-days primarily paid for by Medicare, Medicaid, and all other payors combined (mostly LTC insurance and self-payments). Hospital-based SNFs report on the cost report of the hospital; freestanding SNFs report on a separate report.9 Figure 1 shows the number of resident-days reported by all freestanding SNFs in the United States that participate in the Medicare program. The number of resident-days is converted into resident-years to show the average number of people who are resident at SNFs during the year. The number has been fairly stable at approximately 1.35 million from 2008 through 2014.
Figure 1. Number of Resident-Years Reported by Freestanding SNFs, by Primary Payor and Year
The payor mix has also been fairly stable over this period. Approximately 13% of resident-days are primarily paid by Medicare, 53% by Medicaid, and 34% by other payors (Figure 2). These figures relate to resident-days. In terms of dollar expenditures, CBO (2013) found Medicare paid for 28% of institutional care services,
9 Medicare cost reports are stored in the Healthcare Cost Report Information System (HCRIS), available at https://www.cms.gov/Research-Statistics-Data-and-Systems/Downloadable-Public-Use-Files/Cost-Reports.
Medicare
Medicaid
Other
0.0
0.3
0.6
0.9
1.2
1.5
0.0
0.3
0.6
0.9
1.2
1.5
Num
ber
of r
esid
ent-
year
s (m
illio
ns)
2000 2001 2002 2003 2004 2005 2006 2007 2008 2009 2010 2011 2012 2013 2014Source: CMS Healthcare Cost Report Information System.

10
Medicaid for 30%, and other sources for 43% (see the second column of Table 3 above).
Figure 2. Distribution of Primary Payor of Resident-Years Reported by Freestanding SNFs, by Year
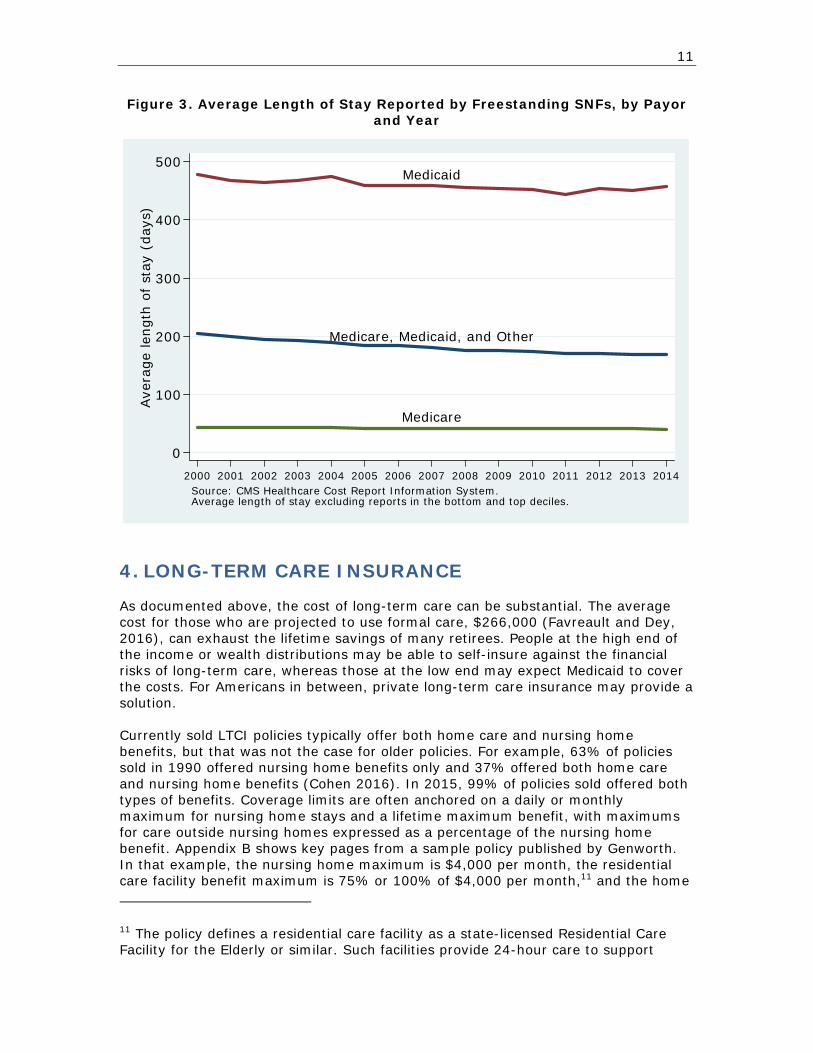
Figure 3 shows the average length of stay as reported by freestanding SNFs on their Medicare cost reports.10 As expected given Medicare’s coverage of at most 100 days, the average length of resident stays that were primarily paid by Medicare was shorter (39 days in 2014) than that of stays primarily paid by Medicaid (460 days in 2014). SNFs are not required to report the average length of stays that were primarily paid for by private payors. Instead, only the average length of stay across all primary payors is reported (165 days in 2014). Figure 3 also shows that average lengths of stay have generally decreased somewhat since 2000.
10 Some SNFs reported implausibly short or long average lengths of stay. We excluded the bottom and top deciles of average lengths of stay in our calculations. The averages are weighted by reported number of resident-days.
Medicare
Medicaid
Other
0%
20%
40%
60%
80%
100%
0%
20%
40%
60%
80%
100%
200020012002200320042005200620072008200920102011201220132014Source: CMS Healthcare Cost Report Information System.
11
Figure 3. Average Length of Stay Reported by Freestanding SNFs, by Payor and Year
4. LONG-TERM CARE INSURANCE
As documented above, the cost of long-term care can be substantial. The average cost for those who are projected to use formal care, $266,000 (Favreault and Dey, 2016), can exhaust the lifetime savings of many retirees. People at the high end of the income or wealth distributions may be able to self-insure against the financial risks of long-term care, whereas those at the low end may expect Medicaid to cover the costs. For Americans in between, private long-term care insurance may provide a solution. Currently sold LTCI policies typically offer both home care and nursing home benefits, but that was not the case for older policies. For example, 63% of policies sold in 1990 offered nursing home benefits only and 37% offered both home care and nursing home benefits (Cohen 2016). In 2015, 99% of policies sold offered both types of benefits. Coverage limits are often anchored on a daily or monthly maximum for nursing home stays and a lifetime maximum benefit, with maximums for care outside nursing homes expressed as a percentage of the nursing home benefit. Appendix B shows key pages from a sample policy published by Genworth. In that example, the nursing home maximum is $4,000 per month, the residential care facility benefit maximum is 75% or 100% of $4,000 per month,11 and the home 11 The policy defines a residential care facility as a state-licensed Residential Care Facility for the Elderly or similar. Such facilities provide 24-hour care to support
Medicare
Medicaid
Medicare, Medicaid, and Other
0
100
200
300
400
500Ave
rage
leng
th o
f st
ay (
days
)
2000 2001 2002 2003 2004 2005 2006 2007 2008 2009 2010 2011 2012 2013 2014Source: CMS Healthcare Cost Report Information System.Average length of stay excluding reports in the bottom and top deciles.

12
and community care benefit maximum is 50% or 100% of $4,000 per month,12 depending on the generosity of the policy purchased. The total benefit payments are subject to a lifetime cap of $240,000. Benefit maximums may or may not be increased over time to protect against inflation. The sample policy shows benefit increases of 5% per year. Policies are also often subject to an elimination period, also known as a deductible period. For example, an elimination period of 90 days can imply that benefits are paid only after 90 days following a first covered expense while chronically ill. LTCI policies can be in force for decades. Most policyholders (54%) applied when they were 55-64 years old, well before they expected to need benefits (AALTCI 2015). Policies are typically guaranteed renewable at an annual premium that is designed to be constant for the duration of the policy contract, even with annual benefit increases and even if a claim was made. However, while designed to be constant for the duration of the contract, the premium may be changed for a variety of reasons, including actual or estimated experiences of all holders of a particular policy form. It is our understanding that premium changes require the approval of state insurance regulators. Premiums on individual policies may change and indeed they have changed. Most insurers’ LTCI policies issued before the mid-2000s have seen adverse experience when compared to their original pricing assumptions. Rising claims, low mortality and lower than expected lapses have led to higher prices often unaffordable to a large segment of the affected population (Karapiperis and Nordman, 2016). According to the chief executive of Genworth Financial, which has a long-term care insurance market share of roughly 35%, average premium increases of 50% were needed to break even on policies issued before 2002 (Carrns 2014). State regulators appear to have been generally receptive to proposed rate increases. The Federal Long Term Care Insurance Program (FLTCIP) offers voluntary private LTCI to Federal employees, who are responsible for the full premiums. It, too, appears to have underestimated the costs of providing benefits. In November 2016, FLTCIP premiums are scheduled to increase by an average of 83% (Davidson 2016). Cohen (2016) documented that policies sold in 2015 offered an average daily benefit amount for nursing homes of $159 and for home care of $152. The lifetime cap supported, on average 3.8 years of nursing home care. Three-out-of-four policies featured annual benefit increases to protect against inflation. The average deductible period was 93 days. The average annual premium was $2,772. The policies generally appear less generous than those sold during the 1990s. For example, the lifetime cap in 1990 supported on average 5.6 years of nursing home care, the average deductible period was 20 days, and the average premium $1,071 (about $1,942 in 2015 dollars).
needs resulting from impairment in ADLs or in cognitive ability, provide three meals per day, have agreements to ensure that residents receive the medical care services of a physician or nurse in case of emergency, and meet certain other criteria. 12 Under the sample policy, home and community benefit care benefits include adult day care, nurse and therapist services, home health care, personal care services, and homemaker services.

13
Table 5 shows average annual premiums for basic LTC insurance, by age of the insured at the time the policy was purchased (NAIC 2013). Premiums increase with age, roughly tripling from $4,349 for people age 50 to $13,500 for those buying at age 75 for inflation-protected policies with a 4-year maximum benefit period.
Table 5. Average Annual Premium for Basic Long-Term Insurance, $200 Daily Benefit (2013)
Most claimants of LTC benefits are at least in their 80s when they start using covered services. About 2% are under age 60, 9% are in their 60s, 25% in their 70s, and 64% age 80 or older (AALTCI 2015; see Table 6).
Table 6. Age of Claimant for New Claims Opened (2012)
About one-half of new claimants receive in-home care, one-in-five receive benefits for assisted living, and about 31% moved into a nursing home (AALTCI 2015; see Table 7).
Table 7. Newly Opened Long-Term Care Insurance Claims Paid For
According to the National Association of Insurance Commissioners (NAIC 2015), 7.2 million people were covered by LTC insurance in 2014, and the American Association for Long-Term Care Insurance (AALTCI 2015) estimated that 8.1 million Americans
4 Years of Benefits 6 Years of Benefits Lifetime Benefits50 $4,349 $5,083 $7,34760 $5,331 $6,269 $8,92770 $9,206 $10,549 $15,07075 $13,500 $15,157 $20,930
4 Years of Benefits 6 Years of Benefits Lifetime Benefits50 $1,294 $1,514 $1,99760 $2,057 $2,426 $3,30770 $4,914 $5,834 $7,77775 $8,146 $8,291 $12,337
Source: NAIC (2013).
Age When Buy
With Inflation Protection 5% Compounded Per Year
With No Inflation Protection—Benefit Stays at $200 per Day
Age PercentUnder 50 0.3%50 to 59 1.9%60 to 69 8.7%70 to 79 25.4%80 and over 63.7%Source: AALTCI (2015).
Service PercentHome Care 51.0%Assisted Living 18.5%Nursing Home 30.5%Source: AALTCI (2015).
14
were insured for long-term care in 2014. About 255,000 policyholders were receiving benefits in 2014 (NAIC 2015). Perhaps in response to unexpected losses to insurance companies and unexpected rate increases to consumers, the market landscape for long-term care insurance has shifted dramatically over the past decade. There is a trend toward smaller daily benefits, shorter benefit periods (i.e., lower lifetime benefit caps), and less inflation protection. Many smaller carriers have exited the market (Gleckman 2013, 2015) and sales of individual LTCI policies plummeted from a high of 754,000 in 2002 to just 129,000 in 2014 (Cohen 2016). That said, so-called combination or hybrid products have gained popularity. These products combine LTC benefits with either life insurance or an annuity. In combination with life insurance, if LTC is needed, the death benefit is accelerated. In combination with an annuity, if LTC is not needed, there is an annuity payout. Sales of combination products rose from 273,000 in 2009 to 535,000 in 2013 (Cohen 2016). In a series of essays, Brown and Finkelstein (2007, 2008, 2009, 2011) addressed the relatively small size of the market for private LTCI. They pointed out that 35%-50% of 65 year-olds will use a nursing home at some point in their remaining lives and that, of those who use a nursing home, 10%-20% will live there more than five years. At current median prices, five years of nursing home residency cost in excess of $400,000 (see Table 4 above). Despite a sizable risk of large future expenditures, private LTCI pays for only 6% of LTC expenses, whereas out-of-pocket payments account for 20% (see Table 3 above). Brown and Finkelstein evaluated supply and demand side factors to explain the small role of private LTCI. Supply side issues are reflected in premiums that far exceed expected benefits and typical benefits that only partially cover costs. On average, the present value of benefits is only one-half of the present value of lifetime premiums (Brown and Finkelstein 2011). Further, while pricing is unisex, men are less likely to incur LTC expenses than women—men receive benefits of only about 34 cents per premium dollar, compared with 64 cents received by women. The authors suggest several supply-side factors that may be responsible for the high premiums and less-than-full coverage. Among these are transaction and administration costs, lack of a competitive market, adverse selection and moral hazard, and contracting issues. Finkelstein and McGarry (2006) found that adverse selection (disproportionate enrollment by high-risk individuals) and moral hazard (disproportionate utilization by insured individuals) are offset by a strong taste for insurance among low-risk individuals. (Our Table 17 below is consistent with that conclusion.) Because of the very long-term nature of LTCI policies, contracting issues may be particularly troublesome. While contractually adjustable, premiums are intended to be fixed in nominal terms for the duration of the policy—typically several decades—even when benefits are inflated annually. The insurance company may go bankrupt, creating a risk for the policyholder that benefits may never materialize. Also, the insurance company may not be able to pool certain risks, such as the risk that prices for long-term care rise faster than expected or that returns on invested premiums are below expectations. However, even if supply side issues could be resolved and premiums would be actuarially fair, demand side issues likely stand in the way of widespread LTC insurance. Brown and Finkelstein (2009) cite several demand side issues. First, consumers may underestimate the risks and costs of long-term care. Second, they may value consumption when institutionalized less highly than when not, thus

15
reducing the incentive to smooth out consumption through insurance. Third, they may take into account imperfect but less expensive alternatives to private insurance, such as care provided by a spouse or other family members, financial transfers from adult children, or Medicaid. In particular, two aspects of the structure of Medicaid reduce demand for private LTCI: means-testing and Medicaid being the secondary payer. Means testing implies that every dollar in private benefits postpones Medicaid eligibility, and Medicaid being the secondary payer implies that it is not available to top up private LTCI benefits, which typically cover only part of the costs. Brown and Finkelstein (2008) calculated the “implicit tax” of Medicaid—the part of the LTCI premium that goes to pay for benefits that end up duplicating benefits that Medicaid would have paid for in the absence of a private policy—at 60% for a man at the median of the wealth distribution. In other words, 60 cents out of every dollar of private benefits simply serve to replace benefits that Medicaid would have provided. For women, they estimated the implicit tax rate at 75%. In short, Brown and Finkelstein argue that supply side issues lift premiums to levels far above expected benefits and that demand side issues sharply reduce the net benefits that private insurance will provide.
StateMedicaidPartnershipPrograms
In recent years many states have implemented so-called Partnership Programs between Medicaid and private insurance companies. These programs are designed to encourage middle-income Americans to purchase long-term care insurance. To qualify for basic Medicaid, one generally needs to spend down assets. However, holders of LTCI policies that meet Partnership criteria may qualify for Medicaid after their long-term care benefits run out while preserving assets. For example, if a policyholder needs long-term care after exhausting his lifetime maximum benefit of, say, $300,000, he may qualify for Medicaid while retaining $300,000 in assets beyond the usual Medicaid criteria. The California Partnership Program describes the asset protection aspect as follows (California DHCS 2010; emphasis in original):
Medi-Cal [California’s Medicaid program] Asset Protection is available in Partnership policies through an alliance between the State of California and select private insurers who agree to market high-quality long-term care insurance policies. Asset Protection guarantees you get to keep a dollar's worth of assets for each dollar your Partnership insurance policy pays out for long-term care services. If you use up your long-term care insurance coverage and still need long-term care, you may apply for Medi-Cal. When qualifying for Medi-Cal, you are entitled to keep assets Medi-Cal normally allows, plus assets equal to the amount the Partnership policy has paid out in benefits. This means you can purchase a Partnership policy equal to the amount of assets you wish to protect. The State of California will also disregard these protected assets when making a claim through Medi-Cal Estate Recovery.
As of March 2014, 44 states and the District of Columbia had implemented a Partnership Program. State requirements for policies to meet Partnership standards vary, but most require inflation protection through benefits that increase automatically over time. With the exception of California, Partnership states allow reciprocity, i.e., they grant asset exemptions based on Partnership policies that were
16
purchased under another state’s Partnership Program (New York SPLTC 2016, AALTCI 2016a). By 2015, Partnership policies accounted for slightly more than two-in-five new policies sold (Cohen 2016).
Employer‐ProvidedLong‐TermCareBenefits
Long-term care insurance coverage may be obtained through individual policies or through employer-sponsored group policies. NAIC (2015) documented that by the end of 2014, 7.2 million lives were covered by LTCI. Of these, 5.0 million (69%) were individual policies and 2.2 million (31%) were certificates under group plans.13 The National Compensation Survey indicates that 18% of civilian workers had access to long-term care insurance through their employer (NCS 2014). In other words, the employers of 18% of civilian workers sponsored a long-term care insurance benefit. Although sponsored by the employer, benefits are typically fully paid for by the employee. From the employee’s point of view, the main advantages of an employer-sponsored plan are potential group discounts and, for larger groups, often simplified medical underwriting (such as without a medical examination). After separating from their employer, the policy certificate stays with the employee. Take-up rates are very low, with different sources reporting estimates from 5%-7% of eligible employees taking up long-term care insurance (CIPR 2016; Pincus et al., 2013). We conducted an analysis of Form 5500 filings to gain insights into the prevalence of employer-sponsored long-term care coverage. The Employee Retirement Income Security Act (ERISA) requires any administrator or sponsor of an employee benefit plan subject to ERISA to annually report details on such plans unless exempt from filing pursuant to regulations issued by the DOL. Welfare plans with fewer than 100 participants are generally exempt, except if they operate a trust. For the purpose of this report, only plans with 100 or more participants are included. Non-ERISA plans, such as governmental plans and church plans, do not need to file a Form 5500 and are not covered by the analysis in this section. The Form 5500 does not ask specifically about long-term care benefits. Line 8b on the main Form asks for the plan’s benefit types, but there is no code for long-term care benefits. Details about underlying insurance contracts, if any, are reported on Schedules A. Line 8 of the Schedule A asks for the benefit type of the insurance contract, but, again, there is no checkbox for long-term care benefits. However, plans may check “Other” and write in the appropriate benefit type. We searched these free-form text boxes for such phrases as “long-term care” and “LTC”. In recent years roughly 2,000 plans annually indicated offering LTC benefits; see Table 8.14
13 Technically, most employer-sponsored plans are not group plans but multi-life policies, i.e., individual long-term care insurance policies bundled together with a group discount (AALTCI 2016b). 14 Since these figures originate from Schedules A, they exclude long-term care benefits offered by employers that self-insure those benefits. We are unaware of the prevalence of self-insured long-term care benefits.
17
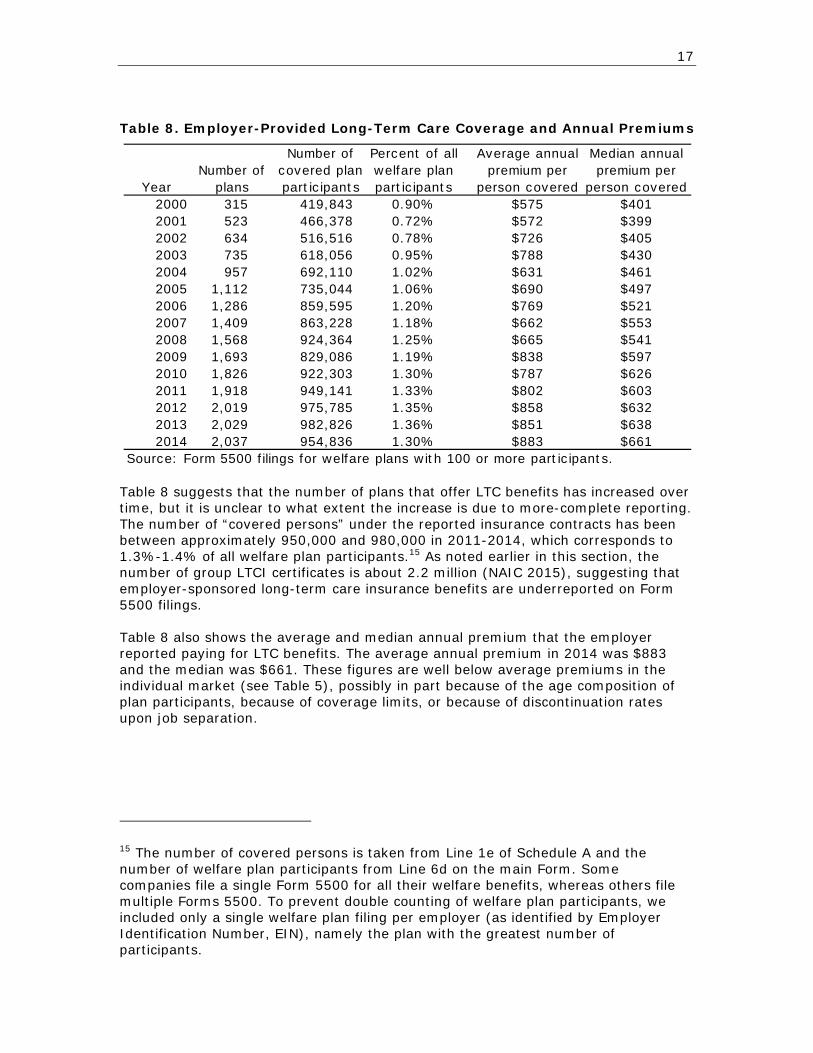
Table 8. Employer-Provided Long-Term Care Coverage and Annual Premiums
Table 8 suggests that the number of plans that offer LTC benefits has increased over time, but it is unclear to what extent the increase is due to more-complete reporting. The number of “covered persons” under the reported insurance contracts has been between approximately 950,000 and 980,000 in 2011-2014, which corresponds to 1.3%-1.4% of all welfare plan participants.15 As noted earlier in this section, the number of group LTCI certificates is about 2.2 million (NAIC 2015), suggesting that employer-sponsored long-term care insurance benefits are underreported on Form 5500 filings. Table 8 also shows the average and median annual premium that the employer reported paying for LTC benefits. The average annual premium in 2014 was $883 and the median was $661. These figures are well below average premiums in the individual market (see Table 5), possibly in part because of the age composition of plan participants, because of coverage limits, or because of discontinuation rates upon job separation.
15 The number of covered persons is taken from Line 1e of Schedule A and the number of welfare plan participants from Line 6d on the main Form. Some companies file a single Form 5500 for all their welfare benefits, whereas others file multiple Forms 5500. To prevent double counting of welfare plan participants, we included only a single welfare plan filing per employer (as identified by Employer Identification Number, EIN), namely the plan with the greatest number of participants.
YearNumber of
plans
Number of covered plan participants
Percent of all welfare plan participants
Average annual premium per
person covered
Median annual premium per
person covered2000 315 419,843 0.90% $575 $4012001 523 466,378 0.72% $572 $3992002 634 516,516 0.78% $726 $4052003 735 618,056 0.95% $788 $4302004 957 692,110 1.02% $631 $4612005 1,112 735,044 1.06% $690 $4972006 1,286 859,595 1.20% $769 $5212007 1,409 863,228 1.18% $662 $5532008 1,568 924,364 1.25% $665 $5412009 1,693 829,086 1.19% $838 $5972010 1,826 922,303 1.30% $787 $6262011 1,918 949,141 1.33% $802 $6032012 2,019 975,785 1.35% $858 $6322013 2,029 982,826 1.36% $851 $6382014 2,037 954,836 1.30% $883 $661
Source: Form 5500 filings for welfare plans with 100 or more participants.
18
5. ANALYSIS OF HEALTH AND RETIREMENT STUDY DATA
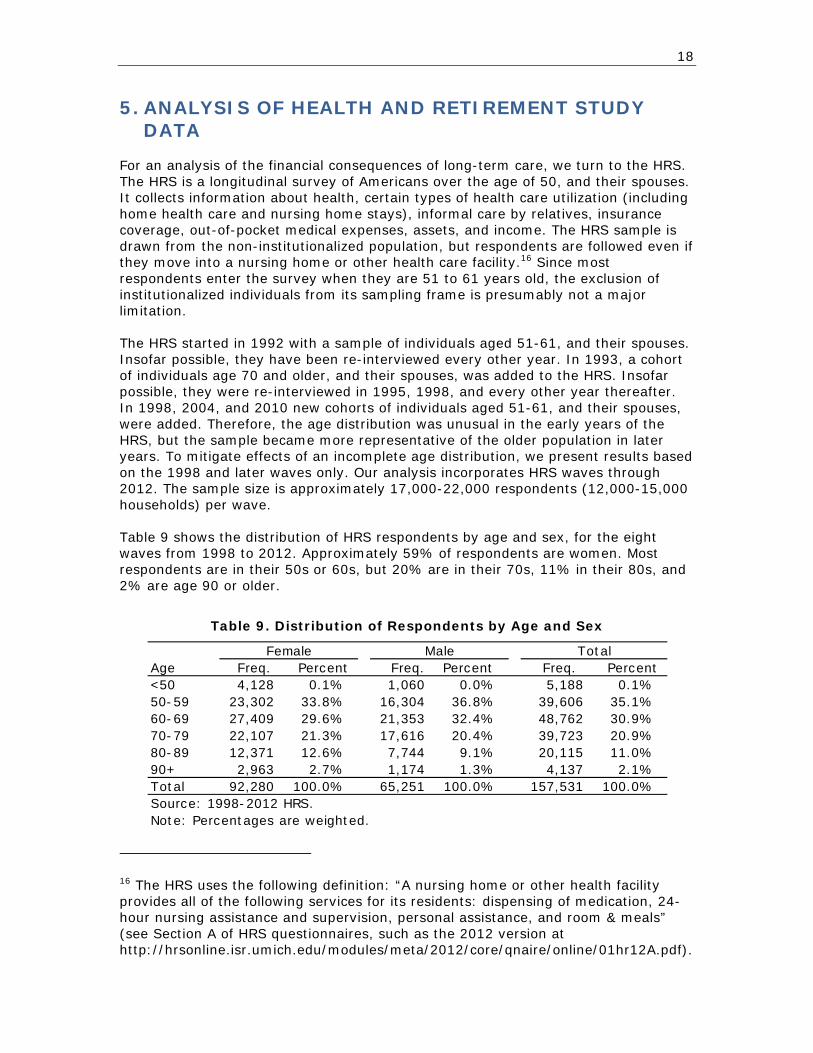
For an analysis of the financial consequences of long-term care, we turn to the HRS. The HRS is a longitudinal survey of Americans over the age of 50, and their spouses. It collects information about health, certain types of health care utilization (including home health care and nursing home stays), informal care by relatives, insurance coverage, out-of-pocket medical expenses, assets, and income. The HRS sample is drawn from the non-institutionalized population, but respondents are followed even if they move into a nursing home or other health care facility.16 Since most respondents enter the survey when they are 51 to 61 years old, the exclusion of institutionalized individuals from its sampling frame is presumably not a major limitation. The HRS started in 1992 with a sample of individuals aged 51-61, and their spouses. Insofar possible, they have been re-interviewed every other year. In 1993, a cohort of individuals age 70 and older, and their spouses, was added to the HRS. Insofar possible, they were re-interviewed in 1995, 1998, and every other year thereafter. In 1998, 2004, and 2010 new cohorts of individuals aged 51-61, and their spouses, were added. Therefore, the age distribution was unusual in the early years of the HRS, but the sample became more representative of the older population in later years. To mitigate effects of an incomplete age distribution, we present results based on the 1998 and later waves only. Our analysis incorporates HRS waves through 2012. The sample size is approximately 17,000-22,000 respondents (12,000-15,000 households) per wave. Table 9 shows the distribution of HRS respondents by age and sex, for the eight waves from 1998 to 2012. Approximately 59% of respondents are women. Most respondents are in their 50s or 60s, but 20% are in their 70s, 11% in their 80s, and 2% are age 90 or older.
Table 9. Distribution of Respondents by Age and Sex
16 The HRS uses the following definition: “A nursing home or other health facility provides all of the following services for its residents: dispensing of medication, 24-hour nursing assistance and supervision, personal assistance, and room & meals” (see Section A of HRS questionnaires, such as the 2012 version at http://hrsonline.isr.umich.edu/modules/meta/2012/core/qnaire/online/01hr12A.pdf).
Female Male TotalAge Freq. Percent Freq. Percent Freq. Percent<50 4,128 0.1% 1,060 0.0% 5,188 0.1%50-59 23,302 33.8% 16,304 36.8% 39,606 35.1%60-69 27,409 29.6% 21,353 32.4% 48,762 30.9%70-79 22,107 21.3% 17,616 20.4% 39,723 20.9%80-89 12,371 12.6% 7,744 9.1% 20,115 11.0%90+ 2,963 2.7% 1,174 1.3% 4,137 2.1%Total 92,280 100.0% 65,251 100.0% 157,531 100.0%Source: 1998-2012 HRS.Note: Percentages are weighted.
19
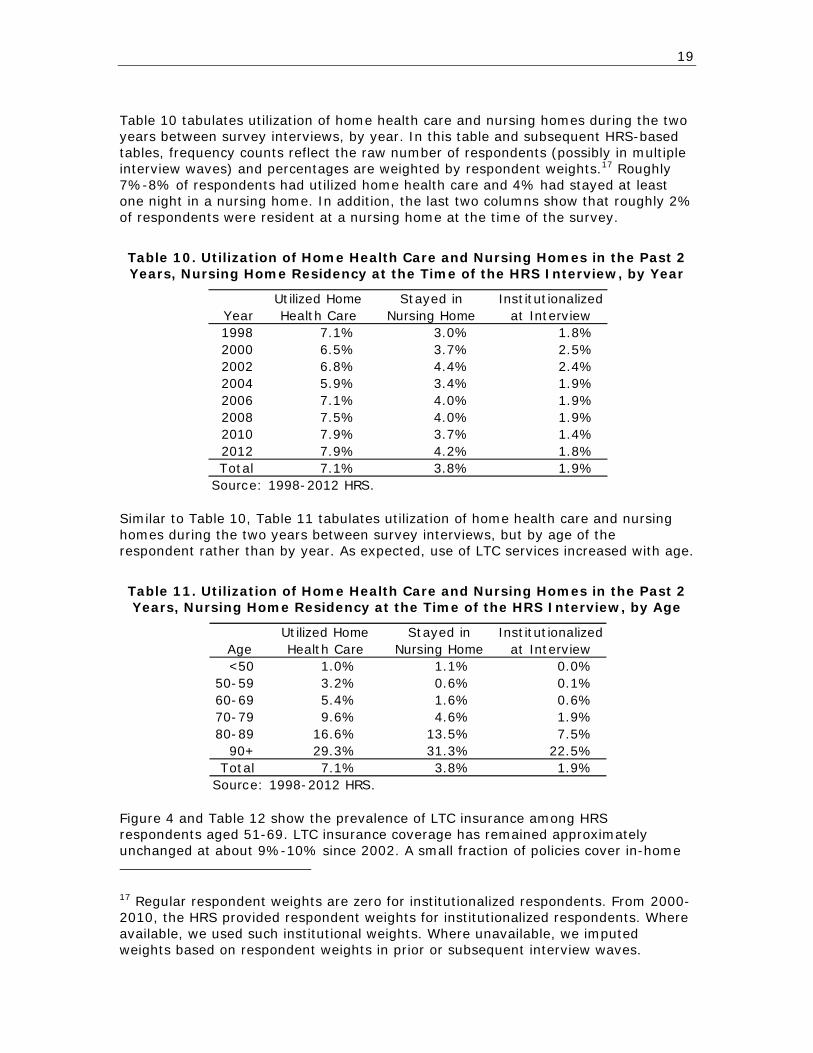
Table 10 tabulates utilization of home health care and nursing homes during the two years between survey interviews, by year. In this table and subsequent HRS-based tables, frequency counts reflect the raw number of respondents (possibly in multiple interview waves) and percentages are weighted by respondent weights.17 Roughly 7%-8% of respondents had utilized home health care and 4% had stayed at least one night in a nursing home. In addition, the last two columns show that roughly 2% of respondents were resident at a nursing home at the time of the survey.
Table 10. Utilization of Home Health Care and Nursing Homes in the Past 2 Years, Nursing Home Residency at the Time of the HRS Interview, by Year
Similar to Table 10, Table 11 tabulates utilization of home health care and nursing homes during the two years between survey interviews, but by age of the respondent rather than by year. As expected, use of LTC services increased with age.
Table 11. Utilization of Home Health Care and Nursing Homes in the Past 2 Years, Nursing Home Residency at the Time of the HRS Interview, by Age
Figure 4 and Table 12 show the prevalence of LTC insurance among HRS respondents aged 51-69. LTC insurance coverage has remained approximately unchanged at about 9%-10% since 2002. A small fraction of policies cover in-home 17 Regular respondent weights are zero for institutionalized respondents. From 2000-2010, the HRS provided respondent weights for institutionalized respondents. Where available, we used such institutional weights. Where unavailable, we imputed weights based on respondent weights in prior or subsequent interview waves.
YearUtilized Home Health Care
Stayed in Nursing Home
Institutionalized at Interview
1998 7.1% 3.0% 1.8%2000 6.5% 3.7% 2.5%2002 6.8% 4.4% 2.4%2004 5.9% 3.4% 1.9%2006 7.1% 4.0% 1.9%2008 7.5% 4.0% 1.9%2010 7.9% 3.7% 1.4%2012 7.9% 4.2% 1.8%Total 7.1% 3.8% 1.9%
Source: 1998-2012 HRS.
AgeUtilized Home Health Care
Stayed in Nursing Home
Institutionalized at Interview
<50 1.0% 1.1% 0.0%50-59 3.2% 0.6% 0.1%60-69 5.4% 1.6% 0.6%70-79 9.6% 4.6% 1.9%80-89 16.6% 13.5% 7.5%
90+ 29.3% 31.3% 22.5%Total 7.1% 3.8% 1.9%
Source: 1998-2012 HRS.

20
care or nursing home care only, but most cover both. This is consistent with Cohen (2016).
Figure 4. Prevalence and Type of Long-Term Care Insurance (Respondents Aged 51-69 in 1998-2012)
Table 12. Prevalence and Type of Long-Term Care Insurance (Respondents Aged 51-69 in 1998-2012)
As documented by Cohen (2016) and discussed on page 11 above, currently sold policies tend to cover both in-home and nursing home care, but older policies were more restrictive. Recognizing that older policies tend to be held by older birth cohorts, Table 13 shows benefit types by age of the HRS respondent. About 87% (9.8%/11.2%) of policies held by 60-69 year-olds covered both in-home and nursing
0%
2%
4%
6%
8%
10%
12%
1998 2000 2002 2004 2006 2008 2010 2012Source: HRS respondents age 51-69
OtherIn-home care onlyNursing home care only Both
YearNursing Home
and Home CareNursing Home
Care OnlyHome
Care Only Other Total1998 6.0% 1.1% 0.8% 0.1% 8.0%2000 6.6% 0.7% 0.6% 0.0% 7.9%2002 8.1% 0.9% 0.3% 0.2% 9.5%2004 8.6% 0.7% 0.4% 0.1% 9.9%2006 8.7% 0.6% 0.3% 0.0% 9.6%2008 9.5% 0.7% 0.3% 0.1% 10.6%2010 8.9% 0.6% 0.3% 0.1% 9.8%2012 8.8% 0.6% 0.4% 0.0% 9.8%
Source: HRS Respondents aged 51-69.

21
home care. That fraction decreases with age to 81% among 70-79 year-olds, 69% among 80-89 year-olds, and 57% among respondents age 90 or older.
Table 13. Prevalence and Type of Long-Term Care Insurance, by Age (1998-2012)
Table 14 and Table 15 show the distribution of cumulative number of days spent in a nursing home, by age of the respondent.18 The days may have been spent consecutively or over multiple nursing home stays. Table 14 shows the distribution for the individual respondent. Most people never stayed in a nursing home, but the fraction who did increases, as expected, with age. Among respondents who are age 90 or older, 11% had stayed 1-30 days, 6% 31-100 days, 6% 101 days to one year, 5% more than one year but less than two years, 10% two to four years, and 2% five years or longer. Table 15 is similar to Table 14 but accounts for nursing home stays of both the respondent and his or her partner.
Table 14. Cumulative Duration Spent in a Nursing Home, by Age
18 Cumulative number of days insofar reported in the HRS. Any stays prior to entering the HRS sample are excluded. However, since most HRS respondents are in their 50s when they enter the HRS, we believe this limitation to be mild. The tables uses eight HRS waves (1998-2012), i.e., individual respondents can contribute multiple times to the tables.
AgeNursing Home
and Home CareNursing Home
Care OnlyHome
Care Only Other Total<50 2.5% 0.0% 1.0% 0.0% 3.5%
50-59 6.9% 0.5% 0.4% 0.1% 7.9%60-69 9.8% 1.0% 0.4% 0.0% 11.2%70-79 10.9% 1.9% 0.5% 0.1% 13.4%80-89 7.8% 2.6% 0.8% 0.1% 11.3%
90+ 4.1% 2.4% 0.5% 0.1% 7.1%Source: 1998-2012 HRS.
AgeDuration <50 50-59 60-69 70-79 80-89 90+ AllZero days 98.9% 99.2% 97.3% 92.8% 80.5% 60.3% 94.4%1-30 days 0.0% 0.5% 1.5% 3.9% 8.4% 11.0% 2.6%31-100 days 1.1% 0.1% 0.4% 1.3% 3.4% 5.6% 0.9%101-364 days 0.0% 0.1% 0.3% 0.7% 2.4% 5.9% 0.7%1 year 0.0% 0.0% 0.1% 0.5% 2.0% 4.8% 0.5%2-4 years 0.0% 0.0% 0.2% 0.7% 2.8% 10.2% 0.8%5+ years 0.0% 0.0% 0.1% 0.1% 0.5% 2.3% 0.2%Source: 1998-2012 HRS.

22
Table 15. Cumulative Duration Spent in a Nursing Home by Self or Partner, by Respondent Age
Table 16 shows the fraction of individuals who reported Medicaid enrollment, by duration spent in a nursing home. As expected, the longer someone was a resident at a nursing home, the more likely he or she was receiving Medicaid benefits. More than one-half (56%) of respondents who had spent five years or longer in a nursing home reported Medicaid enrollment, compared with only 8% among those who had never stayed in a nursing home. A likely explanation is that private assets and other sources of payment become sufficiently depleted for a respondent to become eligible for Medicaid.
Table 16. Medicaid Enrollment by Cumulative Duration Spent in Nursing Home
Table 17 shows utilization of long-term care by age and by long-term care insurance status. Table 11 above already showed that use of services increases with age; Table 17 documents that utilization among people with insurance is generally lower that among their uninsured counterparts. Theoretically, adverse selection and moral hazard could lead to the opposite pattern: people who expect to need long-term care are more likely to purchase insurance protection, and people with insurance coverage are more likely to use services because the net cost is lower for them. However, for long-term care utilization those forces are outweighed by such other factors as better health among LTCI policyholders. This finding is consistent with Finkelstein and McGarry (2006), who concluded that in the market for long-term care insurance individuals with a strong taste for purchasing insurance tend to be low-risk and outnumber individuals with private information that they are high-risk.
AgeDuration <50 50-59 60-69 70-79 80-89 90+ AllZero days 98.3% 98.6% 95.7% 89.0% 74.3% 54.8% 92.1%1-30 days 0.0% 0.9% 2.4% 5.9% 11.0% 12.6% 3.8%31-100 days 1.3% 0.2% 0.7% 2.0% 4.7% 6.7% 1.4%101-364 days 0.4% 0.2% 0.5% 1.2% 3.3% 6.8% 1.0%1 year 0.0% 0.0% 0.2% 0.6% 2.4% 5.2% 0.6%2-4 years 0.0% 0.1% 0.4% 1.1% 3.7% 11.3% 1.0%5+ years 0.0% 0.0% 0.1% 0.2% 0.6% 2.7% 0.2%Source: 1998-2012 HRS.
DurationMedicaid
EnrollmentZero days 7.6%1-30 days 11.7%31-100 days 14.8%101-364 days 26.1%1 year 30.9%2-4 years 37.4%5+ years 55.9%Total 8.7%Source: 1998-2012 HRS.

23
Table 17. Utilization of Long-Term Care, by Age and LTC Insurance Status
The HRS does not ask about out-of-pocket expenses related to nursing home stays. In an attempt to gauge the financial consequences of nursing home stays, Table 18 captures asset depletion between HRS interviews for households with and without nursing home stays. The unit of analysis is a household interview that was preceded by another interview. The analysis excludes households with any wage earnings. It shows the distribution of financial assets (top panel) and net worth (bottom panel) for households whose members never stayed in a nursing home throughout the time that they were in the HRS and for households who reported at least one overnight stay by either partner.19 The latter group is further distinguished between households who did or did not report a stay during the past two years. The hypothesis is that the assets of households who reported a stay in the past two years are more likely to deplete than those of other groups. Indeed the mean change in assets is negative, but the magnitude of the average change would typically pay for only a short nursing home stay.
19 Financial assets include checking accounts, savings accounts, stock holdings, bonds, mutual funds, investment trusts, certificates of deposit, other savings (money owed by others, a valuable collection for investment purposes, an annuity, or rights in a trust or estate), and IRA holdings. Net worth further includes housing and other real estate equity (net of mortgages) and the value of vehicles. Neither metric includes defined contribution pension balances.
Used Home Health Care in the Past 2
Years
Stayed in Nursing Home in the Past 2
YearsIn nursing home at time of interview
LTC insurance at interview?
LTC insurance at interview?
LTC insurance at interview?
Age No Yes No Yes No Yes<50 1.1% 0.0% 1.1% 0.0% 0.0% 0.0%
50-59 3.1% 4.0% 0.5% 0.6% 0.1% 0.1%60-69 5.4% 4.8% 1.7% 1.3% 0.6% 0.4%70-79 10.0% 7.2% 4.8% 3.1% 2.0% 0.9%80-89 16.8% 14.5% 13.8% 10.1% 7.7% 4.8%
90+ 28.9% 31.9% 30.9% 30.7% 22.4% 17.8%Total 7.1% 6.7% 3.8% 3.1% 2.0% 1.2%
Source: 1998-2012 HRS.

24
Table 18. Distribution of Change in Financial Assets, Total Assets in Past Two Years
We turn to a mutivariate analysis of wealth changes between HRS interviews to measure the financial impact of nursing home stays net of public or private insurance coverage. As in the previous table, the analysis excludes households with any wage earnings. It also excludes households with Medicaid beneficiaries, since their out-of-pocket expenses are likely low. We distinguish between short stays (up to 30 days) and long stays (more than 30 days), because short stays are often associated with hospital stays and likely covered by Medicare or private health insurance. Our hypothesis is that long stays pose the greatest financial risks, and that those risks are mitigated if (either partner in) a household has private long-term care insurance. See Table 19. We are interested in wealth changes. However, wealth levels and their changes vary widely across households, and outliers may drive results. We therefore measure wealth through an inverse hyperbolic sine transformation. The inverse hyperbolic sine is similar to a logarithmic transformation, but allows negative values.20 Table 19 presents two specifications, for financial assets and net worth.
20 Formally, sinh √ 1 . The inverse hyperbolic sine is point-symmetric around the origin: sinh sinh .For positive wealth values w that are not close to zero, sinh 2 , and for negative values not close to zero, sinh 2 . For wealth levels that are both positive or both negative in the current and prior interview, changes in the inverse hyperbolic sine may be interpreted similar to changes in logarithms, i.e., as relative changes.
Change in Financial Assets (Incl. IRAs)
Subsample25th
Percentile Median75th
Percentile
Mean (excl. top and bottom
deciles)Never in Nursing Home -26,000 0 41,000 7,045Ever in Nursing Home -28,000 0 37,000 5,159
Not in Past Two Years -21,326 500 45,000 11,302During Past Two Years -36,000 -50 29,500 -1,113
Change in Net Worth
25th Percentile Median
75th Percentile
Mean (excl. top and bottom
deciles)Never in Nursing Home -52,400 4,682 91,000 18,505Ever in Nursing Home -51,100 1,000 68,000 8,421
Not in Past Two Years -35,800 5,500 84,700 23,265During Past Two Years -71,000 -1,000 56,500 -7,186
Source: 1998-2012 HRS.

25
Table 19. Wealth Change between HRS Surveys as a Function of Nursing Home Stays and Insurance Coverage
(Outcome variable: Difference between waves of inverse hyperbolic sine of wealth)
Consistent with our hypothesis, short nursing home stays did not have a statistically significant effect on changes in wealth before and after the stay. However, stays in excess of 30 days had a negative effect, except if the household had long-term care insurance coverage. Not shown in the table is that the parameter estimates were sensitive to the model specification, sample selection, and treatment of negative wealth values. In other words, while the results are consistent with expectations, direct measurement of out-of-pocket expenses may be preferable to measurement of wealth changes. Unfortunately, the HRS currently does not offer such direct measurement. Finally, Table 20 shows probit regression results of the likelihood of Medicaid enrollment. The unit of observation is a household interview and the outcome is an indicator for whether (either partner in) a household reported being covered by Medicaid. As expected, net worth is strongly negatively related to Medicaid enrollment. In contrast to Table 19, nursing home stays are measured cumulatively, with indicators for whether all nursing home stays by either partner prior to the interview summed to 1-30 days or longer. Both short and long stays increased the likelihood of Medicaid enrollment, but the effect of long stays was much greater. Being covered by long-term care insurance reduced the chances of Medicaid enrollment, presumably because of its association with sufficient means to pay for such insurance. Contrary to our expectations, the effect of long stays was not mitigated by long-term care insurance coverage.
Change in inverse hyperbolic sine of:Financial Assets Net Worth
Short stay (<=30 days) -0.085 -0.085(0.231) (0.142)
Long stay (>30 days) -0.674 ** -0.491 ***(0.293) (0.180)
LTC insurance coverage -0.028 -0.048(0.103) (0.064)
Long stay * LTC insurance 1.198 * 0.955 **(0.675) (0.415)
Constant 0.054 0.053 *(0.045) (0.027)
Number of observations 16,485 16,485Standard errors in parentheses.Significance: ***=1%, **=5%, *=10%.Analysis sample excludes households with Medicaid beneficiaries.

26
Table 20. Household Medicaid Coverage as a Function of Cumulative Nursing Home Stays
6. POLICY IMPLICATIONS
Approximately one-half of Baby Boomers are projected to require paid, formal long-term care in the home, an adult day care center, an assisted living facility, or a nursing home (Favreault and Dey, 2016). Paying for care out of pocket could rapidly exhaust retirement savings of many Americans, prompting them to eventually rely on Medicaid. Indeed, Medicaid enrollment is about 8% among HRS respondents who have never stayed in a nursing home and rises to 26% after 101-364 days in a nursing home and 56% after five years in a nursing home (see Table 16 above). The size of the Baby Boom generation is expected to drive up demand for and prices of long-term care, creating a troublesome outlook for the elderly’s personal finances and the Medicaid program. Given the high cost of long-term care, workable solutions could involve risk pooling through public or private insurance. Only about 7 million people are currently covered by private long-term care insurance, which suggests room for growth. However, as argued by Brown and Finkelstein (2007, 2008, 2009, 2011) and summarized above, both insurance companies and consumers face impediments to more widespread adoption of private LTCI. Among these are uncertainty over the adequacy of coverage and uncertainty over future premiums. Indeed, the insurance is designed to be in force for several decades, and past experience shows costs that outpaced general inflation and substantial premium increases on policies that were issued prior to the mid-2000s. The uncertainties affect consumers and insurance companies alike. Some options that may alleviate the uncertainties of both consumers and the industry are:
Insurance products in which benefits and premiums adjust in tandem with inflation. Inflation tends to affect the cost of care, wages, and nominal investment returns in the same direction, so incorporating a link between benefit levels and premiums should greatly reduce inflation uncertainty. Many current products offer automatic benefit increases of 3% or 5% annually, but
ProbitNet worth -0.078 ***
(inverse hyperbolic sine) (0.003)
Short stay(s) 0.164 **(0<cumulative SNF nights<=30) (0.066)
Long stay(s) 0.757 ***(Cumulative SNF nights>30) (0.057)
LTC insurance coverage -0.502 ***(0.049)
Long stay(s) * LTC insurance 0.027(0.147)
Constant -0.489 ***(0.036)
Number of observations 26,797Standard errors in parentheses.Significance: ***=1%, **=5%, *=10%.

27
those increases may be too low or too high. Most products are designed to charge the same annual premium for the life of the policy, which makes them relatively expensive early on. Expecting income to keep pace with inflation, prospective policyholders may be receptive to lower initial premiums that escalate over time.
Products that combine long-term-care insurance with life insurance and/or annuities. Longevity risks affect individual products differently, but a combination product may be easier to price, require less complex underwriting standards, and offer more comprehensive protection against financial risks in old age.
State-based reinsurance pools designed to alleviate individual insurers’ risks and boost consumer confidence that their policies will eventually pay out, if needed.
Consumers may hesitate to purchase private insurance because some of the premiums pay for benefits that Medicaid would provide in the absence of private insurance. Two Medicaid features, in particular, create an implicit tax on private insurance: (1) private benefits postpone the time at which the asset test for Medicaid eligibility is met, and (2) Medicaid is secondary payor, i.e., pays only for services that other insurance do not cover. Public-private partnerships may offer solutions, such as expansion of state Medicaid Partnership Programs (see Section 4 above).
State Medicaid Partnership Programs make it easier to qualify for Medicaid for people with high-quality long-term care insurance. Should all benefits under private long-term care insurance become exhausted, the policyholder may retain assets equal to benefits paid and still qualify for Medicaid. This modified asset test addresses the first Medicaid feature responsible for an implicit tax on private insurance. Under State Medicaid Partnership Programs, the Medicaid program faces reduced expenditures on long-term care and consumers can maintain a higher consumption level or leave a bequest.
Similarly, a solution may lie in high-deductible, catastrophic LTCI with private front-end expense coverage for a set period (1-2 years), and public back-end coverage paid for the remainder of the LTC need. This would address the second Medicaid feature responsible for an implicit tax.
While State Medicaid Partnership Programs and high-deductible LTCI policies each address Medicaid features responsible for an implicit tax on private insurance, few if any options appear available that fully eliminate the tax while simultaneously preserving a safety net for low-income Americans and ensuring fiscal sustainability of the Medicaid program. Finally, incentives to expand private insurance could be introduced in the workplace.
Allow withdrawals from employer-sponsored retirement plans for LTC expenses or the purchase of LTCI without early-distribution penalties.
Promote employer-sponsored long-term insurance by allowing plans to be tax-qualified, so that premiums can be paid through pre-tax payroll deductions.
To alleviate fiduciary liability and other employer concerns, an alternative may be to create a publicly run marketplace in which private insurers offer long-term care insurance that workers may purchase through payroll deductions. Such an initiative could be modeled on recent state initiatives with respect to auto-enrollment IRAs.
28
REFERENCES
AALTCI. 2015. “Long-Term Care Insurance Facts – Statistics.” American Association for Long-Term Care Insurance. Available at http://www.aaltci.org/long-term-care-insurance/learning-center/fast-facts.php.
AALTCI. 2016a. “Long Term Care Insurance Partnership Plans.” American Association for Long-Term Care Insurance. Available at http://www.aaltci.org/long-term-care-insurance/learning-center/long-term-care-insurance-partnership-plans.php.
AALTCI. 2016b. “Types of Group Long-Term Care Insurance Coverage.” American Association for Long-Term Care Insurance. Available at http://www.aaltci.org/group-long-term-care-insurance-plans/true-group-ltc.php.
AARP. 2012. “Long-Term Care Insurance: 2012 Update.” AARP Public Policy Institute, Fact Sheet 261, June 2012. Available at http://www.aarp.org/content/dam/aarp/research/public_policy_institute/ltc/2012/ltc-insurance-2012-update-AARP-ppi-ltc.pdf.
BLS. 2016. Consumer Price Index, All Urban Consumers, series CUUR0000SA0 (All Items) and CUUR0000SAM (Medical Care). Bureau of Labor Statistics. Available at http://www.bls.gov/data/#prices.
Brown, Jeffrey R. and Amy Finkelstein. 2007. “Why is the Market for Long-Term Care Insurance So Small?” Working Paper, National Bureau of Economic Research. http://users.nber.org/~afinkels/papers/Brown_Finkelstein_Small_Feb07.pdf.
Brown, Jeffrey R. and Amy Finkelstein. 2008. “The Interaction of Public and Private Insurance: Medicaid and the Long-Term Care Insurance Market.” American Economic Review 98(3): 1083–1102.
Brown, Jeffrey R. and Amy Finkelstein. 2009. “The Private Market for Long-Term Care Insurance in the United States: A Review of the Evidence.” Journal of Risk and Insurance, 76(1): 5-29.
Brown, Jeffrey R. and Amy Finkelstein. 2011. “Insuring Long-Term Care in the United States.” Journal of Economic Perspectives, Volume 25(4): 119–142.
California DHCS. 2010. “Asset protection: A Special Benefit Created for Californians.” California Department of Health Care Services. Available at http://www.dhcs.ca. gov/services/ltc/Documents/CPLTC%20Print%20Locks/Asset_2010.pdf.
Carrns, Ann. 2014. “Premiums Rise for Long-Term Care Insurance. Keep It or Drop It?” New York Times, March 21, 2014.
CBO. 2013. “Rising Demand for Long-Term Services and Supports for Elderly People.” Congressional Budget Office, June 2013. Available at https://www.cbo.gov/sites/default/files/113th-congress-2013-2014/reports/44363-LTC.pdf.
Census Bureau. 2012. “Americans with Disabilities: 2010.” U.S. Census Bureau, Household Economic Studies. July 2012. Available at http://www.census.gov/prod/2012pubs/p70-131.pdf.
CIPR. 2016. “The State of Long-Term Care Insurance: The Market, Challenges and Future Innovations.” Eric Nordman (ed). National Association of Insurance Commissioners and The Center for Insurance Policy and Research, May 2016.
29
Available at http://www.naic.org/documents/cipr_current_study_160519_ ltc_insurance.pdf.
CMS. 2015. Final Rule, Prospective Payment System and Consolidated Billing for Skilled Nursing Facilities (SNFs) for FY 2016. August 4, 2015. Federal Register Vol. 80, No. 149, pages 46390-46477.
Cohen, Marc. 2016. “The State of the Long-Term Care Insurance Market.” Included in CIPR (2016).
Davidson, Joe. 2016. “Costs Skyrocket for Feds’ Long-Term-Care Insurance.” The Washington Post, July 21, 2016.
Favreault, Melissa and Judith Dey. 2016. “Long-Term Services and Supports for Older Americans: Risks and Financing.” U.S. Department of Health and Human Services, Office of the Assistant Secretary for Planning and Evaluation, Office of Disability, Aging and Long-Term Care Policy. ASPE Issue Brief, February 2016. Available at https://aspe.hhs.gov/sites/default/files/pdf/106211/ElderLTCrb-rev.pdf.
Finkelstein, Amy and Kathleen McGarry. 2006. “Multiple Dimensions of Private Information: Evidence from the Long-Term Care Insurance Market.” The American Economic Review 96(4): 938-958.
Florida AHCA. 2015. “Medicaid Reimbursement Per Diem Rates.” Florida Agency for Health Care Administration. January 1, 2015. Available at http://ahca.myflorida.com/Medicaid/cost_reim/pdf/2015_01_Rate_Letters.pdf.
Genworth. 2015. “Genworth 2015 Cost of Care Survey.” Genworth Financial, Inc. Available at https://www.genworth.com/dam/Americas/US/PDFs/Consumer/ corporate/130568_040115_gnw.pdf.
Gleckman, Howard. 2013. “More Bad News for Long-Term Care Insurance: A Major Carrier Reassess the Business amidst More Rate Hikes.” Forbes, August 8, 2013. Available at http://www.forbes.com/sites/howardgleckman/2013/08/08/more-bad-news-for-long-term-care-insurance-a-major-carrier-reassess-the-business-amidst-more-rate-hikes.
Gleckman, Howard. 2014. “What Does Genworth’s Bad News Mean for the Future of Long-Term Care Insurance?” November 19, 2014. Available at http://howardgleckman.com/2014/11/genworths-terrible-news-mean-future-long-term-care-insurance.
Gleckman, Howard. 2015. “The Long-Term Care Insurance Industry Ponders Its Future: Seven Trends to Watch.” Forbes, April 9, 2015. Available at http://www.forbes.com/sites/howardgleckman/2015/04/09/the-long-term-care-insurance-industry-ponders-its-future-seven-trends-to-watch.
HCRIS. Various years. Healthcare Cost Report Information System. Centers for Medicare and Medicaid Services. Available at https://www.cms.gov/Research-Statistics-Data-and-Systems/Downloadable-Public-Use-Files/Cost-Reports.
Kaiser Family Foundation. 2013. “Overview of Nursing Facility Capacity, Financing, and Ownership in the United States in 2011.” Available at https://kaiserfamilyfoundation.files.wordpress.com/2013/06/8456-overview-of-nursing-facility-capacity.pdf.
Karapiperis, Dimitris and Eric Nordman. 2016. “Forward” and “Long-Term Care Insurance Study Conclusion.” Included in CIPR (2016).

30
Lakdawalla, Darius, Dana Goldman Jayanta Bhattacharya. 2004. “Are the Young Becoming More Disabled?” Health Affairs, 23(1): 168-176.
Lakdawalla, Darius, Dana Goldman, Jayanta Bhattacharya, Michael Hurd, Geoffrey Joyce, and Constantijn Panis. 2003. “Forecasting the Nursing Home Population,” Medical Care, 41(1): 8-20.
Manton, Kenneth. 2003. “Forecasting the Nursing Home Population: Point.” Medical Care 41(1): 21-24.
MetLife. 2012. "Market Survey of Long-Term Care Costs: The 2012 MetLife Market Survey of Nursing Home, Assisted Living, Adult Day Services, and Home Care Costs." MetLife Mature Market Institute, November 2012. Available at https://www.metlife.com/assets/cao/mmi/publications/studies/2012/studies/mmi-2012-market-survey-long-term-care-costs.pdf.
NAIC. 2013. “A Shoppers Guide to Long-Term Care Insurance.” National Association of Insurance Commissioners. Revised 2013. Available at http://www.naic.org/documents/prod_serv_consumer_ltc_lp.pdf.
NAIC. 2016. “Long-Term Care.” National Association of Insurance Commissioners. February 5, 2016. Available at http://www.naic.org/cipr_topics/topic_long_term_care.htm.
NCHS. 2013 “Long-Term Care Services in the United States: 2013 Overview.” National Center for Health Statistics. Available at http://www.cdc.gov/nchs/data/nsltcp/long_term_care_services_2013.pdf.
New York SPLTC. 2016. “State Partnership Programs and Reciprocity.” New York State Partnership for Long-Term Care. Available at http://www.nyspltc.org/reciprocitymap.htm.
Pincus, Jeremy, Katherine Wallace-Hodel, and Katey Brown. 2013. “Size of the Employer and Self-Employed Markets Without Access to Long-Term Care Coverage Options.” The SCAN Foundation. Available at http://www.thescanfoundation.org/sites/default/files/tsf_ltc-financing_size-employer-market_pincus_3-20-13.pdf.
Wolf, Adam. 2014. “Surprise! Your long-term care insurance won’t cover it.” MarketWatch, February 3, 2014. Available at http://www.marketwatch.com/story/surpise-your-long-term-care-insurance-wont-cover-it-2014-02-03.
31
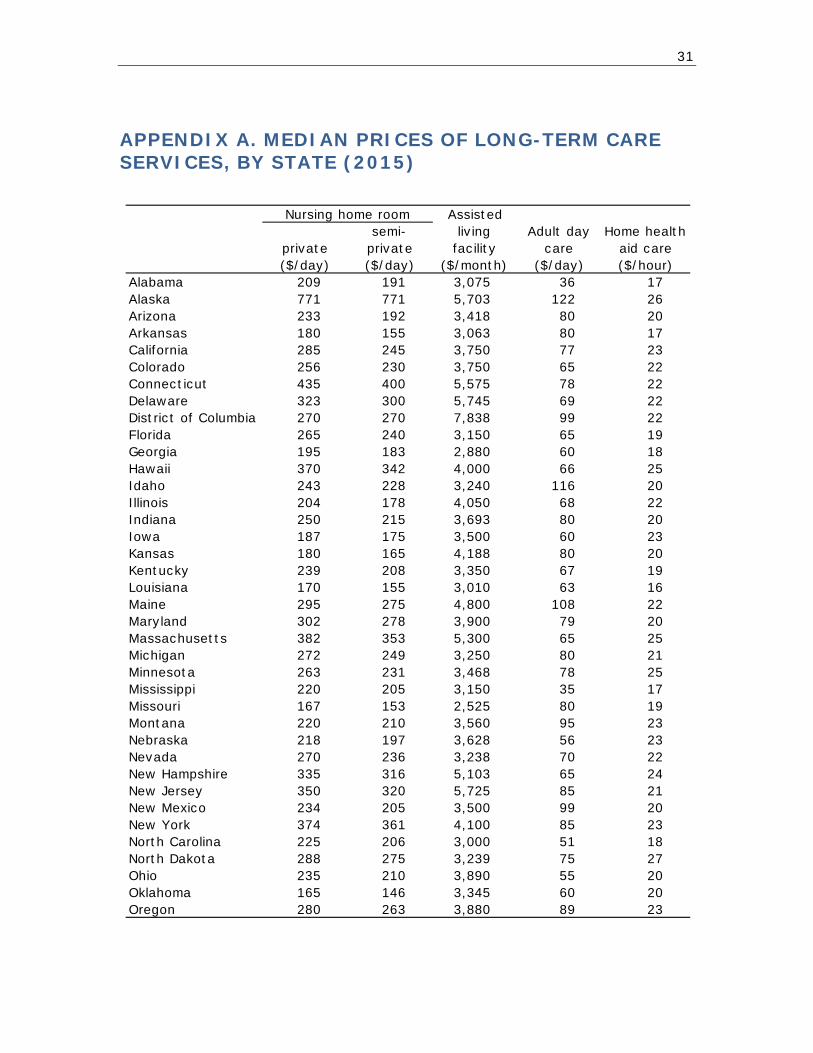
APPENDIX A. MEDIAN PRICES OF LONG-TERM CARE SERVICES, BY STATE (2015)
Nursing home room Assisted
private ($/day)
semi-private ($/day)
living facility
($/month)
Adult day care
($/day)
Home health aid care ($/hour)
Alabama 209 191 3,075 36 17Alaska 771 771 5,703 122 26Arizona 233 192 3,418 80 20Arkansas 180 155 3,063 80 17California 285 245 3,750 77 23Colorado 256 230 3,750 65 22Connecticut 435 400 5,575 78 22Delaware 323 300 5,745 69 22District of Columbia 270 270 7,838 99 22Florida 265 240 3,150 65 19Georgia 195 183 2,880 60 18Hawaii 370 342 4,000 66 25Idaho 243 228 3,240 116 20Illinois 204 178 4,050 68 22Indiana 250 215 3,693 80 20Iowa 187 175 3,500 60 23Kansas 180 165 4,188 80 20Kentucky 239 208 3,350 67 19Louisiana 170 155 3,010 63 16Maine 295 275 4,800 108 22Maryland 302 278 3,900 79 20Massachusetts 382 353 5,300 65 25Michigan 272 249 3,250 80 21Minnesota 263 231 3,468 78 25Mississippi 220 205 3,150 35 17Missouri 167 153 2,525 80 19Montana 220 210 3,560 95 23Nebraska 218 197 3,628 56 23Nevada 270 236 3,238 70 22New Hampshire 335 316 5,103 65 24New Jersey 350 320 5,725 85 21New Mexico 234 205 3,500 99 20New York 374 361 4,100 85 23North Carolina 225 206 3,000 51 18North Dakota 288 275 3,239 75 27Ohio 235 210 3,890 55 20Oklahoma 165 146 3,345 60 20Oregon 280 263 3,880 89 23
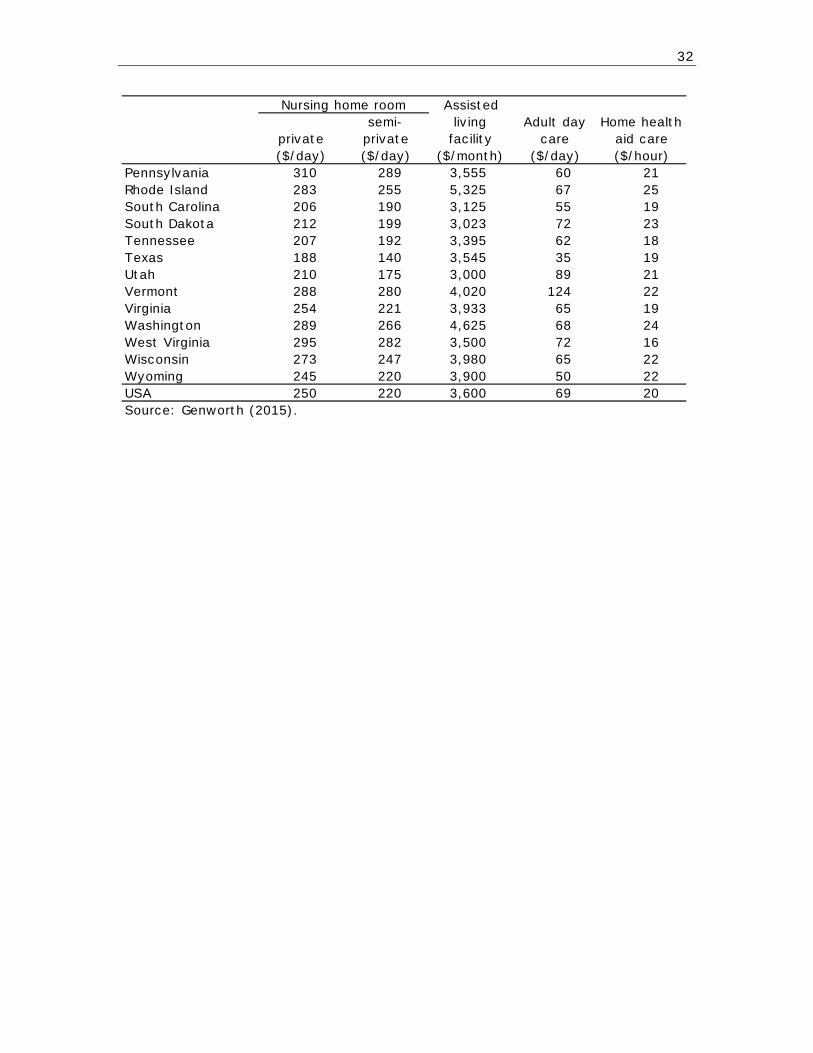
32
Nursing home room Assisted
private ($/day)
semi-private ($/day)
living facility
($/month)
Adult day care
($/day)
Home health aid care ($/hour)
Pennsylvania 310 289 3,555 60 21Rhode Island 283 255 5,325 67 25South Carolina 206 190 3,125 55 19South Dakota 212 199 3,023 72 23Tennessee 207 192 3,395 62 18Texas 188 140 3,545 35 19Utah 210 175 3,000 89 21Vermont 288 280 4,020 124 22Virginia 254 221 3,933 65 19Washington 289 266 4,625 68 24West Virginia 295 282 3,500 72 16Wisconsin 273 247 3,980 65 22Wyoming 245 220 3,900 50 22USA 250 220 3,600 69 20Source: Genworth (2015).

33
APPENDIX B. SAMPLE LONG-TERM CARE INSURANCE POLICY
This appendix reproduces three key pages of a sample long-term care insurance policy that Genworth publishes for California. The full sample policy document may be found at https://www.genworth.com/dam/Americas/US/PDFs/Consumer/Product/ LTC/7052CA_061713_gnw.pdf.

SAMPLE
7052 CA 3
SCHEDULE
Insured Policy Number Policy Effective Date [John Q. Doe] [XXXXXXX] [7/01/2013] [Apt #1234] [1234 Main Street] Issue State [Anytown, CA 99999] California
COVERAGE FEATURES AND LIMITS
Coverage is provided for Covered Expenses that are incurred after the Elimination Period has been satisfied. Payment is subject to the limits determined below and all other provisions of the Policy. Changes in Your Schedule may be made by Rider.
Elimination Period: [[30][90] days of Covered Care] [The Elimination Period is satisfied by days You incur a Covered Expense while You are Chronically Ill.] OR [[30][90] calendar days] [The Elimination Period is satisfied by days You are Chronically Ill beginning with the first day You incur a Covered Expense.]
[There is no Elimination Period for the Home and Community Care Benefit. In addition, days for which payment is made under that Benefit will count toward satisfying the Elimination Period.]
Coverage Maximum Nursing Facility Maximum Benefit Increases [$240,000] [$4,000 per calendar month] [5% Compound] [See below] [The Coverage Maximum and amounts based on the Nursing Facility Maximum are: (a) increased when Benefit Increases apply; and (b) exhausted only when the total of all Benefits paid equals the then applicable maximum amount. Benefit Increases that apply are not affected by any Benefits paid for Covered Expenses incurred prior to the date the applicable maximum is exhausted.] [5%, 3%] Compound Benefit Increases: On each anniversary of the Policy Effective Date Your then current Nursing Facility Maximum and the current amounts of other dollar maximums will each increase by the selected percentage. These Benefit Increases will be automatic; will not require proof of good health; and will be made without a corresponding increase in Premium. They will continue without regard to Your age, Claim status or Claim history, or length of time You have been insured under the Policy. Benefit Increases cease when: (a) the applicable maximum has been exhausted; (b) they are terminated by You; or (c) the Policy ends.] [5% Simple Benefit Increases: On each anniversary of the Policy Effective Date Your then current Nursing Facility Maximum and the current amounts of other dollar maximums will each increase by 5% of their respective amounts in effect on the Policy Effective Date. Calculation of the increased amounts is not affected by Benefit payments. These Benefit Increases will be automatic; will not require proof of good health; and will be made without a corresponding increase in Premium. They will continue without regard to Your age, Claim status or Claim history, or length of time You have been insured under the Policy. Benefit Increases cease when: (a) the applicable maximum has been exhausted; (b) they are terminated by You; or (c) the Policy ends.] [5% Future Purchase Options: These provide a way to increase Your Benefit maximums on every 3rd anniversary of the Policy Effective Date. Increases will not be available or effective, and may be revoked or rescinded, if You are Chronically Ill or otherwise eligible for Benefits on the date the offer is accepted. You will be given the option to purchase additional coverage equal to 5% compounded annually for the 3 year period (an approximate increase of 15.8%). The increases will apply to Your then current Nursing Facility Maximum and the current amounts of other dollar maximums. The additional Premium for an increase will be based on: (1) the amount of the increase; and (2) Your age and the Premium in effect for the Policy on the date the increase takes effect. Offers and Benefit Increases cease when: (a) You have refused/declined three consecutive options to increase Benefit maximums; (b) the applicable maximum has been exhausted; (c) they are terminated by You; or (d) the Policy ends. ]
SAMPLE COPY

SAMPLE
7052 CA 3A
SCHEDULE (Continued)
We Pay [the Covered Percentage of] Covered Expenses Up to these Limits Benefits and Services Provided (except where otherwise noted) Privileged Care Coordination Services ...................... Not subject to coverage limits Nursing Facility Benefit .............................................. Nursing Facility Maximum per [day][calendar month] Residential Care Facility Benefit ................................ [[75%][100%] of the] Nursing Facility Maximum per [day][calendar month] Bed Reservation Benefit ............................................ 60 days per calendar year Home and Community Care Benefit .......................... [[50%][100%] of the] Nursing Facility Maximum per [day] [calendar month]] Home Assistance Benefit ........................................... A Policy total payment maximum equal to (Equipment, modifications & training) [[3 times Monthly][90 times Daily] the Nursing Facility Maximum] Hospice Care Benefit ................................................. Included Respite Care Benefit .................................................. 30 days per calendar year International Coverage Benefit .................................. As stated in the Benefit Waiver of Premium Benefit ........................................ Included
The Waiver of Premium applies only during periods for which Benefits are payable under the: Nursing Facility Benefit; Residential Care Facility Benefit; Bed Reservation Benefit; Home and Community Care Benefit; or Hospice Care Benefit. [This also applies when Your Spouse or Partner for Shared Coverage qualifies for Waiver of Premium under this Policy or his or her Policy.]
Your Right To Request Payment For Alternative Care ............................................ Payment subject to mutual agreement Contingent Nonforfeiture Benefit ................................ Included
The following Riders are attached to, and included in, the Policy.
[Nonforfeiture Benefit ................................................. Included] [Shared Coverage Benefit .......................................... Included with Joint Waiver] [Restoration Benefit .................................................... Included] [Transition Benefit ...................................................... A Policy total payment maximum equal to [5 times][20% of] the Nursing Facility Maximum]
The maximum total amount payable for all Covered Expenses incurred [on a day] [in a calendar month] is limited to the Nursing Facility Maximum. This does not apply to the Home Assistance Benefit and Benefits paid for requested alternative care.
SAMPLE COPY

SAMPLE
7052 CA 3B
SCHEDULE (Continued)
PREMIUM DATA
Annual Premium Basic Policy Coverage ............................................................................................... $XXX.XX [Nonforfeiture Benefit Rider .......................................................................................... $XX.XX] [Shared Coverage Rider ............................................................................................... $XX.XX Spouse or Partner for Shared Coverage Mary Jane Doe] [Restoration Benefit Rider ............................................................................................ $XX.XX] [Transition Benefit Rider ............................................................................................... $XX.XX] [Premium Credit for Replacement of Prior Coverage With Us ..................................... $XX.XX] Total Annual Premium ............................................................................................... $XXX.XX]
First Premium Premium Payment Mode Modal Premium [$aaa.aa] [Quarterly] [$bbb.bb] Premium for Premium Payment Modes other than annual are the following percentage of the Annual Premium:
Semi-Annual = 51%; Quarterly = 26%; Monthly = 9%
The following table shows the Modal Premium and total yearly cost for the available Premium Payment Modes for the Annual Premium that applies on the Policy Effective Date. These costs will change when there is a change in Your Premium. See the Modal Premium Disclosure for additional information.
Total First Year Premium Payment Options (including all optional Coverage)
Annual Semi-Annual Quarterly Monthly
Modal Premium $[XXX.XX] $[XXX.XX] $[XXX.XX] $[XXX.XX]
Total Yearly Cost for First Year Premium
$[XXX.XX] $[XXX.XX] $[XXX.XX] $[XXX.XX]
Premium Payment Period: Lifetime Rating: [Standard] [with [Insured] Couples Discount]
SAMPLE COPY

37
This document is the Final Report, Deliverable 2c pursuant to Task Order DOL-OPS-15-T-00168 (Long-Term Care Study) under Contract DOL-OPS-14-D-0021.
DISCLAIMER
The views, opinions, and/or findings contained in this report are those of the authors and should not be construed as an official Government position, policy or decision, unless so designated by other documentation issued by the appropriate governmental authority. We call your attention to the possibility that other professionals may perform procedures concerning the same information or data and reach different findings than Advanced Analytical Consulting Group, Inc. (AACG) and Deloitte Financial Advisory Services LLP (Deloitte) for a variety of reasons, including the possibilities that additional or different information or data might be provided to them that was not provided to AACG and Deloitte, that they might perform different procedures than did AACG and Deloitte, or that professional judgments concerning complex, unusual, or poorly documented matters may differ. This document contains general information only. AACG and Deloitte are not, by means of this document, rendering business, financial, investment, or other professional advice or services. This document is not a substitute for such professional advice or services, nor should it be used as a basis for any decision or action. Before making any decision or taking any action, a qualified professional adviser should be consulted. AACG and Deloitte, its affiliates, or related entities shall not be responsible for any loss sustained by any person who relies on this publication.