financial section€¦ · · 2016-09-26financial review financial summary denso corporation and...
TRANSCRIPT
Financi
Content
Financial H
Financial R
Managem
Consolida
Consolida
Consolida
Consolida
Consolida
Notes to C
Independe
al Sectio
ts
Highlights
Review
ment’s Discu
ated Balanc
ated Statem
ated Statem
ated Statem
ated Statem
Consolidate
ent Auditor
on
ussion and
ce Sheet
ment of Inco
ment of Com
ment of Cha
ment of Cas
ed Financia
r’s Report
d Analysis
ome
mprehensiv
anges in E
sh Flows
al Stateme
ve Income
quity
ents
e
1
1
1
1
2
2
5
1
2
5
14
16
18
19
20
22
56

Financial Highlights DENSO CORPORATION and its Consolidated Subsidiaries For the Years ended March 31, 2011 to 2013
Millions of yenPercent change
Thousands of U.S. dollars
2013 2012 2011 2013/2012 2013
Net Sales: ¥3,580,923 ¥3,154,630 ¥3,131,460 13.5% $38,074,673Sales in Japan 1,765,536 1,596,106 1,506,681 10.6% 18,772,313Sales outside Japan 1,815,387 1,558,524 1,624,779 16.5% 19,302,360
Net Income 181,682 89,298 143,033 103.5% 1,931,760Total Assets 3,979,093 3,607,697 3,380,433 10.3% 42,308,272Equity 2,426,861 2,117,201 2,072,443 14.6% 25,803,945Capital Expenditures 230,591 179,351 145,087 28.6% 2,451,792Depreciation 181,132 180,648 193,082 0.3% 1,925,912R&D Expenses 335,460 298,362 290,069 12.4% 3,566,826
YenPercent change U.S. dollars
Per Share: Basic net income ¥226.59 ¥110.81 ¥177.49 104.5% $2.41Cash dividends 64.00 46.00 46.00 39.1% 0.68Equity 2,891.39 2,492.92 2,435.14 16.0% 30.74
Billions of yen Percent change
Foreign Exchange: Foreign exchange gain (loss) ¥17.5 ¥(30.7) ¥(34.0) –
U.S. dollar 14.0 (19.4) (18.8) –
Euro (0.9) (3.0) (12.6) (70.0%)
Impact of ¥1/U.S.$ change 3.2 2.9 3.0 10.3%
Impact of ¥1/Euro change 0.7 0.7 0.7 0.0%
YenPercent change
Average Exchange Rate: Yen/U.S. dollar ¥82.23 ¥78.02 ¥84.68 5.4%
Yen/Euro 106.01 107.31 111.62 (1.2%)
Number of Employees 132,276 126,036 123,165 Note: U.S. dollar amounts have been translated, for convenience only, at the rate of ¥94.05=US$1, the approximate exchange rate prevailing on March 29, 2013, the last trading day of the fiscal year.
DENSO CORPORATION Annual Report 2013 1

Financial Review Financial Summary DENSO CORPORATION and its Consolidated Subsidiaries For the Years ended March 31, 2004 to 2013
2013 2012 2011 2010 2009
Net Sales: ¥3,580,923 ¥3,154,630 ¥3,131,460 ¥2,976,709 ¥3,142,665
Sales in Japan 1,765,536 1,596,106 1,506,681 1,518,105 1,615,771Sales outside Japan 1,815,387 1,558,524 1,624,779 1,458,604 1,526,894
Operating Income (Loss) 262,376 160,732 188,331 136,640 (37,309)Net Income (Loss) 181,682 89,298 143,033 73,427 (84,085)Total Assets 3,979,093 3,607,697 3,380,433 3,364,070 3,018,438
Equity*1 2,426,861 2,117,201 2,072,443 2,032,264 1,900,719Shareholders’ Equity – – – – –Capital Expenditures 230,591 179,351 145,087 114,422 314,425Depreciation 181,132 180,648 193,082 237,944 276,624R&D Expenses 335,460 298,362 290,069 270,077 297,148Net Cash Provided by Operating Activities 374,775 176,682 395,527 357,141 209,915 Per Share:
Basic net income (loss) ¥226.59 ¥110.81 ¥177.49 ¥91.11 ¥(104.13)Diluted net income – – – 91.11 –Cash dividends 64.00 46.00 46.00 27.00 40.00Equity*1 2,891.39 2,492.92 2,435.14 2,378.18 2,220.89
Ratios: Return on Sales (%) 5.1 2.8 4.6 2.5 (2.7)Current Ratio (%) 234.4 260.7 235.3 230.4 208.3Fixed Ratio (%) 73.7 73.9 77.1 83.8 97.8Return on Equity (%) 8.4 4.5 7.4 4.0 (4.3)
Average Number of Shares (in thousands) 801,828 805,895 805,871 805,892 807,469Number of Employees 132,276 126,036 123,165 120,812 119,919
Notes: 1. As of March 31, 2013, DENSO CORPORATION had 183 subsidiaries and applied the equity method of accounting to 32 affiliates. 2. U.S. dollar amounts have been translated, for convenience only, at the rate of ¥94.05=US$1, the approximate exchange rate
prevailing on March 29, 2013, the last trading day of the fiscal year.
DENSO CORPORATION Annual Report 2013 2

Millions of yen Thousands of U.S. dollars
2008 2007 2006 2005 2004 2013
¥4,025,076 ¥3,609,700 ¥3,188,330 ¥2,799,949 ¥2,562,411 $38,074,673 1,976,877 1,859,046 1,690,215 1,554,795 1,442,645 18,772,313 2,048,199 1,750,654 1,498,115 1,245,154 1,119,766 19,302,360
348,652 303,068 266,559 213,895 188,659 2,789,750 244,417 205,170 169,648 132,620 110,027 1,931,760
3,643,418 3,765,135 3,411,975 2,780,982 2,526,502 42,308,272 2,282,677 2,286,956 2,066,303 – – 25,803,945
– – 1,970,388 1,643,182 1,509,489 – 343,779 312,457 288,714 235,258 196,461 2,451,792 263,519 219,873 185,143 160,993 151,169 1,925,912 311,474 279,890 256,339 238,241 214,917 3,566,826 572,663 406,543 368,575 273,296 231,814 3,984,848
Yen U.S. dollars
¥299.96 ¥249.88 ¥204.80 ¥159.02 ¥130.02 $2.41
299.70 249.56 204.62 158.96 130.01 – 54.00 45.00 38.00 32.00 24.00 0.68
2,658.06 2,668.82 2,384.05 1,990.48 1,809.55 30.74
6.1 5.7 5.3 4.7 4.3 162.6 151.0 160.6 161.4 163.0 95.6 104.1 102.1 98.2 97.2 11.3 9.9 9.4 8.4 7.6
814,833 821,060 825,725 830,869 842,005 118,853 112,262 105,723 104,183 95,461
*1 The “Equity” section was newly provided to conform to a new Japanese accounting standard for the fiscal year ended March 31, 2006,and after.
DENSO CORPORATION Annual Report 2013 3

Sales by Segment DENSO CORPORATION and its Consolidated Subsidiaries For the Years ended March 31, 2010 to 2013
Millions of yen Thousands of
U.S. dollars
2013 2012 2011 2010 2013
Japan Customers ¥1,808,850 ¥1,639,962 ¥1,548,201 ¥1,553,492 $19,232,855
Intersegment 654,775 557,670 564,733 487,823 6,961,988
Total 2,463,625 2,197,632 2,112,934 2,041,315 26,194,843
North America Customers 624,974 504,075 528,868 468,965 6,645,125
Intersegment 10,424 8,042 7,172 5,442 110,835
Total 635,398 512,117 536,040 474,407 6,755,960
Europe Customers 348,769 373,214 389,584 401,967 3,708,336
Intersegment 23,467 13,978 11,748 9,116 249,516
Total 372,236 387,192 401,332 411,083 3,957,852
Asia & Oceania Customers 734,525 579,752 604,651 494,596 7,809,942
Intersegment 59,516 46,969 47,817 39,510 632,812
Total 794,041 626,721 652,468 534,106 8,442,754
Total Customers 3,517,118 3,097,003 3,071,304 2,919,020 37,396,257
Intersegment 748,182 626,659 631,470 541,891 7,955,152
Total 4,265,300 3,723,662 3,702,774 3,460,911 45,351,409
Others Customers 63,805 57,627 60,156 57,689 678,416
Intersegment 123 101 177 151 1,307
Total 63,928 57,728 60,333 57,840 679,723
Consolidated Customers 3,580,923 3,154,630 3,131,460 2,976,709 38,074,673
Intersegment 748,305 626,760 631,647 542,042 7,956,459
Total ¥4,329,228 ¥3,781,390 ¥3,763,107 ¥3,518,751 $46,031,132Notes: 1. The Group has reported Japan, North America, Europe and Asia & Oceania as its reportable segments since April 2010, in conformity with
revised ASBJ Statement No. 17, “Accounting Standard for Segment Information Disclosures,” and ASBJ Guidance No. 20, “Guidance on Accounting Standard for Segment Information Disclosures,” issued by the ASBJ, the Accounting Standards Board of Japan, in March 2008. The Group has been manufacturing and selling mainly automotive products in each reportable segment.
2. U.S. dollar amounts have been translated, for convenience only, at the rate of ¥94.05=US$1, the approximate exchange rate prevailing on March 29, 2013, the last trading day of the fiscal year.
3. “Others” is a business segment that is not included in reported segments. It includes business activities of subsidiaries in Brazil, etc.
DENSO CORPORATION Annual Report 2013 4

Management’s Discussion and Analysis
Business Overview During fiscal year 2013, the year ended March 31, 2013, the global economy achieved a measure of growth in regions outside Europe, where conditions remained weak due to the European debt crisis. The growth was moderate as a whole, mainly due to a slowdown in emerging markets that had pre-viously fueled growth, such as China. In Japan, pump-priming measures implemented since the lat-ter half of the fiscal year 2013 pushed up the economic growth rate. In the automotive industry, the worldwide market generally expanded at a moderate pace, supporting a record-high automobile sales volume. Expansion was driven by steady growth in North America, along with increased auto-mobile sales in the Southeast Asia region and other emerging markets. Notably, Japan’s auto market experienced significant growth on a full year basis, owing to a boost in automobile sales from subsi-dies for eco-friendly cars, as well as the rebound from the stagnation due to the impact of the Great East Japan Earthquake that struck in 2011. DENSO CORPORATION and its consolidated subsidiar-ies (“the Group”) saw improvement in business results due to a correction in the historically strong yen, which had persisted over the past few years, along with increased auto production in Japan, North America and Asia & Oceania. This was despite the impact of a drop in production due to re-strained purchasing of Japanese automobiles in China. Management Strategy Under the Group’s three-year Global Mid-term Policy, which was formulated in 2012, the Group em-braced the following key priorities: Strategies to expand business for ensuring our continuous growth in future years; Evolve by continuing to develop world’s-first products; and Facilitating Group-wide collaboration worldwide and speeding-up corporate management. Guided by these key priorities, the Group has been endeavoring to drive business expansion.
In the fiscal year 2013, we made the following key achievements centered on the environment and safety areas.
In the area of the environment, we developed a lithium-ion battery pack to be the core component of idle stop/start systems, thereby enabling a vehicle’s engine to be stopped when the vehicle is at rest. The new battery pack will serve as a technology that will help to improve fuel economy by up-grading existing engines. It consists of lithium-ion battery cells, a battery management unit and a power supply control switch. And it is designed to use more regenerative power than current conven-tional systems that only use a lead-acid battery. In air conditioning systems, we developed a Cold Storage Evaporator, which limits the increase in vehicle cabin temperature during an idle stop when stop/start technology is employed. These products are fitted to the new Wagon R model of Suzuki Motor Corporation launched in October 2012. Furthermore, products such as the Group’s injectors and high-pressure pumps for next-generation gasoline direct-injection systems, which help to im-prove the efficiency of internal combustion engines, were chosen for use in the SKYACTIV-G high-efficiency direct-injection gasoline engine of Mazda Motor Corporation. In diesel vehicles, the Group became the world’s first to commercialize the i-ART next generation common rail system for clean diesel. i-ART technology is designed to accurately control the fuel injection amount and timing using sensors fitted to injectors. The new technology reduces emissions while helping to improve fuel economy. This product was fitted to Toyota Motor Corporation’s Hilux model for Brazil. In hybrid and electric vehicles, the Group mass-produces key parts such as inverters. The Group’s compact, high-output double-sided cooling type inverter has been fitted to the latest hybrid Crown model of Toyota Motor Corporation.
In the area of safety, as preventive safety technology to avoid traffic accidents and collision safety technology that mitigates vehicle damage comes to attract attention, the Group has been pursuing R&D activities focused on innovative safety technologies. These R&D activities leverage the Group’s strengths in possessing an array of sensor, Engine Control Unit (ECU) and Human Machine Inter-face (HMI)* products that can be applied to various safety systems. The Group is supplying pre-crash safety system sensors for the Lexus LS lineups of Toyota Motor Corporation. Furthermore, the Group’s pedestrian collision detection sensor has been adopted for use in the pop-up hood system fitted to the latest hybrid Crown model. This system is designed to automatically lift the rear section of the engine hood when detecting a collision, thereby creating a larger buffer space between the hood and hard components that will cushion the impact on the pedestrian. Moreover, the Group has
DENSO CORPORATION Annual Report 2013 5

developed a new laser radar system, a first for compact cars, that is used as a braking sensor for the Smart Assist System of the Move model of Daihatsu Motor Co., Ltd. to help avoid low-speed colli-sions. The Group’s new millimeter-wave radar, featuring a longer and wider-angle detection range, has been fitted to the Mazda6 model (Atenza in Japan) of Mazda Motor Corporation. This radar can detect vehicles ahead from farther away and across a wider angle, helping to expand the operating range of vehicle Pre-Crash Safety (PCS) and Adaptive Cruise Control (ACC) systems. * A collective term for display, driving and control features that promote safety and reliability accord-ing to the status of drivers and their surroundings.
In regard to the development framework, the Group has put in place a development network in seven regions around the world, following the start of operations at new technical centers in Brazil and India. The framework will promptly identify needs in each region and reflect them in product development. Besides various experiments and evaluations, the technical center in India conducts cutting-edge software development in support of product development in other regions. Equipped with a wind tunnel and other testing facilities, the technical center in Brazil is rapidly developing com-petitive products while shortening lead times for development.
In terms of the production and supply system, in Japan, besides the two in-house automotive semiconductor production plants the Group already owns, the Group has established DENSO IWATE CORPORATION as a new semiconductor production site. Overseas, the Group has decided to establish DENSO Cambodia Co., Ltd. to produce sensor components for ignition magnetos for motorcycles in Cambodia to address future expansion in customer demand. In Poland, DENSO Po-land Sp.zo.o has been decided to be established to produce instrument clusters for automobiles. The Group has also begun building new plants in Mexico and Indonesia.
Furthermore, to enhance the cost competitiveness of production operations in Japan, the Group is working to establish lean, competitive and outstanding “Dantotsu (extremely competitive) Plants” in Japan. These plants aim to switch to high-speed, high-utilization production lines, rationalize logistics within plants, dramatically improve productivity and sharply reduce energy consumption. DENSO has established a model plant and is expanding best practices across various plants. Several production lines have started to show results.
In the consumer products business, the Group worked to expand sales of repair and replacement parts for automobiles, along with rolling out automotive accessories that fit customer needs. The Group launched JHORN HYPER, a horn with the world’s first acoustic structure of its kind. The horn produces a clear sound that reverberates clearly in front of the vehicle. Colorful Wiper was a new product launched for the Aqua compact hybrid vehicle of Toyota Motor Corporation. By adding color to ordinary rear wiper arms and blades, Colorful Wiper allows users to customize their wipers ac-cording to their preferences. Furthermore, the Group developed a wireless recharger for smartphones, the world’s first of its kind for automobile use.
The Group conducts corporate citizenship activities with the aim of helping to achieve a sustaina-ble society by developing innovative technology and manufacturing high-quality products, while seeking to become a corporate group that is trusted by all stakeholders. The Group has conducted various activities to support the Great East Japan Earthquake recovery effort, and plans to continue these activities in the fiscal year 2014.
Net Sales Consolidated net sales for the fiscal year ended March 31, 2013, increased compared with the pre-vious year, rising ¥426.3 billion, or 13.5%, to ¥3,580.9 billion. The increase was mainly due to in-creased vehicle production in North America and Asia & Oceania, along with a rebound in vehicle production in Japan.
DENSO CORPORATION Annual Report 2013 6
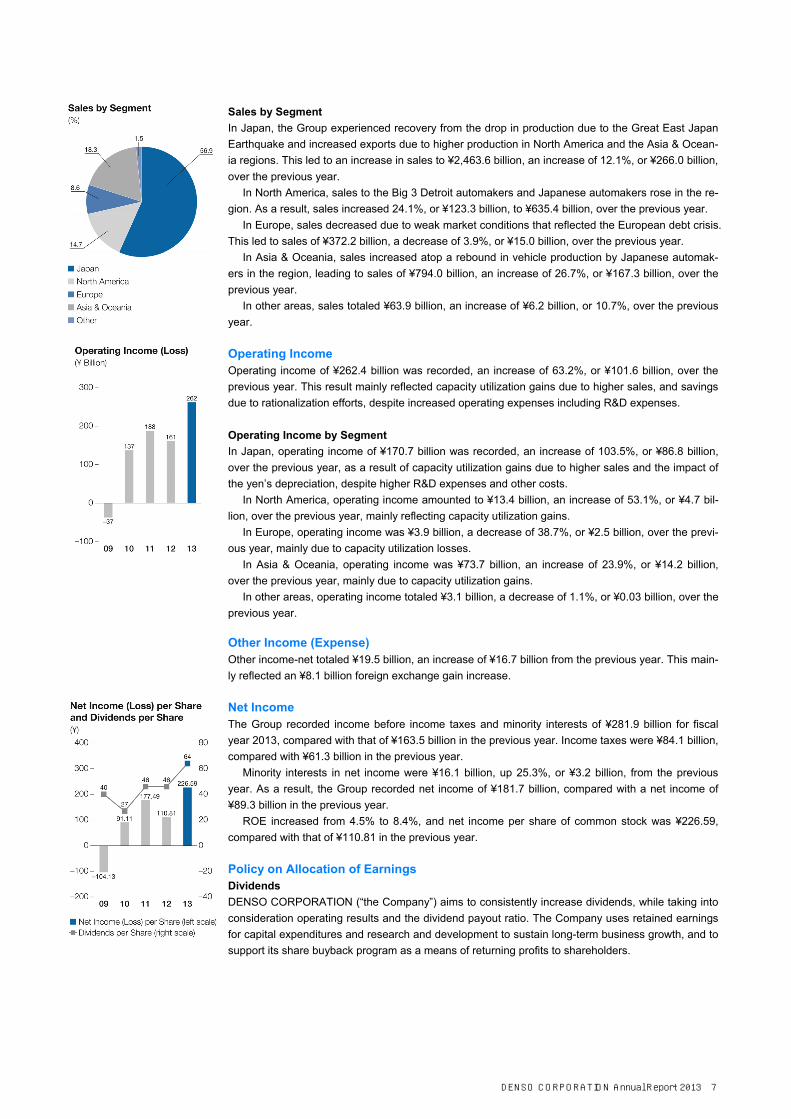
Sales by Segment In Japan, the Group experienced recovery from the drop in production due to the Great East Japan Earthquake and increased exports due to higher production in North America and the Asia & Ocean-ia regions. This led to an increase in sales to ¥2,463.6 billion, an increase of 12.1%, or ¥266.0 billion, over the previous year.
In North America, sales to the Big 3 Detroit automakers and Japanese automakers rose in the re-gion. As a result, sales increased 24.1%, or ¥123.3 billion, to ¥635.4 billion, over the previous year.
In Europe, sales decreased due to weak market conditions that reflected the European debt crisis. This led to sales of ¥372.2 billion, a decrease of 3.9%, or ¥15.0 billion, over the previous year.
In Asia & Oceania, sales increased atop a rebound in vehicle production by Japanese automak-ers in the region, leading to sales of ¥794.0 billion, an increase of 26.7%, or ¥167.3 billion, over the previous year.
In other areas, sales totaled ¥63.9 billion, an increase of ¥6.2 billion, or 10.7%, over the previous year. Operating Income Operating income of ¥262.4 billion was recorded, an increase of 63.2%, or ¥101.6 billion, over the previous year. This result mainly reflected capacity utilization gains due to higher sales, and savings due to rationalization efforts, despite increased operating expenses including R&D expenses. Operating Income by Segment In Japan, operating income of ¥170.7 billion was recorded, an increase of 103.5%, or ¥86.8 billion, over the previous year, as a result of capacity utilization gains due to higher sales and the impact of the yen’s depreciation, despite higher R&D expenses and other costs.
In North America, operating income amounted to ¥13.4 billion, an increase of 53.1%, or ¥4.7 bil-lion, over the previous year, mainly reflecting capacity utilization gains.
In Europe, operating income was ¥3.9 billion, a decrease of 38.7%, or ¥2.5 billion, over the previ-ous year, mainly due to capacity utilization losses.
In Asia & Oceania, operating income was ¥73.7 billion, an increase of 23.9%, or ¥14.2 billion, over the previous year, mainly due to capacity utilization gains.
In other areas, operating income totaled ¥3.1 billion, a decrease of 1.1%, or ¥0.03 billion, over the previous year. Other Income (Expense) Other income-net totaled ¥19.5 billion, an increase of ¥16.7 billion from the previous year. This main-ly reflected an ¥8.1 billion foreign exchange gain increase. Net Income The Group recorded income before income taxes and minority interests of ¥281.9 billion for fiscal year 2013, compared with that of ¥163.5 billion in the previous year. Income taxes were ¥84.1 billion, compared with ¥61.3 billion in the previous year.
Minority interests in net income were ¥16.1 billion, up 25.3%, or ¥3.2 billion, from the previous year. As a result, the Group recorded net income of ¥181.7 billion, compared with a net income of ¥89.3 billion in the previous year.
ROE increased from 4.5% to 8.4%, and net income per share of common stock was ¥226.59, compared with that of ¥110.81 in the previous year. Policy on Allocation of Earnings Dividends DENSO CORPORATION (“the Company”) aims to consistently increase dividends, while taking into consideration operating results and the dividend payout ratio. The Company uses retained earnings for capital expenditures and research and development to sustain long-term business growth, and to support its share buyback program as a means of returning profits to shareholders.
DENSO CORPORATION Annual Report 2013 7

In accordance with the enactment of the Companies Act of Japan in May 2006, the Company had altered its Articles of Incorporation to accommodate the flexible allocation of future earnings. For the time being, however, the Company has decided to continue paying a twice-yearly dividend. For a year-end dividend, the approval of the general shareholders’ meeting is needed.
Taking into consideration the operating results for the fiscal year under review, the Company has decided upon a year-end dividend of ¥37 per share, and decided to pay an annual dividend for the fiscal year ended March 31, 2013, of ¥64 per share. Treasury Stock Repurchases The Company repurchases its own shares as part of its strategy to increase ROE, return profits to shareholders and implement a flexible capital policy in response to changes in the operating envi-ronment. As of March 31, 2013, the Company had repurchased a total of 165 million shares at an aggregate cost of ¥376.5 billion since the introduction of the share buyback program in the year ended March 31, 1997. This represents 19% of all the Company’s outstanding shares as of March 31, 1997. In fiscal year 2013, the Company repurchased 11 million shares in the market at a cost of ¥27.5 billion. In the future, while giving consideration to cash flows, the Company will maintain this share repurchasing policy as an important tool in improving ROE and increasing shareholder value. Source of Funds and Liquidity Risk Management The Group’s fundamental financial policy is designed to: ensure efficient funding and management of funds for the operational activities of the entire Group; secure an optimum level of funds and li-quidity; and maintain a sound financial position. Financial Position Total assets as of March 31, 2013, stood at ¥3,979.1 billion, 10.3%, or ¥371.4 billion, more than the previous fiscal year-end.
Current assets increased 7.6%, or ¥161.8 billion, to ¥2,281.9 billion, primarily reflecting increases in cash and deposits.
Property, plant and equipment increased 10.6%, or ¥85.3 billion, to ¥886.2 billion, mainly due to aggressive capital investment.
Investments and other assets increased 18.1%, or ¥124.3 billion, to ¥811.0 billion, mainly due to an increase of investment in securities.
The total of current and long-term liabilities increased 4.1%, or ¥61.7 billion, to ¥1,552.2 billion, due to an increase of income tax payable. Interest-bearing debt decreased 3.0%, or ¥15.6 billion, to ¥507.5.
Equity increased 14.6%, or ¥309.7 billion, to ¥2,426.9 billion, primarily reflecting increases in un-realized gain on available-for-sale securities and retained earnings. Cash Flows In terms of cash flows for the fiscal year ended March 31, 2013, net cash provided by operating activities was ¥374.8 billion, net cash used in investing activities was ¥269.2 billion, and net cash used in financing activities was ¥98.5 billion. As a result, cash and cash equivalents increased ¥41.9 billion to ¥707.3 billion.
Net cash provided by operating activities for the fiscal year ended March 31, 2013, totaled ¥374.8 billion, ¥198.1 billion more than in the previous year. Cash flows chiefly reflected an operat-ing income of ¥262.4 billion, an increase of ¥101.6 billion from last year.
Investing activities used net cash of ¥269.2 billion, ¥2.1 billion less than in the previous fiscal year. This mainly reflected a change in time deposits, an increase of ¥104.1 billion over the previous year. In addition, an increase of ¥353.6 billion in purchase of available-for-sale securities and an increase of ¥302.2 billion in proceeds from sales and redemption of available-for-sale securities are also reflected in the decrease of net cash used in investing activities.
Financing activities used net cash of ¥98.5 billion. This was mainly due to an increase in repay-ment of long-term bonds, ¥50.0 billion less than in the previous year.
DENSO CORPORATION Annual Report 2013 8

Capital Expenditures/Depreciation The Group applies a number of benchmarks to ensure correct decisions are made with regard to capital expenditures. These benchmarks include projected cash flow, ROA, the number of years to recover investments, and forecasts of profitability. As part of a drive to reduce medium-term fixed costs, the Group is minimizing the scale of its production lines, standardizing components, and using global procurement to reduce facilities costs.
Capital expenditures during the fiscal year ended March 31, 2013, totaled ¥230.6 billion, an in-crease of 28.6%, or ¥51.2 billion, from the previous year. Depreciation increased 0.3%, or ¥0.5 billion, to ¥181.1 billion. Capital Expenditures/Depreciation by Segment As regards capital expenditures by geographic segment, the Group focused for all regions on in-vestments to increase production, and mainly invested in new products and rationalization measures. As a result, capital expenditures in Japan were ¥124.3 billion, an increase of 20.6%, or ¥21.3 billion.
In regions outside Japan, capital expenditures in North America were ¥20.5 billion, an increase of 67.7%, or ¥8.3 billion, capital expenditures in Europe were ¥19.1 billion, an increase of 2.6%, or ¥0.5 billion. Capital expenditures in Asia & Oceania were ¥62.6 billion, an increase of 63.7%, or ¥24.4 billion and capital expenditures in other areas were ¥4.1 billion, an decrease of 43.3%, or ¥3.1 billion. In Japan, depreciation amounted to ¥136.0 billion, a decrease of 2.5%, or ¥3.5 billion. Meanwhile, depreciation amounted to ¥14.5 billion, a decrease of 0.7%, or ¥0.1 billion, in North America; to ¥10.8 billion, a decrease of 3.9%, or ¥0.4 billion in Europe; to ¥23.0 billion, a increase of 20.9%, or ¥4.0 billion, in Asia & Oceania; and to ¥2.3 billion, an increase of 4.2%, or ¥0.1 billion, in other areas. Research and Development (R&D) Activities The Group is pressing ahead with technological development in order to help develop environmental-ly friendly and safe automobiles that people can enjoy with peace of mind, and contribute to the crea-tion of an automotive society. Within this framework, we have strengthened development activities in the areas of the environment, particularly fuel economy, as well as security and safety.
In terms of achievements in the fiscal year ended March 31, 2013, in the area of fuel economy, the Group became the world’s first to commercialize the i-ART next-generation common rail technol-ogy for diesel vehicles. i-ART technology is designed to accurately control the fuel injection amount and timing using sensors fitted to injectors. The new technology reduces emissions while helping to improve fuel economy. This product was fitted to Toyota Motor Corporation’s Hilux model for Brazil. We also developed a lithium-ion battery pack that will help to improve the fuel economy of idle stop/start systems, and a Cold Storage Evaporator, which limits the increase in vehicle cabin tem-perature during an idle stop in the case that idle stop/start technology is employed. Together with the tandem solenoid starter, which can stop and restart the engine when it decelerates, these products have been fitted to the new Wagon R model of Suzuki Motor Corporation, and have helped to make “ENE-CHARGE” and “ECO-COOL” technologies a reality.
Furthermore, as part of the “Demonstration of Next-Generation Energy and Social Systems” pro-ject launched in April 2010, we have developed a vehicle-to-home (V2H) power supply system for electric vehicles (EV), which is designed to work in coordination with DENSO’s home energy man-agement system (HEMS). The V2H system can quickly charge an EV with direct current from the HEMS storage battery, and can supply the electricity in the EV back to the household. In addition, the system can efficiently distribute electricity, including power generated by residential photovoltaic systems (solar panels), to the EV and to the home through the coordination of the HEMS.
In the area of security and safety, we developed a new vision sensor for use in Lane Departure Warning (LDW) and Automatic High Beam (AHB) Control Systems for the Lexus ES model of Toyota Motor Corporation, as well as a new millimeter-wave radar for vehicle Pre-Crash Safety (PCS) and Adaptive Cruise Control (ACC) systems that has been fitted to the Mazda6 model (Atenza in Japan) of Mazda Motor Corporation. Moreover, DENSO has developed a new laser radar system that is used for the Smart Assist System for the Move model of Daihatsu Motor Co., Ltd. to help avoid low-speed collisions. We also developed and commercialized a pedestrian collision detection sensor for use in the latest hybrid Crown model of Toyota Motor Corporation.
DENSO CORPORATION Annual Report 2013 9

Turning to the development framework, in Japan the Group plans to build an evaluation building to develop and evaluate power electronics products, especially key parts for hybrid vehicles, such as inverters. We also plan to build a new prototype building designed to increase coordination between engineers and technicians and to enhance technology development efficiency. Furthermore, the Group is strengthening its development framework centered on technical centers in six overseas regions around the world, namely, the U.S., Europe, Asia & Oceania, China, India and Brazil. In the fiscal year ended on March 31, 2013, we held opening ceremonies at technical centers in Brazil and India and began development operations at each technical center in earnest. Efforts are also focused on enhancing advanced technology development centered in the U.S. and in Europe.
Furthermore, we recently formulated the DENSO Group Long-term Policy 2020. This policy’s slo-gan is “Protecting lives, Preserving the Planet, and Preparing a bright future for generations to come.” Under this policy, to ensure that automobiles remain endearing to people globally, DENSO has made a commitment to deliver convenience and joy of driving to people all over the world, while working to achieve its mission with an emphasis on preserving the planet and ensuring security and safety. Go-ing forward, we will continue to work towards achieving our Long-term Policy by bolstering R&D ac-tivities centered on the environment and security and safety, with the aim of delivering new products and new value that contribute to society.
R&D expenses of the entire Group for the fiscal year ended March 31, 2013, amounted to ¥335.5 billion. The breakdown of expenses is ¥294.4 billion for the Japan segment, ¥13.6 billion for the North America segment, ¥7.9 billion for the European segment, ¥19.0 billion for the Asia & Oceania segment, and ¥0.7 billion for other areas. Currently R&D costs for the overseas segment comprise about 12% of total costs, but we plan to increase this percentage as we expand and improve our R&D organization. Risk Management Economic Risk Demand for auto parts, which account for the major part of the Group’s operating revenue around the globe, is easily affected by the economic situation in the countries and regions where the Group has sales bases. Accordingly, an economic downturn and resulting decrease in demand for auto parts in the Group’s major markets, including Japan, North America, Europe, Asia & Oceania, may have an adverse effect on the Group’s operating results and financial condition.
Further, Group operations can be indirectly affected by the economic situation in regions where competitors have their manufacturing bases. For example, if a competitor is able to employ local labor at lower cost and provide equivalent products at prices below those of the Group, this may ad-versely affect sales. Further, if the local currency of regions where parts and raw materials are sourced falls, there is a chance that the manufacturing cost not only for the Group, but also for other manufacturers, will fall. As a result of these trends, export and price wars may intensify, and have an adverse effect on the Group’s operating results and financial condition. Exchange Rate Risk Operations within the Group include the sale and manufacture of products around the world. All re-gional items in local currency including sales, costs and assets are converted to yen for the purpose of creating consolidated financial statements. Based on the exchange rate used in conversion, even though items have not changed as an amount of local currency, there is a possibility that the amount expressed in yen after the conversion has been changed. In general, a strong yen (in particular against the U.S. dollar and euro that constitute a major part of the Group’s sales) has an adverse effect on the Group’s operations, and a weak yen has a positive effect on the Group’s operations.
For Group operations that manufacture in Japan and export, a strong yen against other currencies decreases the worldwide comparative price competitiveness of their products and can have an ad-verse effect on operating results. The Group performs currency hedging, and makes efforts to mini-mize the adverse effect of short-term fluctuations in the exchange rates of major currencies including the U.S. dollar, euro and yen. However, as a result of medium- and long-term movements in ex-change rates, there are cases where procurement, manufacturing, distribution and sales cannot be performed exactly as planned and, as a result, exchange rate movements may have an adverse effect on the Group’s operating results and financial condition.
DENSO CORPORATION Annual Report 2013 10

Raw Materials and Component Supply Risk The Group procures raw materials and components used to manufacture its products from numer-ous external vendors. Although basic business contracts have been concluded with these external vendors, and transactions are generally stable, there is no guarantee against shortages or sharply higher prices for raw materials and components due to fluctuations in market conditions, unforeseen accidents at vendors or other such events. In such cases, the Group could incur higher manufactur-ing costs or be forced to halt production, which may in turn have an adverse effect on the Group’s operating results and financial condition. New Product Development Risk While the Group believes that it can continue to develop original and appealing new products, the product development and sales process is, by its nature, complex and uncertain, and is subject to the following risks:
There is no guarantee of acquiring sufficient funds and resources for investment in new products and new technologies.
There is no guarantee that long-term investment and allocation of large amounts of re-sources will lead to the development of successful new products and the creation of new technologies.
It is not certain that the Group will be able to correctly predict which new products and new technologies will earn the support of the Group’s customers, and there is no guarantee that the sales of these products will be successful.
As a result of fast-paced technological advances and changes in market needs, there is a possibility that the Group’s products will become outdated.
As a result of delays in the commercialization of new technologies under development, there is a possibility that market demands might not be met.
Beginning with the risks outlined above, if the Group is unable to fully anticipate industry and market changes, and is unable to develop attractive new products, this may result in a drop in future growth and profitability and may have an adverse effect on the Group’s operating results and finan-cial condition. Pricing Risk Price competition in the automotive industry is fierce. In particular, demands for price reductions by automakers have increased in recent years.
Further, it can be foreseen that the Group will face intensified competition in the component fields and regional markets that it operates in. Competitors include other component manufacturers, and some of these manufacturers are providing products at a lower price than the Group. Also, in line with the evolution of the automotive electronics business, there has been a rise in new competitors, such as consumer-electronics manufacturers and tie-ups between existing competitors, and there is a chance that they will quickly gain a large share in the market.
While we believe that the Group is the leading component manufacturer in the world and contin-ues to develop automotive parts that are technically advanced, of high quality and high added value, there is no guarantee that the Group will be able to compete effectively in the future. There is al-ways a possibility that pricing pressure and ineffective competitive practices on the Group’s part will lead to a decrease in customers, which may have an adverse effect on the Group’s operating re-sults and financial condition.
DENSO CORPORATION Annual Report 2013 11

Potential Risks of International Activities and Overseas Expansion The proportion of manufacturing and sales activities carried out in the Americas and Europe, as well as in developing and emerging markets in Asia & Oceania, has been increasing in recent years. Ex-pansion into these overseas markets has the following inherent risks, which if they materialize, may have an adverse effect on the Group’s operating results and financial condition.
Unforeseen change in laws or regulations. Unfavorable political or economic conditions. Difficulties in employing and retaining personnel. Inadequate social infrastructure that may adversely affect the Group’s business activities. The potentially adverse impact of tax regulations. Social or economic turmoil caused by terrorist incidents, military conflict, epidemics and
other events. Intellectual Property Risk The Group has accumulated technology and expertise that allows it to differentiate its products from those of its competitors. However, legal restrictions in certain regions and countries are inadequate to fully protect these technologies and expertise as intellectual property. Consequently, the Group may not be able to effectively prevent third parties from using its intellectual property to manufacture simi-lar products. Additionally, because the Group’s products employ a broad range of technologies, there is a possibility that these products may be judged to have infringed third-party intellectual property rights in the future. OEM Customer Risk The OEM business, which constitutes the majority of the Group’s business, serves automobile manu-facturers around the world and supplies a wide range of products, including air conditioning, engine, driving control and safety, and information and communication products. Sales to OEM customers are liable to be affected by factors that the Group cannot control such as the operating results of the OEM customer, while demands for reduced prices from the OEM customer may reduce the Group’s profit margins. Further, there is a possibility that OEM customer business downturns, unforeseen contract cancellations, changes in OEM customer procurement policies, and price cuts to satisfy large cus-tomers may have an adverse effect on the Group’s operating results and financial condition.
Sales to the Toyota Group account for roughly half of the Group’s sales. Such sales made to a specific client group can be significantly impacted by the operating results of the customer. Product Defect Risk The Group manufactures a variety of products to meet internationally recognized quality control standards at factories around the world. However, there is no guarantee that all the Group’s products are defect-free and that there will be no product recalls in the future. Also, while the Group does have product liability insurance coverage, there is no guarantee that this insurance will completely cover any compensation that the Group may be forced to pay. Further, the Group may not be able to con-tinue to subscribe to this insurance under conditions acceptable to the Group. Product defects that lead to large-scale product recalls or product liability compensation could have a huge cost and large impact on the Group’s reputation, and this may lead to a decrease in sales and adversely affect the Group’s operating results and financial condition. Risks of Natural Disasters and Power Outages In order to minimize the potential negative impact of manufacturing lines being shut down, the Group carries out disaster-prevention inspections and equipment checks on a regular basis.
However, there is no guarantee that the Group can totally prevent or reduce the impact of natural disasters, power outages or other stoppages of the Group’s manufacturing lines and those of the Group’s corporate customers and suppliers. For example, many of the Group’s places of business are in the Tokai region, and if a disastrous earthquake were to hit this region, there is a possibility that the Group’s production and delivery activities would be suspended.
DENSO CORPORATION Annual Report 2013 12

Pension Liability Risk Costs and liabilities for employees’ retirement benefits are calculated based on actuarial assump-tions such as the discount rate and the expected rate of return on pension assets. When actual re-sults differ from the assumptions used for calculation, or when changes are made to the assumptions, the effect is accumulated and brought forward into future calculations, generally resulting in an im-pact on reported future costs and liabilities. Legal Proceedings The Group endeavors to ensure continual legal compliance in the course of its business activities. Nevertheless, it is possible that the Group may become party to legal proceedings due to judicial action or the actions of a regulating authority. Accordingly, such an event may have an adverse ef-fect on the Group’s operating results and financial condition.
DENSO CORPORATION Annual Report 2013 13

Consolidated Balance Sheet DENSO CORPORATION and its Consolidated Subsidiaries March 31, 2013
Millions of yen
Thousands of U.S. dollars (Note 1)
Assets 2013 2012 2013
Current Assets: Cash and cash equivalents (Note 16) ¥707,330 ¥665,409 $7,520,787
Short-term investments (Notes 3 and 16) 387,874 356,733 4,124,125
Notes and accounts receivable (Note 16): Trade 629,397 610,753 6,692,153
Affiliates 10,653 9,403 113,270
640,050 620,156 6,805,423
Less: Allowance for doubtful accounts (1,828) (1,638) (19,437)
638,222 618,518 6,785,986
Inventories (Note 4) 370,662 324,513 3,941,116
Deferred tax assets (Note 6) 62,969 61,274 669,527
Other current assets 114,829 93,661 1,220,936
Total current assets 2,281,886 2,120,108 24,262,477
Property, Plant and Equipment (Notes 5 and 8):
Land 165,740 159,762 1,762,254
Buildings and structures 759,708 715,533 8,077,703
Machinery and equipment 2,779,936 2,598,104 29,558,065
Construction in progress 90,075 65,280 957,735
3,795,459 3,538,679 40,355,757
Less: Accumulated depreciation (2,909,299) (2,737,791) (30,933,535)
Net property, plant and equipment 886,160 800,888 9,422,222
Investments and Other Assets:
Investment securities (Notes 3 and 16) 616,659 478,372 6,556,715
Investments in and advances to affiliates (Note 16) 51,198 43,565 544,370
Prepaid pension cost (Note 9) 82,787 72,634 880,244
Intangible assets 15,456 15,528 164,338
Deferred tax assets (Note 6) 18,236 51,020 193,897
Other assets 26,711 25,582 284,009
Total investments and other assets 811,047 686,701 8,623,573
Total ¥3,979,093 ¥3,607,697 $42,308,272See accompanying notes to the consolidated financial statements.
DENSO CORPORATION Annual Report 2013 14
Millions of yen Thousands of U.S.
dollars (Note 1)
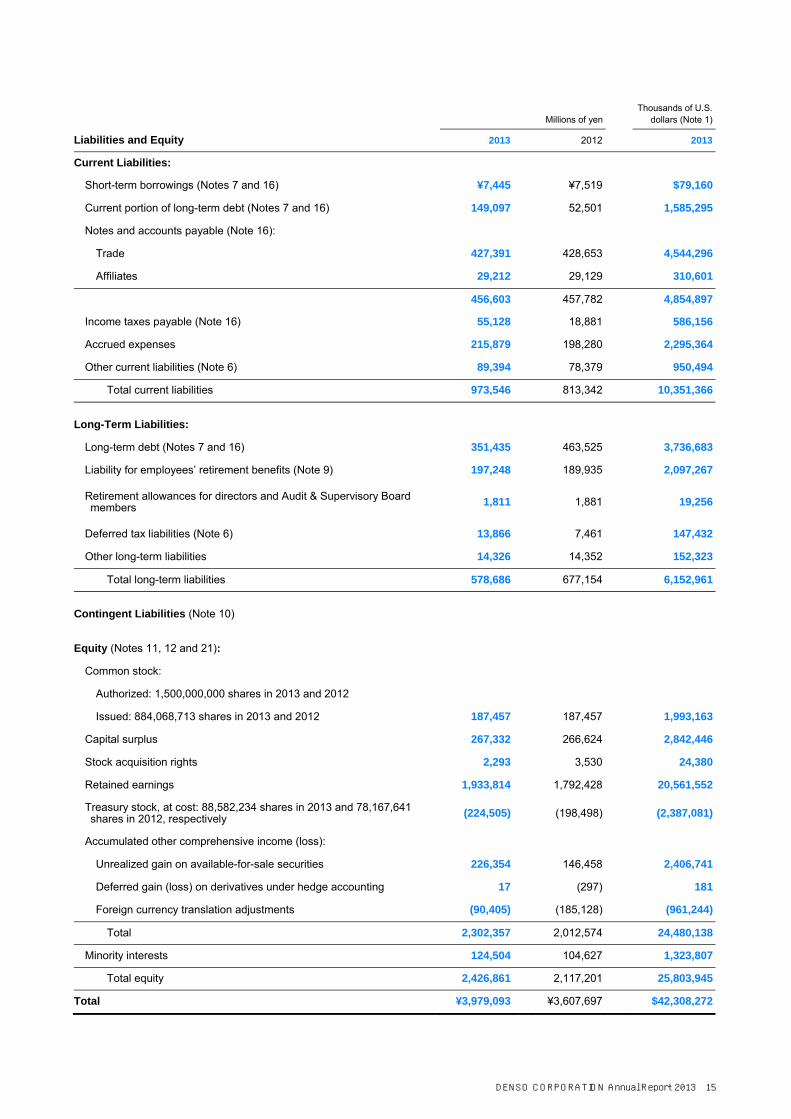
Liabilities and Equity 2013 2012 2013
Current Liabilities:
Short-term borrowings (Notes 7 and 16) ¥7,445 ¥7,519 $79,160
Current portion of long-term debt (Notes 7 and 16) 149,097 52,501 1,585,295
Notes and accounts payable (Note 16):
Trade 427,391 428,653 4,544,296
Affiliates 29,212 29,129 310,601
456,603 457,782 4,854,897
Income taxes payable (Note 16) 55,128 18,881 586,156
Accrued expenses 215,879 198,280 2,295,364
Other current liabilities (Note 6) 89,394 78,379 950,494
Total current liabilities 973,546 813,342 10,351,366
Long-Term Liabilities:
Long-term debt (Notes 7 and 16) 351,435 463,525 3,736,683
Liability for employees’ retirement benefits (Note 9) 197,248 189,935 2,097,267
Retirement allowances for directors and Audit & Supervisory Board members 1,811 1,881
19,256
Deferred tax liabilities (Note 6) 13,866 7,461 147,432
Other long-term liabilities 14,326 14,352 152,323
Total long-term liabilities 578,686 677,154 6,152,961
Contingent Liabilities (Note 10)
Equity (Notes 11, 12 and 21):
Common stock:
Authorized: 1,500,000,000 shares in 2013 and 2012
Issued: 884,068,713 shares in 2013 and 2012 187,457 187,457 1,993,163
Capital surplus 267,332 266,624 2,842,446
Stock acquisition rights 2,293 3,530 24,380
Retained earnings 1,933,814 1,792,428 20,561,552
Treasury stock, at cost: 88,582,234 shares in 2013 and 78,167,641 shares in 2012, respectively (224,505) (198,498) (2,387,081)
Accumulated other comprehensive income (loss):
Unrealized gain on available-for-sale securities 226,354 146,458 2,406,741
Deferred gain (loss) on derivatives under hedge accounting 17 (297) 181
Foreign currency translation adjustments (90,405) (185,128) (961,244)
Total 2,302,357 2,012,574 24,480,138
Minority interests 124,504 104,627 1,323,807
Total equity 2,426,861 2,117,201 25,803,945
Total ¥3,979,093 ¥3,607,697 $42,308,272
DENSO CORPORATION Annual Report 2013 15

Consolidated Statement of Income DENSO CORPORATION and its Consolidated Subsidiaries Year ended March 31, 2013
Millions of yen Thousands of U.S.
dollars (Note 1)
2013 2012 2011 2013
Net Sales (Note 13) ¥3,580,923 ¥3,154,630 ¥3,131,460 $38,074,673
Cost of Sales (Note 14) 3,007,614 2,719,890 2,661,963 31,978,884
Gross profit 573,309 434,740 469,497 6,095,789
Selling, General and Administrative Expenses (Note 14) 310,933 274,008 281,166 3,306,039
Operating income 262,376 160,732 188,331 2,789,750
Other Income (Expenses):
Interest and dividend income 15,906 16,082 14,175 169,123
Interest expense (6,681) (6,596) (5,208) (71,037)
Equity in earnings of affiliates 5,132 4,671 3,273 54,567
Foreign exchange gain 12,312 4,183 6,148 130,909
Loss on sales or disposals of property, plant and equipment, net (1,202) (2,522) (3,291) (12,780)
Gain on negative goodwill 4,048
Reversal of allowance for doubtful accounts 503
Impairment loss on investment securities (80) (579) (2) (851)
Gain (Loss) on sales of investment securities and affiliates’ stock 814 (10) 55 8,655
Impairment loss on long-lived assets (Note 5) (956) (183) (523) (10,165)
Gain (Loss) on change in pension plans of subsidiaries (Note 9) 673 (2)
Loss on violation of antitrust law (6,142)
Pension cost of subsidiaries (Note 9) (13,836) (10,960) (147,113)
Other – net 8,105 4,134 4,160 86,178
Total 19,514 2,751 23,336 207,486
Income before income taxes and minority interests 281,890 163,483 211,667 2,997,236
Income Taxes (Note 6):
Current 86,980 42,761 54,743 924,827
Deferred (2,890) 18,563 (1,972) (30,728)
Total 84,090 61,324 52,771 894,099
Net income before minority interests 197,800 102,159 158,896 2,103,137
Minority Interests in Net Income 16,118 12,861 15,863 171,377
Net income ¥181,682 ¥89,298 ¥143,033 $1,931,760
DENSO CORPORATION Annual Report 2013 16

Yen U.S. dollars
(Note 1)
2013 2012 2011 2013
Per Share of Common Stock (Notes 2 (V) and 20):
Basic net income ¥226.59 ¥110.81 ¥177.49 $2.41
Diluted net income – – – –
Cash dividends applicable to the year 64.00 46.00 46.00 0.68
Average Number of Shares (in thousands) 801,828 805,895 805,871 See accompanying notes to the consolidated financial statements.
DENSO CORPORATION Annual Report 2013 17
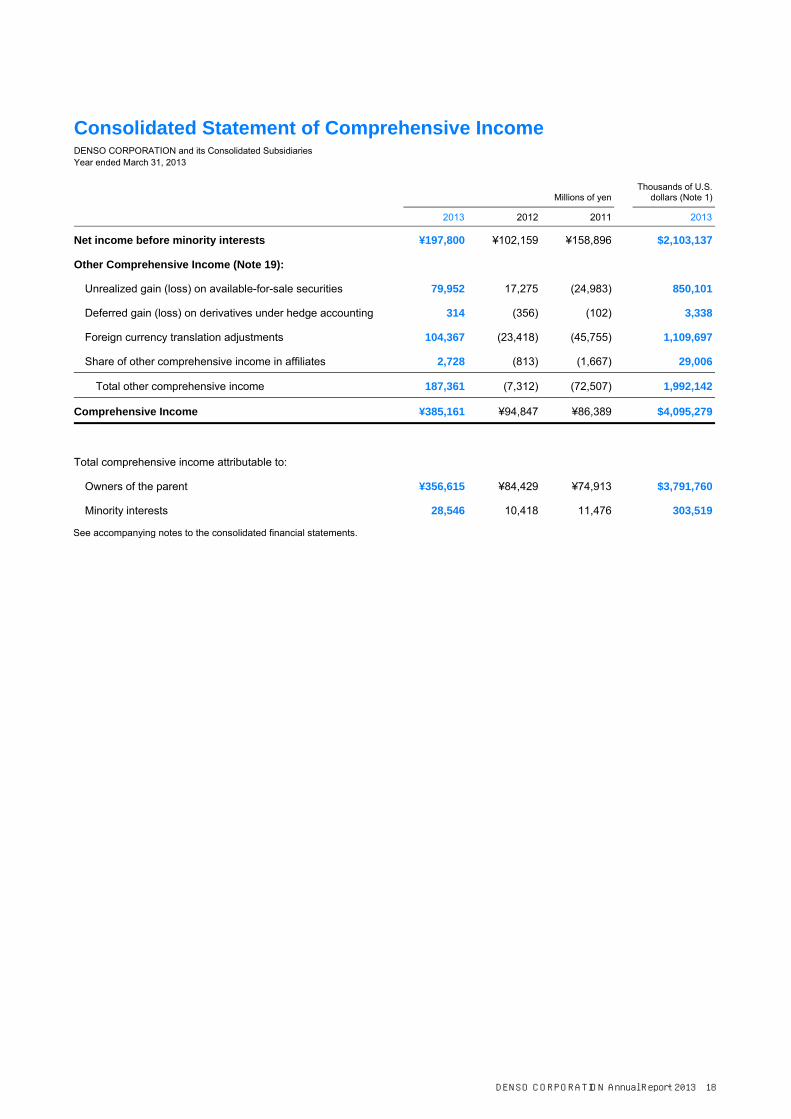
Consolidated Statement of Comprehensive Income DENSO CORPORATION and its Consolidated Subsidiaries Year ended March 31, 2013
Millions of yen Thousands of U.S. dollars (Note 1)
2013 2012 2011 2013
Net income before minority interests ¥197,800 ¥102,159 ¥158,896 $2,103,137
Other Comprehensive Income (Note 19):
Unrealized gain (loss) on available-for-sale securities 79,952 17,275 (24,983) 850,101
Deferred gain (loss) on derivatives under hedge accounting 314 (356) (102) 3,338
Foreign currency translation adjustments 104,367 (23,418) (45,755) 1,109,697
Share of other comprehensive income in affiliates 2,728 (813) (1,667) 29,006
Total other comprehensive income 187,361 (7,312) (72,507) 1,992,142
Comprehensive Income ¥385,161 ¥94,847 ¥86,389 $4,095,279
Total comprehensive income attributable to:
Owners of the parent ¥356,615 ¥84,429 ¥74,913 $3,791,760
Minority interests 28,546 10,418 11,476 303,519 See accompanying notes to the consolidated financial statements.
DENSO CORPORATION Annual Report 2013 18

Consolidated Statement of Changes in Equity DENSO CORPORATION and its Consolidated Subsidiaries Year ended March 31, 2013
Thousands Millions of yen
Accumulated other comprehensive income
Outstanding Number of Shares of Common
Stock Common
Stock Capital Surplus
Stock Acquisition
RightsRetained Earnings
Treasury Stock
Unrealized Gain on
Available-for-sale
Securities
Deferred Gain (Loss) on Deriva-tives under
Hedge Accounting
Foreign Currency
Translation Adjustments Total
Minority Interests Total Equity
Balance, April 1, 2010 805,901 ¥187,457 ¥266,610 ¥2,750 ¥1,626,988 ¥ (198,498) ¥154,178 ¥161 ¥ (120,317) ¥1,919,329 ¥112,935 ¥2,032,264
Net income 143,033 143,033 143,033
Cash dividends, ¥36 per share (29,013) (29,013) (29,013)
Purchase of treasury stock (65) (165) (165) (165)
Disposal of treasury stock 31 6 79 85 85
Net change in the year 712 (24,963) (102) (43,055) (67,408) (6,353) (73,761)
Balance, March 31, 2011 805,867 ¥187,457 ¥266,616 ¥3,462 ¥1,741,008 ¥(198,584) ¥129,215 ¥59 ¥(163,372) ¥1,965,861 ¥106,582 ¥2,072,443
Net income 89,298 89,298 89,298
Cash dividends, ¥47 per share
(37,878)
(37,878)
(37,878)
Purchase of treasury stock (5) (12) (12) (12)
Disposal of treasury stock 39 8 98 106 106
Net change in the year 68 17,243 (356) (21,756) (4,801) (1,955) (6,756)
Balance, March 31, 2012 805,901 ¥187,457 ¥266,624 ¥3,530 ¥1,792,428 ¥(198,498) ¥146,458 ¥(297) ¥(185,128) ¥2,012,574 ¥104,627 ¥2,117,201
Net income 181,682 181,682 181,682
Cash dividends, ¥50 per share
(40,296)
(40,296)
(40,296)
Purchase of treasury stock (11,005) (27,505) (27,505) (27,505)
Disposal of treasury stock 590 708 1,498 2,206 2,206
Net change in the year (1,237) 79,896 314 94,723 173,696 19,877 193,573
Balance, March 31, 2013 795,486 ¥187,457 ¥267,332 ¥2,293 ¥1,933,814 ¥(224,505) ¥226,354 ¥17 ¥(90,405) ¥2,302,357 ¥124,504 ¥2,426,861
Thousands of U.S. dollars (Note 1) Accumulated other comprehensive income
Common Stock Capital Surplus
Stock Acquisition
RightsRetained Earnings
Treasury Stock
Unrealized Gain on
Available-for-sale
Securities
Deferred Gain (Loss) on Deriva-tives under
Hedge Accounting
Foreign Currency
Translation Adjustments Total
Minority Interests Total Equity
Balance, March 31, 2012 $1,993,163 $2,834,918 $37,533 $19,058,245 $(2,110,558) $1,557,236 $(3,158) $(1,968,400) $21,398,979 $1,112,462 $22,511,441
Net income 1,931,760 1,931,760 1,931,760
Cash dividends, $0.53 per share (428,453) (428,453) (428,453)
Purchase of treasury stock (292,451) (292,451) (292,451)
Disposal of treasury stock 7,528 15,928 23,456 23,456
Net change in the year (13,153) 849,505 3,339 1,007,156 1,846,847 211,345 2,058,192
Balance, March 31, 2013 $1,993,163 $2,842,446 $24,380 $20,561,552 $(2,387,081) $2,406,741 $181 $(961,244) $24,480,138 $1,323,807 $25,803,945
See accompanying notes to the consolidated financial statements.
DENSO CORPORATION Annual Report 2013 19
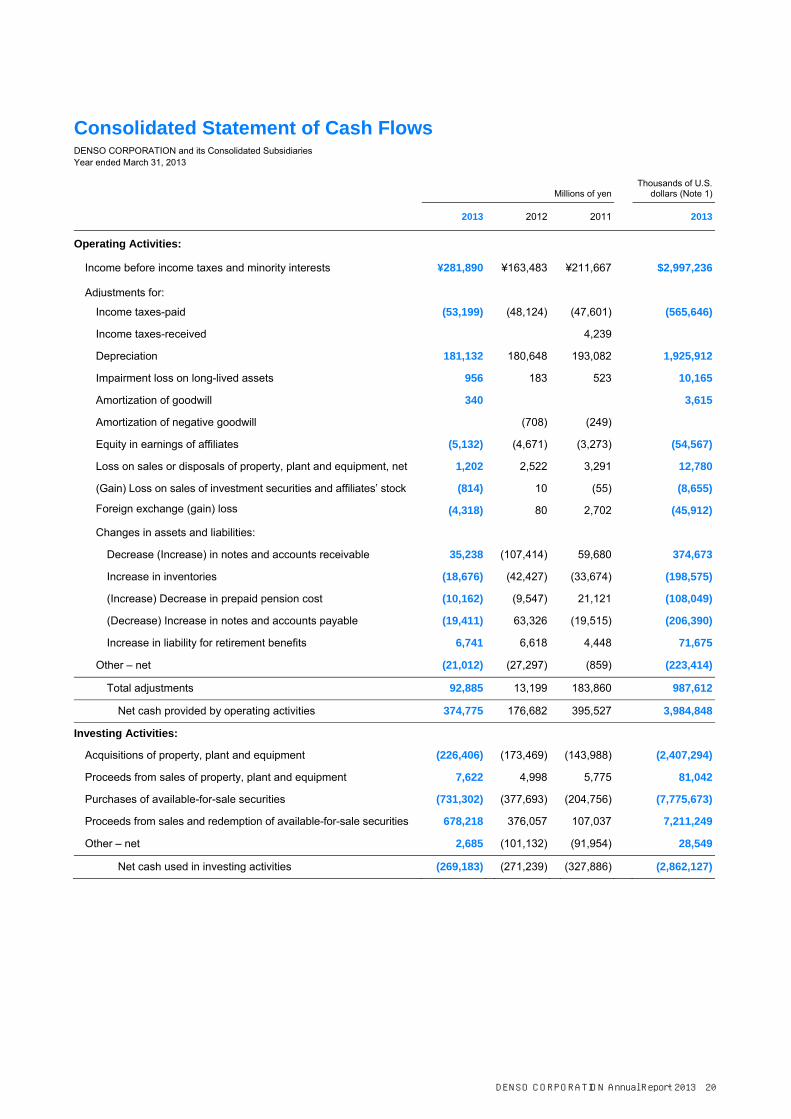
Consolidated Statement of Cash Flows DENSO CORPORATION and its Consolidated Subsidiaries Year ended March 31, 2013
Millions of yen Thousands of U.S.
dollars (Note 1)
2013 2012 2011 2013
Operating Activities:
Income before income taxes and minority interests ¥281,890 ¥163,483 ¥211,667 $2,997,236
Adjustments for:
Income taxes-paid (53,199) (48,124) (47,601) (565,646)
Income taxes-received 4,239
Depreciation 181,132 180,648 193,082 1,925,912
Impairment loss on long-lived assets 956 183 523 10,165
Amortization of goodwill 340 3,615
Amortization of negative goodwill (708) (249)
Equity in earnings of affiliates (5,132) (4,671) (3,273) (54,567)
Loss on sales or disposals of property, plant and equipment, net 1,202 2,522 3,291 12,780
(Gain) Loss on sales of investment securities and affiliates’ stock (814) 10 (55) (8,655)
Foreign exchange (gain) loss (4,318) 80 2,702 (45,912)
Changes in assets and liabilities:
Decrease (Increase) in notes and accounts receivable 35,238 (107,414) 59,680 374,673
Increase in inventories (18,676) (42,427) (33,674) (198,575)
(Increase) Decrease in prepaid pension cost (10,162) (9,547) 21,121 (108,049)
(Decrease) Increase in notes and accounts payable (19,411) 63,326 (19,515) (206,390)
Increase in liability for retirement benefits 6,741 6,618 4,448 71,675
Other – net (21,012) (27,297) (859) (223,414)
Total adjustments 92,885 13,199 183,860 987,612
Net cash provided by operating activities 374,775 176,682 395,527 3,984,848
Investing Activities:
Acquisitions of property, plant and equipment (226,406) (173,469) (143,988) (2,407,294)
Proceeds from sales of property, plant and equipment 7,622 4,998 5,775 81,042
Purchases of available-for-sale securities (731,302) (377,693) (204,756) (7,775,673)
Proceeds from sales and redemption of available-for-sale securities 678,218 376,057 107,037 7,211,249
Other – net 2,685 (101,132) (91,954) 28,549
Net cash used in investing activities (269,183) (271,239) (327,886) (2,862,127)
DENSO CORPORATION Annual Report 2013 20

Millions of yen Thousands of U.S.
dollars (Note 1)
2013 2012 2011 2013
Financing Activities:
Net increase (decrease) in short-term borrowings ¥784 ¥(40,081) ¥27,537 $8,336
Proceeds from long-term borrowings 27,052 159,745 287,634
Repayments of long-term borrowings (2,243) (42,381) (29,564) (23,849)
Issuance of bonds 50,000
Repayments of bonds (50,000) (531,632)
Dividends paid (40,296) (37,878) (29,013) (428,453)
Repurchase of treasury stock (27,505) (12) (165) (292,451)
Other – net (6,311) (10,574) (13,568) (67,102)
Net cash (used in) provided by financing activities (98,519) 78,819 (44,773) (1,047,517)
Foreign Currency Translation Adjustments on Cash and Cash Equivalents 34,831 (7,479) (15,967) 370,346
Net Increase (Decrease) in Cash and Cash Equivalents 41,904 (23,217) 6,901 445,550
Cash and Cash Equivalents of Newly Consolidated Subsidiary at Beginning of Year 17 181
Cash and Cash Equivalents at Beginning of Year 665,409 688,626 681,725 7,075,056
Cash and Cash Equivalents at End of Year ¥707,330 ¥665,409 ¥ 688,626 $7,520,787
See accompanying notes to the consolidated financial statements.
DENSO CORPORATION Annual Report 2013 21

Notes to Consolidated Financial Statements DENSO CORPORATION and its Consolidated Subsidiaries
1. Basis of Presentation of Consolidated Financial Statements The accompanying consolidated financial statements have been prepared from accounts and records maintained by DENSO COR-PORATION (the “Company”) and its subsidiaries (collectively referred to as the “Group”) in accordance with the provisions set forth in the Japanese Financial Instruments and Exchange Act and its related accounting regulations, and in accordance with accounting principles generally accepted in Japan (“Japanese GAAP”), which are different in certain respects as to the application and disclo-sure requirements of International Financial Reporting Standards.
In preparing these consolidated financial statements, certain reclassifications and rearrangements have been made to the consol-idated financial statements issued domestically in order to present them in a form which is more familiar to readers outside Japan. In addition, certain reclassifications have been made in the 2012 and 2011 consolidated financial statements to conform to the classifi-cations used in 2013.
The consolidated financial statements are stated in Japanese yen, the currency of the country in which the Company is incorpo-rated and operates. The translations of Japanese yen amounts into U.S. dollar amounts are included solely for the convenience of readers outside Japan and have been made at the rate of ¥94.05 to U.S. $1, the rate of exchange at March 29, 2013. Such transla-tions should not be construed as representations that the Japanese yen amounts could be converted into U.S. dollars at that or any other rate.
2. Summary of Significant Accounting Policies (A) Principles of Consolidation and Accounting for Investments in Unconsolidated Subsidiaries and Affiliates The Company applied the “control” concept for its consolidation policy. Under the control concept, those companies in which the Company, directly or indirectly, is able to exercise control over operations are fully consolidated. The consolidated financial state-ments for the year ended March 31, 2013, include 183 subsidiaries (188 for 2012 and 187 for 2011). The Company applied the “power to exercise significant influence” concept to determine affiliates to be accounted for by the equity method. Under the influ-ence concept, those companies over which the Company has the ability to exercise significant influence are accounted for by the equity method. The Company applied the equity method to all 32 affiliates for the year ended March 31, 2013 (31 affiliates for 2012 and 2011). The Company applied equity method to one unconsolidated subsidiary and cost basis to another subsidiary for the year ended March 31, 2012, since the effect on the consolidated financial statements of not consolidating those subsidiaries was immate-rial. Those subsidiaries are consolidated for the year ended March 31, 2013.
The fiscal years of subsidiaries are not necessarily the same as that of the Company. Accounts of subsidiaries which have differ-ent fiscal years have been adjusted for significant transactions to properly reflect their financial position at March 31 of each year and the results of operations and cash flows for the years then ended. All significant intercompany balances and transactions have been eliminated in consolidation. All material unrealized profits included in assets resulting from transactions within the Group are eliminated. In fiscal year 2013, the Company decided to change the timing for inclusion of financial position and results of subsidiar-ies for the consolidated financial statements for DENSO (CHINA) INVESTMENT CO., LTD and 5 other subsidiaries in China to unify the closing date with the Company. Accordingly, fiscal year 2013 operating results include 15 months of operations for these 6 sub-sidiaries whereas fiscal year 2012 and 2011 include 12 months of the same.
The net excess of the fair value of the net assets of consolidated subsidiaries and affiliates accounted for under the equity meth-od over the acquisition cost of the Company’s investments in those companies is amortized over the estimated available life or five years.
(B) Unification of Accounting Policies Applied to Foreign Subsidiaries for the Consolidated Financial Statements In May 2006, the Accounting Standards Board of Japan (the “ASBJ”) issued ASBJ Practical Issues Task Force (PITF) No. 18, “Prac-tical Solution on Unification of Accounting Policies Applied to Foreign Subsidiaries for the Consolidated Financial Statements.” PITF No. 18 prescribes that the accounting policies and procedures applied to a parent company and its subsidiaries for similar transac-tions and events under similar circumstances should in principle be unified for the preparation of the consolidated financial state-ments. However, financial statements prepared by foreign subsidiaries in accordance with either International Financial Reporting Standards or the generally accepted accounting principles in the United States of America tentatively may be used for the consolida-tion process, except for the following items which should be adjusted in the consolidation process so that net income is accounted for in accordance with Japanese GAAP, unless they are not material: 1) amortization of goodwill; 2) scheduled amortization of actu-arial gain or loss of pensions that has been directly recorded in equity; 3) expensing capitalized development costs of R&D; 4) can-cellation of the fair value model accounting for property, plant and equipment and investment properties and incorporation of cost model accounting; and 5) exclusion of minority interests from net income, if contained in net income.
DENSO CORPORATION Annual Report 2013 22

(C) Unification of Accounting Policies Applied to Foreign Associated Companies for the Equity Method In March 2008, the ASBJ issued ASBJ Statement No. 16, “Accounting Standard for Equity Method of Accounting for Investments”. The new standard requires adjustments to be made to conform the affiliate’s accounting policies for similar transactions and events under similar circumstances to those of the parent company when the affiliate’s financial statements are used in applying the equity method unless it is impracticable to determine such adjustments. In addition, financial statements prepared by foreign affiliates in accordance with either International Financial Reporting Standards or the generally accepted accounting principles in the United States of America tentatively may be used in applying the equity method if the following items are adjusted so that net income is accounted for in accordance with Japanese GAAP, unless they are not material: 1) amortization of goodwill; 2) scheduled amortiza-tion of actuarial gain or loss of pensions that has been directly recorded in equity; 3) expensing capitalized development costs of R&D; 4) cancellation of the fair value model accounting for property, plant and equipment and investment properties and incorpora-tion of the cost model accounting; and 5) exclusion of minority interests from net income, if contained in net income.
(D) Cash and Cash Equivalents Cash equivalents are short-term investments that are readily convertible into cash and that are exposed to insignificant risk of changes in value. Cash equivalents include time deposits, certificate of deposits, commercial paper and money management funds, all of which mature or become due within three months of the date of acquisition.
(E) Inventories Inventories are stated at the lower of cost, determined by the annual average method, or net selling value.
(F) Securities All securities are classified as available-for-sale securities. Marketable available-for-sale securities are stated at fair value, with un-realized gains and losses, net of applicable taxes, reported in a separate component of equity. The cost of securities sold is deter-mined based on the moving-average method.
Nonmarketable available-for-sale securities are stated at cost determined by the moving-average method. For other-than-temporary declines in fair value, available-for-sale securities are reduced to net realizable value by a charge to income.
(G) Property, Plant and Equipment and Depreciation Property, plant and equipment are stated at cost. Depreciation is computed, with minor exceptions, by the declining-balance method based on the estimated useful lives of the assets.
The range of useful lives is principally from 10 to 45 years for buildings and structures and mainly 7 years for machinery. Addi-tional depreciation is charged for machinery operated in excess of normal usage.
(H) Long-lived Assets The Group reviews its long-lived assets for impairment whenever events or changes in circumstance indicate the carrying amount of an asset or asset group may not be recoverable. An impairment loss is recognized if the carrying amount of an asset or asset group exceeds the sum of the undiscounted future cash flows expected to result from the continued use and eventual disposition of the asset or asset group. The impairment loss would be measured as the amount by which the carrying amount of the asset exceeds its recoverable amount, which is the higher of the discounted cash flows from the continued use and eventual disposition of the asset or the net selling price at disposition.
(I) Intangible Assets Intangible assets consist of in-house software and others. The straight-line method is primarily used to amortize intangible assets. The amortization of in-house software, which is available to reduce operating costs, is computed using the straight-line method based on the estimated useful life of five years.
(J) Allowance for Doubtful Accounts The allowance for doubtful accounts is stated in amounts considered to be appropriate based on the Group’s past credit loss experi-ences and an evaluation of potential losses in the receivables outstanding. (K) Bond Issue Costs Bond issue costs are charged to income as incurred.
DENSO CORPORATION Annual Report 2013 23

(L) Employees’ Retirement Benefits The Group accounts for the liability for employees’ retirement benefits based on projected benefit obligations and plan assets at the balance sheet date.
(M) Retirement Allowances for Directors and Audit & Supervisory Board Members Retirement allowances for directors and Audit & Supervisory Board members are recorded as a liability at the amount that would be required if all directors and Audit & Supervisory Board members retired at the balance sheet date.
(N) Stock Options In December 2005, the ASBJ issued ASBJ Statement No. 8, “Accounting Standard for Stock Options” and related guidance. The new standard and guidance are applicable to stock options newly granted on and after May 1, 2006. This standard requires compa-nies to measure the cost of employee stock options based on the fair value at the date of grant and recognize compensation ex-pense over the vesting period as consideration for receiving goods or services. The standard also requires companies to account for stock options granted to nonemployees based on the fair value of either the stock option or the goods or services received. In the balance sheet, the stock option is presented as a stock acquisition right as a separate component of equity until exercised. The standard covers equity-settled, share-based payment transactions, but does not cover cash-settled, share-based payment transac-tions.
(O) Research and Development Expenses Research and development expenses are charged to income as incurred.
(P) Leases In March 2007, the ASBJ issued ASBJ Statement No. 13, “Accounting Standard for Lease Transactions,” which revised the previous accounting standard for lease transactions. The revised accounting standard for lease transactions was effective for fiscal years beginning on or after April 1, 2008.
Under the previous accounting standard, finance leases that were deemed to transfer ownership of the leased property to the lessee were capitalized. However, other finance leases were permitted to be accounted for as operating lease transactions if cer-tain “as if capitalized” information was disclosed in the note to the lessee’s financial statements. The revised accounting standard requires that all finance lease transactions be capitalized by recognizing lease assets and lease obligations in the balance sheet. In addition, the revised accounting standard permits leases which existed at the transition date and do not transfer ownership of the leased property to the lessee to continue to be accounted for as operating lease transactions with certain “as if capitalized” information disclosed in the notes to the lessee’s financial statements.
The Group applied the revised accounting standard effective April 1, 2008. In addition, the Group accounted for leases which ex-isted at the transition date and do not transfer ownership of the leased property to the lessee as operating lease transactions.
All other leases are accounted for as operating leases.
(Q) Bonuses to Directors and Audit & Supervisory Board Members Bonuses to directors and Audit & Supervisory Board members are accrued at the end of year to which such bonuses are attributable. (R) Income Taxes The provision for income taxes is computed based on the pretax income included in the consolidated statement of income. The as-set and liability approach is used to recognize deferred tax assets and liabilities for the expected future tax consequences of tempo-rary differences between the carrying amounts and the tax bases of assets and liabilities. Deferred taxes are measured by applying currently enacted tax laws to the temporary differences.
(S) Foreign Currency Translation All short-term and long-term monetary receivables and payables denominated in foreign currencies are translated into Japanese yen at the current exchange rates at the balance sheet date. The foreign exchange gains and losses from translation are recognized in the consolidated statement of income to the extent that they are not hedged by forward exchange contracts.
DENSO CORPORATION Annual Report 2013 24

(T) Foreign Currency Financial Statements The balance sheet accounts of the consolidated foreign subsidiaries are translated into Japanese yen at the current exchange rates at the balance sheet date except for equity, which is translated at the historical rates. Differences arising from such translation are shown as “Foreign currency translation adjustments” under accumulated other comprehensive income in a separate component of equity. Revenue and expense accounts of consolidated foreign subsidiaries are translated into Japanese yen at the annual average exchange rates. (U) Derivative Financial Instruments Derivative financial instruments are classified and accounted for as follows: a) all derivatives are recognized as either assets or liabil-ities and measured at fair value, and gains or losses on derivative transactions are recognized in the consolidated statement of in-come and b) for derivatives used for hedging purposes, if such derivatives qualify for hedge accounting because of high correlation and effectiveness between the hedging instruments and the hedged items, gains or losses on derivatives are deferred until maturity of the hedged transactions.
The foreign exchange forward contracts, currency options and currency swap contracts employed to hedge foreign exchange ex-posures to the consolidated subsidiaries are measured at fair value and the unrealized gains/losses are recognized in the consoli-dated statement of income.
Interest rate swaps are utilized to hedge interest rate exposures of financial assets and long-term debt (bonds). These swaps which qualify for hedge accounting are measured at fair value at the balance sheet date and the unrealized gains and losses are deferred until maturity as liability or asset. When interest rate swap contracts which qualify for hedge accounting and meet specific matching criteria, the interest rate swaps are not remeasured at fair value but the differential paid or received under the swap con-tracts are recognized and included in interest expense or income.
(V) Net Income and Dividends per Share Basic net income per share is computed by dividing net income available to common shareholders by the weighted-average number of common shares outstanding for the period, retroactively adjusted for stock splits.
Diluted net income per share reflects the potential dilution that could occur if securities were exercised or converted into common stock. Diluted net income per share of common stock assumes full conversion of the outstanding convertible bonds at the beginning of the year (or at the time of issuance) with an applicable adjustment for related interest expense, net of tax, and full exercise of out-standing stock options.
Diluted net income per share was not disclosed because it is anti-dilutive for the year ended March 31, 2013, 2012 and 2011. Cash dividends per share presented in the accompanying consolidated statement of income are dividends applicable to the re-
spective years including dividends to be paid after the end of the year.
(W) Business Combinations In October 2003, the Business Accounting Council issued a Statement of Opinion, “Accounting for Business Combinations,” and in December 2005, the ASBJ issued ASBJ Statement No. 7, “Accounting Standard for Business Divestitures” and ASBJ Guidance No. 10, “Guidance for Accounting Standard for Business Combinations and Business Divestitures.” The accounting standard for busi-ness combinations allowed companies to apply the pooling of interests method of accounting only when certain specific criteria are met such that the business combination is essentially regarded as a uniting-of-interests. For business combinations that do not meet the uniting-of-interests criteria, the business combination is considered to be an acquisition and the purchase method of accounting is required. This standard also prescribes the accounting for combinations of entities under common control and for joint ventures.
In December 2008, the ASBJ issued a revised accounting standard for business combinations, ASBJ Statement No. 21, “Account-ing Standard for Business Combinations.” Major accounting changes under the revised accounting standard are as follows: (1) The revised standard requires accounting for business combinations only by the purchase method. As a result, the pooling of interests method of accounting is no longer allowed. (2) The previous accounting standard required research and development costs to be charged to income as incurred. Under the revised standard, in-process research and development costs (IPR&D) acquired in the business combination are capitalized as an intangible asset. (3) The previous accounting standard provided for a bargain purchase gain (negative goodwill) to be systematically amortized over a period not exceeding 20 years. Under the revised standard, the acquirer recognizes the bargain purchase gain in profit or loss immediately on the acquisition date after reassessing and confirming that all of the assets acquired and all of the liabilities assumed have been identified after a review of the procedures used in the purchase price allocation.
DENSO CORPORATION Annual Report 2013 25

(X) Accounting Changes and Error Corrections In December 2009, the ASBJ issued ASBJ Statement No. 24, “Accounting Standard for Accounting Changes and Error Corrections” and ASBJ Guidance No. 24, “Guidance on Accounting Standard for Accounting Changes and Error Corrections.” Accounting treat-ments under this standard and guidance are as follows;
(1) Changes in Accounting Policies When a new accounting policy is applied following revision of an accounting standards, the new policy is applied retrospective-ly unless the revised accounting standard includes specific transitional provisions, in which case the entity shall comply with the specific transitional provisions.
(2) Changes in Presentation When the presentation of financial statements is changed, prior-period financial statements are reclassified in accordance with the new presentation.
(3) Changes in Accounting Estimates A change in an accounting estimate is accounted for in the period of the change if the change affects that period only, and is accounted for prospectively if the change affects both the period of the change and future periods.
(4) Corrections of Prior-Period Errors When an error in prior-period financial statements is discovered, those statements are restated.
This accounting standard and the guidance are applicable to accounting changes and corrections of prior-period errors which are made from the beginning of the fiscal year that began on or after April 1, 2011. (Y) New Accounting Pronouncements Accounting Standard for Retirement Benefits On May 17, 2012, the ASBJ issued ASBJ Statement No. 26, "Accounting Standard for Retirement Benefits" and ASBJ Guidance No. 25, "Guidance on Accounting Standard for Retirement Benefits," which replaced the Accounting Standard for Retirement Benefits that had been issued by the Business Accounting Council in 1998 with an effective date of April 1, 2000, and the other related prac-tical guidance, and followed by partial amendments from time to time through 2009.
Major changes are as follows: (1) Treatment in the balance sheet
Under the current requirements, actuarial gains and losses and past service costs that are yet to be recognized in profit or loss are not recognized in the balance sheet, and the difference between retirement benefit obligations and plan assets (hereinafter, "deficit or surplus"), adjusted by such unrecognized amounts, is recognized as a liability or asset.
Under the revised accounting standard, actuarial gains and losses and past service costs that are yet to be recognized in profit or loss shall be recognized within equity (accumulated other comprehensive income), after adjusting for tax effects, and any resulting deficit or surplus shall be recognized as a liability (liability for retirement benefits) or asset (asset for retirement benefits).
(2) Treatment in the statement of income and the statement of comprehensive income The revised accounting standard does not change how to recognize actuarial gains and losses and past service costs in profit or loss. Those amounts would be recognized in profit or loss over a certain period no longer than the expected average re-maining working lives of the employees. However, actuarial gains and losses and past service costs that arose in the current period and have not yet been recognized in profit or loss shall be included in other comprehensive income and actuarial gains and losses and past service costs that were recognized in other comprehensive income in prior periods and then recognized in profit or loss in the current period shall be treated as reclassification adjustments.
(3) Amendments relating to the method of attributing expected benefit to periods and relating to the discount rate and expected future salary increases The revised accounting standard also made certain amendments relating to the method of attributing expected benefit to peri-ods and relating to the discount rate and expected future salary increases.
This accounting standard and the guidance for (1) and (2) above are effective for the end of annual periods beginning on or after April 1, 2013, and for (3) above are effective for the beginning of annual periods beginning on or after April 1, 2014, or for the begin-ning of annual periods beginning on or after April 1, 2015, subject to certain disclosure in March 2015, both with earlier application being permitted from the beginning of annual periods beginning on or after April 1, 2013. However, no retrospective application of this accounting standard to consolidated financial statements in prior periods is required.
The Company expects to apply the revised accounting standard for (1), (2) and (3) above from the beginning of the annual period beginning on April 1, 2013.
The adoption of the revised accounting standard is expected to have a significant impact on the financial statements. The consol-idated net assets will decrease approximately ¥24,000 million to recognize the actuarial gains and losses and past service costs that
DENSO CORPORATION Annual Report 2013 26

are yet to be recognized in profit or loss within equity. Further, the beginning retained earnings as of April 1, 2013, will increase ap-proximately ¥32,000 million to change of calculation method of liability for retirement benefit. In total, the consolidated net assets is expected to increase by approximately ¥8,000 million as of April 1, 2013. The effect of the change in the calculation method of ser-vice costs for the consolidated statement of income is expected to be immaterial. 3. Short-term Investments and Investment Securities Short-term investments consisted of time deposits not classified as cash equivalents in the amount of ¥202,527 million ($2,153,397 thousand) and ¥208,658 million, at March 31, 2013 and 2012, respectively, and debt securities. Investment securities consisted of equity securities and debt securities.
The costs and aggregate fair values of available-for-sale securities included in short-term investments and in investment securi-ties at March 31, 2013 and 2012, were as follows: Millions of yen Thousands of U.S. dollars
Cost Unrealized
Gain Unrealized Loss Fair Value Cost
Unrealized Gain Unrealized
Loss Fair Value
2013 2013
Equity securities ¥177,460 ¥352,488 ¥(7,142) ¥522,806 $1,886,869 $3,747,879 $(75,939) $5,558,809
Debt securities 87,275 356 (4) 87,627 927,964 3,785 (42) 931,707
Others 158,539 – (20) 158,519 1,685,688 – (212) 1,685,476
Total ¥423,274 ¥352,844 ¥(7,166) ¥768,952 $4,500,521 $3,751,664 $(76,193) $8,175,992
Millions of yen
Cost Unrealized
Gain Unrealized
Loss Fair Value 2012
Equity securities ¥175,908 ¥230,703 ¥(7,219) ¥399,392
Debt securities 93,347 473 (2) 93,818
Others 114,038 17 – 114,055
Total ¥383,293 ¥231,193 ¥(7,221) ¥607,265
The carrying amounts of available-for-sale securities included in short-term investments and in investment securities at March 31,
2013 and 2012, whose fair value was not readily determinable were as follows:
Millions of yen Thousands of
U.S. dollars
2013 2012 2013
Equity securities ¥33,054 ¥19,180 $351,451
Total ¥33,054 ¥19,180 $351,451
4. Inventories Inventories at March 31, 2013 and 2012, were as follows:
Millions of yen Thousands of
U.S. dollars
2013 2012 2013
Finished products ¥128,206 ¥123,003 $1,363,168
Work in process 105,973 93,198 1,126,773
Raw materials and supplies 136,483 108,312 1,451,175
Total ¥370,662 ¥324,513 $3,941,116
DENSO CORPORATION Annual Report 2013 27

5. Long-lived Assets The Group reviewed its long-lived assets for impairment as of March 31, 2013. For the review of the impairment, the Group is apply-ing accounting policy of grouping the assets by business groups since the Group management reviews the financial results based on the business groups. In addition, the grouping is prepared by the rental asset group and idle assets group. Further, since the corpo-rate headquarter and welfare facilities do not have identifiable cash flows, the Group treats these assets as corporate level assets.
As a result of the review, the Group recognized a total of ¥411 million ($4,370 thousand) impairment losses on unused long-lived assets as other expenses as a result of a change in the Group’s capital investment plan. The losses were recognized for the power-train control systems group in Brazil, for the thermal systems group in Czech Republic, for the small motor group in Japan and cor-porate level assets in Japan in the amount of ¥48 million ($510 thousand), ¥31 million ($330 thousand), ¥3 million ($32 thousand) and ¥329 million ($3,498 thousand), respectively. The unused assets consist of machinery and equipment, furniture, fixtures, tools and dies, and land. The book value of the relevant assets were written down to the recoverable amounts. The recorded impairment losses by asset type are in the amount of ¥78 million ($829 thousand), ¥4 million ($43 thousand), and ¥329 million ($3,498 thou-sand), respectively. The recoverable amounts of the asset group were measured at net sales value, which is calculated based on the appraisal made by a real property appraiser adjusted with the appraisal value by fixed assets tax and expected costs to sell.
In addition, the Group recognized a total of ¥545 million ($5,795 thousand) impairment losses as other expenses for long-lived assets used for production due to a deterioration of the Group’s business environment. The losses were recognized for the power-train control systems group in Japan and for the small motor groups in Brazil and Korea, in the amount of ¥339 million ($3,605 thou-sand) and ¥206 million ($2,190 thousand), respectively. The carrying amounts of the relevant long-lived assets were written down to the recoverable amounts. Therefore, ¥198 million ($2,105 thousand), ¥8 million ($85 thousand), ¥339 million ($3,605 thousand) and ¥0 million ($0 thousand) losses were recognized on machinery and equipment, on furniture, fixtures, tools and dies, on land and on buildings and structures, respectively. The recoverable amounts of the asset groups were measured at net sales value or its value in use. The net sales value is calculated based on the appraisal made by a real property appraiser. For the calculation of its value in use, the discount rates used for calculation for the present value of future cash flows were 6.41% in Japan, 9.64% in Brazil and 5.81% in Korea.
For the year ended March 31, 2012, the Group recognized ¥183 million impairment losses as other expenses for long-lived as-sets in accordance with the move of certain plants.
The carrying amounts of the relevant long-lived assets were written down to the recoverable amounts. Therefore, ¥183 million losses on buildings and structures were recognized in Japan for the year ended March 31, 2012. The recoverable amounts of the asset groups were measured at net sales value.
For the year ended March 31, 2011, the Group recognized a total of ¥523 million of impairment losses as other expenses for long-lived assets used for production due to a deterioration of the Group’s business environment. The losses were recognized for the powertrain control systems group in Korea; for the small motor groups in Brazil, Czech Republic and Korea; and for the electric systems group in Korea, in the amounts of ¥3, ¥371 and ¥149 million, respectively.
The carrying amounts of the relevant long-lived assets were written down to the recoverable amounts. Therefore, ¥312 million losses on machinery and equipment and ¥211 million losses on buildings and structures were recognized for the year ended March 31, 2011. The recoverable amounts of the asset groups were measured at net sales value or its value in use. The discount rate used for the computation of the present value of future cash flows was 5.4% in Czech Republic.
DENSO CORPORATION Annual Report 2013 28

6. Income Taxes The Company and its domestic subsidiaries are subject to Japanese national and local income taxes which, in the aggregate, result-ed in a normal effective statutory tax rate of approximately 37% for the year ended March 31, 2013, and 40% for the years ended March 31, 2012 and 2011.
The tax effects of significant temporary differences and tax loss carryforwards which resulted in deferred tax assets and liabilities at March 31, 2013 and 2012, were as follows:
Millions of yen Thousands of
U.S. dollars
2013 2012 2013
Deferred tax assets: Employees’ retirement benefits ¥65,646 ¥64,346 $697,990
Depreciation 55,896 58,210 594,322
Warranty reserve 17,736 15,843 188,581
Accrued bonuses to employees 20,461 19,032 217,554
Tax loss carryforwards 15,456 13,154 164,338
Other 99,246 72,795 1,055,248
Less: Valuation allowance (45,191) (31,453) (480,500)
Total deferred tax assets ¥229,250 ¥211,927 $2,437,533
Deferred tax liabilities:
Unrealized gain on available-for-sale securities ¥119,035 ¥77,239 $1,265,657
Prepaid pension cost 20,786 17,744 221,010
Other 22,423 12,193 238,415
Total deferred tax liabilities ¥162,244 ¥107,176 $1,725,082
Net deferred tax assets ¥67,006 ¥104,751 $712,451
Net deferred tax assets presented in the consolidated balance sheets at March 31, 2013 and 2012, were as follows:
Millions of yen Thousands of
U.S. dollars
2013 2012 2013
Current assets–Deferred tax assets ¥62,969 ¥61,274 $669,527
Investments and other assets–Deferred tax assets 18,236 51,020 193,897
Current liabilities–Other current liabilities (333) (82) (3,541)
Long-term liabilities–Deferred tax liabilities (13,866) (7,461) (147,432)
Net deferred tax assets ¥67,006 ¥104,751 $712,451
DENSO CORPORATION Annual Report 2013 29
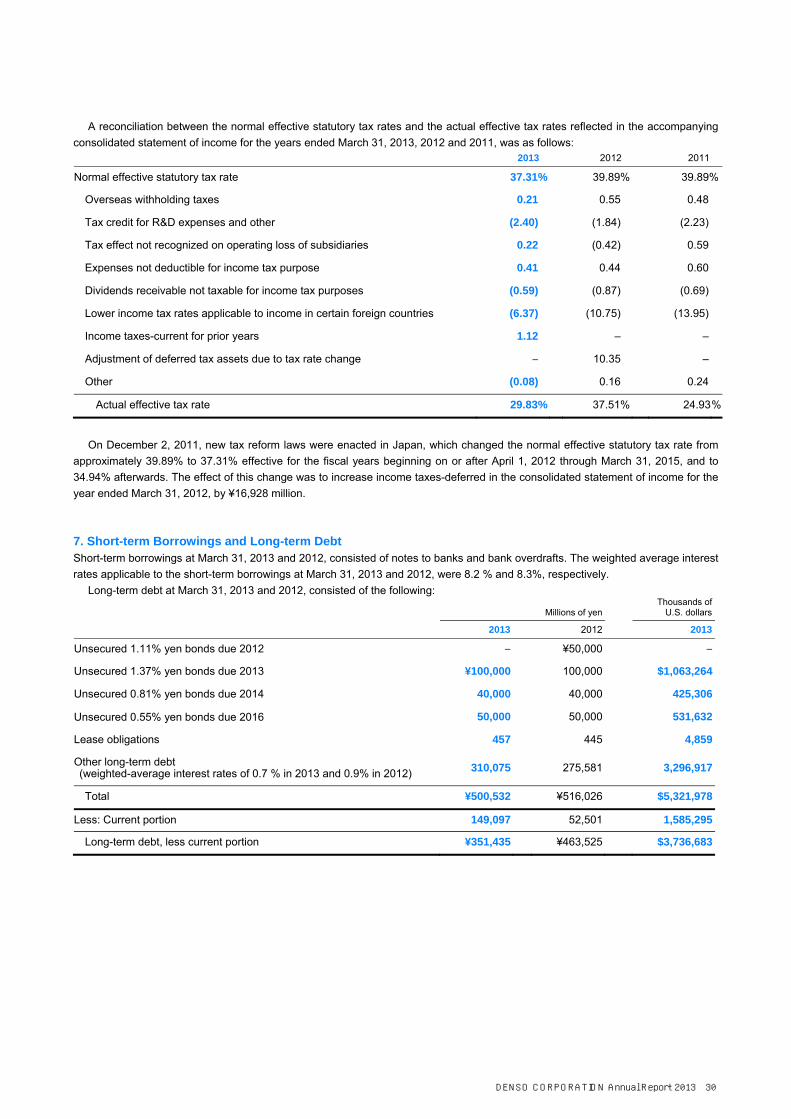
A reconciliation between the normal effective statutory tax rates and the actual effective tax rates reflected in the accompanying consolidated statement of income for the years ended March 31, 2013, 2012 and 2011, was as follows: 2013 2012 2011
Normal effective statutory tax rate 37.31% 39.89% 39.89%
Overseas withholding taxes 0.21 0.55 0.48
Tax credit for R&D expenses and other (2.40) (1.84) (2.23)
Tax effect not recognized on operating loss of subsidiaries 0.22 (0.42) 0.59
Expenses not deductible for income tax purpose 0.41 0.44 0.60
Dividends receivable not taxable for income tax purposes (0.59) (0.87) (0.69)
Lower income tax rates applicable to income in certain foreign countries (6.37) (10.75) (13.95)
Income taxes-current for prior years 1.12 – –
Adjustment of deferred tax assets due to tax rate change – 10.35 –
Other (0.08) 0.16 0.24
Actual effective tax rate 29.83% 37.51% 24.93%
On December 2, 2011, new tax reform laws were enacted in Japan, which changed the normal effective statutory tax rate from
approximately 39.89% to 37.31% effective for the fiscal years beginning on or after April 1, 2012 through March 31, 2015, and to 34.94% afterwards. The effect of this change was to increase income taxes-deferred in the consolidated statement of income for the year ended March 31, 2012, by ¥16,928 million. 7. Short-term Borrowings and Long-term Debt Short-term borrowings at March 31, 2013 and 2012, consisted of notes to banks and bank overdrafts. The weighted average interest rates applicable to the short-term borrowings at March 31, 2013 and 2012, were 8.2 % and 8.3%, respectively.
Long-term debt at March 31, 2013 and 2012, consisted of the following:
Millions of yen Thousands of
U.S. dollars
2013 2012 2013
Unsecured 1.11% yen bonds due 2012 – ¥50,000 –
Unsecured 1.37% yen bonds due 2013 ¥100,000 100,000 $1,063,264
Unsecured 0.81% yen bonds due 2014 40,000 40,000 425,306
Unsecured 0.55% yen bonds due 2016 50,000 50,000 531,632
Lease obligations 457 445 4,859
Other long-term debt (weighted-average interest rates of 0.7 % in 2013 and 0.9% in 2012) 310,075 275,581 3,296,917
Total ¥500,532 ¥516,026 $5,321,978
Less: Current portion 149,097 52,501 1,585,295
Long-term debt, less current portion ¥351,435 ¥463,525 $3,736,683
DENSO CORPORATION Annual Report 2013 30

Annual maturities of long-term debt at March 31, 2013, were as follows:
Year ending March 31 Millions of yen Thousands of U.S. dollars
2014 ¥149,097 $1,585,295
2015 103,733 1,102,956
2016 53,632 570,250
2017 175,555 1,866,614
2018 15,696 166,890
2019 and thereafter 2,819 29,973
Total ¥500,532 $5,321,978
8. Pledged Assets The following assets were pledged as long-term borrowings, including the current portion of long-term borrowings of ¥529 million ($5,625 thousand), at March 31, 2013:
Millions of yen Thousands of U.S. dollars
Buildings and structures, net of accumulated depreciation ¥453 $4,817
Land 460 4,891
Total ¥913 $9,708
9. Employees’ Retirement Benefits The Company and its consolidated subsidiaries in Japan has contributory funded defined benefit pension plan and a severance lump-sum payment plan, which are both considered as defined benefit plans. In addition, there are cases when the Company and its subsidiaries in Japan pay additional retirement grants for employees. These additional grants are not subject to the calculation of liability for employees’ retirement benefits in accordance with the accounting standards, which require calculation of liabilities based on actuarial calculations. In addition, certain foreign subsidiaries adopted defined benefit plan.
According to the enactment of the Defined Contribution Pension Plan Law in October 2001, the Company implemented a defined contribution pension plan in October 2002 by which a portion of the severance lump-sum payment plan was terminated. Similarly, domestic subsidiaries including ASMO CO., LTD., implemented a defined contribution pension plan in October 2003, by which a portion of the severance lump-sum payment plan was terminated. In October 2008, certain domestic subsidiaries including ASMO CO., LTD., implemented the DENSO Group-funded pension plan by which existing funded pension plans were transferred to the new group pension plan. The Company contributed certain available-for-sale securities to the employee retirement benefit trust for the Company’s pension plan. Certain domestic subsidiaries have contributed to a multiemployer pension plan under industry-wide collective agreements but left the plan on March 31, 2013.
The liability (asset) for employees’ retirement benefits at March 31, 2013 and 2012, consisted of the following:
Millions of yen Thousands of U.S. dollars
2013 2012 2013
Projected benefit obligation ¥715,271 ¥615,452 $7,605,221
Fair value of plan assets (567,080) (488,254) (6,029,559)
Unrecognized actuarial loss (56,326) (46,185) (598,894)
Unrecognized prior service benefit 22,596 36,288 240,255
Net liability 114,461 117,301 1,217,023
Prepaid pension cost 82,787 72,634 880,244
Liability for employees’ retirement benefits ¥197,248 ¥189,935 $2,097,267
DENSO CORPORATION Annual Report 2013 31

The components of net periodic retirement benefit costs for the years ended March 31, 2013, 2012 and 2011, were as follows:
Millions of yen Thousands of
U.S. dollars
2013 2012 2011 2013
Service cost ¥25,046 ¥24,919 ¥24,698 $266,305
Interest cost 12,896 13,318 13,274 137,119
Expected return on plan assets (6,520) (4,934) (3,212) (69,325)
Recognized actuarial loss 11,918 23,456 21,888 126,720
Amortization of prior service benefit (10,827) (9,446) (9,037) (115,120)
Net periodic retirement benefit costs ¥32,513 ¥47,313 ¥47,611 $345,699
(Gain) Loss on change in pension plans of subsidiaries – (673) 2 –
Contribution to defined contribution pension plan funds 5,708 3,412 3,384 60,691
Pension cost of subsidiaries 13,836 10,960 – 147,113
Total ¥52,057 ¥61,012 ¥50,997 $553,503
Assumptions used for the years ended March 31, 2013, 2012 and 2011, were set forth as follows:
2013 2012 2011
Discount rate mainly 1.25% mainly 2.0% mainly 2.0%
Expected rate of return on plan assets mainly 1.5% mainly 1.0% mainly 0.5%
Amortization period of prior service benefit 10 years 10 years 10 years
Recognition period of actuarial gain/loss 10 years 10 years 10 years
The losses on pension cost of subsidiaries for the years ended March 31, 2013 and 2012, were ¥13,836 million ($147,113 thou-
sand) and ¥10,960 million, respectively. The loss for the year ended March 31, 2013, was mainly a lump-sum payment in connection with leaving the multi-employer pension plan. The loss for the year ended March 31, 2012, was an additional cost in connection with the transfer of the pension plan fund of an overseas subsidiary to an insurance company managing a defined contribution pension plan. 10. Contingent Liabilities At March 31, 2013, the Group had the following contingent liabilities:
Millions of yen Thousands of U.S. dollars
Bank guarantees for customs duties ¥189 $2,010
Total ¥189 $2,010
With respect to the plea agreement concluded with the U.S. Department of Justice in January 2012, several civil lawsuits claiming
damages have also been filed in the United States and elsewhere.
DENSO CORPORATION Annual Report 2013 32

11. Equity Japanese companies have been subject to the Companies Act of Japan (the “Companies Act”). The significant provisions in the Companies Act that affect financial and accounting matters are summarized below: (A) Dividends Under the Companies Act, companies can pay dividends at any time during the fiscal year in addition to the year-end dividend upon resolution at the shareholders’ meeting. For companies that meet certain criteria such as 1) having a Board of Directors, 2) having independent auditors, 3) having an Audit & Supervisory Board, and 4) the term of service of the directors is prescribed as one year rather than two years of normal term by its articles of incorporation, the Board of Directors may declare dividends (except for divi-dends-in-kind) at any time during the fiscal year if the Company has prescribed so in its articles of incorporation. The Company meets all the above criteria.
Semiannual interim dividends may also be paid once a year upon resolution by the Board of Directors if the articles of incorpora-tion of the company so stipulate. The Companies Act provides certain limitations on the amounts available for dividends or the pur-chase of treasury stock. The limitation is defined as the amount available for distribution to the shareholders, but the amount of net assets after dividends must be maintained at no less than ¥3 million. (B) Increases/Decreases and Transfer of Common Stock, Reserve and Surplus The Companies Act requires that an amount equal to 10% of dividends must be appropriated as a legal reserve (a component of retained earnings) or as additional paid-in capital (a component of capital surplus), depending on the equity account charged upon the payment of such dividends until the aggregate amount of legal reserve and additional paid-in capital equals 25% of the common stock. Under the Companies Act, the total amount of additional paid-in capital and legal reserve may be reversed without limitation. The Companies Act also provides that common stock, legal reserve, additional paid-in capital, other capital surplus and retained earnings can be transferred among the accounts under certain conditions upon resolution of the shareholders. (C) Treasury Stock and Treasury Stock Acquisition Rights The Companies Act also provides for companies to purchase treasury stock and dispose of such treasury stock by resolution of the Board of Directors. The amount of treasury stock purchased cannot exceed the amount available for distribution to the shareholders which is determined by specific formula. Under the Companies Act, stock acquisition rights are presented as a separate component of equity. The Companies Act also provides that companies can purchase both treasury stock acquisition rights and treasury stock. Such treasury stock acquisition rights are presented as a separate component of equity or deducted directly from stock acquisition rights.
The Company acquired 11,000 thousand shares of the Company’s common stock for ¥ 27,489 million (¥292,280 thousand). This acquisition was approved at the Board Meeting on October 31, 2012.
DENSO CORPORATION Annual Report 2013 33

12. Stock Options The stock options outstanding as of March 31, 2013, were as follows:
Stock Option Persons Granted Number of Options Granted Date of Grant Exercise Price Exercise Period
2006 13 Directors 27 Managing Officers 364 Key Employees, etc. 106 Directors of subsidiaries, etc.
1,342,000 shares August 1, 2006 ¥3,950 ($42.00)
From August 1, 2008to July 31, 2012
2007 13 Directors 27 Managing Officers 394 Key Employees, etc. 104 Directors of subsidiaries, etc.
1,720,000 shares August 1, 2007 ¥5,030 ($53.48)
From August 1, 2009to July 31, 2013
2008 13 Directors 29 Managing Officers 418 Key Employees, etc. 124 Directors of subsidiaries, etc.
1,873,000 shares August 1, 2008 ¥3,447 ($36.65)
From August 1, 2010to July 31, 2014
2009 11 Directors 30 Managing Officers 441 Key Employees, etc. 134 Directors of subsidiaries, etc.
1,929,000 shares August 3, 2009 ¥2,920 ($31.05)
From August 1, 2011to July 31, 2015
DENSO CORPORATION Annual Report 2013 34

The stock option activity was as follows: Shares
2009 2008 2007 2006 2005
Non-vested
March 31, 2011 – Outstanding 1,901,000 – – – –
Granted – – – – –
Canceled 70,000 – – – –
Vested 1,831,000 – – – –
March 31, 2012 – Outstanding – – – – –
Vested
March 31, 2011 – Outstanding – 1,738,000 1,459,000 941,000 484,900
Vested 1,831,000 – – – –
Exercised – – – – 38,000
Canceled 22,000 86,000 77,000 88,000 446,900
March 31, 2012 – Outstanding 1,809,000 1,652,000 1,382,000 853,000 –
Non-vested
March 31, 2012 – Outstanding – – – – –
Granted – – – – –
Canceled – – – – –
Vested – – – – –
March 31, 2013 – Outstanding – – – – –
Vested
March 31, 2012 – Outstanding 1,809,000 1,652,000 1,382,000 853,000 –
Vested – – – – –
Exercised 473,900 116,900 – – –
Canceled 113,000 97,300 112,000 853,000 –
March 31, 2013 – Outstanding 1,222,100 1,437,800 1,270,000 – –
Yen (U.S. dollars)
2009 2008 2007 2006
Exercise price ¥2,920 ¥3,447 ¥5,030 ¥3,950
($31.05) ($36.65) ($53.48) ($42.00)
Average stock price at exercise 3,753 3,991 – –
(39.90) (42.43) (–) (–)
Fair value price at grant date 793 366 628 730
(8.43) (3.89) (6.68) (7.76)
DENSO CORPORATION Annual Report 2013 35

13. Significant Shareholder Toyota Motor Corporation (“Toyota”) directly owned 197,193 thousand shares of common stock of the Company at March 31, 2013, which accounted for 22.31% of the total shares of the Company issued at the corresponding date.
Sales of the Group to Toyota for the years ended March 31, 2013, 2012 and 2011, were as follows:
Millions of yen Thousands of
U.S. dollars
2013 2012 2011 2013
Sales to Toyota (Japan headquarters only) ¥1,107,256 ¥946,849 ¥908,751 $11,773,057
14. Research and Development Expenses Research and development expenses charged to income were ¥335,460 million ($3,566,826 thousand), ¥298,362 million and ¥290,069 million for the years ended March 31, 2013, 2012 and 2011, respectively.
15. Leases The Group leases certain machinery, computer equipment, molds and other assets. Total lease expenses for finance leases for the years ended March 31, 2013, 2012 and 2011, were ¥247 million ($2,626 thousand), ¥459 million and ¥737 million, respectively. Pro forma information of leased property whose lease inception was before March 31, 2008 ASBJ Statement No. 13, “Accounting Standard for Lease Transactions” requires that all finance lease transactions be capitalized to recognize lease assets and lease obligations in the balance sheet. However, ASBJ Statement No. 13 permits leases without own-ership transfer of the leased property to the lessee and whose lease inception was before March 31, 2008, to continue to be ac-counted for as operating lease transactions if certain “as if capitalized” information is disclosed in the note to the financial state-ments. The Company applied ASBJ Statement No. 13 effective April 1, 2008, and accounted for such leases as operating lease transactions. Pro forma information of leased property whose lease inception was before March 31, 2008, was as follows:
Millions of yen
Buildings and structures
Machinery and equipment Software Total
2013
Acquisition cost ¥425 ¥478 – ¥903
Accumulated depreciation 251 352 – 603
Net leased property ¥174 ¥126 – ¥300
Millions of yen
Buildings and structures
Machinery and equipment Software Total
2012
Acquisition cost ¥425 ¥1,396 ¥684 ¥2,505
Accumulated depreciation 202 1,120 604 1,926
Net leased property ¥223 ¥276 ¥80 ¥579
Thousands of U.S. dollars
Buildings and structures
Machinery and equipment Software Total
2013
Acquisition cost $4,519 $5,082 – $9,601
Accumulated depreciation 2,669 3,742 – 6,411
Net leased property $1,850 $1,340 – $3,190
DENSO CORPORATION Annual Report 2013 36

Millions of yen Thousands of
U.S. dollars
2013 2012 2013
Obligations under finance leases Due within one year ¥85 ¥254 $904
Due after one year 215 325 2,286
Total ¥300 ¥579 $3,190
Obligations under finance leases include the imputed interest expense portion.
Depreciation expense, which was not reflected in the accompanying consolidated statement of income for the years ended
March 31, 2013, 2012, and 2011, computed by the straight-line method, was ¥247 million ($2,626 thousand), ¥459 million and ¥737 million, respectively.
The minimum rental commitments under noncancelable operating leases at March 31, 2013, were as follows:
Millions of yen Thousands of
U.S. dollars
Due within one year ¥952 $10,122
Due after one year 2,402 25,540
Total ¥3,354 $35,662
16. Financial Instruments and Related Disclosures (A) Group Policy for Financial Instruments The Group uses financial instruments, mainly bank borrowings and bonds, based on its capital financing plan.
Cash surpluses, if any, are invested in low risk financial assets, such as bank deposits and high credit rating bonds. Derivatives are used, not for speculative purposes, but to manage exposure to financial risks as described in Note 18 and (B) below.
(B) Nature and Extent of Risks Arising from Financial Instruments Receivables, such as trade notes and trade accounts, are exposed to customer credit risk. Although receivables in foreign curren-cies are exposed to the market risk of fluctuation in foreign currency exchange rates, the position, net of payables in foreign curren-cies, is hedged by using forward foreign currency contracts. Short-term investments and investment securities include debt securi-ties, investment trusts and equity securities of customers and suppliers of the Company. Debt securities are exposed to credit risk. Investment trusts and equity securities are exposed to the risk of market price fluctuations.
Payment terms of payables, such as trade notes and trade accounts, are less than one year. Although payables in foreign cur-rencies are exposed to the market risk of fluctuation in foreign currency exchange rates, those risks are netted against the balance of receivables denominated in the same foreign currency as noted above.
Bank borrowings and bonds are used to fund the Group’s operations. Although a part of such bank borrowings and bonds are exposed to market risks from changes in variable interest rates, those risks are mitigated by using interest-rate swaps.
Derivatives mainly include forward foreign currency contracts and interest-rate swaps, which are used to manage exposure to market risks from changes in foreign currency exchange rates of receivables and payables, and from changes in interest rates of bank deposits, bank borrowings and bonds. Please see Note 18 for more details about derivatives.
(C) Risk Management for Financial Instruments Credit Risk Management Credit risk is the risk of economic loss arising from a counterparty’s failure to repay or service debt according to the contractual terms. The Group manages its credit risks from receivables on the basis of internal guidelines, which include monitoring of payment term and balances of customers to identify the default risk of customers at an early stage. With respect to short-term investments and investment securities, the Group manages its exposure to credit risk by limiting its funding to high credit rated bonds in accord-ance with its internal guidelines. Please see Note 18 for details about derivatives.
The maximum credit risk exposure of financial assets is limited to their carrying amounts as of March 31, 2013.
DENSO CORPORATION Annual Report 2013 37

Market Risk Management (Foreign Exchange Risk and Interest Rate Risk) Foreign currency trade receivables and payables are exposed to market risk resulting from fluctuations in foreign currency ex-change rates. Such foreign exchange risk is hedged principally by forward foreign currency contracts. In addition, when foreign cur-rency trade receivables and payables are expected to arise from forecasted transactions, forward foreign currency contracts may be used under limited contract terms.
Interest-rate swaps are used to manage exposure to market risks from changes in interest rates of bank borrowings and bond paya-bles.
Available-for-sale securities included in short-term investments and investment securities are managed by monitoring fair values and financial position of issuers on a regular basis.
The basic principles of derivative transactions have been approved by management at meetings on an annual basis based on the internal guidelines which prescribe the authority and the limits for each transaction by the corporate accounting department. Liquidity Risk Management Liquidity risk comprises the risk that the Group cannot meet its contractual obligations in full on maturity dates. The Group manages its liquidity risk by holding adequate volumes of liquid assets at the level of one month’s sales volume, along with adequate financial planning by the corporate accounting department.
(D) Concentration of Credit Risk 19% of total receivables is from certain major customers of the Group as of March 31, 2013.
(E) Fair Values of Financial Instruments Fair values of financial instruments are based on quoted prices in active markets. If a quoted price is not available, other rational valuation techniques are used instead.
Please see Note 18 for detail on fair value for derivatives.
(1) Fair Value of Financial Instruments Millions of yen Thousands of U.S. dollars
Carrying amount Fair value
Unrealized gain/loss Carrying
amount Fair valueUnrealized
gain/loss
2013 2013
Cash and cash equivalents ¥707,330 ¥707,330 – $7,520,787 $7,520,787 –
Short-term investments 387,874 387,874 – 4,124,125 4,124,125 –
Notes and accounts receivable: Trade 629,397 629,397 – 6,692,153 6,692,153 –
Affiliates 10,653 10,653 – 113,270 113,270 –
Investment securities 583,605 583,605 – 6,205,264 6,205,264 –
Investments in and advances to affiliates 4,925 2,505 ¥(2,420) 52,365 26,634 $(25,731)
Total ¥2,323,784 ¥2,321,364 ¥(2,420) $24,707,964 $24,682,233 $(25,731)
DENSO CORPORATION Annual Report 2013 38

Millions of yen Thousands of U.S. dollars
Carrying amount Fair value
Unrealized gain/loss Carrying
amount Fair valueUnrealized
gain/loss
2013 2013
Short-term borrowings ¥7,445 ¥7,445 – $79,160 $79,160 –
Current portion of long-term debt 149,097 150,215 ¥(1,118) 1,585,295 1,597,182 $(11,887)
Notes and accounts payable:
Trade 427,391 427,391 – 4,544,296 4,544,296 –
Affiliates 29,212 29,212 – 310,601 310,601 –
Income taxes payable 55,128 55,128 – 586,156 586,156 –
Long-term debt 351,435 352,871 (1,436) 3,736,683 3,751,951 (15,268)
Total ¥1,019,708 ¥1,022,262 ¥(2,554) $10,842,191 $10,869,346 $(27,155)
Millions of yen
Carrying amount Fair value
Unrealized gain/loss
2012
Cash and cash equivalents ¥665,409 ¥665,409 –
Short-term investments 356,733 356,733 –
Notes and accounts receivable: Trade 610,753 610,753 –
Affiliates 9,403 9,403 –
Investment securities 459,192 459,192 –
Investments in and advances to affiliates 4,879 2,483 ¥(2,396)
Total ¥2,106,369 ¥2,103,973 ¥(2,396)
Short-term borrowings ¥7,519 ¥7,519 –
Current portion of long-term debt 52,501 52,762 ¥(261)
Notes and accounts payable: Trade 428,653 428,653 –
Affiliates 29,129 29,129 –
Income taxes payable 18,881 18,881 –
Long-term debt 463,525 466,480 (2,955)
Total ¥1,000,208 ¥1,003,424 ¥(3,216)
Cash and Cash Equivalents, Notes and Accounts Receivable, Notes and Accounts Payable, Short-term Borrowings and Income Taxes Payable The carrying values of cash and cash equivalents, notes and accounts receivable, notes and accounts payable, short-term borrow-ings and income taxes payable approximate fair value because of their short maturities.
Short-term Investments and Investment Securities The fair values of short-term investments and investment securities are measured at the quoted market price of the stock exchange for the equity instruments, and at the quoted price obtained from the financial institution for certain debt instruments. Information regarding the fair value for short-term investments and investment securities by classification is included in Note 3.
DENSO CORPORATION Annual Report 2013 39

Long-term Debt The fair values of long-term debt are determined by discounting the cash flows related to the debt at the Group’s assumed corpo-rate borrowing rate.
Derivatives Information regarding the fair value of derivatives is included in Note 18.
(2) Financial Instruments Whose Fair Value Cannot Be Reliably Determined
Millions of yen Thousands of
U.S. dollars
2013 2012 2013
Investments in equity instruments that do not have a quoted market price in an active market ¥33,054 ¥19,180 $351,451
Investments in affiliates 46,273 38,686 492,005
(F) Maturity Analysis for Financial Assets and Securities with Contractual Maturities
Millions of yen
Due in one year or less
Due after one year through
five years Due after five years through
ten years Due after ten
years
2013
Cash and cash equivalents ¥707,330 – – –
Notes and accounts receivable: Trade 629,397 – – –
Affiliates 10,653 – – –
Short-term investments and investment securities 282,927 ¥60,053 ¥127 –
Total ¥1,630,307 ¥60,053 ¥127 –
Millions of yen
Due in one year or less
Due after one year through
five years Due after five years through
ten years Due after ten
years
2012
Cash and cash equivalents ¥665,409 – – –
Notes and accounts receivable:
Trade 610,753 – – –
Affiliates 9,403 – – –
Short-term investments and investment securities 230,904 ¥59,004 ¥45 –
Total ¥1,516,469 ¥59,004 ¥45 –
DENSO CORPORATION Annual Report 2013 40

Thousands of U.S. dollars
Due in one year or less
Due after one year through
five years Due after five years through
ten years Due after ten
years
2013
Cash and cash equivalents $7,520,787 – – –
Notes and accounts receivable:
Trade 6,692,153 – – –
Affiliates 113,270 – – –
Short-term investments and investment securities 3,008,261 $638,522 $1,350 –
Total $17,334,471 $638,522 $1,350 –
Please see Note 7 for annual maturities of long-term debt.
17. Segment Information Under ASBJ Statement No. 17, “Accounting Standard for Segment Information Disclosures,” and ASBJ Guidance No. 20, “Guid-ance on Accounting Standard for Segment Information Disclosures”, an entity is required to report financial and descriptive infor-mation about its reportable segments. Reportable segments are operating segments or aggregations of operating segments that meet specified criteria. Operating segments are components of an entity about which separate financial information is available and such information is evaluated regularly by the chief operating decision maker in deciding how to allocate resources and in assessing performance. Generally, segment information is required to be reported on the same basis as is used internally for evaluating oper-ating segment performance and deciding how to allocate resources to operating segments.
(A) Description of Reportable Segments The Group manufactures and sells mainly automotive parts and has directors in charge in Japan, North America, Europe and Asia & Oceania. As independent management units, subsidiaries in each region have developed business activities, as exemplified by establishment or expansion of manufacturing companies aiming for optimum production and supply for orders received through operating activities to regional customers.
The Company is in charge of the business activities in Japan. Meanwhile, DENSO INTERNATIONAL AMERICA, INC. and DEN-SO INTERNATIONAL EUROPE B.V. are in charge in the North America and Europe regions, respectively. In Asia & Oceania, DENSO INTERNATIONAL ASIA CO., LTD. (Thailand); DENSO INTERNATIONAL ASIA PTE. LTD. (Singapore); and DENSO (CHINA) INVESTMENT CO., LTD have been cooperated together as a management unit.
Since the Group is composed of regional segments based on manufacturing and selling systems, the Group determined that Ja-pan, North America, Europe and Asia & Oceania are its reportable segments. The Group has been manufacturing and selling main-ly automotive parts in each reportable segment.
(B) Methods of Measurement of Sales, Profit, Assets, and Other Items for Each Reportable Segment Accounting procedures are the same as those used for the consolidated financial statements.
Reportable segment profit is calculated on the basis of operating income. Internal profits of intersegment and transferring prices are calculated based on current market prices. Amortization of goodwill is offset against the amount of negative goodwill in each reportable segment. The net amount of amorti-
zation of goodwill is included in the calculation of reportable segment profit.
DENSO CORPORATION Annual Report 2013 41

(C) Sales, Profit, Assets, and Other Items for Each Reportable Segment Segment data for the years ended March 31, 2013, 2012 and 2011, were as follows:
Millions of yen Thousands of
U.S. dollars
Years ended March 31 2013 2012 2011 2013
Sales Japan Customers ¥1,808,850 ¥1,639,962 ¥1,548,201 $19,232,855
Intersegment 654,775 557,670 564,733 6,961,988
Total 2,463,625 2,197,632 2,112,934 26,194,843
North America Customers 624,974 504,075 528,868 6,645,125
Intersegment 10,424 8,042 7,172 110,835
Total 635,398 512,117 536,040 6,755,960
Europe Customers 348,769 373,214 389,584 3,708,336
Intersegment 23,467 13,978 11,748 249,516
Total 372,236 387,192 401,332 3,957,852
Asia & Oceania Customers 734,525 579,752 604,651 7,809,942
Intersegment 59,516 46,969 47,817 632,812
Total 794,041 626,721 652,468 8,442,754
Total Customers 3,517,118 3,097,003 3,071,304 37,396,257
Intersegment 748,182 626,659 631,470 7,955,152
Total 4,265,300 3,723,662 3,702,774 45,351,409
Others Customers 63,805 57,627 60,156 678,416
Intersegment 123 101 177 1,307
Total 63,928 57,728 60,333 679,723
Consolidated Customers 3,580,923 3,154,630 3,131,460 38,074,673
Intersegment 748,305 626,760 631,647 7,956,459
Total ¥4,329,228 ¥3,781,390 ¥3,763,107 $46,031,132
Segment Profit Japan ¥170,676 ¥83,866 ¥63,388 $1,814,737
North America 13,429 8,771 25,364 142,786
Europe 3,910 6,379 10,929 41,574
Asia & Oceania 73,696 59,491 83,021 783,583
Total 261,711 158,507 182,702 2,782,680
Others 3,135 3,169 6,473 33,333
Consolidated ¥264,846 ¥161,676 ¥189,175 $2,816,013
Segment Assets Japan ¥1,989,799 ¥1,862,160 ¥1,748,748 $21,156,821
North America 279,093 224,071 210,606 2,967,496
Europe 322,421 273,975 274,844 3,428,187
Asia & Oceania 646,545 501,109 482,670 6,874,482
Total 3,237,858 2,861,315 2,716,868 34,426,986
Others 59,963 49,881 50,354 637,565
Consolidated ¥3,297,821 ¥2,911,196 ¥2,767,222 $35,064,551
DENSO CORPORATION Annual Report 2013 42
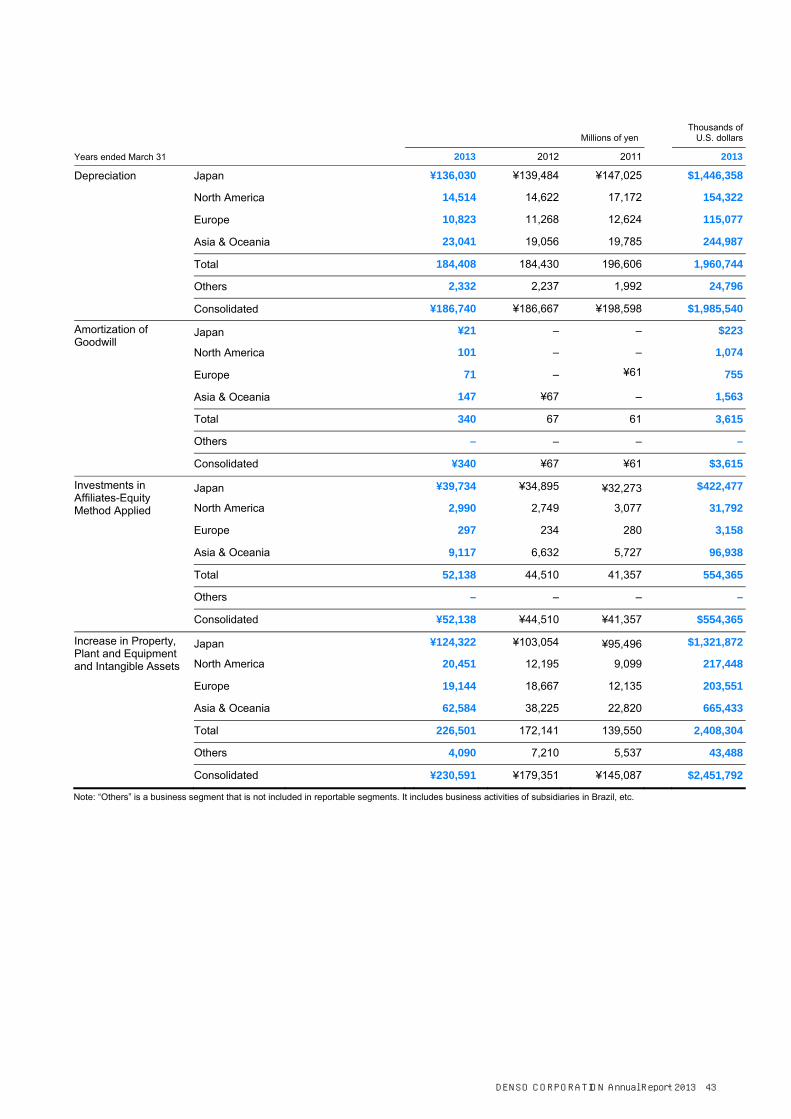
Millions of yen Thousands of
U.S. dollars
Years ended March 31 2013 2012 2011 2013
Depreciation Japan ¥136,030 ¥139,484 ¥147,025 $1,446,358
North America 14,514 14,622 17,172 154,322
Europe 10,823 11,268 12,624 115,077
Asia & Oceania 23,041 19,056 19,785 244,987
Total 184,408 184,430 196,606 1,960,744
Others 2,332 2,237 1,992 24,796
Consolidated ¥186,740 ¥186,667 ¥198,598 $1,985,540
Amortization of Goodwill
Japan ¥21 – – $223
North America 101 – – 1,074
Europe 71 – ¥61 755
Asia & Oceania 147 ¥67 – 1,563
Total 340 67 61 3,615
Others – – – –
Consolidated ¥340 ¥67 ¥61 $3,615
Investments in Affiliates-Equity Method Applied
Japan ¥39,734 ¥34,895 ¥32,273 $422,477
North America 2,990 2,749 3,077 31,792
Europe 297 234 280 3,158
Asia & Oceania 9,117 6,632 5,727 96,938
Total 52,138 44,510 41,357 554,365
Others – – – –
Consolidated ¥52,138 ¥44,510 ¥41,357 $554,365
Increase in Property, Plant and Equipment and Intangible Assets
Japan ¥124,322 ¥103,054 ¥95,496 $1,321,872
North America 20,451 12,195 9,099 217,448
Europe 19,144 18,667 12,135 203,551
Asia & Oceania 62,584 38,225 22,820 665,433
Total 226,501 172,141 139,550 2,408,304
Others 4,090 7,210 5,537 43,488
Consolidated ¥230,591 ¥179,351 ¥145,087 $2,451,792
Note: “Others” is a business segment that is not included in reportable segments. It includes business activities of subsidiaries in Brazil, etc.
DENSO CORPORATION Annual Report 2013 43

(D) Differences between the Total of Reportable Segments and the Consolidated Financial Statements The main differences between the total of reportable segments and the consolidated financial statements were as follows:
Millions of yen Thousands of
U.S. dollars
Years ended March 31 2013 2012 2011 2013
Sales Total of reportable segments ¥4,265,300 ¥3,723,662 ¥3,702,774 $45,351,409
Others 63,928 57,728 60,333 679,723
Eliminations (748,305) (626,760) (631,647) (7,956,459)
Consolidated ¥3,580,923 ¥3,154,630 ¥3,131,460 $38,074,673
Segment Profit Total of reportable segments ¥261,711 ¥158,507 ¥182,702 $2,782,679
Others 3,135 3,169 6,473 33,334
Eliminations (2,470) (944) (844) (26,263)
Consolidated ¥262,376 ¥160,732 ¥188,331 $2,789,750
Segment Assets Total of reportable segments ¥3,237,858 ¥2,861,315 ¥2,716,868 $34,426,986
Others 59,963 49,881 50,354 637,565
Company-wide assets 681,272 696,501 613,211 7,243,721
Consolidated ¥3,979,093 ¥3,607,697 ¥3,380,433 $42,308,272
Depreciation Total of reportable segments ¥184,408 ¥184,430 ¥196,606 $1,960,744
Others 2,332 2,237 1,992 24,796
Adjustments – – – –
Consolidated ¥186,740 ¥186,667 ¥198,598 $1,985,540
Amortization of Goodwill
Total of reportable segments ¥340 ¥67 ¥61 $3,615
Others – – – –
Adjustments – (67) (61) –
Consolidated ¥340 – – $3,615
Investments in Affiliates-Equity Method Applied
Total of reportable segments ¥52,138 ¥44,510 ¥41,357 $554,365
Others – – – –
Adjustments (940) (944) (422) (9,995)
Consolidated ¥51,198 ¥43,566 ¥40,935 $544,370
Increase in Property, Plant and Equipment and Intangible Assets
Total of reportable segments ¥226,501 ¥172,141 ¥139,550 $2,408,304
Others 4,090 7,210 5,537 43,488
Adjustments – – – –
Consolidated ¥230,591 ¥179,351 ¥145,087 $2,451,792
Note: Company-wide assets are mainly cash and cash equivalents, securities and investment securities that are not attributable to the reportable segments.
DENSO CORPORATION Annual Report 2013 44

(E) Related Segment Information (1) Information about Products and Services Sales data by product and service for the years ended March 31, 2013, 2012 and 2011, are not presented as the sales of automo-tive products represented more than 90% of total sales. (2) Information about Geographical Areas Sales
Millions of yen Thousands of
U.S. dollars
Years ended March 31 2013 2012 2011 2013
Japan ¥1,765,536 ¥1,596,106 ¥1,506,681 $18,772,313
The United States 544,162 438,083 447,746 5,785,880
Others 1,271,225 1,120,441 1,177,033 13,516,480
Total ¥3,580,923 ¥3,154,630 ¥3,131,460 $38,074,673
Note: The sales figures are classified based on the customer locations.
Property, Plant and Equipment
Millions of yen Thousands of U.S. dollars
Years ended March 31 2013 2012 2011 2013
Japan ¥493,155 ¥504,541 ¥540,874 $5,243,541
North America 85,094 68,952 73,454 904,774
Europe 108,574 91,256 90,548 1,154,428
Asia & Oceania 176,495 115,717 100,880 1,876,608
Others 22,842 20,422 17,472 242,871
Total ¥886,160 ¥800,888 ¥823,228 $9,422,222
(3) Information about Major Customers
Millions of yen Thousands of
U.S. dollars
Years ended March 31 2013 2012 2011 2013
Japan Sales to Toyota (Japan headquarters only) ¥1,107,256 ¥946,849 ¥908,751 $11,773,057
(F) Impairment Loss on Long-lived Assets for Each Reportable Segment
Millions of yen Thousands of
U.S. dollars
Years ended March 31 2013 2012 2011 2013
Japan ¥671 ¥183 – $7,134
North America – – – –
Europe 31 – ¥323 330
Asia & Oceania 199 – 152 2,116
Others 55 – 48 585
Eliminations – – – –
Total ¥956 ¥183 ¥523 $10,165
DENSO CORPORATION Annual Report 2013 45
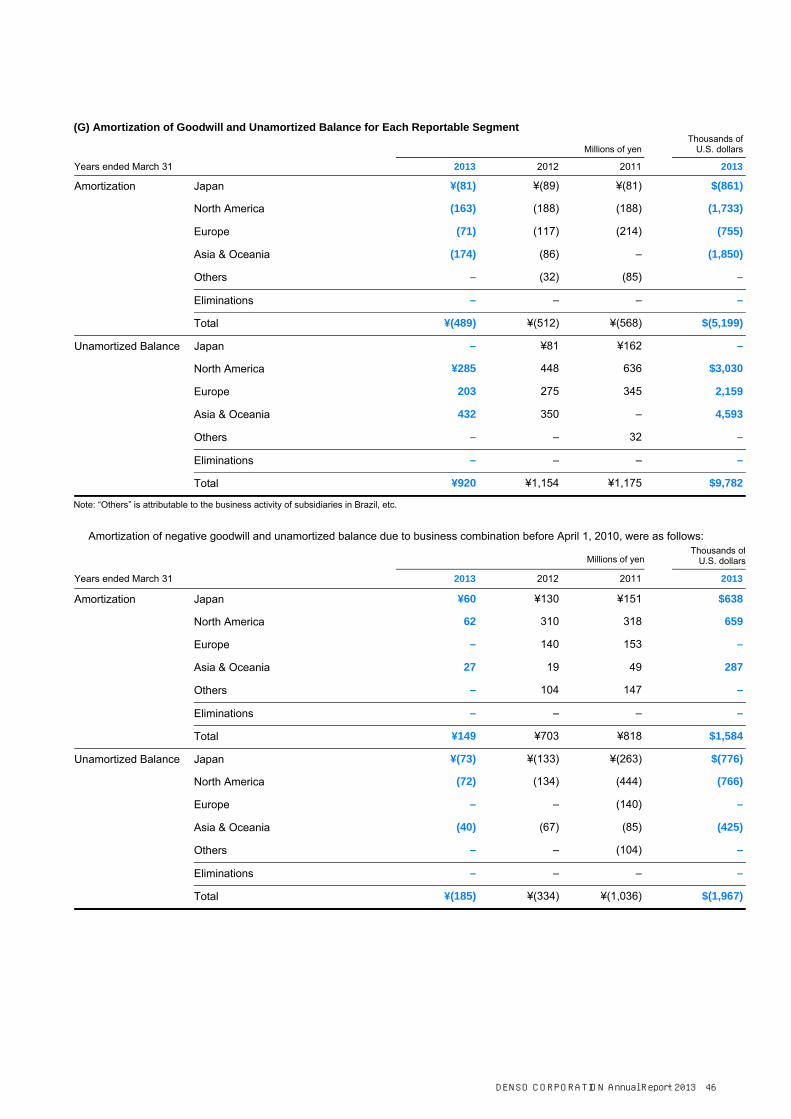
(G) Amortization of Goodwill and Unamortized Balance for Each Reportable Segment
Millions of yen Thousands of
U.S. dollars
Years ended March 31 2013 2012 2011 2013
Amortization Japan ¥(81) ¥(89) ¥(81) $(861)
North America (163) (188) (188) (1,733)
Europe (71) (117) (214) (755)
Asia & Oceania (174) (86) – (1,850)
Others – (32) (85) –
Eliminations – – – –
Total ¥(489) ¥(512) ¥(568) $(5,199)
Unamortized Balance Japan – ¥81 ¥162 –
North America ¥285 448 636 $3,030
Europe 203 275 345 2,159
Asia & Oceania 432 350 – 4,593
Others – – 32 –
Eliminations – – – –
Total ¥920 ¥1,154 ¥1,175 $9,782
Note: “Others” is attributable to the business activity of subsidiaries in Brazil, etc.
Amortization of negative goodwill and unamortized balance due to business combination before April 1, 2010, were as follows:
Millions of yen Thousands of
U.S. dollars
Years ended March 31 2013 2012 2011 2013
Amortization Japan ¥60 ¥130 ¥151 $638
North America 62 310 318 659
Europe – 140 153 –
Asia & Oceania 27 19 49 287
Others – 104 147 –
Eliminations – – – –
Total ¥149 ¥703 ¥818 $1,584
Unamortized Balance Japan ¥(73) ¥(133) ¥(263) $(776)
North America (72) (134) (444) (766)
Europe – – (140) –
Asia & Oceania (40) (67) (85) (425)
Others – – (104) –
Eliminations – – – –
Total ¥(185) ¥(334) ¥(1,036) $(1,967)
DENSO CORPORATION Annual Report 2013 46

(H) Gain on Negative Goodwill for Each Reportable Segment The Group recognized a gain on negative goodwill in the amount of ¥4,048 million for the year ended March 31, 2011, due to a subsidiary’s treasury stock repurchases in the Japan segment. It was not included in the segment income.
18. Derivatives The Group uses derivatives for the purpose of reducing its exposures to adverse fluctuations in interest rates and foreign exchange rates. Derivatives used include forward exchange contracts, currency swaps, currency options and interest rate swaps. The amounts of derivatives are limited by the Group’s regulations.
Derivatives are subject to risks, such as fluctuations in interest rates and foreign exchange rates. Because the counterparties to these derivatives are limited to major international financial institutions, the Group does not anticipate any losses arising from credit risk.
The execution and control of derivatives at the Company, as approved by the Board of Directors at the beginning of each fiscal period, are governed by internal regulations, which stipulate the purpose of the derivatives, their scope of use, and the reporting system.
DENSO CORPORATION Annual Report 2013 47
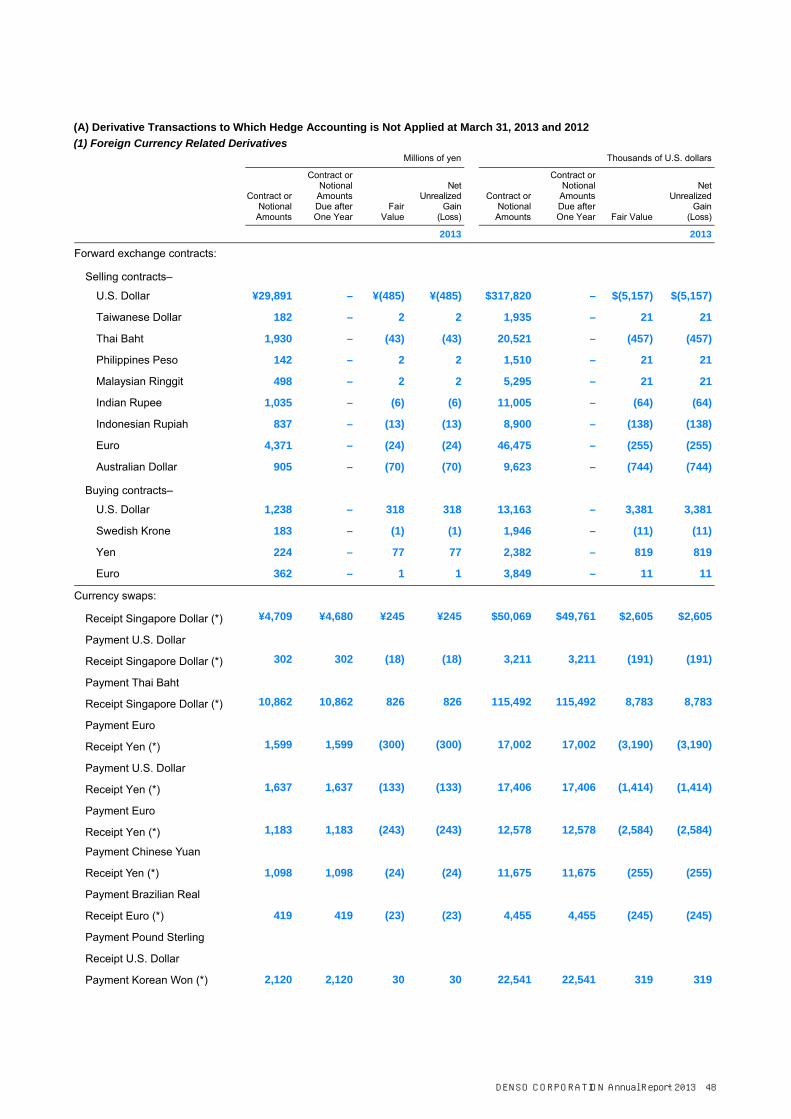
(A) Derivative Transactions to Which Hedge Accounting is Not Applied at March 31, 2013 and 2012 (1) Foreign Currency Related Derivatives
Millions of yen Thousands of U.S. dollars
Contract or
Notional Amounts
Contract or Notional
Amounts Due after One Year
Fair Value
Net Unrealized
Gain (Loss)
Contract or Notional Amounts
Contract or Notional
Amounts Due after One Year Fair Value
Net Unrealized
Gain (Loss)
2013 2013
Forward exchange contracts: Selling contracts–
U.S. Dollar ¥29,891 – ¥(485) ¥(485) $317,820 – $(5,157) $(5,157)
Taiwanese Dollar 182 – 2 2 1,935 – 21 21
Thai Baht 1,930 – (43) (43) 20,521 – (457) (457)
Philippines Peso 142 – 2 2 1,510 – 21 21
Malaysian Ringgit 498 – 2 2 5,295 – 21 21
Indian Rupee 1,035 – (6) (6) 11,005 – (64) (64)
Indonesian Rupiah 837 – (13) (13) 8,900 – (138) (138)
Euro 4,371 – (24) (24) 46,475 – (255) (255)
Australian Dollar 905 – (70) (70) 9,623 – (744) (744)
Buying contracts–
U.S. Dollar 1,238 – 318 318 13,163 – 3,381 3,381
Swedish Krone 183 – (1) (1) 1,946 – (11) (11)
Yen 224 – 77 77 2,382 – 819 819
Euro 362 – 1 1 3,849 – 11 11
Currency swaps: Receipt Singapore Dollar (*) ¥4,709 ¥4,680 ¥245 ¥245 $50,069 $49,761 $2,605 $2,605
Payment U.S. Dollar
Receipt Singapore Dollar (*) 302 302 (18) (18) 3,211 3,211 (191) (191)
Payment Thai Baht
Receipt Singapore Dollar (*) 10,862 10,862 826 826 115,492 115,492 8,783 8,783
Payment Euro
Receipt Yen (*) 1,599 1,599 (300) (300) 17,002 17,002 (3,190) (3,190)
Payment U.S. Dollar
Receipt Yen (*) 1,637 1,637 (133) (133) 17,406 17,406 (1,414) (1,414)
Payment Euro
Receipt Yen (*) 1,183 1,183 (243) (243) 12,578 12,578 (2,584) (2,584)
Payment Chinese Yuan
Receipt Yen (*) 1,098 1,098 (24) (24) 11,675 11,675 (255) (255)
Payment Brazilian Real
Receipt Euro (*) 419 419 (23) (23) 4,455 4,455 (245) (245)
Payment Pound Sterling
Receipt U.S. Dollar
Payment Korean Won (*) 2,120 2,120 30 30 22,541 22,541 319 319
DENSO CORPORATION Annual Report 2013 48
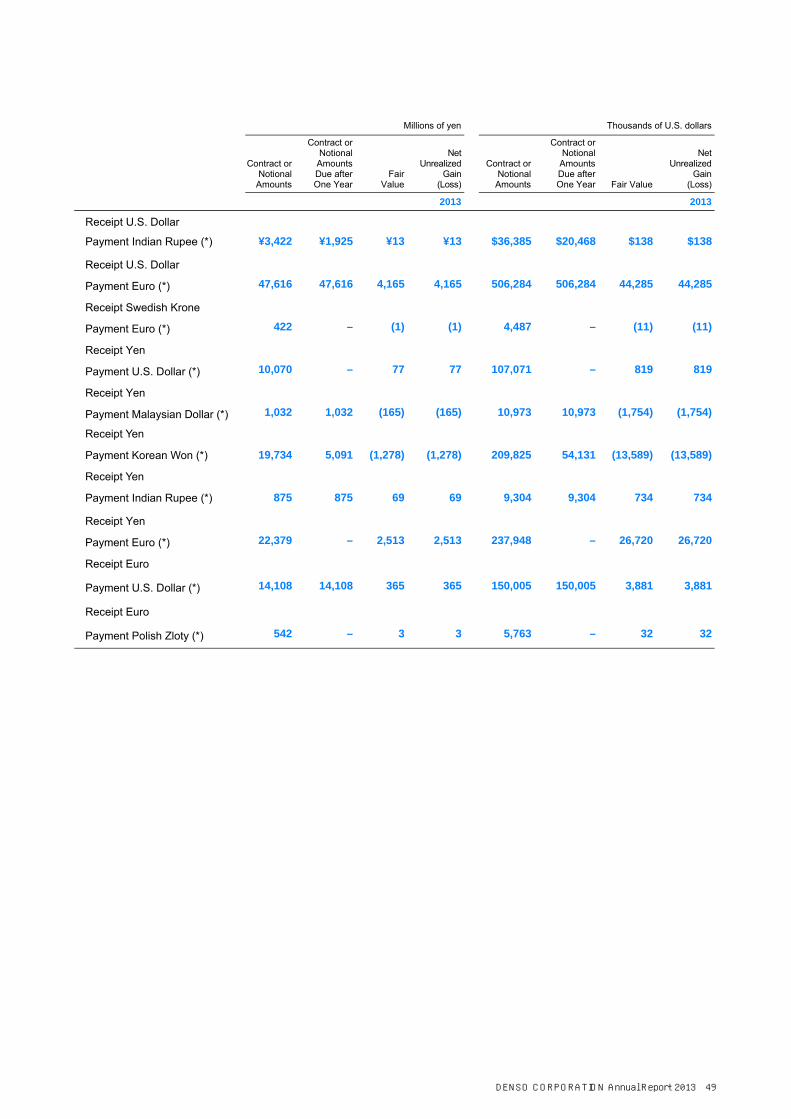
Millions of yen Thousands of U.S. dollars
Contract or
Notional Amounts
Contract or Notional
Amounts Due after One Year
Fair Value
Net Unrealized
Gain (Loss)
Contract or Notional Amounts
Contract or Notional
Amounts Due after One Year Fair Value
Net Unrealized
Gain (Loss)
2013 2013
Receipt U.S. Dollar
Payment Indian Rupee (*) ¥3,422 ¥1,925 ¥13 ¥13 $36,385 $20,468 $138 $138
Receipt U.S. Dollar
Payment Euro (*) 47,616 47,616 4,165 4,165 506,284 506,284 44,285 44,285
Receipt Swedish Krone
Payment Euro (*) 422 – (1) (1) 4,487 – (11) (11)
Receipt Yen
Payment U.S. Dollar (*) 10,070 – 77 77 107,071 – 819 819
Receipt Yen
Payment Malaysian Dollar (*) 1,032 1,032 (165) (165) 10,973 10,973 (1,754) (1,754)
Receipt Yen
Payment Korean Won (*) 19,734 5,091 (1,278) (1,278) 209,825 54,131 (13,589) (13,589)
Receipt Yen
Payment Indian Rupee (*) 875 875 69 69 9,304 9,304 734 734
Receipt Yen
Payment Euro (*) 22,379 – 2,513 2,513 237,948 – 26,720 26,720
Receipt Euro
Payment U.S. Dollar (*) 14,108 14,108 365 365 150,005 150,005 3,881 3,881
Receipt Euro
Payment Polish Zloty (*) 542 – 3 3 5,763 – 32 32
DENSO CORPORATION Annual Report 2013 49

Millions of yen
Contract or
Notional Amounts
Contract or Notional
Amounts Due after One Year
Fair Value
Net Unrealized
Gain (Loss)2012
Forward exchange contracts: Selling contracts–
U.S. Dollar ¥26,152 – ¥(727) ¥(727)
Taiwanese Dollar 139 – 2 2
Thai Baht 635 – (4) (4)
Philippines Peso 64 – 1 1
Malaysian Ringgit 285 – 5 5
Indian Rupee 933 – 13 13
Indonesian Rupiah 479 – (6) (6)
Euro 4,018 – (226) (226)
Australian Dollar 613 – (32) (32)
Buying contracts–
U.S. Dollar 62 – (0) (0)
Swedish Krone 66 – 1 1
Yen 598 – (38) (38)
Hungarian Forint 3,724 – (43) (43)
Euro 1,354 – (38) (38)
Czech Koruna 2,603 – (31) (31)
Currency swaps:
Receipt Singapore Dollar (*) ¥2,221 ¥2,221 ¥219 ¥219
Payment U.S. Dollar
Receipt Singapore Dollar (*) 9,368 9,368 285 285
Payment Euro
Receipt Yen (*) 1,428 1,208 3 3
Payment U.S. Dollar
Receipt Yen (*) 1,637 1,637 26 26
Payment Euro
Receipt Euro (*) 508 508 (37) (37)
Payment Pound Sterling
Receipt U.S. Dollar
Payment Korean Won (*) 3,625 1,813 123 123
Receipt U.S. Dollar
Payment Indian Rupee (*) 1,782 1,782 (215) (215)
DENSO CORPORATION Annual Report 2013 50

Millions of yen
Contract or
Notional Amounts
Contract or Notional
Amounts Due after One Year
Fair Value
Net Unrealized
Gain (Loss)2012
Receipt U.S. Dollar
Payment Indonesian Rupiah (*) ¥364 – ¥1 ¥1
Receipt U.S. Dollar
Payment Euro (*) 30,634 ¥30,634 1,701 1,701
Receipt Swedish Krone
Payment Euro (*) 251 – 4 4
Receipt Polish Zloty
Payment Euro (*) 220 – 0 0
Receipt Yen
Payment Thai Baht (*) 229 – 4 4
Receipt Yen
Payment Malaysian Dollar (*) 1,200 1,200 (58) (58)
Receipt Yen
Payment Korean Won (*) 8,767 2,014 736 736
Receipt Yen
Payment Euro (*) 20,024 19,550 4,375 4,375
Receipt Pound Sterling
Payment Yen (*) 4,000 – (8) (8)
Receipt Euro
Payment Polish Zloty (*) 1,646 – (26) (26)
Receipt Euro
Payment Yen (*) 8,160 – (10) (10)
Notes: 1. The fair values of foreign currencies are translated at the spot rate at the balance sheet date. 2. (*) indicates hedged items.
DENSO CORPORATION Annual Report 2013 51

(2) Interest Related Derivatives Millions of yen Thousands of U.S. dollars
Contract or
Notional Amounts
Contract or Notional
Amounts Due after One Year
Fair Value
Net Unrealized
Gain (Loss)
Contract or Notional Amounts
Contract or Notional
Amounts Due after One Year Fair Value
Net Unrealized
Gain (Loss)
2013 2013
Interest rate swaps: Fixed rate receipt,
floating rate payment ¥2,207 ¥2,207 ¥264 ¥264
$23,466 $23,466 $2,807 $2,807
Floating rate receipt, fixed rate payment
29,138 29,138 (238) (238)
309,814 309,814 (2,531) (2,531)
Millions of yen
Contract or
Notional Amounts
Contract or Notional
Amounts Due after One Year
Fair Value
Net Unrealized
Gain (Loss)
2012
Interest rate swaps: Floating rate receipt,
fixed rate payment ¥20,604 ¥14,291 ¥(129) ¥(129)
Note: The fair values of foreign currencies are translated at the spot rate at the balance sheet date.
(B) Derivative Transactions to which Hedge Accounting is Applied at March 31, 2013 and 2012 (1) Foreign Currency Related Derivatives
Millions of yen Thousands of U.S. dollars
Hedged item
Contract or Notional Amounts
Contract or Notional
Amounts Due after One Year Fair Value
Contract or Notional
Amounts
Contract or Notional
Amounts Due after One Year Fair Value
2013 2013
Forward exchange contracts: Selling contracts–
U.S. Dollar Operating receivables ¥22,074 – ¥(96) $234,705 – $(1,021)
Euro Operating receivables 6,373 – 98 67,762 – 1,042
Millions of yen
Hedged item
Contract or Notional Amounts
Contract or Notional Amounts
Due after One Year Fair Value
2012
Forward exchange contracts: Selling contracts–
U.S. Dollar Operating receivables ¥14,479 – ¥(434)
Euro Operating receivables 5,641 – (280)
Note: The fair values of foreign currencies are calculated at the forward exchange rate.
DENSO CORPORATION Annual Report 2013 52

(2) Interest Related Derivatives Millions of yen Thousands of U.S. dollars
Hedged item
Contract or Notional Amounts
Contract or Notional Amounts
Due after One Year Fair Value
Contract or Notional
Amounts
Contract or Notional
Amounts Due after One Year Fair Value
2013 2013Interest rate swaps:
Floating rate receipt, floating rate payment Long-term debt ¥51,000 ¥40,000 – $542,265 $425,306 –
Fixed rate receipt, floating rate payment
Long-term debt and Large time deposits 19,000 – ¥25 202,020 – $266
Interest rate and Currency swaps: Floating rate receipt, fixed rate payment Long-term debt ¥72,108 ¥72,108 – $766,699 $766,699 –
Fixed rate receipt, fixed rate payment Long-term loan 5,079 5,079 – 54,003 54,003 –
Millions of yen
Hedged item
Contract or Notional Amounts
Contract or Notional
Amounts Due after One Year Fair Value
2012
Interest rate swaps: Floating rate receipt, floating rate payment Long-term debt ¥51,000 ¥51,000 –
Fixed rate receipt, floating rate payment
Long-term debt, Large time deposits and bonds
77,000 19,000 ¥218
Interest rate and Currency swaps: Long-term debt ¥72,108 ¥72,108 –
Note: The above interest rate swaps which qualify for hedge accounting and meet specific matching criteria are not remeasured at fair value but the differential paid or received under the swap agreements is recognized and included in interest expense or income. In addition, the fair value of such interest rate swaps in Note 16 is included in that of hedged items (i.e. Long-term debt).
The fair value of derivative transactions is measured at the quoted price obtained from the financial institutions. The contract or notional amounts of derivatives which are shown in the above table do not represent the amounts exchanged by
the parties and do not measure the Group’s exposure to credit or market risk.
DENSO CORPORATION Annual Report 2013 53
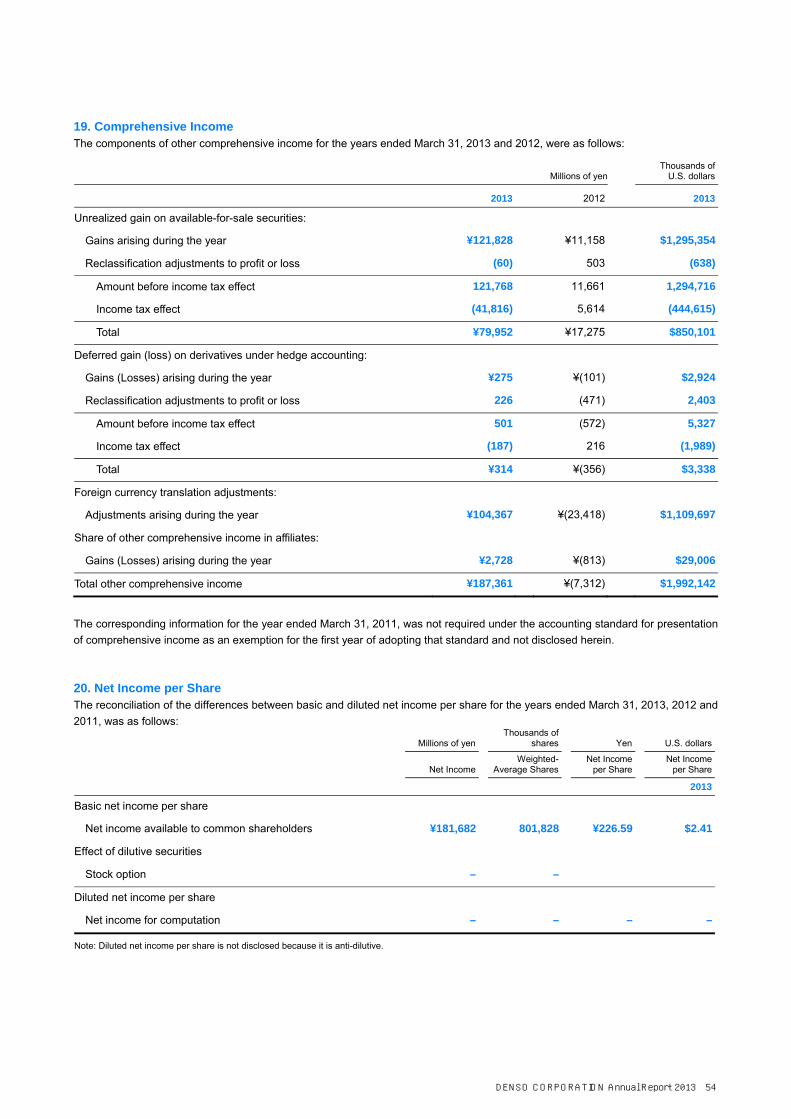
19. Comprehensive Income The components of other comprehensive income for the years ended March 31, 2013 and 2012, were as follows:
Millions of yen Thousands of
U.S. dollars
2013 2012 2013
Unrealized gain on available-for-sale securities: Gains arising during the year ¥121,828 ¥11,158 $1,295,354
Reclassification adjustments to profit or loss (60) 503 (638)
Amount before income tax effect 121,768 11,661 1,294,716
Income tax effect (41,816) 5,614 (444,615)
Total ¥79,952 ¥17,275 $850,101
Deferred gain (loss) on derivatives under hedge accounting: Gains (Losses) arising during the year ¥275 ¥(101) $2,924
Reclassification adjustments to profit or loss 226 (471) 2,403
Amount before income tax effect 501 (572) 5,327
Income tax effect (187) 216 (1,989)
Total ¥314 ¥(356) $3,338
Foreign currency translation adjustments: Adjustments arising during the year ¥104,367 ¥(23,418) $1,109,697
Share of other comprehensive income in affiliates: Gains (Losses) arising during the year ¥2,728 ¥(813) $29,006
Total other comprehensive income ¥187,361 ¥(7,312) $1,992,142
The corresponding information for the year ended March 31, 2011, was not required under the accounting standard for presentation of comprehensive income as an exemption for the first year of adopting that standard and not disclosed herein.
20. Net Income per Share The reconciliation of the differences between basic and diluted net income per share for the years ended March 31, 2013, 2012 and 2011, was as follows:
Millions of yenThousands of
shares Yen U.S. dollars
Net IncomeWeighted-
Average Shares Net Income per Share
Net Income per Share
2013
Basic net income per share Net income available to common shareholders ¥181,682 801,828 ¥226.59 $2.41
Effect of dilutive securities Stock option – –
Diluted net income per share Net income for computation – – – –
Note: Diluted net income per share is not disclosed because it is anti-dilutive.
DENSO CORPORATION Annual Report 2013 54

. Millions of yenThousands of
shares Yen
Net IncomeWeighted-
Average Shares Net Income per Share
2012
Basic net income per share Net income available to common shareholders ¥89,298 805,895 ¥110.81
Effect of dilutive securities Stock option – –
Diluted net income per share Net income for computation – – –
Note: Diluted net income per share is not disclosed because it is anti-dilutive. Millions of yen
Thousands of shares Yen
Net IncomeWeighted-
Average Shares Net Income per Share
2011
Basic net income per share Net income available to common shareholders ¥143,033 805,871 ¥177.49
Effect of dilutive securities Stock option – –
Diluted net income per share Net income for computation – – –
Note: Diluted net income per share is not disclosed because it is anti-dilutive.
21. Subsequent Events On June 19, 2013, at the Company’s shareholders’ meeting, the following item was approved:
Appropriation of Retained Earnings
Millions of yen Thousands of
U.S. dollars
Year-end cash dividends, ¥37 ($0.39) per share ¥29,434 $312,961
DENSO CORPORATION Annual Report 2013 55

INDEPENDEN To the Board oDENSO CORP We have auditMarch 31, 201the year then eyen. Management’Management accounting prithe preparatio Auditor’s ResOur responsibin accordanceobtain reasona An audit involvstatements. Thment of the coers internal cosign audit procness of the ensonableness onancial statem We believe tha Opinion In our opinion,cial position otheir operation Convenience TOur audit alsotion has beenamounts are p
June 19, 2013
NT AUDITOR’S
of Directors of PORATION:
ted the accomp13, and the relaended, and a s
’s Responsibiis responsible inciples generan of consolidat
sponsibility bility is to expree with auditing sable assurance
ves performinghe procedures onsolidated finaontrol relevant tcedures that antity’s internal cof accounting e
ments.
at the audit evid
, the consolidatof DENSO CORns and their cas
Translation o comprehenden made in accpresented solel
3
S REPORT
panying consolated consolidatsummary of sig
lity for the Cofor the prepara
ally accepted ined financial sta
ess an opinion standards genee about whethe
g procedures toselected depe
ancial statemento the entity’s pre appropriate control. An audestimates made
dence we have
ted financial staRPORATION ash flows for the
ed the translatiocordance with ty for the conve
lidated balanceted statementsnificant accoun
nsolidated Fination and fair pn Japan, and foatements that a
on these conserally accepted
er the consolida
o obtain audit eend on the audints, whether dupreparation andin the circums
dit also includese by managem
e obtained is su
atements referand its consolide year then end
on of Japanesethe basis state
enience of read
e sheet of DEN of income, co
nting policies an
nancial Statempresentation of or such internalare free from m
olidated financd in Japan. Thoated financial st
evidence abouitor’s judgmentue to fraud or ed fair presenta
stances, but nos evaluating th
ment, as well as
ufficient and ap
rred to above pdated subsidiaed in accordan
e yen amountsed in Note 1 ters outside Jap
SO CORPORAmprehensive innd other explan
ments these consolid control as maaterial misstate
cial statements ose standards tatements are f
t the amounts , including the error. In makingtion of the cont for the purpoe appropriatens evaluating th
ppropriate to pro
resent fairly, inries as of Marc
nce with accoun
s into U.S. dollato the consolidpan.
ATION and its cncome, changenatory informat
dated financial snagement deteements, whethe
based on our require that wefree from mater
and disclosureassessment of
g those risk asssolidated finanse of expressin
ness of accounthe overall prese
ovide a basis fo
n all material rech 31, 2013, anting principles
ar amounts anddated financial
consolidated sues in equity, antion, all express
statements in aermines is neceer due to fraud
audit. We conde plan and perfrial misstateme
es in the consof the risks of msessments, the
ncial statementsng an opinion oting policies usentation of the
or our audit opi
spects, the conand the consoli generally acce
d, in our opiniostatements. S
ubsidiaries as ond cash flows fosed in Japanes
accordance witessary to enabor error.
ducted our audform the audit tent.
olidated financiaaterial misstate
e auditor consids in order to deon the effectivesed and the rea
consolidated f
nion.
nsolidated finanidated results oepted in Japan.
on, such translaSuch U.S. dolla
of or se
th le
dit to
al e-d-e-e-a-fi-
n-of .
a-ar
DENSO CORPORATION Annual Report 2013 56