financial services demand side survey vanuatu · the production of the vanuatu demand-side survey...
TRANSCRIPT

Financial Services Demand Side Survey
Vanuatu

B | F i n a n c i a l S e r v i c e S D e m a n D S i D e S u r v e y • v a n u a T u

Financial Services Demand Side Survey
Vanuatu

ii | F i n a n c i a l S e r v i c e S D e m a n D S i D e S u r v e y • v a n u a T u
USP Library Cataloguing-in-Publication Data
Financial services demand side survey, Vanuatu / Pacific Financial
Inclusion Programme. -- Suva, Fiji : Pacific Financial Inclusion
Programme, 2016.
39 p. ; 30 cm.
ISBN 978-982-98129-3-3
1. Financial services industry--Vanuatu. 2. Banks and banking--Vanuatu.
3. Finance--Social aspects--Vanuatu. I. Pacific Financial Inclusion
Programme.
HG190.V3F56 2016
332.1099595--dc23
Pacific Financial Inclusion Programme
Title : Financial services demand side survey, vanuatu

F i n a n c i a l S e r v i c e S D e m a n D S i D e S u r v e y • v a n u a T u | iii
Preface
in 2013 members of the Pacific islands regional initiative (Piri), formerly known as the Pacific islands Working Group (PiWG), a grouping under the alliance for Financial inclusion (aFi), jointly undertook a review of available data and measurement exercises with which they could design and evaluate their national financial inclusion strategies and their maya Declaration commitments. as part of this exercise, Piri members agreed to adopt not only the core set of aFi financial inclusion indicators, but to expand that set too. The members committed to carrying out demand side surveys to capture those indicators. in early 2015, demand side surveys were held in Fiji, Samoa and Solomon islands. in the first half of 2016, corresponding surveys were conducted in Tonga and vanuatu. These surveys were jointly supported by aFi and the Pacific Financial inclusion Programme (PFiP).
Alliance for Financial InclusionThe alliance for Financial inclusion (aFi) is the world’s leading organization on financial inclusion policy and regulation. a member-owned network, aFi promotes and develops evidence-based policy solutions that help to improve the lives of the poor. Together, aFi members from more than 120 financial inclusion policymaking institutions are working to unlock the potential of the world’s nearly 2 billion unbanked through the power of financial inclusion.
Pacific Financial Inclusion ProgrammePFiP is a Pacific-wide programme helping low-income households gain access to financial services and financial education. it is jointly administered by the un capital Development Fund (uncDF) and the united nations Development Programme (unDP) and receives funding from the australian Government (DFaT), the european union and the new Zealand Government (mFaT). PFiP funding for the vanuatu Demand Side Survey was from the mFaT regional programme.
PFiP aims to add one million Pacific islanders to the formal financial sector by 2019 by supporting policy and regulatory initiatives, funding innovation with financial services and delivery channels, disseminating market information, and empowering consumers.
PFiP operates from the unDP Pacific Office in Suva, Fiji and has offices in Papua new Guinea, Samoa and Solomon islands.
AcknowledgementsThis survey would not have been possible without the commitment of the reserve Bank of vanuatu (rBv), particularly Governor Simeon malachi athy, Deputy Governor Peter Tari merakali, Dr. michael Hililan, alison Baniuri, Pita Toa, mark mera, cynthia moli, and Tabe isaiah. Thanks are also extended to Benuel lenge, vania m. Kalomor, and rara Soro from the vanuatu national Statistics Office (vnSO) as well as David megill. Heartfelt thanks go to the Data Subgroup of Piri, in particular lanna lome-ieremia and Tua Toomata of cBS, Denson Deni and caroline Kanoko of cBSi, for their dedication and initiative.
Sincere thanks also go to the staff at PFiP for coordination and guidance throughout the project, including Jeff liew, Krishnan narasimhan, esther Bates, erica lee and elizabeth larson. Warm thanks are also extended to Bankable Frontier associates (BFa) Justin Grider, Sushmita meka, Brian loeb, and michelle Hassan for their tireless efforts in designing the surveys, working with the enumerators and drafting the final report.

iv | F i n a n c i a l S e r v i c e S D e m a n D S i D e S u r v e y • v a n u a T u
Foreword
it is an honour to present this report on the first national Demand-Side Survey (DSS) on financial inclusion in vanuatu which, for the first time, presents detailed information on access and usage of financial services and products in vanuatu.
The survey has been long due and the findings will provide an important input in decision-making to our key stakeholders at the reserve Bank of vanuatu (rBv), the Government, the vanuatu national Financial inclusion Task Force (nFiT), the donor community, the private sector and other important stakeholders. until the completion of the survey, we have been constrained by lack of data and understanding of the scope of access and usage of financial services and products, notably where it concerns the most vulnerable low-income and disadvantaged ni-vanuatu, and the nature of that access and usage by provinces and as well as other dimensions such as gender, age and different income levels. in turn, this handicapped our past policy approaches and policy strategies in financial inclusion in vanuatu. The findings will no doubt supplement supply-side data that we collect in our monetary data so the authorities have a view of financial inclusion in vanuatu that is more comprehensive than in the past. more importantly, it will enhance evidence-based policy solutions to address gaps in the financial inclusion agenda, and forms the baseline from which to monitor progress to addressing those gaps in vanuatu.
The objective of the survey were to produce the required data for the authorities in vanuatu to calculate Pacific islands regional initiative (Piri) core Plus indicators, including access and usage indicators to complement the current indicators which utilize supply-side data; determine the needs of the adult population in respect to access and usage of financial services in the urban and rural areas at different income levels; provide information on the formal usage of certain basic financial services such as savings, credit, investment, pension funds and the financial channels; understand the main profiles of users and non-users of formal financial services; and, identify the main barriers preventing adults from accessing and using financial products and services.
The survey shows that although the majority of adults in vanuatu earn income from agriculture, most are likely to be unbanked. This factor could contribute to the low levels of formal account ownership and policy makers seeking to increase account ownership among agricultural workers should address barriers such as lack of identification, distance to access points, preference for cash, and the perceived cost of setting up formal account. The results showed that women are less likely to have a formal bank account, but are more financially active than men. it shows that savings, credit and remittances are deployed for different purposes in vanuatu, a finding that can be put to useful purpose in the design and marketing of products. Furthermore, a large proportion of adults, or 80 percent, use informal savings and credit instruments throughout vanuatu such as informal credit or savings instrument in the past 12 months. This in itself shows a potential gap that are being met by informal instruments due to issues to do with convenience and flexibility of savings. Finally, a large percentage of the banked adults are not transacting which underpins the problem of equating access and usage.
i would like to thank the alliance for Financial inclusion (aFi), and the Pacific Financial inclusion Programme (PFiP) for their support in co-funding this study. i also thank Bankable Frontier associates (BFa) for the survey oversight, training, piloting and the production of the vanuatu Demand-Side Survey report. i very much acknowledge and appreciate the assistance of the vanuatu national Statistics office (vnSO) for assisting in the training, piloting and data-cleaning and staff of the reserve Bank of vanuatu, especially the Technical committee that provided oversight of the DSS project in vanuatu. Finally, i offer a special thank you to all who welcomed the Demand-Side Survey team whole-heartedly and participated to make the survey a success.
Governor Simeon aTHy
reserve Bank of vanuatu

F i n a n c i a l S e r v i c e S D e m a n D S i D e S u r v e y • v a n u a T u | v
Table of contents
Preface.........................................................................................................................................................................................iii
Foreword.....................................................................................................................................................................................iv
acronyms and abbreviations.......................................................................................................................................................vi
executive Summary......................................................................................................................................................................1
Financial access and usage in vanuatu.........................................................................................................................................2
Bank locations, accounts and transaction patterns vary by gender............................................................................................14
Gender differences are evident in savings behavior, as well......................................................................................................16
informal financial instruments are part of most adults’ lives.....................................................................................................18
Bank account access does not equal usage.................................................................................................................................23
remittances are concentrated within vanuatu and used for personal expenses.......................................................................24
insurance is scarce in vanuatu...................................................................................................................................................27
mobile phone penetration is wide but mobile banking is limited..............................................................................................28
recommendations for further understanding of financial inclusion in vanuatu........................................................................30
annex a: Financial inclusion indicators......................................................................................................................................31
annex B: methodology and Sample Description........................................................................................................................40

vi | F i n a n c i a l S e r v i c e S D e m a n D S i D e S u r v e y • v a n u a T u
ATM automated Teller machine
AFI alliance for Financial inclusion
DSS Financial inclusion demand side survey
FAS imF Financial access Survey
Global Findex World Bank Global Financial inclusion indicators
GPFI Global Partnership for Financial inclusion
IMF international monetary Fund
MFI microfinance institution
PFIP Pacific Financial inclusion Programme
PIRI Pacific islands regional initiative
RBV reserve Bank of vanuatu
UNCDF united nations capital Development Fund
VNSO vanuatu national Statistics Office
Acronyms and abbreviations

F i n a n c i a l S e r v i c e S D e m a n D S i D e S u r v e y • v a n u a T u | 1
Executive Summary
according to responses to a nationally representative survey in vanuatu conducted in June 2016, the country has a level of financial inclusion comparable to its peers in the Pacific islands. The survey, led by the reserve Bank of vanuatu and the vanuatu national Statistics Office, is the first of its kind in the country, giving policymakers valuable baseline evidence of consumers’ access to and usage of formal financial services, and laying the groundwork for future research into how these services fit into and transform the lives of everyday ni-vanuatu.
Agricultural income earners are most likely to be unbankedalthough the majority of adults in vanuatu earn income from agriculture, agricultural income earners are most likely to be unbanked. There are a significant portion of adults in all income brackets that earn income from agriculture, but even 24% of the wealthiest adults in vanuatu who earn income through agriculture are unbanked, compared to only 13% of the wealthiest adults not earning income through agriculture. agriculture is a cash-driven sector that takes place in mostly rural settings. These factors could contribute to the low levels of formal account ownership, even for wealthier adults. Policy makers seeking to increase account ownership among agricultural workers should address barriers such as lack of identification, distance to access points, preference for cash, and the perceived cost of setting up formal accounts.
Men are more likely than women to be banked, but women are more financially active than men There is a significant gender gap in bank account ownership. 32% of female adults report owning a bank account, compared to 41% of men. even though women are less likely to report owning a bank account, women are more likely to report saving in the past 12 months, and they say they deposit and withdraw from their bank accounts more frequently. The DSS survey does not reveal the reasons for these differences, nor does it explain why men seem more likely to own current accounts and women are more likely to own savings accounts.
Savings, credit and remittances meet distinct, different needs for adultsSavings, credit and remittances serve unique uses for adults in vanuatu. Savings is primarily used for education, credit for housing and remittances for short term expenses (utility bills, food). Formal financial providers can use these findings to design and market products.
Informal savings instruments play a large role in the financial lives of adultsinformal savings and credit instruments are widely used throughout vanuatu: 80% of adults have used either an informal credit or savings instrument in the past 12 months. This compares to only 37% of adults overall having used a formal credit or savings instrument in the past 12 months. even banked respondents save almost 50% of their total savings in informal instruments.1 informal instruments potentially meet needs that are not being met by formal instruments, such as convenience and flexibility of savings.
A large percentage of banked adults are not transactingOver 20% of banked adults in vanuatu have not made a bank transaction in the past 12 months. an additional 17% of banked adults transact into and out of their accounts, but they have not used these to save or borrow in the past year. This high level of inactivity underpins the problem of equating access and usage. Formal account ownership is only one angle of financial inclusion within a country.
1 informal saving includes savings held at home

2 | F i n a n c i a l S e r v i c e S D e m a n D S i D e S u r v e y • v a n u a T u
Financial access and usage in Vanuatu
The vanuatu DSS data were collected in June 2016, by the reserve Bank of vanuatu (rBv), in close collaboration with the vanuatu national Statistics Office (vnSO). The sample is nationally representative, using three-stage, systematic random sampling. enumerators used a Kish grid to randomly select one adult respondent (age 15 and above) from each sampled household. Thus, all findings apply to adults in vanuatu unless otherwise stated. Further details can be found in annex B: methodology and Sample Description, which includes maps indicating the sampled areas in each province.
Vanuatu financial inclusion strandFinancial inclusion is a journey that begins with enrollment with a formal financial service provider and develops as the customer uses savings, credit, insurance and payment services to manage his or her daily financial needs. This report provides basic baseline indicators of where adults in vanuatu are on this journey.
Throughout the report, the financial inclusion strand is the primary means of illustrating vanuatu adults’ current standing in the first crucial phase of financial inclusion: formal financial enrollment. The financial inclusion strand captures respondents’ usage of various financial services over the 12 months prior to their being interviewed.2 note that adults who are considered “banked” have a formal bank account, but this categorization says nothing about if and how they use that account. usage is explored further in the sections related to bank accounts and specific products.
Financial inclusion strandBanked The respondent currently has a formal bank account.
Other formal Over the past 12 months, the respondent used the services of a credit union, microfinance institution (mFi)3, pension, investments (stocks, bonds and others), insurance or owns a mobile money account.
Informal only Over the past 12 months, the respondent has used a savings club or other non-regulated financial instrument, such as taking credit from a shop, moneylender, or hire purchase.
Excluded Over the past 12 months, the respondent has not used any of the services mentioned for the other three categories, but may have borrowed from or lent to friends and family, saved money in the house, pawned goods, borrowed from an employer, saved with a moneyguard, or trusted person, etc. This category would include respondents who only use money transfer services, as well.
according to the DSS, 37% of adults in vanuatu have a commercial bank account, as Figure 1 below shows, while another 10% access financial services from other formal providers such as credit unions, mFis, insurance, mobile money, or finance companies. However, 32% of adults appear to be excluded from both formal and informal financial services. The remainder of this report presents in-depth findings on the factors associated with inclusion in vanuatu.
Figure 1: 2016 vanuatu Financial inclusion Strand
2 The access strand methodology is borrowed from the FinScope surveys, developed by Finmark Trust, which are implemented on a regular basis in a number of countries throughout africa. The access strand, which segments adults by the types of financial services used, allows policymakers and providers to visualize changes in access to financial services over time
3 vanWODS microfinance, inc. is the only mFi operating in vanuatu. it is a registered nGO
1.
37% 10% 21% 32%
0% 10% 20% 30% 40% 50% 60% 70% 80% 90% 100%
Banked
Otherformal
Informalonly
Excluded
1.
37% 10% 21% 32%
0% 10% 20% 30% 40% 50% 60% 70% 80% 90% 100%
Banked
Otherformal
Informalonly
Excluded

F i n a n c i a l S e r v i c e S D e m a n D S i D e S u r v e y • v a n u a T u | 3
Benchmarking financial access in Vanuatuas Figure 2 shows, in vanuatu the percentage of banked adults (37%) appears to be higher than in the Solomon islands (26%) and comparable to Samoa (39%) and Tonga (41%).
Figure 2: inclusion Strand across Piri-member countries
The data collected by the international monetary Fund’s Financial access Survey (FaS) helps to explain the variation between countries. vanuatu has financial inclusion levels in the middle of other Piri-member countries, and it is similarly situated according to supply-side measures like the penetration of commercial bank branches and aTms. as Figure 3 and Figure 4 show, in 2014 vanuatu had the second highest levels of commercial bank branches per 100,000 adults, behind Samoa, and the third highest number of aTms per 100,000 adults, behind Fiji and Samoa.
Figure 3: number of commercial bank branches per 100,000 adults
Source: IMF Financial Access Survey, available at http://fas.imf.org/
2.
26%
37%
39%
41%
60%
8%
10%
12%
11%
4%
35%
21%
15%
14%
9%
31%
32%
34%
34%
27%
0% 10% 20% 30% 40% 50% 60% 70% 80% 90% 100%
SolomonIslands(2015)
Vanuatu(2016)
Samoa(2015)
Tonga(2016)
Fiji(2015)
Banked
Otherformal
Informalonly
Excluded
3 .
2122 22
23
0
5
10
15
20
25
30
2011 2012 2013 2014
Vanuatu Tonga Samoa Fiji SolomonIslands

4 | F i n a n c i a l S e r v i c e S D e m a n D S i D e S u r v e y • v a n u a T u
Figure 4: number of aTms per 100,000 adults
Source: IMF Financial Access Survey, available at http://fas.imf.org/
vanuatu is classified as a lower-middle income country,4 and its level of formal account ownership (39%) is closely aligned with that of other lower-middle income countries (42%). The percentage of adults in vanuatu who have taken a loan in the past year is consistent with other lower-middle income countries (46%) as well. vanuatu is above average for lower-middle income countries and slightly below average for upper-middle income countries on metrics such as the percentage of adults who have taken a loan from a financial institution in the past year, saved money in the past year and saved money at a financial institution in the past year.
Table 1: Benchmarking vanuatu’s savings and loan behavior
lower-middle income countries
(2014)
vanuatu (2016)
upper-middle income
countries (2014)
account with a formal financial institution 41.8% 39.3% 70.4%
loan in the past year (from any source) 47.4% 46.4% 37.7%
loan from a financial institution in the past year 7.5% 9.2% 10.4%Saved any money in the past year (self-reported) 45.6% 58.7% 62.7%Saved any money at a financial institution in the
past year (bank, credit union, or mFi) 14.8% 26.8% 32.2%
Source: World Bank Global Findex (Global Financial Inclusion Database), accessed: 04/2016
4 http://data.worldbank.org/country/vanuatu
4.
34 36 35 35
0
5
10
15
20
25
30
35
40
45
50
2011 2012 2013 2014
Vanuatu Tonga Samoa Fiji SolomonIslands
F i n a n c i a l S e r v i c e S D e m a n D S i D e S u r v e y • v a n u a T u | 5
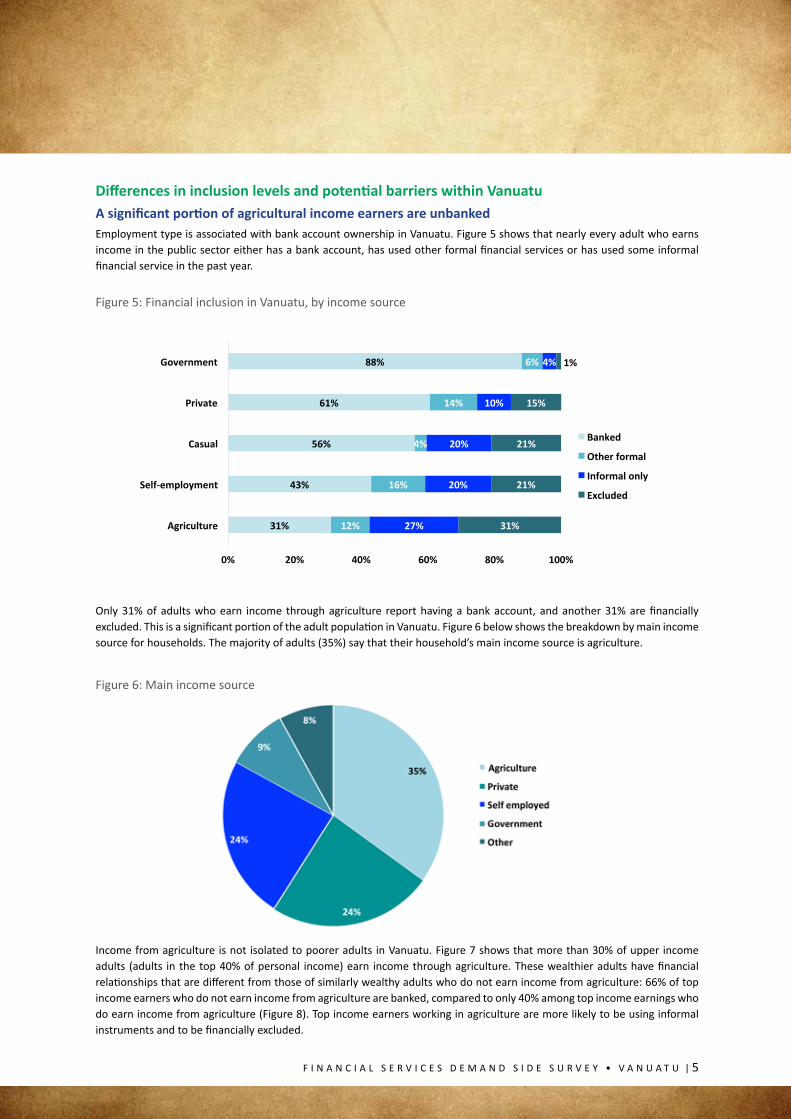
Differences in inclusion levels and potential barriers within Vanuatu A significant portion of agricultural income earners are unbankedemployment type is associated with bank account ownership in vanuatu. Figure 5 shows that nearly every adult who earns income in the public sector either has a bank account, has used other formal financial services or has used some informal financial service in the past year.
Figure 5: Financial inclusion in vanuatu, by income source
Only 31% of adults who earn income through agriculture report having a bank account, and another 31% are financially excluded. This is a significant portion of the adult population in vanuatu. Figure 6 below shows the breakdown by main income source for households. The majority of adults (35%) say that their household’s main income source is agriculture.
Figure 6: main income source
income from agriculture is not isolated to poorer adults in vanuatu. Figure 7 shows that more than 30% of upper income adults (adults in the top 40% of personal income) earn income through agriculture. These wealthier adults have financial relationships that are different from those of similarly wealthy adults who do not earn income from agriculture: 66% of top income earners who do not earn income from agriculture are banked, compared to only 40% among top income earnings who do earn income from agriculture (Figure 8). Top income earners working in agriculture are more likely to be using informal instruments and to be financially excluded.
5.
31%
43%
56%
61%
88%
12%
16%
4%
14%
6%
27%
20%
20%
10%
4%
31%
21%
21%
15%
1%
0% 20% 40% 60% 80% 100%
Agriculture
Self-employment
Casual
Private
Government
Banked
Otherformal
Informalonly
Excluded

6 | F i n a n c i a l S e r v i c e S D e m a n D S i D e S u r v e y • v a n u a T u
Figure 7: Percent of adults earning income source, by income quintile
Figure 8: Financial inclusion in vanuatu for top income earners, with and without agriculture income
7.
30%
9% 10%
4%0%
54%
15%19%
5%0%
40%
11%
21% 23%
3%
35%
8%
22%
40%
8%
33%
7%
28% 27% 26%
0%
10%
20%
30%
40%
50%
60%
Agriculture Casual Self-employment Private Government
BoRom20%
21-40%
41-60%
61-80%
Top20%
8.
40%
66%
12%
13%
23%
9%
24%
13%
0% 20% 40% 60% 80% 100%
Top40%withagricultureincome(n=82)
Top40%withoutagricultureincome(n=284)
Banked
Otherformal
Informalonly
Excluded
The unbanked adults in these two wealthier groups give different reasons for not having an account (Table 2). Those who earn income through agriculture cite distance as a top reason for not having a bank account; those without agricultural income cite not having enough money as the top reason. Other reported reasons include not having necessary documentation to do so and the cost of operating an account.

F i n a n c i a l S e r v i c e S D e m a n D S i D e S u r v e y • v a n u a T u | 7
Table 2: reasons for not having a bank account for the top income earners with and without agricultural income (multiple responses allowed)
reasonTop 40% with
agriculture income (n=55)
Top 40% without agriculture income
(n=91)
not enough money 28% 42%Distance 57% 13%Don’t have necessary documentation 36% 13%Too expensive 36% 20%Someone else in the family has an account 16% 9%Don’t trust them 1% 9%
agriculture in vanuatu is a cash-driven business. Figure 9 shows just how ubiquitous cash income is across sectors: 100% of adults that work in agriculture receive their income in cash, compared with just 19% of adults working in the public sector.
Figure 9: Percent of income received through cash by income source
not only are the economic lives of those in agriculture dominated by cash, but those adults often lack the formal identification needed to open a formal account. almost 40% of adults working in agriculture do not have either formal identification or a birth certificate (Figure 10).
Figure 10: Percent of adults without formal identification or a birth certificate10.
37%
28%
19%
7%
2%
27%
0%
10%
20%
30%
40%
9.
100%
69%
19%
0%
20%
40%
60%
80%
100%
Agriculture(n=311) Private(n=217) Government(n=82)

8 | F i n a n c i a l S e r v i c e S D e m a n D S i D e S u r v e y • v a n u a T u
Income level is associated with bank account ownershipalthough income alone does not entirely explain the differences among adults engaged in agriculture, it is, unsurprisingly, correlated with bank account ownership (Figure 11). While 73% of adults in the top income quintile are formally banked, this is true for only 19% of adults in the bottom quintile. adults with income in the bottom 40% are most likely to have only informal instruments and/or be financially excluded.
Figure 11: Financial inclusion in vanuatu, by personal income quintile
Figure 12 provides this breakdown by gender. Women are less likely to have a bank account at each income quintile, compared with men.
Figure 12: inclusion strand in vanuatu, by personal income quintile and gender
among wealthier adults, those without a bank account were less likely to mention “not having enough money” and more likely to cite other reasons like, “accounts are too expensive,” “distance” and “not having the necessary documentation” (Table 3). These differences highlight the nuanced views adults across income groups have of the perceived costs of bank account ownership.
11.
19%
28%
35%
49%
73%
6%
8%
14%
12%
13%
29%
27%
20%
18%
7%
47%
37%
31%
21%
7%
0% 20% 40% 60% 80% 100%
BoTom20%
21-40%
41-60%
61-80%
Top20%
Banked
Otherformal
Informalonly
Excluded
12.
21%
33%
38%
49%
78%
18%
23%
31%
48%
67%
3%
5%
17%
8%
10%
6%
11%
10%
16%
16%
29%
28%
14%
20%
8%
30%
26%
28%
15%
7%
48%
34%
31%
22%
4%
47%
40%
31%
21%
10%
0% 20% 40% 60% 80% 100%
BoTom20%
21-40%
41-60%
61-80%
Top20%
BoTom20%
21-40%
41-60%
61-80%
Top20%
Male
Female
Banked
Otherformal
Informalonly
Excluded
F i n a n c i a l S e r v i c e S D e m a n D S i D e S u r v e y • v a n u a T u | 9
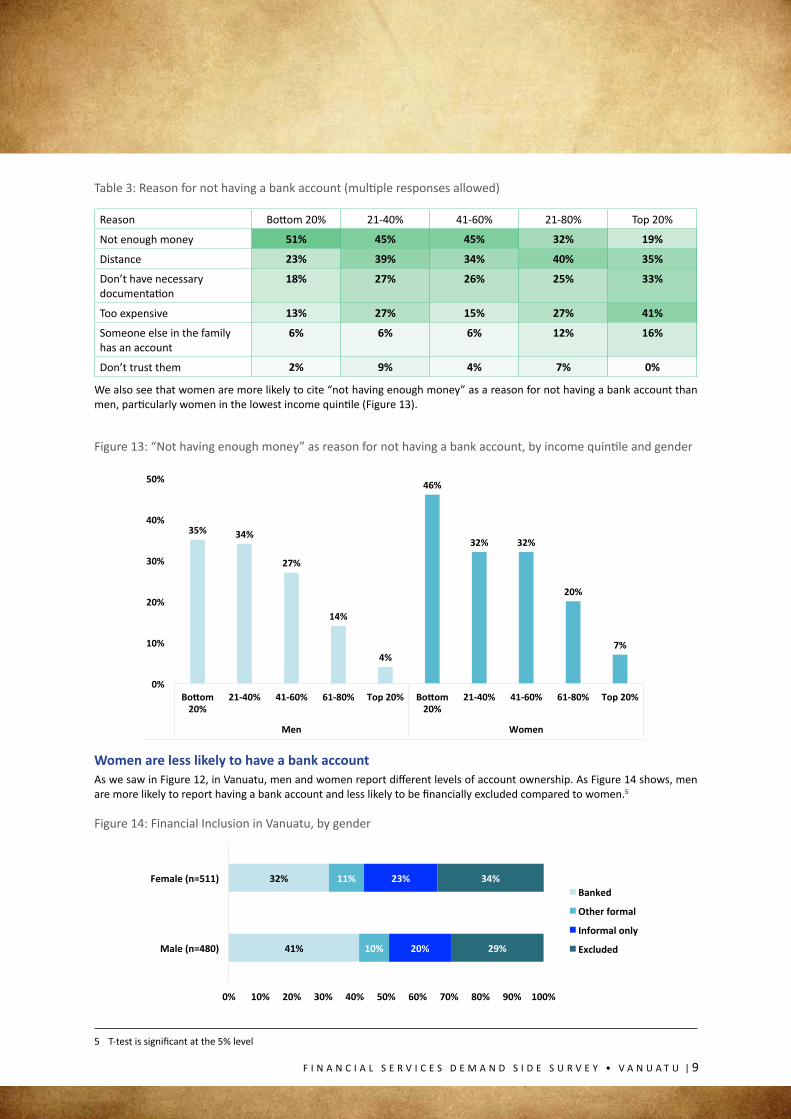
Table 3: reason for not having a bank account (multiple responses allowed)
reason Bottom 20% 21-40% 41-60% 21-80% Top 20%
not enough money 51% 45% 45% 32% 19%
Distance 23% 39% 34% 40% 35%
Don’t have necessary documentation
18% 27% 26% 25% 33%
Too expensive 13% 27% 15% 27% 41%
Someone else in the family has an account
6% 6% 6% 12% 16%
Don’t trust them 2% 9% 4% 7% 0%
We also see that women are more likely to cite “not having enough money” as a reason for not having a bank account than men, particularly women in the lowest income quintile (Figure 13).
Figure 13: “not having enough money” as reason for not having a bank account, by income quintile and gender
Women are less likely to have a bank account as we saw in Figure 12, in vanuatu, men and women report different levels of account ownership. as Figure 14 shows, men are more likely to report having a bank account and less likely to be financially excluded compared to women.5
Figure 14: Financial inclusion in vanuatu, by gender
5 T-test is significant at the 5% level
14.
41%
32%
10%
11%
20%
23%
29%
34%
0% 10% 20% 30% 40% 50% 60% 70% 80% 90% 100%
Male(n=480)
Female(n=511)Banked
Otherformal
Informalonly
Excluded
13.
35% 34%
27%
14%
4%
46%
32% 32%
20%
7%
0%
10%
20%
30%
40%
50%
Bo/om20%
21-40% 41-60% 61-80% Top20% Bo/om20%
21-40% 41-60% 61-80% Top20%
Men Women

10 | F i n a n c i a l S e r v i c e S D e m a n D S i D e S u r v e y • v a n u a T u
The differences in account ownership between men and women can potentially be attributed to employment sources and income levels. men are more likely to report earning private income, while women are more likely to earn income through self-employment (Figure 15).
Figure 15: income source, by gender
men also report higher personal income across age groups (Figure 16).
Figure 16: median personal monthly income (vatu), by gender and age bracket
Bank account ownership is highest in Port Vila and lowest in Malampa adults in the study were selected from 6 different provinces including the two towns of Port vila and luganville. The percentage of banked adults is highest in vanuatu’s harbor side capital of Port vila and lowest in malampa province (Figure 17). as of 2009, Port vila alone contained almost 20% of the country’s population.6 But there is a range of account ownership and use of informal instruments across vanuatu. Only 17% of adults in malampa have a formal bank account, with 32% of these adults using only informal instruments and the remaining 44% excluded.
6 http://www.vnso.gov.vu/images/stories/2009_census_Summary_release_final.pdf
15.
39%
6%
44%
7%10%
24%
12%
38%
2%
41%
4%9%
11%
27%
0%
10%
20%
30%
40%
50%
Male
Female
16.
2,000
20,000 20,000
16,000
20,000
5,000
2,000
6,000
20,000
14,000
11,000
3,000
0
5,000
10,000
15,000
20,000
25,000
15-20 21-30 31-40 41-50 51-60 61+
Vatu
Agebracket
Male
Female

F i n a n c i a l S e r v i c e S D e m a n D S i D e S u r v e y • v a n u a T u | 11
Figure 17: Financial inclusion strand in vanuatu, by province
Figure 18 shows one possible reason for low levels of formal account ownership: adults on Sanma and Shefa are the least likely to know of a bank branch, aTm or bank agent near their home.
Figure 18: Percent of adults that know of a financial access point close to their homes
another possible explanation for the low levels of bank account ownership is the distance adults must travel to reach a bank branch, as well as the cost of doing so. Figure 19 shows that the median adult in malampa has to travel 60 minutes to reach a branch, costing 600 vatu (uS $5.62), the highest figures across vanuatu. This may partly be explained by the fact that residents of two of its islands, ambrym and Paama, must travel by boat to access banking services due to unavailability of proper infrastructure. Figure 20 shows that the median banked adult only travels 20 minutes to reach a bank branch, but an unbanked adult reports travel times of 60 minutes. increasing awareness of financial access points and lowering transaction costs to these points through the expansion of mobile or bank agents might increase formal account ownership in remote locations.
17.
17%
29%
33%
34%
37%
38%
43%
51%
8%
4%
16%
16%
10%
18%
10%
10%
32%
19%
42%
31%
28%
14%
11%
13%
44%
48%
9%
20%
25%
30%
36%
27%
0% 20% 40% 60% 80% 100%
Malampa(n=120)
Tafea(n=75)
Torba(n=30)
Penama(n=105)
Sanma(n=105)
Luganville(n=90)
Shefa(n=120)
PortVila(n=346)
Banked
Otherformal
Informalonly
Excluded
18.
72%50%
67% 57%
97%84% 96% 93%
90%
32%
63%
30%
22%22%
69%57%
17%
20%
1%
5%
4%10%
1%2%
0%
50%
100%
150%
200%
PortVila(n=345)
Shefa(n=120)
Luganville(n=90)
Sanma(n=105)
Penama(n=105)
Torba(n=30)
Tafea(n=75)
Malampa(n=120)
Perc
ent
Bankagent
ATM
Bankbranch

12 | F i n a n c i a l S e r v i c e S D e m a n D S i D e S u r v e y • v a n u a T u
Figure 19: Time and cost to reach the nearest bank branch, by province (median)7
Figure 20: Time to reach the nearest bank branch, by banked adults (median)
We see that, similar to gender disparities in bank account ownership by income level, women are much less likely to report having a bank account when disaggregated by location (Figure 21). men located in the towns of Port vila and luganville are 14 percentage points more likely to be banked than urban women. This difference is slightly lower between men and women in the provinces, at 10 percentage points, but still large nonetheless.
7 Because of the sample size of Torba (n=30), it was excluded from this analysis as outliers drove up the time and cost to reach a bank branch.
19.
Sanma
Penama
Malampa
Shefa
Tafea
Luganville
PortVila
0
100
200
300
400
500
600
700
0 10 20 30 40 50 60 70
Costto
reachbranch(V
atu)
Minutestoreachbranch
20 20
8
60
20
10
0
10
20
30
40
50
60
70
Bankbranch(n=706) ATM(n=432) Bankagent(n=87)
Minutes
BankedUnbanked

F i n a n c i a l S e r v i c e S D e m a n D S i D e S u r v e y • v a n u a T u | 13
21.
56%
38%
42%
28%
11%
9%
12%
11%
12%
22%
14%
27%
22%
31%
31%
35%
0% 10% 20% 30% 40% 50% 60% 70% 80% 90% 100%
Urban
Rural
Urban
Rural
Male
Female
Banked
Otherformal
Informalonly
Excluded
Figure 21: Bank account ownership by gender and location

14 | F i n a n c i a l S e r v i c e S D e m a n D S i D e S u r v e y • v a n u a T u
Bank locations, accounts and transaction patterns vary by gender
Men are more likely be banked—and account type differs by gender, toomen and women in vanuatu appear to be opening accounts at different banks (Figure 22) and opening different types of bank accounts (Figure 23). men are more likely than women to report an account with nBv (69% to 54%), while women are more likely than men to report an account with anZ (27% to 18%).
This may partly be explained by anZ’s variety of product offerings, including a promotional loan product which is targeted specifically to women. and although nBv has greater access in terms of branch outreach, anZ customers can access anZ banking services at gomoney merchants equipped with eFTPOS devices in more remote locations. This expanded presence, along with products targeted specifically towards women, may help to explain the higher takeup of anZ products by women in vanuatu, compared with men.
men are also more likely than women to report a current account (47% to 29%), while women are more likely than men to report a savings account (76% to 59%). The survey data do not reveal the causes of these differences, and the differences should be validated with supply-side data.
Figure 22: account location, by gender (multiple responses allowed)
Figure 23: Bank account type, by gender (multiple responses allowed)
22.
11%
18%
69%
21%
9%
27%
54%
22%
0%
20%
40%
60%
80%
100%
Westpac ANZ NBV BRED
Perc
ent
Male(n=207)
Female(n=179)
23.
59%
47%
8%
76%
29%
4%
0%
20%
40%
60%
80%
100%
Savings Current Termdeposit
Perc
ent
Male(n=207)
Female(n=179)

F i n a n c i a l S e r v i c e S D e m a n D S i D e S u r v e y • v a n u a T u | 15
Women are more financially active with their bank accountsFigure 24 shows the frequency of deposits and withdrawals from bank accounts by gender. Women in vanuatu are less likely to be formally employed and less likely to have an account at a formal institution, yet women appear to deposit and withdraw more frequently than men do. These findings can be validated with supply-side data; if confirmed, this is a possible area for further research.
Figure 24: monthly deposits and withdrawals, by gender
Monthly deposits (Female n=179)
5%
25%
6%64%
Monthly withdrawals (Male n=207)
40%
11%
43%
6%
Monthly withdrawals (Female n=179)
34%
12%
2%
51%
Monthly deposits (Male n=207)
1-2 times per month3 or more times per monthMoney is not deposited/withdrawn usually in a monthDont know/refuse
33%
15%
44%
8%

16 | F i n a n c i a l S e r v i c e S D e m a n D S i D e S u r v e y • v a n u a T u
Gender differences are evident in savings behavior, as well
Women are more likely to report saving in the past yeareven though men report higher incomes than women across age groups, women are more likely to report saving in the past year compared to men, overall 65% of women reported saving in the past year, compared with 53% of men. This difference is statistically significant and supports the finding that women are more financially active. Figure 25 shows the percent of adults that reported saving in the past year, separated by age and gender. across age groups, women are more likely to report saving in the past year.
Figure 25: Percent of adults that saved by any means in the past year, by age and gender
Figure 26 shows that the most common reason for saving is for education.
Figure 26: Savings purposes, (multiple responses allowed)
25.
43%
63%
52% 50%53% 52%
59%
65%
71%66% 65%
58%
0%
10%
20%
30%
40%
50%
60%
70%
80%
15-20 21-30 31-40 41-50 51-60 61+
Perc
ent
Male
Female
26.
41%
17%
7% 7% 8%
0%
10%
20%
30%
40%
50%
Educa`on Start/expandbusiness
Re`rement Householditems/improvement
Emergencies

F i n a n c i a l S e r v i c e S D e m a n D S i D e S u r v e y • v a n u a T u | 17
among those who said they did not save in the past year, the top reason cited was “spending money as soon as it is received” (Figure 27). Some research8 has shown that having cash in hand influences peoples’ spending and saving behavior—when people do not have cash, they are less likely to spend it. With so many adults in vanuatu dealing mostly in cash, further research could investigate the relationship between cash and savings as well as usage of formal financial services.
Figure 27: reason for not saving (multiple responses allowed)
8 monica Popa and laura cojocaru (2015) ,”Fighting Poverty One coin at a Time, Through money-Saving Options: the cash attraction effect”, in na - advances in consumer research volume 43, eds. Kristin Diehl and carolyn yoon, Duluth, mn : association for consumer research, Pages: 660-661.
27.
1%
6%
6%
11%
81%
0%
5%
6%
5%
90%
0% 10% 20% 30% 40% 50% 60% 70% 80% 90%100%
Choosetoinvest
Don’tknow/refuse
Other
Notsafetokeepmoneyaround
Spendassoonasgetmoney
Female(n=188)
Male(n=237)

18 | F i n a n c i a l S e r v i c e S D e m a n D S i D e S u r v e y • v a n u a T u
Informal financial instruments are part of most adults’ lives
A number of non-bank savings and credit instruments are used in VanuatuFigure 28 and Figure 29 show survey respondents’ use of various non-bank savings and credit instruments. For savings, 58% of adults have saved at home in the past year, with a median savings amount of 10,000 vatu (uS $93.72). This savings amount is half of what banked respondents reported saving in the bank.
Figure 28: Percent of adults with various savings instruments and median balance 9
On the credit side, 32% of adults have taken shop credit in the past year, with a median outstanding amount of 1,000 vatu (uS $9.37). This is the smallest credit amount relative to other instruments, but adults appear to be leveraging small amounts of informal credit. Studies like the financial diaries10 have shown that informal credit provides a means for smoothing consumption for households. The largest credit amounts come from the bank, but only 6% of adults have taken credit from a bank in the past year.
Figure 29: Percent of adults with various credit instruments and median balance
9 vanWODS, the mFi operating in vanuatu, does not accept savings deposits, only loan guarantees10 http://www.portfoliosofthepoor.com/
28.
58%
21%
10% 9% 8%
10,000
20,000
10,000 10,0009,000
0
5,000
10,000
15,000
20,000
25,000
0%
10%
20%
30%
40%
50%
60%
70%
Home Savingsinthebank
Family Savingsclubs Moneyguard
Amou
ntsa
ved
(Vat
u)
Perc
entw
ithso
urce
Percentwithsource Amountsaved(Median)
29.
32%
7% 7%6%
4% 4%
1,000 2,000 3,000
60,000
3,500 1,5000
10,000
20,000
30,000
40,000
50,000
60,000
70,000
0%
10%
20%
30%
40%
50%
Shopcredit Moneylender Family Creditfromthebank
Employer Savingsclub
Amou
nto
wed
(Vat
u)
Perc
entw
ithso
urce
Percentwithsource Amountowed(Median)

F i n a n c i a l S e r v i c e S D e m a n D S i D e S u r v e y • v a n u a T u | 19
informal savings mechanisms appear to have more frequent transactions than do formal savings mechanisms. Table 4 shows that many of the adults with informal savings instruments transacted (deposited or made a withdrawal) in the past 30 days. Women are also more likely to report saving in savings clubs than men (12% to 7%); these informal savings clubs provide more than just an opportunity to save, they also provide social interaction.
Table 4: Savings frequency across non-bank savings types
Store of value Past 30 days 2-3 months 3-6 months 6-12 months
Savings club (n=95) 56% 12% 19% 10%
Family (n=92) 57% 17% 11% 13%
cooperative (n=52) 29% 19% 13% 37%
Home (n=540) 63% 19% 8% 7%
money guard (n=72) 58% 12% 12% 16%
vnPF pension (n=129) 59% 11% 5% 19%
Figure 30 shows an interesting picture of how adults balance formal and informal savings mechanisms. adults with a greater number of savings mechanisms, or those who diversify where they save their money, seem to concentrate a greater amount of that money with formal institutions. Those with fewer savings mechanisms, on average, tend to use mostly informal mechanisms.
Figure 30: relationship between the percentage of total savings with formal and informal savings instruments, including savings at home
The picture changes when savings at home is excluded (Figure 31). looking at only institutions, those who use few institutions to save tend to keep about the same percentage of their savings with informal institutions as do those who diversify their savings much more. many adults in vanuatu seem to seek out informal institutions to save money, regardless of their usage of formal institutions. adults with 4 or more savings sources still save 35% of their total savings in informal savings instruments (29% when excluding savings at home). even though adults tend to concentrate a larger share of their total savings in formal instruments as their savings sources increase, informal instruments still hold a significant portion of total savings.
30.
1savingssource(n=348)
2savingssources(n=212)
3savingssources
(n=88)4ormoresavingssources(n=48)
0%
20%
40%
60%
80%
100%
0% 10% 20% 30% 40% 50% 60% 70%
Percentageoftotalsa
vingsw
ithinform
al
instrumentsinclud
ingho
mesavings
Percentageoftotalsavingswithformalinstruments

20 | F i n a n c i a l S e r v i c e S D e m a n D S i D e S u r v e y • v a n u a T u
Figure 31: relationship between percentage of total savings with formal and informal instruments excluding savings at home
Informal instruments are ubiquitous across Vanuatuinformal instruments play an important role for meeting the financial savings and credit needs of adults in vanuatu. Figure 32 shows the most common combinations of financial instruments (formal/informal and savings/credit) used by adults. The largest percentage of adults in vanuatu use only informal savings (23%), followed by a group that uses both informal savings and informal credit (21%).
Figure 32: most common savings and credit instrument combinations
Figure 33 shows the percentage of the sample that have used various formal/informal and savings/credit combinations in the past year and the associated total savings balances. adults with formal savings instruments have higher savings balances relative to adults only using informal savings instruments, but the majority of adults only have informal savings. adults in vanuatu are saving, but in smaller amounts through informal savings instruments.
1savingssource(n=94)
2savingssources(n=201)
3savingssources(n=86)
4ormoresavingssources(n=48)
0%
20%
40%
60%
80%
0% 20% 40% 60% 80%
Percen
tageoftotalsa
vingsw
ithinform
al
instrumen
tsexcludinghom
esavings
Percentageoftotalsavingswithformalinstruments
5%No Instrument
15% Formal savings
informal Savings
informal credit
21%
10%
9%
23%
6%

F i n a n c i a l S e r v i c e S D e m a n D S i D e S u r v e y • v a n u a T u | 21
Figure 33: Percent of the sample with various informal and formal financial instruments and the associated median savings balances
There are differences in formal savings and formal credit usage across income and age ranges, but minimal differences in informal savings and credit usageWealthier adults in vanuatu are more likely to report saving with a formal instrument, but there is little difference in the usage of formal credit (except for the top 20%), informal savings or informal credit (Figure 34). it appears that income is associated with using formal savings but not formal credit, informal savings or informal credit, although people may use these products differently based on income segment.
Figure 34: Percent of adults with formal and informal instruments used, by income quintile
age also appears to be related to usage of formal savings (Figure 35). Older adults are more likely to report saving with a formal instrument (age is positively correlated with individual income), but only up to a certain point. after the age of 40, usage of formal savings decreases. These results make sense: earning power increases up to a certain age, but in retirement, earning power decreases. usage of pensions or other social welfare payments may explain the uptick in usage of formal savings by the oldest adults. Just as with adults’ income levels, there is no difference in how adults of different age brackets use formal credit, informal savings or informal credit by age.
34.
73%
31%
73%
45%40%
10%
78%
45%
37%
5%
77%
38%
22%
7%
69%
48%
19%
5%
56%
39%
0%
10%
20%
30%
40%
50%
60%
70%
80%
90%
Formalsavings Formalcredit Informalsavings Informalcredit
Top20%
61-80%
41-60%
21-40%
BoRom20%
Formal savings: Informal savings: Formal credit: Informal credit:

22 | F i n a n c i a l S e r v i c e S D e m a n D S i D e S u r v e y • v a n u a T u
Figure 35: Percent of adults with formal and informal instruments, by age
Figure 36 shows the loan uses for the most recent loan taken by adults. While savings tends to be used to pay for education, loans appear to be used for housing, with education being the second most popular response.
Figure 36: loan uses (multiple responses allowed)
16%7%
63%
38%33%
5%
73%
43%
52%
14%
71%
41%41%
17%
71%
48%
26%
5%
78%
42%
34%
5%
56%
34%
0%
10%
20%
30%
40%
50%
60%
70%
80%
90%
Formalsavings Formalcredit Informalsavings Informalcredit
15-20 21-30 31-40 41-50 51-60 61+
36.
4%
5%
26%
34%
42%
0% 5% 10% 15% 20% 25% 30% 35% 40% 45%
Health
Wedding/funerals
Business
Educa`on
Improvehousing
Percent

F i n a n c i a l S e r v i c e S D e m a n D S i D e S u r v e y • v a n u a T u | 23
Bank account access does not equal usageMany banked adults have not saved or borrowed from a bank in the past yeareven among banked adults (37%), a significant portion are not saving or borrowing from a bank. Figure 37 shows the breakdown of usage for banked adults in vanuatu: 22% of banked adults reported no transactions (deposits, withdrawals, savings or borrowing) in the past 12 months; 17% of banked adults reported only transacting into or out of the account through (income) deposits or withdrawals; and the remaining 60% of banked adults reported deliberate saving or borrowing from the bank in the past 12 months. Supply side data could be used to validate these responses and look at transaction patterns across banked clients to see which clients use accounts for transactional purposes only.
Figure 37: Percent of banked clients that have transacted, saved or borrow with a bank in the past year
Supporting the above finding that women transact more frequently than men, they also appear more likely to use their accounts to save. This may be partly explained by the fact that women are more likely to be self-employed than men, and as a result, may need to deposit and withdraw more frequently. Since women traditionally manage household expenses, they may also be more likely to save. Further research can help to validate these hypotheses. Figure 38 illustrates that women are 10 percentage points more likely to report having used their accounts to save, and slightly less likely to have used them only to send or receive money, than men.
Figure 38: Bank account usage, by gender
37.
22% 17% 45% 2% 13%
0% 20% 40% 60% 80% 100%
Notransac[ons
Transac[onsonly(withdrawalsordeposits)
Savedinthepast12months
Borrowedinthepast12months
Savedandborrowedinthepast12months
38
23%
21%
20%
14%
41%
51%
3%
2%
14%
12%
0% 20% 40% 60% 80% 100%
Male(n=207)
Female(n=179) Notransac[ons
Transac[onsonly(withdrawalsordeposits)
Savedinthepast12months
Borrowedinthepast12months
Savedandborrowedinthepast12months

24 | F i n a n c i a l S e r v i c e S D e m a n D S i D e S u r v e y • v a n u a T u
Remittances are concentrated within Vanuatu and used for personal expenses
The majority of remittances are sent and received within VanuatuSimilar to other Piri countries, remittances play an important role in the financial lives of adults in vanuatu. almost 50% of adults have either sent or received remittances in the past year (Figure 39). in vanuatu the majority of remittances are sent from within the country (Figure 40). For adults receiving remittances, 75% are sent from within vanuatu with a median remittance amount of 9,000 vatu (uS $84.35).
Figure 39: Percent of adults who have sent or received remittances
Figure 40: remittance locations of adults receiving remittances
Similar to other Piri countries, remittances are largely sent through Western union (Figure 41), though the survey data do not reveal adults’ opinions of Western union or their access to other options.
39.
33%
27%
49%
11%
0%
10%
20%
30%
40%
50%
60%
ReceivedremiRances SentremiRances SendorreceiveremiRances
SendandreceiveremiRances
Perc
ent
40.
67%
23%
9%
1%
33%
DonotreceiveremiRances
AnotherpartofVanuatu
Abroad
AbroadandVanuatu

F i n a n c i a l S e r v i c e S D e m a n D S i D e S u r v e y • v a n u a T u | 25
Figure 41: How adults receive remittances sent within vanuatu (multiple responses allowed)
remittance amounts from within vanuatu are relatively small in size, at 9,000 vatu (uS $84.35), and are used for short term consumption needs rather than longer term planning, unlike savings, which is used mainly for education or credit, which is used mainly for housing. One potential reason for the high percentage of remittances spent on personal expenses is that the DSS survey was conducted just over a year after cyclone Pam passed through vanuatu. adults may have used remittances to offset damage from the cyclone.
Figure 42: remittance uses, by gender (multiple responses allowed)
We also see interesting differences in the uses of remittances by men and women (Figure 42). Women are more likely to use remittance money for personal and household expenses, traditional ceremonies, and health care, while men appear more likely to use remittances for spending on housing.
41.
55%
21%
16%
8%
3% 3%
0%
10%
20%
30%
40%
50%
60%
WesternUnion Rela`vewithcash
Othermoneytransfer
Bankaccount MoneyGram Rela`veaccount
Perc
ent
42.
1%
1%
2%
2%
5%
8%
8%
14%
33%
64%
3%
8%
3%
2%
7%
14%
4%
6%
34%
79%
0% 20% 40% 60% 80% 100%
Business
Ceremony
Emergency
Save
Church
Health
Other
Housing
Educa`on
PersonalExpenses(food,u`li`es)
Female(n=189)
Male(n=143)
26 | F i n a n c i a l S e r v i c e S D e m a n D S i D e S u r v e y • v a n u a T u
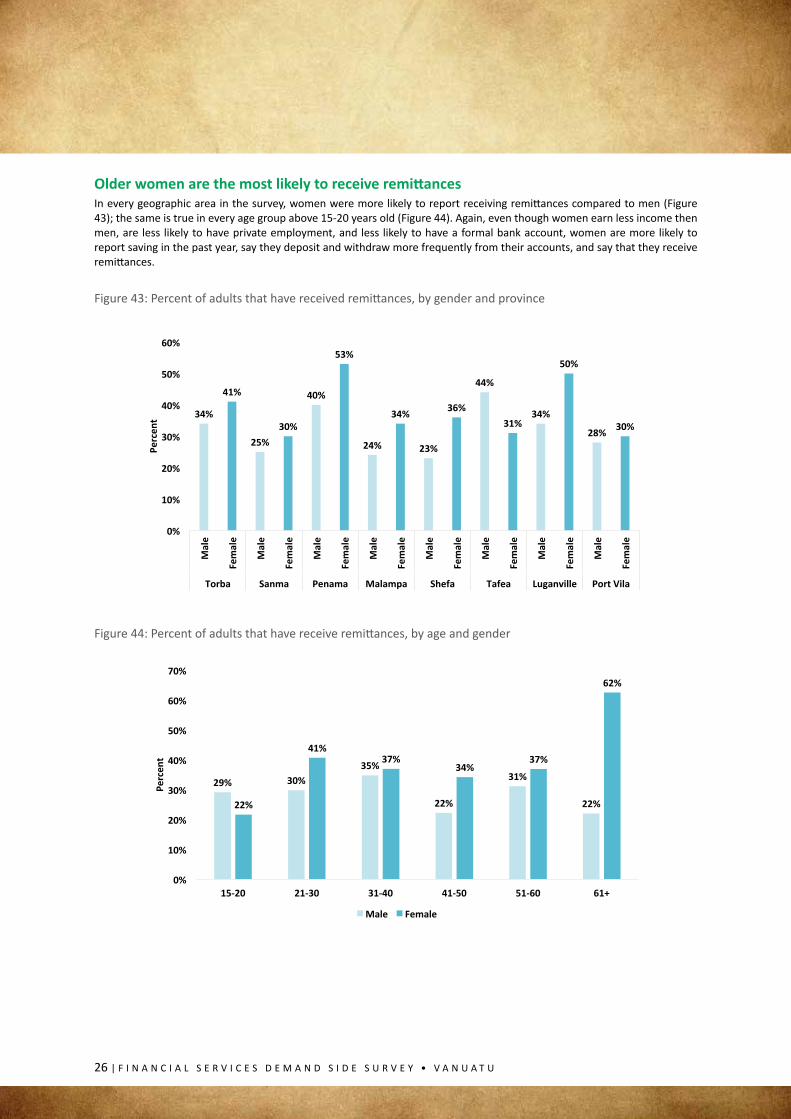
Older women are the most likely to receive remittancesin every geographic area in the survey, women were more likely to report receiving remittances compared to men (Figure 43); the same is true in every age group above 15-20 years old (Figure 44). again, even though women earn less income then men, are less likely to have private employment, and less likely to have a formal bank account, women are more likely to report saving in the past year, say they deposit and withdraw more frequently from their accounts, and say that they receive remittances.
Figure 43: Percent of adults that have received remittances, by gender and province
Figure 44: Percent of adults that have receive remittances, by age and gender
43.
34%
41%
25%30%
40%
53%
24%
34%
23%
36%
44%
31%34%
50%
28% 30%
0%
10%
20%
30%
40%
50%
60%
Male
Female
Male
Female
Male
Female
Male
Female
Male
Female
Male
Female
Male
Female
Male
Female
Torba Sanma Penama Malampa Shefa Tafea Luganville PortVila
Percent
44.
29% 30%35%
22%
31%
22%22%
41%37%
34%37%
62%
0%
10%
20%
30%
40%
50%
60%
70%
15-20 21-30 31-40 41-50 51-60 61+
Perc
ent
Male Female

F i n a n c i a l S e r v i c e S D e m a n D S i D e S u r v e y • v a n u a T u | 27
Insurance is scarce in Vanuatu
Almost half of adults in Vanuatu do not know what insurance isinsurance in vanuatu is almost nonexistent, with only 5% of adults having insurance (Figure 45). The low level of insurance is concerning, as health care is a serious social issue in vanuatu. according to the World Health Organization, vanuatu spent $41 million on health care in 2014 (uS $158 per capita), but only 6% was spent by households and 90% by the government.11
There are only 1.4 doctors per 10,000 adults, one tenth of the regional average. all inpatient services in vanuatu and 60% of outpatient care is funded by the ministry of Health, but there are only five public hospitals and one private hospital in vanuatu.12
in the DSS, the top reason cited for not having insurance varied by individuals’ source of income (Table 5). adults earning income through agriculture cite “not knowing where or how to obtain it” (50%), while private income earners said insurance was “too expensive” (57%).
Figure 45: Percent of adults with insurance
Table 5: reason for not having insurance, by income source (multiple responses allowed)
Reason Agriculture (n=123)
Casual (n=60) Self-employed (n=85)
Private (n=136) Government (n=58)
Don’t know where or how to get it
50% 33% 27% 13% 29%
Too expensive 30% 34% 44% 57% 39%
Don’t know what it is or how it works
26% 17% 23% 14% 10%
Don’t need 22% 26% 15% 29% 19%
Don’t trust companies
4% 14% 8% 9% 5%
11 http://apps.who.int/nha/database/country_Profile/index/en12 12 http://www.pacificprime.com/country/australasia/vanuatu-health-insurance-pacific-prime-international/
45.
5%
47%
48%Yes
Iknowwhatitisbutdon’thaveit
Don’tknowwhatinsuranceis

28 | F i n a n c i a l S e r v i c e S D e m a n D S i D e S u r v e y • v a n u a T u
Mobile phone penetration is wide but mobile banking is limited
Over 80% of adults have regular access to mobile phonesmobile phone ownership is not ubiquitous across vanuatu, with only 67% of adults owning a phone and 70% owning a Sim card. However, 84% of adults either own their own phone, own a Sim card, or regularly use another person’s mobile phone (Figure 46). These findings are consistent with a 2011 study in which four out of five households reported owning a mobile phone.13
Figure 46: Percent of adults with a Sim, a phone and have heard of mobile banking
network reliability and internet access are areas of concern in the mobile arena. Figure 47 shows that 17% of adults that use a phone said that network reliability was infrequent and/or they had to move in order to obtain service. network reliability also hinders internet use and potentially explains the slow rise in usage rates of internet in vanuatu. internet usage only rose from 3.5% of inhabitants in 2004 to 7.1% in 2009.14 These results support the DSS results: accessing the internet was the least cited use of mobile phones.
Figure 47: network reliability for adults with a phone or Sim
13 ibid14 http://www.mjcs.gov.vu/images/research_database/PiPP-net-effects-2011-vanuatu-Telecomms-report1.pdf
47.
62%22%
5%
12%
Reliablealmostallofthe`me
Mostofthe`me
Infrequent
Havetomoveforservice

F i n a n c i a l S e r v i c e S D e m a n D S i D e S u r v e y • v a n u a T u | 29
even phone activities that do not require internet, such as texting, are not part of many adults’ daily routine in vanuatu. as Figure 48 shows, 53% of adults do not use SmS, and of the adults that do, only 13% do so daily.
Figure 48: Frequency of SmS usage48.
53%
13%
22%
9%
4%
47%
Doesnottext
Daily
Few`mesaweek
Onceaweek
Onceamonthorless

30 | F i n a n c i a l S e r v i c e S D e m a n D S i D e S u r v e y • v a n u a T u
Recommendations for further understanding of financial inclusion in Vanuatu
vanuatu has similar levels of bank account ownership to other Pacific island and lower-middle income countries. This section presents some preliminary suggestions for local stakeholders for understanding the drivers not only of account ownership but also of full, meaningful financial inclusion.
The results show that financial access is linked unevenly to employment type, gender and province/city. adults working in agriculture and adults living in Tafea and malampa are most likely to be financially excluded, as are women generally.
although it is not possible with the survey data to determine the cause of all these differences, some of the above findings could help policy makers and financial service providers take the lead on closing the gaps across segments. For example, agricultural income earners are more likely to lack formal identification as well as earn income and pay for items in cash, compared to non-agricultural income earners. adults in malampa report higher transportation costs to reach bank branches, and the unbanked overall report longer transportation times to bank branch branches compared to bank adults. Provided there is a large enough market opportunity, bank agents could potentially serve these groups. even wealthier adults that earn income through agriculture are more likely to be financial excluded and rely on informal instruments to meet their financial needs compared to wealthier adults that do not earn income from agriculture. The data suggest that there is an unmet need for formal financial services among these groups.
The DSS data also suggest that a large percentage of the banked population is not actively saving or borrowing with their account, but using their account for transactional purposes (receiving deposits or making withdrawals). Providing access to a formal account is only the first step in financial inclusion, but products must meet the specific needs and use cases for adults in their financial lives. many adults use savings for cyclical spending on items such as education, while loans are used for larger, infrequent expenses such as housing repairs and remittances are used for short term expenditures on food and personal items. By taking these uses into account, formal financial services providers may improve the fit between their products and their clients’ needs.

F i n a n c i a l S e r v i c e S D e m a n D S i D e S u r v e y • v a n u a T u | 31
Annex A: Financial Inclusion Indicators
Table 6: Piri demand side indicators
acceSS inDicaTOrS
Confidence interval
3.4 % of adults with a mobile phone subscription 67.1% [62.9%,71.4%]
4.3. average cost of traveling to the nearest access point (public transit fee or gas costs)
Bank branch vT 1,156.4 (uS $10.84) [932.7,1380.1]
aTmvT 1,149.1
(uS $10.77)[792.7,1505.4]
Bank agentvT 888.8
(uS $8.33)[0,2279]
4.4. average time of traveling to the nearest access point in minutes
Bank branch 86.6 [62.3,111.0]
aTm 181.3 [110.9,251.8]
Bank agent39.2 [0,82.7]
4.5. average time waiting to be served when opening a deposit account (in hrs.) 18.3 [12.8,23.9]
4.7. Percentage of adults reporting that they do not have all identification documents required to open a basic account 14.7% [11.8%,17.6%]

32 | F i n a n c i a l S e r v i c e S D e m a n D S i D e S u r v e y • v a n u a T u
Table 7: Global Findex indicators – vanuatu compared with lower-middle and other Pacific islands
Benchmarking the Vanuatu Financial Inclusion Indicators
lower-middle income
countries (2014)
Fiji (2014)
Tonga *
main account
(2016)
vanuatu main
account (2016)
0 deposits in a typical month (% with account) 57.2% 7.5% 14.8% 29.4%
0 deposits/withdrawals in a typical month (% with account) 34.6%** 13.7% 8.3% 20.8%
0 withdrawals in a typical month (% with account) 57.8% 12.8% 18.7% 31.6%
1-2 deposits in a typical month (% with account) 32.4% 63.9%15 60.4% 52.5%
1-2 withdrawals in a typical month (% with account) 27.5% 56.3%16 54.8% 44.5%
3+ deposits in a typical month (% with account) 8.8% 27.3% 16.8% 7.2%
3+ withdrawals in a typical month (% with account) 12.5% 29.9% 19.5% 11.8%
aTm is main mode of withdrawal (% with account) 42.4% 80.7% 47.3% 43.83%
account at a formal financial institution (bank or credit union) 41.8% 60.2% 40.8% 39.3%
Bank teller is main mode of withdrawal (% with account) 45.8% 10.6% 49.5% 52.3%
credit cards (total population) 3.7% 3% 1.9% 0.7%
Debit cards (total population) 21.2% 47.2% 20.5% 18.7%
mobile phone used to pay bills (total population)* 1.89% 0.0% 0.0% 0.0%
mobile phone used to receive money (total population)* 3.57% 2.3% 8.7% 0.7%
mobile phone used to send money (total population)* 2.27% 1.4% 2.3% 1.0%
Saved any money in the past year 45.6% 71.2% 62.9% 58.7%
Saved at a financial institution in the past year (bank, credit union, or mFi) 14.8% 37.9% 18.2% 26.8%
Saved using a savings club in the past year 12.4% 9.0% 22.7% 9.2%
loan in the past year (from any source) 47.4% 32.0% 37.4% 46.4%
loan from a financial institution in the past year 7.5% 6.9% 13.6% 9.2%
loan from an employer in the past year* 4.88% 1% 2.6% 4.4%
loan from family or friends in past year 33.1% 8% 5.2% 7.2%
loan through store credit in the past year* 8.18% 10.4% 22.7% 32.2%
Personally paid for health insurance (all respondents)* 5.15%* 1.2% 13.4% 5.4%
15 This includes deposits which are made infrequently or only a few times per year 16 This includes withdrawals which are made infrequently (less than once per month) or a few times per year

F i n a n c i a l S e r v i c e S D e m a n D S i D e S u r v e y • v a n u a T u | 33
Table 8:GPFi indicators
GPFi indicators Proportion 95% ci
Formally banked adults: % of adults with an account at a formal financial institution 36.7% [32.1%,41.2%]
adults with credit from regulated institutions (bank and credit union only) 6.8% [4.5%,9.1%]
adults with credit from regulated institutions (bank, credit union, finance company, or mFi)
9.2% [6.6%,11.8%]
adults with insurance 5.4% [3.7%,7.9%]
Saved at a financial institution in the past year (bank, credit union, mFi) 26.8% [22.6%,30.9%]
remittances (send or receive) 48.6% [44.1%,53.0%]
Table 9:inclusion categories
Financial inclusion category % 95% ci
Banked (n=386) 36.7% [32.3%,41.3%]
Other formal (n=98) 10.3% [7.9%,13.3%]
informal only (n=192) 21.4% [18.2%,25.1%]
excluded (n=315) 31.6% [27.8%,35.6%]
n=991
Table 10: Bank account types and motivation for opening account
Does anyone in your household apart from you currently have any type of account with a bank?
95% ci
yes (n=487) 50.5% [46.1%,54.9%]no (n=503) 49.5% [45.0%,53.9%]n=990Have you, personally, ever had any type of account with a bank?used to have, but no longer have (n=117) 12.1% [9.3%,15.4%]i have this now (n=386) 36.7% [32.3%,41.3%]never had (n=487) 51.3% [46.8%,55.8%]n=990How many bank accounts do you have?1 (n=276) 77.5% [70.4%,83.3%]2 (n=82) 17.9% [12.6%,24.8%]3 (n=20) 2.8% [1.5%,4.9%]4 or more (n=8) 1.9% [0.6%,5.5%]n=386in which bank is your account? (account 1)Westpac (n=33) 7.3% [4.7%,11%]anZ (n=82) 18.7% [13.3%,25.7%]

34 | F i n a n c i a l S e r v i c e S D e m a n D S i D e S u r v e y • v a n u a T u
nBv (n=8182) 56.7% [46.6%,64.5%]BreD (n=89) 17.3% [12.4%,23.5%]n=386What type of account is this? (account 1)current account (n=146) 37.8% [30.1%,46.1%]Savings account (n=228) 59.6% [51.3%,67.4%]Term deposit (n=7) 1.7% [0.6%,4.3%]Other (n=5) 0.9% [0.2%,3.4%]n=386What is the main reason that you opened this account? (account 1)To receive a payment (salary, remittances, other) (n=102) 20.9% [16.2%,26.8%]To keep my money safe (n=250) 72.1% [65.2%,78.1%]To receive government benefits (n=2) 0.3% [0.3%,0.4%]To get a loan (n=5) 0.7% [0.3%,1.9%]Other (n=25) 5.9% [2.9%,12.2%]Don’t know/refuse (n=2) 0.3% [0.3%,1.2%]n=386in which year did you open this account? (account 1)2000 or earlier (n=50) 10.7% [7.4%,15.3%]2001-2010 (n=119) 31.2% [23.8%,39.6%]2011 (n=12) 3.9% [1.7%,8.7%]2012 (n=19) 7.8% [3.9%,14.9%]2013 (n=34) 11.9% [6.4%,20.8%]2014 (n=45) 14.6% [9.5%,21.8%]2015 (n=44) 16.7% [10.2%,26.3%]2016 (n=10) 3.4% [1.6%,7.2%]n=333
Table 11: Documentation
Do you currently have a birth certificate?yes (n=693) 68.2% [64.1%,71.9%]no (n=281) 30.1% [26.4%,34.0%]Don’t know (n=16) 1.8% [0.8%,3.7%]n=9907.2 Do you currently have a photo iD?yes (n=403) 34.8% [30.5%,39.4%]no (n=581) 64.7% [60.1%,68.9%]Don’t know (n=6) 0.5% [0.2%,1.2%]n=990

F i n a n c i a l S e r v i c e S D e m a n D S i D e S u r v e y • v a n u a T u | 35
Where did you open this account? (account 1)Bank branch (n=430) 89.1% [82.3%,93.5%]Bank agent (n=14) 3.6% [1.9%,6.6%]Bank representative (n=15) 7.3% [3.5%,14.4%]Don’t know (n=1) 0.01% [0.0%,0.2%]n=323Was a minimum balance required to open the account? (account 1)yes (n=237) 25.2% [17.9%,34.2%]no (n=195) 61.7% [53.1%,69.6%]Don’t know (n=54) 13.1% [9.0%,18.6%]n=386
Table 12: account usage
What is the main reason for opening the account (account 1):To keep money in a safe place (n=250) 72.1% [65.2%,78.1%]To receive a payment (salary, remittance) (n=102) 20.9% [16.2%,26.8%]To receive government benefits (n=2) 0.0% [0.0%,0.4%]To get a loan (n=5) 0.7% [0.3%,1.9%]Transfer money electronically (n=3) 0.3% [0.0%,0.9%]Other (n=22) 5.6% [2.7%,11.4%]n=384in the past 12 months, have you borrowed money from any of these banks?yes (n=62) 15.8% [10.8%,22.4%]n=386in a typical month, how many times is money deposited into this account (by you or others) (account 1)?1 - 2 times per month (n=242) 52.5% [44.1%,60.8%]3 or more times per month(n=26) 7.2% [4.2%,11.8%]money is not deposited in a normal month (n=79) 29.4% [21.6%,39.6%]Don’t know/refuse (n=39) 10.6% [5.9%,19.4%]n=386in a typical month, how many times is money withdrawn from this account (by you or others) (account 1)?1 - 2 times per month (n=183) 44.5% [36.6%,52.6%]3 or more times per month (n=63) 11.8% [8.3%,16.5%]money is not withdrawn in a normal month (n=87) 31.6% [23.4%,41.2%]Don’t know/refuse (n=23) 4.6% [2.5%,7.2%]n=386

36 | F i n a n c i a l S e r v i c e S D e m a n D S i D e S u r v e y • v a n u a T u
Table 13: mobile phone ownership and mobile banking
Do you, yourself, have a mobile phone? 95% ciyes (n=692) 67.1% [62.8%,71.2%]no (n=298) 32.9% [28.8%,37.2%]n=990Do you have an active Sim card?yes (n=710) 83.0% [79.5%,86.1%]no (n=129) 16.9% [13.9%,20.5%]n=839How many active Sim cards do you have?1 (n=547) 79.5% [75.1%,83.2%]2 (n=157) 20.3% [16.6%,24.7%]3 or more (n=6) 0.2% [0.0%,0.6%]n=710How often do you use a phone to send text messages?Daily (n=125) 26.7% [21.1%,33.1%]a few times a week (n=250) 45.8% [39.9%,51.7%]about once a week (n=91) 19.3% [15.3%,23.9%]Once a month or less (n=57) 8.3% [6.1%,11.3%]n=523Have you HearD about sending and receiving money using your phone? yes (n=450) 10.2% [7.4%,14.1%]no (n=450) 41.9% [37.6%,46.4%]Don’t know (n=90) 47.8% [43.4%,52.3%]n=990in the last 12 months, have you used a mobile banking account?yes, to send and receive (n=3) 15.7% [3.9%,45.8%]yes, to receive only (n=2) 22.1% [4.9%,60.4%]yes, to send only (n=5) 41.7% [16.4%,72.4%]Transferring (n=2) 10.4% [2.0%,39.4%]checking balance (n=5) 10.2% [3.1%,28.9%]n=17When was the last time you sent money using mobile banking (even using someone else’s account)?in the past 30 days (month) (n=11) 60.7% [29.8%,84.9%]2 - 3 months ago (n=2) 12.9% [2.7%,44.4%]Don’t know / refuse (n=4) 26.4% [6.6%,74.3%]n=17

F i n a n c i a l S e r v i c e S D e m a n D S i D e S u r v e y • v a n u a T u | 37
Table 14: remittances
Do you have any relatives or acquaintances living elsewhere (in vanuatu or abroad) that sent you money in the past 12 months?yes (n=333) 32.8% [28.9%,37.0%]no (n=657) 67.2% [62.9%,71.1%]n=990is the money sent from…?abroad (n=83) 27.1% [20.7%,34.5%]another part of vanuatu (n=239) 69.9% [62.6%,76.4%]abroad and vanuatu (n=10) 2.9% [1.4%,5.7%]Don’t know / refuse (n=1) 0.1% [0.0%,0.9%]n=333How is the money from abroad usually sent to you? Own bank account (n=12) 10.7% [5.3%,20.2%]Western union (n=61) 59.8% [44.3%,73.6%]Other money transfer (n=1) 1.7% [0.2%,11.5%]Through a relative or friend (by cash) (n=10) 11.5% [5.5%,22.6%]Through a relative or friend (using the relative’s mobile money or bank account) (n=5)
6.0% [2.2%,15.3%]
Other (specify) (n=4) 10.3% [2.1%,38.1%]n=93How is the money from elsewhere in vanuatu usually sent to you?
(multiple responses)Own bank account (n=28) 8.1%Western union (n=152) 55.0%Other money transfer (n=31) 16.2%Through a relative or friend (by cash) (n=43) 21.5%Through a relative or friend (account) (n=7) 3.1%Other money transfer (n=31) 16.2%moneyGram (n=8) 3.5%Other (n=7) 2.0%n=249about how often do you usually receive this money from abroad?Weekly (n=1) 0.7% [0.0%,5.1%]Fortnightly (n=4) 2.3% [0.6%,8.2%]Once a month (n=13) 12.3% [6.2%,22.8%]every 2-3 months (n=22) 29.8% [18.6%,44.0%]Twice a year (n=27) 31.7% [18.8%,48.2%]Once a year (n=13) 19.3% [11.0%,31.7%]

38 | F i n a n c i a l S e r v i c e S D e m a n D S i D e S u r v e y • v a n u a T u
less than once per year (n=4) 1.5% [0.4%,4.9%]Other (specify) (n=4) 2.4% [0.5%,10.0%]n=93Do you regularly send any money to family or friends (in vanuatu or abroad)?yes (n=296) 26.9% [23.2%,31.1%]no (n=694) 73.1% [68.9%,76.9%]n=990Where do you send the money?Other parts of vanuatu (n=276) 95.5% [90.4%,97.9%]abroad (n=16) 3.9% [1.6%,9.3%]abroad and vanuatu (n=4) 0.6% [0.2%,1.7%]n=296How do you usually send the money to other parts of vanuatu?
(multiple responses)Own bank account (n=27) 8.2%Western union (n=163) 54.4%Other money transfer (n=25) 12.3%Through a relative or friend (by cash) (n=61) 25.1%Through a relative or friend (using the relative’s mobile money or bank account) (n=6)
1.8%
Other (n=13) 2.6%n=280about how often do you usually send this money within vanuatu?Fortnightly (n=11) 3.2% [0.0%,1.0%]Once a month (n=56) 17.3% [12.3%,23.7%]every 2-3 months (n=89) 28.9% [21.9%,37.2%]Twice a year (n=78) 32.7% [24.1%,42.7%]Once a year (n=37) 14.7% [10.1%,20.9%]less than once a year (n=5) 2.4% [0.9%,6.1%]Other (specify) (n=2) 0.6% [0.1%,2.9%]Don’t know/refuse (n=2) 0.3% [0.0%,1.0%]n=280Sends or receives remittancesyes (n=507) 48.6% [44.2%,53.0%]no (n=484) 51.4% [46.9%,55.8%]n=991

F i n a n c i a l S e r v i c e S D e m a n D S i D e S u r v e y • v a n u a T u | 39
Table 15: insurance
Do you have any type of insurance?yes (n=68) 5.4% [3.7%,7.9%]i know what insurance is but do not have it ) n=506) 46.7% [42.3%,51.2%]Don’t know what insurance is (n=416) 47.8% [43.4%,52.3%]n=990Which of the following types of insurance do you have?(multiple responses)Health insurance (n=16) 14.7%life (n=7) 7.4%Home (n=17) 14.1%vehicle (n=36) 63.8%Travel (n=3) 5.2%Other (n=3) 4.1%Don’t know/refuse (n=5) 8.0%n=68reasons for not having insurance for those who don’t have
(multiple responses)used to have but had bad experience (n=3) 0.4%Do not need (n=142) 25.8%Don’t know what it is or how it works (n=92) 19.8%Don’t know where or how to get it (n=116) 26.2%Too expensive (n=207) 38.9%Don’t trust companies (n=32) 5.1%another household member has insurance (n=5) 0.4%Other (n=33) 9.1%Don’t know/refuse (n=26) 5.4%n = 506
Table 16: constraints to access
mean 95% cicost to bank branch (vuv) 1156.4 [932.7,1380.1]Time to bank branch (min) 86.6 [62.3, 111.0]cost to aTm (vuv) 1149.1 [792.7, 1505.4]Time to aTm (min) 181.3 [110.9,251.8]cost to bank agent (vuv) 888.8 [0,2279]Time to bank agent (min) 39.2 [0,82.7]

40 | F i n a n c i a l S e r v i c e S D e m a n D S i D e S u r v e y • v a n u a T u
Annex B: Methodology and Sample Description
The sampling frame was based on the last vanuatu census of Population and Housing. a stratified three-stage sample design was used for selecting a sample of 991 households and persons aged 15 years or older that were interviewed. The primary sampling units (PSus) corresponded to the census enumeration areas (eas). The sampling frame was stratified by urban and rural eas, with implicit stratification by the 8 provinces of vanuatu (from ordering the eas in the sampling frame for each stra-tum by province). The final sample includes a total of 68 sample eas: 31 urban eas and 37 rural eas. The urban stratum has about 25.7% of the households in the census frame. in order to improve the level of precision for the urban estimates from the survey data, a higher sampling rate was used for the urban stratum in order to select a sample of 30 eas. an additional urban ea was enumerated in the field and accepted as part of the sample, so the final number of urban sample eas was 31. This oversampling of the urban stratum was taken into account in calculating the weights for the sample households.
Within each stratum (urban and rural), the sample eas were selected systematically with probability proportional to size (PPS), where the measure of size was based on the total number of households in the frame for each ea. Following the selec-tion of sample eas, a new listing of households was conducted in each of these eas. at the second sampling stage, a sample of 15 households was selected from the listing for each sample ea, for an initial target sample size of 1,005 households. The final number of completed household interviews was 991. at the third sampling stage, one household member aged 15 years or older was randomly selected for the survey from all the persons in that age group identified in each sample household. Table 1 shows the distribution of the total number of households in the census frame by stratum, and the number of sample eas and households allocated to each stratum.
a list of reserve households for possible replacement were also randomly selected in each sample ea. any sample household that could not be interviewed was replaced with a household from the reserve, although in a few sample eas it was not pos-sible to complete 15 interviews.
Table 17. Distribution of the total number of households in the vanuatu census frame by urban and rural stratum, and corresponding allocation of the sample eas and households for the vanuatu DSS 2016
Stratum Number of households in frame Number of EAs selected Final number of sample
households interviewedurban 10,973 31 436rural 31,719 37 555TOTal 42,692 68 991
Figure 49: relationship to household head Figure 50: marital status

F i n a n c i a l S e r v i c e S D e m a n D S i D e S u r v e y • v a n u a T u | 41
Figure 51: english literacy level Figure 52: Bislama literacy level
Figure 53: age distribution
51.
50%33%
17%
Comfortable
AliRle
Notatall
52.
81%
13%
6%
Comfortable
AliRle
Notatall
53.
19%
28%
23%
15%
8%7%
0%
5%
10%
15%
20%
25%
30%
15-20 21-30 31-40 41-50 51-60 61+
Perc
ent

42 | F i n a n c i a l S e r v i c e S D e m a n D S i D e S u r v e y • v a n u a T u
Figure 54: education level
Figure 55: vanuatu enumeration areas
54.
51%
36%
6% 7%
0%
10%
20%
30%
40%
50%
60%
Primary Secondary Ter`ary None
Perc
ent


44 | F i n a n c i a l S e r v i c e S D e m a n D S i D e S u r v e y • v a n u a T u