financial stability report - rbnz.govt.nz · 1 financial stability risk and policy assessment 2 ......
TRANSCRIPT
Financial Stability ReportNovember 2018
iiRESERVE BANK OF NEW ZEALAND / FINANCIAL STABILITY REPORT, NOVEMBER 2018
Reserve Bank of New Zealand Financial Stability Report
Subscribe online: https://www.rbnz.govt.nz/email-updates
Report and supporting notes published at:
https://www.rbnz.govt.nz/financial-stability/financial-stability-report
A summary of New Zealand’s financial system is published at:
http://www.rbnz.govt.nz/financial-stability/overview-of-the-new-zealand-financial-system
This report is published pursuant to section 165A of the Reserve Bank of New Zealand Act 1989, which states that a financial stability report must:
(a) report on the soundness and efficiency of the financial system and other matters associated with the Bank’s statutory prudential purposes; and
(b) contain the information necessary to allow an assessment to be made of the activities undertaken by the Bank to achieve its statutory prudential purposes under this Act and any other enactment.
In addition, under the Memorandum of Understanding between the Minister of Finance and the Governor of the Reserve Bank of New Zealand, the Bank’s Financial Stability Report will report on matters relating to the soundness
and efficiency of the financial system, including any build-up of systemic risk, and the reasons for, and impact of, any use by the Bank of macro-prudential policy instruments.
This Report uses data released up to 21 November 2018
Copyright © 2018 Reserve Bank of New Zealand
ISSN 1176-7863 (print)
ISSN 1177-9160 (online)
iiiRESERVE BANK OF NEW ZEALAND / FINANCIAL STABILITY REPORT, NOVEMBER 2018
Financial Stability Report in picturesNovember 2018
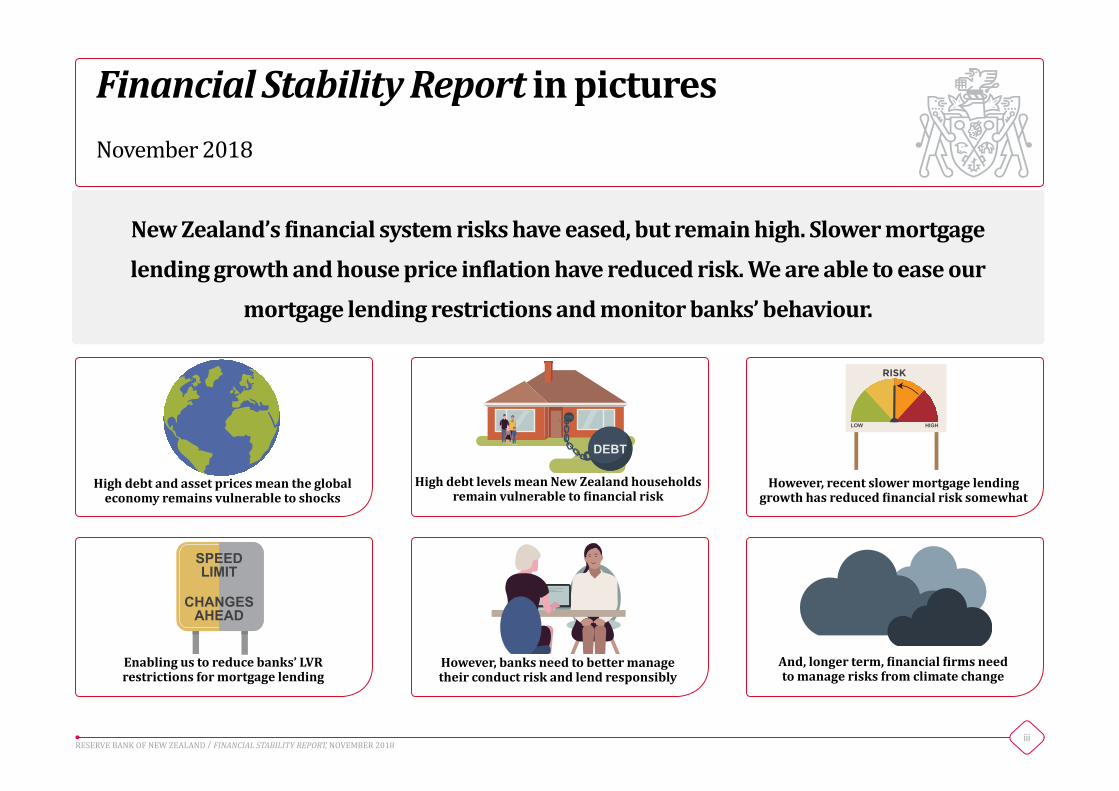
New Zealand’s financial system risks have eased, but remain high. Slower mortgage lending growth and house price inflation have reduced risk. We are able to ease our
mortgage lending restrictions and monitor banks’ behaviour.
High debt levels mean New Zealand households remain vulnerable to financial risk
However, recent slower mortgage lending growth has reduced financial risk somewhat
Enabling us to reduce banks’ LVR restrictions for mortgage lending
High debt and asset prices mean the global economy remains vulnerable to shocks
And, longer term, financial firms need to manage risks from climate change
However, banks need to better manage their conduct risk and lend responsibly
DEBT
LOW HIGH
SPEED LIMIT
CHANGESAHEAD
ivRESERVE BANK OF NEW ZEALAND / FINANCIAL STABILITY REPORT, NOVEMBER 2018
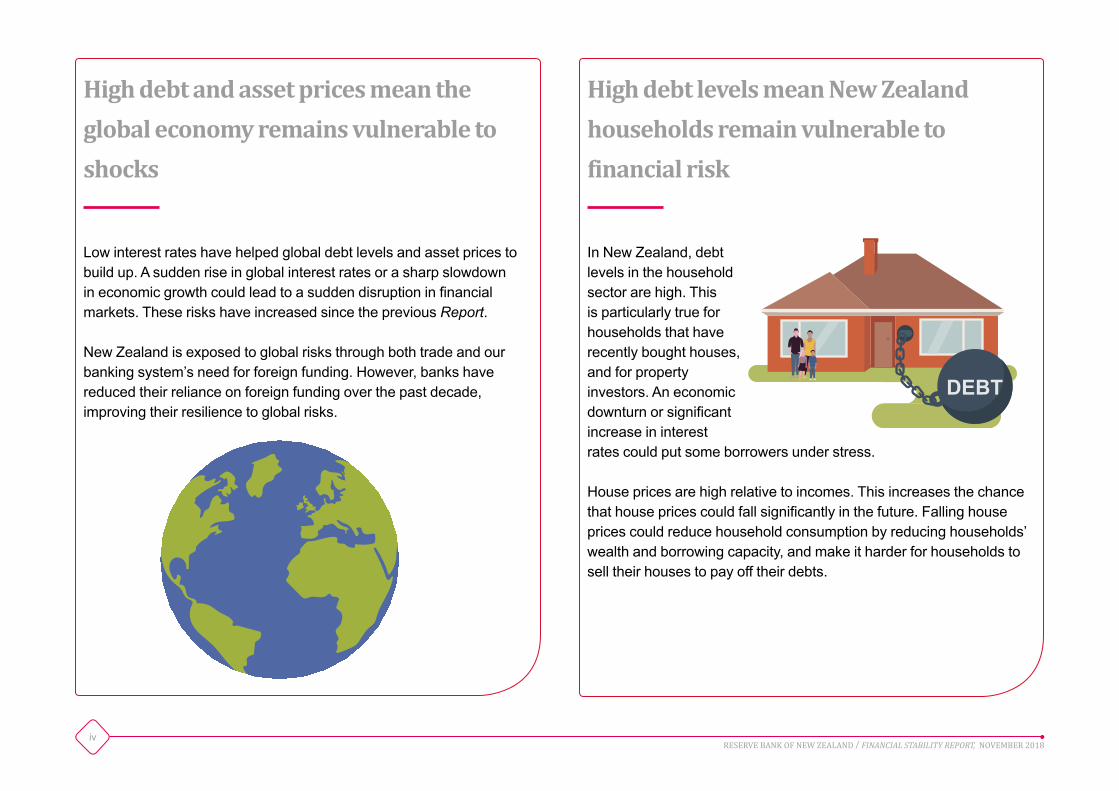
High debt and asset prices mean the global economy remains vulnerable to shocks
Low interest rates have helped global debt levels and asset prices to build up. A sudden rise in global interest rates or a sharp slowdown in economic growth could lead to a sudden disruption in financial markets. These risks have increased since the previous Report.
New Zealand is exposed to global risks through both trade and our banking system’s need for foreign funding. However, banks have reduced their reliance on foreign funding over the past decade, improving their resilience to global risks.
High debt levels mean New Zealand households remain vulnerable to financial risk
In New Zealand, debt levels in the household sector are high. This is particularly true for households that have recently bought houses, and for property investors. An economic downturn or significant increase in interest rates could put some borrowers under stress.
House prices are high relative to incomes. This increases the chance that house prices could fall significantly in the future. Falling house prices could reduce household consumption by reducing households’ wealth and borrowing capacity, and make it harder for households to sell their houses to pay off their debts.
DEBT

vRESERVE BANK OF NEW ZEALAND / FINANCIAL STABILITY REPORT, NOVEMBER 2018
Enabling us to reduce banks’ LVR restrictions for mortgage lending
We introduced loan-to-value ratio (LVR) restrictions in 2013 in response to rising housing lending risk. The restrictions have reduced the number of borrowers who would be forced to sell their houses or significantly reduce spending if they ran into financial problems.
With housing lending risks falling, we can relax the LVR restrictions. From the start of next year, banks will be able to provide 20 percent of new owner-occupier loans to owner-occupier borrowers with less than 20 percent deposits. And they will be able to provide 5 percent of new investor loans to investor borrowers with less than 30 percent deposits. We will continue to monitor changes in housing lending risk, and will further ease LVR restrictions if risks continue to diminish over the next few years.
However, recent slower mortgage lending growth has reduced financial risk somewhat
Household lending growth has slowed, and fewer mortgages are being provided at high multiples of income or on interest-only terms. This is helping to gradually improve the financial resilience of the household sector.
House price growth has also slowed, particularly in Auckland. We think house price growth will remain low for some time, particularly as some Government initiatives are likely to weaken demand and support supply. The longer that house prices grow slowly, the less likely it is that they will fall sharply in the future.
20% LOW DEPOSIT LENDING
HOMESWEETHOME
20%DEPOSIT
5% LOW DEPOSIT LENDING
HOUSES
30%DEPOSIT
TO LET
LOW HIGH
viRESERVE BANK OF NEW ZEALAND / FINANCIAL STABILITY REPORT, NOVEMBER 2018
And, longer term, financial firms need to manage risks from climate change
New Zealand’s financial system is exposed to climate risks through the sectors it lends to and insures. Rising sea levels and more frequent extreme weather events could affect coastal property values and lead to higher insurance claims. And banks have large exposures to the agriculture industry, which could be affected by both the physical risks of climate change and transition risks as the economy moves towards lower carbon intensity.
Managing the consequences of climate change will require coordinated action from a range of parties. Banks and insurance companies will need to ensure longer-term climate risks are adequately reflected in their lending and underwriting standards. Banks will also have a role in providing finance for mitigating actions.
However, banks need to better manage their conduct risk and lend responsibly
Strong culture and good conduct are important ingredients for a sound and efficient financial system. Weak governance and risk management can undermine decision-making, threatening the efficient allocation of savings and investment, and increasing the vulnerability of the financial system.
The Reserve Bank and Financial Markets Authority recently reviewed the culture and conduct of New Zealand’s banking system. While the review did not find widespread conduct and culture issues, it found weaknesses in the governance and management of conduct risks. Banks must produce plans for addressing shortcomings by March 2019, and report on progress implementing the plans.

1RESERVE BANK OF NEW ZEALAND / FINANCIAL STABILITY REPORT, NOVEMBER 2018
Financial Stability ReportNovember 2018
Contents
1 Financial stability risk and policy assessment 2
2 The New Zealand financial system’s domestic vulnerabilities 6
Box A: The impact of climate change on New Zealand’s financial system 14
3 The New Zealand financial system’s international vulnerabilities 16
4 Developments in New Zealand’s financial system 22
Box B: The review of bank conduct and culture 36
5 Key regulatory developments 38
Appendix: Reserve Bank enforcement actions 44
2RESERVE BANK OF NEW ZEALAND / FINANCIAL STABILITY REPORT, NOVEMBER 2018
Chapter 1Financial stability risk and policy assessment
New Zealand’s financial system is sound and risks have abated a little. However, vulnerabilities remain. Bank capital and liquidity ratios are in excess of current regulatory requirements, and have increased over the past 12 months. Bank profits remain high, reflecting low operating costs and strong asset performance. While positive overall, banks’ low costs have been partly achieved through underinvestment in core IT infrastructure and risk management systems in New Zealand.
The Reserve Bank and the Financial Markets Authority recently completed a review of the culture and conduct of New Zealand’s banking system. While the review did not find widespread conduct and culture issues, it found weaknesses in the governance and management of conduct risks. Banks must produce plans for addressing shortcomings by March 2019, and report on progress implementing the plans.
CBL Insurance Ltd (‘CBL’) was placed into full liquidation by the High Court on 12 November. Aside from CBL, the insurance sector as a whole is meeting its minimum capital requirements. However, capital strength has declined and a number of insurers are operating with small buffers. The insurance industry must ensure it has sufficient capital to maintain solvency in all business conditions. High commission structures remain a challenge to efficiency in the life insurance sector, and a review of culture and conduct in the sector is ongoing.
While the financial system is currently stable, risks remain that could challenge future stability. The principal vulnerabilities are high levels of indebtedness in the household and agriculture sectors, and the reliance on foreign funding of New Zealand’s economy and banking system. While these vulnerabilities remain significant, they have improved over the past six months.
Reflecting some moderation in the financial system’s risks from housing lending, the Reserve Bank will ease loan-to-valuation (LVR) restrictions on new mortgages.
Key vulnerabilities
Household indebtedness remains high.
Around 60 percent of bank lending is to the household sector. Indebtedness in the household sector is high relative to historical and international norms, with particularly large concentrations of debt in recent entrants to the property market and property investors. These borrowers are exposed to an economic downturn that would cause

3RESERVE BANK OF NEW ZEALAND / FINANCIAL STABILITY REPORT, NOVEMBER 2018
0
5
10
15
20
0
5
10
15
20
2013 2014 2015 2016 2017 2018
%%Household lendingHouse prices
Figure 1.1Annual house price and household lending growth
Source: RBNZ Bank Balance Sheet Survey (BBS), Real Estate Institute of New Zealand.
0
100
200
300
400
0
100
200
300
400
2000 2003 2006 2009 2012 2015 2018
%%AgricultureDairy
Figure 1.2Agriculture sector debt-to-income ratio
Source: RBNZ BBS, RBNZ Annual Agriculture Survey, Dairy Companies Association of New Zealand, DairyNZ, private reporting, RBNZ estimates.
household incomes to fall, as well as to sharp increases in borrowing costs. These vulnerabilities are amplified by the heightened risk of a fall in house prices. However, house price and credit growth have both eased over the past 12 months, and lending standards have improved, helping to reduce housing lending risk (figure 1.1).
Global risks to stability have increased.
As a small open economy reliant on foreign funding, New Zealand’s economy is exposed to global risks. Following a decade of low interest rates, global debt levels have built up significantly (figure 1.3), asset values have become elevated and pricing for risk is low. This leaves markets vulnerable to sudden shifts, for example if interest rates rise suddenly in advanced economies, or if there is a sharp fall in global economic growth due to an escalation in protectionist trade policies. This vulnerability is highlighted by the current elevated price volatility in equity and debt markets.
New Zealand’s vulnerability to international shocks has improved in recent years, as banks have reduced their reliance on foreign funding, but global risks have increased.
Dairy farm balance sheets remain stretched.
Indebtedness remains high in the agriculture sector, particularly for dairy farms (figure 1.2). While the sector is currently profitable, commodity prices are volatile and the sector remains vulnerable to another downturn. In addition, there are a number of longer-term challenges facing the sector, including managing the risks of climate change. It remains important for the sector as a whole to continue to repair its balance sheets, to restore resilience to a future downturn and to allow farms to invest to adapt to medium-term challenges.

4RESERVE BANK OF NEW ZEALAND / FINANCIAL STABILITY REPORT, NOVEMBER 2018
0
50
100
150
200
250
300
0
50
100
150
200
250
300
Advanced economies Emerging marketeconomies
%% 2008 2018Figure 1.3Debt-to-GDP ratios(excluding financial sector debt)
Source: Bank for International Settlements.
Policy assessment
The banking system plays an integral role in New Zealand’s financial system and economy. Given this, a high level of resilience needs to be built in to our baseline prudential settings. The Reserve Bank is currently undertaking a fundamental review of capital requirements for New Zealand incorporated banks. This will ensure that the banking system has sufficient capital to continue to operate and maintain the confidence of creditors even when subject to extreme shocks. Our preliminary view is that higher capital requirements are necessary, so that the banking system can be sufficiently resilient whilst remaining efficient.
In December, we will release a consultation paper on the remaining elements of the capital review, including the setting of minimum capital ratios and buffers. Final decisions on all components of the capital review are expected in the second quarter of 2019.
The Reserve Bank also operates macro-prudential policy to manage higher-than-normal risks arising from asset and credit cycles. The Reserve Bank introduced LVR restrictions in 2013 to address rising housing lending risk. Easy lending standards were amplifying debt and house price imbalances, and ultimately increasing the risk of a subsequent sharp housing market correction. The LVR restrictions have helped to lean against these risks by improving the quality of bank mortgage lending portfolios and reducing the number of households that are financially vulnerable. This reduces the risk that large numbers of households are forced to sell their houses or significantly reduce spending in a downturn.
House prices remain high relative to incomes and rents, and are therefore susceptible to a correction. However, momentum has waned in the housing market since early 2017 and credit growth to households has returned to more sustainable levels. Banks are also more rigorously assessing the ability of customers to service their loans. This has seen a gradual reduction in the risks that the LVR restrictions were designed to mitigate. And housing market pressures are expected to remain subdued, which will further reduce risks over time.

5RESERVE BANK OF NEW ZEALAND / FINANCIAL STABILITY REPORT, NOVEMBER 2018
Developments in financial regulation
The Government is in the process of reviewing the Reserve Bank of New Zealand Act. A first consultation paper on reforming aspects of the financial policy provisions of the Act was released at the beginning of November. The Reserve Bank welcomes the review and encourages responses to the consultation.
The Reserve Bank has made progress on a number of other regulatory initiatives, including a new regulatory regime for financial market infrastructures and new standards for mortgage bonds.
Adrian Orr
Governor
Reflecting this, the Reserve Bank will ease LVR restrictions on new mortgages. From 1 January 2019:
• Up to 20 percent (increased from 15 percent) of new mortgage loans to owner occupiers can have deposits of less than 20 percent.
• Up to 5 percent of new mortgage loans to property investors can have deposits of less than 30 percent (lowered from 35 percent).
The Reserve Bank will continue to monitor changes in housing lending risk, and will further ease LVR restrictions if risks diminish as expected over the next few years. Household credit and house price growth remaining at sustainable levels will be an important consideration, as will banks retaining prudent mortgage lending standards.
20% LOW DEPOSIT LENDING
HOMESWEETHOME
20%DEPOSIT
5% LOW DEPOSIT LENDING
HOUSES
30%DEPOSIT
TO LET
6RESERVE BANK OF NEW ZEALAND / FINANCIAL STABILITY REPORT, NOVEMBER 2018
Chapter 2The New Zealand financial system’s domestic vulnerabilitiesNew Zealand’s financial system is deeply integrated into New Zealand’s economy (see chapter 4). As a result, there are strong linkages between developments in the real economy and the performance of the financial system. A significant deterioration in the economy can threaten the resilience of the financial system. Domestic economic developments are transmitted to the financial system primarily through the sectors the financial system lends to, funds from, and insures. This chapter highlights where significant domestic vulnerabilities lie – in the household, agriculture and commercial property sectors. These vulnerabilities have declined slightly since the previous Report.
The Reserve Bank also monitors a range of other risks and vulnerabilities. Some of these reflect longer-term challenges to the economy and financial system, such as the impacts of climate change (see box A).
Household sector indebtedness
The risk to the soundness and efficiency of the financial system from high household debt has reduced since the previous Report. Household debt and house prices are now growing more in line with incomes and banks have maintained tighter mortgage lending standards. As a result, the Reserve Bank has eased its loan-to-valuation ratio (LVR) restrictions (see chapter 1).
Household stress can threaten financial stability.
The financial health of households is important for the financial system. Mortgages represent 57 percent of bank lending. Therefore the financial system is exposed to stressed households that default on their loans. It is also exposed to stressed households cutting spending and selling their homes, which can weaken the economy, reduce house prices, and increase losses on household and business lending. A resilient financial system can withstand some household stress but its soundness can be threatened if many households become stressed. The efficiency of the
7RESERVE BANK OF NEW ZEALAND / FINANCIAL STABILITY REPORT, NOVEMBER 2018
0
20
40
60
0
20
40
60
DTI>5 DTI>6 DTI>5 DTI>6
%%InvestorFirst-home buyerOther owner-occupier
By borrower typeBy regionAucklandRest of NZ
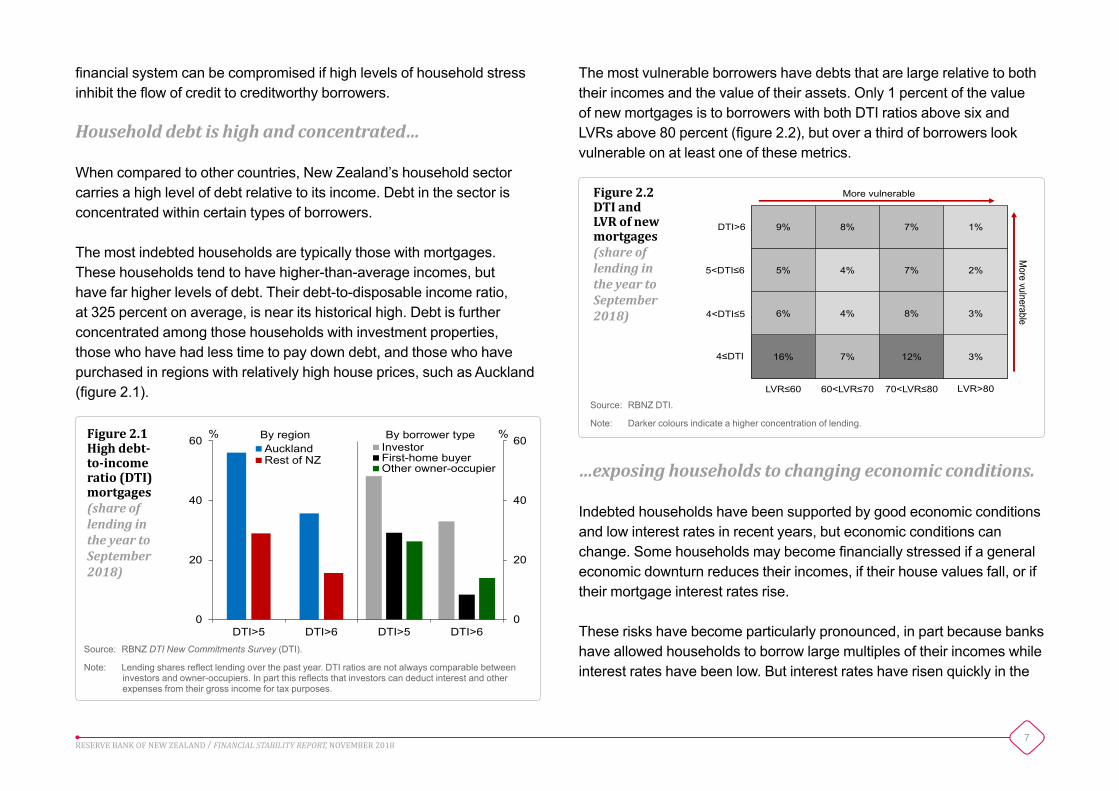
Figure 2.1High debt-to-income ratio (DTI) mortgages(share of lending in the year to September 2018)
Source: RBNZ DTI New Commitments Survey (DTI).
Note: Lending shares reflect lending over the past year. DTI ratios are not always comparable between investors and owner-occupiers. In part this reflects that investors can deduct interest and other expenses from their gross income for tax purposes.
16% 7% 12% 3%
6% 4% 8% 3%
5% 4% 7% 2%
9% 8% 7% 1%
0
1
2
3
4
0
1
2
3
4
LVR≤60 60<LVR≤70 70<LVR≤80 LVR>80
DTI>6
5<DTI≤6
4≤DTI
4<DTI≤5
More vulnerable
More vulnerable
Figure 2.2DTI and LVR of new mortgages(share of lending in the year to September 2018)
Source: RBNZ DTI.
Note: Darker colours indicate a higher concentration of lending.
financial system can be compromised if high levels of household stress inhibit the flow of credit to creditworthy borrowers.
Household debt is high and concentrated…
When compared to other countries, New Zealand’s household sector carries a high level of debt relative to its income. Debt in the sector is concentrated within certain types of borrowers.
The most indebted households are typically those with mortgages. These households tend to have higher-than-average incomes, but have far higher levels of debt. Their debt-to-disposable income ratio, at 325 percent on average, is near its historical high. Debt is further concentrated among those households with investment properties, those who have had less time to pay down debt, and those who have purchased in regions with relatively high house prices, such as Auckland (figure 2.1).
The most vulnerable borrowers have debts that are large relative to both their incomes and the value of their assets. Only 1 percent of the value of new mortgages is to borrowers with both DTI ratios above six and LVRs above 80 percent (figure 2.2), but over a third of borrowers look vulnerable on at least one of these metrics.
…exposing households to changing economic conditions.
Indebted households have been supported by good economic conditions and low interest rates in recent years, but economic conditions can change. Some households may become financially stressed if a general economic downturn reduces their incomes, if their house values fall, or if their mortgage interest rates rise.
These risks have become particularly pronounced, in part because banks have allowed households to borrow large multiples of their incomes while interest rates have been low. But interest rates have risen quickly in the
8RESERVE BANK OF NEW ZEALAND / FINANCIAL STABILITY REPORT, NOVEMBER 2018
past and, although this is not expected soon, international developments could see it happen again (see chapter 3). Reserve Bank analysis suggests that a significant number of borrowers would struggle to service their loans if mortgage rates increased to 7 percent (see box A of the May 2017 Report).1
Risk has also been exacerbated by the rapid rise in house prices since the GFC, which has left house prices stretched relative to household incomes and rents, particularly in Auckland. This has increased the likelihood that house prices will fall sharply in the future. As well as reducing the value of banks’ mortgage collateral, a large fall in house prices would likely reduce household consumption, by reducing households’ wealth and borrowing capacity, and make it harder for households to sell their houses to pay off their debts.
The Reserve Bank has leaned against the build-up of risks.
The Reserve Bank’s LVR restrictions have leaned against the build-up in risks from high household debt by increasing the amount of equity borrowers have in their homes. The restrictions have seen the proportion of outstanding mortgage debt to households with loans larger than 80 percent of the value of their houses fall from over 20 percent in 2013 to under 7 percent. This extra equity provides households with more room to avoid cutting consumption or defaulting on their loans if economic conditions deteriorate or if interest rates rise.
1 At the time around 6 percent of all loans and 9 percent of recent loans, by value, were to households that would not be able to meet their essential expenses if interest rates rose to 7 percent.
Recent borrowers are now more resilient…
Although debt levels remain concerning, the annual growth rate of household debt has slowed from 9 percent in 2016 to 6 percent in September 2018. Household debt is now growing at a more sustainable rate, broadly matching the pace of household income growth.
There are signs that households that borrowed in recent months are in a better financial position than those that borrowed in previous years (figure 2.3). Borrowers are tending to borrow less relative to their incomes, and the proportion of new mortgages that are not being repaid over time – those on ‘interest-only’ terms – has steadily declined. The share of loans going to investors is below the level seen in 2016. Investors typically pose a higher risk to the financial system than owner-occupiers, partly because they have a greater incentive to default strategically when house prices fall. Investors can also amplify undesirable swings in house prices by buying and selling as conditions change.
These changes have been partly offset by an increase in the proportion of new lending that is at high LVRs. This increase reflects the Reserve Bank relaxing LVR restrictions in January 2018, in response to signs that banks had tightened their lending standards and housing market risks had fallen.

9RESERVE BANK OF NEW ZEALAND / FINANCIAL STABILITY REPORT, NOVEMBER 2018
…partly due to an improvement in bank lending standards.
Banks have gradually strengthened their serviceability policies over the past two years. Banks are now assesing households’ ability to make loan payments against higher living costs and interest rates. In a recent exercise conducted by the Reserve Bank, banks estimated the amount they would be willing to lend to a range of hypothetical borrowers. The results suggest that banks are willing to lend less to the same set of borrowers, relative to their incomes, than they were in 2014 (figure 2.4).
Despite the easing of LVR restrictions at the beginning of 2018, banks have tended to maintain or tighten their serviceability standards. Banks are expected to maintain their serviceability standards, but household sector risks, and banks’ exposure to those risks, could quickly resurge if serviceability standards were to ease.
Housing market risks have fallen slightly…
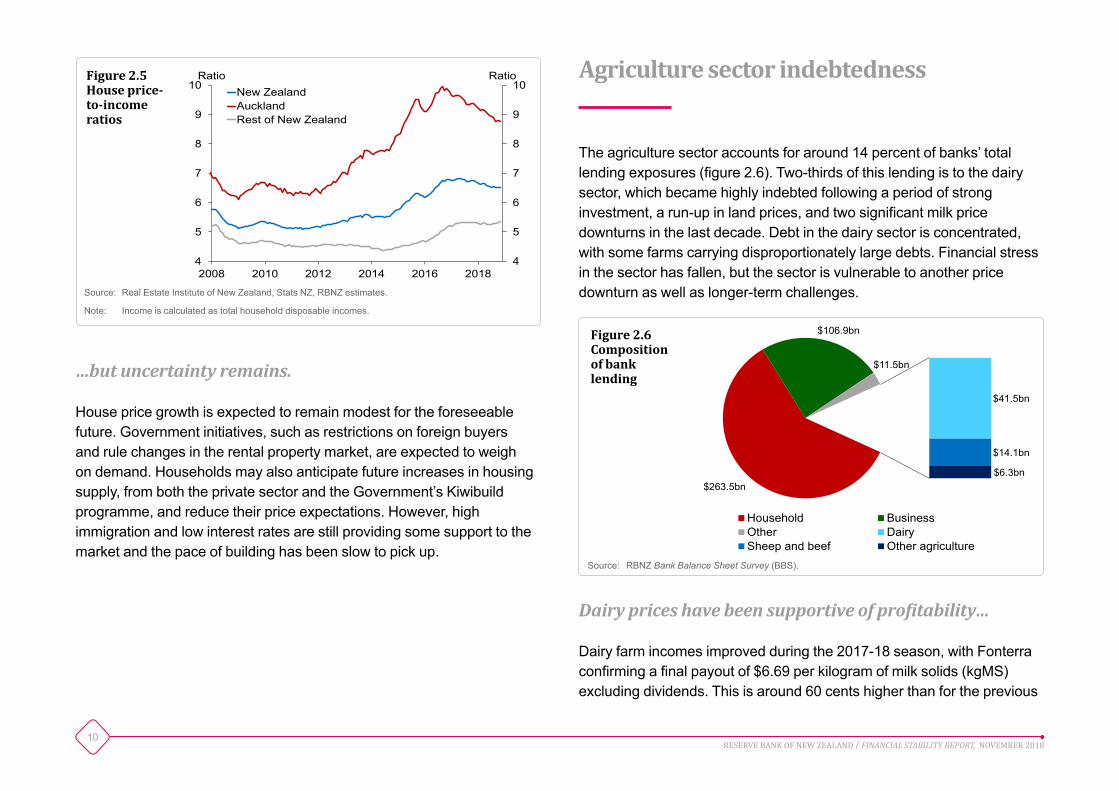
International evidence suggests that sharp housing corrections often follow a period of rapid house price and credit growth. House price growth has slowed significantly over the past two years. In particular, house prices in Auckland are still around their late 2016 level. In combination with slowing housing credit growth, this suggests the risk of an eventual hard landing in the housing market is falling. Nevertheless, it is concerning that house prices remain high relative to incomes and rents (figure 2.5). A prolonged period of low house-price growth would allow this imbalance to gradually reduce, further reducing the risk of a hard landing.
0
10
20
30
40
50
0
10
20
30
40
50
Interest only Investor High LVR DTI>5
%% Sep-16 Sep-17 Sep-18Figure 2.3Risk characteristics of new mortgages(share of lending, 3-month average)
Source: RBNZ LVR New Commitments Survey, RBNZ DTI, private reporting.
Note: ‘High LVR’ is the proportion of owner-occupier mortgage loans with LVRs above 80 percent and investment mortgage loans with LVRs above 65 percent.
0
2
4
6
8
10
0
2
4
6
8
10
Owner-occupier Investor
RatioRatio201420172018
Figure 2.4Maximum loan amount by borrower type(ratio to borrower gross income)
Source: Private reporting.
Note: The maximum borrowing amount is based on the average of the maximum amount these banks stated that they would lend to a hypothetical owner-occupier and a hypothetical investor, weighted by the asset size of each bank. See chart datapack.
10RESERVE BANK OF NEW ZEALAND / FINANCIAL STABILITY REPORT, NOVEMBER 2018
4
5
6
7
8
9
10
4
5
6
7
8
9
10
2008 2010 2012 2014 2016 2018
RatioRatioNew ZealandAucklandRest of New Zealand
Figure 2.5House price-to-income ratios
Source: Real Estate Institute of New Zealand, Stats NZ, RBNZ estimates.
Note: Income is calculated as total household disposable incomes.
$263.5bn
$106.9bn
$11.5bn
$41.5bn
$14.1bn
$6.3bn
Household BusinessOther DairySheep and beef Other agriculture
Figure 2.6Composition of bank lending
Source: RBNZ Bank Balance Sheet Survey (BBS).
…but uncertainty remains.
House price growth is expected to remain modest for the foreseeable future. Government initiatives, such as restrictions on foreign buyers and rule changes in the rental property market, are expected to weigh on demand. Households may also anticipate future increases in housing supply, from both the private sector and the Government’s Kiwibuild programme, and reduce their price expectations. However, high immigration and low interest rates are still providing some support to the market and the pace of building has been slow to pick up.
Agriculture sector indebtedness
The agriculture sector accounts for around 14 percent of banks’ total lending exposures (figure 2.6). Two-thirds of this lending is to the dairy sector, which became highly indebted following a period of strong investment, a run-up in land prices, and two significant milk price downturns in the last decade. Debt in the dairy sector is concentrated, with some farms carrying disproportionately large debts. Financial stress in the sector has fallen, but the sector is vulnerable to another price downturn as well as longer-term challenges.
Dairy prices have been supportive of profitability…
Dairy farm incomes improved during the 2017-18 season, with Fonterra confirming a final payout of $6.69 per kilogram of milk solids (kgMS) excluding dividends. This is around 60 cents higher than for the previous
11RESERVE BANK OF NEW ZEALAND / FINANCIAL STABILITY REPORT, NOVEMBER 2018
0
10
20
30
40
2009 2012 2015 2018
%WatchlistClosely monitoredPotentially stressed
0
2
4
6
8
2009 2012 2015 2018
%
Non-performing
Figure 2.8Dairy sector loan performance metrics(% of dairy lending)
Source: RBNZ BBS, private reporting.
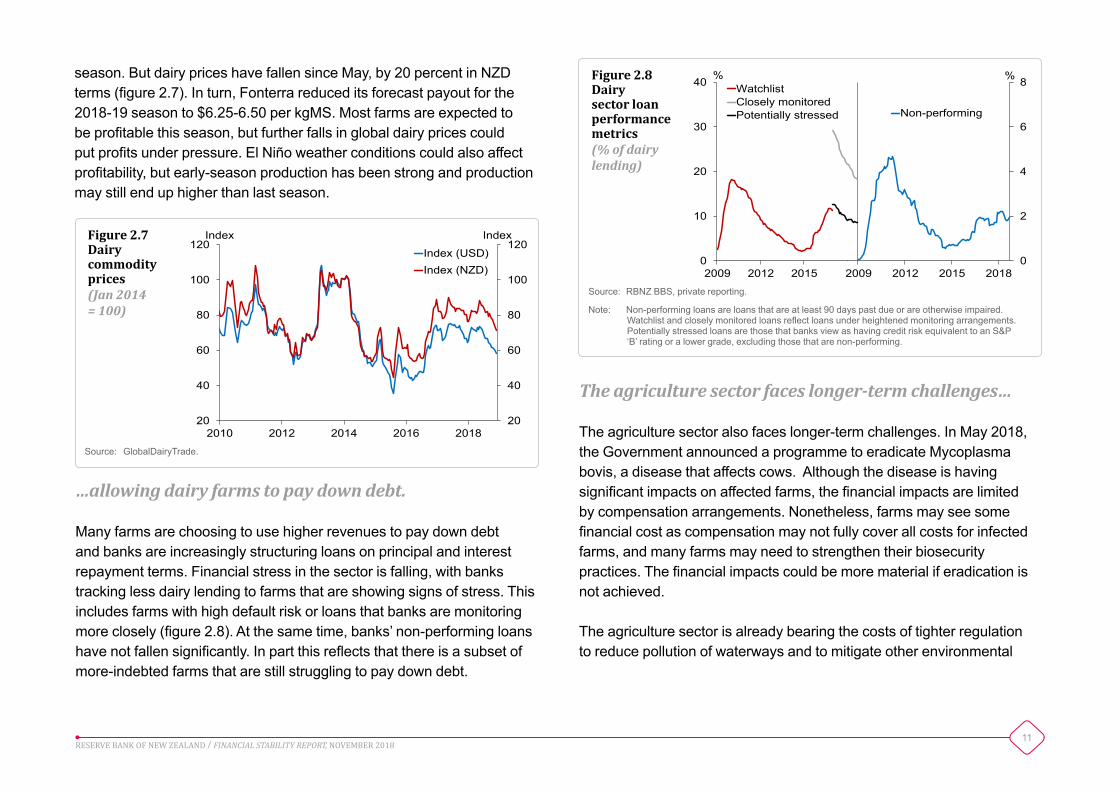
Note: Non-performing loans are loans that are at least 90 days past due or are otherwise impaired. Watchlist and closely monitored loans reflect loans under heightened monitoring arrangements. Potentially stressed loans are those that banks view as having credit risk equivalent to an S&P ‘B’ rating or a lower grade, excluding those that are non-performing.
The agriculture sector faces longer-term challenges…
The agriculture sector also faces longer-term challenges. In May 2018, the Government announced a programme to eradicate Mycoplasma bovis, a disease that affects cows. Although the disease is having significant impacts on affected farms, the financial impacts are limited by compensation arrangements. Nonetheless, farms may see some financial cost as compensation may not fully cover all costs for infected farms, and many farms may need to strengthen their biosecurity practices. The financial impacts could be more material if eradication is not achieved.
The agriculture sector is already bearing the costs of tighter regulation to reduce pollution of waterways and to mitigate other environmental
20
40
60
80
100
120
20
40
60
80
100
120
2010 2012 2014 2016 2018
IndexIndexIndex (USD)Index (NZD)
Figure 2.7Dairy commodity prices(Jan 2014 = 100)
Source: GlobalDairyTrade.
season. But dairy prices have fallen since May, by 20 percent in NZD terms (figure 2.7). In turn, Fonterra reduced its forecast payout for the 2018-19 season to $6.25-6.50 per kgMS. Most farms are expected to be profitable this season, but further falls in global dairy prices could put profits under pressure. El Niño weather conditions could also affect profitability, but early-season production has been strong and production may still end up higher than last season.
…allowing dairy farms to pay down debt.
Many farms are choosing to use higher revenues to pay down debt and banks are increasingly structuring loans on principal and interest repayment terms. Financial stress in the sector is falling, with banks tracking less dairy lending to farms that are showing signs of stress. This includes farms with high default risk or loans that banks are monitoring more closely (figure 2.8). At the same time, banks’ non-performing loans have not fallen significantly. In part this reflects that there is a subset of more-indebted farms that are still struggling to pay down debt.
12RESERVE BANK OF NEW ZEALAND / FINANCIAL STABILITY REPORT, NOVEMBER 2018
concerns. In the longer term, the sector will also face the consequences of climate change (see box A).
…and farms need to be ready to adapt.
It is important that the agriculture sector is ready to respond and adapt to the challenges ahead, as well as the opportunities that change may create. The sector’s debt levels limit its capacity to withstand market downturns and invest to adapt over the longer term. Hence, it is encouraging that many dairy farms are paying down debt. Banks have a role to play in ensuring that their lending decisions reflect relevant risks, including longer-term risks. Where prudent, banks may need to fund investments that farms must make to improve sustainability. Some banks are already offering loan products for environmental compliance.
Banks are diversifying their agriculture lending.
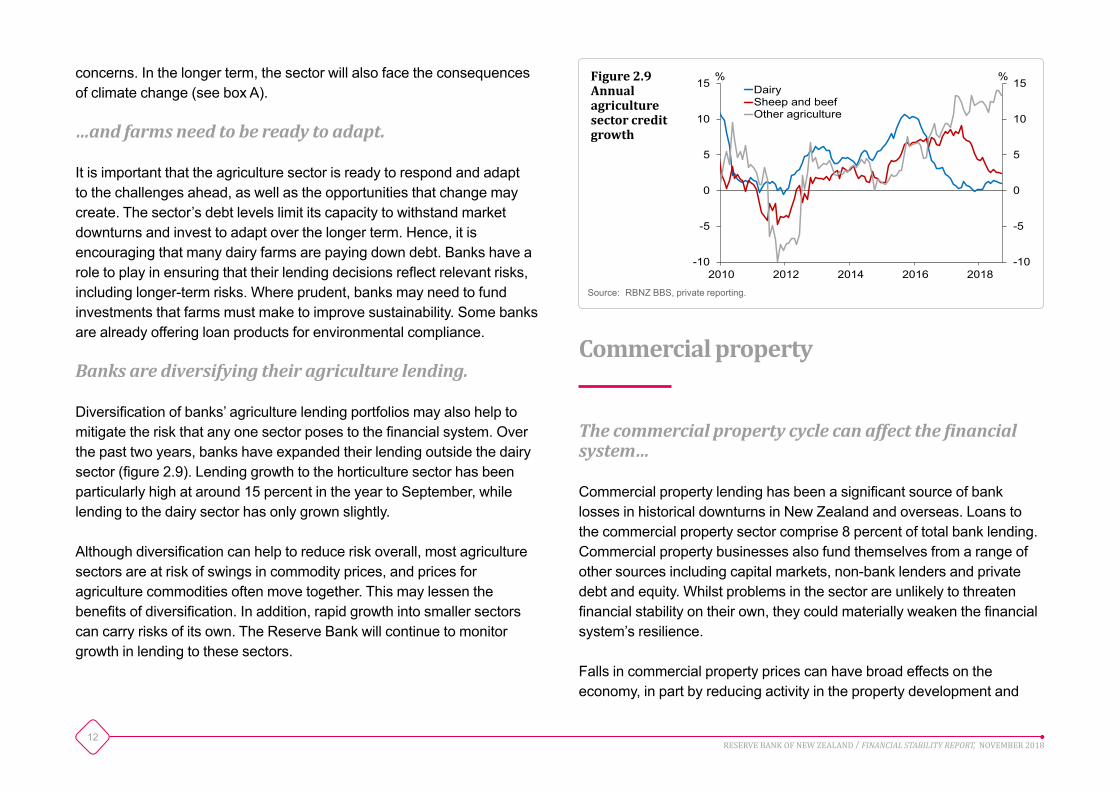
Diversification of banks’ agriculture lending portfolios may also help to mitigate the risk that any one sector poses to the financial system. Over the past two years, banks have expanded their lending outside the dairy sector (figure 2.9). Lending growth to the horticulture sector has been particularly high at around 15 percent in the year to September, while lending to the dairy sector has only grown slightly.
Although diversification can help to reduce risk overall, most agriculture sectors are at risk of swings in commodity prices, and prices for agriculture commodities often move together. This may lessen the benefits of diversification. In addition, rapid growth into smaller sectors can carry risks of its own. The Reserve Bank will continue to monitor growth in lending to these sectors.
Commercial property
The commercial property cycle can affect the financial system…
Commercial property lending has been a significant source of bank losses in historical downturns in New Zealand and overseas. Loans to the commercial property sector comprise 8 percent of total bank lending. Commercial property businesses also fund themselves from a range of other sources including capital markets, non-bank lenders and private debt and equity. Whilst problems in the sector are unlikely to threaten financial stability on their own, they could materially weaken the financial system’s resilience.
Falls in commercial property prices can have broad effects on the economy, in part by reducing activity in the property development and
-10
-5
0
5
10
15
-10
-5
0
5
10
15
2010 2012 2014 2016 2018
%%DairySheep and beefOther agriculture
Figure 2.9Annual agriculture sector credit growth
Source: RBNZ BBS, private reporting.
13RESERVE BANK OF NEW ZEALAND / FINANCIAL STABILITY REPORT, NOVEMBER 2018
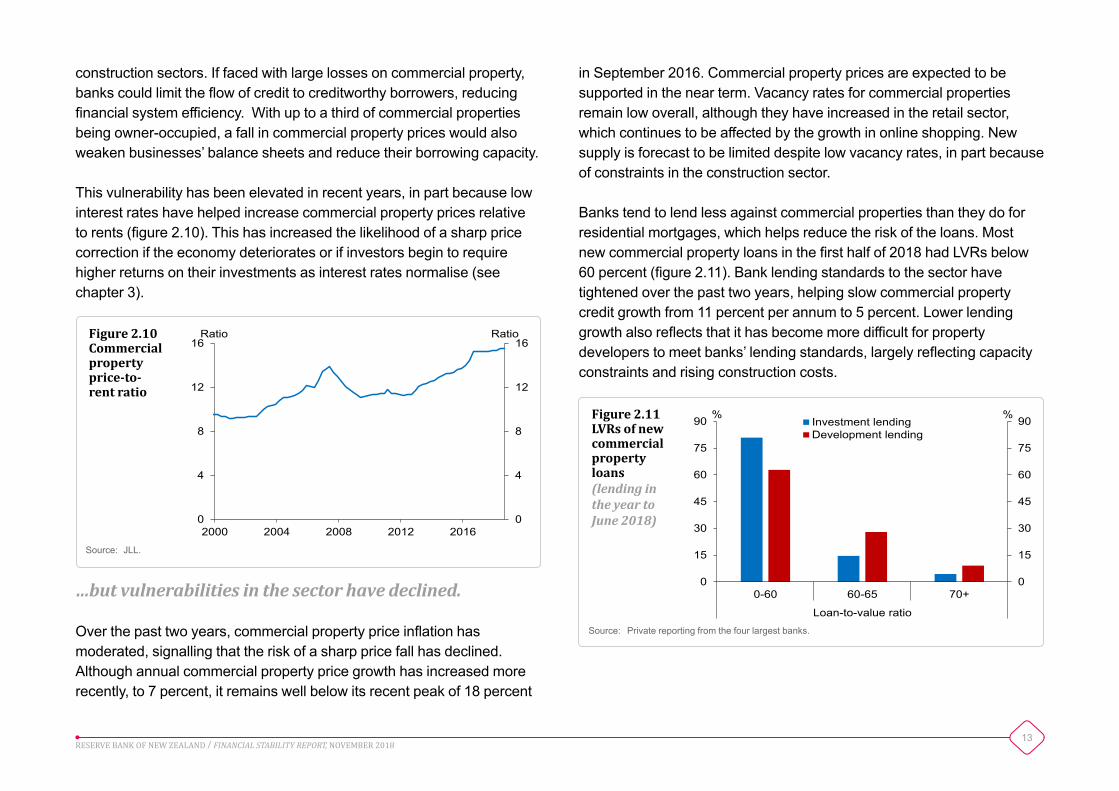
in September 2016. Commercial property prices are expected to be supported in the near term. Vacancy rates for commercial properties remain low overall, although they have increased in the retail sector, which continues to be affected by the growth in online shopping. New supply is forecast to be limited despite low vacancy rates, in part because of constraints in the construction sector.
Banks tend to lend less against commercial properties than they do for residential mortgages, which helps reduce the risk of the loans. Most new commercial property loans in the first half of 2018 had LVRs below 60 percent (figure 2.11). Bank lending standards to the sector have tightened over the past two years, helping slow commercial property credit growth from 11 percent per annum to 5 percent. Lower lending growth also reflects that it has become more difficult for property developers to meet banks’ lending standards, largely reflecting capacity constraints and rising construction costs.
construction sectors. If faced with large losses on commercial property, banks could limit the flow of credit to creditworthy borrowers, reducing financial system efficiency. With up to a third of commercial properties being owner-occupied, a fall in commercial property prices would also weaken businesses’ balance sheets and reduce their borrowing capacity.
This vulnerability has been elevated in recent years, in part because low interest rates have helped increase commercial property prices relative to rents (figure 2.10). This has increased the likelihood of a sharp price correction if the economy deteriorates or if investors begin to require higher returns on their investments as interest rates normalise (see chapter 3).
0
4
8
12
16
0
4
8
12
16
2000 2004 2008 2012 2016
RatioRatioFigure 2.10Commercial property price-to-rent ratio
Source: JLL.
0
15
30
45
60
75
90
0
15
30
45
60
75
90
0-60 60-65 70+
Loan-to-value ratio
%%Investment lendingDevelopment lending
Figure 2.11LVRs of new commercial property loans (lending in the year to June 2018)
Source: Private reporting from the four largest banks.
…but vulnerabilities in the sector have declined.
Over the past two years, commercial property price inflation has moderated, signalling that the risk of a sharp price fall has declined. Although annual commercial property price growth has increased more recently, to 7 percent, it remains well below its recent peak of 18 percent
14RESERVE BANK OF NEW ZEALAND / FINANCIAL STABILITY REPORT, NOVEMBER 2018
Box A
The impact of climate change on New Zealand’s financial system
Climate change will have a significant effect on New Zealand’s economy and financial system. The Reserve Bank has a strong interest in climate change, as understanding, quantifying and managing risk is critical to many of its core functions, including promoting a sound and efficient financial system.
Climate change has physical and transitional impacts…
New Zealand’s financial system is primarily exposed to climate risks through the sectors that it lends to and insures. The financial system will be affected by both the physical and transitional impacts of climate change. The physical impacts of climate change will pose risks through damage to property, changing property values, and disruptions to supply chains. The transitional impacts, which reflect the shift of New Zealand and other countries to lower-carbon economies, may pose risks through the impact of regulatory changes, technological advances and changes in consumer and investor preferences. There is also potential for significant liability risks to emerge.
…including on the agriculture and property sectors.
Managing exposures to assets linked to primary industries will be a major global challenge. For many countries, emissions from fossil fuels and the energy sector will be the key areas of focus. But for New Zealand, it will likely be the agriculture sector, which accounts for around half of our emissions.
The physical risks for the agriculture sector are not expected to be material in aggregate. However, regional impacts will vary, and increased volatility in weather patterns may impact farm costs and production. It is important that banks’ lending decisions account for farm-specific exposures to these climate risks.
Transition risk is likely to be more significant for the agriculture sector. The treatment of the sector in policies to reduce emissions remains unclear, but it seems inevitable that some of the burden will fall on it. It is in the interests of farms and lenders that this uncertainty be removed and that any new rules are implemented through clear and prudent transitional arrangements. Risks to the financial system are likely to increase if changes are implemented too quickly or delayed to the point that sudden, more material, changes are required to meet New Zealand’s international commitments.
The financial system is also exposed to the effects of climate change on property. Coastal property is likely to be the most affected, as rising sea levels may result in some properties being lost to the sea entirely. However, more frequent extreme weather events could see broader impacts on properties across the country.
Insurers and banks need to reflect climate risks in their decisions…
Property insurance penetration is high in New Zealand, so these risks may crystallise in the insurance sector. However, most property insurance contracts are negotiated annually, allowing insurers to re-assess risk and adjust policy terms each year. Some insurers in New Zealand appear to have begun adjusting their products and pricing to reflect emerging climate risks, and some existing properties could ultimately become uninsurable. Whilst this supports the efficiency and
15RESERVE BANK OF NEW ZEALAND / FINANCIAL STABILITY REPORT, NOVEMBER 2018
stability of the insurance sector, it poses challenges for property owners and lenders.
An increase in the cost of insurance or a reduction in its availability may reduce the value of affected assets. In the first instance, this represents a cost to the owners of the assets. But these costs will also translate into higher risks for lenders if the value of loan collateral falls or underinsured borrowers suffer losses.
More generally, lenders protect against the risk of losses on loans by assessing the value of property security, assessing the capacity of borrowers to service their loans, and requiring ongoing insurance coverage in loan contracts. To work effectively it is essential that these processes are calibrated to longer-term risks, including climate change. This may mean placing less reliance on backward-looking valuation models, strengthening serviceability tests to incorporate the potential future variations in insurance costs, and investing in systems to monitor ongoing insurance coverage and exposure to physical risks.
The Reserve Bank will engage further with banks and insurers to understand how they are incorporating these and other climate-related risks within their businesses.
…but a broader response will be required.
No single institution working alone can achieve any meaningful progress on a global issue like climate change. Within New Zealand, action will be required from a range of parties to ensure that the financial system remains sound and efficient in the long term:
• Financial sector participants have a critical role in assessing their own current and future exposures, ensuring the appropriate
allocation of financial resources through robust lending standards and insurance underwriting policies, and providing the necessary finance for mitigation actions.
• The Reserve Bank has an important role in monitoring climate risks across the system and incorporating them within regulatory frameworks, driving appropriate disclosure to help market participants assess climate-related exposures, and addressing any barriers to the development of green finance.
• Government has a vital role in driving the transition to a low-carbon economy and in alleviating uncertainty by developing robust and durable frameworks that can be analysed and priced by market participants.
Whilst it is not possible to predict future climatic developments with certainty, it is essential that all sectors of the economy work within a coherent national strategy on climate change. Decisions about future investment and development should factor in long-term climate risks. Decision-makers should take responsibility for the risks that they are building today, such as by avoiding building infrastructure in vulnerable locations where not essential.
The Reserve Bank is developing its own climate change strategy. The strategy focuses on ensuring that climate risks are appropriately incorporated within the Reserve Bank’s mandate. The Reserve Bank also stands ready to collaborate with industry and government to help position New Zealand for the challenges ahead.
16RESERVE BANK OF NEW ZEALAND / FINANCIAL STABILITY REPORT, NOVEMBER 2018
Chapter 3The New Zealand financial system’s international vulnerabilities
0
100
200
300
400
500
0
20
40
60
80
100
2006 2008 2010 2012 2014 2016 2018
bpsIndex
Uncertainty indicator – VIXOffshore funding spread (RHS)
Figure 3.1Offshore funding costs and market uncertainty(30-day moving average)
Source: Bloomberg.
Note: The offshore funding spread is the cost of an AA-rated financial institution issuing a 5-year bond in the US relative to the 5-year US swap rate, accounting for the cost of swapping into NZD. The VIX index is an indicator of the market’s expectation of the 30-day volatility in the S&P 500 equity index.
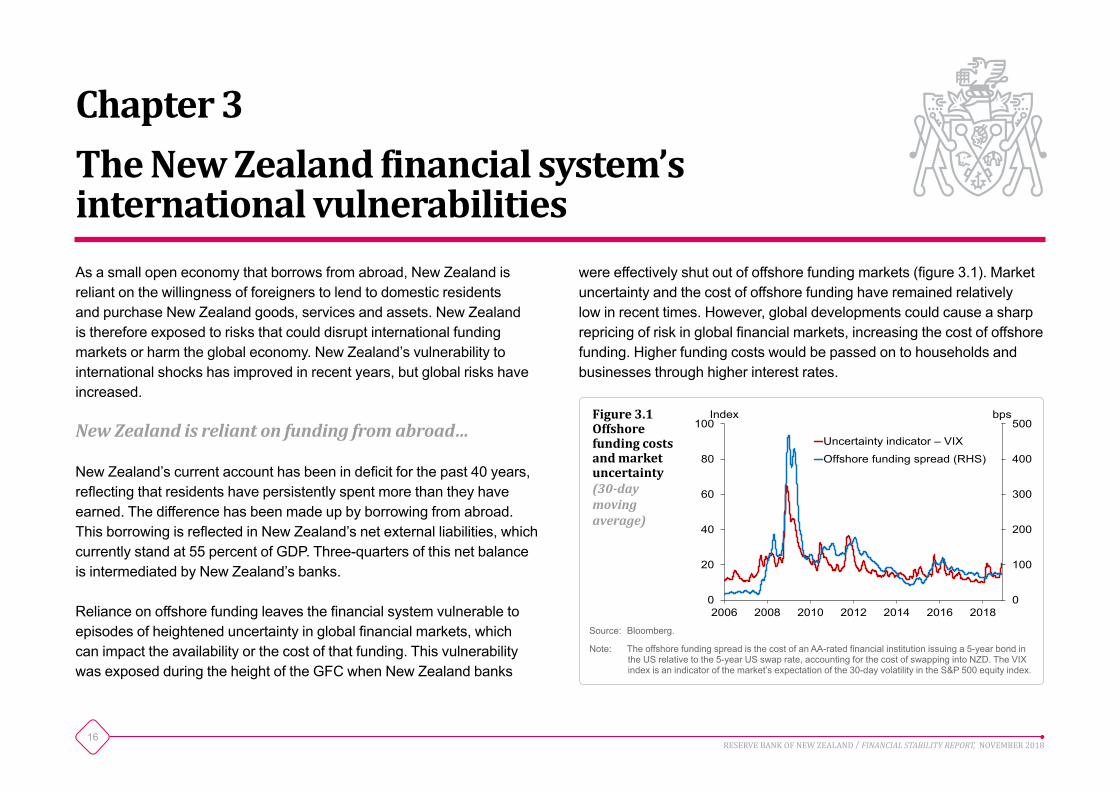
As a small open economy that borrows from abroad, New Zealand is reliant on the willingness of foreigners to lend to domestic residents and purchase New Zealand goods, services and assets. New Zealand is therefore exposed to risks that could disrupt international funding markets or harm the global economy. New Zealand’s vulnerability to international shocks has improved in recent years, but global risks have increased.
New Zealand is reliant on funding from abroad…
New Zealand’s current account has been in deficit for the past 40 years, reflecting that residents have persistently spent more than they have earned. The difference has been made up by borrowing from abroad. This borrowing is reflected in New Zealand’s net external liabilities, which currently stand at 55 percent of GDP. Three-quarters of this net balance is intermediated by New Zealand’s banks.
Reliance on offshore funding leaves the financial system vulnerable to episodes of heightened uncertainty in global financial markets, which can impact the availability or the cost of that funding. This vulnerability was exposed during the height of the GFC when New Zealand banks
were effectively shut out of offshore funding markets (figure 3.1). Market uncertainty and the cost of offshore funding have remained relatively low in recent times. However, global developments could cause a sharp repricing of risk in global financial markets, increasing the cost of offshore funding. Higher funding costs would be passed on to households and businesses through higher interest rates.
17RESERVE BANK OF NEW ZEALAND / FINANCIAL STABILITY REPORT, NOVEMBER 2018
While New Zealand’s offshore borrowing is high by international standards, around 90 percent of it is hedged against exchange rate movements. These hedging arrangements do not eliminate all currency risk.1 However, they allow a depreciating New Zealand dollar to act as a buffer to the real economy, in part by avoiding the sharp increase in New Zealand’s debt servicing burden that would otherwise occur.
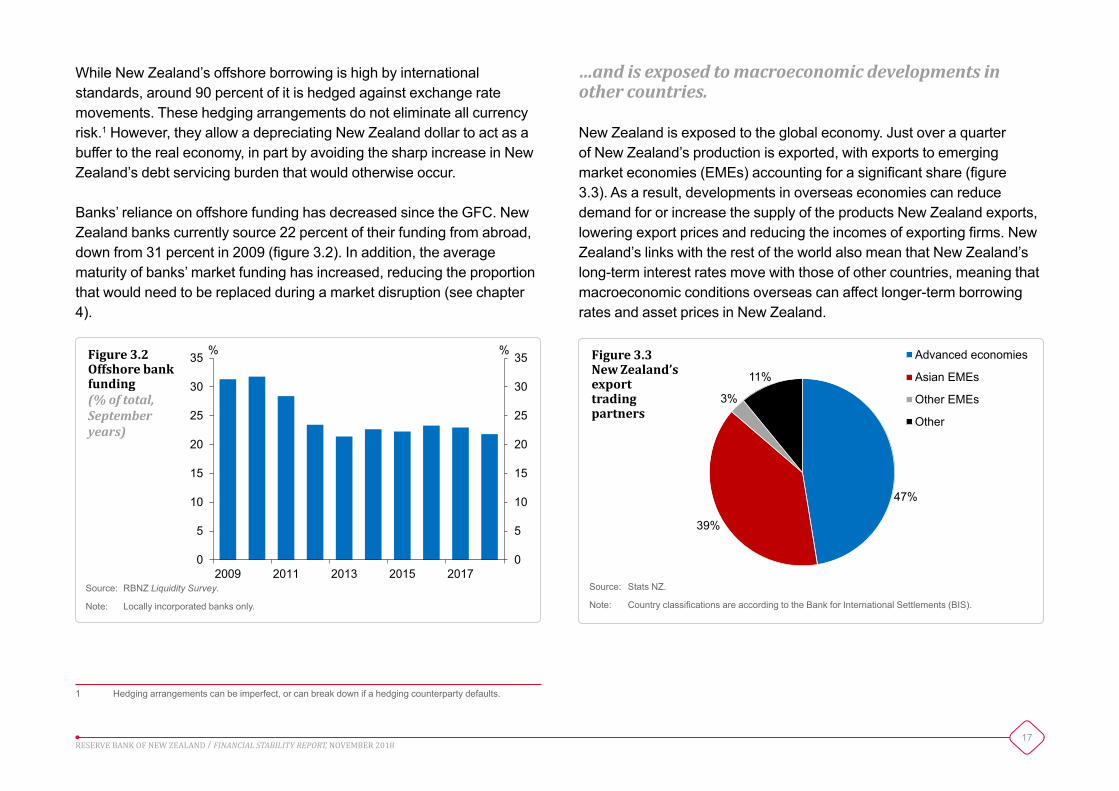
Banks’ reliance on offshore funding has decreased since the GFC. New Zealand banks currently source 22 percent of their funding from abroad, down from 31 percent in 2009 (figure 3.2). In addition, the average maturity of banks’ market funding has increased, reducing the proportion that would need to be replaced during a market disruption (see chapter 4).
1 Hedging arrangements can be imperfect, or can break down if a hedging counterparty defaults.
0
5
10
15
20
25
30
35
0
5
10
15
20
25
30
35
2009 2011 2013 2015 2017
%%Figure 3.2Offshore bank funding (% of total, September years)
Source: RBNZ Liquidity Survey.
Note: Locally incorporated banks only.
…and is exposed to macroeconomic developments in other countries.
New Zealand is exposed to the global economy. Just over a quarter of New Zealand’s production is exported, with exports to emerging market economies (EMEs) accounting for a significant share (figure 3.3). As a result, developments in overseas economies can reduce demand for or increase the supply of the products New Zealand exports, lowering export prices and reducing the incomes of exporting firms. New Zealand’s links with the rest of the world also mean that New Zealand’s long-term interest rates move with those of other countries, meaning that macroeconomic conditions overseas can affect longer-term borrowing rates and asset prices in New Zealand.
47%
39%
3%
11%
Advanced economies
Asian EMEs
Other EMEs
Other
Figure 3.3New Zealand’s export trading partners
Source: Stats NZ.
Note: Country classifications are according to the Bank for International Settlements (BIS).

18RESERVE BANK OF NEW ZEALAND / FINANCIAL STABILITY REPORT, NOVEMBER 2018
0
5
10
15
20
25
30
0
5
10
15
20
25
30
2000 2003 2006 2009 2012 2015 2018
pptspptsUSEMEsEurope
Figure 3.4Credit spreads on high-yield corporate bonds
Source: ICE Benchmark Administration.
Note: See chart datapack.
International risks
The global economy is vulnerable to a negative shock.
Risk-free interest rates have been low in many countries for the past decade. Prices for a broad range of assets are now elevated, because interest rates are central to their valuations. Compensation for risk is low, as investors have become more willing to hold riskier assets in a search for higher returns. This is evident in the low levels of corporate bond spreads (figure 3.4).
Low interest rates have also contributed to global indebtedness. Global non-financial sector debt as a percentage of GDP has risen from 179 percent to 219 percent over the past decade, with rising corporate debt
in EMEs contributing significantly to this increase (figure 1.3). Debt has also increased in some advanced economies, and borrowing by highly-leveraged corporates has been growing.
High indebtedness and asset prices leave the global financial system vulnerable to unexpected negative developments. There is a range of possible shocks that could lead to a repricing of risk in global financial markets, causing asset prices to fall and debt servicing costs to rise. Such global disturbances can transmit to New Zealand through higher funding costs for New Zealand banks, higher risk premiums on risky assets and reduced trade.
Volatility in financial markets has picked up since the start of the year, with global equity markets falling significantly in February and October. While this has only been reflected in a modest increase in banks’ offshore funding costs, these events demonstrate the global financial system’s vulnerability to shocks, and an accompanying repricing of risk.
Some central banks are continuing to tighten monetary policy…
Global growth is expected to remain strong and inflation pressures have been rising in some advanced economies. In response, some major central banks have raised policy rates in recent months (figure 3.5). The US Federal Reserve is expected to further increase interest rates in the coming year. Central banks are likely to signal clearly the timing and pace of future policy rate increases. But given that the level of stimulus being removed is unprecedented, there remains a risk of a disorderly reaction in global asset markets. Investors adjusting their expectations for monetary policy is likely to have been one factor behind the higher volatility in equity and bond markets since the beginning of 2018.
19RESERVE BANK OF NEW ZEALAND / FINANCIAL STABILITY REPORT, NOVEMBER 2018
-1
0
1
2
3
4
5
-1
0
1
2
3
4
5
2013 2014 2015 2016 2017 2018 2019
%% United Kingdom Euro areaNew Zealand AustraliaUnited States
Figure 3.5Expectations for monetary policy
Source: Bloomberg, ANZ.
Note: Expectations are based on prices of financial instruments, and do not take into account term premium effects.
0 10 20 30 40
ChinaIndia
KoreaBrazil
South AfricaMalaysia
RussiaSaudi Arabia
IndonesiaMexico
ArgentinaChile
Turkey
%
US dollarEuroYen
Figure 3.6Foreign currency debt for selected EMEs(% of GDP)
Source: BIS.
Note: Foreign currency debt comprises US dollar-, euro-, and yen-denominated debt.
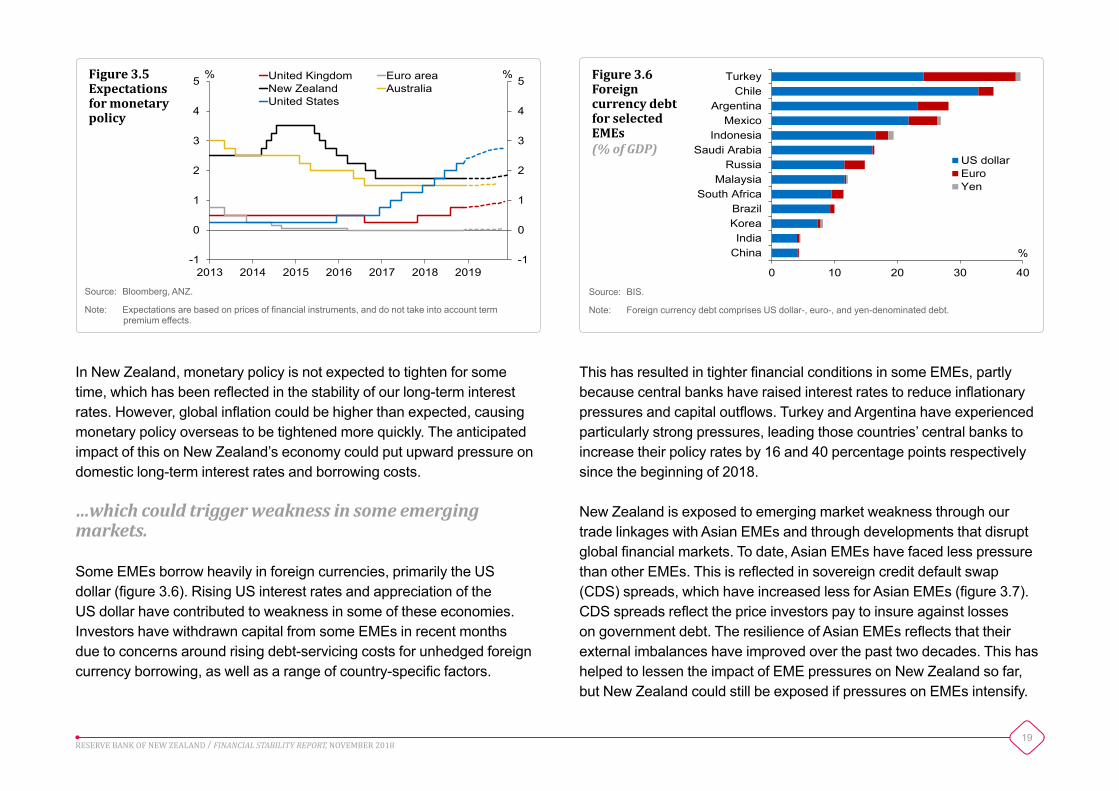
In New Zealand, monetary policy is not expected to tighten for some time, which has been reflected in the stability of our long-term interest rates. However, global inflation could be higher than expected, causing monetary policy overseas to be tightened more quickly. The anticipated impact of this on New Zealand’s economy could put upward pressure on domestic long-term interest rates and borrowing costs.
…which could trigger weakness in some emerging markets.
Some EMEs borrow heavily in foreign currencies, primarily the US dollar (figure 3.6). Rising US interest rates and appreciation of the US dollar have contributed to weakness in some of these economies. Investors have withdrawn capital from some EMEs in recent months due to concerns around rising debt-servicing costs for unhedged foreign currency borrowing, as well as a range of country-specific factors.
This has resulted in tighter financial conditions in some EMEs, partly because central banks have raised interest rates to reduce inflationary pressures and capital outflows. Turkey and Argentina have experienced particularly strong pressures, leading those countries’ central banks to increase their policy rates by 16 and 40 percentage points respectively since the beginning of 2018.
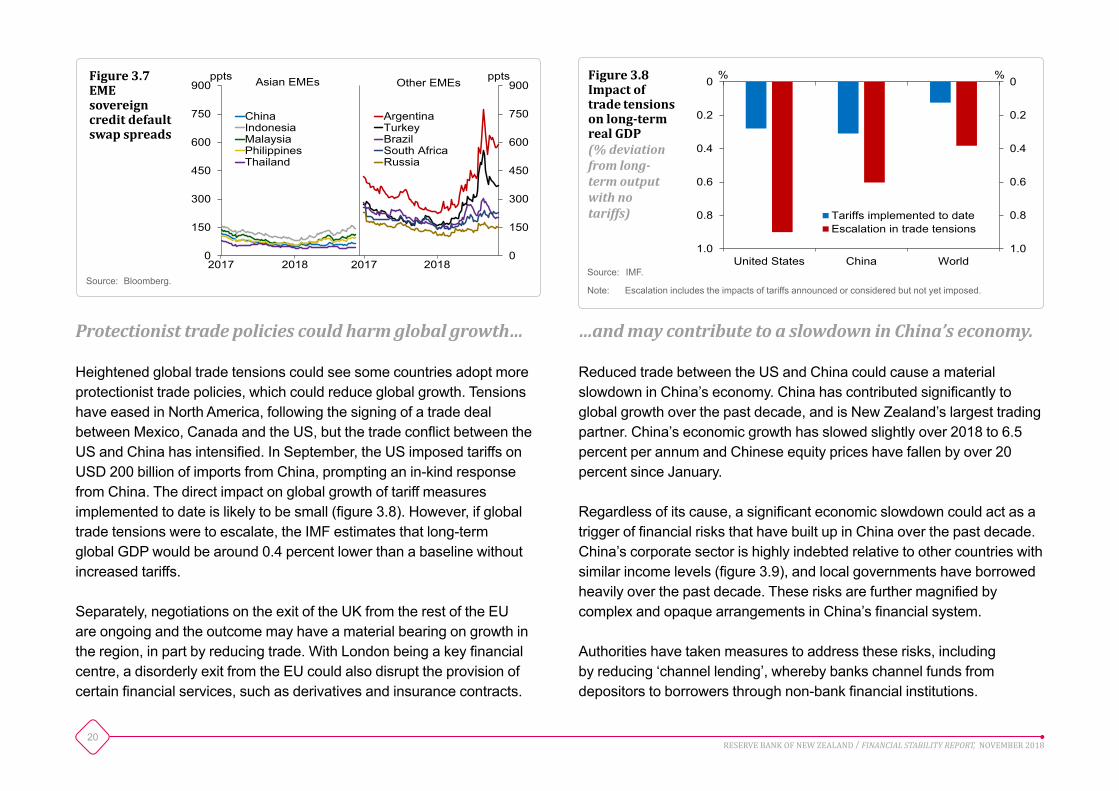
New Zealand is exposed to emerging market weakness through our trade linkages with Asian EMEs and through developments that disrupt global financial markets. To date, Asian EMEs have faced less pressure than other EMEs. This is reflected in sovereign credit default swap (CDS) spreads, which have increased less for Asian EMEs (figure 3.7). CDS spreads reflect the price investors pay to insure against losses on government debt. The resilience of Asian EMEs reflects that their external imbalances have improved over the past two decades. This has helped to lessen the impact of EME pressures on New Zealand so far, but New Zealand could still be exposed if pressures on EMEs intensify.
20RESERVE BANK OF NEW ZEALAND / FINANCIAL STABILITY REPORT, NOVEMBER 2018
0
150
300
450
600
750
900
0
150
300
450
600
750
900pptsppts
China ArgentinaIndonesia TurkeyMalaysia BrazilPhilippines South AfricaThailand Russia
2017 2018 2017 2018
Asian EMEs Other EMEsFigure 3.7EME sovereign credit default swap spreads
Source: Bloomberg.
United States China World1.0
0.8
0.6
0.4
0.2
0
1.0
0.8
0.6
0.4
0.2
0 %%
Tariffs implemented to dateEscalation in trade tensions
Figure 3.8 Impact of trade tensions on long-term real GDP(% deviation from long-term output with no tariffs)
Protectionist trade policies could harm global growth…
Heightened global trade tensions could see some countries adopt more protectionist trade policies, which could reduce global growth. Tensions have eased in North America, following the signing of a trade deal between Mexico, Canada and the US, but the trade conflict between the US and China has intensified. In September, the US imposed tariffs on USD 200 billion of imports from China, prompting an in-kind response from China. The direct impact on global growth of tariff measures implemented to date is likely to be small (figure 3.8). However, if global trade tensions were to escalate, the IMF estimates that long-term global GDP would be around 0.4 percent lower than a baseline without increased tariffs.
Separately, negotiations on the exit of the UK from the rest of the EU are ongoing and the outcome may have a material bearing on growth in the region, in part by reducing trade. With London being a key financial centre, a disorderly exit from the EU could also disrupt the provision of certain financial services, such as derivatives and insurance contracts.
…and may contribute to a slowdown in China’s economy.
Reduced trade between the US and China could cause a material slowdown in China’s economy. China has contributed significantly to global growth over the past decade, and is New Zealand’s largest trading partner. China’s economic growth has slowed slightly over 2018 to 6.5 percent per annum and Chinese equity prices have fallen by over 20 percent since January.
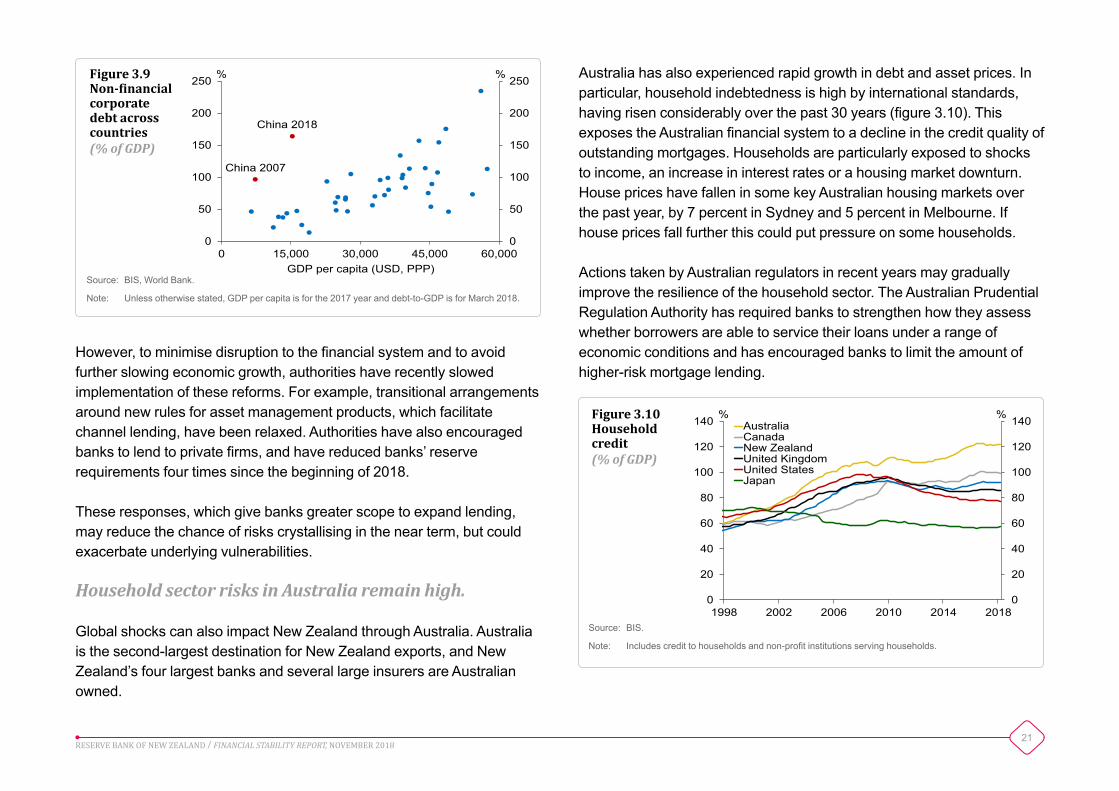
Regardless of its cause, a significant economic slowdown could act as a trigger of financial risks that have built up in China over the past decade. China’s corporate sector is highly indebted relative to other countries with similar income levels (figure 3.9), and local governments have borrowed heavily over the past decade. These risks are further magnified by complex and opaque arrangements in China’s financial system.
Authorities have taken measures to address these risks, including by reducing ‘channel lending’, whereby banks channel funds from depositors to borrowers through non-bank financial institutions.
Source: IMF.
Note: Escalation includes the impacts of tariffs announced or considered but not yet imposed.
21RESERVE BANK OF NEW ZEALAND / FINANCIAL STABILITY REPORT, NOVEMBER 2018
Australia has also experienced rapid growth in debt and asset prices. In particular, household indebtedness is high by international standards, having risen considerably over the past 30 years (figure 3.10). This exposes the Australian financial system to a decline in the credit quality of outstanding mortgages. Households are particularly exposed to shocks to income, an increase in interest rates or a housing market downturn. House prices have fallen in some key Australian housing markets over the past year, by 7 percent in Sydney and 5 percent in Melbourne. If house prices fall further this could put pressure on some households.
Actions taken by Australian regulators in recent years may gradually improve the resilience of the household sector. The Australian Prudential Regulation Authority has required banks to strengthen how they assess whether borrowers are able to service their loans under a range of economic conditions and has encouraged banks to limit the amount of higher-risk mortgage lending.
0
50
100
150
200
250
0
50
100
150
200
250
0 15,000 30,000 45,000 60,000
%%
GDP per capita (USD, PPP)
China 2018
China 2007
Figure 3.9Non-financial corporate debt across countries(% of GDP)
Source: BIS, World Bank.
Note: Unless otherwise stated, GDP per capita is for the 2017 year and debt-to-GDP is for March 2018.
However, to minimise disruption to the financial system and to avoid further slowing economic growth, authorities have recently slowed implementation of these reforms. For example, transitional arrangements around new rules for asset management products, which facilitate channel lending, have been relaxed. Authorities have also encouraged banks to lend to private firms, and have reduced banks’ reserve requirements four times since the beginning of 2018.
These responses, which give banks greater scope to expand lending, may reduce the chance of risks crystallising in the near term, but could exacerbate underlying vulnerabilities.
Household sector risks in Australia remain high.
Global shocks can also impact New Zealand through Australia. Australia is the second-largest destination for New Zealand exports, and New Zealand’s four largest banks and several large insurers are Australian owned.
0
20
40
60
80
100
120
140
0
20
40
60
80
100
120
140
1998 2002 2006 2010 2014 2018
%%AustraliaCanadaNew ZealandUnited KingdomUnited StatesJapan
Figure 3.10Household credit(% of GDP)
Source: BIS.
Note: Includes credit to households and non-profit institutions serving households.

22RESERVE BANK OF NEW ZEALAND / FINANCIAL STABILITY REPORT, NOVEMBER 2018
Chapter 4Developments in New Zealand’s financial system
0
25
50
75
100
0
25
50
75
100
Bank credit Stock marketcapitalisation
Managed fundassets
Life insurancepremium
Non-lifeinsurancepremium
PercentilePercentileFigure 4.1The shape of New Zealand’s financial system compared with OECD peers(percentile, indicators relative to GDP)
Source: The World Bank, Bank for International Settlements (BIS).
Note: Data for each country is the latest available, ranging from 2015 to 2018.
The Reserve Bank is responsible for promoting the maintenance of a sound and efficient financial system. To help achieve this, the Reserve Bank regulates and supervises banks and insurers, regulates non-bank deposit takers and oversees financial market infrastructures (FMIs).
Soundness relates to the resilience of financial institutions and the financial system as a whole to unexpected events, such as a disruption in the economy. A financial system that is not sound may not be able to fulfil its role consistently over an economic cycle.
Efficiency relates to how well the financial system performs its roles. An efficient financial system allocates resources to their best use and does so in a cost-efficient manner. An efficient financial system also responds to changing demand and uncertainty over time through the development of new financial processes, services and products.
A sound and efficient financial system is important because of the many roles the financial system plays in New Zealand’s economy.
The financial system facilitates borrowing and saving…
The financial system improves the investment and consumption opportunities available to households and firms by intermediating funds between savers and borrowers. In New Zealand, this role is dominated by the banking system, which is larger relative to the size of the economy than in most other OECD countries (figure 4.1). New Zealand’s banking penetration is high, with over 99 percent of adults having bank accounts.
23RESERVE BANK OF NEW ZEALAND / FINANCIAL STABILITY REPORT, NOVEMBER 2018
0
20
40
60
0
20
40
60
Housing Consumer Agriculture Business
%%19982018
Figure 4.2Share of bank lending by sector
Source: RBNZ Standard Statistical Return (SSR), RBNZ Bank Balance Sheet Survey (BBS).
0
10
20
30
40
50
0
10
20
30
40
50 %% Incumbent small banksNBLIsNew entrant banks
2013 2018 2013 2018 2013 2018 2013 2018Housing Consumer Agriculture Business
Figure 4.3Small banks’ and NBLIs’ market share by sector(% of system lending)
Source: RBNZ BBS, RBNZ SSR.
Note: Small banks consists of all banks excluding the five largest banks. The new entrants are Bank of China, China Construction Bank, and the Industrial and Commercial Bank of China.
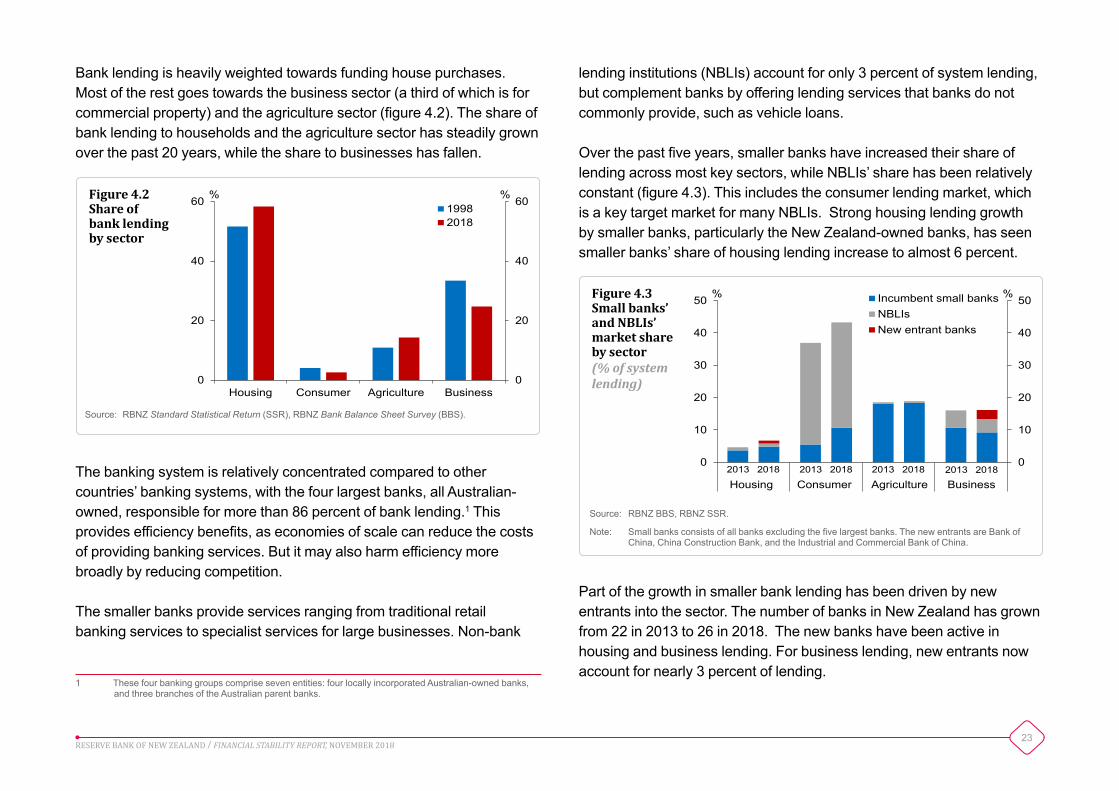
Bank lending is heavily weighted towards funding house purchases. Most of the rest goes towards the business sector (a third of which is for commercial property) and the agriculture sector (figure 4.2). The share of bank lending to households and the agriculture sector has steadily grown over the past 20 years, while the share to businesses has fallen.
lending institutions (NBLIs) account for only 3 percent of system lending, but complement banks by offering lending services that banks do not commonly provide, such as vehicle loans.
Over the past five years, smaller banks have increased their share of lending across most key sectors, while NBLIs’ share has been relatively constant (figure 4.3). This includes the consumer lending market, which is a key target market for many NBLIs. Strong housing lending growth by smaller banks, particularly the New Zealand-owned banks, has seen smaller banks’ share of housing lending increase to almost 6 percent.
The banking system is relatively concentrated compared to other countries’ banking systems, with the four largest banks, all Australian-owned, responsible for more than 86 percent of bank lending.1 This provides efficiency benefits, as economies of scale can reduce the costs of providing banking services. But it may also harm efficiency more broadly by reducing competition.
The smaller banks provide services ranging from traditional retail banking services to specialist services for large businesses. Non-bank
1 These four banking groups comprise seven entities: four locally incorporated Australian-owned banks, and three branches of the Australian parent banks.
Part of the growth in smaller bank lending has been driven by new entrants into the sector. The number of banks in New Zealand has grown from 22 in 2013 to 26 in 2018. The new banks have been active in housing and business lending. For business lending, new entrants now account for nearly 3 percent of lending.
24RESERVE BANK OF NEW ZEALAND / FINANCIAL STABILITY REPORT, NOVEMBER 2018
0
2
4
6
8
0
2
4
6
8
General Life Health
$bn$bnThree largest firmsOther firms
Figure 4.4Gross earned premium by insurance subsector
Source: RBNZ Quarterly Insurer Survey (QIS), Insurer Return, RBNZ estimates.
Note: The RBNZ QIS covers 88 percent of the insurance industry by premium. Data for these insurers is as at 30 June 2018. Data for insurers not captured by the QIS are estimates based on less frequent reporting.
New Zealand’s capital markets also intermediate funds. Well-functioning capital markets are important for the efficiency of the financial system and are particularly important at times when it is difficult to obtain bank loans. New Zealanders mainly access capital markets through managed funds, such as their KiwiSaver funds. These funds help households allocate their savings to investments in New Zealand and abroad.
In some respects, New Zealand’s capital markets are not as developed as those of other developed countries. For example, New Zealand’s listed equity market is smaller and its turnover is far lower than in most other OECD countries. This may inhibit access to capital for businesses looking to grow, as well as reduce investment opportunities for households.
…and allows people to share risks and make payments.
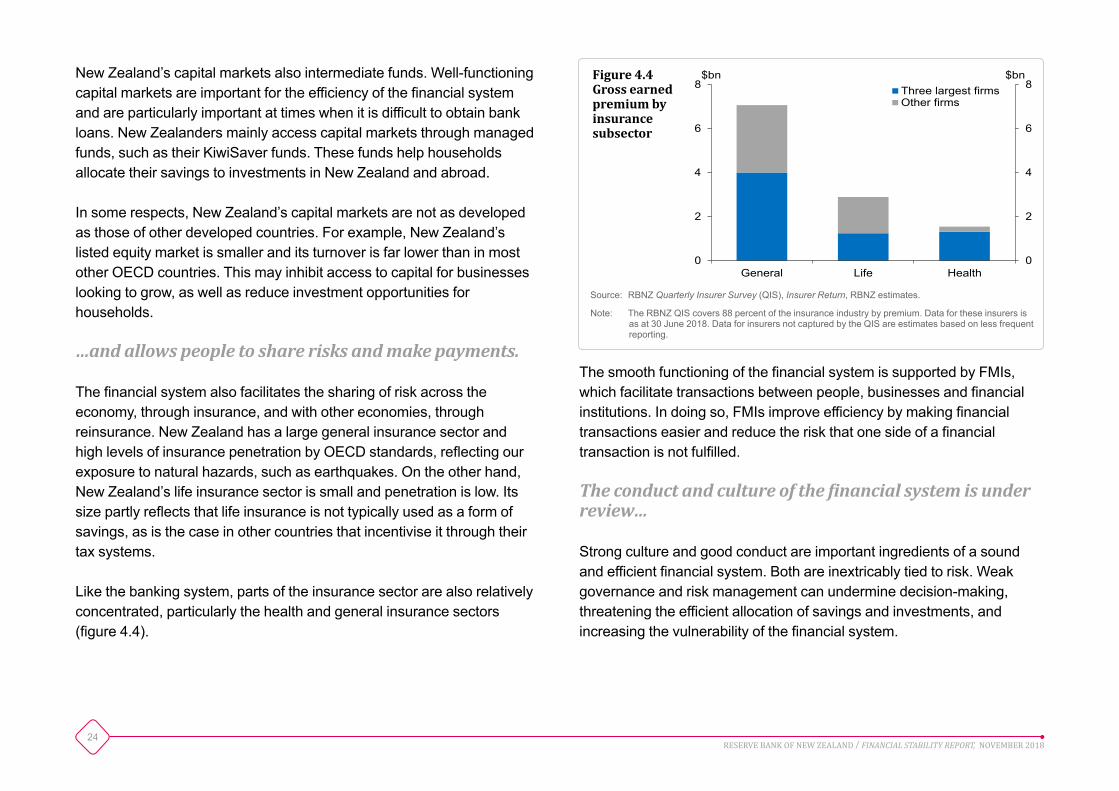
The financial system also facilitates the sharing of risk across the economy, through insurance, and with other economies, through reinsurance. New Zealand has a large general insurance sector and high levels of insurance penetration by OECD standards, reflecting our exposure to natural hazards, such as earthquakes. On the other hand, New Zealand’s life insurance sector is small and penetration is low. Its size partly reflects that life insurance is not typically used as a form of savings, as is the case in other countries that incentivise it through their tax systems.
Like the banking system, parts of the insurance sector are also relatively concentrated, particularly the health and general insurance sectors (figure 4.4).
The smooth functioning of the financial system is supported by FMIs, which facilitate transactions between people, businesses and financial institutions. In doing so, FMIs improve efficiency by making financial transactions easier and reduce the risk that one side of a financial transaction is not fulfilled.
The conduct and culture of the financial system is under review…
Strong culture and good conduct are important ingredients of a sound and efficient financial system. Both are inextricably tied to risk. Weak governance and risk management can undermine decision-making, threatening the efficient allocation of savings and investments, and increasing the vulnerability of the financial system.
25RESERVE BANK OF NEW ZEALAND / FINANCIAL STABILITY REPORT, NOVEMBER 2018
The Royal Commission into Misconduct in the Banking, Superannuation and Financial Services Industry in Australia has highlighted a range of conduct and culture issues within Australian financial institutions. These findings are important here as many of New Zealand’s financial institutions are Australian-owned.
Separately, the Financial Markets Authority (FMA) and the Reserve Bank have recently completed a review of the conduct and culture of New Zealand’s banks. While the review did not find widespread conduct and culture issues, it found weaknesses in the governance and management of conduct risks. It will be important for banks to address these shortcomings, which are discussed further in box B. A review of the culture and conduct of several large life insurers in New Zealand is ongoing.
…and the financial system faces technological change.
The financial system is also being impacted by improvements in financial technology (‘FinTech’). FinTech refers to technological innovations that may have a material impact on business models, processes and products in financial services. It has the potential to change significantly the structure of the financial system and the nature of payment services over the medium term.2
FinTech developments are likely to improve the efficiency of the financial system, in part by reducing barriers to entry and enhancing competition, particularly for retail banking, lending and insurance services. They will also allow firms to develop financial products and services that are cheaper and that better meet consumers’ needs.
2 See Riki Fujii-Rajani (2018), ‘FinTech developments in banking, insurance and FMIs’, Reserve Bank of New Zealand Bulletin, Vol. 81, No. 12, November.
They may also present challenges. New technologies will come with risks that have to be managed. And incumbent financial institutions, particularly those that are slower to adapt to new technologies, may face reduced profitability and lose market share. Overall, the financial system appears well positioned to adapt to these changes and the risks they may create.
Banks
All banks are compliant with capital, liquidity and stable funding requirements.
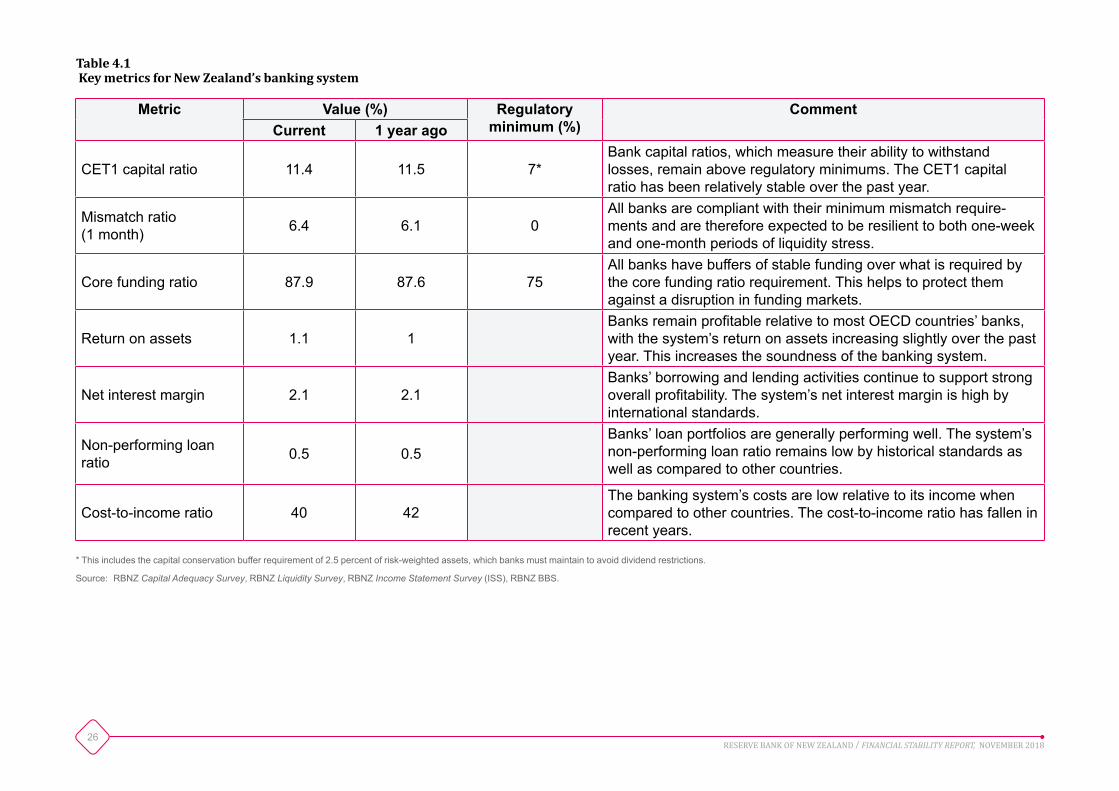
All banks hold buffers of capital, liquidity and stable funding in excess of current regulatory requirements (table 4.1). New Zealand’s banking system continues to perform well and remains profitable by international standards.
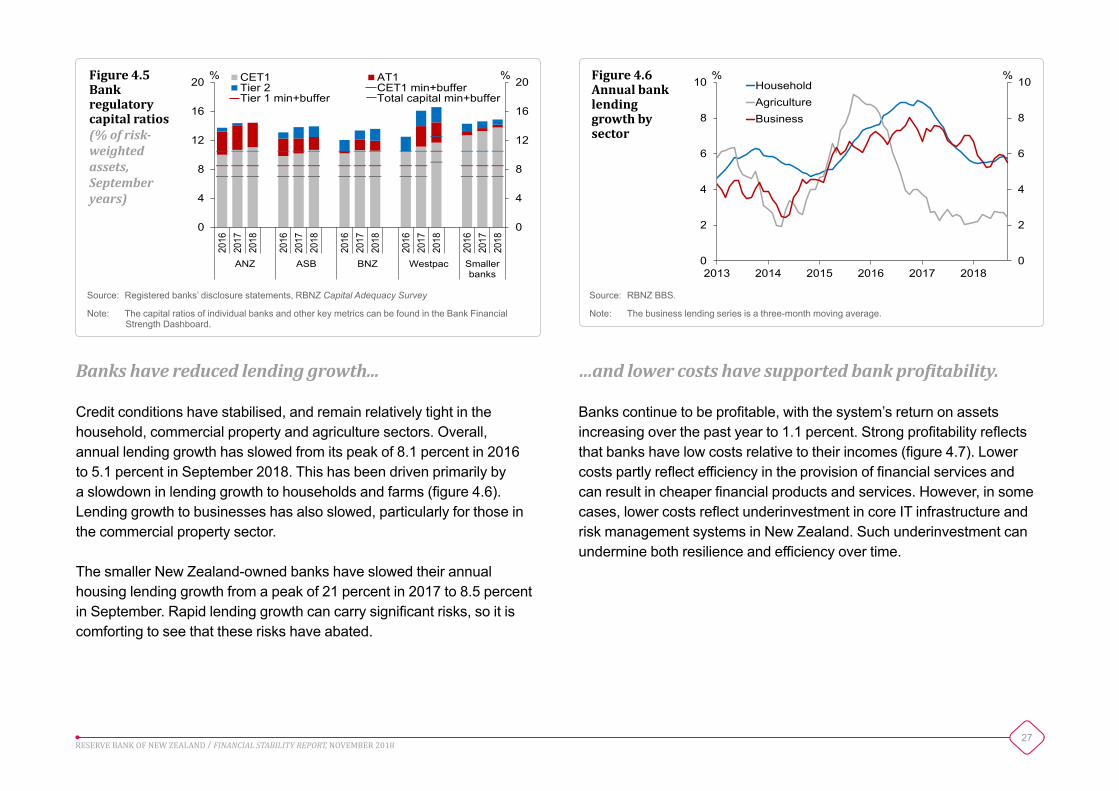
Banks have increased their total capital over the past two years, from 13 to 14 percent of risk-weighted assets. This trend has been evident across both smaller and larger banks (figure 4.5). The smaller banks tend to have higher levels of common equity Tier 1 (CET1) capital, which is the highest-quality form of capital, whereas larger banks tend to make more use of additional Tier 1 (AT1) and Tier 2 capital.
A well-capitalised banking system is critical for the overall soundness of the financial system. The Reserve Bank is reviewing its capital requirements for banks (see chapter 5).
26RESERVE BANK OF NEW ZEALAND / FINANCIAL STABILITY REPORT, NOVEMBER 2018
Table 4.1 Key metrics for New Zealand’s banking system
Metric Value (%) Regulatory minimum (%)
CommentCurrent 1 year ago
CET1 capital ratio 11.4 11.5 7*Bank capital ratios, which measure their ability to withstand losses, remain above regulatory minimums. The CET1 capital ratio has been relatively stable over the past year.
Mismatch ratio (1 month) 6.4 6.1 0
All banks are compliant with their minimum mismatch require-ments and are therefore expected to be resilient to both one-week and one-month periods of liquidity stress.
Core funding ratio 87.9 87.6 75All banks have buffers of stable funding over what is required by the core funding ratio requirement. This helps to protect them against a disruption in funding markets.
Return on assets 1.1 1Banks remain profitable relative to most OECD countries’ banks, with the system’s return on assets increasing slightly over the past year. This increases the soundness of the banking system.
Net interest margin 2.1 2.1Banks’ borrowing and lending activities continue to support strong overall profitability. The system’s net interest margin is high by international standards.
Non-performing loan ratio 0.5 0.5
Banks’ loan portfolios are generally performing well. The system’s non-performing loan ratio remains low by historical standards as well as compared to other countries.
Cost-to-income ratio 40 42The banking system’s costs are low relative to its income when compared to other countries. The cost-to-income ratio has fallen in recent years.
* This includes the capital conservation buffer requirement of 2.5 percent of risk-weighted assets, which banks must maintain to avoid dividend restrictions.
Source: RBNZ Capital Adequacy Survey, RBNZ Liquidity Survey, RBNZ Income Statement Survey (ISS), RBNZ BBS.
27RESERVE BANK OF NEW ZEALAND / FINANCIAL STABILITY REPORT, NOVEMBER 2018
Banks have reduced lending growth...
Credit conditions have stabilised, and remain relatively tight in the household, commercial property and agriculture sectors. Overall, annual lending growth has slowed from its peak of 8.1 percent in 2016 to 5.1 percent in September 2018. This has been driven primarily by a slowdown in lending growth to households and farms (figure 4.6). Lending growth to businesses has also slowed, particularly for those in the commercial property sector.
The smaller New Zealand-owned banks have slowed their annual housing lending growth from a peak of 21 percent in 2017 to 8.5 percent in September. Rapid lending growth can carry significant risks, so it is comforting to see that these risks have abated.
…and lower costs have supported bank profitability.
Banks continue to be profitable, with the system’s return on assets increasing over the past year to 1.1 percent. Strong profitability reflects that banks have low costs relative to their incomes (figure 4.7). Lower costs partly reflect efficiency in the provision of financial services and can result in cheaper financial products and services. However, in some cases, lower costs reflect underinvestment in core IT infrastructure and risk management systems in New Zealand. Such underinvestment can undermine both resilience and efficiency over time.
0
4
8
12
16
20
0
4
8
12
16
20
2016
2017
2018
2016
2017
2018
2016
2017
2018
2016
2017
2018
2016
2017
2018
ANZ ASB BNZ Westpac Smallerbanks
%% CET1 AT1Tier 2 CET1 min+bufferTier 1 min+buffer Total capital min+buffer
Figure 4.5Bank regulatory capital ratios(% of risk-weighted assets, September years)
Source: Registered banks’ disclosure statements, RBNZ Capital Adequacy Survey
Note: The capital ratios of individual banks and other key metrics can be found in the Bank Financial Strength Dashboard.
0
2
4
6
8
10
0
2
4
6
8
10
2013 2014 2015 2016 2017 2018
%%HouseholdAgricultureBusiness
Figure 4.6Annual bank lending growth by sector
Source: RBNZ BBS.
Note: The business lending series is a three-month moving average.

28RESERVE BANK OF NEW ZEALAND / FINANCIAL STABILITY REPORT, NOVEMBER 2018
Strong asset performance has also supported profitability. Levels of non-performing loans (NPLs) remain low across most lending sectors (figure 4.8) and represent only 0.5 percent of the system’s lending. Agriculture NPLs are elevated because of the dairy downturn in 2015 and 2016, but these levels are expected to reduce gradually over time (see chapter 2).
Consumer NPLs have picked up recently, off very low levels. This may be an early indication of pressures facing households, possibly due to higher rents and fuel prices. Despite emerging stresses in the retail and construction sectors, business NPLs have continued to fall. Lending to the retail and construction sectors makes up only 3 percent of bank lending.
Banks have strengthened their funding profiles.
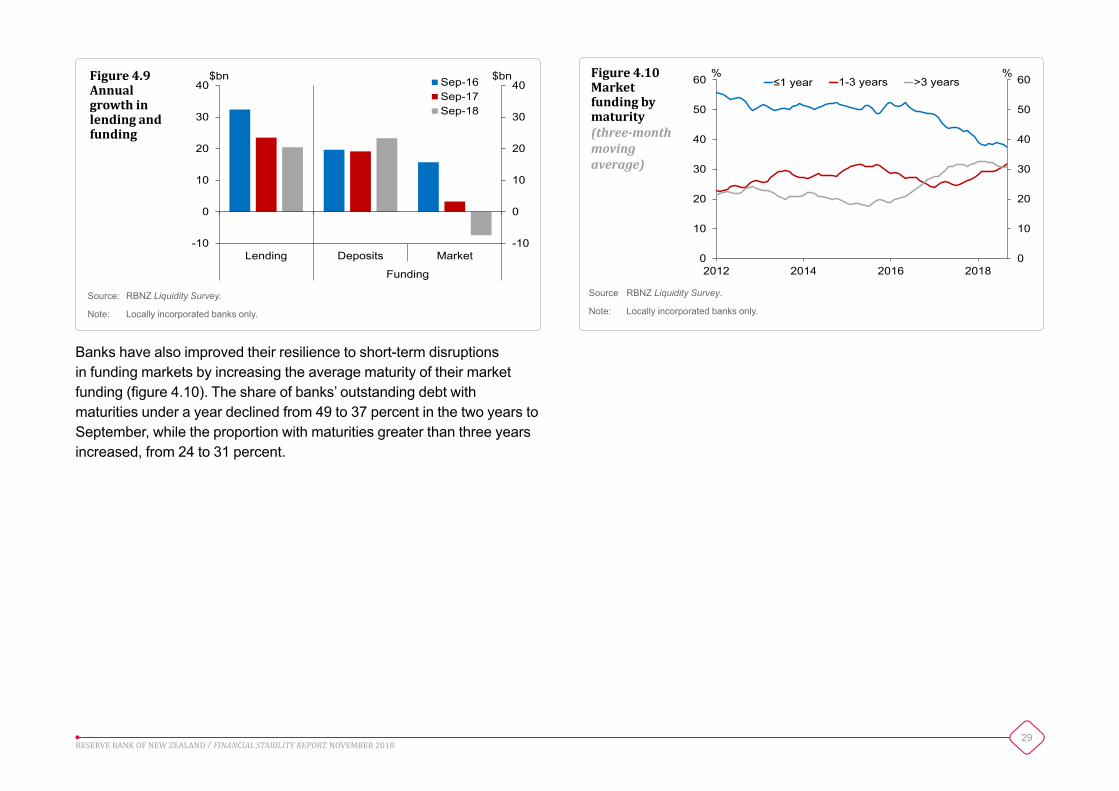
Banks rely on market funding to finance their loan portfolios. It can be difficult or costly to renew market funding during periods of financial stress (see chapter 3). Recently, banks have funded more through deposits, a relatively stable form of funding. Banks have experienced strong deposit growth against a backdrop of falling lending growth, allowing them to pay down market funding (figure 4.9). Term deposits have grown particularly strongly, at 10 percent, compared to no growth for on-call savings accounts.
0
1
2
3
4
0
1
2
3
4
Consumer Housing Agriculture Commercialproperty
Otherbusiness
%%2013 2014 2015
2016 2017 2018
Figure 4.8Non-performing loans by sector(% of sectoral lending, September years)
Source: RBNZ BBS, private reporting.
0
15
30
45
60
0
15
30
45
60
Five largest banks Smaller banks
%%201620172018
Figure 4.7Cost-to-income ratios(by bank size, September years)
Source: RBNZ ISS.
29RESERVE BANK OF NEW ZEALAND / FINANCIAL STABILITY REPORT, NOVEMBER 2018
Lending Deposits Market
Funding
-10
0
10
20
30
40
-10
0
10
20
30
40$bn$bn Sep-16
Sep-17Sep-18
Figure 4.9Annual growth in lending and funding
Source: RBNZ Liquidity Survey.
Note: Locally incorporated banks only.
Banks have also improved their resilience to short-term disruptions in funding markets by increasing the average maturity of their market funding (figure 4.10). The share of banks’ outstanding debt with maturities under a year declined from 49 to 37 percent in the two years to September, while the proportion with maturities greater than three years increased, from 24 to 31 percent.
0
10
20
30
40
50
60
0
10
20
30
40
50
60
2012 2014 2016 2018
%%≤1 year 1-3 years >3 years
Figure 4.10Market funding by maturity(three-month moving average)
Source RBNZ Liquidity Survey.
Note: Locally incorporated banks only.
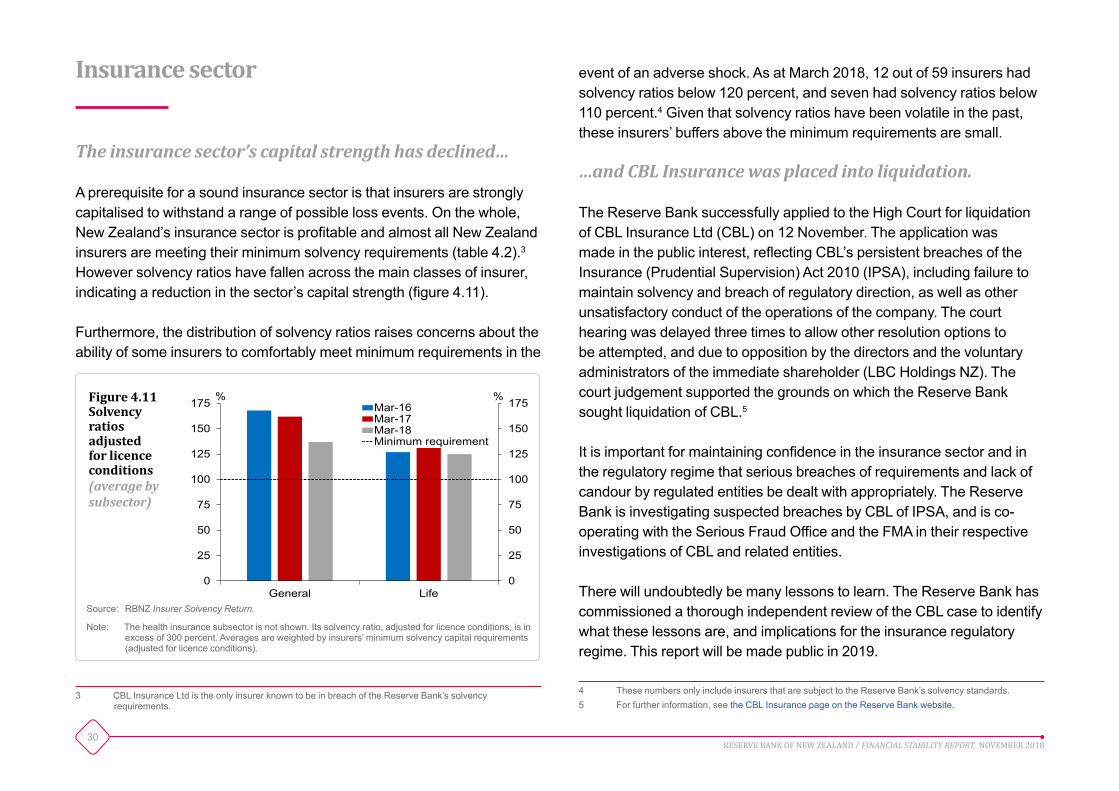
30RESERVE BANK OF NEW ZEALAND / FINANCIAL STABILITY REPORT, NOVEMBER 2018
Insurance sector
The insurance sector’s capital strength has declined…
A prerequisite for a sound insurance sector is that insurers are strongly capitalised to withstand a range of possible loss events. On the whole, New Zealand’s insurance sector is profitable and almost all New Zealand insurers are meeting their minimum solvency requirements (table 4.2).3 However solvency ratios have fallen across the main classes of insurer, indicating a reduction in the sector’s capital strength (figure 4.11).
Furthermore, the distribution of solvency ratios raises concerns about the ability of some insurers to comfortably meet minimum requirements in the
3 CBL Insurance Ltd is the only insurer known to be in breach of the Reserve Bank’s solvency requirements.
event of an adverse shock. As at March 2018, 12 out of 59 insurers had solvency ratios below 120 percent, and seven had solvency ratios below 110 percent.4 Given that solvency ratios have been volatile in the past, these insurers’ buffers above the minimum requirements are small.
…and CBL Insurance was placed into liquidation.
The Reserve Bank successfully applied to the High Court for liquidation of CBL Insurance Ltd (CBL) on 12 November. The application was made in the public interest, reflecting CBL’s persistent breaches of the Insurance (Prudential Supervision) Act 2010 (IPSA), including failure to maintain solvency and breach of regulatory direction, as well as other unsatisfactory conduct of the operations of the company. The court hearing was delayed three times to allow other resolution options to be attempted, and due to opposition by the directors and the voluntary administrators of the immediate shareholder (LBC Holdings NZ). The court judgement supported the grounds on which the Reserve Bank sought liquidation of CBL.5
It is important for maintaining confidence in the insurance sector and in the regulatory regime that serious breaches of requirements and lack of candour by regulated entities be dealt with appropriately. The Reserve Bank is investigating suspected breaches by CBL of IPSA, and is co-operating with the Serious Fraud Office and the FMA in their respective investigations of CBL and related entities.
There will undoubtedly be many lessons to learn. The Reserve Bank has commissioned a thorough independent review of the CBL case to identify what these lessons are, and implications for the insurance regulatory regime. This report will be made public in 2019.
4 These numbers only include insurers that are subject to the Reserve Bank’s solvency standards.5 For further information, see the CBL Insurance page on the Reserve Bank website.
0
25
50
75
100
125
150
175
0
25
50
75
100
125
150
175
General Life
%%Mar-16Mar-17Mar-18Minimum requirement
Figure 4.11Solvency ratios adjusted for licence conditions(average by subsector)
Source: RBNZ Insurer Solvency Return.
Note: The health insurance subsector is not shown. Its solvency ratio, adjusted for licence conditions, is in excess of 300 percent. Averages are weighted by insurers’ minimum solvency capital requirements (adjusted for licence conditions).
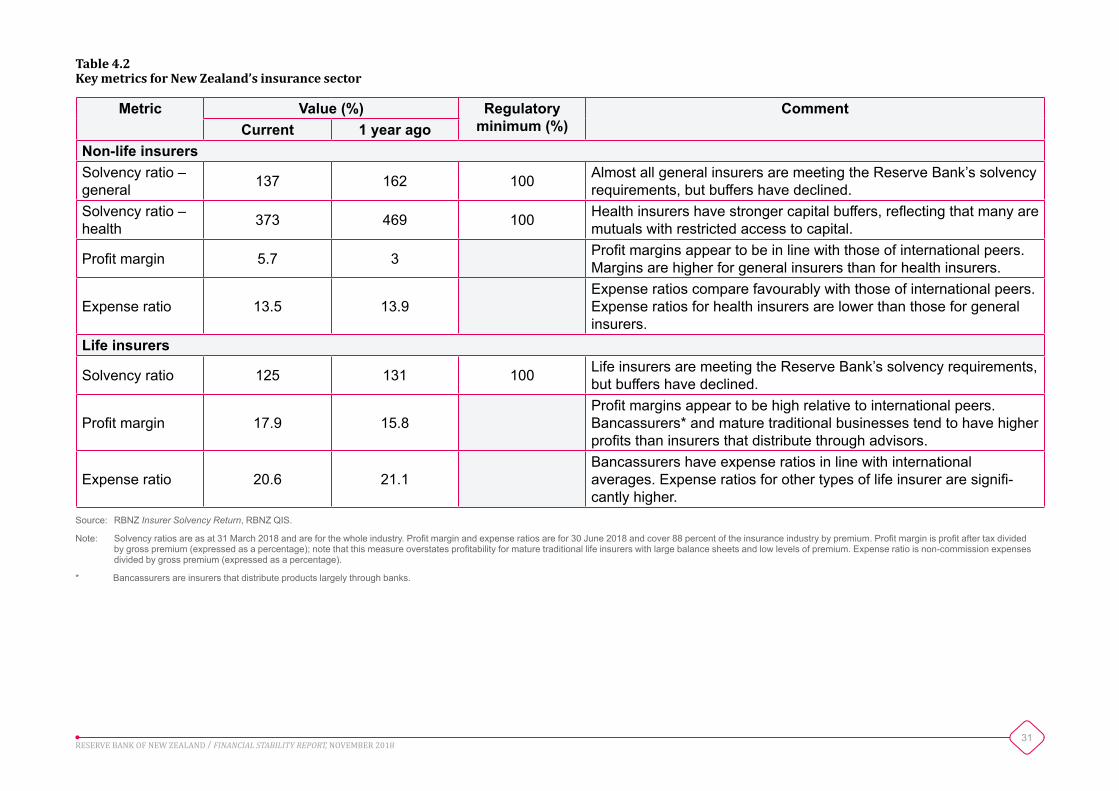
31RESERVE BANK OF NEW ZEALAND / FINANCIAL STABILITY REPORT, NOVEMBER 2018
Table 4.2Key metrics for New Zealand’s insurance sector
Metric Value (%) Regulatory minimum (%)
CommentCurrent 1 year ago
Non-life insurersSolvency ratio – general 137 162 100 Almost all general insurers are meeting the Reserve Bank’s solvency
requirements, but buffers have declined.Solvency ratio – health 373 469 100 Health insurers have stronger capital buffers, reflecting that many are
mutuals with restricted access to capital.
Profit margin 5.7 3 Profit margins appear to be in line with those of international peers. Margins are higher for general insurers than for health insurers.
Expense ratio 13.5 13.9Expense ratios compare favourably with those of international peers. Expense ratios for health insurers are lower than those for general insurers.
Life insurers
Solvency ratio 125 131 100 Life insurers are meeting the Reserve Bank’s solvency requirements, but buffers have declined.
Profit margin 17.9 15.8Profit margins appear to be high relative to international peers. Bancassurers* and mature traditional businesses tend to have higher profits than insurers that distribute through advisors.
Expense ratio 20.6 21.1Bancassurers have expense ratios in line with international averages. Expense ratios for other types of life insurer are signifi-cantly higher.
Source: RBNZ Insurer Solvency Return, RBNZ QIS.
Note: Solvency ratios are as at 31 March 2018 and are for the whole industry. Profit margin and expense ratios are for 30 June 2018 and cover 88 percent of the insurance industry by premium. Profit margin is profit after tax divided by gross premium (expressed as a percentage); note that this measure overstates profitability for mature traditional life insurers with large balance sheets and low levels of premium. Expense ratio is non-commission expenses divided by gross premium (expressed as a percentage).
* Bancassurers are insurers that distribute products largely through banks.
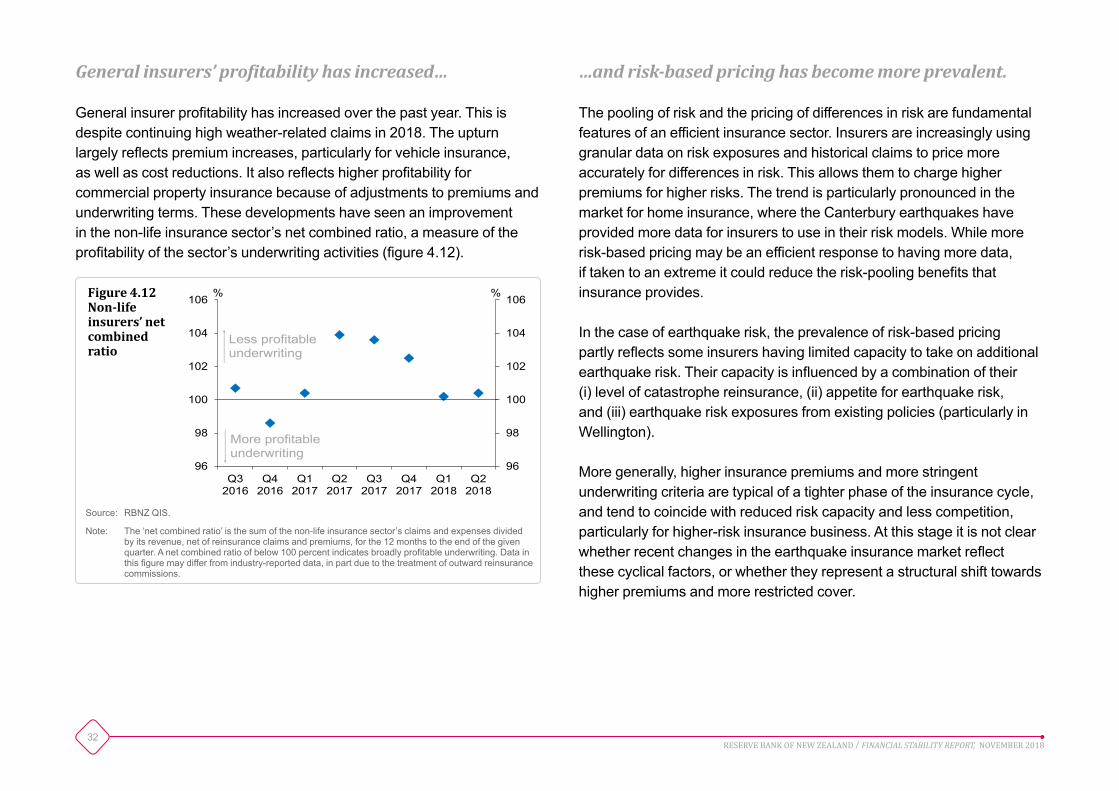
32RESERVE BANK OF NEW ZEALAND / FINANCIAL STABILITY REPORT, NOVEMBER 2018
General insurers’ profitability has increased…
General insurer profitability has increased over the past year. This is despite continuing high weather-related claims in 2018. The upturn largely reflects premium increases, particularly for vehicle insurance, as well as cost reductions. It also reflects higher profitability for commercial property insurance because of adjustments to premiums and underwriting terms. These developments have seen an improvement in the non-life insurance sector’s net combined ratio, a measure of the profitability of the sector’s underwriting activities (figure 4.12).
…and risk-based pricing has become more prevalent.
The pooling of risk and the pricing of differences in risk are fundamental features of an efficient insurance sector. Insurers are increasingly using granular data on risk exposures and historical claims to price more accurately for differences in risk. This allows them to charge higher premiums for higher risks. The trend is particularly pronounced in the market for home insurance, where the Canterbury earthquakes have provided more data for insurers to use in their risk models. While more risk-based pricing may be an efficient response to having more data, if taken to an extreme it could reduce the risk-pooling benefits that insurance provides.
In the case of earthquake risk, the prevalence of risk-based pricing partly reflects some insurers having limited capacity to take on additional earthquake risk. Their capacity is influenced by a combination of their (i) level of catastrophe reinsurance, (ii) appetite for earthquake risk, and (iii) earthquake risk exposures from existing policies (particularly in Wellington).
More generally, higher insurance premiums and more stringent underwriting criteria are typical of a tighter phase of the insurance cycle, and tend to coincide with reduced risk capacity and less competition, particularly for higher-risk insurance business. At this stage it is not clear whether recent changes in the earthquake insurance market reflect these cyclical factors, or whether they represent a structural shift towards higher premiums and more restricted cover.
96
98
100
102
104
106
96
98
100
102
104
106
Q32016
Q42016
Q12017
Q22017
Q32017
Q42017
Q12018
Q22018
%%
Less profitable underwriting
More profitable underwriting
Figure 4.12Non-life insurers’ net combined ratio
Source: RBNZ QIS.
Note: The ‘net combined ratio’ is the sum of the non-life insurance sector’s claims and expenses divided by its revenue, net of reinsurance claims and premiums, for the 12 months to the end of the given quarter. A net combined ratio of below 100 percent indicates broadly profitable underwriting. Data in this figure may differ from industry-reported data, in part due to the treatment of outward reinsurance commissions.

33RESERVE BANK OF NEW ZEALAND / FINANCIAL STABILITY REPORT, NOVEMBER 2018
Insurers have made further progress settling earthquake-related claims.
As of September 2018, insurers have paid $1.8 billion of claims relating to the Kaikōura earthquake and $35.1 billion of claims relating to the Canterbury earthquakes.6 The rate of claims settlement has slowed considerably as many of the remaining claims are complex or are being litigated. In addition, some insurers have been increasing their estimates of their ultimate claims cost. The Reserve Bank estimates that final claims costs will lie in the range of $2.5-4.5 billion for Kaikōura and $36-39 billion for Canterbury.
The life insurance sector has been slower to adapt to changes in the market.
The life insurance sector shares many characteristics with the general insurance sector, including the increased potential to apply data to assess and price risk. However, the sector appears to have been slow to adapt to new technologies and changing consumer preferences towards online product distribution. Instead it has relied largely on the traditional advisor sales channel, where life insurers pay high commissions to advisors. Commissions in the New Zealand market are high when compared with those in other countries (figure 4.13).
Insurance advisors have an important role in helping buyers select insurance products that meet their needs. However, the high level of commissions and other incentives that life insurers pay to advisors can create conduct risk. In some cases, advisors could be incentivised to encourage policyholders to switch to different insurance policies even if the changes do not benefit the policyholders. Such activities can
6 This includes claims settled by the Earthquake Commission.
0
5
10
15
20
25
0
5
10
15
20
25
Denm
ark
Latv
iaNo
rway
Pola
ndSw
eden
Luxe
mbo
urg
Portu
gal
Switz
erla
nd Italy
Finl
and
Spai
nBe
lgiu
mCh
ileG
erm
any
Unite
d St
ates
Slov
enia
Aust
ralia
Irela
ndIs
rael
Aust
riaHu
ngar
yM
exico
New
Zeal
and
%%Figure 4.13Life insurance commissions (% of gross premium revenue)
Source OECD, RBNZ QIS.
Note: Data is for 2016.
compromise the efficiency of the sector, because policyholders may not be matched with the best policies, and ultimately end up funding high commissions through high premiums.
The conduct and culture of life insurers is currently under review by the FMA and the Reserve Bank (see box B).
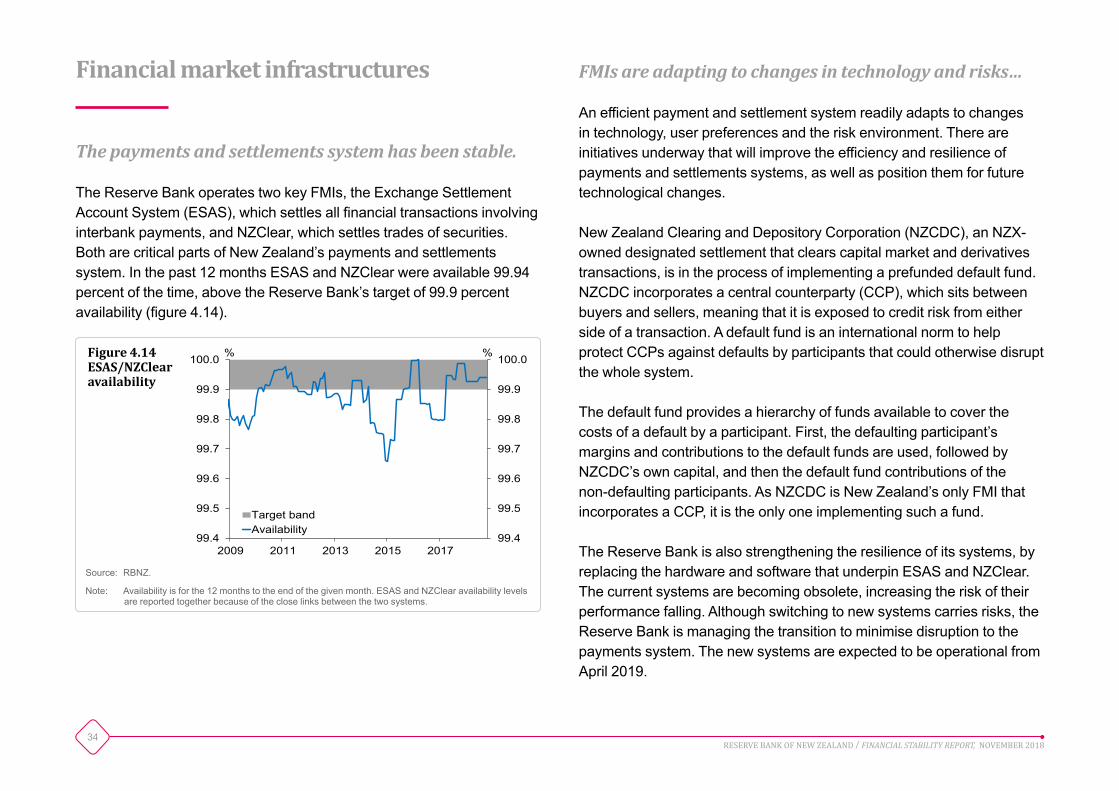
34RESERVE BANK OF NEW ZEALAND / FINANCIAL STABILITY REPORT, NOVEMBER 2018
Financial market infrastructures
The payments and settlements system has been stable.
The Reserve Bank operates two key FMIs, the Exchange Settlement Account System (ESAS), which settles all financial transactions involving interbank payments, and NZClear, which settles trades of securities. Both are critical parts of New Zealand’s payments and settlements system. In the past 12 months ESAS and NZClear were available 99.94 percent of the time, above the Reserve Bank’s target of 99.9 percent availability (figure 4.14).
FMIs are adapting to changes in technology and risks…
An efficient payment and settlement system readily adapts to changes in technology, user preferences and the risk environment. There are initiatives underway that will improve the efficiency and resilience of payments and settlements systems, as well as position them for future technological changes.
New Zealand Clearing and Depository Corporation (NZCDC), an NZX-owned designated settlement that clears capital market and derivatives transactions, is in the process of implementing a prefunded default fund. NZCDC incorporates a central counterparty (CCP), which sits between buyers and sellers, meaning that it is exposed to credit risk from either side of a transaction. A default fund is an international norm to help protect CCPs against defaults by participants that could otherwise disrupt the whole system.
The default fund provides a hierarchy of funds available to cover the costs of a default by a participant. First, the defaulting participant’s margins and contributions to the default funds are used, followed by NZCDC’s own capital, and then the default fund contributions of the non-defaulting participants. As NZCDC is New Zealand’s only FMI that incorporates a CCP, it is the only one implementing such a fund.
The Reserve Bank is also strengthening the resilience of its systems, by replacing the hardware and software that underpin ESAS and NZClear. The current systems are becoming obsolete, increasing the risk of their performance falling. Although switching to new systems carries risks, the Reserve Bank is managing the transition to minimise disruption to the payments system. The new systems are expected to be operational from April 2019.
99.4
99.5
99.6
99.7
99.8
99.9
100.0
99.4
99.5
99.6
99.7
99.8
99.9
100.0
2009 2011 2013 2015 2017
%%
Target bandAvailability
Figure 4.14ESAS/NZClear availability
Source: RBNZ.
Note: Availability is for the 12 months to the end of the given month. ESAS and NZClear availability levels are reported together because of the close links between the two systems.

35RESERVE BANK OF NEW ZEALAND / FINANCIAL STABILITY REPORT, NOVEMBER 2018
…as well as the needs of users.
Payments NZ is working to enable retail payments to be processed every day, as opposed to just business days. This would make it possible for common payments, such as bank transfers and direct debits, to show up in the recipients’ bank accounts on weekends. Enabling this change requires cooperation between Payments NZ (which sets the rules for payments between banks), the Reserve Bank (which facilitates interbank payments), and the banks.
Payments NZ is also developing standards for application programming interfaces (APIs). APIs enable applications to exchange data in a standardised manner and are used widely by websites and mobile phone apps to access data from third parties. An API pilot is already underway with a small number of organisations. This includes two API standards, one for sharing account information with third parties and one for initiating payments.
APIs are an example of FinTech. In the future they may allow consumers to buy products and authorise payments for them within a single website, or allow access to information from accounts with multiple banks through one mobile phone app. APIs are expected to improve payments system efficiency and convenience for users, and form a key part of a general trend towards ‘open banking’ (see box B in the May 2018 Report).

36RESERVE BANK OF NEW ZEALAND / FINANCIAL STABILITY REPORT, NOVEMBER 2018
The review found weaknesses in the governance and management of conduct risks…
The review found significant variations in the maturity of banks’ approaches to identifying, managing and remediating conduct issues. While some banks had been thinking about conduct and culture for some time, the approach of other banks could be described as reactive at best and complacent at worst. Most banks are only at an early stage of embedding the necessary focus on long-term customer outcomes into their business strategies.
More broadly, weaknesses in the governance and management of conduct risks were identified, as well as significant gaps in the measurement and reporting of customer outcomes. If left unchecked, these weaknesses have the potential to lead to widespread issues such as those seen in other jurisdictions.
…but no widespread misconduct or cultural issues.
The review observed a small number of issues related to poor conduct by bank staff. Some of these related to inappropriate lending and sales, fees materially outweighing benefits, manipulation of customer records to influence satisfaction outcomes, and manipulation of branch sales records. Issues relating to system or process weaknesses were more commonplace. However, the FMA and the Reserve Bank do not consider that widespread conduct or culture issues are currently present in banks in New Zealand.
Any remediation issues that warrant further investigation and potential enforcement action will be considered by the FMA, the Reserve Bank or
Box B
The review of bank conduct and culture
The FMA and the Reserve Bank recently completed a joint review of the conduct and culture of the 11 largest retail banks in New Zealand.1 The objective of the review was to understand whether there were widespread conduct and culture issues present in banks in New Zealand. The FMA and the Reserve Bank are the two main financial market regulators. The FMA’s core focus is to regulate the conduct of certain financial market participants. The Reserve Bank’s focus on conduct and culture reflects its mandate to promote a sound and efficient financial system. Undesirable behaviours and attitudes towards risk can undermine the viability of financial institutions, which in turn can impact financial stability. Poor conduct in banks can also lead to inefficiency or a loss of confidence in the banking system.
The review was based on interviews with almost 600 bank staff and directors, and more than 1,000 documents supplied by the banks. It also considered insights from key banking industry stakeholders, and a survey of more than 2,000 consumers.
1 See the FMA and RBNZ report on bank culture and conduct.
391 interviews
documents received
1000+
13
towns and
visited
2000 consumers surveyed
with 572 including
directors, managers and
banking sector stakeholders
Insights sought from
6
ci�es
bank staff,
frontline staff
37RESERVE BANK OF NEW ZEALAND / FINANCIAL STABILITY REPORT, NOVEMBER 2018
• Strengthening staff reporting channels, including whistleblower processes for conduct and culture issues.
• Removing all incentives linked to sales measures and revising incentive structures for frontline salespeople and through all layers of management.
The review identified gaps in the regulatory framework.
The principal responsibility for developing strong frameworks for conduct risk remains with banks. In the absence of confidence that this will occur, clearer regulatory oversight of bank conduct would be necessary.
From a prudential perspective, the review has not identified any notable regulatory gaps for the Reserve Bank. However, the review has highlighted that there is a lack of specific regulatory requirements in relation to conduct across the banking sector, particularly in respect of the delivery of products distributed without financial advice. The review concludes that this lack of specific regulatory requirements has hampered the FMA’s regulatory oversight and the development of strong governance and management of conduct risk.
The report sets out a number of options that the Government could consider in response to these gaps.
A review of life insurers is also underway.
The FMA and the Reserve Bank are currently undertaking a separate thematic review of the conduct and culture of life insurers in New Zealand. Onsite visits commenced in August and were completed in November. A report is expected to be published in late January 2019.
the Commerce Commission, depending on which is responsible for the relevant legislation.
Banks must address recommendations by March 2019.
The review confirmed that all 11 banks need to more effectively identify, manage, remediate and report on conduct risks and issues to deliver consistently good outcomes for customers. The FMA and the Reserve Bank made a number of recommendations to improve oversight, controls and processes. Banks need to address these improvements with a sense of urgency. More broadly, boards and management should be focusing on generating long-term sustainable profits, not maximising short-term profits at the expense of good customer outcomes.
The FMA and the Reserve Bank will provide banks with individual feedback, along with general observations from the review. Each bank will need to produce a plan to address the feedback by the end of March 2019, then report on its progress implementing the plan. The FMA and the Reserve Bank will monitor progress and take further action if it is not satisfactory.
There are five key areas of focus from the review’s findings and recommendations that are common to all banks:
• Greater board ownership and accountability – including being able to properly measure and report on conduct and culture issues.
• Prioritising the identification of issues and remediation.
• Prioritising investment in systems and frameworks to strengthen processes and controls.
38RESERVE BANK OF NEW ZEALAND / FINANCIAL STABILITY REPORT, NOVEMBER 2018
Chapter 5Key regulatory developments
Phase 2 review of the Reserve Bank Act
The regulatory framework is a key driver of the performance of New Zealand’s financial system. The Government is in the process of reviewing the Reserve Bank of New Zealand Act 1989 (the ‘Act’), and is now in its second phase.
Phase 2 of the review will cover the financial policy provisions of the Act that provide the legislative basis for prudential regulation and supervision. It will also cover broader governance arrangements for the Reserve Bank, including the respective roles of the Board and the Governor. The overall aim of Phase 2 is to ensure that the Act remains fit for purpose and provides a strong, flexible and enduring framework.
The Minister of Finance announced the terms of reference for Phase 2 in June1 and the first consultation paper was published at the beginning of November.2
1 See Terms of Reference: Review of the Reserve Bank Act 1989.2 See Public Consultation.
The first consultation paper covers five main issues:
• the arguments for and against separating the Reserve Bank’s prudential responsibilities (although the Government has stated that it is not in favour of separation);
• the Reserve Bank’s statutory objectives;
• the Reserve Bank’s governance arrangements, including the role of the Governor and the Board;
• the regulatory perimeter; and
• the arguments for and against introducing a depositor protection scheme.
Responses to the consultation are due by 25 January 2019.
Two further consultation papers will follow in mid- and late-2019. The second consultation will seek feedback on the implementation of the preferred options developed as a result of the first consultation, and will open a discussion of the remaining issues. These include:
39RESERVE BANK OF NEW ZEALAND / FINANCIAL STABILITY REPORT, NOVEMBER 2018
• the legal basis for bank regulation;
• the Reserve Bank’s approach to supervision and enforcement;
• macro-prudential policy;
• crisis management; and
• the Reserve Bank’s resourcing and funding.
The third consultation will seek feedback on any residual issues. Cabinet is due to make final policy decisions on all components of the review in early 2020.
The results of the review will determine how the Reserve Bank operates for many years to come. As such, the Reserve Bank welcomes the review and encourages anyone with an interest in the Reserve Bank’s financial policy responsibilities to respond to the consultations.
Financial market infrastructures
Financial market infrastructures (FMIs) play a critical role in the financial system. Some FMIs are systemically important, in that their disruption could have widespread consequences across the financial system. The failure of payment systems can cause major disruption for consumers and businesses by making it difficult to buy and sell goods and services.
The current regulatory regime for FMIs is an opt-in regime. It also covers only some types of FMIs and lacks appropriate regulatory
and supervisory powers. Given the importance of FMIs, and the market failures that they can be subject to, a new regulatory regime is under development. This work has resulted in the Financial Market Infrastructures Bill (the ‘Bill’), which will establish the new regime. An exposure draft of the Bill will be released for consultation in early 2019.
The regime established under the Bill would be jointly administered by the Reserve Bank and the Financial Markets Authority (FMA), except in relation to payment systems, where the Reserve Bank would be the sole regulator. It would focus on the regulation of designated FMIs. These are FMIs that are identified as systemically important or which choose to opt in to the regime.3
Under the Bill, the regulators would have the power to set requirements for designated FMIs by issuing standards, and powers to oversee the rules of designated FMIs. The Bill also includes new enforcement tools, such as financial penalties and enforceable undertakings, and would provide significant new crisis management powers. These would include direction powers and a new statutory management regime.
For non-designated FMIs, the Bill would provide regulators with information-gathering and investigative powers. These would be used to monitor the broader sector and identify emerging risks. This lighter approach for non-designated FMIs would help to minimise compliance costs and barriers to entry, thereby enhancing the efficiency of the regime.
3 An FMI may choose to opt in to the regime in order to access legal protections around settlement finality and netting.

40RESERVE BANK OF NEW ZEALAND / FINANCIAL STABILITY REPORT, NOVEMBER 2018
Subject to the submissions on the exposure draft and Cabinet approval, the Bill is likely to be introduced into Parliament in the second quarter of 2019.
The review of bank capital requirements
A sound and efficient financial system requires that banks are sufficiently capitalised to absorb the losses they may face over an economic cycle. A well-capitalised banking system is less likely to become distressed in the event of a severe economic downturn and is more likely to continue to provide lending services to creditworthy borrowers, reducing feedback effects that could worsen the downturn.
It is therefore important that banks are required to have adequate levels of capital, and that those requirements are appropriate for the risks that the financial system faces. To help ensure this is the case, the Reserve Bank is fundamentally reviewing its capital requirements for New Zealand incorporated banks (the ‘capital review’). The capital review is addressing the three main components of the capital framework:
• the types of instrument that are accepted as regulatory capital;
• the way banks’ risks are measured and aggregated; and
• the minimum capital ratios applying to banks.
In December 2017 and July 2018, the Reserve Bank announced in-principle decisions arising from the capital review.4
The most recent decision was to continue to allow accredited banks to use their own models to estimate their credit risks and the related capital charges, but to do more to mitigate the possibility that these banks underestimate risk.5 The Reserve Bank’s view that credit risk models need to be constrained reflects local experience with bank models and is consistent with views held by the Basel Committee and many overseas regulators.
One aim of constraining models is to build more confidence in the capital framework. Another is to create a more level playing field, both among banks that are permitted to use models, and between those banks and the smaller banks that use standardised approaches to measure risk.
A consultation paper on the minimum capital ratios is due to be released in December. Our preliminary view is that higher capital requirements are necessary, so that the banking system can be sufficiently resilient whilst remaining efficient. The Reserve Bank’s aim is to announce final decisions on all key components of the capital framework in the second quarter of 2019.
4 See Review of the capital adequacy framework for registered banks.5 Currently ANZ, ASB, BNZ and Westpac are accredited to use their own models to measure credit risk.
41RESERVE BANK OF NEW ZEALAND / FINANCIAL STABILITY REPORT, NOVEMBER 2018
Breach reporting and materiality
Banks are required to publish details of breaches of their conditions of registration, in their six-monthly disclosure statements. This is an important component of the market discipline pillar.
During the development of the dashboard, the Reserve Bank confirmed it would begin publishing information on breaches of conditions on its website. On 23 October the Reserve Bank published a consultation paper on formal breach reporting and publication arrangements. The paper includes a draft notice under section 93 of the Reserve Bank Act that would require banks to promptly report any breaches of conditions of registration to the Reserve Bank. These reports would provide the raw material for information to be published on the Reserve Bank website.
The consultation paper also seeks views on the option of applying a materiality threshold to the publication of breaches. Under that option, the Reserve Bank would assess whether or not a breach is material, and would only publish material breaches on its website. Immaterial breaches would include minor breaches that have no bearing on a bank’s soundness. A materiality threshold would sharpen the focus of market discipline on bank failings that are of genuine public interest.
The deadline for submissions is 14 December 2018.
The Bank Financial Strength Dashboard
Financial market participants have an important role in disciplining the behaviour of banks by choosing which banks to borrow from and invest in. This ‘market discipline’ is a key pillar of the Reserve Bank’s regulatory framework.
The Bank Financial Strength Dashboard (the ‘dashboard’) is an interactive online disclosure tool that provides more than 100 metrics on individual banks in a comparable and accessible form. It puts better information in the hands of market participants – including retail depositors, professional investors and rating agencies – so that they can scrutinise the behaviour of banks more effectively.
The Reserve Bank has published three iterations of the dashboard. Early usage statistics have been positive, with the vast majority of visits being from New Zealanders and around 15 percent of users being return visitors. This indicates that people are using the dashboard as a resource, rather than just as a one-off curiosity.
The Reserve Bank is committed to improving the dashboard in response to user needs. The Reserve Bank plans to develop a public application programming interface (API) for the dashboard, which will make it easier to analyse and report the data. The Reserve Bank has begun work on a version in te reo Māori, and will explore options for extending disclosure dashboards to other sectors, such as the insurance and non-bank deposit taker sectors.
42RESERVE BANK OF NEW ZEALAND / FINANCIAL STABILITY REPORT, NOVEMBER 2018
Mortgage bonds as collateral
New Zealand banks rely on a range of funding sources, including domestic and international financial markets. When financial markets are disrupted it can become difficult or costly for banks to access some forms of funding. To help mitigate the impact of funding market disruptions on New Zealand’s financial system, the Reserve Bank stands ready to lend to banks and other counterparties against eligible collateral.
The Reserve Bank is developing a new standard for mortgage bonds that can qualify for eligible collateral. The standard aims to improve the quality and liquidity of these bonds by making them more transparent and comparable. In doing so, the standard may support the development of the New Zealand mortgage bond market, which may provide an additional funding source during financial market disruptions, reducing the need for counterparties to transact with the Reserve Bank.
After consulting on a proposed standard in November 2017, the Reserve Bank published a summary of submissions in May. The Reserve Bank has since engaged several key domestic stakeholders to flesh out some of the details of the proposed standard and the supporting framework. These include the legal terms and conditions as well as the processes for providing data on the mortgages that sit behind the bonds.
In November the Reserve Bank issued an exposure draft on the proposed standard. The draft summarises changes the Reserve Bank proposes to make in response to the key issues raised by industry and sets them out for consultation.
The deadline for submissions is 22 February 2019. The Reserve Bank aims to publish a final policy defining the standard and supporting framework early in 2019.
EU Benchmark Regulation and BKBM
New European legislation regulates the benchmarks that can be used in financial market contracts. The EU Benchmark Regulation (BMR) prevents EU-supervised entities from using non-EU benchmarks within the EU in any new contracts entered into after 1 January 2020, unless a benchmark qualifies under the BMR.
New Zealand’s current regulatory regime for the Bank Bill Benchmark Rate (BKBM) is judged as not sufficient to meet the EU’s equivalence standard.6 This is because the BKBM and the New Zealand Financial Markets Association (NZFMA), the administrator of the BKBM, are not subject to ‘binding requirements’ under the BMR, and the NZFMA is not ‘authorised or registered’ in New Zealand. Without regulatory reform, the use of BKBM will be restricted in the EU from 1 January 2020.
New Zealand banks and other financial institutions make extensive use of interest rate and currency derivatives to hedge funding risks on their balance sheets. A significant reduction in EU counterparties able to enter into these transactions, due to non-recognition of BKBM under the BMR, could significantly increase the costs of hedging and potentially impede New Zealand banks’ ability to fund themselves.
6 The BKBM is the reference short-term interest rate used as a benchmark for New Zealand dollar floating rate resets in interest rate and currency derivatives. It is an interest rate set by participating banks each day for short-term maturities (generally 90 days) and is based on observable, published, traded rates.
43RESERVE BANK OF NEW ZEALAND / FINANCIAL STABILITY REPORT, NOVEMBER 2018
The Ministry of Business, Innovation and Employment (MBIE), with assistance from the FMA, the Reserve Bank and the NZFMA, is drafting legislation to establish a licensing regime for certain benchmark administrators. Under the proposed regime, benchmark administrators would be licensed and regulated by the FMA. The regime would capture the NZFMA as the administrator of the BKBM benchmark and any other organisations that produce significant New Zealand benchmarks.
The proposed legislation is expected to progress through Parliament in the first half of 2019. Alongside this, MBIE will apply to the European Commission to gain equivalence as a third-country administrator, with a view to achieving equivalence by the end of 2019.
Foreign margin requirements for over-the-counter derivatives
New Zealand banks source part of their funding from offshore, often by issuing debt that is denominated in other currencies. Movements in the exchange rate may make it more expensive to repay this debt, so banks enter into derivatives (e.g. cross-currency basis swaps) to manage this risk.
New rules being introduced by G20 countries require parties to these derivatives contracts to exchange security (known as ‘margin’). If one party to the contract defaults, the other may access the margin to cover the losses they would otherwise have incurred.
These rules have extraterritorial scope, and will cover some New Zealand entities (including large banks). However, some technical aspects of New Zealand law impede the ability of affected New Zealand entities to comply with these requirements. This could put at risk New Zealand banks’ ability to access derivative and offshore funding markets, creating risks to financial stability and potentially putting upward pressure on domestic interest rates.
A bill is currently being drafted that will address these impediments through targeted amendments to a number of acts. The amendments will mean that derivatives counterparties will be able to enforce their security interests over margin immediately, and ahead of other creditors, in the event of a derivative counterparty defaulting.
The amendments will apply only in relation to derivatives contracts that meet certain requirements, and only where those contracts were entered into by prescribed entities.
Subject to Cabinet approval, the Bill is likely to be introduced into Parliament shortly.
44RESERVE BANK OF NEW ZEALAND / FINANCIAL STABILITY REPORT, NOVEMBER 2018
AppendixReserve Bank enforcement actions
The Reserve Bank is the prudential regulator for the banking, insurance, payments and settlements, and non-bank deposit-taking sectors. It also has responsibility under legislation for preventing money laundering and the financing of terrorism. The Reserve Bank monitors entities’ compliance with their obligations under legislation administered by the Reserve Bank. In responding to identified non-compliance by an entity, the Reserve bank may consider it appropriate to take enforcement action. During the past 12 months, the Reserve Bank has undertaken the following public enforcement actions:
• February 2018 – the Reserve Bank successfully applied to the High Court to appoint McGrathNicol as interim liquidator for CBL Insurance Limited (‘CBL’). The Reserve Bank has reasonable grounds to believe that CBL breached directions issued under section 143 of the Insurance (Prudential Supervision) Act 2010 by making an unauthorised payment of €25 million to Alpha Insurance A/S and a series of payments to United Specialty Insurance Company. On 12 November the High Court placed CBL into permanent liquidation.
• May 2018 – an industry notice was issued regarding First American Title Insurance Company of Australia Pty Limited. This followed
a private warning for failing to disclose an overseas policyholder preference to a policyholder, as required under the Insurance (Prudential Supervision) Act 2010.
• May 2018 – a notice was issued regarding Chartered Savings Loan and Trust Limited (‘CSLT’). This followed a private warning for CSLT’s conduct in misrepresenting on its website and Facebook page that it is a licensed non-bank deposit taker (NBDT). Section 12(2) of the Non-bank Deposit Takers Act 2013 makes it an offence for a person that is not licensed as an NBDT to hold out that the person is a licensed NBDT.
• June 2018 – an industry notice was issued regarding Pacific International Insurance Pty Limited. This followed a private warning for failing to include its solvency ratio in its New Zealand branch financial statements for three consecutive years, as required under the Insurance (Prudential Supervision) Act 2010.