financial statement -...
TRANSCRIPT

SAN JOSE DEL MONTE CITY WATER DISTRICT
FINANCIAl STATEMENT For Year 2014
Note: Scheduled for Audit in 2015 (no specific date yet)
RunDilte: 02(26/2015
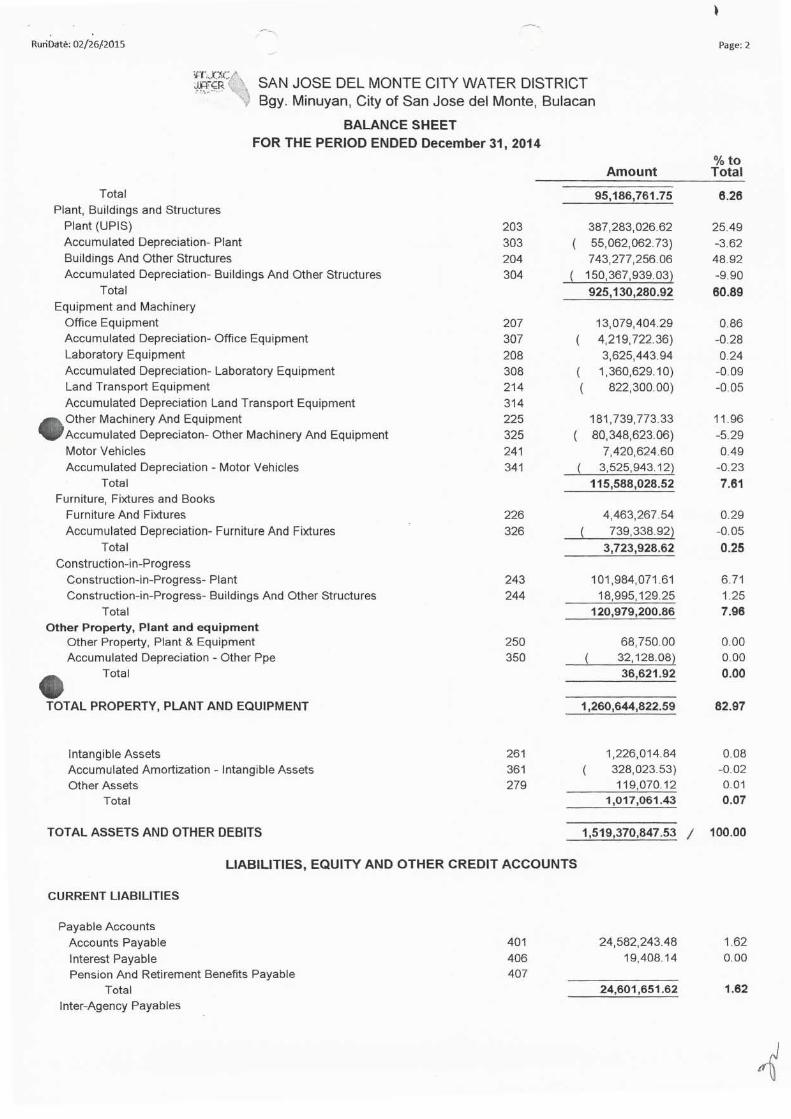
'i-T..}?c.!~, SAN JOSE DEL MONTE CITY WATER DISTRICT ,l~; ';: J<. \,:\ 'f Bgy. Minuyan, City of San Jose del Monte, Bulacan
BALANCE SHEET
FOR THE PERIOD ENDED December 31,2014
Total Plant, Buildings and Structures
Plant (UP IS)
Accumulated Depreciation- Plant
Buildings And Other Structures Accumulated Depreciation- Buildings And Other Structures
Total
Equipment and Machinery Office Equipment Accumulated Depreciation- Office Equipment
Laboratory Equipment Accumulated Depreciation- Laboratory Equipment Land Transport Equipment
Accumulated Depreciation Land Transport Equipment ... Other Machinery And Equipment ., Accumulated Depreciaton- Other Machinery And Equipment
Motor Vehicles Accumulated Depreciation - Motor Vehicles
Total Furniture, Fixtures and Books
Furniture And Fixtures
Accumulated Oepreciation- Furniture And Fixtures
Total
Construction-in-Progress Construction-in-Progress- Plant Construction-in-Progress- Buildings And Other Structures
Total Other Property, Plant and equipment
Other Property, Plant & Equipment Accumulated Depreciation - Other Ppe
Total
TOTAL PROPERTY, PLANT AND EQUIPMENT
Intangible Assets Accumulated Amortization - Intangible Assets Other Assets
Total
TOTAL ASSETS AND OTHER DEBITS
203 303
204 304
207 307
208 308 214
314 225 325
241 341
226
326
243 244
250 350
261 361 279
(
LIABILITIES, EQUITY AND OTHER CREDIT ACCOUNTS
CURRENT LIABILITIES
Payable Accounts Accounts Payable
Interest Payable Pension And Retirement Benefits Payable
Total Inter-Agency Payables
401 406 407
Amount
95,186,761.75
387,283,026.62
55,062,062.73) 743,277,256.06
150,367,939.03)
925,130,280.92
13,079,404.29
4,219,722.36) 3,625,443.94
1,360,629.10)
( 822,300.00)
181,739,773.33 80,348,623.06)
7,420,624.60 3,525,943.12)
115,588,028.52
4,463,267.54
739,338.92)
3,723,928.62
101,984,071 .61 18,995,129.25
120,979,200.86
68,750.00 32,128.08)
36,621.92
1,260,644,822.59
1,226,014.84 328,023.53) 119,070.12
1,017,061.43
1,519,370,847.53
24,582,243.48 19,408.14
24,601,651.62
I
Page: 2
%to Total
6.26
25.49 -3.62 48.92
-9.90
60.89
0.86 -0.28
0.24 -009 -0.05
11 .96
-5.29
0.49 -0.23
7.61
0.29 -0.05
0.25
6.71 1.25 7.96
000 0.00
0.00
62.97
0.08 -0.02 0.01 0.07
100.00
1.62 0.00
1.62
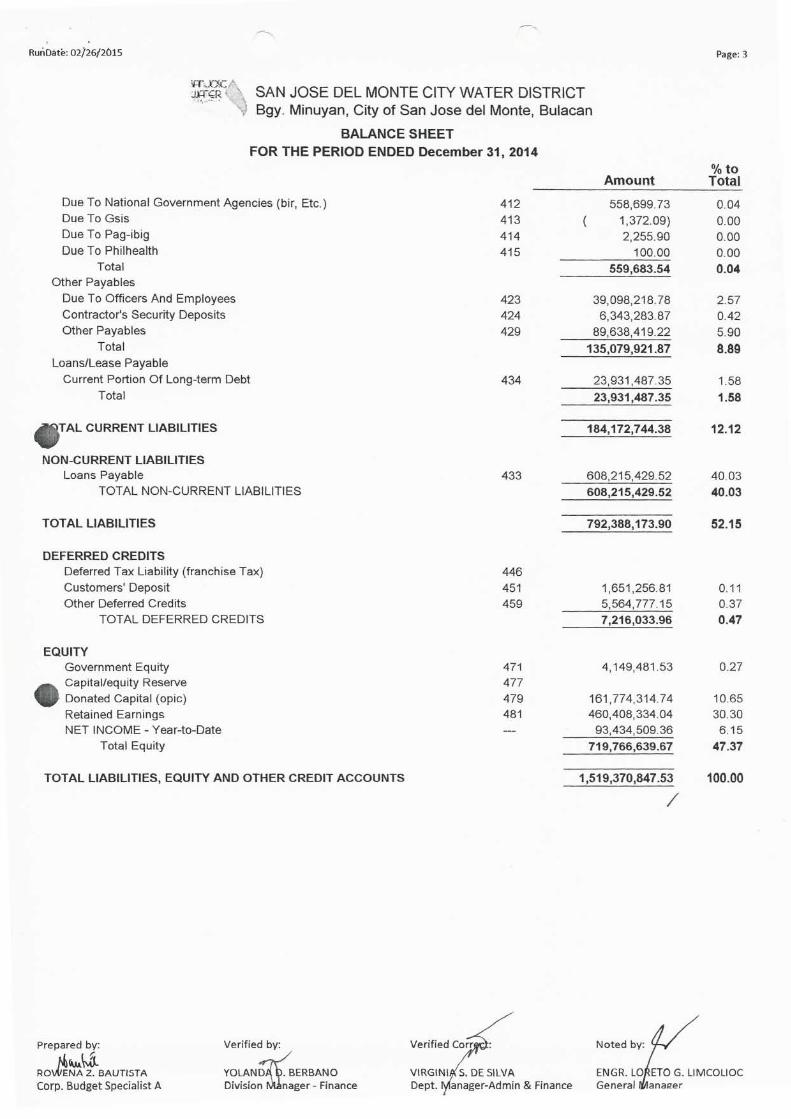
Run Date: 02/26/2015 Page: 3
~gs/\ SAN JOSE DEL MONTE CITY WATER DISTRICT ', : " .t, -:"':' ,.,~ \
\) Bgy. Minuyan, City of San Jose del Monte, Bulacan
BALANCE SHEET FOR THE PERIOD ENDED December 31,2014
Due To National Government Agencies (bir, Etc.) Due To Gsis Due To Pag-ibig Due To Philhealth
Total Other Payables
Due To Officers And Employees Contractor's Security Deposits Other Payables
Total
Loans/Lease Payable Current Portion Of Long-term Debt
Total
TAL CURRENT LIABILITIES
NON-CURRENT LIABILITIES Loans Payable
TOTAL NON-CURRENT LIABILITIES
TOTAL LIABILITIES
DEFERRED CREDITS Deferred Tax Liability (franchise Tax) Customers' Deposit Other Deferred Credits
TOTAL DEFERRED CREDITS
EQUITY Government Equity Capital/equity Reserve Donated Capital (opic) Retained Earnings NET INCOME - Year-to-Date
Total Equity
TOTAL LIABILITIES, EQUITY AND OTHER CREDIT ACCOUNTS
Prepared by:
M \Ji.. Ro\,.(iE~ Z. BAUTISTA Corp. Budget Specialist A
Verified by:
YOLAN~ERBANO DiViSio~~~!ger - Finance
Verified Carr
412 413 414 415
423 424 429
434
433
446 451 459
471 477 479 481
VIRGINI S. DE SILVA Dept. anager-Admin & Finance
Amount
558,699.73 1,372.09) 2,255.90
100.00
559,683.54
39,098,218.78 6,343,283.87
89,638,419.22
135,079,921.87
23,931,487.35
23,931,487.35
184,172,744.38
608,215,429.52 608,215,429.52
792,388,173.90
1,651,256.81 5,564,777.15 7,216,033.96
4,149,481 .53
161,774,314.74 460,408,334.04
93,434,509.36
719,766,639.67
1,519,370,847.53
/
%to Total
0.04
0.00 0.00 000
0.04
2.57 0.42
5.90
8.89
1.58
1.58
12.12
40.03
40.03
52.15
0.11 0.37 0.47
0.27
10.65 30.30 6.15
47.37
100.00
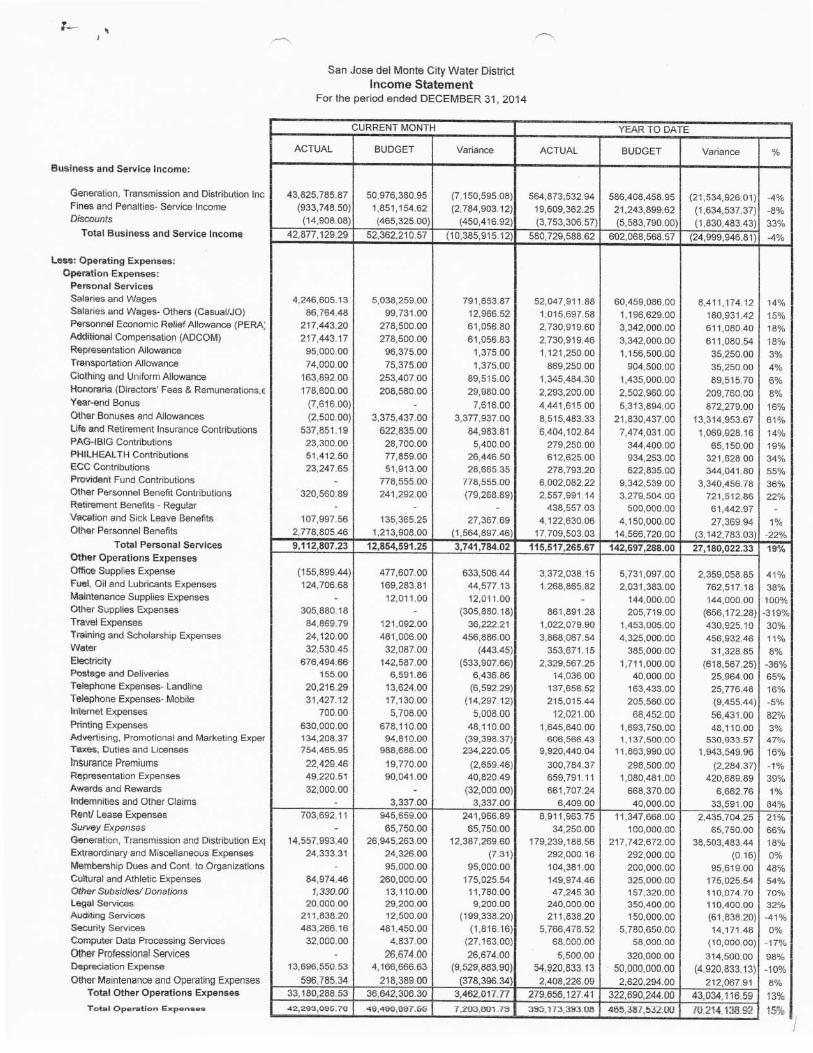
Business and Service Income:
Generation, Transmission and Distribution Inc Fines and Penalties- Service Income Discounts
Total Business and Service Income
Less: Operating Expenses: Operation Expenses:
Personal Services Salaries and Wages Salaries and Wages- Others (CasuaIlJO) Personnel Economic Relief Allowance (PERA Additional Compensation (ADCOM) Repl"esentation Allowance Transportation Allowance Clothing and Uniform Allowance
,
Honoraria (Directors' Fees & Remunerations,€ Year-end Bonus Other Bonuses and Allowances Lifu and Retirement Insurance Contributions PAG-IBIG Contributions PHllHEAL TH Contributions ECC Contributions Provident Fund Contributions Other Personnel Benefit Contributions Retirement Benefits - Regular Vacation and Sick Leave Benefits Other Personnel Benefits
Total Personal Services Other Operations Expenses Office Supplies Expense Fuel, Oil and Lubricants Expenses Maintenance Supplies Expenses Other Supplies Expenses Travel Expenses Training and Scholarship Expenses Water Electricity Postage and Deliveries Telephone Expenses- Landline Telephone Expenses- Mobile Internet Expenses Printing Expenses
I
Advertising, Promotional and Marketing Expe Taxes, Duties and Licenses
Insurance Premiums Representation Expenses Awards and Rewards Indemnities and Other Claims Rent! Lease Expenses Survey Expenses
r I
I Generation, Transmission and Distribution Ex Extraordinary and Miscellaneous Expenses Membership Dues and Cont. to Organizations Cultural and Athletic Expenses Other Subsidies! Donations Legal SeNices Auditing SeNices Security Services Computer Data Processing Services Other Professional Services Depreciation Expense
Other Maintenance and Operating Expenses Total Other Operations Expenses
T o t.al 0p9ration I;xpenses
I
San Jose del Monte City Water District
income Statement For the period ended DECEMBER 31,2014
CURRENT MONTH
ACTUAL BUDGET Variance
43,825,785.87 50,976,380.95 (7,150,59508) (933,748.50) 1,851,154.62 (2,784,903 12)
(14,908.08) (465,325.00) (450,416.92)
42,877,129.29 52,362,210,57 (10,385,915,12)
4 ,246,605,13 5,038,259,00 791,653.87 86,764.48 99,731.00 12,966.52
217,443.20 278,500,00 61,056,80 217,443,17 278,500.00 61,056.83
95,000,00 96,375.00 1,375,00 74,000.00 75,375.00 1,375,00
163,892,00 253,407,00 89,515.00 178,600.00 208,580,00 29,980,00
(7,616,00) - 7,616,00 (2,50000) 3,375,437,00 3,377,937,00
537,851,19 622,835.00 84,983,81 23,300.00 28,700,00 5,400,00 51,412.50 77,859,00 26,446,50 23,247,65 51 ,913,00 28,665,35
- 778,555,00 778,555,00 . 320,560:89
1
241,292,00 (79,268,89) - -
107,997.56 135,365,25 27,367.69 2,778,805.46 1,213,908.00 (1,564,897.46)
9,112,807.23 12,854,591,25 3,741,784.02
(155,899.44) 477,607.00 633,506.44 124,706,68 169,283.81 44,577,13
- 12,011 .00 12,011.00 305,880.18 - (305,880.18)
84,869.79 121 ,092.00 36,222,21
24,120.00 481,006.00 456,886,00 32,530.45 32,087.00 (443.45)
676,494.66 142,587.00 (533,907.66) 155.00 6,591,86 6,436,86
20,216.29 13,624.00 (6,592,29) 31,427.12 17,130,00 (14,297.12)
700.00 5,708.00 5,008.00 630,000,00 678,110.00 48,110.00 134,208,37 94,810,00 (39,398,37) 754,465.95 988,686,00 234,220.05
22,429.46 19,770,OO (2,659.46) 49,220,51 90,041.00 40,820.49 32,000,00 - (32,00000)
- 3,337.00 3,337.00 703,692.11 945,659,00 241,966.89
- 65,750,00 65,750,00 14,557,993,40 26,945,263,00 12,387,269,60
24,333,31 24,326,00 (7,31) - 95,000,00 95,000,00
84,974.46 260,000.00 175,025.54 1,330,00 13,110.00 11,780,00
20,000.00 29,200.00 9,200,00 211,838.20 12,500,00 (199,338.20) 483,266.16 481,450,00 (1,816.16)
32,000.00 4,837,00 (27,16300)
- 26,674.00 26,674.00 13,696.550.53 4,166,666,63 (9,529,883.90)
596.785.34 218,389.00 (378,39634)
33,180,288.53 36,642,306.30 3,462,017.77
421293,095.7<$ .49,496,657.:;:> 7 ,ZOCi,001 .. n
YEAR TO DATE
ACTUAL BUDGET Variance %
564,873,532.94 586,408,458.95 (21,534,926.01) -4% 19,609,362.25 21,243,899.62 (1,634,537.37) -8% (3,753,306.57) (5,583,790,00) (1,830,48343) 33%
580,729,588,62 602,068,568.57 (24,999,946.81) -4%
52,047,911 .88 60,459,086.00 8,411 ,174.12 14% 1,015,697.58 1,196,629,00 180,931.42 15% 2,730,919.60 3,342,000,00 611,080.40 18% 2,730,91946 3,342,000.00 611,080,54 18% 1,121,250.00 1,156,500.00 35,250,00 3%
869,250.00 904,500.00 I 35,250,00 4% 1,345,484,30 1,435,000.00 89,515,70
6% I 2,293,200.00 2,502,960,00 I 209,760.00 8% 4,441,615,00 5,313,894,00 872,279.00 16% 8,515.483.33 21 ,830,437,00 13,314,953.67 61% 6,404,102,84 7,474,031.00 1,069,928,16 14%
279,250.00 344,400,00 65,150.00 19% 612,625.00 934,253.00 321,628,00 34% 278,793,20 622,835,00 344,041,80 55%
6,002,082.22 9,342,539.00 3,340,456,78 36% 2,557,991 .14 3,279,504,00 721,512,86 22%
438,557.03 500,000,00 61,442,97 -
4,122,630.06 4,150,000,00 27,369.94 1% 17,709,503,03 14,566,720,00 (3,142,783,03) -22%
115,517,265,67 142,697,288,00 27,180,022.33 19%
3,372,038,15 5,731,097.00 2,359,058.85 41% 1,268,865.82 2,031 ,383.00 762,517 ,18 38%
- 144,000,00 144,000.00 100% 861,891,28 205,719,00 (656,172.28) -319%
1,022,079.90 1,453,005,00 430,925.10 30% 3,868,067.54 4,325,000,00 456,932.46 11%
353,671.15 385,000.00 31,328,85 8% 2,329,567.25 1,711,000,00 (618,567.25) -36%
14,036.00 40,000,00 25,964,00 65%
137,656.52 1 163,433,00 25,776.48 16% 215,015.44 205,560,00 (9,455.44) -5%
12,021 .00 68,452.00 56,431,00 82% 1,645,640.00 1,693,750,00 48,110,00 3%
606,566.43 1,137,500.00 530,933,57 470/0
9,920,440.04 11 ,863,990.00 1,943,549,96 16% 300,784,37 298,500.00 (2,284.37) -1% I 659,791.11 1,080,481,00 420,689,89 39% I 661 ,707.24 668,370.00 6,662.76 1%
6,409.00 40,000.00 33,591,00 84% 8,911,963.75 11 ,347,668.00 2,435,104,25 21%
34,250,00 100,000.00 65,750,00 I 66% 179,239,188.56 217,742,672.00 38,503,483.44 18%
292,000.16 292,000.00 (0.16) 0% 104,381.00 200,000.00 95,619,00 48% 149,974.46 325,000,00 175,025,54 54% 47,245.30 157,320.00 110,074.70 70%
240,000.00 350,400,00 110,400.00 32% 211 ,838.20 150,000,00 (61 ,83820) -41 %
5,766,4 78.52 5,780,650,00 14,171.48 0% I 68.00000 58,000.00 I (10,000.00) -17% 5,500.00 320,000.00 314,50000 98%
54,920,833.13 50,000,000,00 (4,920,83313) -10% 2,408,226.09 I 2,620,294,00 212,067.91 8%
279,656,127.41 322,690,244.00 43,034,116.59 13% :l1l:;.173 ,3KI,Ol) 4B~,31IT .532_00 I 70,214,138,92 15%
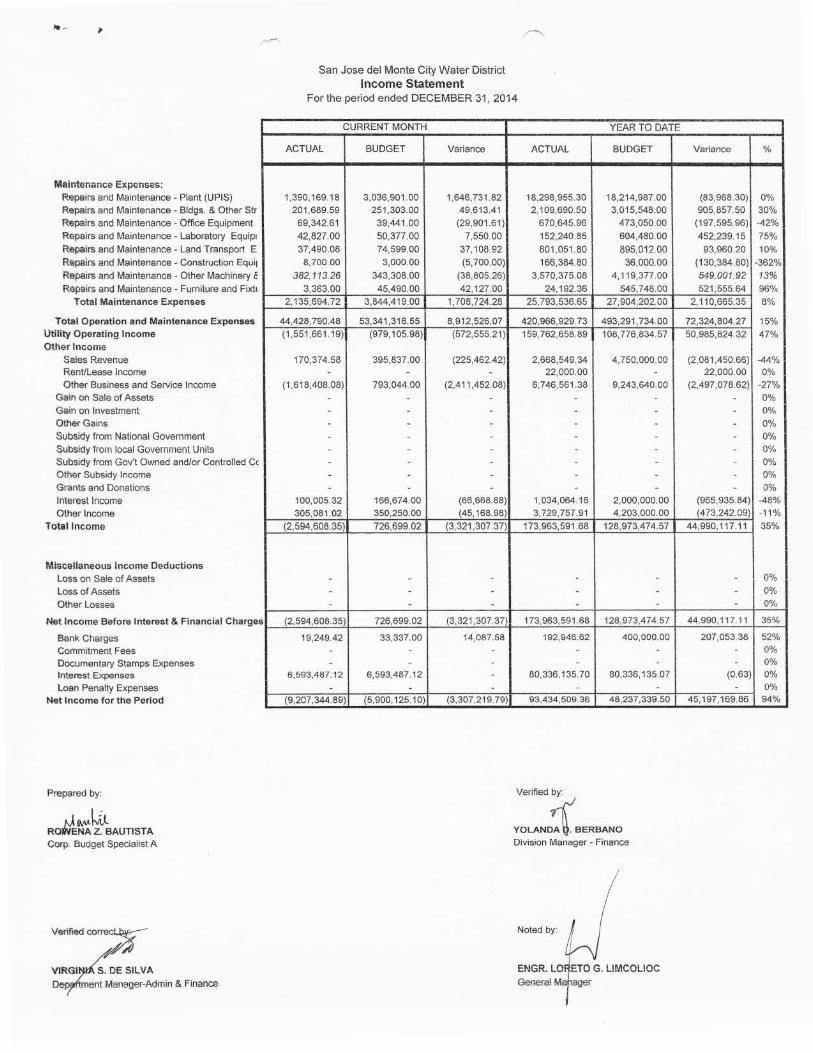
Maintenance Expenses: Repairs and Maintenance - Plant (UP IS) Repairs and Maintenance - Bldgs. & Other Str
Repairs and Maintenance - Office Equipment Repairs and Maintenance - Laboratory Equip,
Repairs and Maintenance - Land Transport E
Repairs and Maintenance - Construction Equil
Repairs and Maintenance - Other Machinery 8 Repairs and Maintenance - Furnitu;e and Fixtl
Tota! Maintenance Expenses
Total Operation and Maintenance Expenses Utility Operating Income
Other Income Sales Revenue Rent/Lease Income
Other Business and Service Income Gain on Sale of Assets
Gain on Investment Other Gains
Subsidy from National Government
Subsidy from local Government Units Subsidy from Gov't Owned and/or Controlled Cc Other Subsidy Income
Grants and Donations
Interest Income Other Income
Total Income
Miscellaneous Income Deductions
Loss on Sale of Assets
loss of Assets Other losses
Net Income Before Interest & Financial Charge s
Bank Charges Commitment Fees Documentary Stamps Expenses Interest Expenses loan Penalty Expenses
Net Income for the Period
Prepared by:
W RO~~Z. BAUTISTA Corp. Budget Speciaiist A
S. DE SILVA
ent Manager-Admin & Finance
San Jose del Monte City Water District Income Statement
For the period ended DECEMBER 31> 2014
CURRENT MONTH
ACTUAL BUDGET
1,390,169.18 3,036,901.00 201 ,689.59 251 ,303.00
69,342.61 39,441.00
42,827.00 50,377.00 37,490.08 74,599.00
8,70000 3,000.00
382, 113.26 343,308.00
3,363.00 45,490.00
2,135,694.72 3,844,419.00
44,428,790.48 53,341,316.55
(1 ,551,661.19) (979,105.98)
170,374.58 395,837.00 - -
(1,618,40808) 793,044.00
- -- -- -- -- -- -
- -- -
100,005.32 166,674.00 305,081.02 350,250.00
(2,594,60835) 726,699.02
- -- -
- -
(2,594,608.35) 726,699,02
19,249.42 33,337.00
- -- -
6,593,487.12 6,593,487.12
- -(9,207,344.89) (5,900,125.10)
Variance
1,646,731 .82 49,613.41
(29,901.61)
7,550.00
37,108.92 1 (5,700.00)
(38,805.26)
42,127.00
1,708,724.28
8,912,526.07 (572,555.21)
(225,462.42) -
(2,411,452.08)
----
-
-
-
-(66,668.68) (45,168.98)
(3,321,30737)
- I --
(3,321 ,307.37)
14,087.58
--
-(3,307,219.79)
YEAR TO DATE
ACTUAL BUDGET
18,298,955.30 18,214,987.00 2,109,690.50 3,015,548.00
670,645.96 473,050.00
152,240.85 604,480.00
801 ,051 .80 895,012.00 I 166,384.80 36,000.00 I
3,570,375.08 4,119,377.00
24,192.36 545,748.00
25,793,536.65 27,904,202.00
420,966,929.73 493,291 ,734.00
i 59, 762,658.89 108,1/6,834.57
2,668,549.34 4,750,000.00 22,000.00 -
6,746,561.38 9,243,640.00
- -- -- -- - I - -
- -
- -
- -1,034,064.16 2,000,000.00 3,729,757.91 4,203,000.00
173,963,591 .68 128,973,474.57
- -- -- -
173,963,591 ,68 128,973,474.57
192,946.62 400,000.00
- -
- -80,336,135.70 80,336,135.07
-93,434,509.36 48,237,339.50
Verified by:
YOLAND~BERBANO Division Manager - Finance
Variance %
(83.968.30) 0% 905,857.50 30%
(197,595.96) -42%
452,239.15 75%
93,960.20 10%
(130,384.80) -362%
549,001.92 13% 521,555.64 96%
2,110,665.35 8%
72,324,804.27 15%
50,985,824.32 47%
(2,081,450.66) -44% 22,000.00 0%
(2,497,078.62) -27%
- 0%
- 0% I - 0% - 0%
- 00/0 - 0%
- 0%
- 0% (965,935.84) -48% (473,242.09) -11%
44,990,117.11 35%
I - I 00
/0 1 - 0%
- 0%
44,990,117.11 35%
207,053.38 52% I
- 0%
- 0% (0.63) 0%
- 0% 45,197,169.86 94%
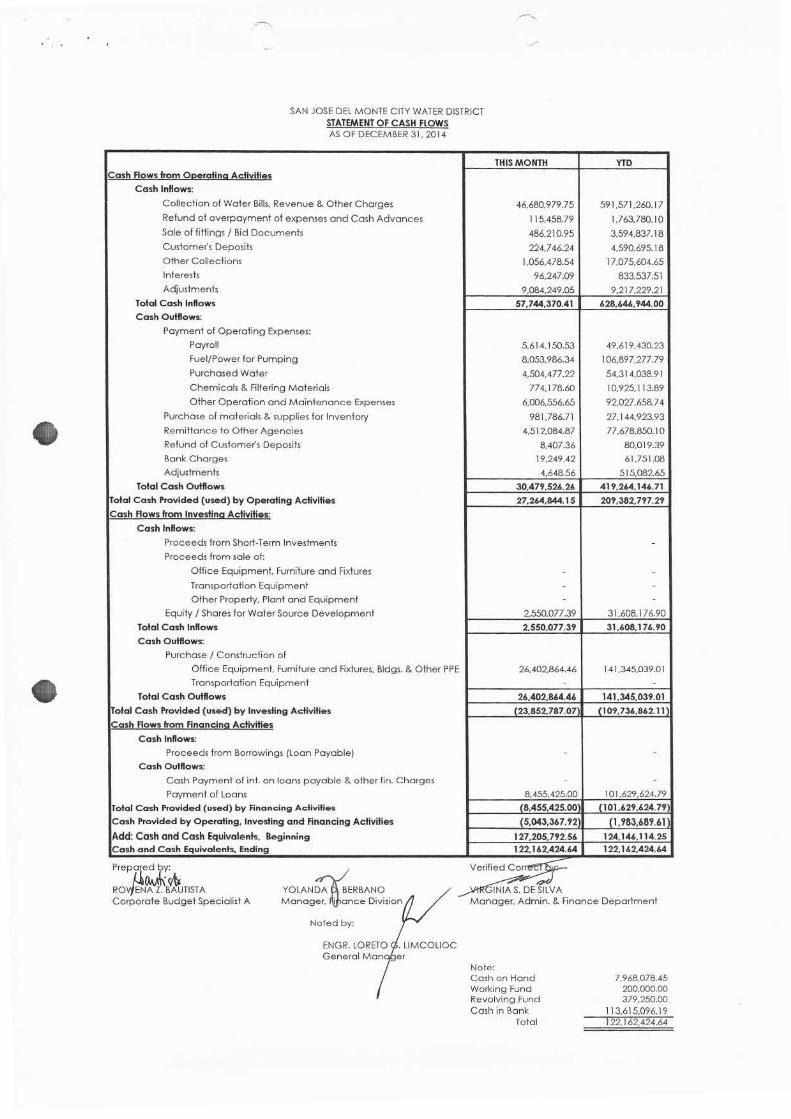
Cash Flows from Operating Activities
Cash Inflows:
SAN JOSE DEL MONTE CITY WATER DISTRICT STATEMENT OF CASH FLOWS AS OF DECEMBER 31. 2014
Collection of Water Bills. Revenue & Other Charges
Refund of overpayment of expenses and Cash Advances
Sale of fittings / Bid Documents
Customer's Deposits
Other Collections
Interests
Adjustments
Total Cash Inflows
Cash Outflows:
Payment of Operating Expenses:
Payroll
Fuel/Power for Pumping
Purchased Water
Chemicals & Filtering Materials
Other Operation and Maintenance Expenses
Purchase of materials & supplies for Inventory
Remittance to Other Agencies
Refund of Customer's Deposits
Bank Charges
Adjustments
Total Cash Outflows
Total Cash Provided (used) by Operating Activities
Cash Flows from Investing Activities:
Cash Inflows:
Proceeds from Short-Term Investments
Proceeds from sale of:
Office Equipment. Furniture and Fixtures
Transportation Equipment
Other Property, Plant and Equipment
Equity / Shares for Water Source Development
Total Cash Inflows
Cash Outflows:
Purchase / Construction of
Office Equipment. Furniture and Fixtures. Bldgs. & Other PPE
Transportation Equipment
Total Cash Outflows
Total Cash Provided (used) by Investing Activities
Cash Flows from Financing Activities
Cash Inflows:
Proceeds from Borrowings (Loan Payable)
Cash Outflows:
Cash Payment of into on loans payable & other fin. Charges
Payment of Loans
Total Cash Provided (used) by Financing Activities
Cash Provided by Operating, Investing and Financing Activities
Add: Cash and Cash Equivalents, Beginning
Cash and Cash Equivalents, Ending
THIS MONTH
46.680.979.75
115.458.79
486.210.95
224.746.24
1.056.478.54
96.247.Q9
9.084.249.05
57,744,370.41
5.614.150.53
8.053.986.34
4.504.477.22
774.178.60
6.006.556.65
981.786.71
4.512.084.87
8.407.36
19.249.42
4.648.56
30.479.526.26
27,264,844.15
-
-
-
2.550.077.39
2,550.077.39
26.402.864.46
-
26,402,864.46
(23,852.787.07)
-
-
8.455.425.00
(8,455,425.00)
(5,043,367.92)
127,205,792.56
122.162,424.64
M~ preJJa ed by: verified~~
RO ENA Z. BAUTISTA
YTD
591.571.260.17
1.7 63.780.10
3.594.837.18
4.590.695.18
17.075.604.65
833.537.51
9.217,229.21
628,646.944.00
49.619.430.23
106.897.277.79
54.314.038.91
10.925.113.89
92.027.658.7 4
27.144.923.93
77.678.850.10
80.019.39
61.751.08
515.082.65
419.264.146.71
209,382,797.2'1
-
-
--
31.608.176.90
31,608,176.90
141.345.039.01 -
141.345,039.01
(10'1.736,862.11
-
-
101.629.624.79
(101,629,624.79)
(1,983,689.61
124,146,114.25
122,162,424.64
Corporate Budget SpeCialist A YOLAN~ERBANO Manag~~ ~~~ce DIviSIon
~~EflfvA. Manager. Admin. & Finance Departmenl
Noted by:
. L1MCOLIOC
Note: Cash on Hand Working Fund Revolving Fund Cash in Bank
Tolal
7.968.078.45 200.000.00 379.250.00
113.615.096.19 122.162.424.64