financial statements 2017 - six-group.com · table of contents 4 six key figures 5 six consolidated...
TRANSCRIPT
Financial Statements 2017
Table of contents
4 SIX key figures5 SIXconsolidatedfinancial statements 20176 Full-yearreportofSIXasat31 December 20179 Consolidatedincomestatement10 Consolidatedstatementofcomprehensiveincome11 Consolidatedbalancesheet12 Consolidatedstatementofchangesinequity14 Consolidatedstatementofcashflows
15 Basisofpreparation15 1. General information
15 2. Significant accounting policies
26 3. Use of judgments and estimates
28 Performancefortheyear28 4. Segment information
31 5. Net interest income from banking business
32 6. Other operating income
32 7. Personnel expenses
33 8. Other operating expenses
34 9. Financial income and expenses
35 10. Interest income and expenses
35 11. Earnings per share
36 Incometaxes36 12. Income taxes
38 13. Deferred tax assets and liabilities
40 Assets40 14. Cash and cash equivalents
40 15. Trade and other receivables
42 16. Receivables and payables from clearing & settlement
43 17. Financial assets (current and non-current)
45 18. Disposal groups and assets held for sale
46 19. Inventories
46 20. Other assets (current and non-current)
47 21. Property, plant and equipment
48 22. Intangible assets and goodwill
52 Equityandliabilities52 23. Capital management
53 24. Capital and reserves
54 25. Provisions (current and non-current)
55 26. Other liabilities (current and non-current)
SIX consolidated financial statements 2017 3
56 Financialinstruments56 27. Financial risk management
62 28. Fair value of financial instruments
67 29. Derivative financial instruments
68 30. Offsetting
71 Groupcomposition71 31. Interests in other entities
76 32. Acquisitions of subsidiaries and non-controlling interests
80 Additionalinformation80 33. Assets pledged or assigned to secure own liabilities
80 34. Contingent liabilities
80 35. Operating leases
81 36. Defined benefit plans
86 37. Related party disclosures
88 38. Events after the balance sheet date
89 Statutoryauditor’sreportontheauditof the consolidated financial statements
91 SIXGroup Ltdfinancial statements 201792 1. Balance sheet
93 2. Income statement
94 3. Notes to the financial statements
101 4. Statement of changes in equity
101 5. Appropriation of profit
102 Reportofthestatutoryauditoron the financial statements
4 SIX consolidated financial statements 2017
SIX key figures
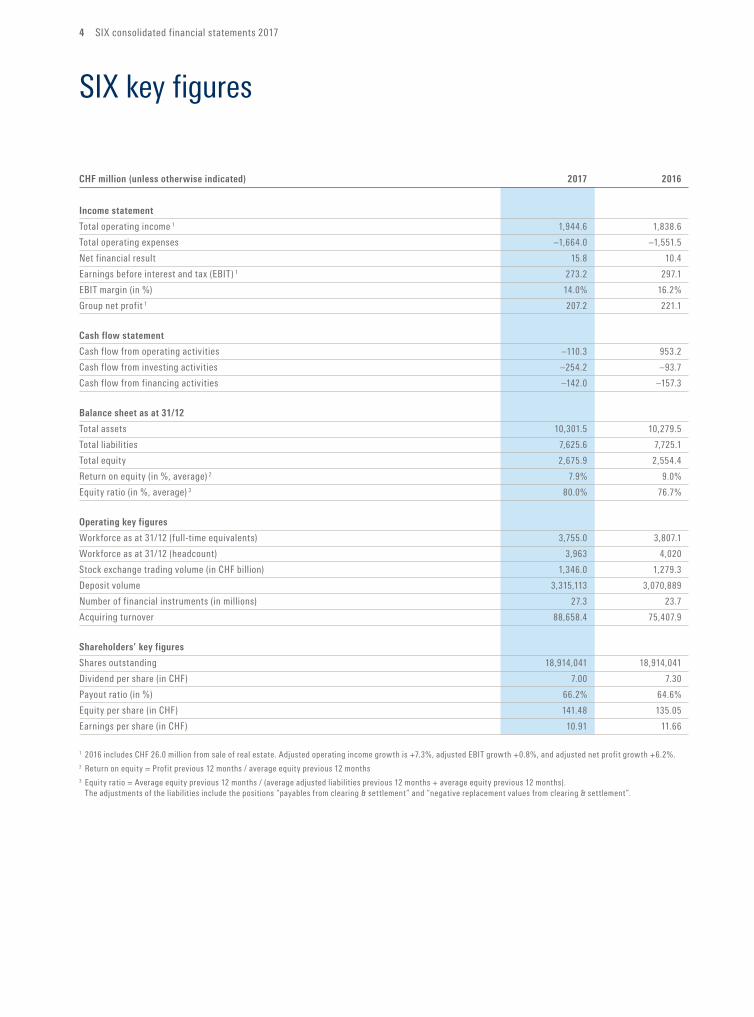
CHFmillion(unlessotherwiseindicated) 2017 2016
Incomestatement
Total operating income 1 1,944.6 1,838.6
Total operating expenses –1,664.0 –1,551.5
Net financial result 15.8 10.4
Earnings before interest and tax (EBIT) 1 273.2 297.1
EBIT margin (in %) 14.0% 16.2%
Group net profit 1 207.2 221.1
Cashflowstatement
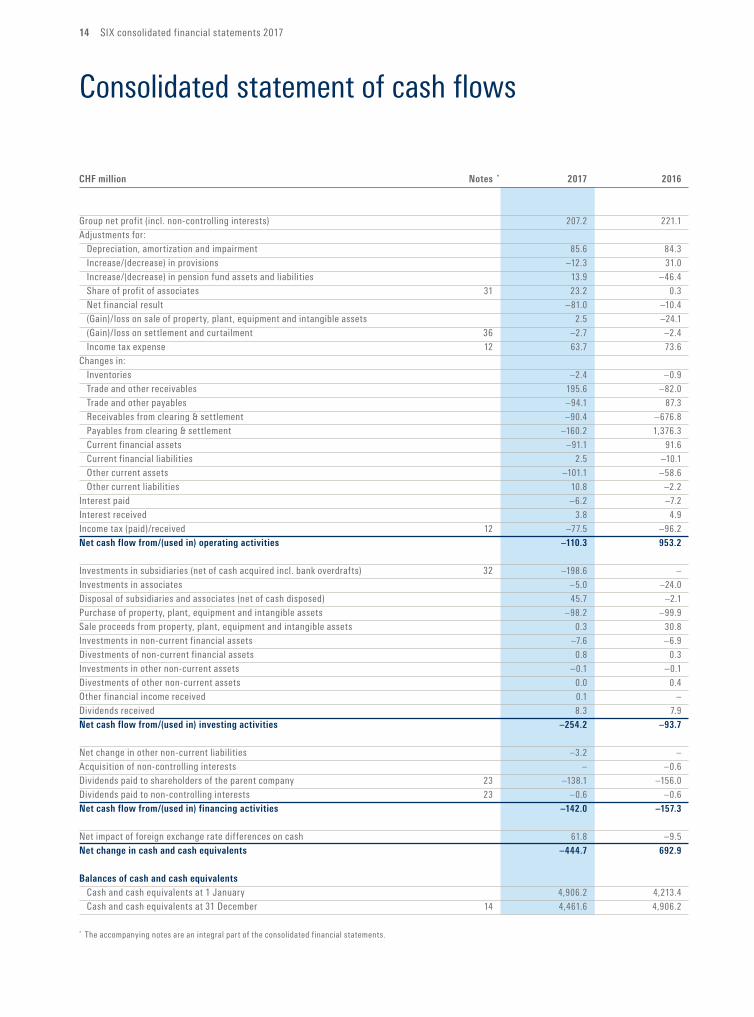
Cash flow from operating activities –110.3 953.2
Cash flow from investing activities –254.2 –93.7
Cash flow from financing activities –142.0 –157.3
Balancesheetasat31/12
Total assets 10,301.5 10,279.5
Total liabilities 7,625.6 7,725.1
Total equity 2,675.9 2,554.4
Return on equity (in %, average) 2 7.9% 9.0%
Equity ratio (in %, average) 3 80.0% 76.7%
Operating key figures
Workforce as at 31/12 (full-time equivalents) 3,755.0 3,807.1
Workforce as at 31/12 (headcount) 3,963 4,020
Stock exchange trading volume (in CHF billion) 1,346.0 1,279.3
Deposit volume 3,315,113 3,070,889
Number of financial instruments (in millions) 27.3 23.7
Acquiring turnover 88,658.4 75,407.9
Shareholders’keyfigures
Shares outstanding 18,914,041 18,914,041
Dividend per share (in CHF) 7.00 7.30
Payout ratio (in %) 66.2% 64.6%
Equity per share (in CHF) 141.48 135.05
Earnings per share (in CHF) 10.91 11.66
1 2016 includes CHF 26.0 million from sale of real estate. Adjusted operating income growth is +7.3%, adjusted EBIT growth +0.8%, and adjusted net profit growth +6.2%.2 Return on equity = Profit previous 12 months / average equity previous 12 months3 Equity ratio = Average equity previous 12 months / (average adjusted liabilities previous 12 months + average equity previous 12 months). The adjustments of the liabilities include the positions “payables from clearing & settlement” and “negative replacement values from clearing & settlement”.
SIX consolidated financial statements 2017 5
SIX consolidated financial statements 2017
6 SIX consolidated financial statements 2017
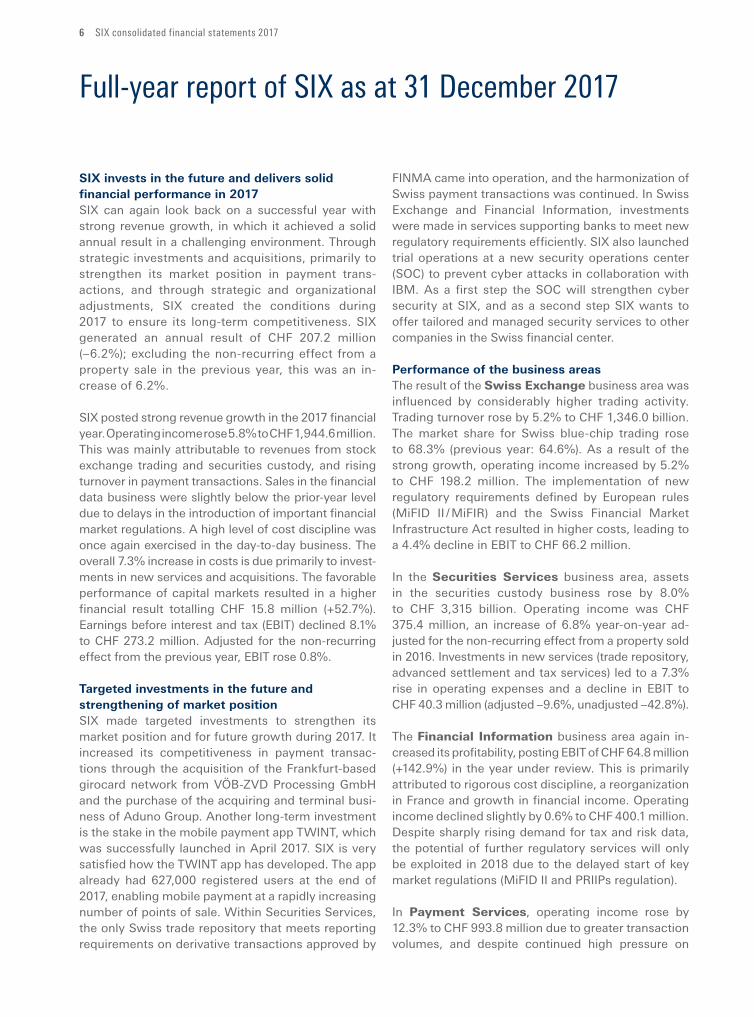
Full-year report of SIX as at 31 December 2017
SIX invests in the future and delivers solid financial performance in 2017SIX can again look back on a successful year with strong revenue growth, in which it achieved a solid annual result in a challenging environment. Through strategic investments and acquisitions, primarily to strengthen its market position in payment transactions, and through strategic and organizational adjustments, SIX created the conditions during 2017 to ensure its long-term competitiveness. SIX generated an annual result of CHF 207.2 million (–6.2%); excluding the nonrecurring effect from a property sale in the previous year, this was an increase of 6.2%.
SIX posted strong revenue growth in the 2017 financial year. Operating income rose 5.8% to CHF 1,944.6 million. This was mainly attributable to revenues from stock exchange trading and securities custody, and rising turnover in payment transactions. Sales in the financial data business were slightly below the prioryear level due to delays in the introduction of important financial market regulations. A high level of cost discipline was once again exercised in the daytoday business. The overall 7.3% increase in costs is due primarily to investments in new services and acquisitions. The favorable performance of capital markets resulted in a higher financial result totalling CHF 15.8 million (+52.7%). Earnings before interest and tax (EBIT) declined 8.1% to CHF 273.2 million. Adjusted for the non-recurring effect from the previous year, EBIT rose 0.8%.
Targeted investments in the future and strengthening of market positionSIX made targeted investments to strengthen its market position and for future growth during 2017. It increased its competitiveness in payment transactions through the acquisition of the Frankfurtbased girocard network from VÖBZVD Processing GmbH and the purchase of the acquiring and terminal business of Aduno Group. Another longterm investment is the stake in the mobile payment app TWINT, which was successfully launched in April 2017. SIX is very satisfied how the TWINT app has developed. The app already had 627,000 registered users at the end of 2017, enabling mobile payment at a rapidly increasing number of points of sale. Within Securities Services, the only Swiss trade repository that meets reporting requirements on derivative transactions approved by
FINMA came into operation, and the harmonization of Swiss payment transactions was continued. In Swiss Exchange and Financial Information, investments were made in services supporting banks to meet new regulatory requirements efficiently. SIX also launched trial operations at a new security operations center (SOC) to prevent cyber attacks in collaboration with IBM. As a first step the SOC will strengthen cyber security at SIX, and as a second step SIX wants to offer tailored and managed security services to other companies in the Swiss financial center.
Performance of the business areasThe result of the Swiss Exchange business area was influenced by considerably higher trading activity. Trading turnover rose by 5.2% to CHF 1,346.0 billion. The market share for Swiss bluechip trading rose to 68.3% (previous year: 64.6%). As a result of the strong growth, operating income increased by 5.2% to CHF 198.2 million. The implementation of new regulatory requirements defined by European rules (MiFID II / MiFIR) and the Swiss Financial Market Infrastructure Act resulted in higher costs, leading to a 4.4% decline in EBIT to CHF 66.2 million.
In the Securities Services business area, assets in the securities custody business rose by 8.0% to CHF 3,315 billion. Operating income was CHF 375.4 million, an increase of 6.8% year-on-year adjusted for the nonrecurring effect from a property sold in 2016. Investments in new services (trade repository, advanced settlement and tax services) led to a 7.3% rise in operating expenses and a decline in EBIT to CHF 40.3 million (adjusted –9.6%, unadjusted –42.8%).
The Financial Information business area again increased its profitability, posting EBIT of CHF 64.8 million (+142.9%) in the year under review. This is primarily attributed to rigorous cost discipline, a reorganization in France and growth in financial income. Operating income declined slightly by 0.6% to CHF 400.1 million. Despite sharply rising demand for tax and risk data, the potential of further regulatory services will only be exploited in 2018 due to the delayed start of key market regulations (MiFID II and PRIIPs regulation).
In Payment Services, operating income rose by 12.3% to CHF 993.8 million due to greater transaction volumes, and despite continued high pressure on

SIX consolidated financial statements 2017 7
margins. In processing for banks, the number of card transactions was up 9.2% to 3,997.9 million and revenue in acquiring increased 17.6% to CHF 88.7 billion. Operating expenses were 14.6% higher due to two strategic purchases, which put in place the requirements for the successful further development of the card business. Together with the additional expenses for the SIX stake in Twint AG, this resulted in a decline of 37.1% in EBIT to CHF 57.7 million.
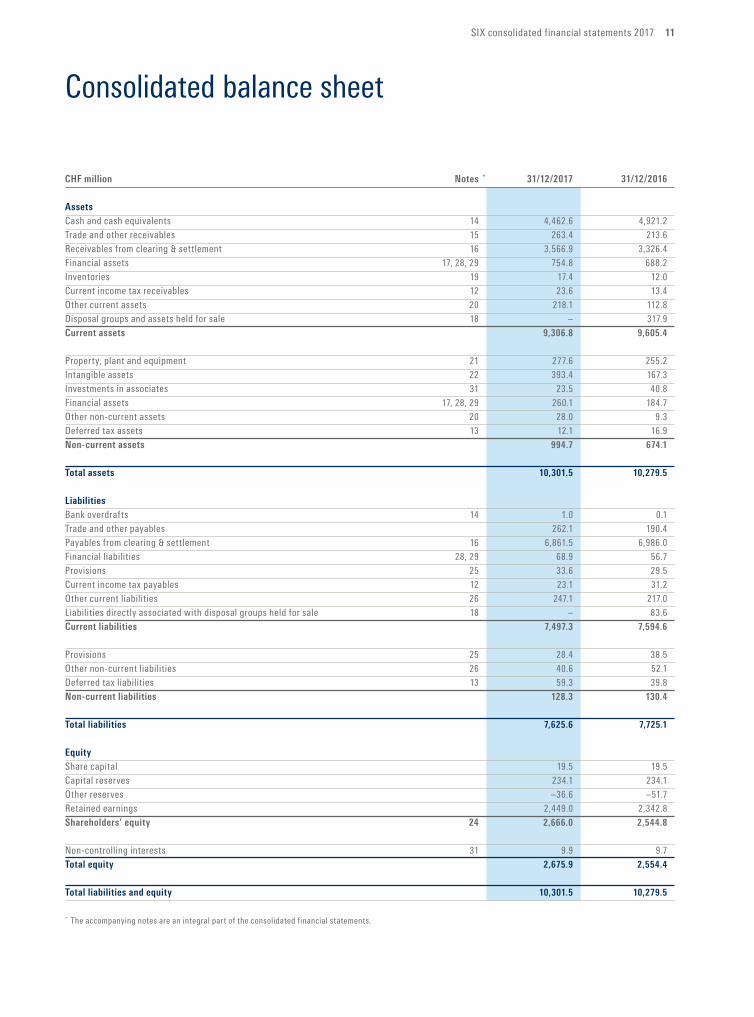
Balance sheet as of 31 December 2017As of 31 December 2017, balance sheet assets totaled CHF 10,301.5 million, an increase of CHF 22.0 million compared with 31 December 2016. The decrease in current assets (CHF –298.6 million) is mainly due to the ordinary movements in giro balances with the Swiss National Bank (SNB) (CHF –443.2 million) included in cash and cash equivalents and the movements in receivables from clearing & settlement in the Securities Services (CHF –188.0 million) and Payment Services (CHF +428.5 million) operating segments. Furthermore, the decrease is caused by the disposal groups and assets held for sale (CHF –317.9 million) due to the sale of the commercial issuing business of SIX Payment Services (Austria) GmbH. The increase in receivables from clearing & settlement in the Payment Services operating segment is mainly related to the acquisition of Aduno SA and VöB-ZVD Processing GmbH (CHF +214.4 million). In addition, the 2017 cutoff day was a Sunday, meaning this balance sheet item included additional days in 2017 compared with the balance as of 31 December 2016 and was therefore higher as a result. The
increase in non-current assets (CHF +320.6 million) is mostly due to the increases in intangible assets (CHF +226.1 million) – mainly related to the acquisitions mentioned above – and in financial assets (CHF +75.4 million).
Liabilities totaled CHF 7,625.6 million as of the balance sheet date, a decrease of CHF 99.5 million. The de crease in current liabilities (CHF –97.3 million) is mainly due to the ordinary movements in payables from clearing & settlement in the Securities Services (CHF –534.2 million) and Payment Services (CHF +409.6 million) operating segments. These movements are related to the abovementioned movements in giro balances with the Swiss National Bank (SNB) and in receivables from clearing & settlement. Noncurrent liabilities (CHF –2.1 million) remained stable compared with the previous year.
Equity increased by CHF 121.5 million in the reporting period to CHF 2,675.9 million. The increase is driven by the net profit for 2017 (CHF +207.2 million) and the actuarial gains on defined benefit plans net of tax (CHF +37.9 million) recognized in other comprehensive income, and is partially offset by the dividends paid (CHF –138.7 million).
Based on the good result and excellent liquidity and capital situation, an ordinary dividend of CHF 7.00 per share (previous year: CHF 7.30) will be proposed to the Annual General Meeting. This represents a total of CHF 136.7 million. The lower dividend is due to the slight decline in Group net profit.

SIX consolidated financial statements 2017 9
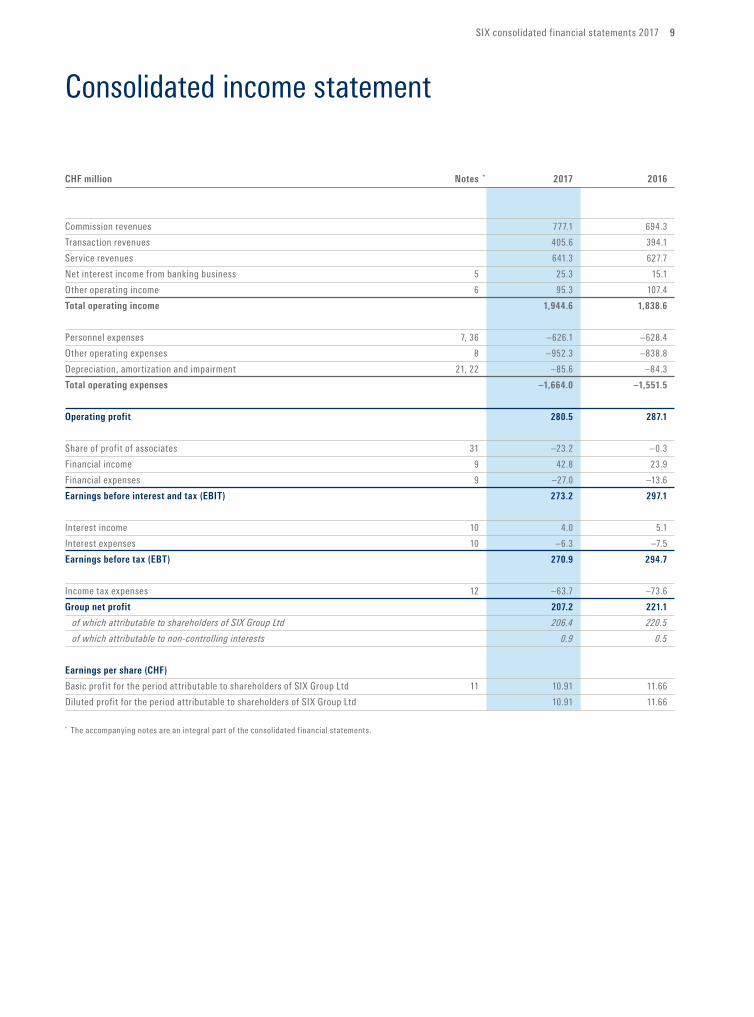
Consolidated income statement
CHFmillion Notes * 2017 2016
Commission revenues 777.1 694.3
Transaction revenues 405.6 394.1
Service revenues 641.3 627.7
Net interest income from banking business 5 25.3 15.1
Other operating income 6 95.3 107.4
Totaloperatingincome 1,944.6 1,838.6
Personnel expenses 7, 36 –626.1 –628.4
Other operating expenses 8 –952.3 –838.8
Depreciation, amortization and impairment 21, 22 –85.6 –84.3
Totaloperatingexpenses –1,664.0 –1,551.5
Operating profit 280.5 287.1
Share of profit of associates 31 –23.2 –0.3
Financial income 9 42.8 23.9
Financial expenses 9 –27.0 –13.6
Earningsbeforeinterestandtax(EBIT) 273.2 297.1
Interest income 10 4.0 5.1
Interest expenses 10 –6.3 –7.5
Earningsbeforetax(EBT) 270.9 294.7
Income tax expenses 12 –63.7 –73.6
Groupnetprofit 207.2 221.1
of which attributable to shareholders of SIX Group Ltd 206.4 220.5
of which attributable to non-controlling interests 0.9 0.5
Earningspershare(CHF)
Basic profit for the period attributable to shareholders of SIX Group Ltd 11 10.91 11.66
Diluted profit for the period attributable to shareholders of SIX Group Ltd 10.91 11.66
* The accompanying notes are an integral part of the consolidated financial statements.
10 SIX consolidated financial statements 2017
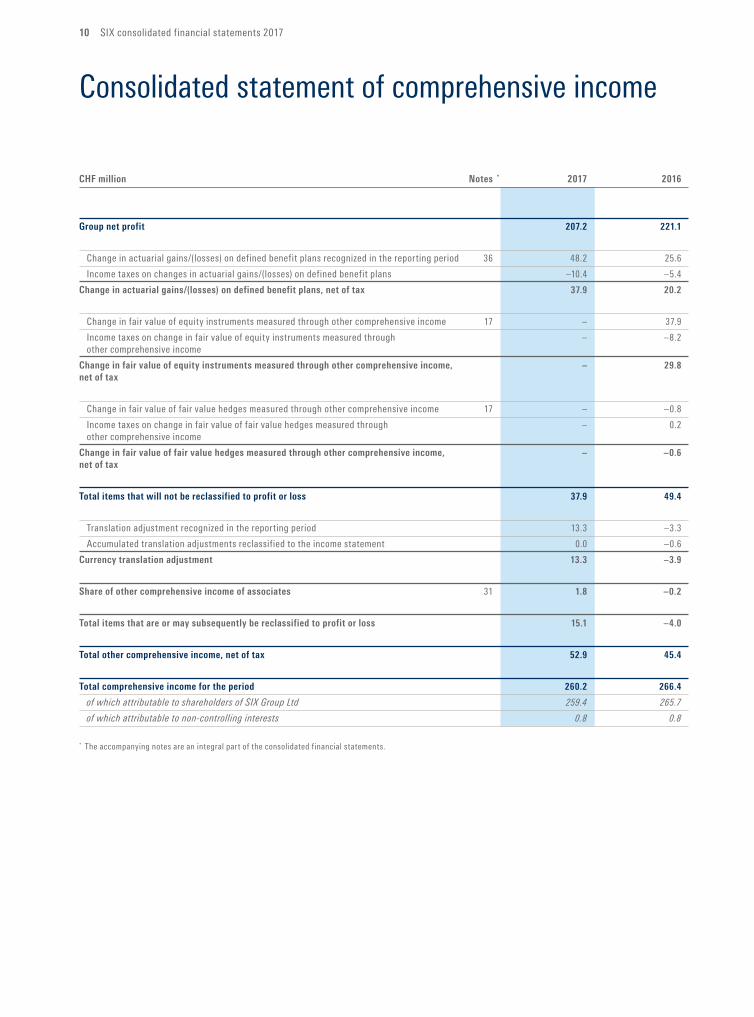
Consolidated statement of comprehensive income
CHFmillion Notes * 2017 2016
Groupnetprofit 207.2 221.1
Change in actuarial gains/(losses) on defined benefit plans recognized in the reporting period 36 48.2 25.6
Income taxes on changes in actuarial gains/(losses) on defined benefit plans –10.4 –5.4
Changeinactuarialgains/(losses)ondefinedbenefitplans,netoftax 37.9 20.2
Change in fair value of equity instruments measured through other comprehensive income 17 – 37.9
Income taxes on change in fair value of equity instruments measured through – –8.2
other comprehensive income
Changeinfairvalueofequityinstrumentsmeasuredthroughothercomprehensiveincome, – 29.8
netoftax
Change in fair value of fair value hedges measured through other comprehensive income 17 – –0.8
Income taxes on change in fair value of fair value hedges measured through – 0.2
other comprehensive income
Changeinfairvalueoffairvaluehedgesmeasuredthroughothercomprehensiveincome, – –0.6
netoftax
Totalitemsthatwillnotbereclassifiedtoprofitorloss 37.9 49.4
Translation adjustment recognized in the reporting period 13.3 –3.3
Accumulated translation adjustments reclassified to the income statement 0.0 –0.6
Currencytranslationadjustment 13.3 –3.9
Shareofothercomprehensiveincomeofassociates 31 1.8 –0.2
Totalitemsthatareormaysubsequentlybereclassifiedtoprofitorloss 15.1 –4.0
Totalothercomprehensiveincome,netoftax 52.9 45.4
Totalcomprehensiveincomefortheperiod 260.2 266.4
of which attributable to shareholders of SIX Group Ltd 259.4 265.7
of which attributable to non-controlling interests 0.8 0.8
* The accompanying notes are an integral part of the consolidated financial statements.
SIX consolidated financial statements 2017 11
Consolidated balance sheet
CHFmillion Notes * 31/12/2017 31/12/2016
Assets
Cash and cash equivalents 14 4,462.6 4,921.2
Trade and other receivables 15 263.4 213.6
Receivables from clearing & settlement 16 3,566.9 3,326.4
Financial assets 17, 28, 29 754.8 688.2
Inventories 19 17.4 12.0
Current income tax receivables 12 23.6 13.4
Other current assets 20 218.1 112.8
Disposal groups and assets held for sale 18 – 317.9
Current assets 9,306.8 9,605.4
Property, plant and equipment 21 277.6 255.2
Intangible assets 22 393.4 167.3
Investments in associates 31 23.5 40.8
Financial assets 17, 28, 29 260.1 184.7
Other non-current assets 20 28.0 9.3
Deferred tax assets 13 12.1 16.9
Non-current assets 994.7 674.1
Total assets 10,301.5 10,279.5
Liabilities
Bank overdrafts 14 1.0 0.1
Trade and other payables 262.1 190.4
Payables from clearing & settlement 16 6,861.5 6,986.0
Financial liabilities 28, 29 68.9 56.7
Provisions 25 33.6 29.5
Current income tax payables 12 23.1 31.2
Other current liabilities 26 247.1 217.0
Liabilities directly associated with disposal groups held for sale 18 – 83.6
Currentliabilities 7,497.3 7,594.6
Provisions 25 28.4 38.5
Other non-current liabilities 26 40.6 52.1
Deferred tax liabilities 13 59.3 39.8
Non-currentliabilities 128.3 130.4
Totalliabilities 7,625.6 7,725.1
Equity
Share capital 19.5 19.5
Capital reserves 234.1 234.1
Other reserves –36.6 –51.7
Retained earnings 2,449.0 2,342.8
Shareholders’equity 24 2,666.0 2,544.8
Non-controlling interests 31 9.9 9.7
Totalequity 2,675.9 2,554.4
Totalliabilitiesandequity 10,301.5 10,279.5
* The accompanying notes are an integral part of the consolidated financial statements.
12 SIX consolidated financial statements 2017
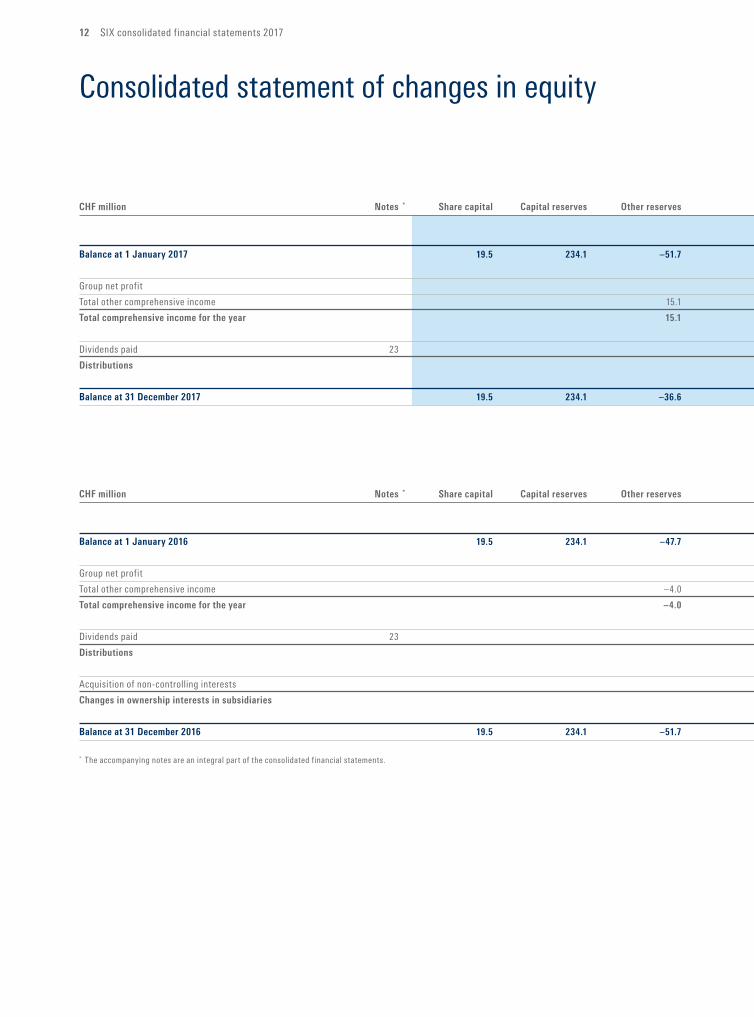
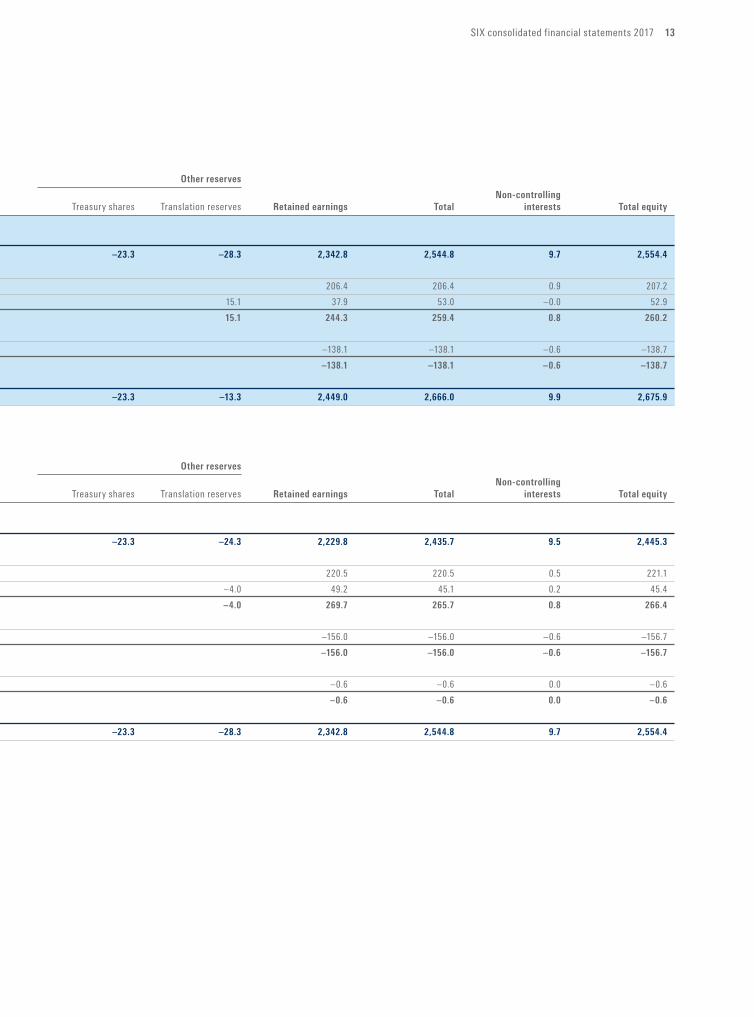
Consolidated statement of changes in equity
Otherreserves
Non-controlling
CHFmillion Notes * Sharecapital Capitalreserves Otherreserves Treasury shares Translation reserves Retainedearnings Total interests Totalequity
Balanceat1January2017 19.5 234.1 –51.7 –23.3 –28.3 2,342.8 2,544.8 9.7 2,554.4
Group net profit 206.4 206.4 0.9 207.2
Total other comprehensive income 15.1 15.1 37.9 53.0 –0.0 52.9
Totalcomprehensiveincomefortheyear 15.1 15.1 244.3 259.4 0.8 260.2
Dividends paid 23 –138.1 –138.1 –0.6 –138.7
Distributions –138.1 –138.1 –0.6 –138.7
Balanceat31December2017 19.5 234.1 –36.6 –23.3 –13.3 2,449.0 2,666.0 9.9 2,675.9
Otherreserves
Non-controlling
CHFmillion Notes * Sharecapital Capitalreserves Otherreserves Treasury shares Translation reserves Retainedearnings Total interests Totalequity
Balanceat1January2016 19.5 234.1 –47.7 –23.3 –24.3 2,229.8 2,435.7 9.5 2,445.3
Group net profit 220.5 220.5 0.5 221.1
Total other comprehensive income –4.0 –4.0 49.2 45.1 0.2 45.4
Totalcomprehensiveincomefortheyear –4.0 –4.0 269.7 265.7 0.8 266.4
Dividends paid 23 –156.0 –156.0 –0.6 –156.7
Distributions –156.0 –156.0 –0.6 –156.7
Acquisition of non-controlling interests –0.6 –0.6 0.0 –0.6
Changesinownershipinterestsinsubsidiaries –0.6 –0.6 0.0 –0.6
Balanceat31December2016 19.5 234.1 –51.7 –23.3 –28.3 2,342.8 2,544.8 9.7 2,554.4
* The accompanying notes are an integral part of the consolidated financial statements.
SIX consolidated financial statements 2017 13
Otherreserves
Non-controlling
CHFmillion Notes * Sharecapital Capitalreserves Otherreserves Treasury shares Translation reserves Retainedearnings Total interests Totalequity
Balanceat1January2017 19.5 234.1 –51.7 –23.3 –28.3 2,342.8 2,544.8 9.7 2,554.4
Group net profit 206.4 206.4 0.9 207.2
Total other comprehensive income 15.1 15.1 37.9 53.0 –0.0 52.9
Totalcomprehensiveincomefortheyear 15.1 15.1 244.3 259.4 0.8 260.2
Dividends paid 23 –138.1 –138.1 –0.6 –138.7
Distributions –138.1 –138.1 –0.6 –138.7
Balanceat31December2017 19.5 234.1 –36.6 –23.3 –13.3 2,449.0 2,666.0 9.9 2,675.9
Otherreserves
Non-controlling
CHFmillion Notes * Sharecapital Capitalreserves Otherreserves Treasury shares Translation reserves Retainedearnings Total interests Totalequity
Balanceat1January2016 19.5 234.1 –47.7 –23.3 –24.3 2,229.8 2,435.7 9.5 2,445.3
Group net profit 220.5 220.5 0.5 221.1
Total other comprehensive income –4.0 –4.0 49.2 45.1 0.2 45.4
Totalcomprehensiveincomefortheyear –4.0 –4.0 269.7 265.7 0.8 266.4
Dividends paid 23 –156.0 –156.0 –0.6 –156.7
Distributions –156.0 –156.0 –0.6 –156.7
Acquisition of non-controlling interests –0.6 –0.6 0.0 –0.6
Changesinownershipinterestsinsubsidiaries –0.6 –0.6 0.0 –0.6
Balanceat31December2016 19.5 234.1 –51.7 –23.3 –28.3 2,342.8 2,544.8 9.7 2,554.4
* The accompanying notes are an integral part of the consolidated financial statements.
14 SIX consolidated financial statements 2017
Consolidated statement of cash flows
CHFmillion Notes * 2017 2016
Group net profit (incl. non-controlling interests) 207.2 221.1
Adjustments for:
Depreciation, amortization and impairment 85.6 84.3
Increase/(decrease) in provisions –12.3 31.0
Increase/(decrease) in pension fund assets and liabilities 13.9 –46.4
Share of profit of associates 31 23.2 0.3
Net financial result –81.0 –10.4
(Gain)/loss on sale of property, plant, equipment and intangible assets 2.5 –24.1
(Gain)/loss on settlement and curtailment 36 –2.7 –2.4
Income tax expense 12 63.7 73.6
Changes in:
Inventories –2.4 –0.9
Trade and other receivables 195.6 –82.0
Trade and other payables –94.1 87.3
Receivables from clearing & settlement –90.4 –676.8
Payables from clearing & settlement –160.2 1,376.3
Current financial assets –91.1 91.6
Current financial liabilities 2.5 –10.1
Other current assets –101.1 –58.6
Other current liabilities 10.8 –2.2
Interest paid –6.2 –7.2
Interest received 3.8 4.9
Income tax (paid)/received 12 –77.5 –96.2
Netcashflowfrom/(usedin)operatingactivities –110.3 953.2
Investments in subsidiaries (net of cash acquired incl. bank overdrafts) 32 –198.6 –
Investments in associates –5.0 –24.0
Disposal of subsidiaries and associates (net of cash disposed) 45.7 –2.1
Purchase of property, plant, equipment and intangible assets –98.2 –99.9
Sale proceeds from property, plant, equipment and intangible assets 0.3 30.8
Investments in non-current financial assets –7.6 –6.9
Divestments of non-current financial assets 0.8 0.3
Investments in other non-current assets –0.1 –0.1
Divestments of other non-current assets 0.0 0.4
Other financial income received 0.1 –
Dividends received 8.3 7.9
Netcashflowfrom/(usedin)investingactivities –254.2 –93.7
Net change in other non-current liabilities –3.2 –
Acquisition of non-controlling interests – –0.6
Dividends paid to shareholders of the parent company 23 –138.1 –156.0
Dividends paid to non-controlling interests 23 –0.6 –0.6
Netcashflowfrom/(usedin)financingactivities –142.0 –157.3
Net impact of foreign exchange rate differences on cash 61.8 –9.5
Netchangeincashandcashequivalents –444.7 692.9
Balancesofcashandcashequivalents
Cash and cash equivalents at 1 January 4,906.2 4,213.4
Cash and cash equivalents at 31 December 14 4,461.6 4,906.2
* The accompanying notes are an integral part of the consolidated financial statements.
SIX consolidated financial statements 2017 15
Basis of preparation
1. General information
The consolidated financial statements of SIX as at and for the year ended 31 December 2017 cover SIX Group Ltd (the “Company” or the parent) and its subsidiaries (together referred to as the “Group” or “SIX”). A table of the Group subsidiaries and interests in associates is set out in note 31.
SIX Group Ltd is an unlisted public limited company domiciled in Switzerland with its registered office in Zurich, at Hardturmstrasse 201. The Company is owned by 127 national and international financial institutions.
SIX provides a comprehensive range of services in the areas of securities trading and posttrading, financial information processing and cashless payment transactions.
The Board of Directors of SIX approved the issuance of these consolidated financial statements on 14 March 2018.
2. Significant accounting policies
Basis of preparationThe consolidated financial statements of SIX have been prepared in accordance with International Financial Reporting Standards (IFRS) as issued by the International Accounting Standards Board (IASB).
The reporting period covers twelve months. For all consolidated companies, the financial year corresponds to the calendar year. Unless otherwise indicated, all amounts are stated in millions of Swiss francs (CHF) and all values are rounded to the nearest hundred thousand.
The consolidated financial statements provide comparative information in respect of the previous period.
The SIX consolidated financial statements have been prepared on a historical cost basis, except for certain financial instruments which have been measured at fair value, as disclosed in the accounting policies below.
Basis of consolidationBusiness combinationsBusiness combinations are accounted for using the acquisition method at the date of acquisition, which is the date on which SIX obtains control. SIX has control over an investee when it is exposed or has rights to variable returns from its involvement with the investee and has the ability to affect those returns through its power over the relevant activities of the investee.
At the time of acquisition, all identifiable assets and liabilities that satisfy the recognition criteria are recognized at their fair values. The difference between the consideration transferred and the fair value of the identifiable assets acquired and liabilities assumed is accounted for as goodwill after taking into account any noncontrolling interests and, if the business com bination is achieved in stages, the fair value of the preexisting equity interest in the acquiree. Any negative difference, after further review, is recognized in the income statement. Directly attributable transaction costs are reported as other operating expenses.
Any contingent consideration to be transferred by SIX will be recognized at fair value at the acquisition date. Subsequent changes in the fair value of liabilities from contingent consideration will be recognized in the income statement if those changes result from events after the acquisition date.
SubsidiariesSubsidiaries are fully consolidated from the date of acquisition and continue to be consolidated until the date when control ceases.
The financial statements of the subsidiaries are prepared for the same reporting period as the parent company, using consistent accounting policies. All intraGroup balances, transactions, any unrealized gains and losses resulting from intraGroup transactions and dividends are eliminated in full.
16 SIX consolidated financial statements 2017
Non-controlling interests arise when SIX Group Ltd directly or indirectly holds less than 100% of a subsidiary, but does control the subsidiary. Noncontrolling interests in subsidiaries are reported separately within equity. Profit or loss and other comprehensive income (OCI) are attributed to the shareholders of the parent and to the noncontrolling interests, even if this results in the noncontrolling interests having a negative balance.
Upon loss of control, SIX ceases to recognize the assets and liabilities of a subsidiary, any noncontrolling interests and the other components of equity related to the subsidiary. Any gain or loss arising on the loss of control is recognized in the income statement. The interest retained is measured at fair value at the date when control is lost. Subsequently, it is accounted for as an investment using the equity method or as a financial asset, depending on the level of influence retained.
Investments in associatesInvestments in associates are accounted for using the equity method. Associates are those entities where SIX has significant influence over the financial and operating policies but does not exercise control. Significant influence is generally assumed to exist whenever voting rights ranging between 20% and 50% are held. Under the equity method, investments in associates are initially recognized at cost at the date of acquisition. Cost comprises the share of net assets acquired and any applicable goodwill arising. In subsequent accounting periods, the carrying amount of the investment is adjusted by the share of profit or loss and other comprehensive income less the share of dividends received. Unrealized gains and losses from transactions with associates are eliminated in proportion to the interest held in the associate; unrealized losses only to the extent that there is no evidence of impairment.
Foreign currency translationFunctional and presentation currencyThese consolidated financial statements are presented in Swiss francs, which is also the functional currency of SIX Group Ltd. Each subsidiary prepares its own financial statements in its functional currency, i.e. in the currency of the primary economic environment in which it operates.
Foreign currency transactions and balancesTransactions in foreign currencies are initially recorded by the Group’s entities in their respective functional currencies using the exchange rates prevailing at the dates of the transactions.
Exchange rate gains and losses arising between the date of a transaction and its settlement and from the translation of monetary assets and liabilities denominated in foreign currencies at closing exchange rates are recognized in the income statement within financial income or expenses.
Nonmonetary items recognized at historical cost are measured at the historical exchange rates, while non monetary items that are measured at fair value in a foreign currency are translated using the exchange rates at the date when the fair value was determined. Foreign exchange gains and losses are recorded in the income statement within financial income or expenses with the exception of those incurred on FVtOCI instruments.
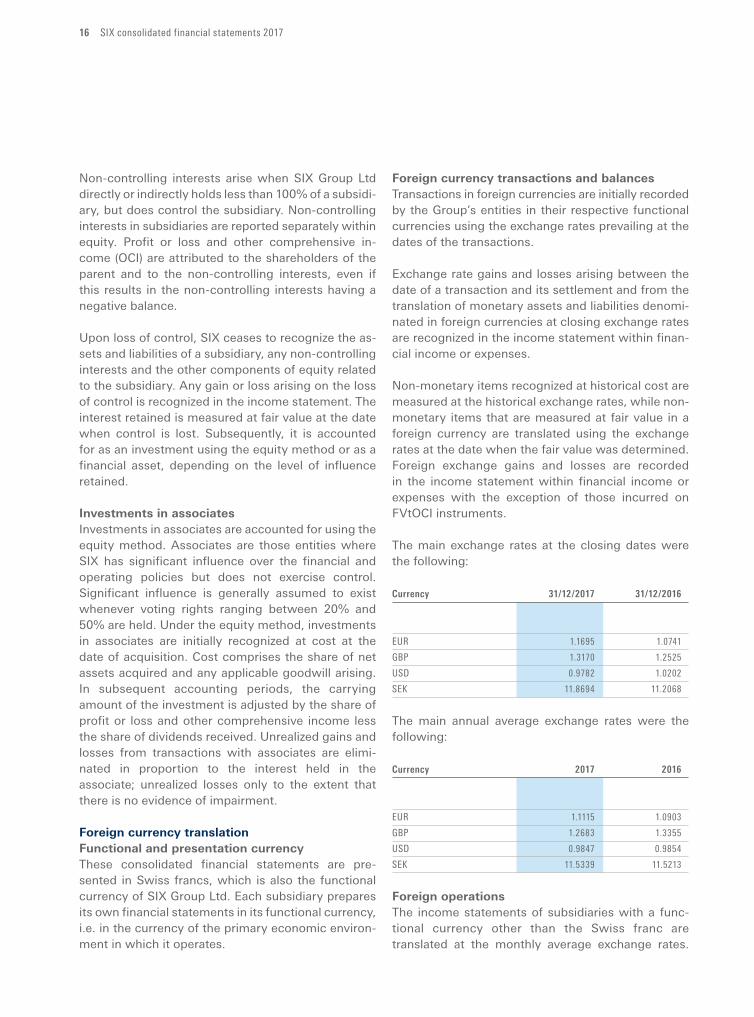
The main exchange rates at the closing dates were the following:
Currency 31/12/2017 31/12/2016
EUR 1.1695 1.0741
GBP 1.3170 1.2525
USD 0.9782 1.0202
SEK 11.8694 11.2068
The main annual average exchange rates were the following:
Currency 2017 2016
EUR 1.1115 1.0903
GBP 1.2683 1.3355
USD 0.9847 0.9854
SEK 11.5339 11.5213
Foreign operationsThe income statements of subsidiaries with a functional currency other than the Swiss franc are translated at the monthly average exchange rates.
SIX consolidated financial statements 2017 17
Assets and liabilities, including goodwill and fair value adjustments arising on acquisition, are translated at the closing exchange rate. Foreign exchange translation differences are recognized as currency translation adjustments in other comprehensive income and presented in equity under other reserves. On the loss of control of a subsidiary, the accumulated exchange rate differences previously recognized in equity are reclassified to the income statement as part of the gain or loss on disposal.
Operating segmentsOperating segments are reported in a manner consistent with the internal reporting to the Group Executive Board of SIX and the chief operating decision maker (CODM). The CODM, who is responsible for allocating resources and assessing the performance of the operating segments, has been identified as the SIX Group CEO. Management has determined the reportable operating segments based on the reports regularly reviewed by the CODM.
Cash and cash equivalentsCash and cash equivalents include cash on hand, postal and bank accounts, giro and demand deposits at the Swiss National Bank, deposits held at call with banks and shortterm deposits with a maximum maturity of three months from the date of initial recognition. Cash and cash equivalents are classified as current.
Cash and cash equivalents are stated at amortized cost, which normally equals the nominal value.
For the purpose of the consolidated statement of cash flows, cash and cash equivalents consist of cash and shortterm deposits as defined above, net of bank overdrafts.
Trade and other receivablesTrade and other receivables and advances are recognized initially at fair value including directly related transaction costs. Subsequent to initial recognition, receivables are measured at amortized cost less impairment losses.
Receivables are classified as current if payment is due within one year. If not, they are presented as noncurrent.
Receivables and payables from clearing & settlementBeside the receivables and payables from clearing & settlement incurred in the card business, these also comprise vostro accounts of participants for securities transactions and nostro accounts of SIX Securities Services with cash correspondent banks, subcustodians and other central securities depositories. These vostro and nostro accounts are on sight and carried at nominal value.
Financial assetsGeneral criteriaFinancial assets are generally recognized at the trade date. Nonfulfilled transactions from the clearing business of Securities Services are recognized at the settlement date.
SIX classifies its financial assets into the following categories: a) financial assets at amortized cost, b) financial assets at fair value through profit or loss (FVtPL) and c) financial assets at fair value through other comprehensive income (FVtOCI). The classification depends on the business model of SIX for managing the financial assets, the contractual cash flow characteristics of the financial assets and whether SIX makes the election at initial recognition of equity instruments to recognize changes in fair value through other comprehensive income.
Financial assets are initially recognized at their fair value plus, for financial assets not subsequently measured at fair value through profit or loss, directly attributable transaction costs.
Financial assets at amortized costA financial asset is carried at amortized cost if both of the following criteria are met: a) the financial asset is held within a business model whose objective is to hold these assets in order to collect contractual cash flows, and b) the contractual terms of the financial asset give rise on specified dates to cash flows that are solely payments of principal and interest on the principal amount outstanding.
After initial recognition such financial assets are measured at amortized cost by applying the effective interest method. Gains or losses are recognized in the income statement when the financial asset is
18 SIX consolidated financial statements 2017
derecognized or impaired and through the amortization process using the effective interest method. This category consists of cash deposits with a maturity of more than three months from the date of initial recognition, receivables, debt instruments and loans.
SIX does not apply the fair value option to any debt instruments.
Financial assets at fair value through profit or lossIf either of the above two criteria for financial assets at amortized cost is not met, the financial asset is classified as measured at fair value through profit or loss (FVtPL), unless SIX makes the election at initial recognition of equity instruments to recognize changes in fair value through other comprehensive income. Gains and losses arising from changes in the fair value are reported in financial income or expenses. This category consists of equity instruments, units in investment funds, derivatives, financial instruments from the settlement business of SIX and debt instruments.
Financial assets at fair value through other comprehensive incomeFor equity instruments that are not held for trading, SIX can make the irrevocable election on an instrumentbyinstrument basis at initial recognition to recognize changes in fair value through other comprehensive income (FVtOCI) rather than profit or loss. With the exception of dividends received, the associated gains and losses are recognized in other comprehensive income and will not be reclassified to profit or loss.
Impairment of financial assetsFinancial assets that are measured at amortized cost are tested at each reporting date for any objective evidence of impairment to these assets, at both an individual and collective level.
An impairment loss is recognized where there is objective evidence of impairment, such as the downgrading of the credit rating or significant financial difficulties of the obligors or issuers.
If there is objective evidence that an impairment loss has been incurred, the amount of the loss is measured as the difference between the asset’s carrying amount
and the present value of the estimated future cash flows discounted at the asset’s original effective interest rate. The carrying amount of the financial asset is reduced through the use of an allowance account, and the amount of the loss is recorded in the income statement. If, at a subsequent reporting date, the fair value objectively increases as a result of events occurring after the impairment loss was recognized, the previously recognized impairment loss is reversed by adjusting the allowance account. The reversal of impairment losses for financial assets measured at amortized cost is recognized in the income statement.
If the Group concludes that no objective evidence of impairment exists for an individually tested financial asset, whether significant or not, it includes the asset in a group of financial assets with similar credit risk characteristics and collectively tests them for im pairment. Assets that are individually tested for impairment and for which an impairment loss is, or continues to be, recognized are not included in a collective test of impairment.
DerivativesDerivative financial instrumentsSIX uses derivative financial instruments to mitigate its exposure to foreign exchange risks arising from operational activities. Derivative financial instruments are recognized initially and subsequent to initial recognition at fair value. Gains or losses relating to changes in fair value are recognized immediately in the income statement. Apart from forward contracts from the clearing and settlement business of Securities Services, this category includes in particular foreign currency forwards and swaps.
All derivative financial instruments are included under financial assets if their fair value is positive and under financial liabilities if their fair value is negative.
Financial instruments in this category are classified as current assets if they are expected to be settled within twelve months; otherwise, they are classified as noncurrent.
SIX consolidated financial statements 2017 19
Hedging activities (fair value hedge of FVtOCI equity instruments)SIX may decide to hedge the fair value or a portion of the fair value of FVtOCI equity instruments. In this case, the effective and ineffective portion of the changes in fair value of the derivatives that are designated and qualify as hedging instruments are recognized in other comprehensive income. The cumulative changes in fair value remain in equity and will not be reclassified to profit or loss.
Repurchase and reverse repurchase agreements, securities lending and borrowingRepurchase agreements with securities are only entered into for the own account of SIX (principal). The securities that have been transferred are not recognized in or derecognized from the balance sheet unless the risks and rewards of ownership are also transferred.
Securities purchased under agreements to resell (reverse repurchase agreements) and securities sold under agreements to repurchase (repurchase agreements) are generally treated as collateralized financing transactions. In reverse repurchase agreements, the cash delivered is derecognized and a corresponding receivable is recorded in the balance sheet. In repurchase agreements, the cash received is recognized in the balance sheet with a corresponding obligation to return it. Securities received in a reverse repurchase agreement are disclosed in the notes if SIX has the right to resell or repledge them.
Securities borrowing and lending transactions are, similarly to repurchase and reverse repurchase transactions, treated like collateralized financing transac tions if they are covered with cash collateral and daily margin settlements. Securities borrowing and lending transactions that are not covered with cash collateral are not recognized in the balance sheet. Cash collateral received is recognized with a corresponding obligation to return it, and cash collateral delivered is derecognized with a corresponding receivable. Both are carried at nominal value. Securities received in a lending or borrowing transaction are disclosed in the notes if SIX has the right to resell or repledge them.
Derecognition of financial assetsFinancial assets are derecognized when the contractual rights to receive cash flows have expired or when substantially all the risks and rewards of ownership of the financial assets are transferred.
Offsetting of financial assets and liabilitiesFinancial assets and liabilities are offset and the net amount is reported in the balance sheet when, and only when, there is a legally enforceable right to offset the recognized amounts and there is an intention either to settle on a net basis or to realize the asset and settle the liability simultaneously.
InventoriesInventories are stated at the lower of cost and net realizable value. Cost is determined using the weighted average cost method. Net realizable value represents the estimated selling price for inventories in the ordinary course of business, less the estimated costs of completion and selling expenses.
Any writedowns and reversals of writedowns of inventories and any inventory losses are recognized within operating expenses when they occur.
When inventories are sold and revenue is recognized, the carrying amount of those inventories is recognized as expenses for inventories in the income statement, except for mobile vouchers. For sales of mobile vouchers where SIX earns a commission, revenues are recognized on a net basis in accordance with IAS 18, as SIX is not the primary obligor towards its customer.
Disposal groups and non-current assets held for saleNoncurrent assets are presented as held for sale if management is committed to a plan to sell an asset or disposal group, it is highly probable that the sale will be completed within one year of the date of the reclassification and the asset or disposal group is available for immediate sale in its present condition. Such assets are measured at the lower of their carrying amount and fair value less costs to sell. Costs to sell are the incremental costs directly attributable to the disposal, excluding finance costs and income tax expense. Property, plant and equipment and intangible assets are not depreciated or amortized once classified as held for sale.
20 SIX consolidated financial statements 2017
Property, plant and equipmentAssets included under property, plant and equipment are measured at historical cost less accumulated depreciation and accumulated impairment losses, if any. Historical cost includes expenditure directly attributable to the acquisition of the items. Operating lease costs such as lease payments for a property during the construction of leasehold improvements are considered directly attributable costs. Repair and maintenance costs are recognized in the income statement as incurred. Purchased software that is integral to the functionality of the related equipment is capitalized as part of that equipment.
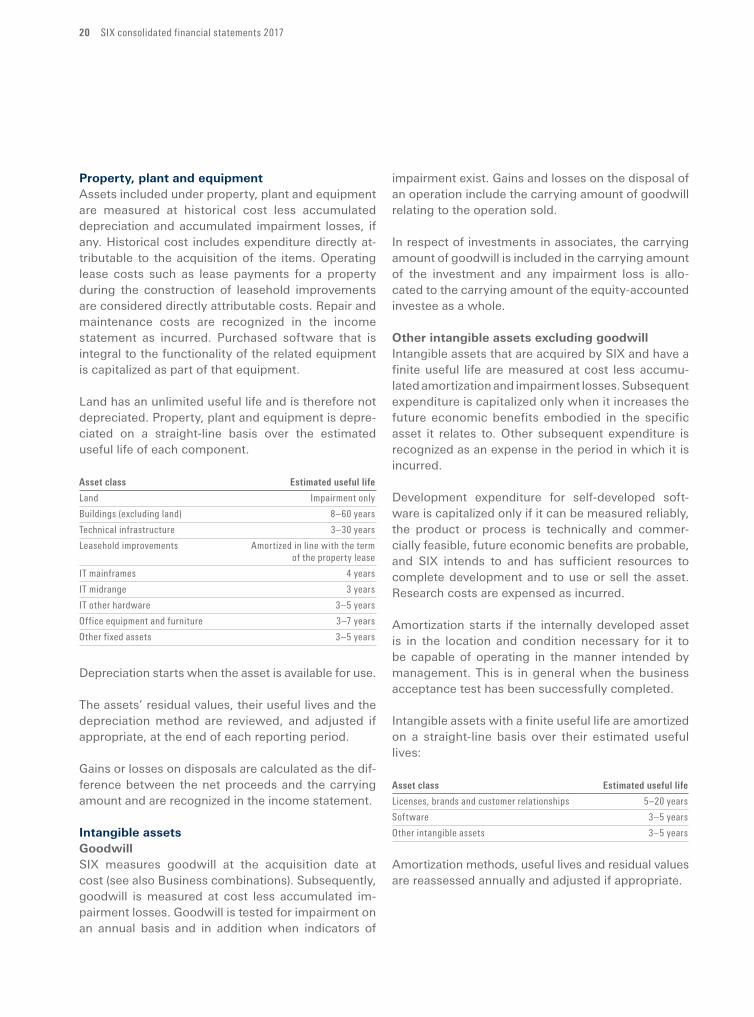
Land has an unlimited useful life and is therefore not depreciated. Property, plant and equipment is depreciated on a straightline basis over the estimated useful life of each component.
Assetclass Estimatedusefullife
Land Impairment only
Buildings (excluding land) 8–60 years
Technical infrastructure 3–30 years
Leasehold improvements Amortized in line with the term
of the property lease
IT mainframes 4 years
IT midrange 3 years
IT other hardware 3–5 years
Office equipment and furniture 3–7 years
Other fixed assets 3–5 years
Depreciation starts when the asset is available for use.
The assets’ residual values, their useful lives and the depreciation method are reviewed, and adjusted if appropriate, at the end of each reporting period.
Gains or losses on disposals are calculated as the difference between the net proceeds and the carrying amount and are recognized in the income statement.
Intangible assetsGoodwillSIX measures goodwill at the acquisition date at cost (see also Business combinations). Subsequently, good will is measured at cost less accumulated impairment losses. Goodwill is tested for impairment on an annual basis and in addition when indicators of
impairment exist. Gains and losses on the disposal of an operation include the carrying amount of goodwill relating to the operation sold.
In respect of investments in associates, the carrying amount of goodwill is included in the carrying amount of the investment and any impairment loss is allocated to the carrying amount of the equityaccounted investee as a whole.
Other intangible assets excluding goodwillIntangible assets that are acquired by SIX and have a finite useful life are measured at cost less accumulated amortization and impairment losses. Subsequent expenditure is capitalized only when it increases the fu ture economic benefits embodied in the specific asset it relates to. Other subsequent expenditure is recognized as an expense in the period in which it is incurred.
Development expenditure for selfdeveloped software is capitalized only if it can be measured reliably, the product or process is technically and commercially feasible, future economic benefits are probable, and SIX intends to and has sufficient resources to complete development and to use or sell the asset. Research costs are expensed as incurred.
Amortization starts if the internally developed asset is in the location and condition necessary for it to be capable of operating in the manner intended by management. This is in general when the business acceptance test has been successfully completed.
Intangible assets with a finite useful life are amortized on a straightline basis over their estimated useful lives:
Assetclass Estimatedusefullife
Licenses, brands and customer relationships 5–20 years
Software 3–5 years
Other intangible assets 3–5 years
Amortization methods, useful lives and residual values are reassessed annually and adjusted if appropriate.
SIX consolidated financial statements 2017 21
Impairment of non-financial assetsGoodwill and other intangible assets with an indefinite useful life, including intangible assets not yet ready for use, are not subject to amortization and are tested for impairment on an annual basis and whenever there is an indication that the asset may be impaired.
Assets classified under property, plant and equipment, including those not yet ready for use, that are subject to depreciation are tested for impairment whenever events or changes in circumstances indicate that the carrying amount may not be recoverable.
For the purposes of impairment testing, assets are tested individually or grouped at the lowest levels for which there are separately identifiable cash flows (cashgenerating units, CGUs). Goodwill is allocated to the CGU at which it is monitored for internal management purposes and which is not larger than an operating segment.
If the carrying amount of the assets exceeds the recoverable amount, an impairment equal to the difference between the carrying amount and the recoverable amount is recognized as an impairment loss in the income statement. The recoverable amount is the higher of an asset’s fair value less costs of disposal and value in use. In assessing value in use, the estimated future cash flows are discounted to their present value using a pretax discount rate that reflects the current market assessment of the time value of money and the risks specific to the asset or CGU. In determining fair value less costs to sell, recent market transactions are taken into account, if available. Impairment losses recognized in respect of CGUs are allocated first to reduce the carrying amount of any goodwill allocated to the CGU and then to reduce the carrying amounts of the other assets in the CGU on a prorata basis.
Any impairment loss on goodwill recognized in prior periods may not be reversed in subsequent periods. For other assets, an impairment loss is reversed only to the extent that the asset’s carrying amount does not exceed the carrying amount that would have been determined, net of depreciation or amortization, if no impairment loss had been recognized.
Trade and other payablesTrade and other payables are initially recognized at fair value and subsequently measured at amortized cost using the effective interest method.
Payables are classified as current liabilities if payment is due within one year or less. If not, they are presented as noncurrent liabilities.
Financial liabilitiesApart from the negative fair value of derivative financial instruments (see Derivatives), financial liabilities comprise shortterm borrowings and contingent considerations. Borrowings are initially recognized at fair value including transaction costs. Subsequently, they are measured at amortized cost using the effective interest method. Contingent considerations are measured at fair value through profit or loss.
LeasesGeneral criteriaLeasing includes all arrangements that transfer the right to use a specified asset for a stated period of time in return for a payment or series of payments. Lease agreements that transfer substantially all the risks and rewards incidental to ownership of the leased item to SIX are classified as finance leases. All other lease agreements are classified as operating leases.
SIX is a lessee of premises, IT equipment and vehicles and a lessor of payment terminals and premises. These lease agreements are classified and recorded as operating leases.
Operating leasesSIX as lesseePayments made under operating leases are recognized in the income statement on a straightline basis over the term of the lease agreement.
SIX as lessorOperating lease equipment is carried initially at its acquisition or manufacturing cost. The leased asset is depreciated according to the depreciation policies of SIX for property, plant and equipment on a straightline basis to its expected residual value or over the contractual term of the lease. Rental income from
22 SIX consolidated financial statements 2017
operating leases is recognized on a straightline basis over the term of the lease agreement in the income statement as other operating income.
Sale and leasebackA sale and leaseback is an arrangement where an entity sells one of its assets and leases it back. The gain or loss on the sale of the asset is recognized immediately if the transaction is concluded at fair value and the leaseback qualifies as an operating lease.
ProvisionsGeneral criteriaProvisions are recognized when SIX has a present legal or constructive obligation as a result of a past event, it is probable that an outflow of resources will be required to settle the obligation and the amount of the obligation can be estimated reliably. Provisions are not recognized for future operating losses.
The amount recognized as a provision is the amount which represents the best estimate required to settle the present obligation. If the effect of the time value of money is material, provisions are discounted using a current pretax rate that reflects current market assessments of the time value of money and the risks specific to the liability. When discounting is used, the increase in the provision due to the passage of time is recognized as an interest expense.
Provisions are regularly reviewed and adjusted as further information develops or circumstances change.
Restructuring provisionsRestructuring provisions are recognized only when the Group has a legal or constructive obligation, which is when a detailed formal plan identifies the business or part of the business concerned, the location and number of employees affected, a detailed estimate of the associated costs and an appropriate timeline, and the employees affected have been notified of the plan’s main features.
Asset retirement obligationIf a lease agreement requires SIX to remove any assets it has installed in the leased property (such as internal walls or partitions), the removal obligation arises immediately upon installation. In such a situation, the
Group recognizes a provision for the present value of the future cost of removal at the date the assets are installed.
The costs of removal are capitalized as part of the acquisition costs of the leasehold improvements and are depreciated over their useful lives or according to the lease term, if shorter.
Contingent liabilities and assetsContingent liabilities are not recognized, but are disclosed, unless the possibility of an outflow of eco nom ic resources is remote.
Contingent assets are not recognized, but are disclosed, where an inflow of economic benefits is prob able. Where the realization of income is virtually certain, the related asset is recognized.
EquityOrdinary sharesOrdinary shares in SIX Group Ltd are classified as share capital.
Treasury sharesOwn shares held by SIX Group Ltd itself and by other entities of the Group are recognized at cost within other reserves and deducted from equity. Gains or losses on the disposal or cancellation of treasury shares are recorded in other reserves.
Operating revenuesGeneralWhen SIX acts as principal, revenue is recorded gross. However, when SIX acts only as an agent, revenue is limited to the commission or fee that it retains (net of related costs). The primary responsibility for providing services, the latitude in establishing prices and the subsequent credit risk strongly indicate that SIX acts as principal.
Commission revenuesSIX generates commission revenues from the admission of securities to trading and posttrading services (e.g. domestic and international custody service, global fund service) and the ongoing listing. SIX also receives commission from merchants in the card business and from financial institutions in the ATM business.
SIX consolidated financial statements 2017 23
Fees for the ongoing listing are recognized in the accounting period in which the related service is rendered. Commission revenues generated from posttrading services are recognized as revenue when the related service is rendered. Commission fees received in the card business are calculated either as a percentage of the value of the transaction or as a fixed amount per transaction and are recorded as income at the time those transactions occur.
Transaction revenuesSIX earns transaction fees on the transactions processed for its customers. Transaction revenues are generated from trading activities on the stock exchange as well as from clearing and settlement transactions in the posttrading and payment services business.
Trading, clearing and settlement fees are recognized on the settlement day or on the day when the trade is completed (for late settlement).
Service revenuesSIX provides customers with efficient access to financial information including market information and reference data. SIX also provides support to card issuers and offers valueadded services to merchants.
Revenues generated from the distribution of reference data and market information generally comprise a fixed and a variable component. The fixed component is recognized on an accrual basis over the respective service period, while the variable part is recorded at the date of each individual sale. Nontransactionrelated fees charged to merchants and card issuers in Payment Services are recorded as fixed fees. These fees are recognized over the contract period.
Net interest income from banking activitiesInterest income and expenses arise from the interest margin business of SIX Securities Services, which is part of the core business activities of SIX. Accordingly, net interest income from banking activities has been separated from the Group’s other interest income and expenses. Net interest income from banking activities is recognized applying the effective interest method. Negative interest on financial assets from banking
activities is presented within interest expenses from banking business, and the related interest earned from the recharge of negative interest is presented within interest income from banking business.
Employee benefitsGeneralSIX maintains a number of different pension plans based on the respective legislation in each country. The retirement benefit plans include both defined benefit and defined contribution plans.
Defined contribution plansContributions to defined contribution plans are recognized as an employee benefit expense in the period during which the related services are rendered by employees.
Defined benefit plansThe net liability or asset recognized in the balance sheet in respect of defined benefit plans is the present value of the defined benefit obligation less the fair value of plan assets. Actuarial assumptions used for calculation include the discount rate, future salary and pension increases, staff turnover and life expectancy. The calculation is performed annually by a qualified actuary using the projected unit credit method. Pension plan assets are valued annually at market values. Defined benefit costs consist of three components:− service costs, curtailments and settlements− net interest income or expenses− remeasurements
Service costs include current and past service costs and are presented as personnel expenses in the income statement. The Group recognizes gains and losses on plan curtailments or settlements in the income statement when they occur.
Net interest income or expenses are calculated as the net defined benefit liability or asset at the beginning of the reporting period multiplied by the discount rate that is used to measure the defined benefit obligation. Net interest income or expenses are recognized as personnel expenses in the income statement.

24 SIX consolidated financial statements 2017
Remeasurements comprise actuarial gains and losses, the return on plan assets (excluding interest) and the effect of the asset ceiling (if any, excluding interest). SIX recognizes them in other comprehensive income. Remeasurements are not recycled to the income statement.
Termination benefitsTermination benefits are payable when employment is terminated before the normal retirement date, or when an employee accepts voluntary redundancy in exchange for these benefits. Termination benefits are expensed at the earlier of when the Group can no longer withdraw the offer of those benefits or when the Group recognizes costs for a restructuring. In the case of an offer made to encourage voluntary redundancy, the termination benefits are measured based on the number of employees expected to accept the offer. Benefits falling due more than twelve months after the end of the reporting period are discounted to their present value.
Other long-term employee benefitsThe Group’s obligation in respect of longterm employee benefits is the amount of future benefit that employees have earned in return for their service in the current and prior periods. Remeasurements are recognized in profit or loss in the period in which they arise. Other longterm employee benefits include in particular long-service awards (or “jubilees”). The liability is determined by applying the projected unit credit method. The actuarial assumptions used are reassessed annually.
Short-term employee benefitsShortterm employee benefit obligations are measured on an undiscounted basis and are expensed when the related service is provided.
Interest and dividendsInterest income and expensesFor all financial instruments measured at amortized cost, interest income and expenses are recorded using the effective interest rate, which is the rate that exactly discounts the estimated future cash payments or receipts over the expected life of the financial instrument or a shorter period, where appropriate, to the net carrying amount of the financial asset or liability. Negative interest on financial assets
is presented within interest expenses. Negative interest on financial liabilities is presented within interest income.
Dividend incomeDividends are recognized when the right to receive payment is established and are included in financial income.
Income taxesGeneralThe tax expense for the period comprises current and deferred tax. Taxes are recognized in the income statement, except to the extent that the underlying transaction is recorded either in other comprehensive income or directly in equity.
Current income taxesCurrent income tax assets and liabilities are measured at the amount expected to be recovered from or paid to the tax authorities based on the taxable profit. The tax rates and tax laws used to calculate the amount are those that are enacted or substantively enacted at the reporting date in the countries where the Group operates and generates taxable income.
Deferred taxesDeferred tax is recognized by applying the liability method in respect of temporary differences between the carrying amount of assets and liabilities for financial reporting purposes and the amounts used for taxation purposes. Deferred tax is not recognized for:− temporary differences on the initial recognition of
assets and liabilities in a transaction that is not a business combination and that affects neither accounting profit nor taxable profit or loss
− taxable temporary differences arising on the initial recognition of goodwill
Deferred tax assets are recognized for unused tax losses, unused tax credits and deductible temporary differences to the extent that it is probable that sufficient future taxable profits will be available against which they can be utilized.
The carrying amount of deferred tax assets is reviewed at each reporting date and reduced to the extent that it is no longer probable that sufficient
SIX consolidated financial statements 2017 25
taxable profit will be available to allow all or part of the deferred tax asset to be utilized. Unrecognized deferred tax assets are reassessed at each reporting date and are recognized to the extent that it has become probable that future taxable profits will allow the deferred tax asset to be recovered.
Calculation of deferred taxes is based on the country specific tax rates expected to apply in the accounting period in which these tax assets will be realized or tax liabilities will be settled. Deferred tax assets and liabilities are offset if they relate to the same taxable entity and tax authority and if there exists an offset entitlement for current taxes.
New standards, interpretations and amendments adopted by the GroupNew amendments adopted with effect from 1 January 2017: − Recognition of Deferred Tax Assets (Amendments
to IAS 12 Income taxes)− Disclosure Initiative (Amendments to IAS 7)− Annual Improvements to IFRSs 2014 - 2016 Cycle
The adoption of the amendments had no impact on the consolidated financial statements of the Group as at 31 December 2017.
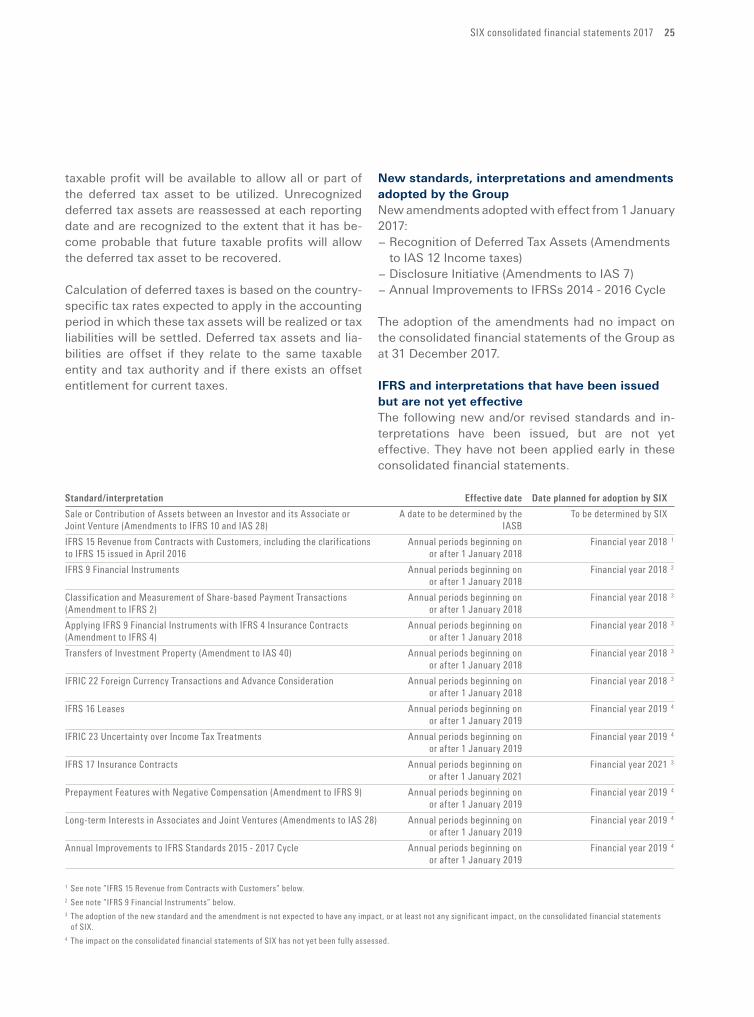
IFRS and interpretations that have been issued but are not yet effectiveThe following new and/or revised standards and interpretations have been issued, but are not yet effective. They have not been applied early in these consolidated financial statements.
Standard/interpretation Effectivedate DateplannedforadoptionbySIX
Sale or Contribution of Assets between an Investor and its Associate or A date to be determined by the To be determined by SIX
Joint Venture (Amendments to IFRS 10 and IAS 28) IASB
IFRS 15 Revenue from Contracts with Customers, including the clarifications Annual periods beginning on Financial year 2018 1
to IFRS 15 issued in April 2016 or after 1 January 2018
IFRS 9 Financial Instruments Annual periods beginning on Financial year 2018 2
or after 1 January 2018
Classification and Measurement of Share-based Payment Transactions Annual periods beginning on Financial year 2018 3
(Amendment to IFRS 2) or after 1 January 2018
Applying IFRS 9 Financial Instruments with IFRS 4 Insurance Contracts Annual periods beginning on Financial year 2018 3
(Amendment to IFRS 4) or after 1 January 2018
Transfers of Investment Property (Amendment to IAS 40) Annual periods beginning on Financial year 2018 3
or after 1 January 2018
IFRIC 22 Foreign Currency Transactions and Advance Consideration Annual periods beginning on Financial year 2018 3
or after 1 January 2018
IFRS 16 Leases Annual periods beginning on Financial year 2019 4
or after 1 January 2019
IFRIC 23 Uncertainty over Income Tax Treatments Annual periods beginning on Financial year 2019 4
or after 1 January 2019
IFRS 17 Insurance Contracts Annual periods beginning on Financial year 2021 3
or after 1 January 2021
Prepayment Features with Negative Compensation (Amendment to IFRS 9) Annual periods beginning on Financial year 2019 4
or after 1 January 2019
Long-term Interests in Associates and Joint Ventures (Amendments to IAS 28) Annual periods beginning on Financial year 2019 4
or after 1 January 2019
Annual Improvements to IFRS Standards 2015 - 2017 Cycle Annual periods beginning on Financial year 2019 4
or after 1 January 2019
1 See note “IFRS 15 Revenue from Contracts with Customers” below.2 See note “IFRS 9 Financial Instruments” below.3 The adoption of the new standard and the amendment is not expected to have any impact, or at least not any significant impact, on the consolidated financial statements of SIX.4 The impact on the consolidated financial statements of SIX has not yet been fully assessed.
26 SIX consolidated financial statements 2017
IFRS 9 Financial InstrumentsIn July 2014, the IASB issued the final version of IFRS 9 Financial Instruments. SIX has already adopted the requirements of IFRS 9 (version 2013) regarding classification and measurement and hedge accounting, which were determined in phase 1 and phase 3 of the standard-setting process. The standard issued in 2014 introduces a new impairment model. For the firsttime adoption, the Group will not restate comparative information. Instead, the cumulative effect will be recognized in equity. Starting 1 January 2018, the Group will recognize expected credit losses for the following positions:− Cash and cash equivalents− Trade and other receivables− Bonds− Receivables from clearing & settlement− Other financial assets
The Group will apply the simplified approach for all trade and other receivables. For instruments under the general approach the Group assumes that the credit rating of a financial asset has not increased significantly since initial recognition as long as the
credit rating is equivalent to investment grade. Overall, the Group expects no significant impact on its financial statements.
IFRS 15 Revenue from Contracts with CustomersIFRS 15 was issued in May 2014 and amended in April 2016 and introduces new revenue recognition requirements. For the firsttime adoption, the Group will not restate comparative information. Instead, the cumulative effect will be recognized in equity. The Group applies the practical expedient according to IFRS 15.B16 and recognizes revenue in the amount to which the entity has a right to invoice when the right to considerations corresponds directly with the value of the performance completed to date. Overall, the Group expects no significant impact on its financial statements, except for the accounting of incremental costs to obtain a contract. Starting 1 January 2018, the Group will capitalize sales commissions and amortize over the contract period. The cumulative effect on equity at initial recognition is CHF 8.4 million (increase in retained earnings). The expected effect on the income statement is not material.
3. Use of judgments and estimates
The application of some accounting policies requires the use of assumptions, estimates and judgments that may affect the reported assets and liabilities, income and expenses and also the disclosure of contingent assets and liabilities in the reporting period. Additionally, there is a significant risk that these estimation uncertainties could result in material adjustments to the carrying amount of assets and liabilities within the next financial year. The assumptions and estimates are continually reviewed and are based upon historical experience and other factors, including anticipated developments arising from probable future events. Actual future occurrences may differ from these assumptions and estimates.
Areas that may incorporate a greater number of uncertain assumptions, estimates and judgments are listed below.
Fair value of assets and liabilities recognized in a business combinationIn the case of business combinations, assets acquired and liabilities assumed are measured at fair value at the date of acquisition. In determining the fair value of the intangible assets and property, plant and equipment acquired and liabilities assumed at the date of acquisition, and the useful lives of the intangible and tangible assets acquired, certain assumptions are made. The measurement is based upon projected cash flows and on information available at the date of acquisition (see also note 32).
Fair value of level 3 instrumentsThe fair value of financial instruments that are not traded in an active market is determined by using several valuation techniques. SIX uses judgment to determine the valuation methods and makes assumptions to estimate the inputs into the calculations, as the parameters for the calculation of the fair values
SIX consolidated financial statements 2017 27
are not readily available in the markets. The calculations are based on information available as at the reporting date (see note 28).
If only an indicative sales price is available for announced sales transactions of unlisted equity instruments, the determination of the future cash flows requires judgment. Uncertainties such as regulatory approvals, appeals from transaction participants and restrictions to the considerations received are taken into account through deductions to the indicative sales price (see note 28).
Capitalization of development costsSIX develops various software applications for internal and external use. Development costs for selfdeveloped intangible assets are capitalized if the applicable criteria of IAS 38 are fulfilled. Initial capitalization of costs is based on management’s judgment that the feasibility is confirmed. In determining the amounts to be capitalized, management makes assumptions regarding the expected future cash flows generated from the project, the discount rates to be applied and the expected period of benefits.
All development costs are allocated to projects. Projects are broken down into three main phases. Costs incurred in the inception and transition phase are treated as noncapitalizable, whereas costs incurred in the construction phase are treated as capitalizable. Project management is generally allocated to each single project phase and is treated as capitalizable or non-capitalizable, as applicable. Development costs that do not satisfy the requirements for capitalization are expensed as incurred.
The carrying value of an intangible asset arising from development is tested for impairment annually when the asset is not yet available for use or more frequently if an indicator of impairment arises during the reporting period. See note 22 for further details on capitalized development costs.
Impairment tests of intangible assets with an indefinite useful lifeThe carrying amounts of intangible assets with an indefinite useful life, which includes goodwill, are tested for recoverability annually or if events or a change of circumstances indicate a possible impairment. Note 22
includes information on the key assumptions used in performing the impairment tests on goodwill. In each case, the respective budgets and financial plans provide the basis for determining the recoverable amount. The business plans contain management estimates and projections of the financial performance of the respective CGU. A reasonable discount rate is also chosen to calculate the present value of these cash flow projections. For further details refer to note 22.
Utilization of tax losses and recognition of deferred tax assetsDeferred tax assets are recognized for unused tax losses to the extent that it is probable that taxable profit will be available against which the losses can be utilized. Significant management judgment is required to determine the amount of deferred tax assets that can be recognized, based upon the likely timing and the level of future taxable profits. At each closing, the entity assesses the recoverability of deferred tax assets, including those recognized in previous periods. Further details on recognized deferred tax assets and unrecognized tax losses are disclosed in note 13.
Measurement of defined benefit obligationsAccounting for defined benefit obligations requires the application of certain actuarial assumptions (e.g. discount rate, salary trend, interest rate on retirement savings capital and life expectancy). These assumptions were used to calculate the present value of the obligation (or asset) as at 31 December 2017. Changes in actuarial assumptions can materially affect pension obligations and the expenses arising from employee benefit plans. A sensitivity analysis of the key factors is presented in note 36.
ProvisionsSIX has a significant international operation and is therefore subject to various legal and regulatory regimes. Some entities of the Group are parties to legal proceedings. Provisions are raised for the expected amounts payable in respect of legal or regulatory requirements, legal claims and restructurings. The measurement of provisions and contingencies is periodically assessed based upon the latest information available, usually with the assistance of lawyers and other specialists. See note 25 for further details on provisions.
28 SIX consolidated financial statements 2017
Performance for the year
4. Segment information
Determination of operating segmentsThe operating segments of SIX are determined based on the management approach. Accordingly, external segment reporting reflects the internal organizational and management structure as well as the internal financial reporting to the chief operating decision maker (CODM). For the purpose of internal reporting, SIX is broken down into five reportable segments and “Corporate”. IT-related functions are part of the
Global IT segment. Business activities that support the Group as a whole do not qualify as reportable operating segments under IFRS 8. They include the activities of the management company, corporate communications, strategic development, human resources, finance & risk, legal & compliance and logistics. These activities are grouped together under Corporate. The reportable segments and Corporate offer the following products and services:
Segment Productsandservices
Swiss Exchange – Cash and securitized derivatives market for trading in equities, bonds, structured products and warrants,
exchange-traded products (ETPs) and funds
– Admission of securities
– Distribution of raw market data and index products
Securities Services – Clearing house and central counterparty
– Securities financing solutions
– Custody, settlement and administration services
– Share register services (until 2016)
– Electronic transactions between land registries, notaries and banks
– Interbank clearing and e-bill payments
Financial Information – Procurement, processing and distribution of reference data and market information
Payment Services – Card acceptance and merchant services
– Card issuing and services for card issuers and acquirers
Global IT – IT-related functions including IT infrastructure, software development and IT operations
Corporate – Corporate services such as communications, strategic development, human resources, finance & risk,
legal & compliance and logistics
The internal reporting is based on the measurement methods used for the IFRS consolidated financial statements.
Performance is measured based on segment earnings before interest and tax (EBIT) as included in the internal management reports that are reviewed
regularly by the CODM. Segment EBIT is used to measure performance, as management believes that such information is the most relevant for evaluating the results of the segments. Transactions between the segments are based on market prices.
SIX consolidated financial statements 2017 29
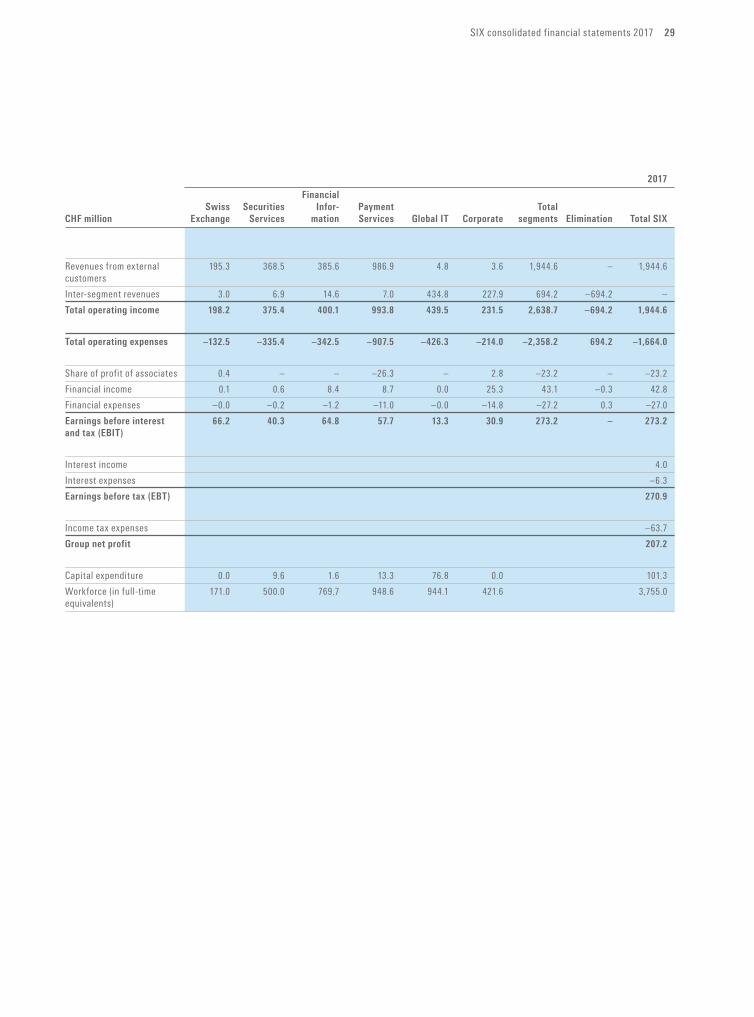
2017
Financial
Swiss Securities Infor- Payment Total
CHFmillion Exchange Services mation Services GlobalIT Corporate segments Elimination Total SIX
Revenues from external 195.3 368.5 385.6 986.9 4.8 3.6 1,944.6 – 1,944.6
customers
Inter-segment revenues 3.0 6.9 14.6 7.0 434.8 227.9 694.2 –694.2 –
Totaloperatingincome 198.2 375.4 400.1 993.8 439.5 231.5 2,638.7 –694.2 1,944.6
Totaloperatingexpenses –132.5 –335.4 –342.5 –907.5 –426.3 –214.0 –2,358.2 694.2 –1,664.0
Share of profit of associates 0.4 – – –26.3 – 2.8 –23.2 – –23.2
Financial income 0.1 0.6 8.4 8.7 0.0 25.3 43.1 –0.3 42.8
Financial expenses –0.0 –0.2 –1.2 –11.0 –0.0 –14.8 –27.2 0.3 –27.0
Earningsbeforeinterest 66.2 40.3 64.8 57.7 13.3 30.9 273.2 – 273.2
andtax(EBIT)
Interest income 4.0
Interest expenses –6.3
Earningsbeforetax(EBT) 270.9
Income tax expenses –63.7
Groupnetprofit 207.2
Capital expenditure 0.0 9.6 1.6 13.3 76.8 0.0 101.3
Workforce (in full-time 171.0 500.0 769.7 948.6 944.1 421.6 3,755.0
equivalents)
30 SIX consolidated financial statements 2017
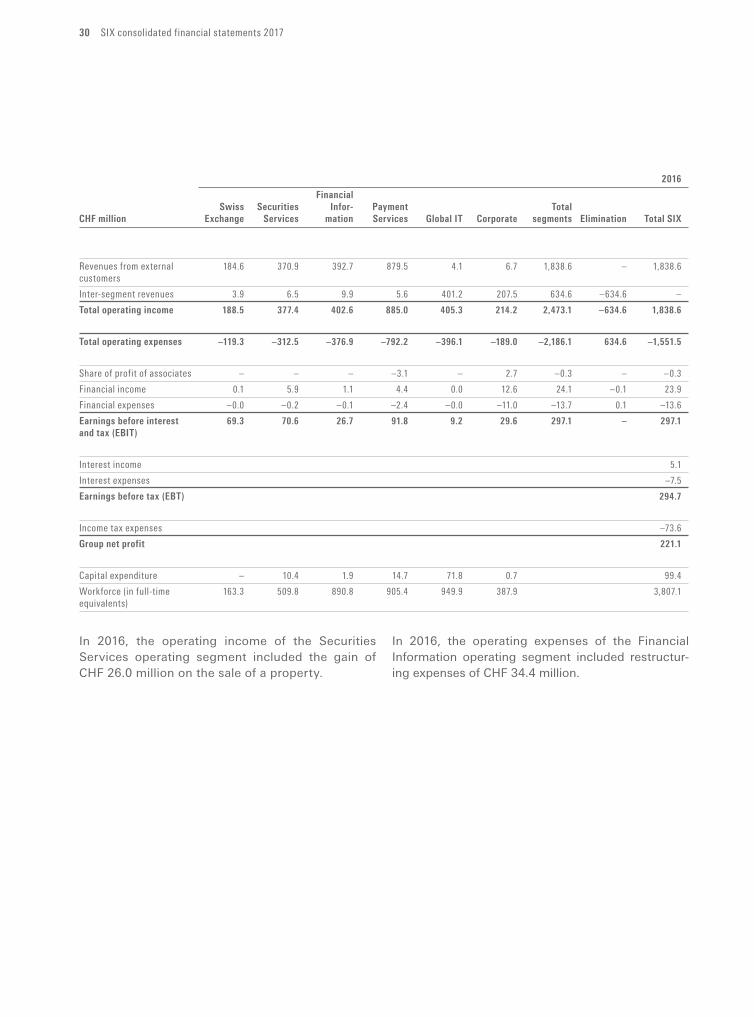
2016
Financial
Swiss Securities Infor- Payment Total
CHFmillion Exchange Services mation Services GlobalIT Corporate segments Elimination Total SIX
Revenues from external 184.6 370.9 392.7 879.5 4.1 6.7 1,838.6 – 1,838.6
customers
Inter-segment revenues 3.9 6.5 9.9 5.6 401.2 207.5 634.6 –634.6 –
Totaloperatingincome 188.5 377.4 402.6 885.0 405.3 214.2 2,473.1 –634.6 1,838.6
Totaloperatingexpenses –119.3 –312.5 –376.9 –792.2 –396.1 –189.0 –2,186.1 634.6 –1,551.5
Share of profit of associates – – – –3.1 – 2.7 –0.3 – –0.3
Financial income 0.1 5.9 1.1 4.4 0.0 12.6 24.1 –0.1 23.9
Financial expenses –0.0 –0.2 –0.1 –2.4 –0.0 –11.0 –13.7 0.1 –13.6
Earningsbeforeinterest 69.3 70.6 26.7 91.8 9.2 29.6 297.1 – 297.1
andtax(EBIT)
Interest income 5.1
Interest expenses –7.5
Earningsbeforetax(EBT) 294.7
Income tax expenses –73.6
Groupnetprofit 221.1
Capital expenditure – 10.4 1.9 14.7 71.8 0.7 99.4
Workforce (in full-time 163.3 509.8 890.8 905.4 949.9 387.9 3,807.1
equivalents)
In 2016, the operating income of the Securities Services operating segment included the gain of CHF 26.0 million on the sale of a property.
In 2016, the operating expenses of the Financial Information operating segment included restructuring expenses of CHF 34.4 million.
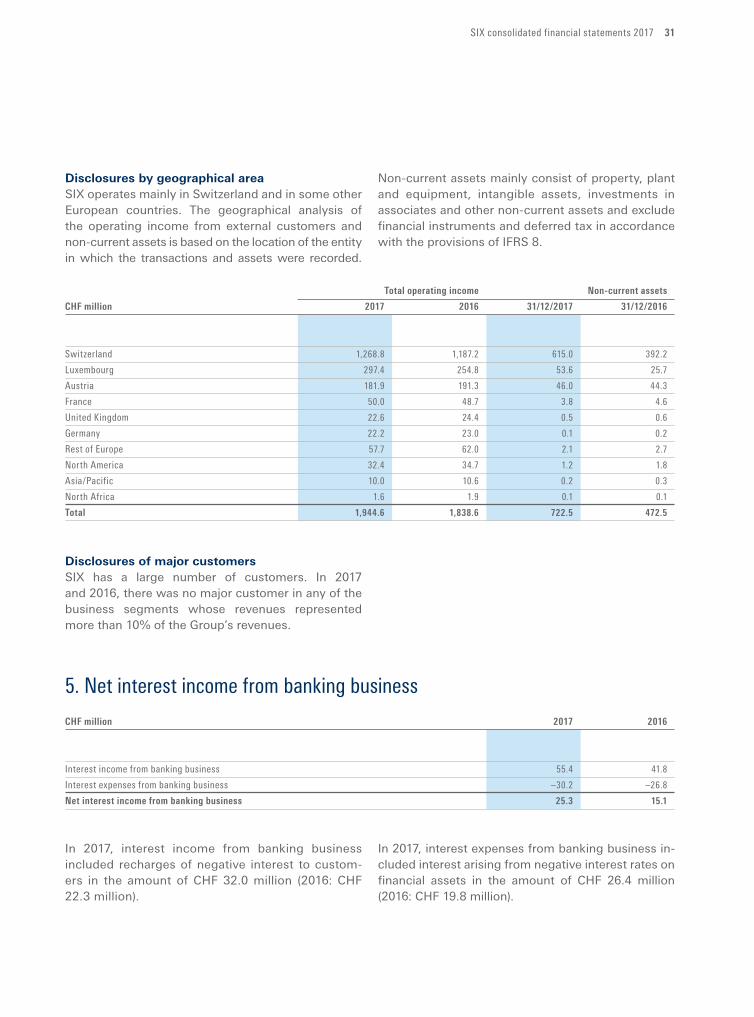
SIX consolidated financial statements 2017 31
Disclosures by geographical areaSIX operates mainly in Switzerland and in some other European countries. The geographical analysis of the operating income from external customers and noncurrent assets is based on the location of the entity in which the transactions and assets were recorded.
Noncurrent assets mainly consist of property, plant and equipment, intangible assets, investments in associates and other noncurrent assets and exclude financial instruments and deferred tax in accordance with the provisions of IFRS 8.
Totaloperatingincome Non-current assets
CHFmillion 2017 2016 31/12/2017 31/12/2016
Switzerland 1,268.8 1,187.2 615.0 392.2
Luxembourg 297.4 254.8 53.6 25.7
Austria 181.9 191.3 46.0 44.3
France 50.0 48.7 3.8 4.6
United Kingdom 22.6 24.4 0.5 0.6
Germany 22.2 23.0 0.1 0.2
Rest of Europe 57.7 62.0 2.1 2.7
North America 32.4 34.7 1.2 1.8
Asia/Pacific 10.0 10.6 0.2 0.3
North Africa 1.6 1.9 0.1 0.1
Total 1,944.6 1,838.6 722.5 472.5
Disclosures of major customersSIX has a large number of customers. In 2017 and 2016, there was no major customer in any of the business segments whose revenues represented more than 10% of the Group’s revenues.
5. Net interest income from banking business
CHFmillion 2017 2016
Interest income from banking business 55.4 41.8
Interest expenses from banking business –30.2 –26.8
Netinterestincomefrombankingbusiness 25.3 15.1
In 2017, interest income from banking business included recharges of negative interest to customers in the amount of CHF 32.0 million (2016: CHF 22.3 million).
In 2017, interest expenses from banking business included interest arising from negative interest rates on financial assets in the amount of CHF 26.4 million (2016: CHF 19.8 million).
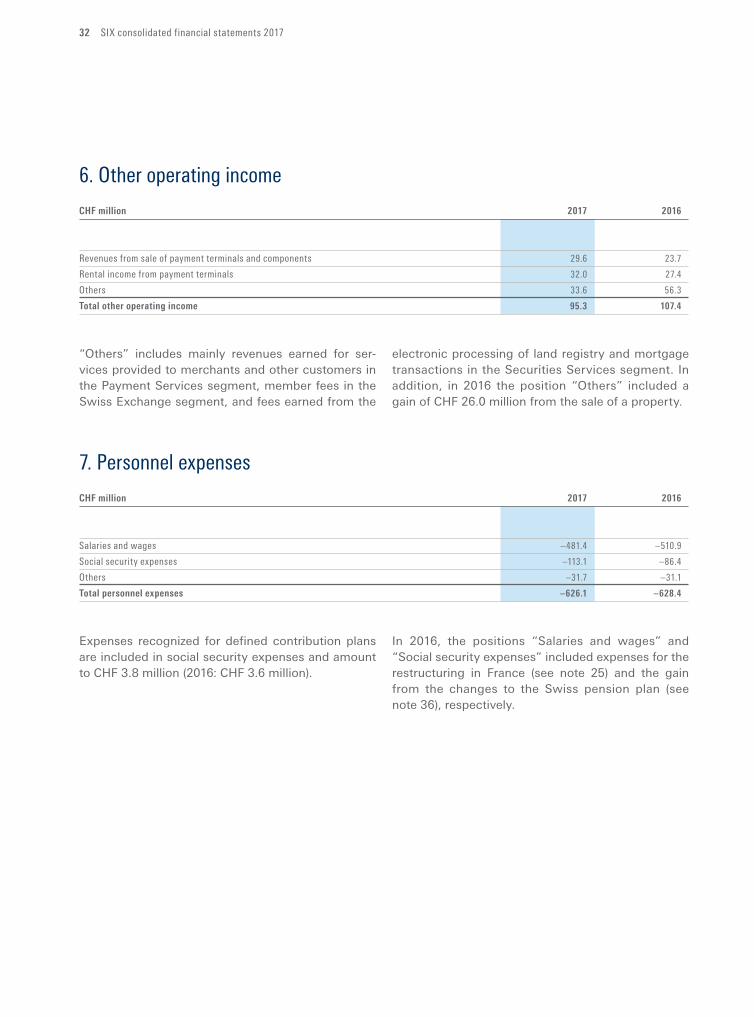
32 SIX consolidated financial statements 2017
6. Other operating income
CHFmillion 2017 2016
Revenues from sale of payment terminals and components 29.6 23.7
Rental income from payment terminals 32.0 27.4
Others 33.6 56.3
Totalotheroperatingincome 95.3 107.4
“Others” includes mainly revenues earned for services provided to merchants and other customers in the Payment Services segment, member fees in the Swiss Exchange segment, and fees earned from the
electronic processing of land registry and mortgage transactions in the Securities Services segment. In addition, in 2016 the position “Others” included a gain of CHF 26.0 million from the sale of a property.
7. Personnel expenses
CHFmillion 2017 2016
Salaries and wages –481.4 –510.9
Social security expenses –113.1 –86.4
Others –31.7 –31.1
Totalpersonnelexpenses –626.1 –628.4
Expenses recognized for defined contribution plans are included in social security expenses and amount to CHF 3.8 million (2016: CHF 3.6 million).
In 2016, the positions “Salaries and wages” and “Social security expenses” included expenses for the restructuring in France (see note 25) and the gain from the changes to the Swiss pension plan (see note 36), respectively.
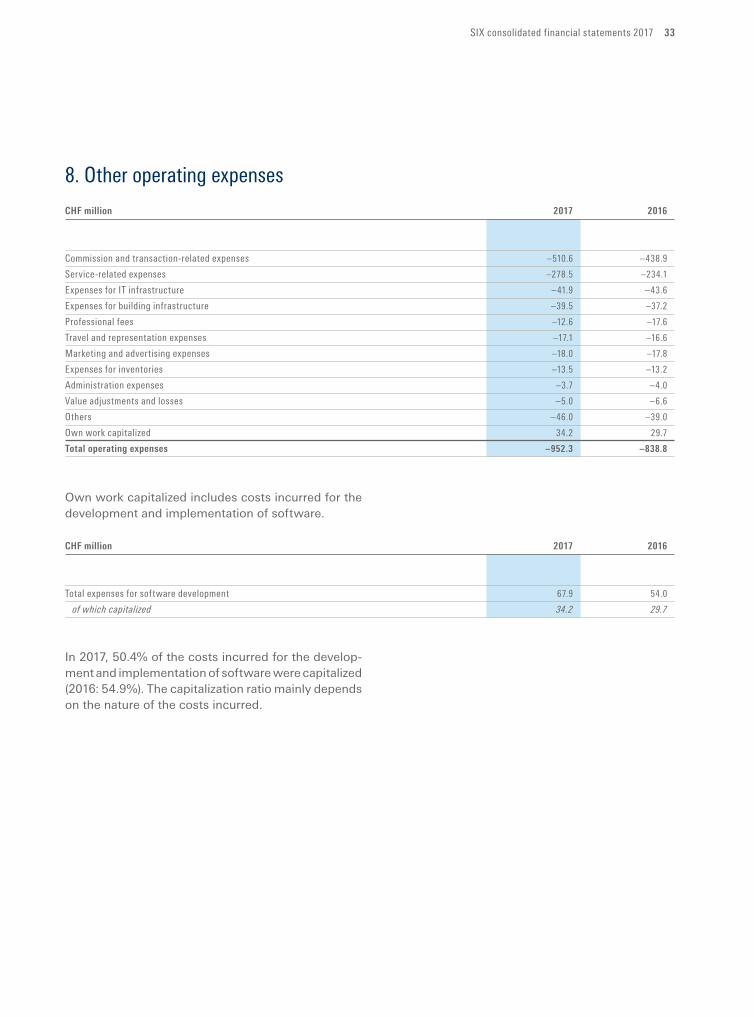
SIX consolidated financial statements 2017 33
8. Other operating expenses
CHFmillion 2017 2016
Commission and transaction-related expenses –510.6 –438.9
Service-related expenses –278.5 –234.1
Expenses for IT infrastructure –41.9 –43.6
Expenses for building infrastructure –39.5 –37.2
Professional fees –12.6 –17.6
Travel and representation expenses –17.1 –16.6
Marketing and advertising expenses –18.0 –17.8
Expenses for inventories –13.5 –13.2
Administration expenses –3.7 –4.0
Value adjustments and losses –5.0 –6.6
Others –46.0 –39.0
Own work capitalized 34.2 29.7
Totaloperatingexpenses –952.3 –838.8
Own work capitalized includes costs incurred for the development and implementation of software.
CHFmillion 2017 2016
Total expenses for software development 67.9 54.0
of which capitalized 34.2 29.7
In 2017, 50.4% of the costs incurred for the development and implementation of software were capitalized (2016: 54.9%). The capitalization ratio mainly depends on the nature of the costs incurred.
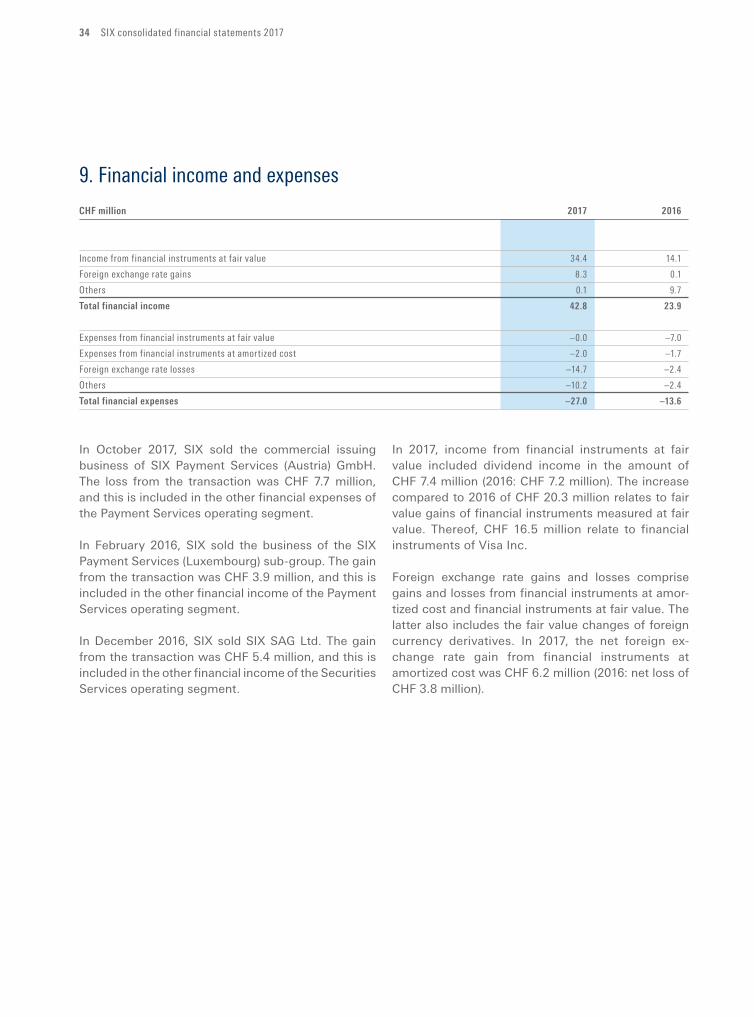
34 SIX consolidated financial statements 2017
9. Financial income and expenses
CHFmillion 2017 2016
Income from financial instruments at fair value 34.4 14.1
Foreign exchange rate gains 8.3 0.1
Others 0.1 9.7
Totalfinancialincome 42.8 23.9
Expenses from financial instruments at fair value –0.0 –7.0
Expenses from financial instruments at amortized cost –2.0 –1.7
Foreign exchange rate losses –14.7 –2.4
Others –10.2 –2.4
Totalfinancialexpenses –27.0 –13.6
In October 2017, SIX sold the commercial issuing business of SIX Payment Services (Austria) GmbH. The loss from the transaction was CHF 7.7 million, and this is included in the other financial expenses of the Payment Services operating segment.
In February 2016, SIX sold the business of the SIX Payment Services (Luxembourg) subgroup. The gain from the transaction was CHF 3.9 million, and this is included in the other financial income of the Payment Services operating segment.
In December 2016, SIX sold SIX SAG Ltd. The gain from the transaction was CHF 5.4 million, and this is included in the other financial income of the Securities Services operating segment.
In 2017, income from financial instruments at fair value included dividend income in the amount of CHF 7.4 million (2016: CHF 7.2 million). The increase compared to 2016 of CHF 20.3 million relates to fair value gains of financial instruments measured at fair value. Thereof, CHF 16.5 million relate to financial instruments of Visa Inc.
Foreign exchange rate gains and losses comprise gains and losses from financial instruments at amortized cost and financial instruments at fair value. The latter also includes the fair value changes of foreign currency derivatives. In 2017, the net foreign exchange rate gain from financial instruments at amor tized cost was CHF 6.2 million (2016: net loss of CHF 3.8 million).
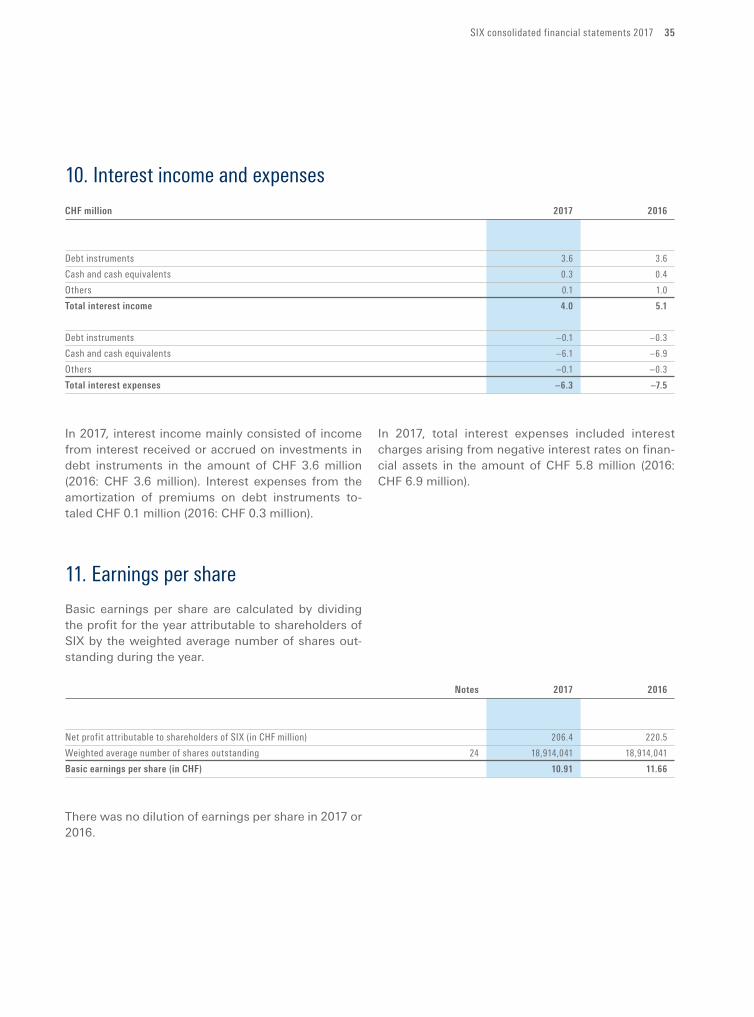
SIX consolidated financial statements 2017 35
10. Interest income and expenses
CHFmillion 2017 2016
Debt instruments 3.6 3.6
Cash and cash equivalents 0.3 0.4
Others 0.1 1.0
Totalinterestincome 4.0 5.1
Debt instruments –0.1 –0.3
Cash and cash equivalents –6.1 –6.9
Others –0.1 –0.3
Totalinterestexpenses –6.3 –7.5
In 2017, interest income mainly consisted of income from interest received or accrued on investments in debt instruments in the amount of CHF 3.6 million (2016: CHF 3.6 million). Interest expenses from the amortization of premiums on debt instruments totaled CHF 0.1 million (2016: CHF 0.3 million).
In 2017, total interest expenses included interest charges arising from negative interest rates on financial assets in the amount of CHF 5.8 million (2016: CHF 6.9 million).
11. Earnings per share
Basic earnings per share are calculated by dividing the profit for the year attributable to shareholders of SIX by the weighted average number of shares outstanding during the year.
Notes 2017 2016
Net profit attributable to shareholders of SIX (in CHF million) 206.4 220.5
Weighted average number of shares outstanding 24 18,914,041 18,914,041
Basicearningspershare(inCHF) 10.91 11.66
There was no dilution of earnings per share in 2017 or 2016.
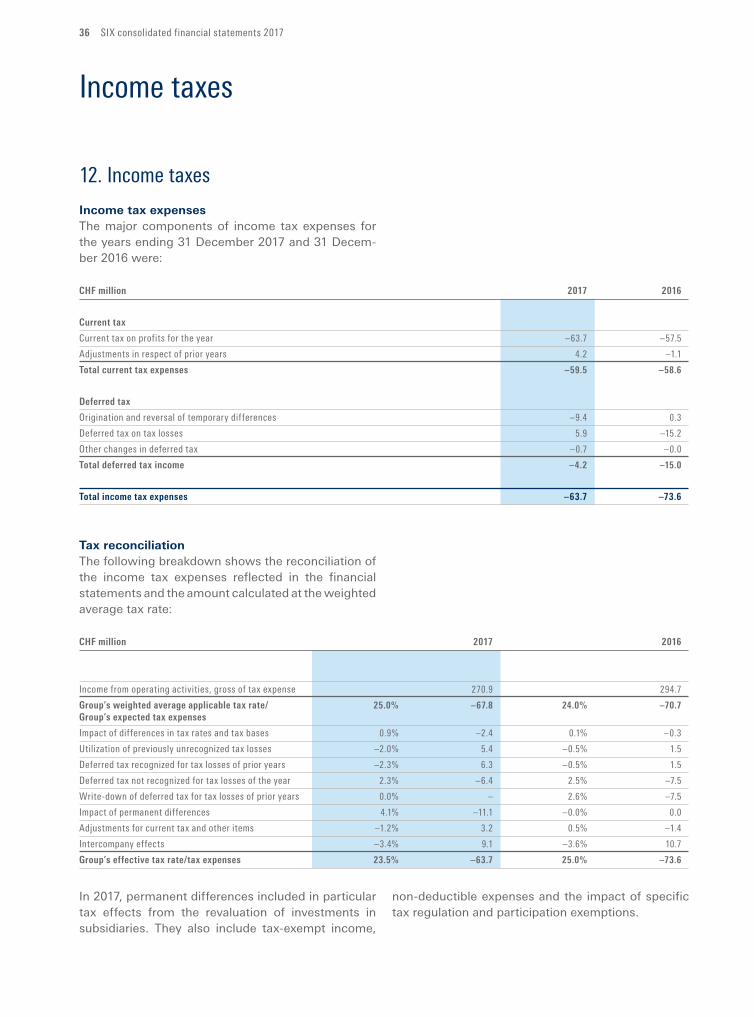
36 SIX consolidated financial statements 2017
Income taxes
12. Income taxes
Income tax expensesThe major components of income tax expenses for the years ending 31 December 2017 and 31 Decem-ber 2016 were:
CHFmillion 2017 2016
Currenttax
Current tax on profits for the year –63.7 –57.5
Adjustments in respect of prior years 4.2 –1.1
Totalcurrenttaxexpenses –59.5 –58.6
Deferredtax
Origination and reversal of temporary differences –9.4 0.3
Deferred tax on tax losses 5.9 –15.2
Other changes in deferred tax –0.7 –0.0
Totaldeferredtaxincome –4.2 –15.0
Totalincometaxexpenses –63.7 –73.6
Tax reconciliationThe following breakdown shows the reconciliation of the income tax expenses reflected in the financial statements and the amount calculated at the weighted average tax rate:
CHFmillion 2017 2016
Income from operating activities, gross of tax expense 270.9 294.7
Group’sweightedaverageapplicabletaxrate/ 25.0% –67.8 24.0% –70.7
Group’sexpectedtaxexpenses
Impact of differences in tax rates and tax bases 0.9% –2.4 0.1% –0.3
Utilization of previously unrecognized tax losses –2.0% 5.4 –0.5% 1.5
Deferred tax recognized for tax losses of prior years –2.3% 6.3 –0.5% 1.5
Deferred tax not recognized for tax losses of the year 2.3% –6.4 2.5% –7.5
Write-down of deferred tax for tax losses of prior years 0.0% – 2.6% –7.5
Impact of permanent differences 4.1% –11.1 –0.0% 0.0
Adjustments for current tax and other items –1.2% 3.2 0.5% –1.4
Intercompany effects –3.4% 9.1 –3.6% 10.7
Group’seffectivetaxrate/taxexpenses 23.5% –63.7 25.0% –73.6
In 2017, permanent differences included in particular tax effects from the revaluation of investments in subsidiaries. They also include taxexempt income,
nondeductible expenses and the impact of specific tax regulation and participation exemptions.
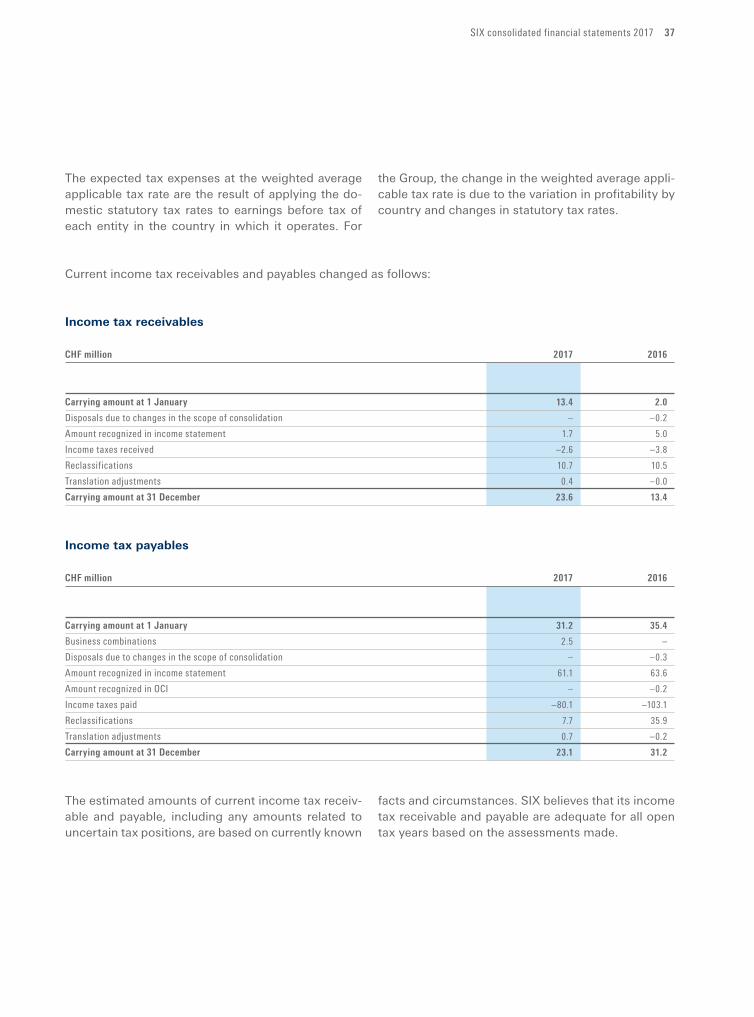
SIX consolidated financial statements 2017 37
The expected tax expenses at the weighted average applicable tax rate are the result of applying the domestic statutory tax rates to earnings before tax of each entity in the country in which it operates. For
the Group, the change in the weighted average applicable tax rate is due to the variation in profitability by country and changes in statutory tax rates.
Current income tax receivables and payables changed as follows:
Income tax receivables
CHFmillion 2017 2016
Carryingamountat1January 13.4 2.0
Disposals due to changes in the scope of consolidation – –0.2
Amount recognized in income statement 1.7 5.0
Income taxes received –2.6 –3.8
Reclassifications 10.7 10.5
Translation adjustments 0.4 –0.0
Carryingamountat31December 23.6 13.4
Income tax payables
CHFmillion 2017 2016
Carryingamountat1January 31.2 35.4
Business combinations 2.5 –
Disposals due to changes in the scope of consolidation – –0.3
Amount recognized in income statement 61.1 63.6
Amount recognized in OCI – –0.2
Income taxes paid –80.1 –103.1
Reclassifications 7.7 35.9
Translation adjustments 0.7 –0.2
Carryingamountat31December 23.1 31.2
The estimated amounts of current income tax receivable and payable, including any amounts related to uncertain tax positions, are based on currently known
facts and circumstances. SIX believes that its income tax receivable and payable are adequate for all open tax years based on the assessments made.
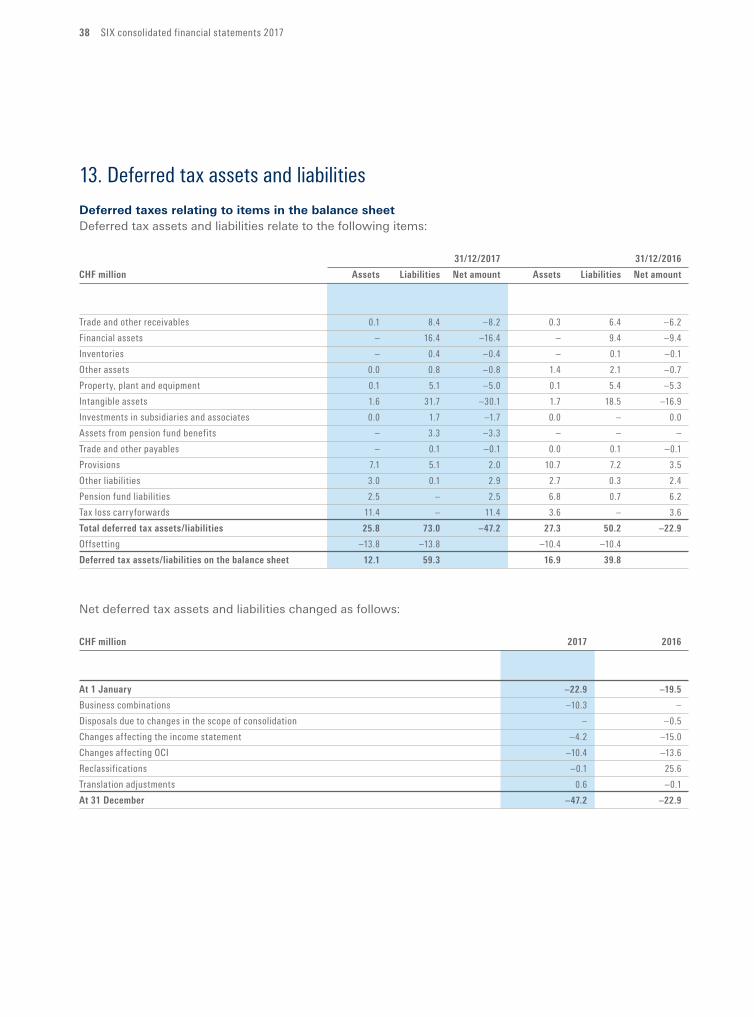
38 SIX consolidated financial statements 2017
13. Deferred tax assets and liabilities
Deferred taxes relating to items in the balance sheetDeferred tax assets and liabilities relate to the following items:
31/12/2017 31/12/2016
CHFmillion Assets Liabilities Netamount Assets Liabilities Netamount
Trade and other receivables 0.1 8.4 –8.2 0.3 6.4 –6.2
Financial assets – 16.4 –16.4 – 9.4 –9.4
Inventories – 0.4 –0.4 – 0.1 –0.1
Other assets 0.0 0.8 –0.8 1.4 2.1 –0.7
Property, plant and equipment 0.1 5.1 –5.0 0.1 5.4 –5.3
Intangible assets 1.6 31.7 –30.1 1.7 18.5 –16.9
Investments in subsidiaries and associates 0.0 1.7 –1.7 0.0 – 0.0
Assets from pension fund benefits – 3.3 –3.3 – – –
Trade and other payables – 0.1 –0.1 0.0 0.1 –0.1
Provisions 7.1 5.1 2.0 10.7 7.2 3.5
Other liabilities 3.0 0.1 2.9 2.7 0.3 2.4
Pension fund liabilities 2.5 – 2.5 6.8 0.7 6.2
Tax loss carryforwards 11.4 – 11.4 3.6 – 3.6
Totaldeferredtaxassets/liabilities 25.8 73.0 –47.2 27.3 50.2 –22.9
Offsetting –13.8 –13.8 –10.4 –10.4
Deferredtaxassets/liabilitiesonthebalancesheet 12.1 59.3 16.9 39.8
Net deferred tax assets and liabilities changed as follows:
CHFmillion 2017 2016
At1January –22.9 –19.5
Business combinations –10.3 –
Disposals due to changes in the scope of consolidation – –0.5
Changes affecting the income statement –4.2 –15.0
Changes affecting OCI –10.4 –13.6
Reclassifications –0.1 25.6
Translation adjustments 0.6 –0.1
At31December –47.2 –22.9
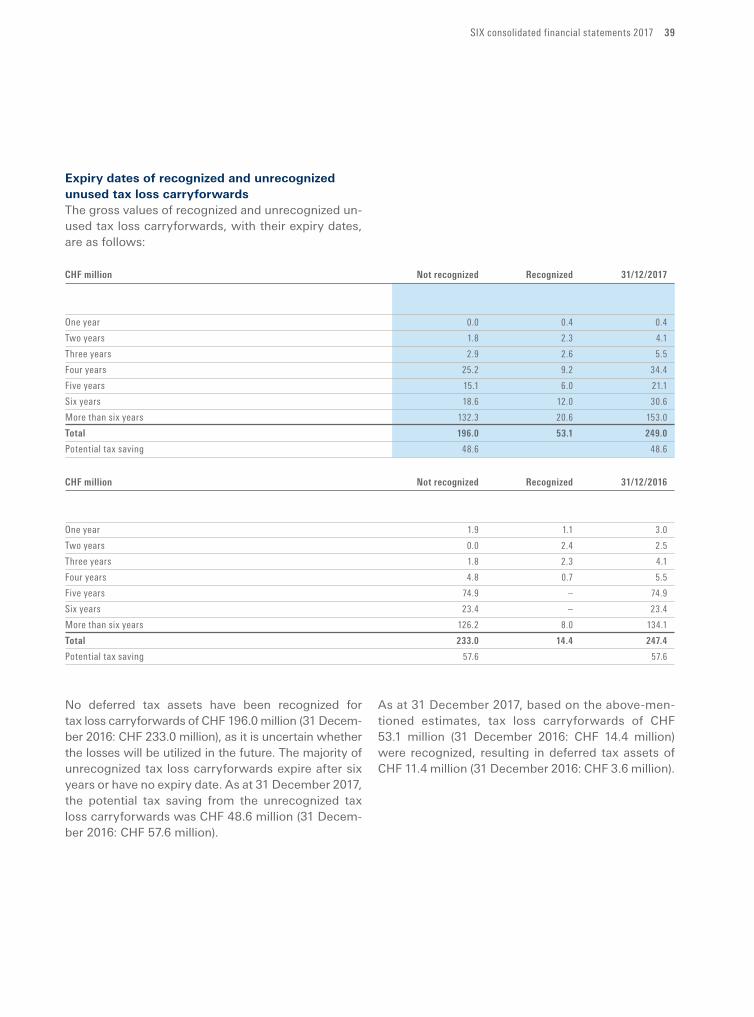
SIX consolidated financial statements 2017 39
Expiry dates of recognized and unrecognized unused tax loss carryforwardsThe gross values of recognized and unrecognized unused tax loss carryforwards, with their expiry dates, are as follows:
CHFmillion Not recognized Recognized 31/12/2017
One year 0.0 0.4 0.4
Two years 1.8 2.3 4.1
Three years 2.9 2.6 5.5
Four years 25.2 9.2 34.4
Five years 15.1 6.0 21.1
Six years 18.6 12.0 30.6
More than six years 132.3 20.6 153.0
Total 196.0 53.1 249.0
Potential tax saving 48.6 48.6
CHFmillion Not recognized Recognized 31/12/2016
One year 1.9 1.1 3.0
Two years 0.0 2.4 2.5
Three years 1.8 2.3 4.1
Four years 4.8 0.7 5.5
Five years 74.9 – 74.9
Six years 23.4 – 23.4
More than six years 126.2 8.0 134.1
Total 233.0 14.4 247.4
Potential tax saving 57.6 57.6
No deferred tax assets have been recognized for tax loss carryforwards of CHF 196.0 million (31 Decem-ber 2016: CHF 233.0 million), as it is uncertain whether the losses will be utilized in the future. The majority of unrecognized tax loss carryforwards expire after six years or have no expiry date. As at 31 December 2017, the potential tax saving from the unrecognized tax loss carryforwards was CHF 48.6 million (31 Decem-ber 2016: CHF 57.6 million).
As at 31 December 2017, based on the above- men-tioned estimates, tax loss carryforwards of CHF 53.1 million (31 December 2016: CHF 14.4 million) were recognized, resulting in deferred tax assets of CHF 11.4 million (31 December 2016: CHF 3.6 million).
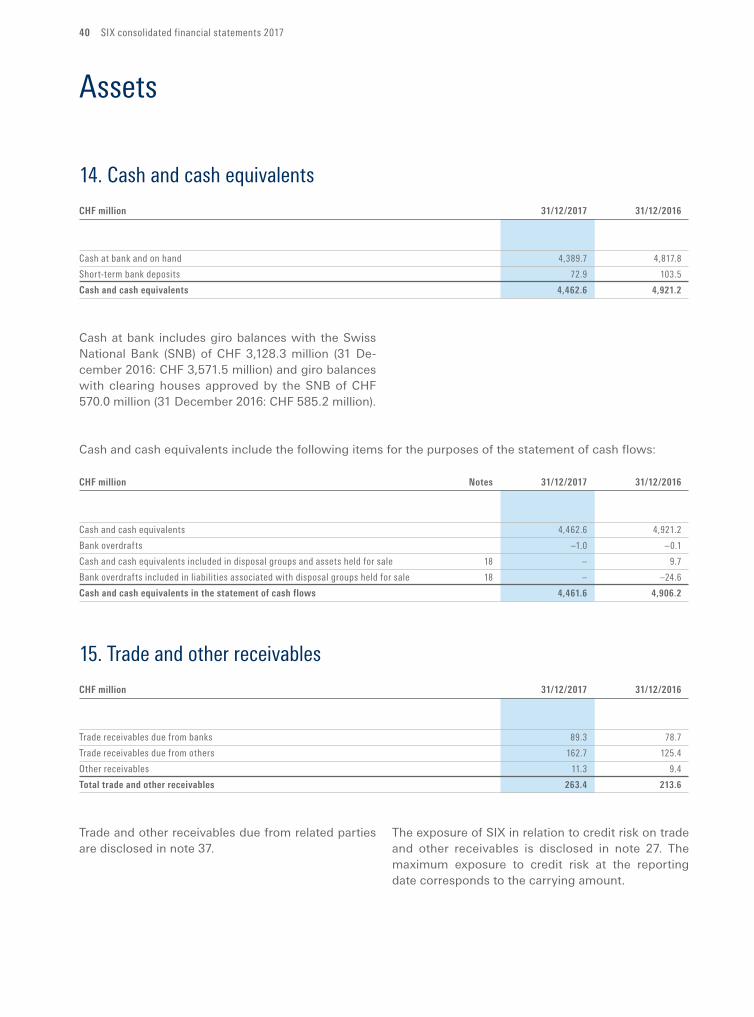
40 SIX consolidated financial statements 2017
Assets
14. Cash and cash equivalents
CHFmillion 31/12/2017 31/12/2016
Cash at bank and on hand 4,389.7 4,817.8
Short-term bank deposits 72.9 103.5
Cashandcashequivalents 4,462.6 4,921.2
Cash at bank includes giro balances with the Swiss National Bank (SNB) of CHF 3,128.3 million (31 De-cember 2016: CHF 3,571.5 million) and giro balances with clearing houses approved by the SNB of CHF 570.0 million (31 December 2016: CHF 585.2 million).
Cash and cash equivalents include the following items for the purposes of the statement of cash flows:
CHFmillion Notes 31/12/2017 31/12/2016
Cash and cash equivalents 4,462.6 4,921.2
Bank overdrafts –1.0 –0.1
Cash and cash equivalents included in disposal groups and assets held for sale 18 – 9.7
Bank overdrafts included in liabilities associated with disposal groups held for sale 18 – –24.6
Cashandcashequivalentsinthestatementofcashflows 4,461.6 4,906.2
15. Trade and other receivables
CHFmillion 31/12/2017 31/12/2016
Trade receivables due from banks 89.3 78.7
Trade receivables due from others 162.7 125.4
Other receivables 11.3 9.4
Totaltradeandotherreceivables 263.4 213.6
Trade and other receivables due from related parties are disclosed in note 37.
The exposure of SIX in relation to credit risk on trade and other receivables is disclosed in note 27. The maximum exposure to credit risk at the reporting date corresponds to the carrying amount.
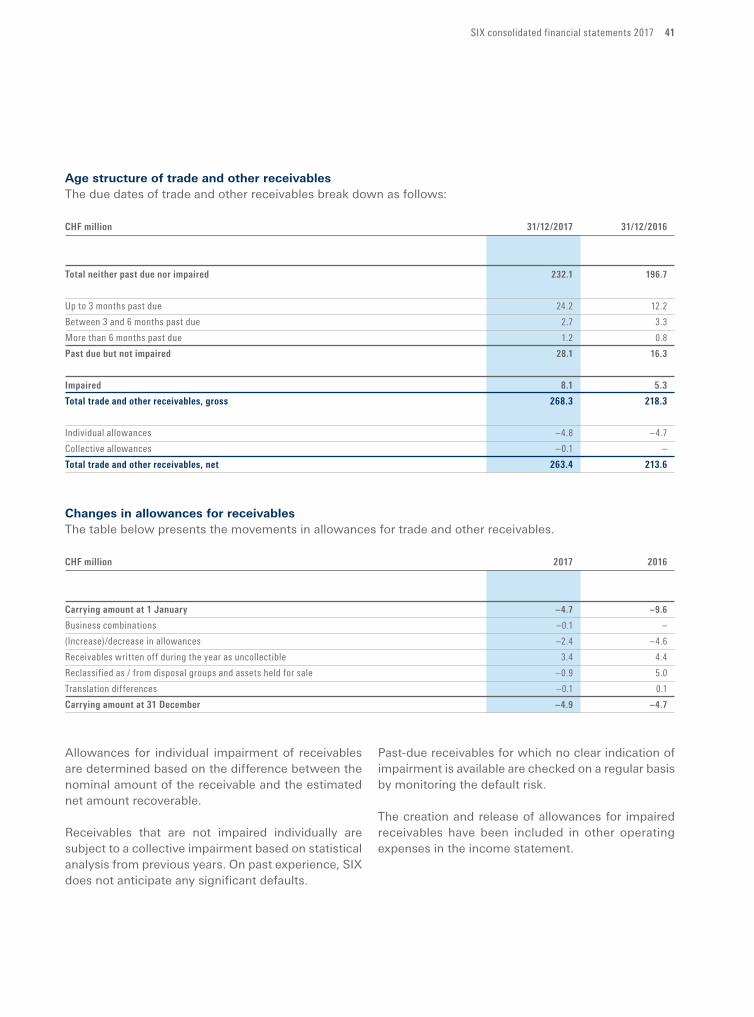
SIX consolidated financial statements 2017 41
Age structure of trade and other receivablesThe due dates of trade and other receivables break down as follows:
CHFmillion 31/12/2017 31/12/2016
Totalneitherpastduenorimpaired 232.1 196.7
Up to 3 months past due 24.2 12.2
Between 3 and 6 months past due 2.7 3.3
More than 6 months past due 1.2 0.8
Pastduebutnotimpaired 28.1 16.3
Impaired 8.1 5.3
Totaltradeandotherreceivables,gross 268.3 218.3
Individual allowances –4.8 –4.7
Collective allowances –0.1 –
Totaltradeandotherreceivables,net 263.4 213.6
Changes in allowances for receivablesThe table below presents the movements in allowances for trade and other receivables.
CHFmillion 2017 2016
Carryingamountat1January –4.7 –9.6
Business combinations –0.1 –
(Increase)/decrease in allowances –2.4 –4.6
Receivables written off during the year as uncollectible 3.4 4.4
Reclassified as / from disposal groups and assets held for sale –0.9 5.0
Translation differences –0.1 0.1
Carryingamountat31December –4.9 –4.7
Allowances for individual impairment of receivables are determined based on the difference between the nominal amount of the receivable and the estimated net amount recoverable.
Receivables that are not impaired individually are subject to a collective impairment based on statistical analysis from previous years. On past experience, SIX does not anticipate any significant defaults.
Pastdue receivables for which no clear indication of impairment is available are checked on a regular basis by monitoring the default risk.
The creation and release of allowances for impaired receivables have been included in other operating expenses in the income statement.
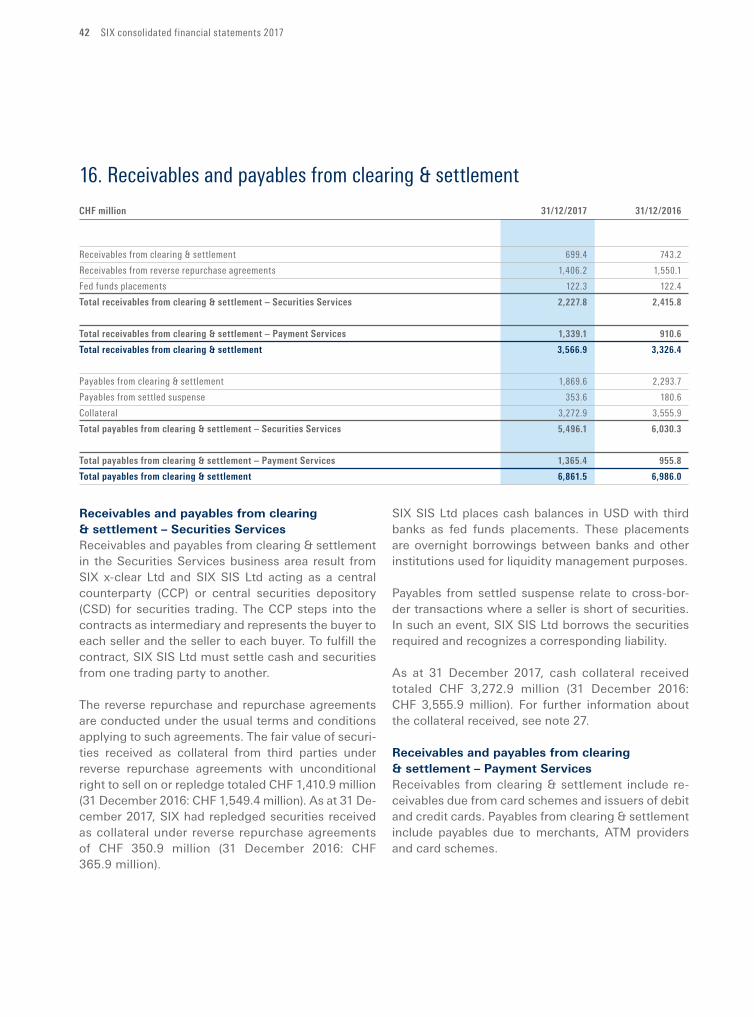
42 SIX consolidated financial statements 2017
16. Receivables and payables from clearing & settlement
CHFmillion 31/12/2017 31/12/2016
Receivables from clearing & settlement 699.4 743.2
Receivables from reverse repurchase agreements 1,406.2 1,550.1
Fed funds placements 122.3 122.4
Totalreceivablesfromclearing&settlement–SecuritiesServices 2,227.8 2,415.8
Totalreceivablesfromclearing&settlement–PaymentServices 1,339.1 910.6
Totalreceivablesfromclearing&settlement 3,566.9 3,326.4
Payables from clearing & settlement 1,869.6 2,293.7
Payables from settled suspense 353.6 180.6
Collateral 3,272.9 3,555.9
Totalpayablesfromclearing&settlement–SecuritiesServices 5,496.1 6,030.3
Totalpayablesfromclearing&settlement–PaymentServices 1,365.4 955.8
Totalpayablesfromclearing&settlement 6,861.5 6,986.0
Receivables and payables from clearing & settlement – Securities ServicesReceivables and payables from clearing & settlement in the Securities Services business area result from SIX x-clear Ltd and SIX SIS Ltd acting as a central counterparty (CCP) or central securities depository (CSD) for securities trading. The CCP steps into the contracts as intermediary and represents the buyer to each seller and the seller to each buyer. To fulfill the contract, SIX SIS Ltd must settle cash and securities from one trading party to another.
The reverse repurchase and repurchase agreements are conducted under the usual terms and conditions applying to such agreements. The fair value of securities received as collateral from third parties under reverse repurchase agreements with unconditional right to sell on or repledge totaled CHF 1,410.9 mil lion (31 December 2016: CHF 1,549.4 million). As at 31 De-cember 2017, SIX had repledged securities received as collateral under reverse repurchase agreements of CHF 350.9 million (31 December 2016: CHF 365.9 million).
SIX SIS Ltd places cash balances in USD with third banks as fed funds placements. These placements are overnight borrowings between banks and other institutions used for liquidity management purposes.
Payables from settled suspense relate to crossborder transactions where a seller is short of securities. In such an event, SIX SIS Ltd borrows the securities required and recognizes a corresponding liability.
As at 31 December 2017, cash collateral received totaled CHF 3,272.9 million (31 December 2016: CHF 3,555.9 million). For further information about the collateral received, see note 27.
Receivables and payables from clearing & settlement – Payment ServicesReceivables from clearing & settlement include receivables due from card schemes and issuers of debit and credit cards. Payables from clearing & settlement include payables due to merchants, ATM providers and card schemes.
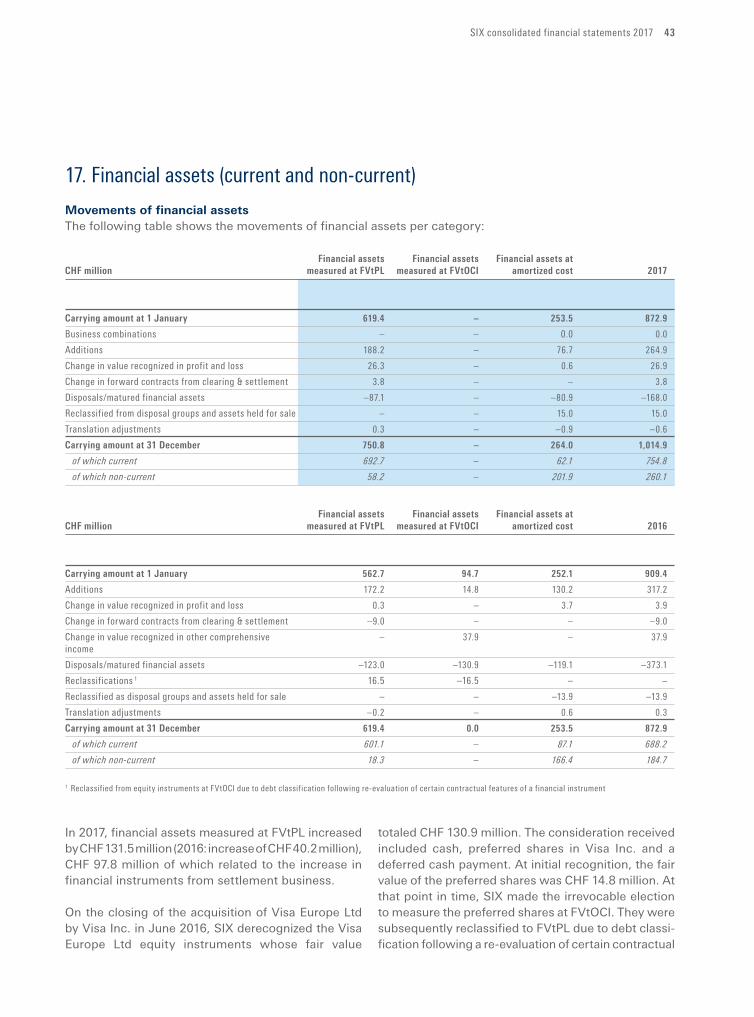
SIX consolidated financial statements 2017 43
17. Financial assets (current and non-current)
Movements of financial assetsThe following table shows the movements of financial assets per category:
Financial assets Financial assets Financial assets at
CHFmillion measuredatFVtPL measuredatFVtOCI amortizedcost 2017
Carryingamountat1January 619.4 – 253.5 872.9
Business combinations – – 0.0 0.0
Additions 188.2 – 76.7 264.9
Change in value recognized in profit and loss 26.3 – 0.6 26.9
Change in forward contracts from clearing & settlement 3.8 – – 3.8
Disposals/matured financial assets –87.1 – –80.9 –168.0
Reclassified from disposal groups and assets held for sale – – 15.0 15.0
Translation adjustments 0.3 – –0.9 –0.6
Carryingamountat31December 750.8 – 264.0 1,014.9
of which current 692.7 – 62.1 754.8
of which non-current 58.2 – 201.9 260.1
Financial assets Financial assets Financial assets at
CHFmillion measuredatFVtPL measuredatFVtOCI amortizedcost 2016
Carryingamountat1January 562.7 94.7 252.1 909.4
Additions 172.2 14.8 130.2 317.2
Change in value recognized in profit and loss 0.3 – 3.7 3.9
Change in forward contracts from clearing & settlement –9.0 – – –9.0
Change in value recognized in other comprehensive – 37.9 – 37.9
income
Disposals/matured financial assets –123.0 –130.9 –119.1 –373.1
Reclassifications 1 16.5 –16.5 – –
Reclassified as disposal groups and assets held for sale – – –13.9 –13.9
Translation adjustments –0.2 – 0.6 0.3
Carryingamountat31December 619.4 0.0 253.5 872.9
of which current 601.1 – 87.1 688.2
of which non-current 18.3 – 166.4 184.7
1 Reclassified from equity instruments at FVtOCI due to debt classification following re-evaluation of certain contractual features of a financial instrument
In 2017, financial assets measured at FVtPL in creased by CHF 131.5 million (2016: increase of CHF 40.2 mil lion), CHF 97.8 million of which related to the increase in financial instruments from settlement business.
On the closing of the acquisition of Visa Europe Ltd by Visa Inc. in June 2016, SIX derecognized the Visa Europe Ltd equity instruments whose fair value
totaled CHF 130.9 million. The consideration received included cash, preferred shares in Visa Inc. and a deferred cash payment. At initial recognition, the fair value of the preferred shares was CHF 14.8 million. At that point in time, SIX made the irrevocable election to measure the preferred shares at FVtOCI. They were subsequently reclassified to FVtPL due to debt classification following a reevaluation of certain contractual
44 SIX consolidated financial statements 2017
features. The deferred cash payment of CHF 8.3 million is classified as financial assets at amortized cost. In 2016, SIX also hedged the foreign currency risk of the upfront cash payment for the Visa Europe Ltd equity instruments using foreign currency forward contracts. Up to the derecognition of the Visa Europe Ltd equity instruments in June 2016, the hedge incurred a loss of CHF 0.8 million, which was recognized in other comprehensive income.
During 2017, CHF 80.9 million of debt securities matured or were disposed of (2016: CHF 119.1 million).
On derecognition of the financial assets at amortized cost, a net loss of CHF 1.9 million (2016: net loss of CHF 1.7 million) was recognized within the net financial result (see note 9).
SIX recognizes forward contracts from clearing and settlement activities in its capacity as a central counterparty in the course of fulfilling its task of matching buy and sell orders. As such, SIX recognizes positive and negative fair values of outstanding forward contracts. In 2017, the increase in the fair value of the forward contracts from clearing and settlement was CHF 3.8 million (31 December 2016: decrease of CHF 9.0 million).
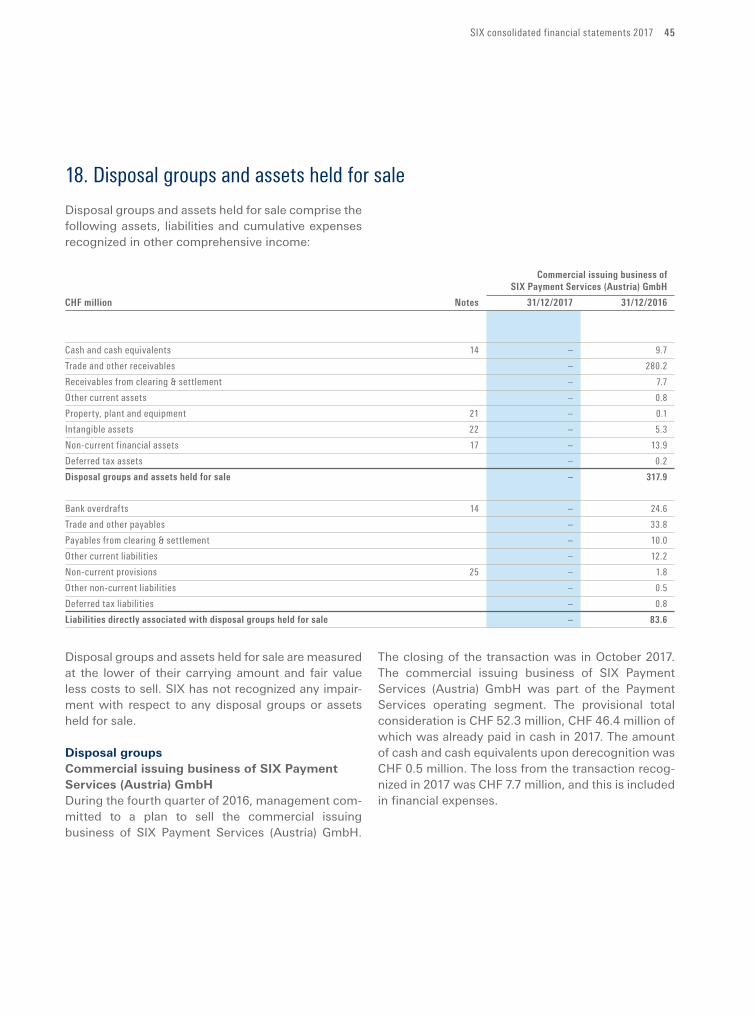
SIX consolidated financial statements 2017 45
18. Disposal groups and assets held for sale
Disposal groups and assets held for sale comprise the following assets, liabilities and cumulative expenses recognized in other comprehensive income:
Commercialissuingbusinessof
SIXPaymentServices(Austria)GmbH
CHFmillion Notes 31/12/2017 31/12/2016
Cash and cash equivalents 14 – 9.7
Trade and other receivables – 280.2
Receivables from clearing & settlement – 7.7
Other current assets – 0.8
Property, plant and equipment 21 – 0.1
Intangible assets 22 – 5.3
Non-current financial assets 17 – 13.9
Deferred tax assets – 0.2
Disposalgroupsandassetsheldforsale – 317.9
Bank overdrafts 14 – 24.6
Trade and other payables – 33.8
Payables from clearing & settlement – 10.0
Other current liabilities – 12.2
Non-current provisions 25 – 1.8
Other non-current liabilities – 0.5
Deferred tax liabilities – 0.8
Liabilitiesdirectlyassociatedwithdisposalgroupsheldforsale – 83.6
Disposal groups and assets held for sale are measured at the lower of their carrying amount and fair value less costs to sell. SIX has not recognized any impairment with respect to any disposal groups or assets held for sale.
Disposal groupsCommercial issuing business of SIX Payment Services (Austria) GmbH During the fourth quarter of 2016, management committed to a plan to sell the commercial issuing business of SIX Payment Services (Austria) GmbH.
The closing of the transaction was in October 2017. The commercial issuing business of SIX Payment Services (Austria) GmbH was part of the Payment Services operating segment. The provisional total consideration is CHF 52.3 million, CHF 46.4 million of which was already paid in cash in 2017. The amount of cash and cash equivalents upon derecognition was CHF 0.5 million. The loss from the transaction recognized in 2017 was CHF 7.7 million, and this is included in financial expenses.
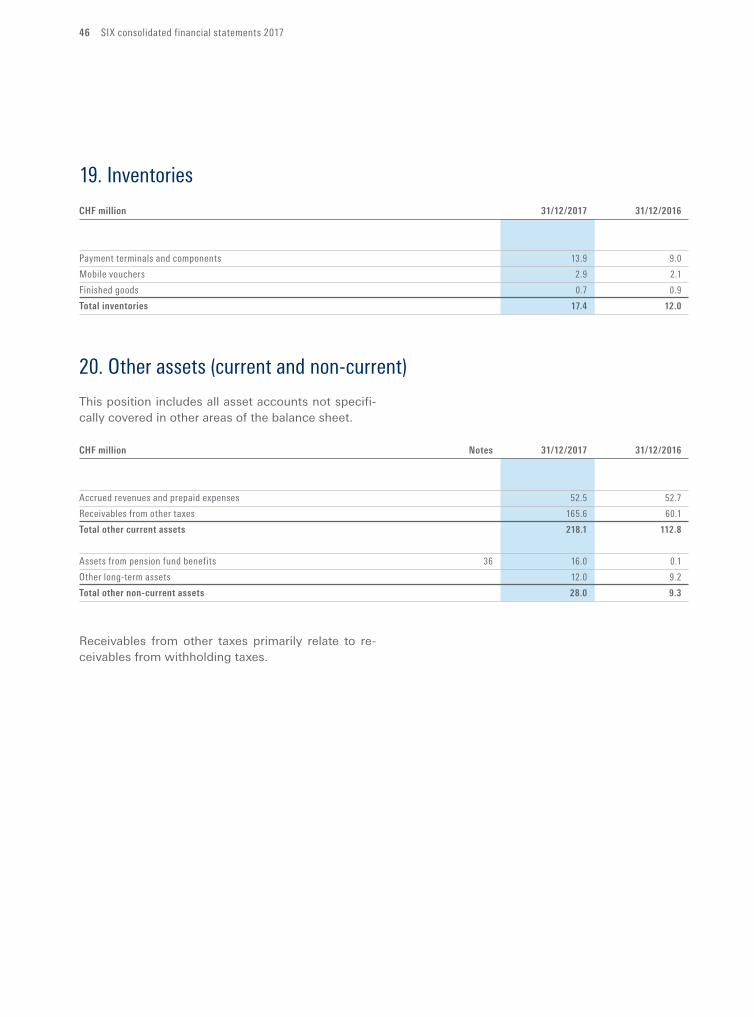
46 SIX consolidated financial statements 2017
19. Inventories
CHFmillion 31/12/2017 31/12/2016
Payment terminals and components 13.9 9.0
Mobile vouchers 2.9 2.1
Finished goods 0.7 0.9
Totalinventories 17.4 12.0
20. Other assets (current and non-current)
This position includes all asset accounts not specifically covered in other areas of the balance sheet.
CHFmillion Notes 31/12/2017 31/12/2016
Accrued revenues and prepaid expenses 52.5 52.7
Receivables from other taxes 165.6 60.1
Totalothercurrentassets 218.1 112.8
Assets from pension fund benefits 36 16.0 0.1
Other long-term assets 12.0 9.2
Totalothernon-currentassets 28.0 9.3
Receivables from other taxes primarily relate to receivables from withholding taxes.
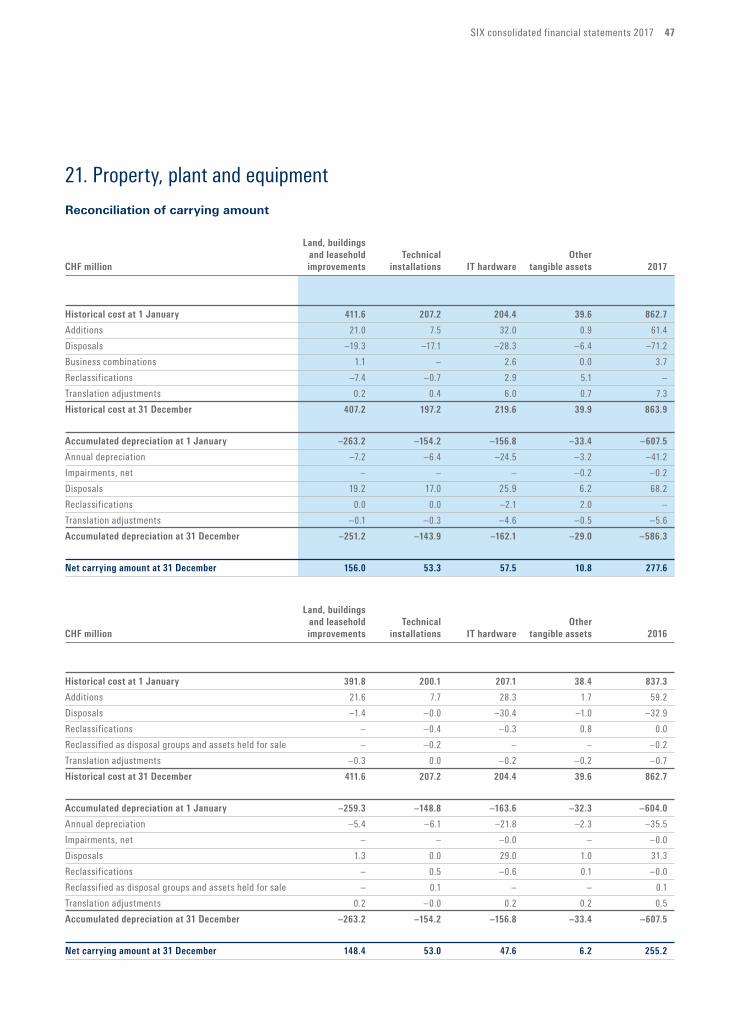
SIX consolidated financial statements 2017 47
21. Property, plant and equipment
Reconciliation of carrying amount
Land,buildings
andleasehold Technical Other
CHFmillion improvements installations IThardware tangibleassets 2017
Historicalcostat1January 411.6 207.2 204.4 39.6 862.7
Additions 21.0 7.5 32.0 0.9 61.4
Disposals –19.3 –17.1 –28.3 –6.4 –71.2
Business combinations 1.1 – 2.6 0.0 3.7
Reclassifications –7.4 –0.7 2.9 5.1 –
Translation adjustments 0.2 0.4 6.0 0.7 7.3
Historicalcostat31December 407.2 197.2 219.6 39.9 863.9
Accumulateddepreciationat1January –263.2 –154.2 –156.8 –33.4 –607.5
Annual depreciation –7.2 –6.4 –24.5 –3.2 –41.2
Impairments, net – – – –0.2 –0.2
Disposals 19.2 17.0 25.9 6.2 68.2
Reclassifications 0.0 0.0 –2.1 2.0 –
Translation adjustments –0.1 –0.3 –4.6 –0.5 –5.6
Accumulateddepreciationat31December –251.2 –143.9 –162.1 –29.0 –586.3
Netcarryingamountat31December 156.0 53.3 57.5 10.8 277.6
Land,buildings
andleasehold Technical Other
CHFmillion improvements installations IThardware tangibleassets 2016
Historicalcostat1January 391.8 200.1 207.1 38.4 837.3
Additions 21.6 7.7 28.3 1.7 59.2
Disposals –1.4 –0.0 –30.4 –1.0 –32.9
Reclassifications – –0.4 –0.3 0.8 0.0
Reclassified as disposal groups and assets held for sale – –0.2 – – –0.2
Translation adjustments –0.3 0.0 –0.2 –0.2 –0.7
Historicalcostat31December 411.6 207.2 204.4 39.6 862.7
Accumulateddepreciationat1January –259.3 –148.8 –163.6 –32.3 –604.0
Annual depreciation –5.4 –6.1 –21.8 –2.3 –35.5
Impairments, net – – –0.0 – –0.0
Disposals 1.3 0.0 29.0 1.0 31.3
Reclassifications – 0.5 –0.6 0.1 –0.0
Reclassified as disposal groups and assets held for sale – 0.1 – – 0.1
Translation adjustments 0.2 –0.0 0.2 0.2 0.5
Accumulateddepreciationat31December –263.2 –154.2 –156.8 –33.4 –607.5
Netcarryingamountat31December 148.4 53.0 47.6 6.2 255.2
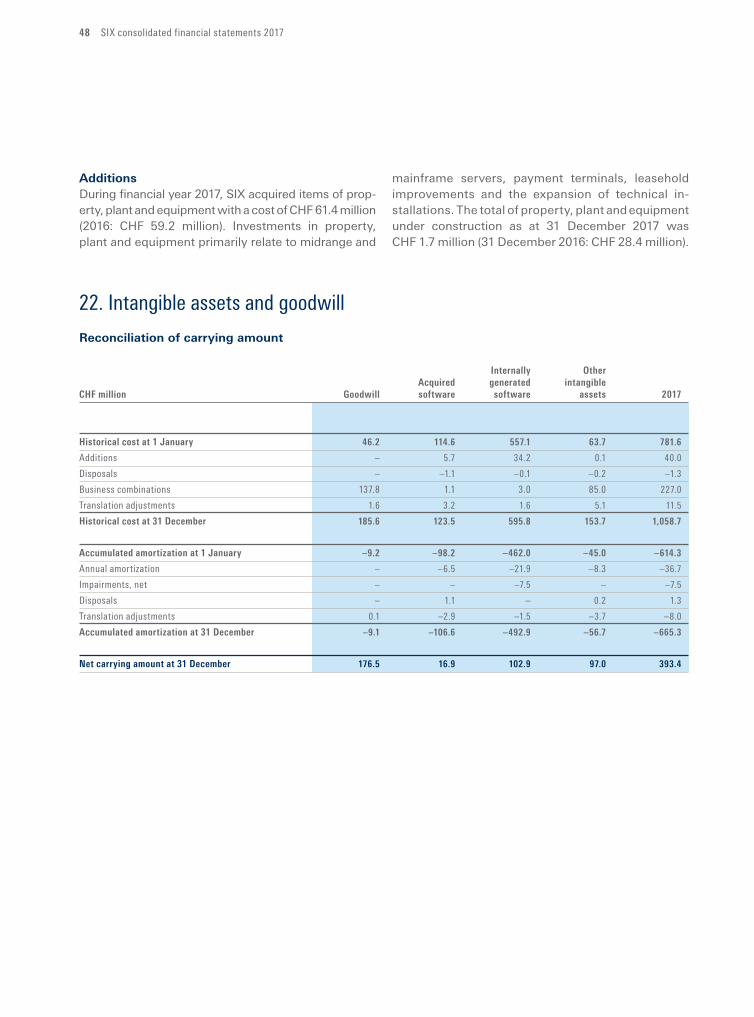
48 SIX consolidated financial statements 2017
AdditionsDuring financial year 2017, SIX acquired items of property, plant and equipment with a cost of CHF 61.4 million (2016: CHF 59.2 million). Investments in property, plant and equipment primarily relate to midrange and
mainframe servers, payment terminals, leasehold improvements and the expansion of technical installations. The total of property, plant and equipment under construction as at 31 Decem ber 2017 was CHF 1.7 million (31 December 2016: CHF 28.4 million).
22. Intangible assets and goodwill
Reconciliation of carrying amount
Internally Other
Acquired generated intangible
CHFmillion Goodwill software software assets 2017
Historicalcostat1January 46.2 114.6 557.1 63.7 781.6
Additions – 5.7 34.2 0.1 40.0
Disposals – –1.1 –0.1 –0.2 –1.3
Business combinations 137.8 1.1 3.0 85.0 227.0
Translation adjustments 1.6 3.2 1.6 5.1 11.5
Historicalcostat31December 185.6 123.5 595.8 153.7 1,058.7
Accumulatedamortizationat1January –9.2 –98.2 –462.0 –45.0 –614.3
Annual amortization – –6.5 –21.9 –8.3 –36.7
Impairments, net – – –7.5 – –7.5
Disposals – 1.1 – 0.2 1.3
Translation adjustments 0.1 –2.9 –1.5 –3.7 –8.0
Accumulatedamortizationat31December –9.1 –106.6 –492.9 –56.7 –665.3
Netcarryingamountat31December 176.5 16.9 102.9 97.0 393.4
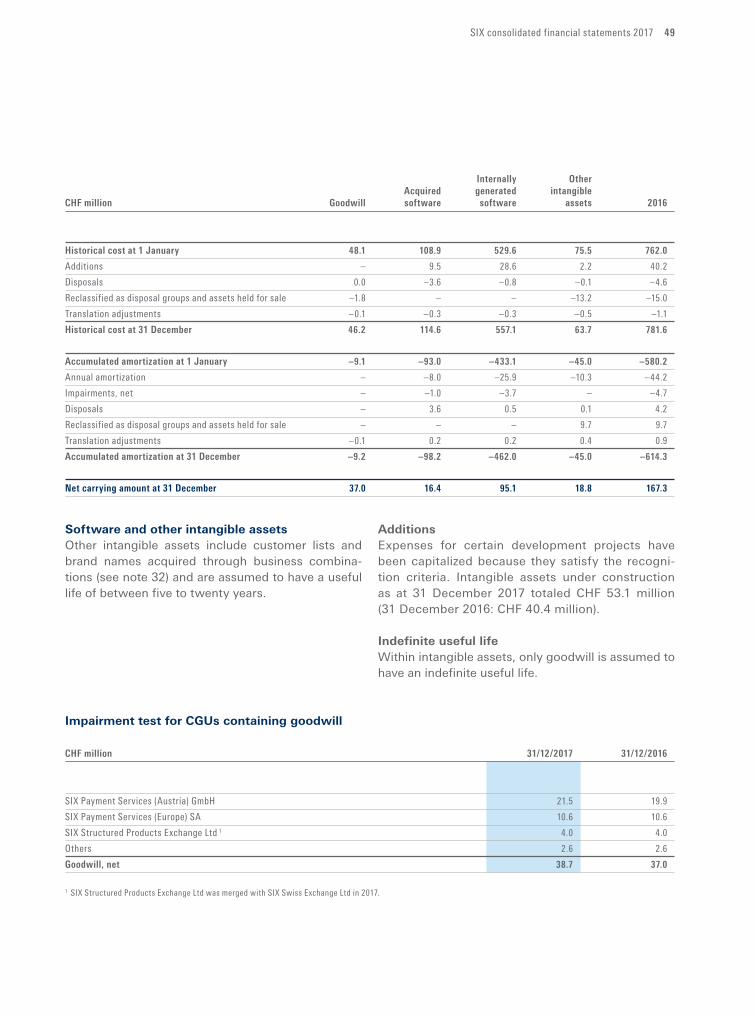
SIX consolidated financial statements 2017 49
Internally Other
Acquired generated intangible
CHFmillion Goodwill software software assets 2016
Historicalcostat1January 48.1 108.9 529.6 75.5 762.0
Additions – 9.5 28.6 2.2 40.2
Disposals 0.0 –3.6 –0.8 –0.1 –4.6
Reclassified as disposal groups and assets held for sale –1.8 – – –13.2 –15.0
Translation adjustments –0.1 –0.3 –0.3 –0.5 –1.1
Historicalcostat31December 46.2 114.6 557.1 63.7 781.6
Accumulatedamortizationat1January –9.1 –93.0 –433.1 –45.0 –580.2
Annual amortization – –8.0 –25.9 –10.3 –44.2
Impairments, net – –1.0 –3.7 – –4.7
Disposals – 3.6 0.5 0.1 4.2
Reclassified as disposal groups and assets held for sale – – – 9.7 9.7
Translation adjustments –0.1 0.2 0.2 0.4 0.9
Accumulatedamortizationat31December –9.2 –98.2 –462.0 –45.0 –614.3
Netcarryingamountat31December 37.0 16.4 95.1 18.8 167.3
Software and other intangible assetsOther intangible assets include customer lists and brand names acquired through business combinations (see note 32) and are assumed to have a useful life of between five to twenty years.
AdditionsExpenses for certain development projects have been capitalized because they satisfy the recognition criteria. Intangible assets under construction as at 31 December 2017 totaled CHF 53.1 million (31 December 2016: CHF 40.4 million).
Indefinite useful lifeWithin intangible assets, only goodwill is assumed to have an indefinite useful life.
Impairment test for CGUs containing goodwill
CHFmillion 31/12/2017 31/12/2016
SIX Payment Services (Austria) GmbH 21.5 19.9
SIX Payment Services (Europe) SA 10.6 10.6
SIX Structured Products Exchange Ltd 1 4.0 4.0
Others 2.6 2.6
Goodwill,net 38.7 37.0
1 SIX Structured Products Exchange Ltd was merged with SIX Swiss Exchange Ltd in 2017.
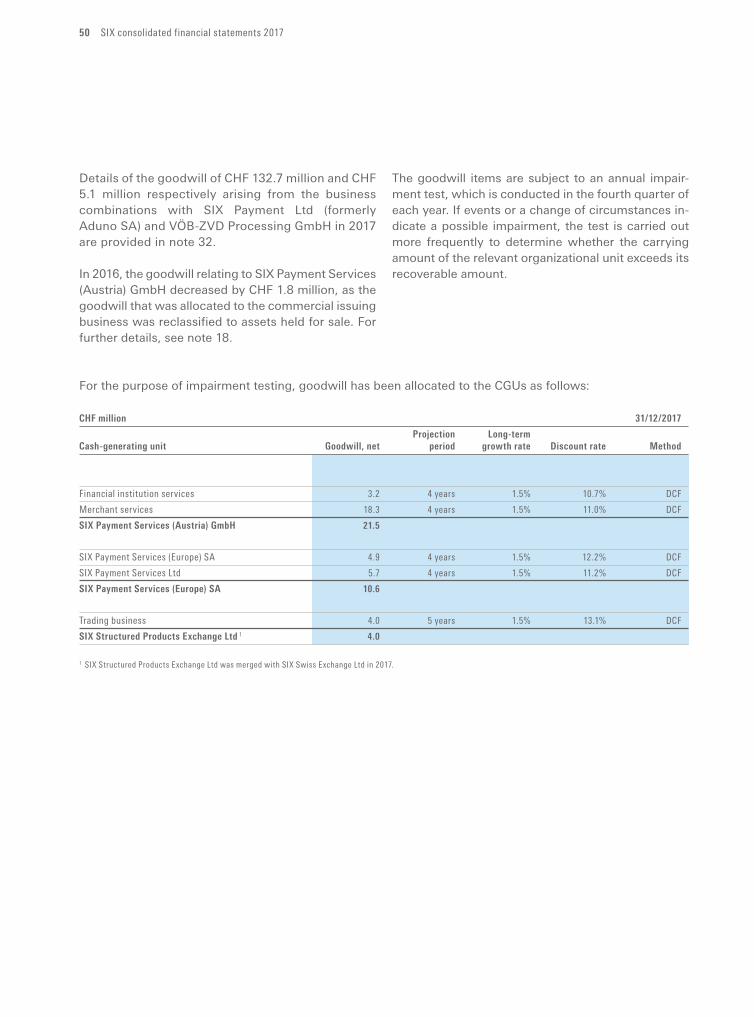
50 SIX consolidated financial statements 2017
Details of the goodwill of CHF 132.7 million and CHF 5.1 million respectively arising from the business combinations with SIX Payment Ltd (formerly Aduno SA) and VÖBZVD Processing GmbH in 2017 are provided in note 32.
In 2016, the goodwill relating to SIX Payment Services (Austria) GmbH decreased by CHF 1.8 million, as the goodwill that was allocated to the commercial issuing business was reclassified to assets held for sale. For further details, see note 18.
The goodwill items are subject to an annual impairment test, which is conducted in the fourth quarter of each year. If events or a change of circumstances indicate a possible impairment, the test is carried out more frequently to determine whether the carrying amount of the relevant organizational unit exceeds its recoverable amount.
For the purpose of impairment testing, goodwill has been allocated to the CGUs as follows:
CHFmillion 31/12/2017
Projection Long-term
Cash-generatingunit Goodwill,net period growthrate Discountrate Method
Financial institution services 3.2 4 years 1.5% 10.7% DCF
Merchant services 18.3 4 years 1.5% 11.0% DCF
SIXPaymentServices(Austria)GmbH 21.5
SIX Payment Services (Europe) SA 4.9 4 years 1.5% 12.2% DCF
SIX Payment Services Ltd 5.7 4 years 1.5% 11.2% DCF
SIXPaymentServices(Europe)SA 10.6
Trading business 4.0 5 years 1.5% 13.1% DCF
SIXStructuredProductsExchangeLtd 1 4.0
1 SIX Structured Products Exchange Ltd was merged with SIX Swiss Exchange Ltd in 2017.
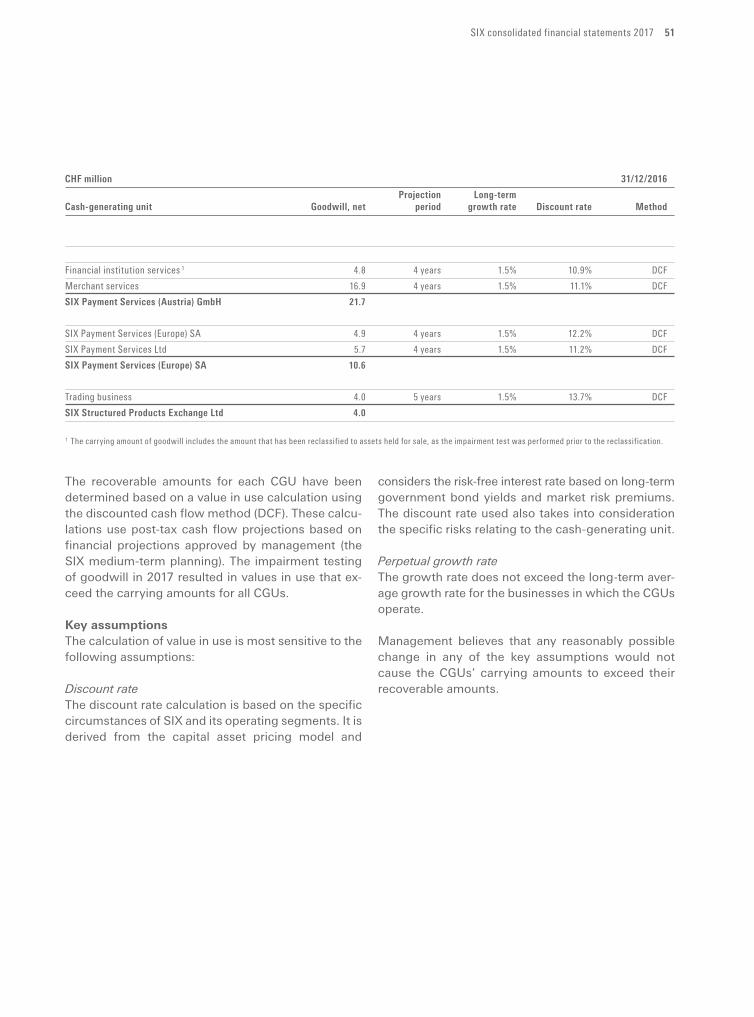
SIX consolidated financial statements 2017 51
CHFmillion 31/12/2016
Projection Long-term
Cash-generatingunit Goodwill,net period growthrate Discountrate Method
Financial institution services 1 4.8 4 years 1.5% 10.9% DCF
Merchant services 16.9 4 years 1.5% 11.1% DCF
SIXPaymentServices(Austria)GmbH 21.7
SIX Payment Services (Europe) SA 4.9 4 years 1.5% 12.2% DCF
SIX Payment Services Ltd 5.7 4 years 1.5% 11.2% DCF
SIXPaymentServices(Europe)SA 10.6
Trading business 4.0 5 years 1.5% 13.7% DCF
SIXStructuredProductsExchangeLtd 4.0
1 The carrying amount of goodwill includes the amount that has been reclassified to assets held for sale, as the impairment test was performed prior to the reclassification.
The recoverable amounts for each CGU have been determined based on a value in use calculation using the discounted cash flow method (DCF). These calculations use posttax cash flow projections based on financial projections approved by management (the SIX mediumterm planning). The impairment testing of goodwill in 2017 resulted in values in use that exceed the carrying amounts for all CGUs.
Key assumptionsThe calculation of value in use is most sensitive to the following assumptions:
Discount rateThe discount rate calculation is based on the specific circumstances of SIX and its operating segments. It is derived from the capital asset pricing model and
considers the riskfree interest rate based on longterm government bond yields and market risk premiums. The discount rate used also takes into consideration the specific risks relating to the cashgenerating unit.
Perpetual growth rateThe growth rate does not exceed the longterm average growth rate for the businesses in which the CGUs operate.
Management believes that any reasonably possible change in any of the key assumptions would not cause the CGUs’ carrying amounts to exceed their recoverable amounts.
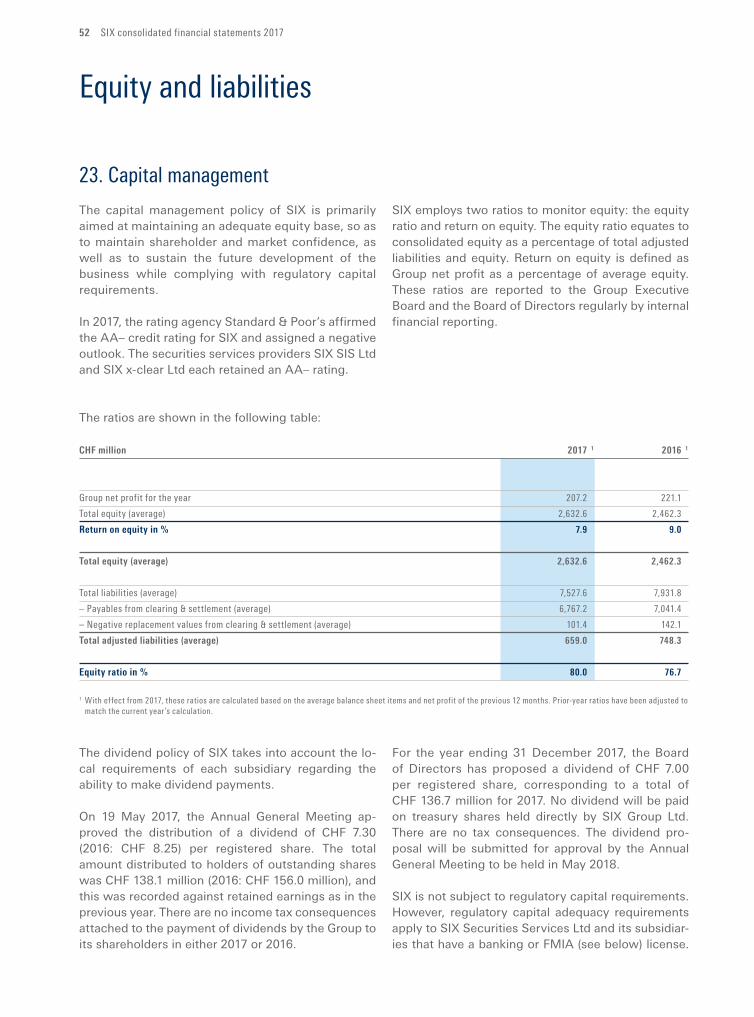
52 SIX consolidated financial statements 2017
Equity and liabilities
23. Capital management
The capital management policy of SIX is primarily aimed at maintaining an adequate equity base, so as to maintain shareholder and market confidence, as well as to sustain the future development of the business while complying with regulatory capital requirements.
In 2017, the rating agency Standard & Poor’s affirmed the AA– credit rating for SIX and assigned a negative outlook. The securities services providers SIX SIS Ltd and SIX xclear Ltd each retained an AA– rating.
SIX employs two ratios to monitor equity: the equity ratio and return on equity. The equity ratio equates to consolidated equity as a percentage of total adjusted liabilities and equity. Return on equity is defined as Group net profit as a percentage of average equity. These ratios are reported to the Group Executive Board and the Board of Directors regularly by internal financial reporting.
The ratios are shown in the following table:
CHFmillion 2017 1 2016 1
Group net profit for the year 207.2 221.1
Total equity (average) 2,632.6 2,462.3
Returnonequityin% 7.9 9.0
Totalequity(average) 2,632.6 2,462.3
Total liabilities (average) 7,527.6 7,931.8
– Payables from clearing & settlement (average) 6,767.2 7,041.4
– Negative replacement values from clearing & settlement (average) 101.4 142.1
Totaladjustedliabilities(average) 659.0 748.3
Equityratioin% 80.0 76.7
1 With effect from 2017, these ratios are calculated based on the average balance sheet items and net profit of the previous 12 months. Prior-year ratios have been adjusted to match the current year’s calculation.
The dividend policy of SIX takes into account the local requirements of each subsidiary regarding the ability to make dividend payments.
On 19 May 2017, the Annual General Meeting approved the distribution of a dividend of CHF 7.30 (2016: CHF 8.25) per registered share. The total amount distributed to holders of outstanding shares was CHF 138.1 million (2016: CHF 156.0 million), and this was recorded against retained earnings as in the previous year. There are no income tax consequences attached to the payment of dividends by the Group to its shareholders in either 2017 or 2016.
For the year ending 31 December 2017, the Board of Directors has proposed a dividend of CHF 7.00 per registered share, corresponding to a total of CHF 136.7 million for 2017. No dividend will be paid on treasury shares held directly by SIX Group Ltd. There are no tax consequences. The dividend proposal will be submitted for approval by the Annual General Meeting to be held in May 2018.
SIX is not subject to regulatory capital requirements. However, regulatory capital adequacy requirements apply to SIX Securities Services Ltd and its subsidiaries that have a banking or FMIA (see below) license.
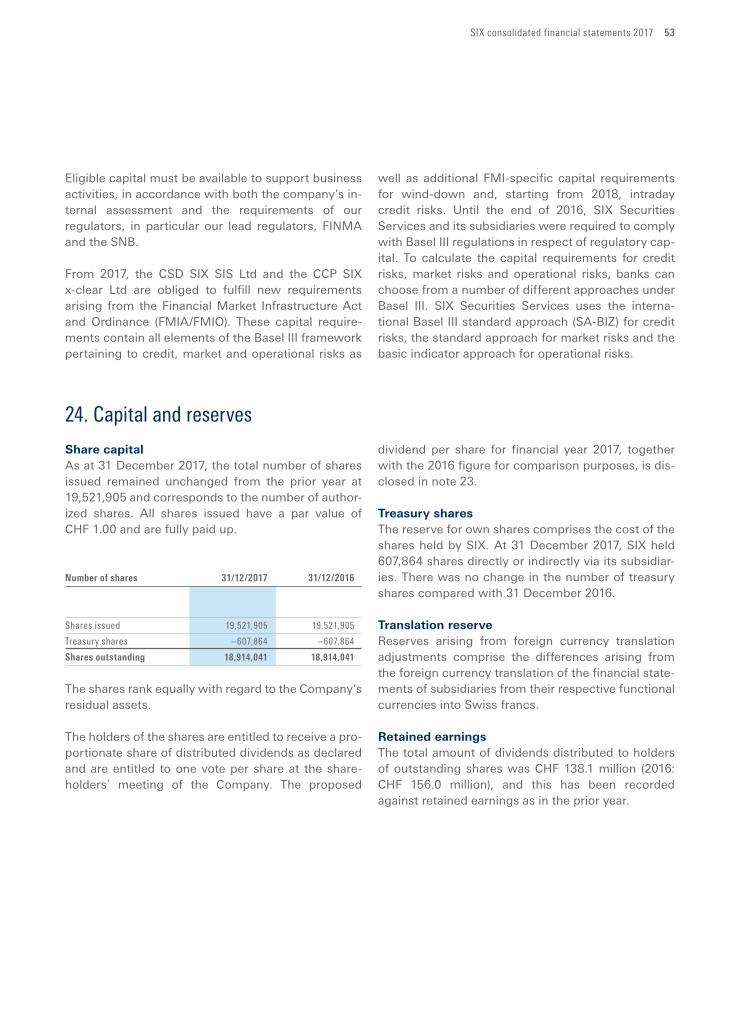
SIX consolidated financial statements 2017 53
Eligible capital must be available to support business activities, in accordance with both the company’s internal assessment and the requirements of our regulators, in particular our lead regulators, FINMA and the SNB.
From 2017, the CSD SIX SIS Ltd and the CCP SIX xclear Ltd are obliged to fulfill new requirements arising from the Financial Market Infrastructure Act and Ordinance (FMIA/FMIO). These capital requirements contain all elements of the Basel III framework pertaining to credit, market and operational risks as
well as additional FMIspecific capital requirements for winddown and, starting from 2018, intraday credit risks. Until the end of 2016, SIX Securities Services and its subsidiaries were required to comply with Basel III regulations in respect of regulatory capital. To calculate the capital requirements for credit risks, market risks and operational risks, banks can choose from a number of different approaches under Basel III. SIX Securities Services uses the international Basel III standard approach (SABIZ) for credit risks, the standard approach for market risks and the basic indicator approach for operational risks.
24. Capital and reserves
Share capitalAs at 31 December 2017, the total number of shares issued remained unchanged from the prior year at 19,521,905 and corresponds to the number of authorized shares. All shares issued have a par value of CHF 1.00 and are fully paid up.
Numberofshares 31/12/2017 31/12/2016
Shares issued 19,521,905 19,521,905
Treasury shares –607,864 –607,864
Sharesoutstanding 18,914,041 18,914,041
The shares rank equally with regard to the Company’s residual assets.
The holders of the shares are entitled to receive a proportionate share of distributed dividends as declared and are entitled to one vote per share at the shareholders´ meeting of the Company. The proposed
dividend per share for financial year 2017, together with the 2016 figure for comparison purposes, is disclosed in note 23.
Treasury sharesThe reserve for own shares comprises the cost of the shares held by SIX. At 31 December 2017, SIX held 607,864 shares directly or indirectly via its subsidiaries. There was no change in the number of treasury shares compared with 31 December 2016.
Translation reserveReserves arising from foreign currency translation adjustments comprise the differences arising from the foreign currency translation of the financial statements of subsidiaries from their respective functional currencies into Swiss francs.
Retained earningsThe total amount of dividends distributed to holders of outstanding shares was CHF 138.1 million (2016: CHF 156.0 million), and this has been recorded against retained earnings as in the prior year.
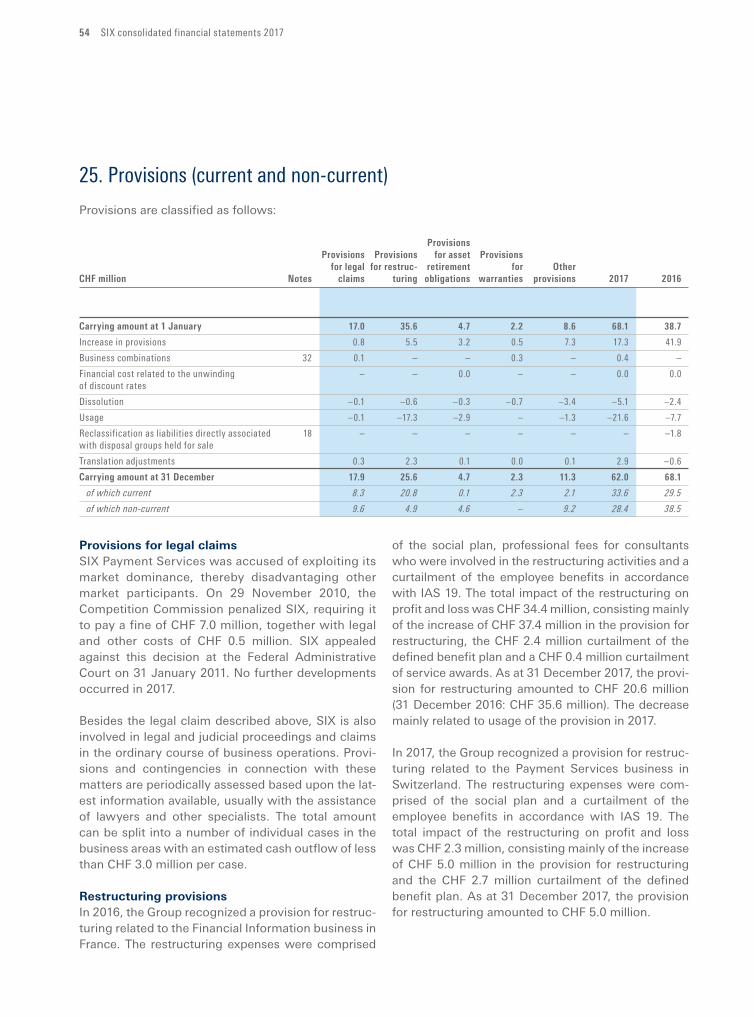
54 SIX consolidated financial statements 2017
25. Provisions (current and non-current)
Provisions are classified as follows:
Provisions
Provisions Provisions for asset Provisions
for legal for restruc- retirement for Other
CHFmillion Notes claims turing obligations warranties provisions 2017 2016
Carryingamountat1January 17.0 35.6 4.7 2.2 8.6 68.1 38.7
Increase in provisions 0.8 5.5 3.2 0.5 7.3 17.3 41.9
Business combinations 32 0.1 – – 0.3 – 0.4 –
Financial cost related to the unwinding – – 0.0 – – 0.0 0.0
of discount rates
Dissolution –0.1 –0.6 –0.3 –0.7 –3.4 –5.1 –2.4
Usage –0.1 –17.3 –2.9 – –1.3 –21.6 –7.7
Reclassification as liabilities directly associated 18 – – – – – – –1.8
with disposal groups held for sale
Translation adjustments 0.3 2.3 0.1 0.0 0.1 2.9 –0.6
Carryingamountat31December 17.9 25.6 4.7 2.3 11.3 62.0 68.1
of which current 8.3 20.8 0.1 2.3 2.1 33.6 29.5
of which non-current 9.6 4.9 4.6 – 9.2 28.4 38.5
Provisions for legal claimsSIX Payment Services was accused of exploiting its market dominance, thereby disadvantaging other market participants. On 29 November 2010, the Competition Commission penalized SIX, requiring it to pay a fine of CHF 7.0 million, together with legal and other costs of CHF 0.5 million. SIX appealed against this decision at the Federal Administrative Court on 31 January 2011. No further developments occurred in 2017.
Besides the legal claim described above, SIX is also involved in legal and judicial proceedings and claims in the ordinary course of business operations. Provisions and contingencies in connection with these matters are periodically assessed based upon the latest information available, usually with the assistance of lawyers and other specialists. The total amount can be split into a number of individual cases in the business areas with an estimated cash outflow of less than CHF 3.0 million per case.
Restructuring provisionsIn 2016, the Group recognized a provision for restructuring related to the Financial Information business in France. The restructuring expenses were comprised
of the social plan, professional fees for consultants who were involved in the restructuring activities and a curtailment of the employee benefits in accordance with IAS 19. The total impact of the restructuring on profit and loss was CHF 34.4 million, consisting mainly of the increase of CHF 37.4 million in the provision for restructuring, the CHF 2.4 million curtailment of the defined benefit plan and a CHF 0.4 million curtailment of service awards. As at 31 December 2017, the provision for restructuring amounted to CHF 20.6 million (31 December 2016: CHF 35.6 million). The decrease mainly related to usage of the provision in 2017.
In 2017, the Group recognized a provision for restructuring related to the Payment Services business in Switzerland. The restructuring expenses were comprised of the social plan and a curtailment of the employee benefits in accordance with IAS 19. The total impact of the restructuring on profit and loss was CHF 2.3 million, consisting mainly of the increase of CHF 5.0 million in the provision for restructuring and the CHF 2.7 million curtailment of the defined benefit plan. As at 31 December 2017, the provision for restructuring amounted to CHF 5.0 million.
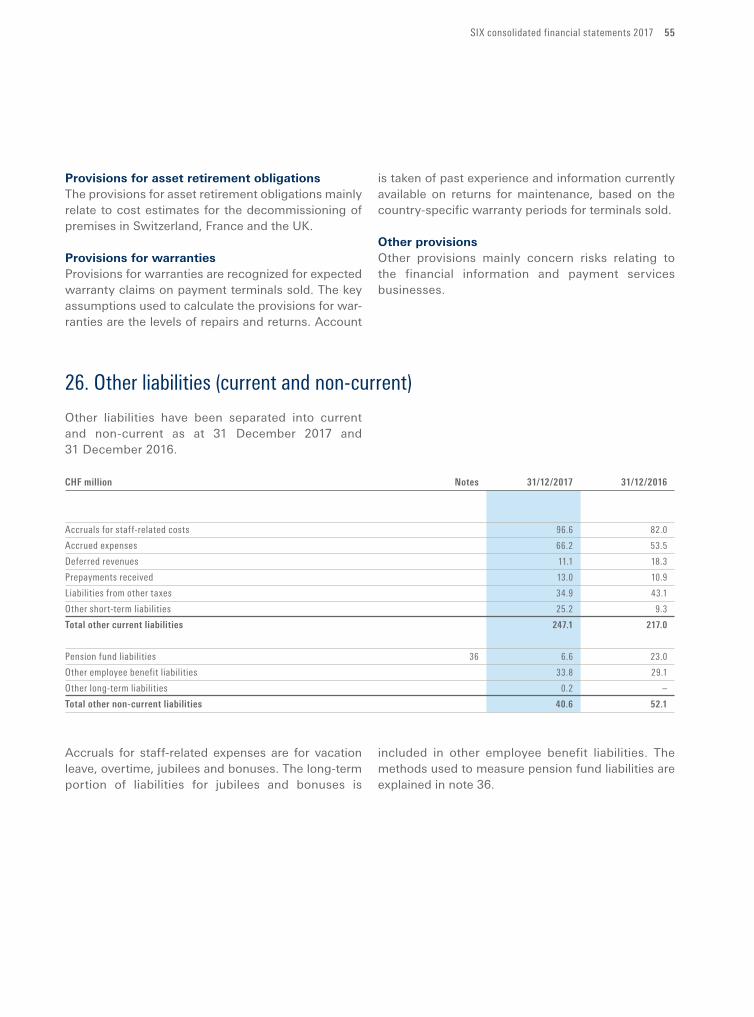
SIX consolidated financial statements 2017 55
Provisions for asset retirement obligationsThe provisions for asset retirement obligations mainly relate to cost estimates for the decommissioning of premises in Switzerland, France and the UK.
Provisions for warrantiesProvisions for warranties are recognized for expected warranty claims on payment terminals sold. The key assumptions used to calculate the provisions for warranties are the levels of repairs and returns. Account
is taken of past experience and information currently available on returns for maintenance, based on the countryspecific warranty periods for terminals sold.
Other provisionsOther provisions mainly concern risks relating to the financial information and payment services businesses.
26. Other liabilities (current and non-current)
Other liabilities have been separated into current and non-current as at 31 December 2017 and 31 Decem ber 2016.
CHFmillion Notes 31/12/2017 31/12/2016
Accruals for staff-related costs 96.6 82.0
Accrued expenses 66.2 53.5
Deferred revenues 11.1 18.3
Prepayments received 13.0 10.9
Liabilities from other taxes 34.9 43.1
Other short-term liabilities 25.2 9.3
Totalothercurrentliabilities 247.1 217.0
Pension fund liabilities 36 6.6 23.0
Other employee benefit liabilities 33.8 29.1
Other long-term liabilities 0.2 –
Totalothernon-currentliabilities 40.6 52.1
Accruals for staffrelated expenses are for vacation leave, overtime, jubilees and bonuses. The longterm portion of liabilities for jubilees and bonuses is
included in other employee benefit liabilities. The methods used to measure pension fund liabilities are explained in note 36.
56 SIX consolidated financial statements 2017
Financial instruments
27. Financial risk management
Risk governanceResponsibility for the overall risk management of SIX resides with the Board of Directors of SIX Group Ltd (BoD). The BoD defines risk appetite and tolerance, overviews the overall risk situation, approves the Group risk policy and delegates risk management tasks to the Risk Committee of the SIX Group Ltd BoD.
Supervision of risk management and assurance that SIX is managed in line with Group risk policy are the responsibility of the Risk Committee of the SIX Group Ltd BoD.
Also delegated by the BoD, responsibility for accounting, financial reporting and the internal controlling systems resides with the Audit Committee of the SIX Group Ltd BoD. External and internal auditors report to the Audit Committee of the SIX Group Ltd BoD. Internal auditors are responsible for monitoring risk management and control, in particular the risks related to business processes.
The Group Executive Board of SIX Group Ltd (GExB) is responsible for implementing risk management activities within the Group in line with Group risk policy. Defined by the Group risk policy, Groupwide risk management methodology is delegated to the Chief Risk Officer (CRO), who leads the Groupwide risk management organization. The risk management organization is set up as a ’second line of defense’ function across the organization. The CRO has oversight of the risks described below and reports the risk situation to the GExB and BoD on a quarterly basis. Within business divisions, the management committee of the division, supported by the risk management organization, is responsible for risk management performance. At SIX SIS Ltd and in SIX x-clear Ltd in particular, management of counterparty limits, margin requirements and risk model parameterization and validation are performed by the risk management organization. Groupwide balance sheet risks and Groupwide liquidity are managed by Group Treasury and division treasury functions, supervised by the Chief Financial Officer.
Credit riskGeneralCounterparty credit risk is defined as the risk of a loss caused by a counterparty not fulfilling its contractual obligations or commitments. Given the nature of its core business activities, SIX monitors the counterparty default risk for all its major riskrelated activities, which relate in particular to the following financial positions:− cash at banks and short-term deposits− trade and other receivables− receivables from clearing & settlement− investments in other financial instruments held
by SIX
Within the Securities Services business area, credit exposures mainly relate to shortterm interim financing undertaken for the purpose of settling securities transactions. Securities Services applies a strict risk and credit policy. Credit risk management is effected via limits granted to the customers by the relevant bodies within SIX, pursuant to the competency rules. Each participant with a credit limit is subject to an initial credit risk assessment and rating assignment as well as a periodic riskdriven review. No credit limits are granted without prior risk assessment and rating assignment. The credit limits are monitored constantly. Each counterparty is assigned to a risk group which defines the depth and frequency of the review. Counterparties in higherrisk groups (higher “risk equivalent”, worse credit rating) are reviewed more often and monitored more closely than those in lower-risk groups. The allocation of a counterparty to a specific risk group is determined by the risk equivalent, as an expression of the amount at risk in a default scenario, and by the creditworthiness of the counterparty, as an indication of the probability of default.
In businesses other than Securities Services, counterparty credit risk arises in particular from in vestments of the Group’s operating liquidity, which to a large extent takes the form of cash deposits with banks. As at Securities Services, such credit exposures are limited by investment limits that vary in size depending on
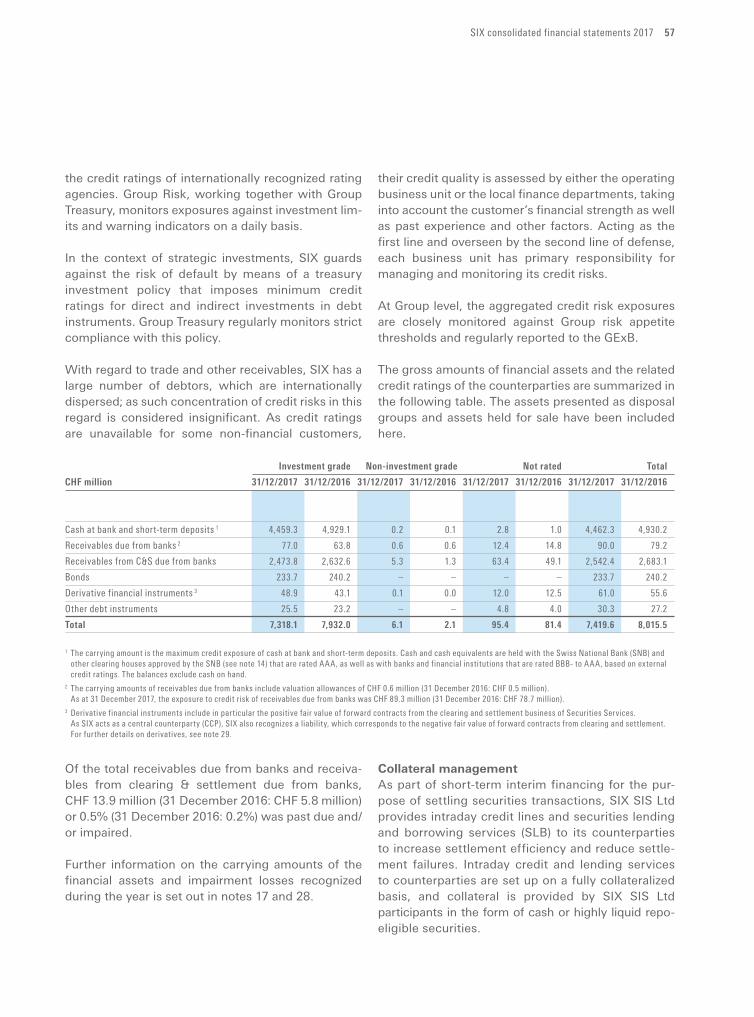
SIX consolidated financial statements 2017 57
the credit ratings of internationally recognized rating agencies. Group Risk, working together with Group Treasury, monitors exposures against investment limits and warning indicators on a daily basis.
In the context of strategic investments, SIX guards against the risk of default by means of a treasury investment policy that imposes minimum credit ratings for direct and indirect investments in debt instruments. Group Treasury regularly monitors strict compliance with this policy.
With regard to trade and other receivables, SIX has a large number of debtors, which are internationally dispersed; as such concentration of credit risks in this regard is considered insignificant. As credit ratings are unavailable for some nonfinancial customers,
their credit quality is assessed by either the operating business unit or the local finance departments, taking into account the customer’s financial strength as well as past experience and other factors. Acting as the first line and overseen by the second line of defense, each business unit has primary responsibility for managing and monitoring its credit risks.
At Group level, the aggregated credit risk exposures are closely monitored against Group risk appetite thresholds and regularly reported to the GExB.
The gross amounts of financial assets and the related credit ratings of the counterparties are summarized in the following table. The assets presented as disposal groups and assets held for sale have been included here.
Investmentgrade Non-investmentgrade Not rated Total
CHFmillion 31/12/2017 31/12/2016 31/12/2017 31/12/2016 31/12/2017 31/12/2016 31/12/2017 31/12/2016
Cash at bank and short-term deposits 1 4,459.3 4,929.1 0.2 0.1 2.8 1.0 4,462.3 4,930.2
Receivables due from banks 2 77.0 63.8 0.6 0.6 12.4 14.8 90.0 79.2
Receivables from C&S due from banks 2,473.8 2,632.6 5.3 1.3 63.4 49.1 2,542.4 2,683.1
Bonds 233.7 240.2 – – – – 233.7 240.2
Derivative financial instruments 3 48.9 43.1 0.1 0.0 12.0 12.5 61.0 55.6
Other debt instruments 25.5 23.2 – – 4.8 4.0 30.3 27.2
Total 7,318.1 7,932.0 6.1 2.1 95.4 81.4 7,419.6 8,015.5
1 The carrying amount is the maximum credit exposure of cash at bank and short-term deposits. Cash and cash equivalents are held with the Swiss National Bank (SNB) and other clearing houses approved by the SNB (see note 14) that are rated AAA, as well as with banks and financial institutions that are rated BBB- to AAA, based on external credit ratings. The balances exclude cash on hand.
2 The carrying amounts of receivables due from banks include valuation allowances of CHF 0.6 million (31 December 2016: CHF 0.5 million). As at 31 December 2017, the exposure to credit risk of receivables due from banks was CHF 89.3 million (31 December 2016: CHF 78.7 million).3 Derivative financial instruments include in particular the positive fair value of forward contracts from the clearing and settlement business of Securities Services. As SIX acts as a central counterparty (CCP), SIX also recognizes a liability, which corresponds to the negative fair value of forward contracts from clearing and settlement.
For further details on derivatives, see note 29.
Of the total receivables due from banks and receivables from clearing & settlement due from banks, CHF 13.9 million (31 December 2016: CHF 5.8 million) or 0.5% (31 December 2016: 0.2%) was past due and/or impaired.
Further information on the carrying amounts of the financial assets and impairment losses recognized during the year is set out in notes 17 and 28.
Collateral managementAs part of shortterm interim financing for the purpose of settling securities transactions, SIX SIS Ltd provides intraday credit lines and securities lending and borrowing services (SLB) to its counterparties to increase settlement efficiency and reduce settlement failures. Intraday credit and lending services to counter parties are set up on a fully collateralized basis, and collateral is provided by SIX SIS Ltd participants in the form of cash or highly liquid repo eligible securities.
58 SIX consolidated financial statements 2017
In order to protect SIX x-clear Ltd, which acts as central counterparty, against the risk of default by a clearing member before it has settled its outstanding transactions, clearing members are required under the applicable version of the clearing terms to provide collateral in the form of cash or highly liquid repo eligible securities under a fulltitle transfer regime. The margin requirement basically comprises an initial margin for possible future price fluctuations, a variation margin for actual changes in value and certain addons that are called in times of higher market volatility according to the clearing terms. In addition, all counterparties have to provide default fund contributions to cover the potential risk that is not covered by the margin model (confidence level of 99%) in the event of a member’s default. The margin model is regularly calibrated and backtested.
As at 31 December 2017, cash collateral received was CHF 3,272.9 million (31 December 2016: CHF 3,555.9 million). The fair value of the securities received as collateral which can be repledged or sold was CHF 4,993.2 million (31 December 2016: CHF 2,612.1 million), of which CHF 33.6 million (31 December 2016: CHF 2.5 million) related to SLB transactions.
Liquidity riskGeneralLiquidity risk is the risk that SIX will encounter difficulty in meeting current and future obligations associated with its financial liabilities. Specific to the Securities Services business area of SIX, liquidity risk exists mainly as a result of everyday operational flows, such as repayments of cash collateral to clearing members and provision of liquidity to facilitate settlement.
Liquidity management is governed by the treasury policy of SIX. Its main purpose is to provide subsidiaries with financial resources at any time so that they are able to meet their payment obligations. The continuous monitoring of liquidity at Group level and the allocation of resources allow Group Treasury to maintain a sound level of liquidity at all times. The liquidity status is reported on a monthly or quarterly basis to various committees. In the event of exceptional liquidity requirements, SIX can also access a portfolio of financial instruments such as equities
and bonds that can be liquidated within a reasonable time. In addition, SIX maintains credit lines with a limited number of financial institutions. For Swiss Group entities, the total amount of unused credit lines as at 31 December 2017 was CHF 175.0 million (31 Decem-ber 2016: CHF 175.0 million). There are additional credit lines with banks in Austria and Norway in the amount of CHF 140.7 million (31 December 2016: CHF 75.3 million). As at 31 December 2017, these credit facilities had not been utilized (31 Decem-ber 2016: nil). Liquidity is managed for various currencies. The main currencies are the Swiss franc, the euro, the US dollar and the pound sterling.
The Group’s operational liquidity at 31 December 2017 was CHF 4,462.6 million (31 December 2016: CHF 4,921.2 million). It is deposited with appropriate investment limits at commercial banks, the Swiss National Bank (SNB) and clearing houses approved by the SNB. Operational liquidity of the Swiss and various foreign subsidiaries, with the exception of SIX SIS Ltd and SIX x-clear Ltd, is held and managed centrally at SIX as part of a cash pool. Group Treasury is responsible for the management of the cash pool. The liquidity in excess of operational liquidity required by the subsidiaries is provided by Group Treasury to cover any short to mediumterm structural liquidity requirements. SIX has invested funds with a carrying amount of CHF 608.4 million (31 December 2016: CHF 587.3 million) using professional asset managers.
On a daytoday basis the Collateral and Liquidity Management team is tasked with ensuring that the Group can meet its financing needs at all times, in particular to ensure the business continues to operate smoothly in the event of default by a clearing member.
The liquidity managed by SIX SIS Ltd and SIX x-clear Ltd as at 31 December 2017 totaled CHF 3,803.5 million (31 December 2016: CHF 4,255.2 million). Liquidity management is one of the main operating activities in the settlement business. Liquidity risk in the Securities Services business area is managed by ensuring that the expected inflows match the expected outflows in the respective currency.
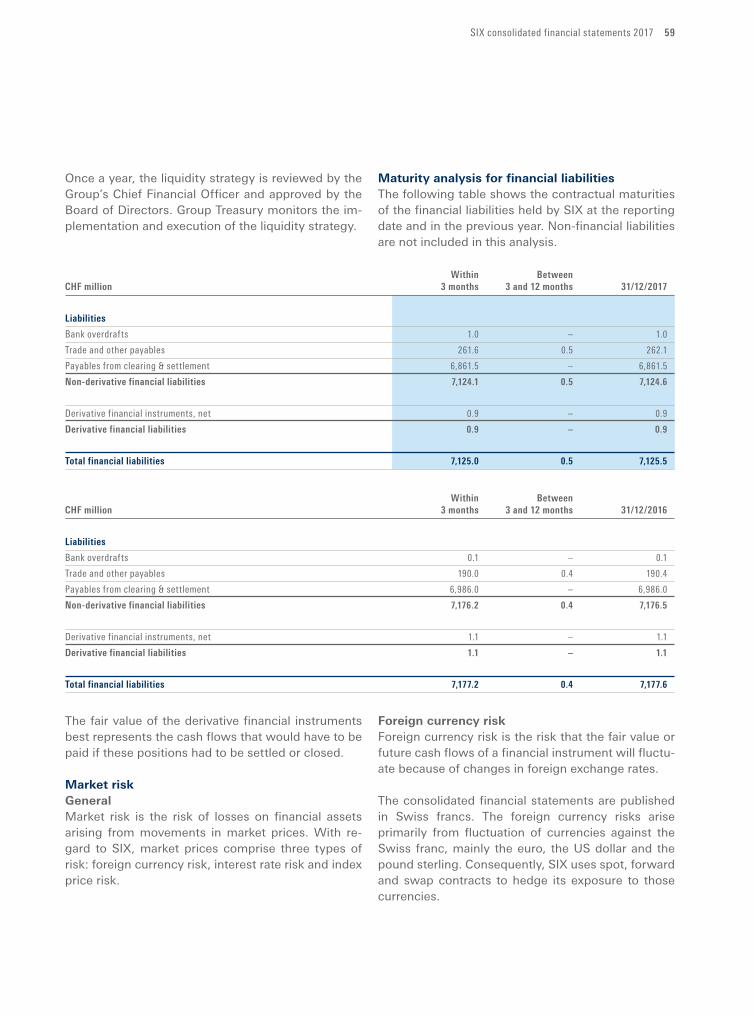
SIX consolidated financial statements 2017 59
Once a year, the liquidity strategy is reviewed by the Group’s Chief Financial Officer and approved by the Board of Directors. Group Treasury monitors the implementation and execution of the liquidity strategy.
Maturity analysis for financial liabilitiesThe following table shows the contractual maturities of the financial liabilities held by SIX at the reporting date and in the previous year. Nonfinancial liabilities are not included in this analysis.
Within Between
CHFmillion 3months 3and12months 31/12/2017
Liabilities
Bank overdrafts 1.0 – 1.0
Trade and other payables 261.6 0.5 262.1
Payables from clearing & settlement 6,861.5 – 6,861.5
Non-derivativefinancialliabilities 7,124.1 0.5 7,124.6
Derivative financial instruments, net 0.9 – 0.9
Derivativefinancialliabilities 0.9 – 0.9
Totalfinancialliabilities 7,125.0 0.5 7,125.5
Within Between
CHFmillion 3months 3and12months 31/12/2016
Liabilities
Bank overdrafts 0.1 – 0.1
Trade and other payables 190.0 0.4 190.4
Payables from clearing & settlement 6,986.0 – 6,986.0
Non-derivativefinancialliabilities 7,176.2 0.4 7,176.5
Derivative financial instruments, net 1.1 – 1.1
Derivativefinancialliabilities 1.1 – 1.1
Totalfinancialliabilities 7,177.2 0.4 7,177.6
The fair value of the derivative financial instruments best represents the cash flows that would have to be paid if these positions had to be settled or closed.
Market riskGeneralMarket risk is the risk of losses on financial assets arising from movements in market prices. With regard to SIX, market prices comprise three types of risk: foreign currency risk, interest rate risk and index price risk.
Foreign currency riskForeign currency risk is the risk that the fair value or future cash flows of a financial instrument will fluctuate because of changes in foreign exchange rates.
The consolidated financial statements are published in Swiss francs. The foreign currency risks arise primarily from fluctuation of currencies against the Swiss franc, mainly the euro, the US dollar and the pound sterling. Consequently, SIX uses spot, forward and swap contracts to hedge its exposure to those currencies.
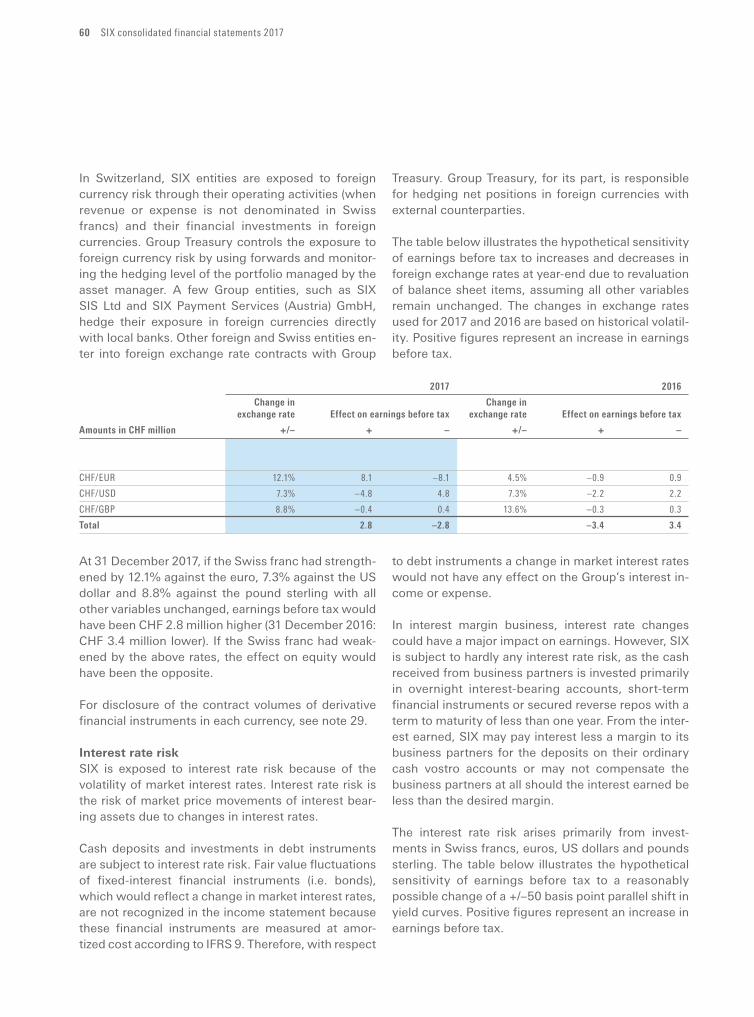
60 SIX consolidated financial statements 2017
In Switzerland, SIX entities are exposed to foreign currency risk through their operating activities (when revenue or expense is not denominated in Swiss francs) and their financial investments in foreign currencies. Group Treasury controls the exposure to foreign currency risk by using forwards and monitoring the hedging level of the portfolio managed by the asset manager. A few Group entities, such as SIX SIS Ltd and SIX Payment Services (Austria) GmbH, hedge their exposure in foreign currencies directly with local banks. Other foreign and Swiss entities enter into foreign exchange rate contracts with Group
Treasury. Group Treasury, for its part, is responsible for hedging net positions in foreign currencies with external counterparties.
The table below illustrates the hypothetical sensitivity of earnings before tax to increases and decreases in foreign exchange rates at yearend due to revaluation of balance sheet items, assuming all other variables remain unchanged. The changes in exchange rates used for 2017 and 2016 are based on historical volatility. Positive figures represent an increase in earnings before tax.
2017 2016
Changein Changein
exchangerate Effectonearningsbeforetax exchangerate Effectonearningsbeforetax
AmountsinCHFmillion +/– + – +/– + –
CHF/EUR 12.1% 8.1 –8.1 4.5% –0.9 0.9
CHF/USD 7.3% –4.8 4.8 7.3% –2.2 2.2
CHF/GBP 8.8% –0.4 0.4 13.6% –0.3 0.3
Total 2.8 –2.8 –3.4 3.4
At 31 December 2017, if the Swiss franc had strengthened by 12.1% against the euro, 7.3% against the US dollar and 8.8% against the pound sterling with all other variables unchanged, earnings before tax would have been CHF 2.8 million higher (31 December 2016: CHF 3.4 million lower). If the Swiss franc had weakened by the above rates, the effect on equity would have been the opposite.
For disclosure of the contract volumes of derivative financial instruments in each currency, see note 29.
Interest rate riskSIX is exposed to interest rate risk because of the vola tility of market interest rates. Interest rate risk is the risk of market price movements of interest bearing assets due to changes in interest rates.
Cash deposits and investments in debt instruments are subject to interest rate risk. Fair value fluctuations of fixedinterest financial instruments (i.e. bonds), which would reflect a change in market interest rates, are not recognized in the income statement because these financial instruments are measured at amortized cost according to IFRS 9. Therefore, with respect
to debt instruments a change in market interest rates would not have any effect on the Group’s interest income or expense.
In interest margin business, interest rate changes could have a major impact on earnings. However, SIX is subject to hardly any interest rate risk, as the cash received from business partners is invested primarily in overnight interestbearing accounts, shortterm financial instruments or secured reverse repos with a term to maturity of less than one year. From the interest earned, SIX may pay interest less a margin to its business partners for the deposits on their ordinary cash vostro accounts or may not compensate the business partners at all should the interest earned be less than the desired margin.
The interest rate risk arises primarily from investments in Swiss francs, euros, US dollars and pounds sterling. The table below illustrates the hypothetical sensitivity of earnings before tax to a reasonably possible change of a +/–50 basis point parallel shift in yield curves. Positive figures represent an increase in earnings before tax.
SIX consolidated financial statements 2017 61
2017 2016
Changein Changein
interest rate Effectonearningsbeforetax interest rate Effectonearningsbeforetax
AmountsinCHFmillion +/– + – +/– + –
CHF 50 bps 4.5 –4.5 50 bps 1.4 –1.4
EUR 50 bps 2.1 –0.9 50 bps 1.1 –
USD 50 bps 5.4 –5.4 50 bps 7.0 –7.0
GBP 50 bps 0.2 –0.2 50 bps – –
Total 12.2 –11.0 9.5 –8.4
According to the simulation, with a 50 bps rise in interest rates in each currency, earnings before tax would have been CHF 12.2 million higher (31 De-cember 2016: CHF 9.5 million higher). With a 50 bps drop in interest rates, earnings before tax would have been CHF 11.0 mil lion lower (31 December 2016: CHF 8.4 million lower).
Index price riskIndex price risk at SIX is the risk of loss resulting from declining equity and bonds indices or fair values of individual instruments.
SIX holds equity instruments (e.g. direct investments in shares and units in investment funds) and bond funds for liquidity reasons. These instruments are measured at fair value through profit or loss. Fluctuations in individual prices or indices therefore have a direct impact on earnings before tax.
The investment policy of SIX establishes limits on the level of risk in the invested portfolio. Investment
limits help the professional external asset managers to ensure that the investment portfolio is sufficiently diversified and that it remains exposed to an acceptable level of risk. The performance of the portfolio is compared with the defined benchmarks.
SIX makes direct investments in unlisted companies to a much lesser extent. The fair value of these equity investments tends to be dominated by factors specific to the company invested in. For this reason, SIX does not include these investments in the sensitivity analysis. Additionally, debt instruments classified as measured at amortized cost are not included in the sensitivity analysis, as fluctuations in prices have no direct impact on earnings before tax.
The table below illustrates the hypothetical sensitivity of earnings before tax to increases and decreases in the respective indices, assuming all other variables remain unchanged. The sensitivity rate is based on historical volatility using the yearly standard deviation.
2017 2016
Changeinindex Effectonearningsbeforetax Changeinindex Effectonearningsbeforetax
AmountsinCHFmillion +/– + – +/– + –
Index
SPI® 7.3% 10.3 –10.3 10.9% 10.2 –10.2
SBI® 2.3% 6.0 –6.0 3.3% 8.5 –8.5
SXI® 6.1% 4.1 –4.1 4.5% 2.9 –2.9
Total 20.4 –20.4 21.7 –21.7
If the increases in the three indices had been reflected in a change in the financial instruments classified as FVtPL held as at 31 December 2017, earnings before
tax would have been CHF 20.4 million higher (31 De-cember 2016: CHF 21.7 million higher). If the indices had fallen, the effect would have been the opposite.
62 SIX consolidated financial statements 2017
28. Fair value of financial instruments
Fair value of financial instrumentsThe table below shows the estimated fair values of financial instruments together with the carrying amounts at the reporting date. The valuation methods and assumptions applied to determine the fair values are explained further below.
31/12/2017 31/12/2016
Carrying Carrying
CHFmillion amount Fairvalue Deviation amount Fairvalue Deviation
Assets
Equity instruments at FVtPL 44.5 44.5 – 34.0 34.0 –
Units in investment funds at FVtPL 1 416.6 416.6 – 409.0 409.0 –
Financial instruments from settlement business 2 198.9 198.9 – 101.0 101.0 –
Derivative financial instruments at FVtPL 61.0 61.0 – 55.6 55.6 –
Debt instruments at FVtPL 29.9 29.9 – 19.6 19.6 4 –
Financialassetsatfairvalue 750.8 750.8 – 619.4 619.4 –
Cash and cash equivalents 4,462.6 4,462.6 – 4,921.2 4,921.2 –
Trade and other receivables 263.4 263.4 – 213.6 213.6 –
Receivables from clearing & settlement 3,566.9 3,566.9 – 3,326.4 3,326.4 –
Bonds 3 233.7 235.2 1.5 240.2 242.5 2.3
Other debt instruments 30.3 30.3 – 13.3 13.3 –
Financialassetsatamortizedcost 8,556.9 8,558.4 1.5 8,714.6 8,716.9 2.3
Total financial assets 9,307.8 9,309.3 1.5 9,334.0 9,336.3 2.3
of which current 9,047.7 9,149.3
of which non-current 260.1 184.7
Liabilities
Derivative financial instruments at FVtPL 61.9 61.9 – 56.7 56.7 –
Other financial liabilities at FVtPL 7.0 7.0 – – –
Financialliabilitiesatfairvalue 68.9 68.9 – 56.7 56.7 –
Bank overdrafts 1.0 1.0 – 0.1 0.1 –
Trade and other payables 262.1 262.1 – 190.4 190.4 –
Payables from clearing & settlement 6,861.5 6,861.5 – 6,986.0 6,986.0 –
Financialliabilitiesatamortizedcost 7,124.6 7,124.6 – 7,176.5 7,176.5 –
Totalfinancialliabilities 7,193.5 7,193.5 – 7,233.3 7,233.3 –
of which current 7,193.5 7,233.3
of which non-current – –
1 SIX holds certain investments in equity funds, fixed income funds, money market funds, real estate funds and funds of hedge funds denominated in foreign currencies, with the aim of diversifying its investments and taking advantage of foreign markets’ performance.2 These financial instruments represent quoted equity instruments that SIX acquires as a result of failure by a counterparty to deliver its side of a transaction.3 Bonds mainly include government and corporate bonds as well as European medium term notes (EMTNs) denominated in CHF, EUR, USD and NOK. According to the internal investment strategy, the requirements regarding counterparty creditworthiness are based on a minimum rating of A (Standard & Poor’s) or A2 (Moody’s).4 Including CHF 16.5 million reclassified from equity instruments at FVtOCI due to debt classification following re-evaluation of certain contractual features of a financial
instrument.
SIX consolidated financial statements 2017 63
Valuation methods for financial assets and liabilitiesThe table below analyzes recurring fair value measurements for financial assets and liabilities. These fair value measurements are assigned to the different levels of the fair value hierarchy. These levels are defined as follows:− Level 1: The fair value of listed financial
instruments with a price established in an active market is determined on the basis of current quoted market prices.
− Level 2: Valuation methods are used to determine the fair value of financial instruments if no direct market prices are available. The underlying assump tions are based on observable market data, either directly or indirectly, as at the reporting date.
− Level 3: If neither current market prices nor valuation methods based on observable market data can be drawn on for the purpose of determining fair value, then valuation methods are based on unobservable market data. Those inputs reflect the assumptions that market participants would use when pricing the asset or liability, including assumptions about risk.
The following methods and assumptions were used to estimate the fair values:− For cash and cash equivalents including bank
overdrafts, trade and other receivables, receivables and payables from clearing & settlement, trade and other payables, and shortterm loans and borrowings, it is assumed that the carrying amount corresponds to their fair value.
− The fair value of quoted equity and debt instruments (e.g. bonds) and of units in investment funds is determined by reference to published price quotations at the reporting date. The valuation of financial assets from settlement business held at fair value through profit or loss is performed with reference to quoted prices from the markets to which they relate. Such financial assets therefore fall under level 1 of the fair value hierarchy.
− For equity instruments that are not traded but for which a sales transaction has been announced and either an indicative or final sales price is available (e.g. sales price in a purchase agreement), the fair value is measured based on the expected cash flows from the sale considering the risks and
uncertainties until the closing of the transaction. These equity instruments are assigned to level 3 of the fair value hierarchy. An increase or decrease of 10% in the estimated cash flows would lead to an increase or decrease of approximately 10% in the fair value of the financial asset.
− For preferred shares classified as debt instruments that are limited in trans ferability until conversion into tradable equity securities, the fair value is measured based on the current quoted market price of the tradable equity securities adjusted by a variable discount percentage considering the timing and risks until con version. These equity instruments are assigned to level 3 of the fair value hierarchy. An increase or decrease of 10% in the quoted market price of the tradable securities would lead to an increase or decrease of approximately 10% in the fair value of the financial asset.
− For other debt instruments measured at FVtPL and liabilities from contingent considerations, the fair value is determined by discounting the expected future payments at a riskadjusted discount rate. As the input factors are not readily available in the market, these instruments are assigned to level 3 of the fair value hierarchy. An increase or decrease of 10% in the estimated cash flows would lead to an increase or decrease of approximately 10% in the fair value. The estimated fair value would increase if the riskadjusted discount rate were lower.
− Foreign exchange swaps and forwards are not traded publicly. The inputs into the calculation include foreign exchange spot rates, interest rates and foreign exchange volatility. In general, these inputs are readily observable in the markets or provided by consensus data providers. Thus, foreign exchange swaps, forwards and other foreign exchange derivatives are categorized as level 2 instruments.
− For forward contracts from the clearing and settlement business as CCP, the fair value is determined as the difference between the fair value of the underlying instrument at the trade date and its fair value at the reporting date. With the exception of forward contracts from the clearing and settlement of options, all other forward contracts from clearing and settlement are assigned to level 2 of the fair value hierarchy, as the inputs used are readily available in the market.
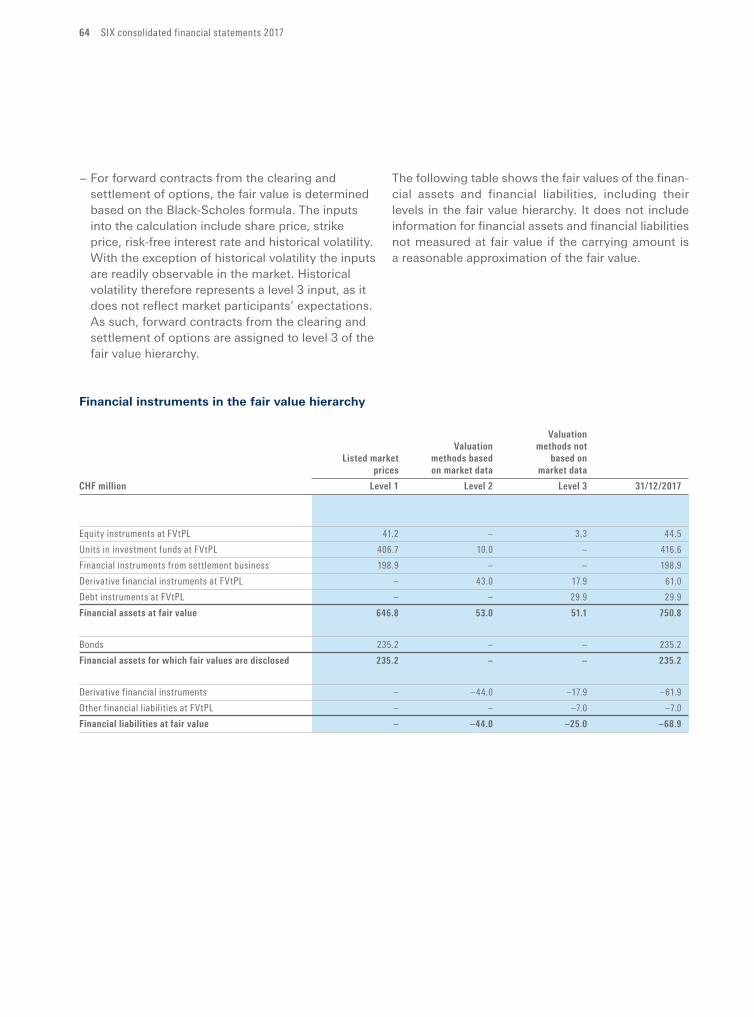
64 SIX consolidated financial statements 2017
− For forward contracts from the clearing and settlement of options, the fair value is determined based on the BlackScholes formula. The inputs into the calculation include share price, strike price, riskfree interest rate and historical volatility. With the exception of historical volatility the inputs are readily observable in the market. Historical volatility therefore represents a level 3 input, as it does not reflect market participants’ expectations. As such, forward contracts from the clearing and settlement of options are assigned to level 3 of the fair value hierarchy.
The following table shows the fair values of the financial assets and financial liabilities, including their levels in the fair value hierarchy. It does not include information for financial assets and financial liabilities not measured at fair value if the carrying amount is a reasonable approximation of the fair value.
Financial instruments in the fair value hierarchy
Valuation
Valuation methodsnot
Listedmarket methodsbased basedon
prices onmarketdata marketdata
CHFmillion Level1 Level2 Level3 31/12/2017
Equity instruments at FVtPL 41.2 – 3.3 44.5
Units in investment funds at FVtPL 406.7 10.0 – 416.6
Financial instruments from settlement business 198.9 – – 198.9
Derivative financial instruments at FVtPL – 43.0 17.9 61.0
Debt instruments at FVtPL – – 29.9 29.9
Financialassetsatfairvalue 646.8 53.0 51.1 750.8
Bonds 235.2 – – 235.2
Financialassetsforwhichfairvaluesaredisclosed 235.2 – – 235.2
Derivative financial instruments – –44.0 –17.9 –61.9
Other financial liabilities at FVtPL – – –7.0 –7.0
Financialliabilitiesatfairvalue – –44.0 –25.0 –68.9
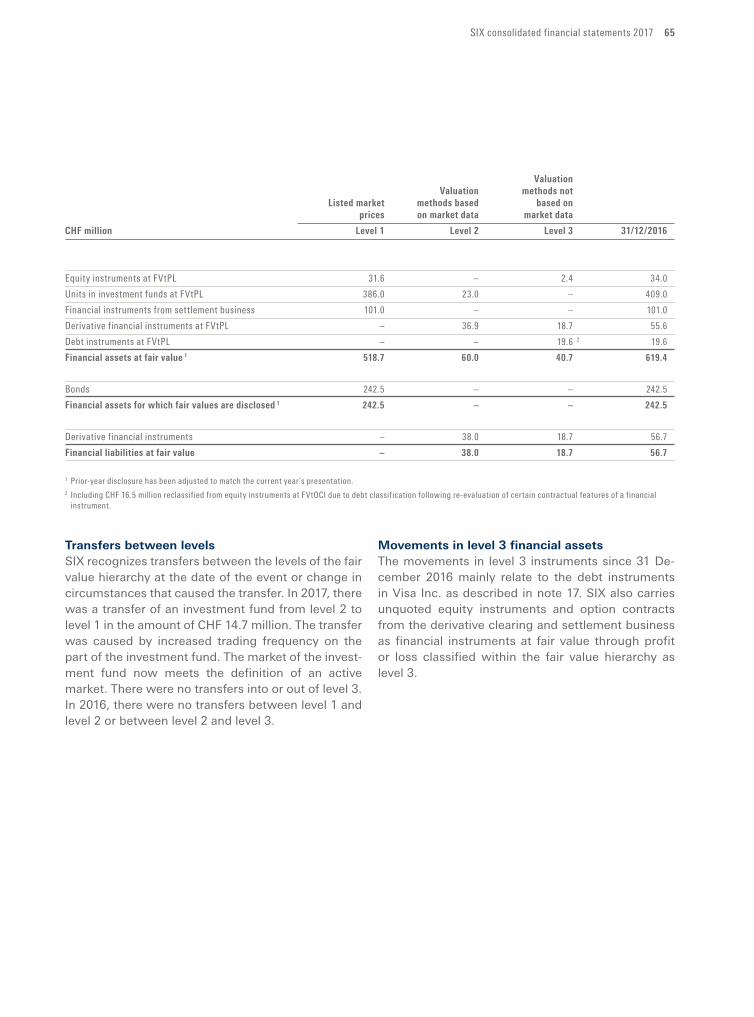
SIX consolidated financial statements 2017 65
Valuation
Valuation methodsnot
Listedmarket methodsbased basedon
prices onmarketdata marketdata
CHFmillion Level1 Level2 Level3 31/12/2016
Equity instruments at FVtPL 31.6 – 2.4 34.0
Units in investment funds at FVtPL 386.0 23.0 – 409.0
Financial instruments from settlement business 101.0 – – 101.0
Derivative financial instruments at FVtPL – 36.9 18.7 55.6
Debt instruments at FVtPL – – 19.6 2 19.6
Financialassetsatfairvalue 1 518.7 60.0 40.7 619.4
Bonds 242.5 – – 242.5
Financialassetsforwhichfairvaluesaredisclosed 1 242.5 – – 242.5
Derivative financial instruments – 38.0 18.7 56.7
Financialliabilitiesatfairvalue – 38.0 18.7 56.7
1 Prior-year disclosure has been adjusted to match the current year’s presentation.2 Including CHF 16.5 million reclassified from equity instruments at FVtOCI due to debt classification following re-evaluation of certain contractual features of a financial
instrument.
Transfers between levelsSIX recognizes transfers between the levels of the fair value hierarchy at the date of the event or change in circumstances that caused the transfer. In 2017, there was a transfer of an investment fund from level 2 to level 1 in the amount of CHF 14.7 million. The transfer was caused by increased trading frequency on the part of the investment fund. The market of the investment fund now meets the definition of an active market. There were no transfers into or out of level 3. In 2016, there were no transfers between level 1 and level 2 or between level 2 and level 3.
Movements in level 3 financial assetsThe movements in level 3 instruments since 31 De-cember 2016 mainly relate to the debt instruments in Visa Inc. as described in note 17. SIX also carries unquoted equity instruments and option contracts from the derivative clearing and settlement business as financial instruments at fair value through profit or loss classified within the fair value hierarchy as level 3.
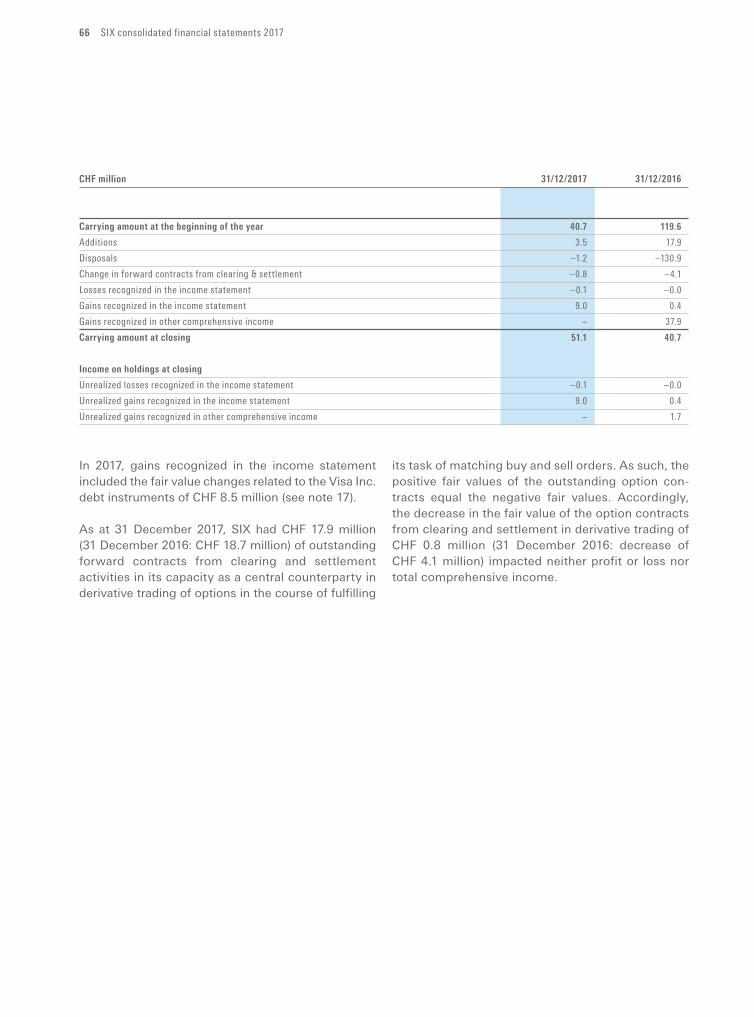
66 SIX consolidated financial statements 2017
CHFmillion 31/12/2017 31/12/2016
Carryingamountatthebeginningoftheyear 40.7 119.6
Additions 3.5 17.9
Disposals –1.2 –130.9
Change in forward contracts from clearing & settlement –0.8 –4.1
Losses recognized in the income statement –0.1 –0.0
Gains recognized in the income statement 9.0 0.4
Gains recognized in other comprehensive income – 37.9
Carryingamountatclosing 51.1 40.7
Incomeonholdingsatclosing
Unrealized losses recognized in the income statement –0.1 –0.0
Unrealized gains recognized in the income statement 9.0 0.4
Unrealized gains recognized in other comprehensive income – 1.7
In 2017, gains recognized in the income statement included the fair value changes related to the Visa Inc. debt instruments of CHF 8.5 million (see note 17).
As at 31 December 2017, SIX had CHF 17.9 million (31 December 2016: CHF 18.7 million) of outstanding forward contracts from clearing and settlement activities in its capacity as a central counterparty in derivative trading of options in the course of fulfilling
its task of matching buy and sell orders. As such, the positive fair values of the outstanding option contracts equal the negative fair values. Accordingly, the decrease in the fair value of the option contracts from clearing and settlement in derivative trading of CHF 0.8 million (31 December 2016: decrease of CHF 4.1 million) impacted neither profit or loss nor total comprehensive income.
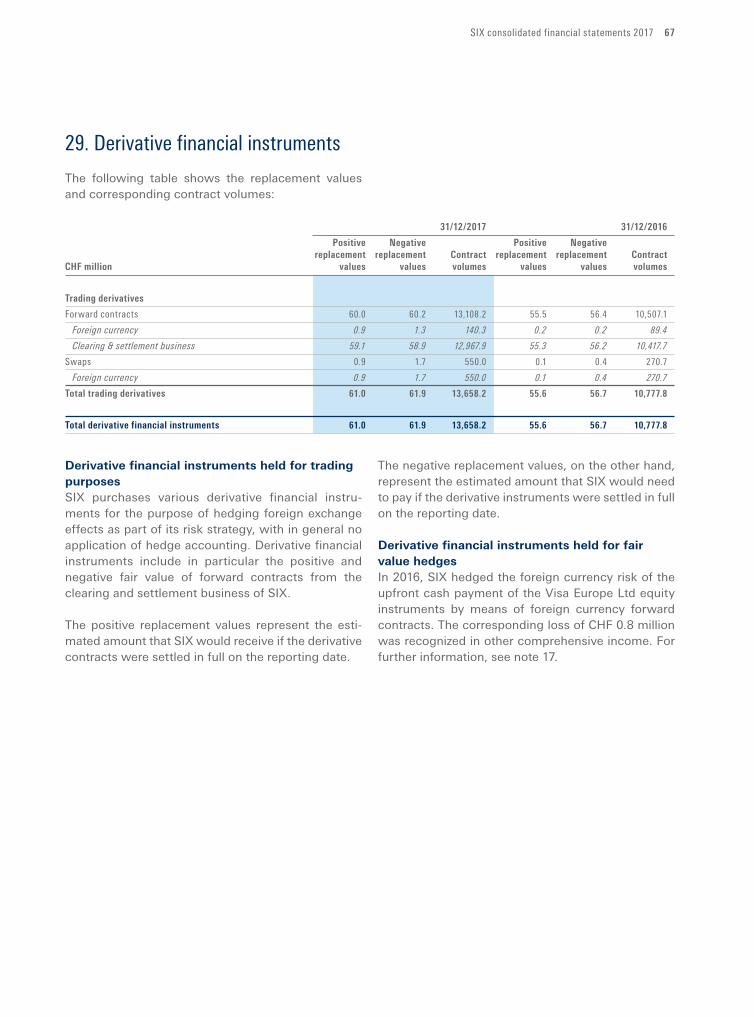
SIX consolidated financial statements 2017 67
29. Derivative financial instruments
The following table shows the replacement values and corresponding contract volumes:
31/12/2017 31/12/2016
Positive Negative Positive Negative
replacement replacement Contract replacement replacement Contract
CHFmillion values values volumes values values volumes
Tradingderivatives
Forward contracts 60.0 60.2 13,108.2 55.5 56.4 10,507.1
Foreign currency 0.9 1.3 140.3 0.2 0.2 89.4
Clearing & settlement business 59.1 58.9 12,967.9 55.3 56.2 10,417.7
Swaps 0.9 1.7 550.0 0.1 0.4 270.7
Foreign currency 0.9 1.7 550.0 0.1 0.4 270.7
Totaltradingderivatives 61.0 61.9 13,658.2 55.6 56.7 10,777.8
Totalderivativefinancialinstruments 61.0 61.9 13,658.2 55.6 56.7 10,777.8
Derivative financial instruments held for trading purposesSIX purchases various derivative financial instruments for the purpose of hedging foreign exchange effects as part of its risk strategy, with in general no application of hedge accounting. Derivative financial instruments include in particular the positive and negative fair value of forward contracts from the clearing and settlement business of SIX.
The positive replacement values represent the estimated amount that SIX would receive if the derivative contracts were settled in full on the reporting date.
The negative replacement values, on the other hand, represent the estimated amount that SIX would need to pay if the derivative instruments were settled in full on the reporting date.
Derivative financial instruments held for fair value hedgesIn 2016, SIX hedged the foreign currency risk of the upfront cash payment of the Visa Europe Ltd equity instruments by means of foreign currency forward contracts. The corresponding loss of CHF 0.8 million was recognized in other comprehensive income. For further information, see note 17.
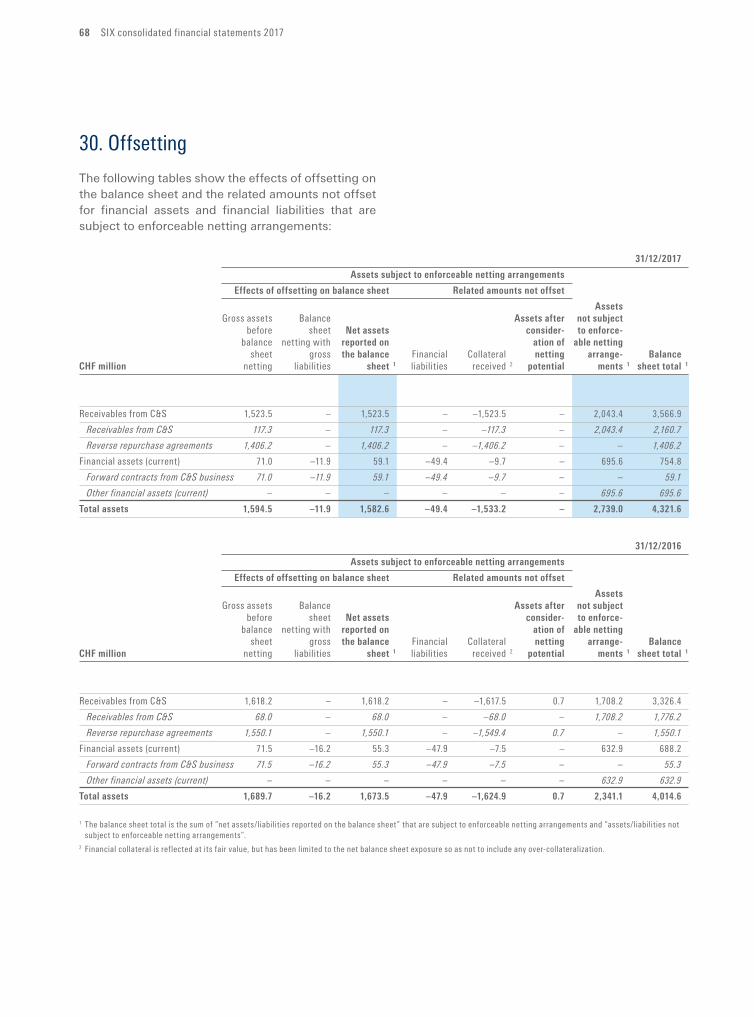
68 SIX consolidated financial statements 2017
30. Offsetting
The following tables show the effects of offsetting on the balance sheet and the related amounts not offset for financial assets and financial liabilities that are subject to enforceable netting arrangements:
31/12/2017
Assetssubjecttoenforceablenettingarrangements
Effectsofoffsettingonbalancesheet Relatedamountsnotoffset
Assets
Gross assets Balance Assetsafter notsubject
before sheet Net assets consider- to enforce-
balance netting with reported on ation of ablenetting
sheet gross thebalance Financial Collateral netting arrange- Balance
CHFmillion netting liabilities sheet 1 liabilities received 2 potential ments 1 sheettotal 1
Receivables from C&S 1,523.5 – 1,523.5 – –1,523.5 – 2,043.4 3,566.9
Receivables from C&S 117.3 – 117.3 – –117.3 – 2,043.4 2,160.7
Reverse repurchase agreements 1,406.2 – 1,406.2 – –1,406.2 – – 1,406.2
Financial assets (current) 71.0 –11.9 59.1 –49.4 –9.7 – 695.6 754.8
Forward contracts from C&S business 71.0 –11.9 59.1 –49.4 –9.7 – – 59.1
Other financial assets (current) – – – – – – 695.6 695.6
Total assets 1,594.5 –11.9 1,582.6 –49.4 –1,533.2 – 2,739.0 4,321.6
31/12/2016
Assetssubjecttoenforceablenettingarrangements
Effectsofoffsettingonbalancesheet Relatedamountsnotoffset
Assets
Gross assets Balance Assetsafter notsubject
before sheet Net assets consider- to enforce-
balance netting with reported on ation of ablenetting
sheet gross thebalance Financial Collateral netting arrange- Balance
CHFmillion netting liabilities sheet 1 liabilities received 2 potential ments 1 sheettotal 1
Receivables from C&S 1,618.2 – 1,618.2 – –1,617.5 0.7 1,708.2 3,326.4
Receivables from C&S 68.0 – 68.0 – –68.0 – 1,708.2 1,776.2
Reverse repurchase agreements 1,550.1 – 1,550.1 – –1,549.4 0.7 – 1,550.1
Financial assets (current) 71.5 –16.2 55.3 –47.9 –7.5 – 632.9 688.2
Forward contracts from C&S business 71.5 –16.2 55.3 –47.9 –7.5 – – 55.3
Other financial assets (current) – – – – – – 632.9 632.9
Total assets 1,689.7 –16.2 1,673.5 –47.9 –1,624.9 0.7 2,341.1 4,014.6
1 The balance sheet total is the sum of “net assets/liabilities reported on the balance sheet” that are subject to enforceable netting arrangements and “assets/liabilities not subject to enforceable netting arrangements”.
2 Financial collateral is reflected at its fair value, but has been limited to the net balance sheet exposure so as not to include any over-collateralization.
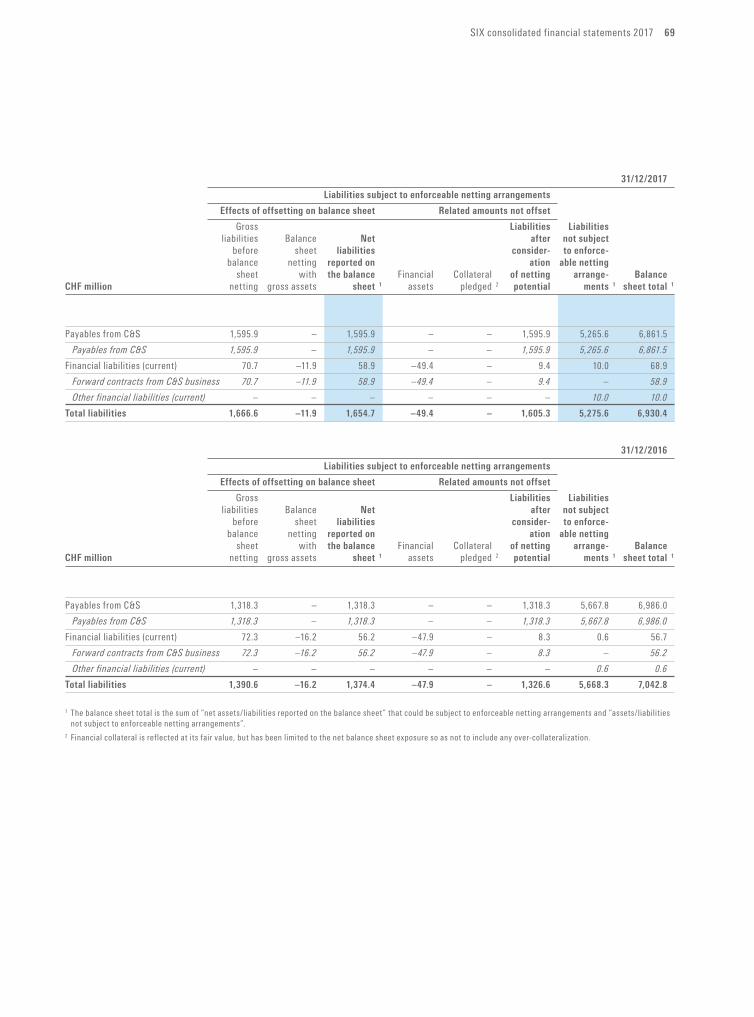
SIX consolidated financial statements 2017 69
31/12/2017
Liabilitiessubjecttoenforceablenettingarrangements
Effectsofoffsettingonbalancesheet Relatedamountsnotoffset
Gross Liabilities Liabilities
liabilities Balance Net after notsubject
before sheet liabilities consider- to enforce-
balance netting reported on ation ablenetting
sheet with thebalance Financial Collateral of netting arrange- Balance
CHFmillion netting gross assets sheet 1 assets pledged 2 potential ments 1 sheettotal 1
Payables from C&S 1,595.9 – 1,595.9 – – 1,595.9 5,265.6 6,861.5
Payables from C&S 1,595.9 – 1,595.9 – – 1,595.9 5,265.6 6,861.5
Financial liabilities (current) 70.7 –11.9 58.9 –49.4 – 9.4 10.0 68.9
Forward contracts from C&S business 70.7 –11.9 58.9 –49.4 – 9.4 – 58.9
Other financial liabilities (current) – – – – – – 10.0 10.0
Totalliabilities 1,666.6 –11.9 1,654.7 –49.4 – 1,605.3 5,275.6 6,930.4
31/12/2016
Liabilitiessubjecttoenforceablenettingarrangements
Effectsofoffsettingonbalancesheet Relatedamountsnotoffset
Gross Liabilities Liabilities
liabilities Balance Net after notsubject
before sheet liabilities consider- to enforce-
balance netting reported on ation ablenetting
sheet with thebalance Financial Collateral of netting arrange- Balance
CHFmillion netting gross assets sheet 1 assets pledged 2 potential ments 1 sheettotal 1
Payables from C&S 1,318.3 – 1,318.3 – – 1,318.3 5,667.8 6,986.0
Payables from C&S 1,318.3 – 1,318.3 – – 1,318.3 5,667.8 6,986.0
Financial liabilities (current) 72.3 –16.2 56.2 –47.9 – 8.3 0.6 56.7
Forward contracts from C&S business 72.3 –16.2 56.2 –47.9 – 8.3 – 56.2
Other financial liabilities (current) – – – – – – 0.6 0.6
Totalliabilities 1,390.6 –16.2 1,374.4 –47.9 – 1,326.6 5,668.3 7,042.8
1 The balance sheet total is the sum of “net assets/liabilities reported on the balance sheet” that could be subject to enforceable netting arrangements and “assets/liabilities not subject to enforceable netting arrangements”.
2 Financial collateral is reflected at its fair value, but has been limited to the net balance sheet exposure so as not to include any over-collateralization.
70 SIX consolidated financial statements 2017
Related amounts offsetForward contracts from clearing & settlement business are subject to the netting conditions as defined in the Clearing Rules of SIX x-clear Ltd. Open positions are settled net and offset to the extent that netting is permitted, which requires that the amounts relate to the same clearing representative, the same derivative series and the same maturity date.
Related amounts not offsetPositive/negative replacement values (RPVs) of derivatives and receivables/payables from clearing & settlementThese receivables and payables are subject to setoff under netting agreements, such as the General Terms and Conditions of Business for Clearing of Trading Platform Transactions. The netting agreements stipulate that closeout netting applies across all outstanding transactions with the same clearing member if a default event or other predetermined event occurs. Such arrangements, however, do not provide a legally enforceable right in the normal course of business.
SIX x-clear Ltd acts as central counterparty for securities trading. If one counterparty (buyer or seller) fails, it is exposed to the price fluctuation of the securities,
as the remaining late leg is not offset by the settled leg. To cover this risk, SIX x-clear Ltd obtains collateral to cover the net exposure. The collateral can be realized in a default event or if another predetermined event occurs.
Repurchase agreements and reverse repurchase agreementsReceivables and payables related to repurchase and reverse repurchase agreements are subject to setoff under netting agreements, such as the Swiss Master Agreement for Repo Trades and/or Global Master Repurchase Agreement. These agreements stipulate that all outstanding transactions with the same counterparty can be offset, and closeout netting applies across all outstanding transactions covered by the agreements if a default event or other predetermined event occurs. Such arrangements, however, do not provide a legally enforceable right in the normal course of business.
Financial collateral typically comprises highly liquid securities and can be liquidated in the event of counterparty default.
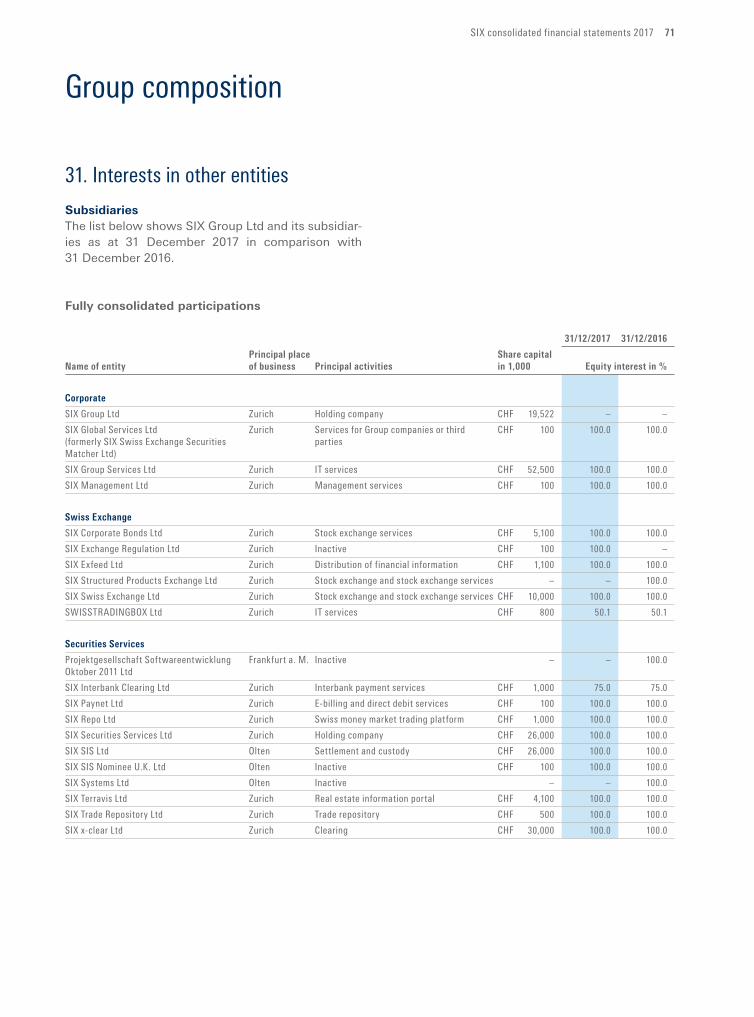
SIX consolidated financial statements 2017 71
Group composition
31. Interests in other entities
SubsidiariesThe list below shows SIX Group Ltd and its subsidiaries as at 31 December 2017 in comparison with 31 December 2016.
Fully consolidated participations
31/12/2017 31/12/2016
Principalplace Sharecapital
Nameofentity ofbusiness Principalactivities in1,000 Equityinterestin%
Corporate
SIX Group Ltd Zurich Holding company CHF 19,522 – –
SIX Global Services Ltd Zurich Services for Group companies or third CHF 100 100.0 100.0
(formerly SIX Swiss Exchange Securities parties
Matcher Ltd)
SIX Group Services Ltd Zurich IT services CHF 52,500 100.0 100.0
SIX Management Ltd Zurich Management services CHF 100 100.0 100.0
SwissExchange
SIX Corporate Bonds Ltd Zurich Stock exchange services CHF 5,100 100.0 100.0
SIX Exchange Regulation Ltd Zurich Inactive CHF 100 100.0 –
SIX Exfeed Ltd Zurich Distribution of financial information CHF 1,100 100.0 100.0
SIX Structured Products Exchange Ltd Zurich Stock exchange and stock exchange services – – 100.0
SIX Swiss Exchange Ltd Zurich Stock exchange and stock exchange services CHF 10,000 100.0 100.0
SWISSTRADINGBOX Ltd Zurich IT services CHF 800 50.1 50.1
SecuritiesServices
Projektgesellschaft Softwareentwicklung Frankfurt a. M. Inactive – – 100.0
Oktober 2011 Ltd
SIX Interbank Clearing Ltd Zurich Interbank payment services CHF 1,000 75.0 75.0
SIX Paynet Ltd Zurich E-billing and direct debit services CHF 100 100.0 100.0
SIX Repo Ltd Zurich Swiss money market trading platform CHF 1,000 100.0 100.0
SIX Securities Services Ltd Zurich Holding company CHF 26,000 100.0 100.0
SIX SIS Ltd Olten Settlement and custody CHF 26,000 100.0 100.0
SIX SIS Nominee U.K. Ltd Olten Inactive CHF 100 100.0 100.0
SIX Systems Ltd Olten Inactive – – 100.0
SIX Terravis Ltd Zurich Real estate information portal CHF 4,100 100.0 100.0
SIX Trade Repository Ltd Zurich Trade repository CHF 500 100.0 100.0
SIX x-clear Ltd Zurich Clearing CHF 30,000 100.0 100.0
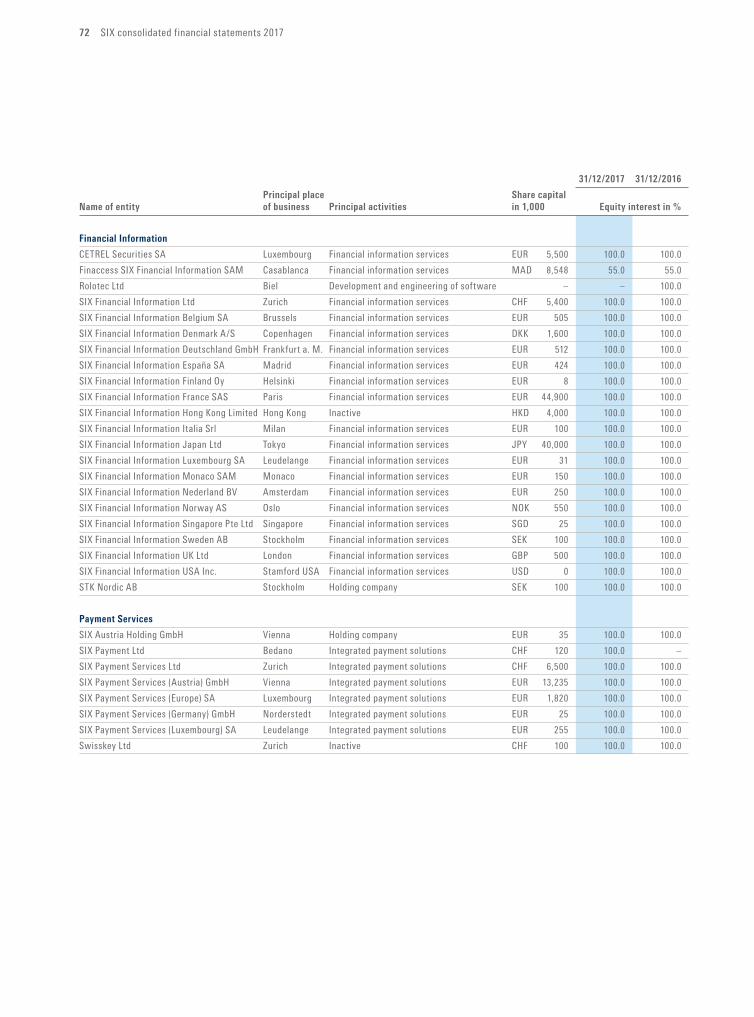
72 SIX consolidated financial statements 2017
31/12/2017 31/12/2016
Principalplace Sharecapital
Nameofentity ofbusiness Principalactivities in1,000 Equityinterestin%
FinancialInformation
CETREL Securities SA Luxembourg Financial information services EUR 5,500 100.0 100.0
Finaccess SIX Financial Information SAM Casablanca Financial information services MAD 8,548 55.0 55.0
Rolotec Ltd Biel Development and engineering of software – – 100.0
SIX Financial Information Ltd Zurich Financial information services CHF 5,400 100.0 100.0
SIX Financial Information Belgium SA Brussels Financial information services EUR 505 100.0 100.0
SIX Financial Information Denmark A/S Copenhagen Financial information services DKK 1,600 100.0 100.0
SIX Financial Information Deutschland GmbH Frankfurt a. M. Financial information services EUR 512 100.0 100.0
SIX Financial Information España SA Madrid Financial information services EUR 424 100.0 100.0
SIX Financial Information Finland Oy Helsinki Financial information services EUR 8 100.0 100.0
SIX Financial Information France SAS Paris Financial information services EUR 44,900 100.0 100.0
SIX Financial Information Hong Kong Limited Hong Kong Inactive HKD 4,000 100.0 100.0
SIX Financial Information Italia Srl Milan Financial information services EUR 100 100.0 100.0
SIX Financial Information Japan Ltd Tokyo Financial information services JPY 40,000 100.0 100.0
SIX Financial Information Luxembourg SA Leudelange Financial information services EUR 31 100.0 100.0
SIX Financial Information Monaco SAM Monaco Financial information services EUR 150 100.0 100.0
SIX Financial Information Nederland BV Amsterdam Financial information services EUR 250 100.0 100.0
SIX Financial Information Norway AS Oslo Financial information services NOK 550 100.0 100.0
SIX Financial Information Singapore Pte Ltd Singapore Financial information services SGD 25 100.0 100.0
SIX Financial Information Sweden AB Stockholm Financial information services SEK 100 100.0 100.0
SIX Financial Information UK Ltd London Financial information services GBP 500 100.0 100.0
SIX Financial Information USA Inc. Stamford USA Financial information services USD 0 100.0 100.0
STK Nordic AB Stockholm Holding company SEK 100 100.0 100.0
PaymentServices
SIX Austria Holding GmbH Vienna Holding company EUR 35 100.0 100.0
SIX Payment Ltd Bedano Integrated payment solutions CHF 120 100.0 –
SIX Payment Services Ltd Zurich Integrated payment solutions CHF 6,500 100.0 100.0
SIX Payment Services (Austria) GmbH Vienna Integrated payment solutions EUR 13,235 100.0 100.0
SIX Payment Services (Europe) SA Luxembourg Integrated payment solutions EUR 1,820 100.0 100.0
SIX Payment Services (Germany) GmbH Norderstedt Integrated payment solutions EUR 25 100.0 100.0
SIX Payment Services (Luxembourg) SA Leudelange Integrated payment solutions EUR 255 100.0 100.0
Swisskey Ltd Zurich Inactive CHF 100 100.0 100.0
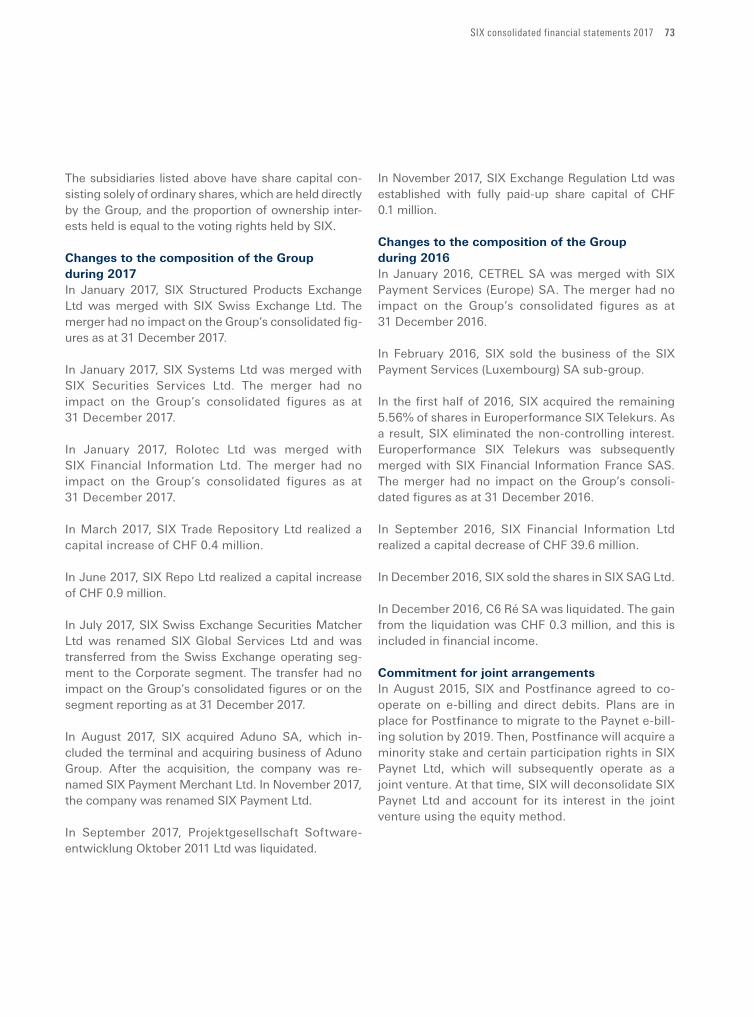
SIX consolidated financial statements 2017 73
The subsidiaries listed above have share capital consisting solely of ordinary shares, which are held directly by the Group, and the proportion of ownership interests held is equal to the voting rights held by SIX.
Changes to the composition of the Group during 2017In January 2017, SIX Structured Products Exchange Ltd was merged with SIX Swiss Exchange Ltd. The merger had no impact on the Group’s consolidated figures as at 31 December 2017.
In January 2017, SIX Systems Ltd was merged with SIX Securities Services Ltd. The merger had no impact on the Group’s consolidated figures as at 31 De cem ber 2017.
In January 2017, Rolotec Ltd was merged with SIX Financial Information Ltd. The merger had no impact on the Group’s consolidated figures as at 31 December 2017.
In March 2017, SIX Trade Repository Ltd realized a capital increase of CHF 0.4 million.
In June 2017, SIX Repo Ltd realized a capital increase of CHF 0.9 million.
In July 2017, SIX Swiss Exchange Securities Matcher Ltd was renamed SIX Global Services Ltd and was transferred from the Swiss Exchange operating segment to the Corporate segment. The transfer had no impact on the Group’s consolidated figures or on the segment reporting as at 31 December 2017.
In August 2017, SIX acquired Aduno SA, which included the terminal and acquiring business of Aduno Group. After the acquisition, the company was renamed SIX Payment Merchant Ltd. In November 2017, the company was renamed SIX Payment Ltd.
In September 2017, Projektgesellschaft Software-entwicklung Oktober 2011 Ltd was liquidated.
In November 2017, SIX Exchange Regulation Ltd was established with fully paidup share capital of CHF 0.1 million.
Changes to the composition of the Group during 2016In January 2016, CETREL SA was merged with SIX Payment Services (Europe) SA. The merger had no impact on the Group’s consolidated figures as at 31 December 2016.
In February 2016, SIX sold the business of the SIX Payment Services (Luxembourg) SA subgroup.
In the first half of 2016, SIX acquired the remaining 5.56% of shares in Europerformance SIX Telekurs. As a result, SIX eliminated the noncontrolling interest. Europerformance SIX Telekurs was subsequently merged with SIX Financial Information France SAS. The merger had no impact on the Group’s consolidated figures as at 31 December 2016.
In September 2016, SIX Financial Information Ltd realized a capital decrease of CHF 39.6 million.
In December 2016, SIX sold the shares in SIX SAG Ltd.
In December 2016, C6 Ré SA was liquidated. The gain from the liquidation was CHF 0.3 million, and this is included in financial income.
Commitment for joint arrangementsIn August 2015, SIX and Postfinance agreed to co-operate on ebilling and direct debits. Plans are in place for Postfinance to migrate to the Paynet ebilling solution by 2019. Then, Postfinance will acquire a minority stake and certain participation rights in SIX Paynet Ltd, which will subsequently operate as a joint venture. At that time, SIX will deconsolidate SIX Paynet Ltd and account for its interest in the joint venture using the equity method.
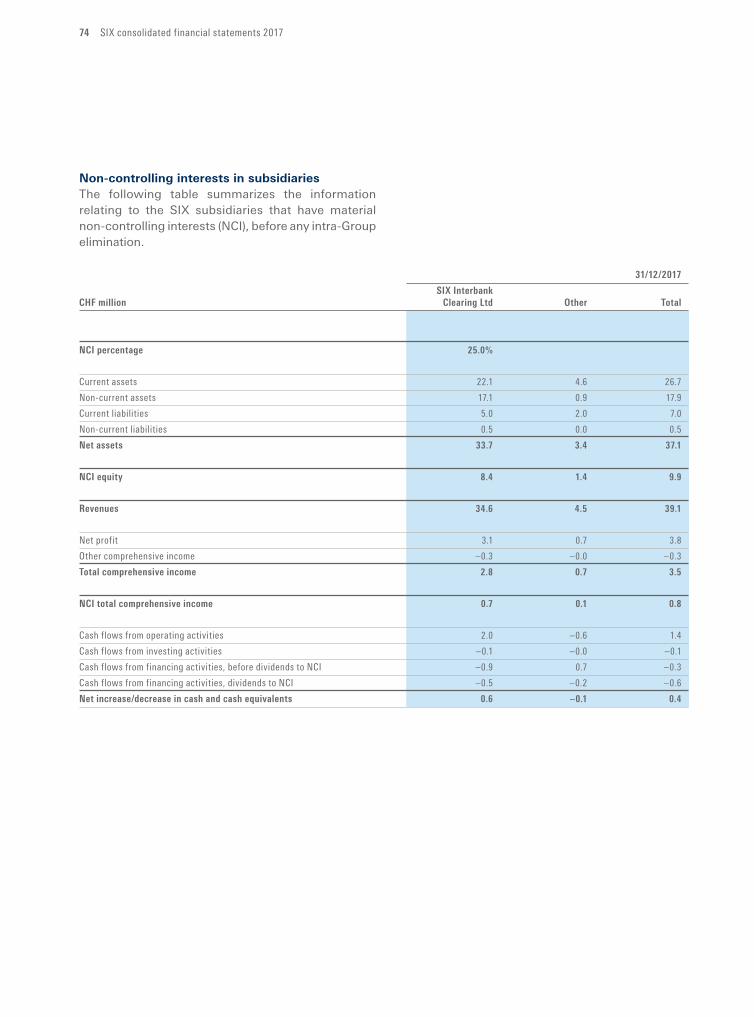
74 SIX consolidated financial statements 2017
Non-controlling interests in subsidiariesThe following table summarizes the information relating to the SIX subsidiaries that have material noncontrolling interests (NCI), before any intraGroup elimination.
31/12/2017
SIXInterbank
CHFmillion ClearingLtd Other Total
NCI percentage 25.0%
Current assets 22.1 4.6 26.7
Non-current assets 17.1 0.9 17.9
Current liabilities 5.0 2.0 7.0
Non-current liabilities 0.5 0.0 0.5
Net assets 33.7 3.4 37.1
NCIequity 8.4 1.4 9.9
Revenues 34.6 4.5 39.1
Net profit 3.1 0.7 3.8
Other comprehensive income –0.3 –0.0 –0.3
Totalcomprehensiveincome 2.8 0.7 3.5
NCItotalcomprehensiveincome 0.7 0.1 0.8
Cash flows from operating activities 2.0 –0.6 1.4
Cash flows from investing activities –0.1 –0.0 –0.1
Cash flows from financing activities, before dividends to NCI –0.9 0.7 –0.3
Cash flows from financing activities, dividends to NCI –0.5 –0.2 –0.6
Netincrease/decreaseincashandcashequivalents 0.6 –0.1 0.4
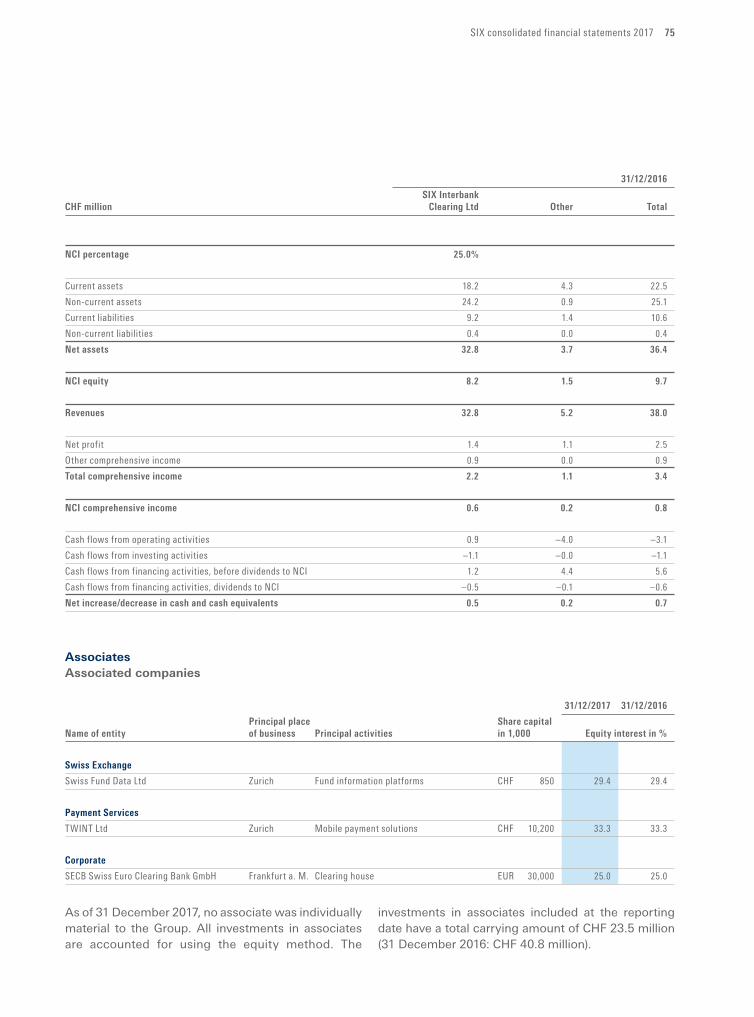
SIX consolidated financial statements 2017 75
31/12/2016
SIXInterbank
CHFmillion ClearingLtd Other Total
NCI percentage 25.0%
Current assets 18.2 4.3 22.5
Non-current assets 24.2 0.9 25.1
Current liabilities 9.2 1.4 10.6
Non-current liabilities 0.4 0.0 0.4
Net assets 32.8 3.7 36.4
NCIequity 8.2 1.5 9.7
Revenues 32.8 5.2 38.0
Net profit 1.4 1.1 2.5
Other comprehensive income 0.9 0.0 0.9
Totalcomprehensiveincome 2.2 1.1 3.4
NCIcomprehensiveincome 0.6 0.2 0.8
Cash flows from operating activities 0.9 –4.0 –3.1
Cash flows from investing activities –1.1 –0.0 –1.1
Cash flows from financing activities, before dividends to NCI 1.2 4.4 5.6
Cash flows from financing activities, dividends to NCI –0.5 –0.1 –0.6
Netincrease/decreaseincashandcashequivalents 0.5 0.2 0.7
AssociatesAssociated companies
31/12/2017 31/12/2016
Principalplace Sharecapital
Nameofentity ofbusiness Principalactivities in1,000 Equityinterestin%
SwissExchange
Swiss Fund Data Ltd Zurich Fund information platforms CHF 850 29.4 29.4
PaymentServices
TWINT Ltd Zurich Mobile payment solutions CHF 10,200 33.3 33.3
Corporate
SECB Swiss Euro Clearing Bank GmbH Frankfurt a. M. Clearing house EUR 30,000 25.0 25.0
As of 31 December 2017, no associate was indi vidually material to the Group. All investments in associates are accounted for using the equity method. The
investments in associates included at the re porting date have a total carrying amount of CHF 23.5 million (31 December 2016: CHF 40.8 million).
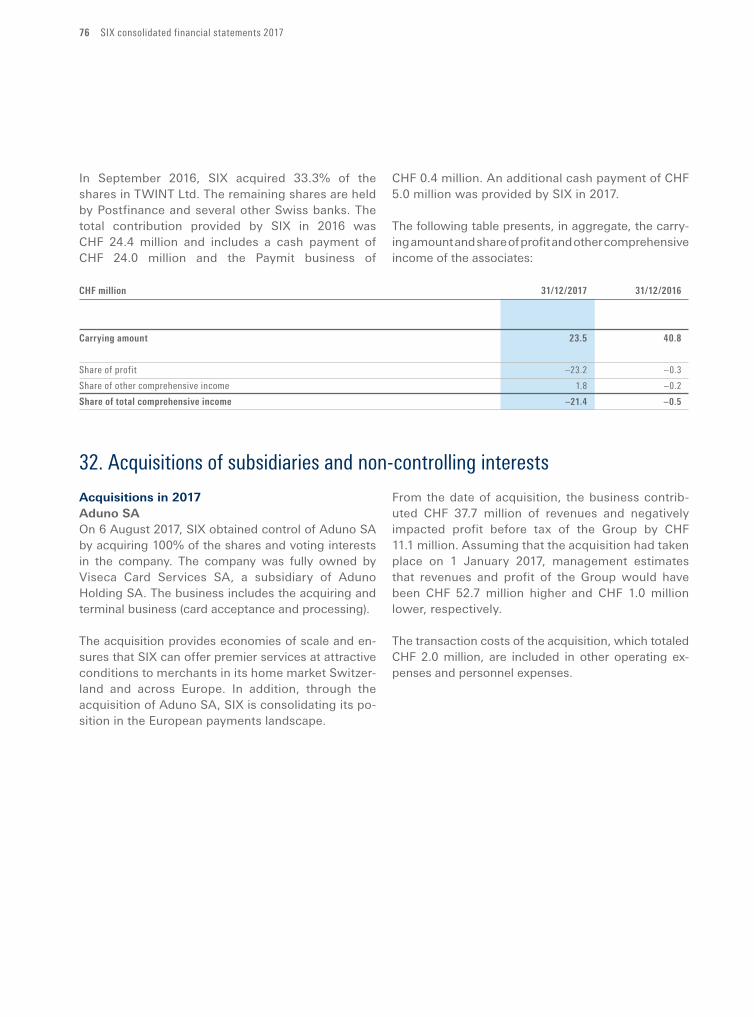
76 SIX consolidated financial statements 2017
In September 2016, SIX acquired 33.3% of the shares in TWINT Ltd. The remaining shares are held by Postfinance and several other Swiss banks. The total contribution provided by SIX in 2016 was CHF 24.4 mil lion and includes a cash payment of CHF 24.0 million and the Paymit business of
CHF 0.4 million. An additional cash payment of CHF 5.0 million was provided by SIX in 2017.
The following table presents, in aggregate, the carrying amount and share of profit and other comprehensive income of the associates:
CHFmillion 31/12/2017 31/12/2016
Carryingamount 23.5 40.8
Share of profit –23.2 –0.3
Share of other comprehensive income 1.8 –0.2
Shareoftotalcomprehensiveincome –21.4 –0.5
32. Acquisitions of subsidiaries and non-controlling interests
Acquisitions in 2017Aduno SAOn 6 August 2017, SIX obtained control of Aduno SA by acquiring 100% of the shares and voting interests in the company. The company was fully owned by Viseca Card Services SA, a subsidiary of Aduno Holding SA. The business includes the acquiring and terminal business (card acceptance and processing).
The acquisition provides economies of scale and ensures that SIX can offer premier services at attractive conditions to merchants in its home market Switzerland and across Europe. In addition, through the acquisition of Aduno SA, SIX is consolidating its position in the European payments landscape.
From the date of acquisition, the business contributed CHF 37.7 million of revenues and negatively impacted profit before tax of the Group by CHF 11.1 million. Assuming that the acquisition had taken place on 1 January 2017, management estimates that revenues and profit of the Group would have been CHF 52.7 million higher and CHF 1.0 million lower, respectively.
The transaction costs of the acquisition, which totaled CHF 2.0 million, are included in other operating expenses and personnel expenses.
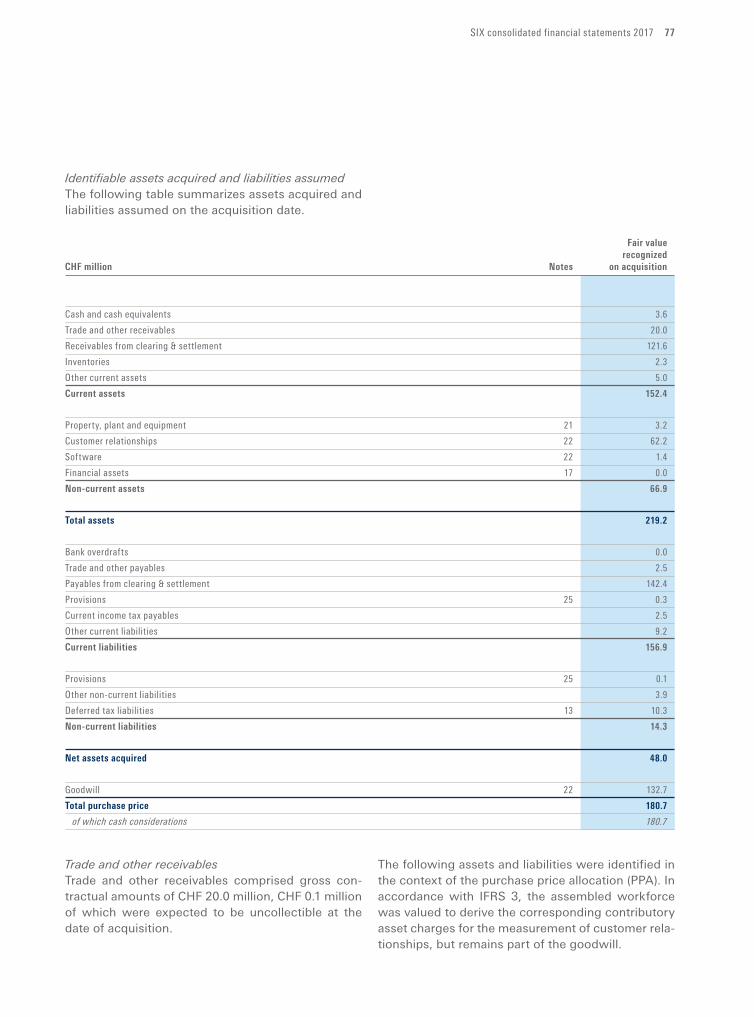
SIX consolidated financial statements 2017 77
Identifiable assets acquired and liabilities assumedThe following table summarizes assets acquired and liabilities assumed on the acquisition date.
Fairvalue
recognized
CHFmillion Notes onacquisition
Cash and cash equivalents 3.6
Trade and other receivables 20.0
Receivables from clearing & settlement 121.6
Inventories 2.3
Other current assets 5.0
Current assets 152.4
Property, plant and equipment 21 3.2
Customer relationships 22 62.2
Software 22 1.4
Financial assets 17 0.0
Non-current assets 66.9
Total assets 219.2
Bank overdrafts 0.0
Trade and other payables 2.5
Payables from clearing & settlement 142.4
Provisions 25 0.3
Current income tax payables 2.5
Other current liabilities 9.2
Currentliabilities 156.9
Provisions 25 0.1
Other non-current liabilities 3.9
Deferred tax liabilities 13 10.3
Non-currentliabilities 14.3
Netassetsacquired 48.0
Goodwill 22 132.7
Totalpurchaseprice 180.7
of which cash considerations 180.7
Trade and other receivablesTrade and other receivables comprised gross contractual amounts of CHF 20.0 million, CHF 0.1 million of which were expected to be uncollectible at the date of acquisition.
The following assets and liabilities were identified in the context of the purchase price allocation (PPA). In accordance with IFRS 3, the assembled workforce was valued to derive the corresponding contributory asset charges for the measurement of customer relationships, but remains part of the goodwill.
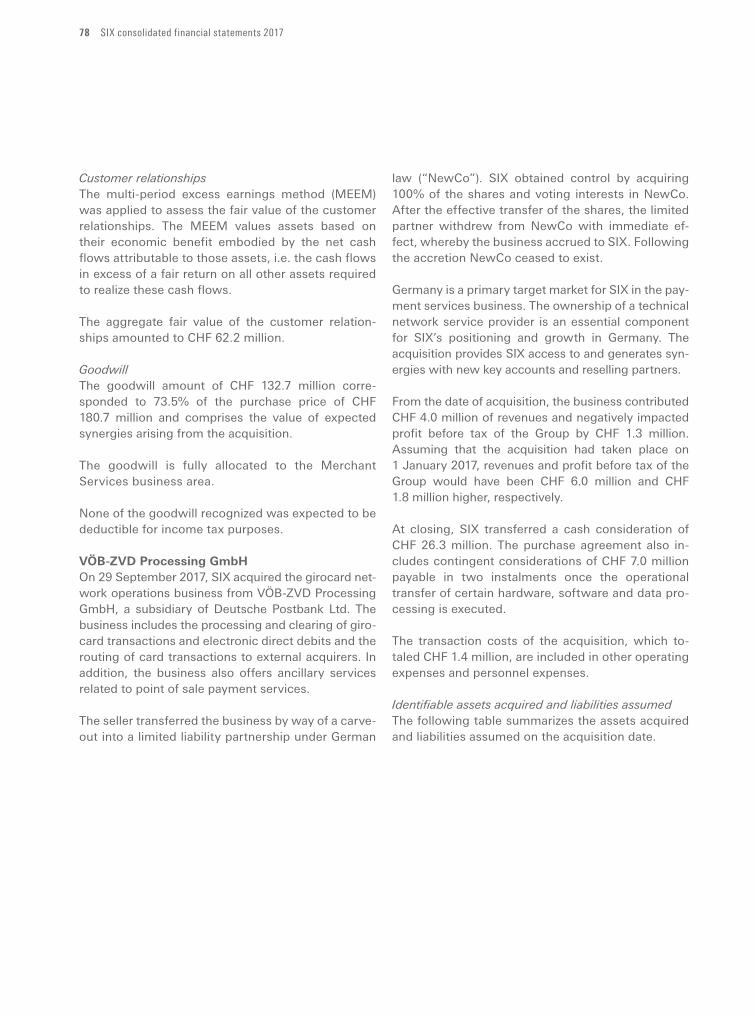
78 SIX consolidated financial statements 2017
Customer relationshipsThe multiperiod excess earnings method (MEEM) was applied to assess the fair value of the customer relationships. The MEEM values assets based on their economic benefit embodied by the net cash flows attributable to those assets, i.e. the cash flows in excess of a fair return on all other assets required to realize these cash flows.
The aggregate fair value of the customer relationships amounted to CHF 62.2 million.
GoodwillThe goodwill amount of CHF 132.7 million corresponded to 73.5% of the purchase price of CHF 180.7 million and comprises the value of expected synergies arising from the acquisition.
The goodwill is fully allocated to the Merchant Services business area.
None of the goodwill recognized was expected to be deductible for income tax purposes.
VÖB-ZVD Processing GmbHOn 29 September 2017, SIX acquired the girocard network operations business from VÖBZVD Pro cessing GmbH, a subsidiary of Deutsche Postbank Ltd. The business includes the processing and clearing of girocard transactions and electronic direct debits and the routing of card transactions to external acquirers. In addition, the business also offers ancillary services related to point of sale payment services.
The seller transferred the business by way of a carveout into a limited liability partnership under German
law (“NewCo”). SIX obtained control by acquiring 100% of the shares and voting interests in NewCo. After the effective transfer of the shares, the limited partner withdrew from NewCo with immediate effect, whereby the business accrued to SIX. Following the accretion NewCo ceased to exist.
Germany is a primary target market for SIX in the payment services business. The ownership of a technical network service provider is an essential component for SIX’s positioning and growth in Germany. The acquisition provides SIX access to and generates synergies with new key accounts and reselling partners.
From the date of acquisition, the business contributed CHF 4.0 million of revenues and negatively impacted profit before tax of the Group by CHF 1.3 million. Assuming that the acquisition had taken place on 1 January 2017, revenues and profit before tax of the Group would have been CHF 6.0 million and CHF 1.8 million higher, respectively.
At closing, SIX transferred a cash consideration of CHF 26.3 million. The purchase agreement also includes contingent considerations of CHF 7.0 million payable in two instalments once the operational transfer of certain hardware, software and data processing is executed.
The transaction costs of the acquisition, which totaled CHF 1.4 million, are included in other operating expenses and personnel expenses.
Identifiable assets acquired and liabilities assumedThe following table summarizes the assets acquired and liabilities assumed on the acquisition date.
SIX consolidated financial statements 2017 79
Fairvalue
recognized
CHFmillion Notes onacquisition
Cash and cash equivalents 4.9
Trade and other receivables 2.3
Inventories 0.2
Other current assets 0.0
Current assets 7.4
Property, plant and equipment 21 0.5
Customer relationships 22 22.9
Software 22 2.7
Non-current assets 26.0
Total assets 33.4
Trade and other payables 0.2
Payables from clearing & settlement 2.2
Other current liabilities 2.8
Currentliabilities 5.2
Netassetsacquired 28.2
Goodwill 22 5.1
Totalpurchaseprice 33.3
of which contingent considerations 7.0
of which cash considerations 26.3
Trade and other receivablesTrade and other receivables comprised gross contractual amounts of CHF 2.3 million, none of which were expected to be uncollectible at the date of acquisition.
The following assets and liabilities were identified in the context of the purchase price allocation (PPA). In accordance with IFRS 3, the assembled workforce has been valued to derive the corresponding contributory asset charges for the valuation of the customer relationships, but remains part of the goodwill.
Customer relationshipsThe multiperiod excess earnings method (MEEM) was applied to assess the fair value of the customer relationship. The MEEM values assets based on their economic benefit embodied by the net cash flows attributable to those assets, i.e. the cash flows in excess of a fair return on all other assets required to realize these cash flows.
The aggregate fair value of the customer relationships amounted to CHF 22.9 million.
SoftwareThe cost approach was applied to assess the fair value of the internally generated and acquired software. The aggregate fair value of software amounted to CHF 2.7 million.
GoodwillThe goodwill amount of CHF 5.1 million corresponded to 15.3% of the purchase price and comprises the value of expected synergies arising from the acquisition.
The goodwill is fully allocated to the Merchant Service business area.
The total goodwill of CHF 5.1 million recognized is expected to be deductible for income tax purposes.
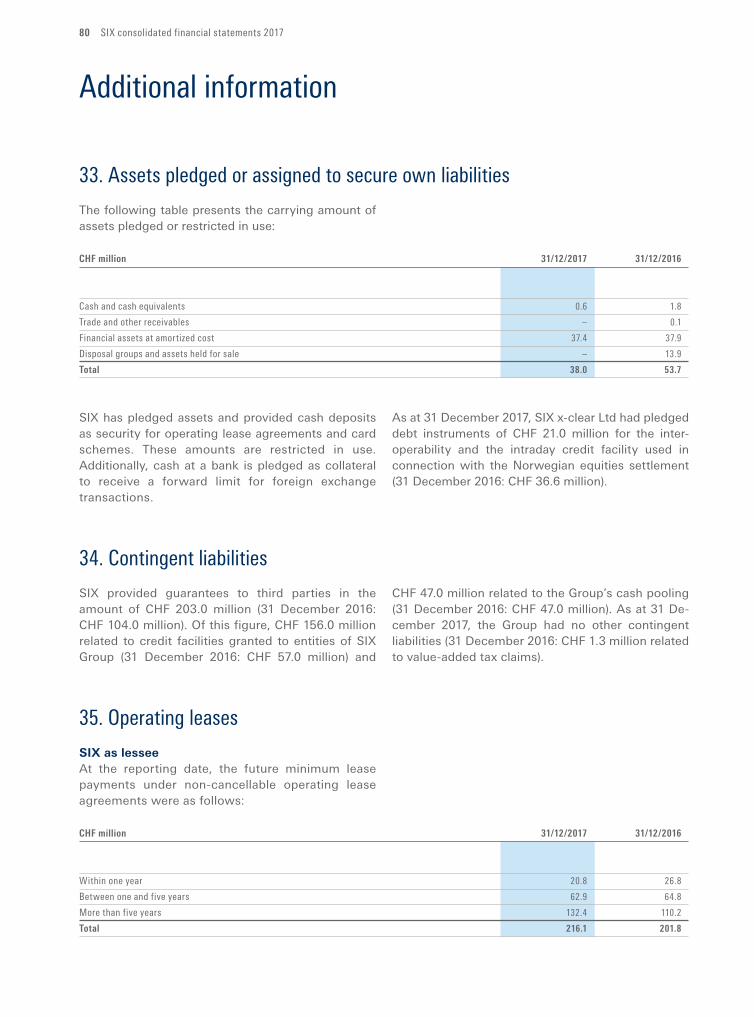
80 SIX consolidated financial statements 2017
Additional information
33. Assets pledged or assigned to secure own liabilities
The following table presents the carrying amount of assets pledged or restricted in use:
CHFmillion 31/12/2017 31/12/2016
Cash and cash equivalents 0.6 1.8
Trade and other receivables – 0.1
Financial assets at amortized cost 37.4 37.9
Disposal groups and assets held for sale – 13.9
Total 38.0 53.7
SIX has pledged assets and provided cash deposits as security for operating lease agreements and card schemes. These amounts are restricted in use. Additionally, cash at a bank is pledged as collateral to receive a forward limit for foreign exchange trans actions.
As at 31 December 2017, SIX x-clear Ltd had pledged debt instruments of CHF 21.0 million for the inter-operability and the intraday credit facility used in connection with the Norwegian equities settlement (31 December 2016: CHF 36.6 million).
34. Contingent liabilities
SIX provided guarantees to third parties in the amount of CHF 203.0 million (31 December 2016: CHF 104.0 million). Of this figure, CHF 156.0 million related to credit facilities granted to entities of SIX Group (31 December 2016: CHF 57.0 million) and
CHF 47.0 million related to the Group’s cash pooling (31 December 2016: CHF 47.0 million). As at 31 De-cember 2017, the Group had no other contingent liabilities (31 December 2016: CHF 1.3 million related to valueadded tax claims).
35. Operating leases
SIX as lesseeAt the reporting date, the future minimum lease payments under noncancellable operating lease agreements were as follows:
CHFmillion 31/12/2017 31/12/2016
Within one year 20.8 26.8
Between one and five years 62.9 64.8
More than five years 132.4 110.2
Total 216.1 201.8
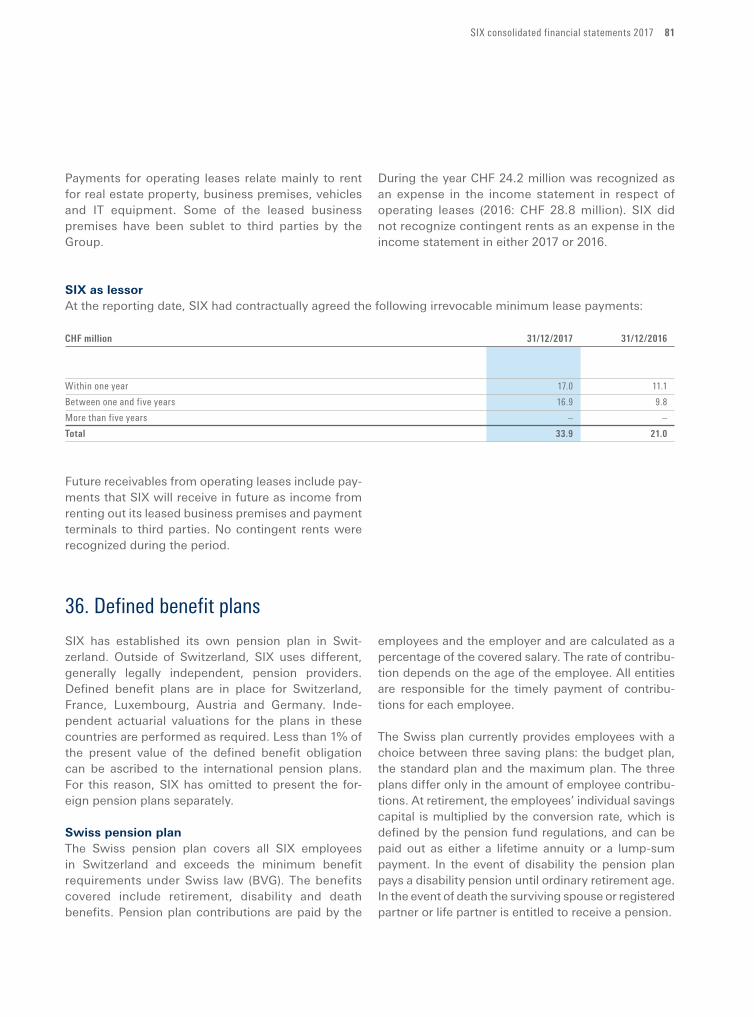
SIX consolidated financial statements 2017 81
Payments for operating leases relate mainly to rent for real estate property, business premises, vehicles and IT equipment. Some of the leased business premises have been sublet to third parties by the Group.
During the year CHF 24.2 million was recognized as an expense in the income statement in respect of operating leases (2016: CHF 28.8 million). SIX did not recognize contingent rents as an expense in the income statement in either 2017 or 2016.
SIX as lessorAt the reporting date, SIX had contractually agreed the following irrevocable minimum lease payments:
CHFmillion 31/12/2017 31/12/2016
Within one year 17.0 11.1
Between one and five years 16.9 9.8
More than five years – –
Total 33.9 21.0
Future receivables from operating leases include payments that SIX will receive in future as income from renting out its leased business premises and payment terminals to third parties. No contingent rents were recognized during the period.
36. Defined benefit plans
SIX has established its own pension plan in Switzerland. Outside of Switzerland, SIX uses different, generally legally independent, pension providers. Defined benefit plans are in place for Switzerland, France, Luxembourg, Austria and Germany. Independent actuarial valuations for the plans in these countries are performed as required. Less than 1% of the present value of the defined benefit obligation can be ascribed to the international pension plans. For this reason, SIX has omitted to present the foreign pension plans separately.
Swiss pension planThe Swiss pension plan covers all SIX employees in Switzerland and exceeds the minimum benefit requirements under Swiss law (BVG). The benefits covered include retirement, disability and death benefits. Pension plan contributions are paid by the
employees and the employer and are calculated as a percentage of the covered salary. The rate of contribution depends on the age of the employee. All entities are responsible for the timely payment of contributions for each employee.
The Swiss plan currently provides employees with a choice between three saving plans: the budget plan, the standard plan and the maximum plan. The three plans differ only in the amount of employee contributions. At retirement, the employees’ individual savings capital is multiplied by the conversion rate, which is defined by the pension fund regulations, and can be paid out as either a lifetime annuity or a lumpsum payment. In the event of disability the pension plan pays a disability pension until ordinary retirement age. In the event of death the surviving spouse or registered partner or life partner is entitled to receive a pension.
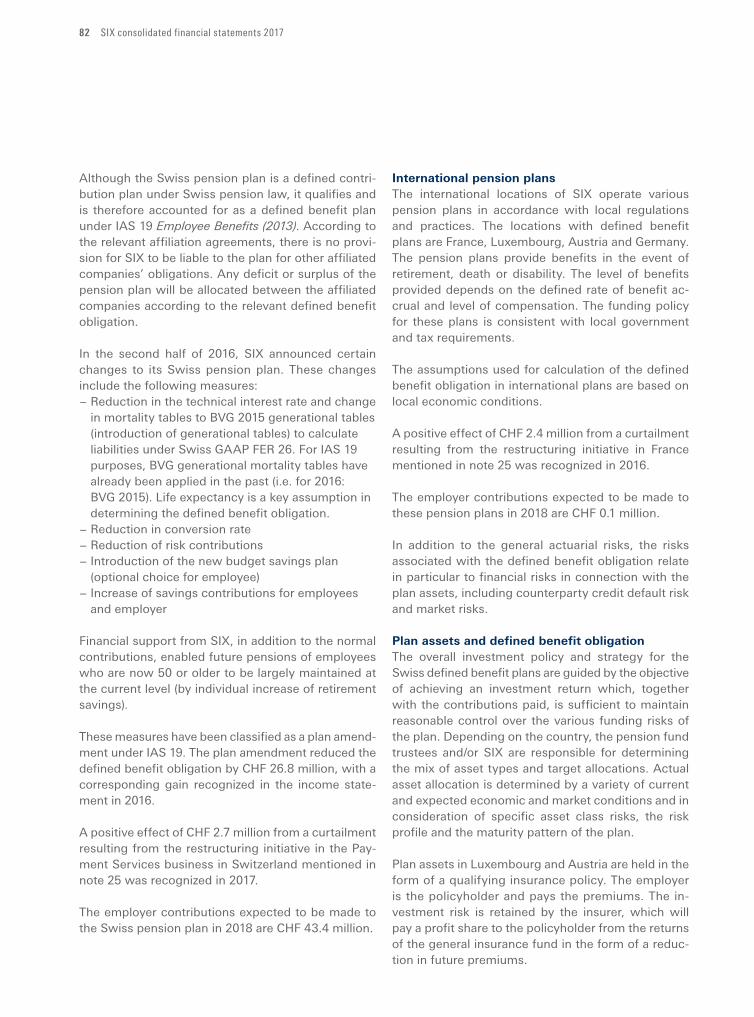
82 SIX consolidated financial statements 2017
Although the Swiss pension plan is a defined contribution plan under Swiss pension law, it qualifies and is therefore accounted for as a defined benefit plan under IAS 19 Employee Benefits (2013). According to the relevant affiliation agreements, there is no provision for SIX to be liable to the plan for other affiliated companies’ obligations. Any deficit or surplus of the pension plan will be allocated between the affiliated companies according to the relevant defined benefit obligation.
In the second half of 2016, SIX announced certain changes to its Swiss pension plan. These changes include the following measures:− Reduction in the technical interest rate and change
in mortality tables to BVG 2015 generational tables (introduction of generational tables) to calculate liabilities under Swiss GAAP FER 26. For IAS 19 purposes, BVG generational mortality tables have already been applied in the past (i.e. for 2016: BVG 2015). Life expectancy is a key assumption in determining the defined benefit obligation.
− Reduction in conversion rate− Reduction of risk contributions− Introduction of the new budget savings plan
(optional choice for employee)− Increase of savings contributions for employees
and employer
Financial support from SIX, in addition to the normal contributions, enabled future pensions of employees who are now 50 or older to be largely maintained at the current level (by individual increase of retirement savings).
These measures have been classified as a plan amendment under IAS 19. The plan amendment reduced the defined benefit obligation by CHF 26.8 million, with a corresponding gain recognized in the income statement in 2016.
A positive effect of CHF 2.7 million from a curtailment resulting from the restructuring initiative in the Payment Services business in Switzerland mentioned in note 25 was recognized in 2017.
The employer contributions expected to be made to the Swiss pension plan in 2018 are CHF 43.4 million.
International pension plansThe international locations of SIX operate various pension plans in accordance with local regulations and practices. The locations with defined benefit plans are France, Luxembourg, Austria and Germany. The pension plans provide benefits in the event of retirement, death or disability. The level of benefits provided depends on the defined rate of benefit accrual and level of compensation. The funding policy for these plans is consistent with local government and tax requirements.
The assumptions used for calculation of the defined benefit obligation in international plans are based on local economic conditions.
A positive effect of CHF 2.4 million from a curtailment resulting from the restructuring initiative in France mentioned in note 25 was recognized in 2016.
The employer contributions expected to be made to these pension plans in 2018 are CHF 0.1 million.
In addition to the general actuarial risks, the risks associated with the defined benefit obligation relate in particular to financial risks in connection with the plan assets, including counterparty credit default risk and market risks.
Plan assets and defined benefit obligationThe overall investment policy and strategy for the Swiss defined benefit plans are guided by the ob jective of achieving an investment return which, together with the contributions paid, is sufficient to maintain reasonable control over the various funding risks of the plan. Depending on the country, the pension fund trustees and/or SIX are responsible for determining the mix of asset types and target allocations. Actual asset allocation is determined by a variety of current and expected economic and market conditions and in consideration of specific asset class risks, the risk profile and the maturity pattern of the plan.
Plan assets in Luxembourg and Austria are held in the form of a qualifying insurance policy. The employer is the policyholder and pays the premiums. The investment risk is retained by the insurer, which will pay a profit share to the policyholder from the returns of the general insurance fund in the form of a reduction in future premiums.
SIX consolidated financial statements 2017 83
The plan assets comprise:
CHFmillion 31/12/2017 31/12/2016
Equity instruments 501.4 443.7
of which listed 501.4 443.7
Debt instruments 714.9 720.8
of which listed 714.9 720.8
Real estate 328.5 288.9
of which indirect investments 328.5 288.9
Cash and cash equivalents 33.2 25.2
Other financial investments 78.0 38.6
Total plan assets 1,656.0 1,517.2
All equity and debt instruments have quoted prices in active markets. All government bonds have investmentgrade ratings.
An assetliability matching (ALM) study is performed periodically by an external investment advisor, in which the consequences of the strategic investment policies are analyzed. The strategic investment policy of the pension fund for 2018 can be summarized as follows:
− The strategic asset allocation comprises 21.0% to 33.0% (neutral: 27.0%) equity instruments; 37.0% to 62.0% debt instruments (neutral: 48.0%); and 17.0% to 31.0% (neutral: 25.0%) other investments (e.g. real estate, alternative investments and cash).
− Interest rate risk is not managed actively, but the pension plan is strongly underweighted in duration.
− The foreign currency risk of the main currencies is managed by a currency overlay program and/or foreign currency hedge directly in the funds.
The following table summarizes the changes in the present value of the defined benefit obligation:
CHFmillion 2017 2016
Presentvalueofobligationat1January –1,540.1 –1,498.0
Effect of business combinations and disposals –19.8 11.3
Interest expenses on defined benefit obligation –11.1 –13.9
Current service costs (employer) –57.4 –57.4
Employee contributions –32.8 –31.1
Benefits paid 25.1 31.3
Past service costs – 26.8
Plan curtailments and settlements 15.0 2.4
Actuarial gains or (losses) –23.5 –11.1
Administration costs –0.8 –0.7
Translation adjustments –1.2 0.4
Presentvalueofobligationat31December –1,646.5 –1,540.1
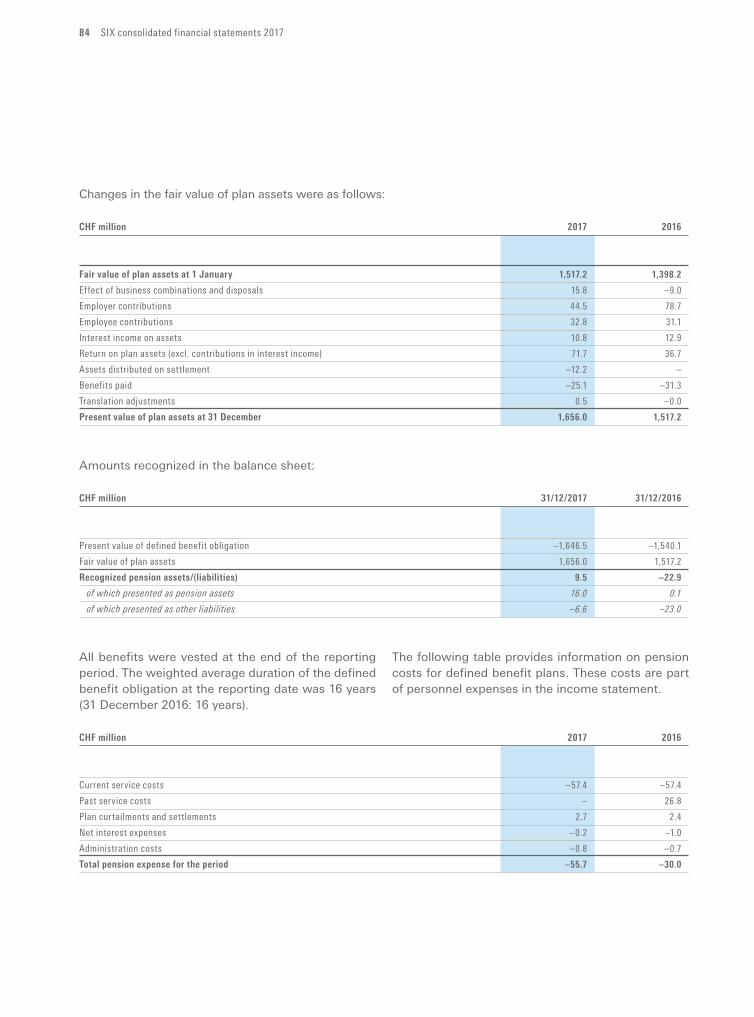
84 SIX consolidated financial statements 2017
Changes in the fair value of plan assets were as follows:
CHFmillion 2017 2016
Fairvalueofplanassetsat1January 1,517.2 1,398.2
Effect of business combinations and disposals 15.8 –9.0
Employer contributions 44.5 78.7
Employee contributions 32.8 31.1
Interest income on assets 10.8 12.9
Return on plan assets (excl. contributions in interest income) 71.7 36.7
Assets distributed on settlement –12.2 –
Benefits paid –25.1 –31.3
Translation adjustments 0.5 –0.0
Presentvalueofplanassetsat31December 1,656.0 1,517.2
Amounts recognized in the balance sheet:
CHFmillion 31/12/2017 31/12/2016
Present value of defined benefit obligation –1,646.5 –1,540.1
Fair value of plan assets 1,656.0 1,517.2
Recognizedpensionassets/(liabilities) 9.5 –22.9
of which presented as pension assets 16.0 0.1
of which presented as other liabilities –6.6 –23.0
All benefits were vested at the end of the reporting period. The weighted average duration of the defined benefit obligation at the reporting date was 16 years (31 December 2016: 16 years).
The following table provides information on pension costs for defined benefit plans. These costs are part of personnel expenses in the income statement.
CHFmillion 2017 2016
Current service costs –57.4 –57.4
Past service costs – 26.8
Plan curtailments and settlements 2.7 2.4
Net interest expenses –0.2 –1.0
Administration costs –0.8 –0.7
Totalpensionexpensefortheperiod –55.7 –30.0
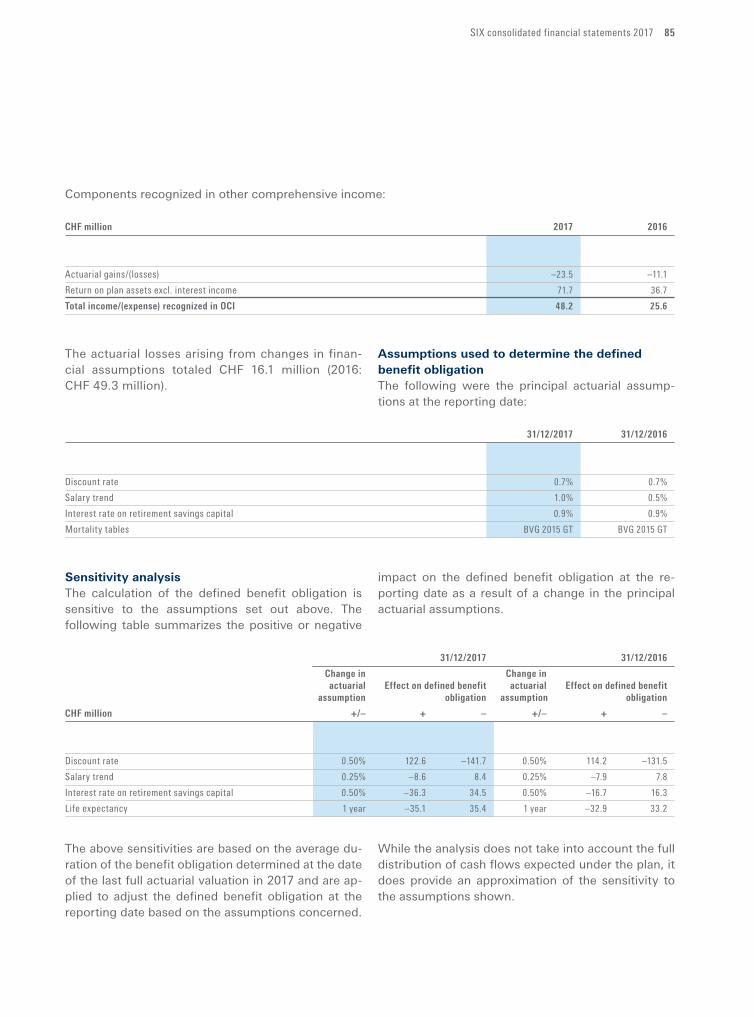
SIX consolidated financial statements 2017 85
Components recognized in other comprehensive income:
CHFmillion 2017 2016
Actuarial gains/(losses) –23.5 –11.1
Return on plan assets excl. interest income 71.7 36.7
Totalincome/(expense)recognizedinOCI 48.2 25.6
The actuarial losses arising from changes in financial assumptions totaled CHF 16.1 million (2016: CHF 49.3 million).
Assumptions used to determine the defined benefit obligationThe following were the principal actuarial assumptions at the reporting date:
31/12/2017 31/12/2016
Discount rate 0.7% 0.7%
Salary trend 1.0% 0.5%
Interest rate on retirement savings capital 0.9% 0.9%
Mortality tables BVG 2015 GT BVG 2015 GT
Sensitivity analysisThe calculation of the defined benefit obligation is sensitive to the assumptions set out above. The following table summarizes the positive or negative
impact on the defined benefit obligation at the reporting date as a result of a change in the principal actuarial assumptions.
31/12/2017 31/12/2016
Changein Changein
actuarial Effectondefinedbenefit actuarial Effectondefinedbenefit
assumption obligation assumption obligation
CHFmillion +/– + – +/– + –
Discount rate 0.50% 122.6 –141.7 0.50% 114.2 –131.5
Salary trend 0.25% –8.6 8.4 0.25% –7.9 7.8
Interest rate on retirement savings capital 0.50% –36.3 34.5 0.50% –16.7 16.3
Life expectancy 1 year –35.1 35.4 1 year –32.9 33.2
The above sensitivities are based on the average duration of the benefit obligation determined at the date of the last full actuarial valuation in 2017 and are applied to adjust the defined benefit obligation at the reporting date based on the assumptions concerned.
While the analysis does not take into account the full distribution of cash flows expected under the plan, it does provide an approximation of the sensitivity to the assumptions shown.
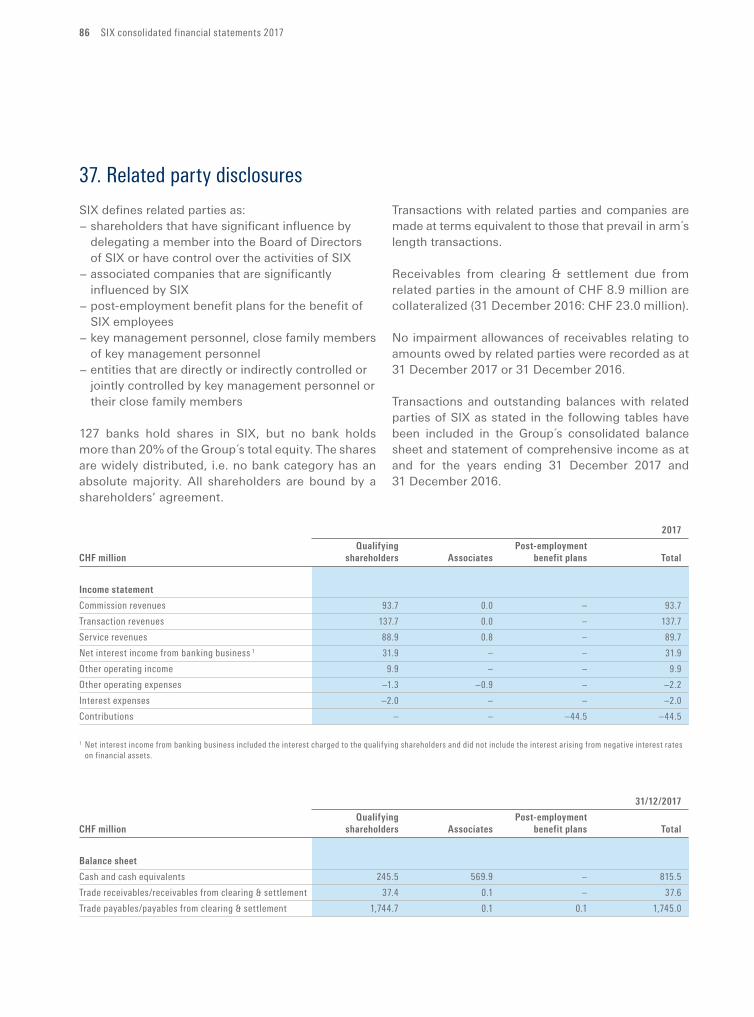
86 SIX consolidated financial statements 2017
37. Related party disclosures
SIX defines related parties as:− shareholders that have significant influence by
delegating a member into the Board of Directors of SIX or have control over the activities of SIX
− associated companies that are significantly influenced by SIX
− post-employment benefit plans for the benefit of SIX employees
− key management personnel, close family members of key management personnel
− entities that are directly or indirectly controlled or jointly controlled by key management personnel or their close family members
127 banks hold shares in SIX, but no bank holds more than 20% of the Group´s total equity. The shares are widely distributed, i.e. no bank category has an ab solute majority. All shareholders are bound by a shareholders’ agreement.
Transactions with related parties and companies are made at terms equivalent to those that prevail in arm´s length transactions.
Receivables from clearing & settlement due from related parties in the amount of CHF 8.9 million are collateralized (31 December 2016: CHF 23.0 million).
No impairment allowances of receivables relating to amounts owed by related parties were recorded as at 31 December 2017 or 31 December 2016.
Transactions and outstanding balances with related parties of SIX as stated in the following tables have been included in the Group´s consolidated balance sheet and statement of comprehensive income as at and for the years ending 31 December 2017 and 31 December 2016.
2017
Qualifying Post-employment
CHFmillion shareholders Associates benefitplans Total
Incomestatement
Commission revenues 93.7 0.0 – 93.7
Transaction revenues 137.7 0.0 – 137.7
Service revenues 88.9 0.8 – 89.7
Net interest income from banking business 1 31.9 – – 31.9
Other operating income 9.9 – – 9.9
Other operating expenses –1.3 –0.9 – –2.2
Interest expenses –2.0 – – –2.0
Contributions – – –44.5 –44.5
1 Net interest income from banking business included the interest charged to the qualifying shareholders and did not include the interest arising from negative interest rates on financial assets.
31/12/2017
Qualifying Post-employment
CHFmillion shareholders Associates benefitplans Total
Balancesheet
Cash and cash equivalents 245.5 569.9 – 815.5
Trade receivables/receivables from clearing & settlement 37.4 0.1 – 37.6
Trade payables/payables from clearing & settlement 1,744.7 0.1 0.1 1,745.0
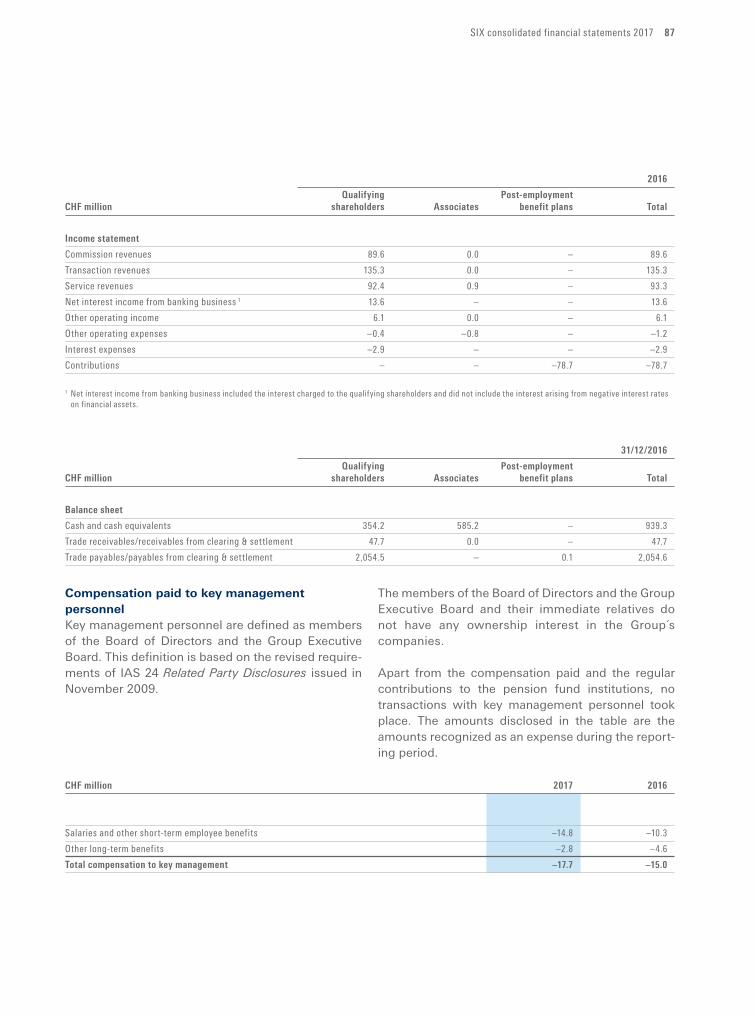
SIX consolidated financial statements 2017 87
2016
Qualifying Post-employment
CHFmillion shareholders Associates benefitplans Total
Incomestatement
Commission revenues 89.6 0.0 – 89.6
Transaction revenues 135.3 0.0 – 135.3
Service revenues 92.4 0.9 – 93.3
Net interest income from banking business 1 13.6 – – 13.6
Other operating income 6.1 0.0 – 6.1
Other operating expenses –0.4 –0.8 – –1.2
Interest expenses –2.9 – – –2.9
Contributions – – –78.7 –78.7
1 Net interest income from banking business included the interest charged to the qualifying shareholders and did not include the interest arising from negative interest rates on financial assets.
31/12/2016
Qualifying Post-employment
CHFmillion shareholders Associates benefitplans Total
Balancesheet
Cash and cash equivalents 354.2 585.2 – 939.3
Trade receivables/receivables from clearing & settlement 47.7 0.0 – 47.7
Trade payables/payables from clearing & settlement 2,054.5 – 0.1 2,054.6
Compensation paid to key management personnelKey management personnel are defined as members of the Board of Directors and the Group Executive Board. This definition is based on the revised requirements of IAS 24 Related Party Disclosures issued in November 2009.
The members of the Board of Directors and the Group Executive Board and their immediate relatives do not have any ownership interest in the Group´s com pa nies.
Apart from the compensation paid and the regular contributions to the pension fund institutions, no transactions with key management personnel took place. The amounts disclosed in the table are the amounts recognized as an expense during the reporting period.
CHFmillion 2017 2016
Salaries and other short-term employee benefits –14.8 –10.3
Other long-term benefits –2.8 –4.6
Totalcompensationtokeymanagement –17.7 –15.0
88 SIX consolidated financial statements 2017
38. Events after the balance sheet date
As at 14 March 2018, the date of approval for issue of the financial statements by the Board of Directors, the Group had undergone no subsequent events warranting a modification of the value of the assets and liabilities or an additional disclosure.
SIX consolidated financial statements 2017 89
Statutory auditor’s report on the audit of the consolidated financial statements
To the General Meeting of SIX Group Ltd, ZurichZurich, 15 March 2018
OpinionWe have audited the consolidated financial statements of SIX Group Ltd and its subsidiaries (the Group), which comprise the consolidated statement of financial position as at 31 December 2017 and the consolidated income statement, consolidated statement of comprehensive income, consolidated statement of changes in equity and consolidated statement of cash flows for the year then ended, and notes to the consolidated financial statements, including a summary of significant accounting policies.
In our opinion, the consolidated financial statements (pages 9 to 88) give a true and fair view of the consolidated financial position of the Group as at 31 December 2017, and its consolidated financial performance and its consolidated cash flows for the year then ended in accordance with International Financial Reporting Standards (IFRS) and comply with Swiss law.
Basis for opinionWe conducted our audit in accordance with Swiss law, International Standards on Auditing (ISAs) and Swiss Auditing Standards. Our responsibilities under those provisions and standards are further described in the Auditor’s responsibilities for the audit of the consolidated financial statements section of our report.
We are independent of the Group in accordance with the provisions of Swiss law and the requirements of the Swiss audit profession, as well as the IESBA Code of Ethics for Professional Accountants, and we have fulfilled our other ethical responsibilities in accordance with these requirements.
We believe that the audit evidence we have obtained is sufficient and appropriate to provide a basis for our opinion.
Other information in the annual reportThe Board of Directors is responsible for the other information in the annual report. The other information comprises all information included in the annual report, but does not include the consolidated financial statements, the standalone financial statements and our auditor’s reports thereon.
Our opinion on the consolidated financial statements does not cover the other information in the annual report and we do not express any form of assurance conclusion thereon.
In connection with our audit of the consolidated financial statements, our responsibility is to read the other information in the annual report and, in doing so, consider whether the other information is materially inconsistent with the consolidated financial statements or our knowledge obtained in the audit, or otherwise appears to be materially misstated. If, based on the work we have performed, we conclude that there is a material misstatement of this other information, we are required to report that fact. We have nothing to report in this regard.
90 SIX consolidated financial statements 2017
Responsibility of the Board of Directors for the consolidated financial statementsThe Board of Directors is responsible for the preparation of the consolidated financial statements that give a true and fair view in accordance with IFRS and the provisions of Swiss law, and for such internal control as the Board of Directors determines is necessary to enable the preparation of consolidated financial statements that are free from material misstatement, whether due to fraud or error.
In preparing the consolidated financial statements, the Board of Directors is responsible for assessing the Group’s ability to continue as a going concern, disclosing, as applicable, matters related to going concern and using the going concern basis of accounting unless the Board of Directors either intends to liquidate the Group or to cease operations, or has no realistic alternative but to do so.
Auditor’s responsibilities for the audit of the consolidated financial statementsOur objectives are to obtain reasonable assurance about whether the consolidated financial statements as a whole are free from material misstatement, whether due to fraud or error, and to issue an auditor’s report that includes our opinion. Reasonable assurance is a high level of assurance, but is not a guarantee that an audit conducted in accordance with Swiss law, ISAs and Swiss Auditing Standards will always detect a material misstatement when it exists. Misstatements can arise from fraud or error and are considered material if, individually or in the aggregate, they could reasonably be expected to influence the economic decisions of users taken on the basis of these consolidated financial statements.
A further description of our responsibilities for the audit of the consolidated financial statements is located at the website of EXPERTsuisse: http://www.expertsuisse.ch/en/audit-report-for-public-companies. This description forms part of our auditor’s report.
Report on other legal and regulatory requirementsIn accordance with article 728a para. 1 item 3 CO and the Swiss Auditing Standard 890, we confirm that an internal control system exists, which has been designed for the preparation of consolidated financial statements according to the instructions of the Board of Directors.
We recommend that the consolidated financial statements submitted to you be approved.
Ernst & Young Ltd
Jan MarxfeldLicensed audit expert(Auditor in charge)
Slaven CosicLicensed audit expert
SIX Group Ltd financial statements 2017 91
SIX Group Ltd financial statements 2017
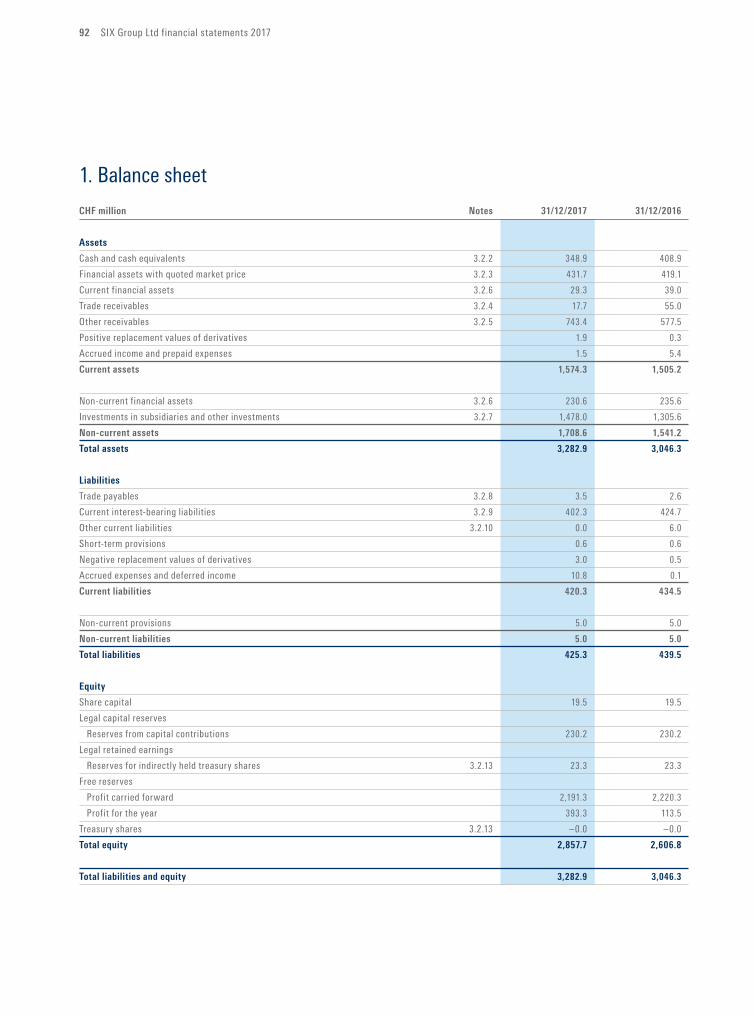
92 SIX Group Ltd financial statements 2017
1. Balance sheet
CHFmillion Notes 31/12/2017 31/12/2016
Assets
Cash and cash equivalents 3.2.2 348.9 408.9
Financial assets with quoted market price 3.2.3 431.7 419.1
Current financial assets 3.2.6 29.3 39.0
Trade receivables 3.2.4 17.7 55.0
Other receivables 3.2.5 743.4 577.5
Positive replacement values of derivatives 1.9 0.3
Accrued income and prepaid expenses 1.5 5.4
Current assets 1,574.3 1,505.2
Non-current financial assets 3.2.6 230.6 235.6
Investments in subsidiaries and other investments 3.2.7 1,478.0 1,305.6
Non-current assets 1,708.6 1,541.2
Total assets 3,282.9 3,046.3
Liabilities
Trade payables 3.2.8 3.5 2.6
Current interest-bearing liabilities 3.2.9 402.3 424.7
Other current liabilities 3.2.10 0.0 6.0
Short-term provisions 0.6 0.6
Negative replacement values of derivatives 3.0 0.5
Accrued expenses and deferred income 10.8 0.1
Currentliabilities 420.3 434.5
Non-current provisions 5.0 5.0
Non-currentliabilities 5.0 5.0
Totalliabilities 425.3 439.5
Equity
Share capital 19.5 19.5
Legal capital reserves
Reserves from capital contributions 230.2 230.2
Legal retained earnings
Reserves for indirectly held treasury shares 3.2.13 23.3 23.3
Free reserves
Profit carried forward 2,191.3 2,220.3
Profit for the year 393.3 113.5
Treasury shares 3.2.13 –0.0 –0.0
Totalequity 2,857.7 2,606.8
Totalliabilitiesandequity 3,282.9 3,046.3
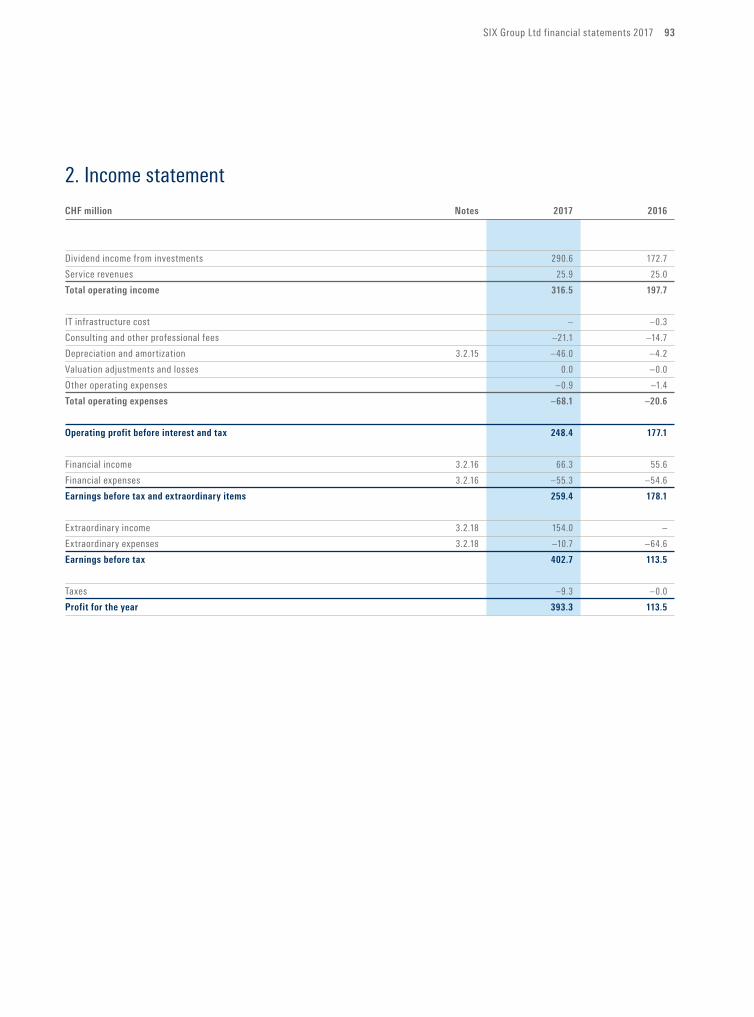
SIX Group Ltd financial statements 2017 93
2. Income statement
CHFmillion Notes 2017 2016
Dividend income from investments 290.6 172.7
Service revenues 25.9 25.0
Totaloperatingincome 316.5 197.7
IT infrastructure cost – –0.3
Consulting and other professional fees –21.1 –14.7
Depreciation and amortization 3.2.15 –46.0 –4.2
Valuation adjustments and losses 0.0 –0.0
Other operating expenses –0.9 –1.4
Totaloperatingexpenses –68.1 –20.6
Operatingprofitbeforeinterestandtax 248.4 177.1
Financial income 3.2.16 66.3 55.6
Financial expenses 3.2.16 –55.3 –54.6
Earningsbeforetaxandextraordinaryitems 259.4 178.1
Extraordinary income 3.2.18 154.0 –
Extraordinary expenses 3.2.18 –10.7 –64.6
Earningsbeforetax 402.7 113.5
Taxes –9.3 –0.0
Profitfortheyear 393.3 113.5
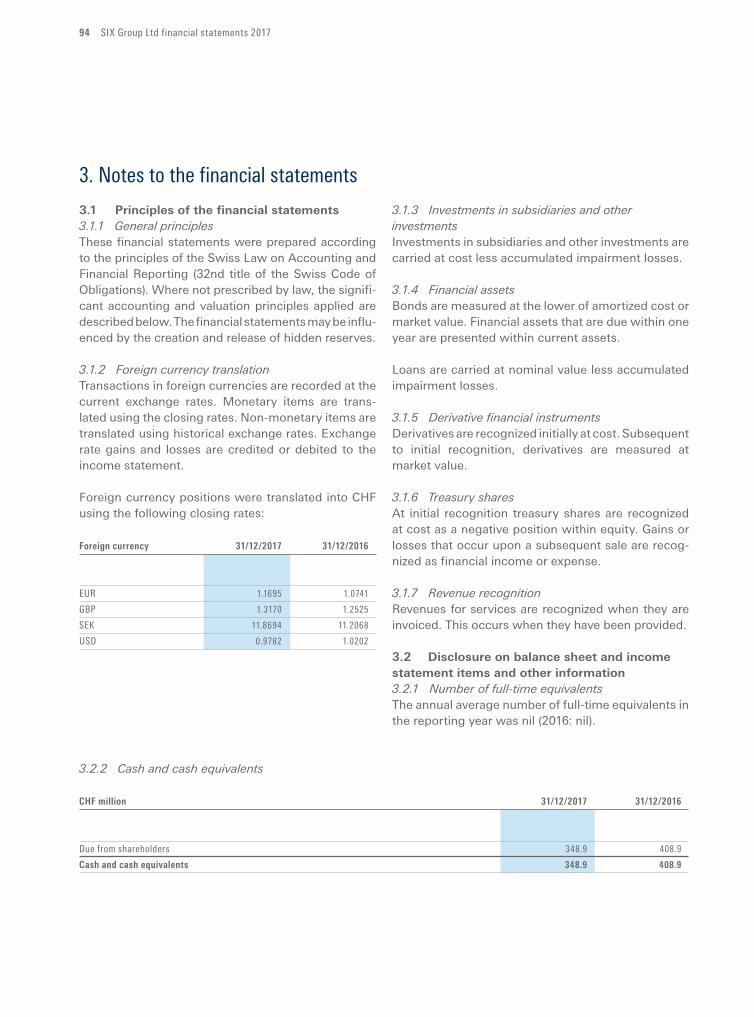
94 SIX Group Ltd financial statements 2017
3. Notes to the financial statements
3.1 Principles of the financial statements 3.1.1 General principles These financial statements were prepared according to the principles of the Swiss Law on Accounting and Financial Reporting (32nd title of the Swiss Code of Obligations). Where not prescribed by law, the significant accounting and valuation principles applied are described below. The financial statements may be influ enced by the creation and release of hidden reserves.
3.1.2 Foreign currency translationTransactions in foreign currencies are recorded at the current exchange rates. Monetary items are translated using the closing rates. Nonmonetary items are translated using historical exchange rates. Exchange rate gains and losses are credited or debited to the income statement.
Foreign currency positions were translated into CHF using the following closing rates:
Foreign currency 31/12/2017 31/12/2016
EUR 1.1695 1.0741
GBP 1.3170 1.2525
SEK 11.8694 11.2068
USD 0.9782 1.0202
3.1.3 Investments in subsidiaries and other investments Investments in subsidiaries and other investments are carried at cost less accumulated impairment losses.
3.1.4 Financial assetsBonds are measured at the lower of amortized cost or market value. Financial assets that are due within one year are presented within current assets.
Loans are carried at nominal value less accumulated impairment losses.
3.1.5 Derivative financial instrumentsDerivatives are recognized initially at cost. Subsequent to initial recognition, derivatives are measured at market value.
3.1.6 Treasury sharesAt initial recognition treasury shares are recognized at cost as a negative position within equity. Gains or losses that occur upon a subsequent sale are recognized as financial income or expense.
3.1.7 Revenue recognitionRevenues for services are recognized when they are invoiced. This occurs when they have been provided.
3.2 Disclosure on balance sheet and income statement items and other information3.2.1 Number of full-time equivalentsThe annual average number of fulltime equivalents in the reporting year was nil (2016: nil).
3.2.2 Cash and cash equivalents
CHFmillion 31/12/2017 31/12/2016
Due from shareholders 348.9 408.9
Cashandcashequivalents 348.9 408.9
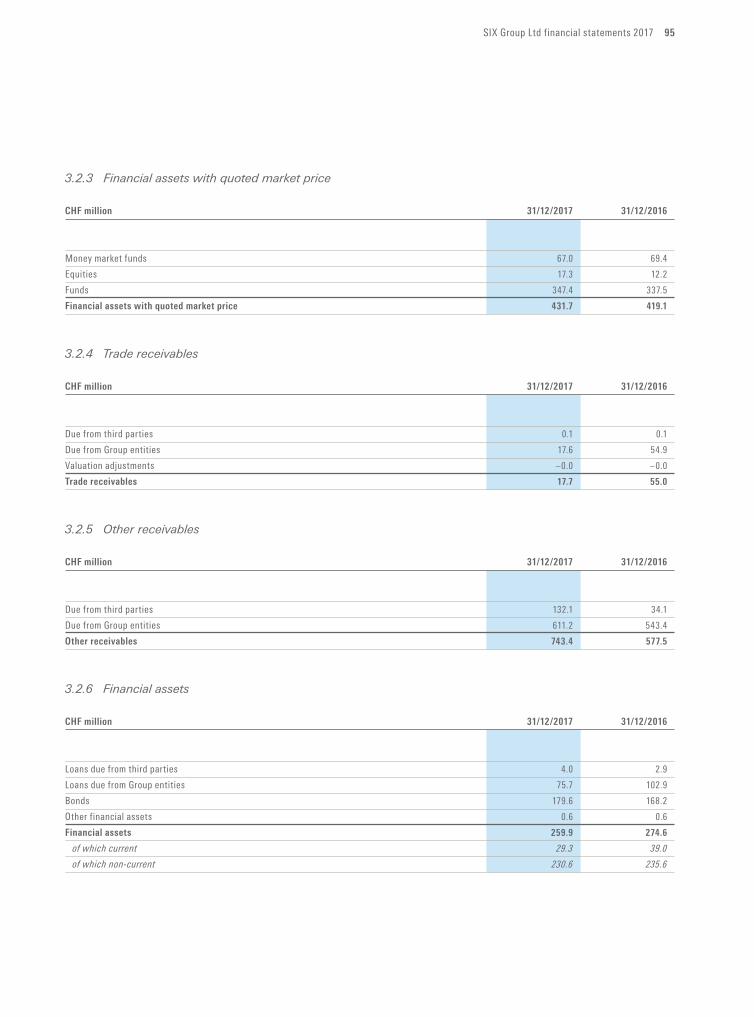
SIX Group Ltd financial statements 2017 95
3.2.3 Financial assets with quoted market price
CHFmillion 31/12/2017 31/12/2016
Money market funds 67.0 69.4
Equities 17.3 12.2
Funds 347.4 337.5
Financialassetswithquotedmarketprice 431.7 419.1
3.2.4 Trade receivables
CHFmillion 31/12/2017 31/12/2016
Due from third parties 0.1 0.1
Due from Group entities 17.6 54.9
Valuation adjustments –0.0 –0.0
Tradereceivables 17.7 55.0
3.2.5 Other receivables
CHFmillion 31/12/2017 31/12/2016
Due from third parties 132.1 34.1
Due from Group entities 611.2 543.4
Otherreceivables 743.4 577.5
3.2.6 Financial assets
CHFmillion 31/12/2017 31/12/2016
Loans due from third parties 4.0 2.9
Loans due from Group entities 75.7 102.9
Bonds 179.6 168.2
Other financial assets 0.6 0.6
Financial assets 259.9 274.6
of which current 29.3 39.0
of which non-current 230.6 235.6
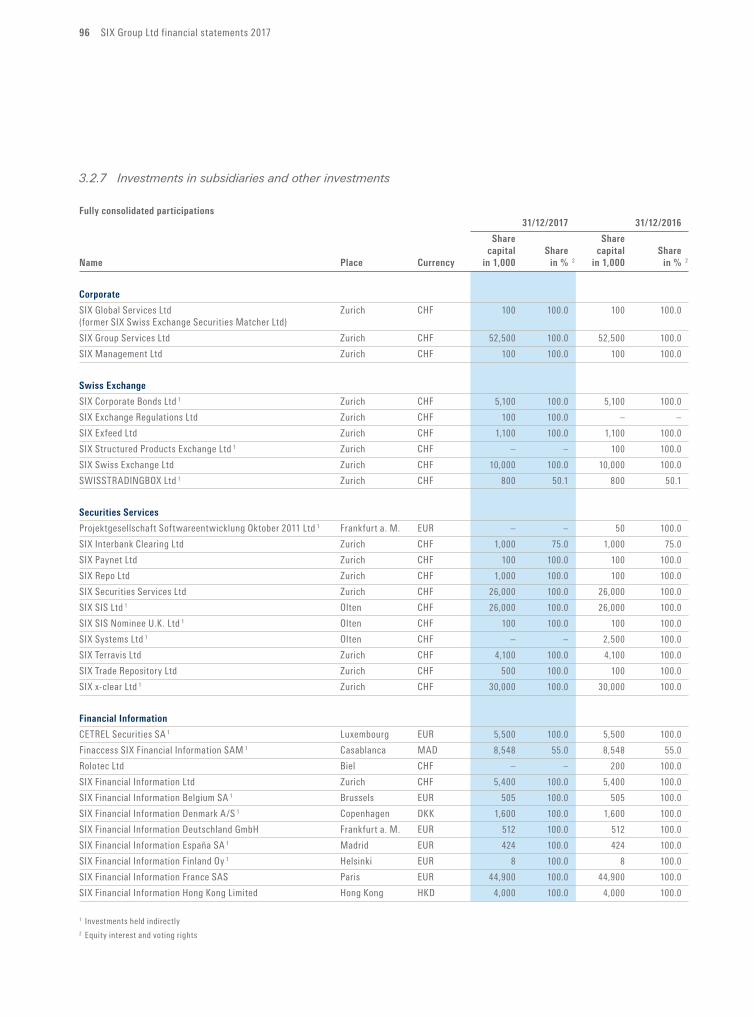
96 SIX Group Ltd financial statements 2017
3.2.7 Investments in subsidiaries and other investments
Fully consolidated participations
31/12/2017 31/12/2016
Share Share
capital Share capital Share
Name Place Currency in1,000 in% 2 in1,000 in% 2
Corporate
SIX Global Services Ltd Zurich CHF 100 100.0 100 100.0
(former SIX Swiss Exchange Securities Matcher Ltd)
SIX Group Services Ltd Zurich CHF 52,500 100.0 52,500 100.0
SIX Management Ltd Zurich CHF 100 100.0 100 100.0
SwissExchange
SIX Corporate Bonds Ltd 1 Zurich CHF 5,100 100.0 5,100 100.0
SIX Exchange Regulations Ltd Zurich CHF 100 100.0 – –
SIX Exfeed Ltd Zurich CHF 1,100 100.0 1,100 100.0
SIX Structured Products Exchange Ltd 1 Zurich CHF – – 100 100.0
SIX Swiss Exchange Ltd Zurich CHF 10,000 100.0 10,000 100.0
SWISSTRADINGBOX Ltd 1 Zurich CHF 800 50.1 800 50.1
SecuritiesServices
Projektgesellschaft Softwareentwicklung Oktober 2011 Ltd 1 Frankfurt a. M. EUR – – 50 100.0
SIX Interbank Clearing Ltd Zurich CHF 1,000 75.0 1,000 75.0
SIX Paynet Ltd Zurich CHF 100 100.0 100 100.0
SIX Repo Ltd Zurich CHF 1,000 100.0 100 100.0
SIX Securities Services Ltd Zurich CHF 26,000 100.0 26,000 100.0
SIX SIS Ltd 1 Olten CHF 26,000 100.0 26,000 100.0
SIX SIS Nominee U.K. Ltd 1 Olten CHF 100 100.0 100 100.0
SIX Systems Ltd 1 Olten CHF – – 2,500 100.0
SIX Terravis Ltd Zurich CHF 4,100 100.0 4,100 100.0
SIX Trade Repository Ltd Zurich CHF 500 100.0 100 100.0
SIX x-clear Ltd 1 Zurich CHF 30,000 100.0 30,000 100.0
FinancialInformation
CETREL Securities SA 1 Luxembourg EUR 5,500 100.0 5,500 100.0
Finaccess SIX Financial Information SAM 1 Casablanca MAD 8,548 55.0 8,548 55.0
Rolotec Ltd Biel CHF – – 200 100.0
SIX Financial Information Ltd Zurich CHF 5,400 100.0 5,400 100.0
SIX Financial Information Belgium SA 1 Brussels EUR 505 100.0 505 100.0
SIX Financial Information Denmark A/S 1 Copenhagen DKK 1,600 100.0 1,600 100.0
SIX Financial Information Deutschland GmbH Frankfurt a. M. EUR 512 100.0 512 100.0
SIX Financial Information España SA 1 Madrid EUR 424 100.0 424 100.0
SIX Financial Information Finland Oy 1 Helsinki EUR 8 100.0 8 100.0
SIX Financial Information France SAS Paris EUR 44,900 100.0 44,900 100.0
SIX Financial Information Hong Kong Limited Hong Kong HKD 4,000 100.0 4,000 100.0
1 Investments held indirectly2 Equity interest and voting rights
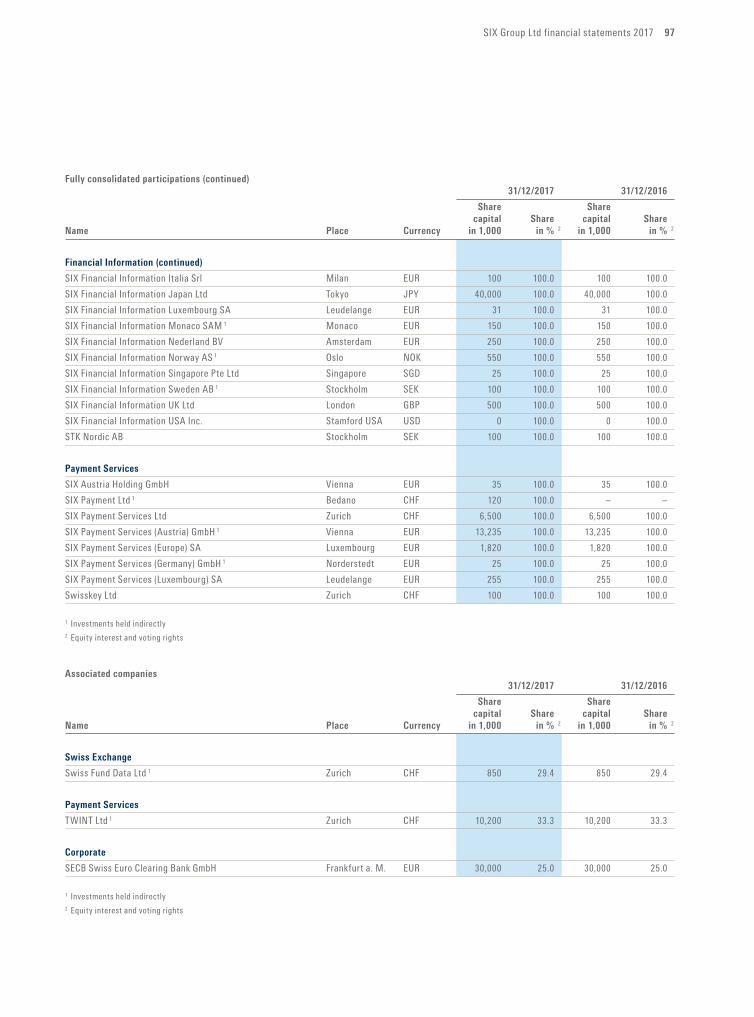
SIX Group Ltd financial statements 2017 97
Fullyconsolidatedparticipations(continued)
31/12/2017 31/12/2016
Share Share
capital Share capital Share
Name Place Currency in1,000 in% 2 in1,000 in% 2
FinancialInformation(continued)
SIX Financial Information Italia Srl Milan EUR 100 100.0 100 100.0
SIX Financial Information Japan Ltd Tokyo JPY 40,000 100.0 40,000 100.0
SIX Financial Information Luxembourg SA Leudelange EUR 31 100.0 31 100.0
SIX Financial Information Monaco SAM 1 Monaco EUR 150 100.0 150 100.0
SIX Financial Information Nederland BV Amsterdam EUR 250 100.0 250 100.0
SIX Financial Information Norway AS 1 Oslo NOK 550 100.0 550 100.0
SIX Financial Information Singapore Pte Ltd Singapore SGD 25 100.0 25 100.0
SIX Financial Information Sweden AB 1 Stockholm SEK 100 100.0 100 100.0
SIX Financial Information UK Ltd London GBP 500 100.0 500 100.0
SIX Financial Information USA Inc. Stamford USA USD 0 100.0 0 100.0
STK Nordic AB Stockholm SEK 100 100.0 100 100.0
PaymentServices
SIX Austria Holding GmbH Vienna EUR 35 100.0 35 100.0
SIX Payment Ltd 1 Bedano CHF 120 100.0 – –
SIX Payment Services Ltd Zurich CHF 6,500 100.0 6,500 100.0
SIX Payment Services (Austria) GmbH 1 Vienna EUR 13,235 100.0 13,235 100.0
SIX Payment Services (Europe) SA Luxembourg EUR 1,820 100.0 1,820 100.0
SIX Payment Services (Germany) GmbH 1 Norderstedt EUR 25 100.0 25 100.0
SIX Payment Services (Luxembourg) SA Leudelange EUR 255 100.0 255 100.0
Swisskey Ltd Zurich CHF 100 100.0 100 100.0
1 Investments held indirectly2 Equity interest and voting rights
Associatedcompanies
31/12/2017 31/12/2016
Share Share
capital Share capital Share
Name Place Currency in1,000 in% 2 in1,000 in% 2
SwissExchange
Swiss Fund Data Ltd 1 Zurich CHF 850 29.4 850 29.4
PaymentServices
TWINT Ltd 1 Zurich CHF 10,200 33.3 10,200 33.3
Corporate
SECB Swiss Euro Clearing Bank GmbH Frankfurt a. M. EUR 30,000 25.0 30,000 25.0
1 Investments held indirectly2 Equity interest and voting rights
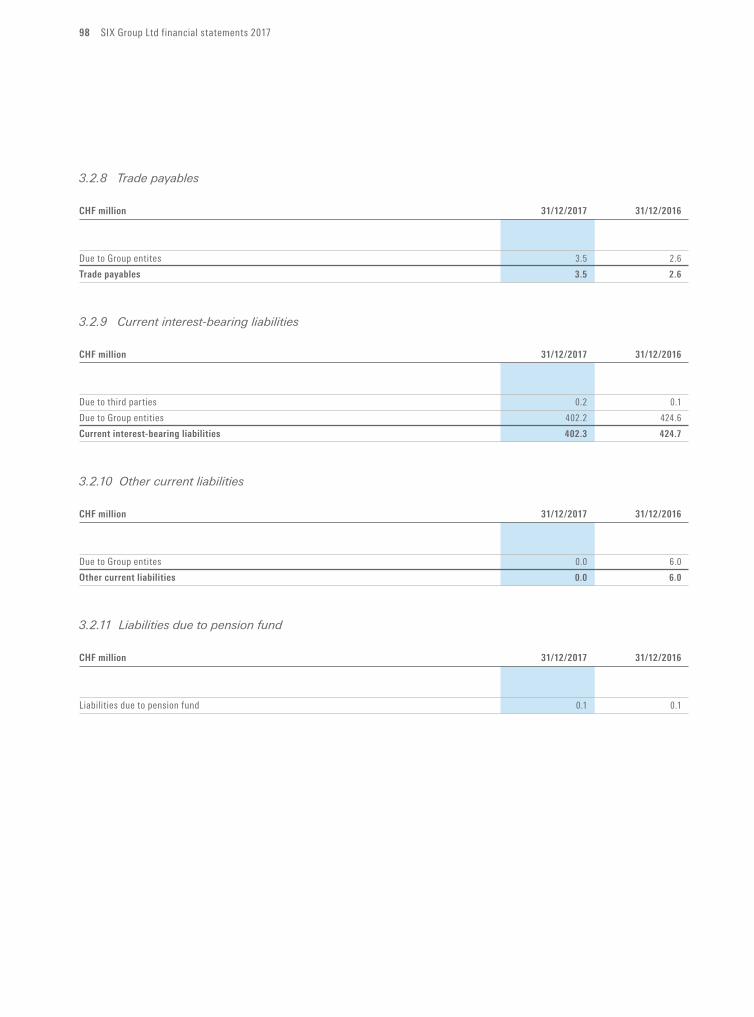
98 SIX Group Ltd financial statements 2017
3.2.8 Trade payables
CHFmillion 31/12/2017 31/12/2016
Due to Group entites 3.5 2.6
Tradepayables 3.5 2.6
3.2.9 Current interest-bearing liabilities
CHFmillion 31/12/2017 31/12/2016
Due to third parties 0.2 0.1
Due to Group entities 402.2 424.6
Currentinterest-bearingliabilities 402.3 424.7
3.2.10 Other current liabilities
CHFmillion 31/12/2017 31/12/2016
Due to Group entites 0.0 6.0
Othercurrentliabilities 0.0 6.0
3.2.11 Liabilities due to pension fund
CHFmillion 31/12/2017 31/12/2016
Liabilities due to pension fund 0.1 0.1
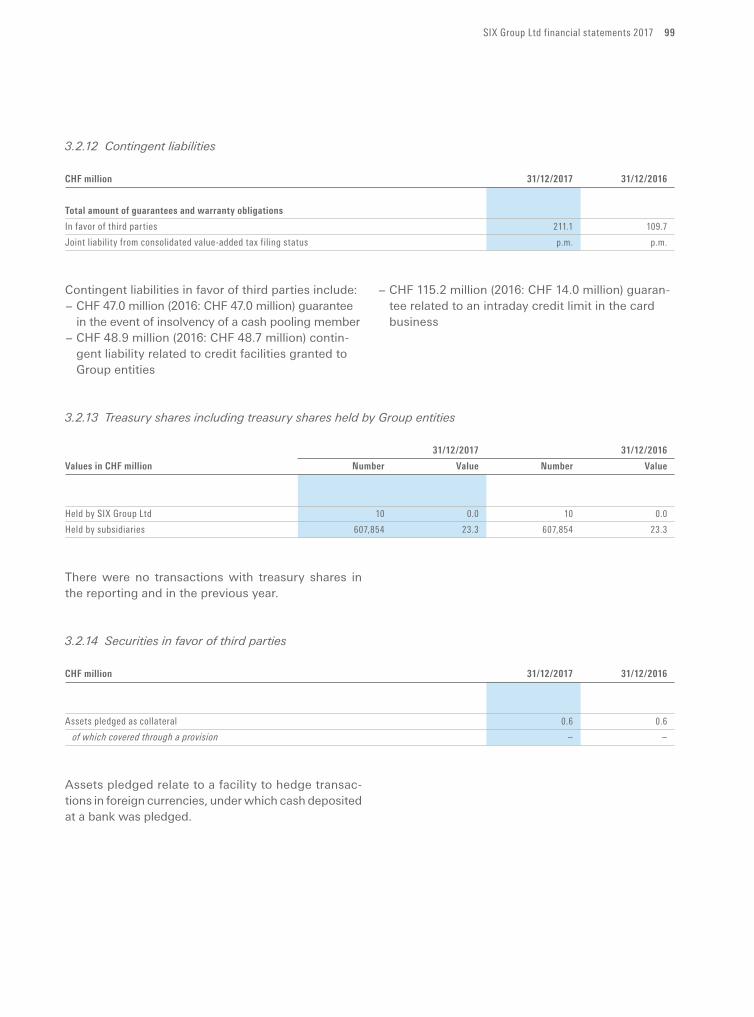
SIX Group Ltd financial statements 2017 99
3.2.12 Contingent liabilities
CHFmillion 31/12/2017 31/12/2016
Totalamountofguaranteesandwarrantyobligations
In favor of third parties 211.1 109.7
Joint liability from consolidated value-added tax filing status p.m. p.m.
Contingent liabilities in favor of third parties include:− CHF 47.0 million (2016: CHF 47.0 million) guarantee
in the event of insolvency of a cash pooling member− CHF 48.9 million (2016: CHF 48.7 million) contin
gent liability related to credit facilities granted to Group entities
− CHF 115.2 million (2016: CHF 14.0 million) guarantee related to an intraday credit limit in the card business
3.2.13 Treasury shares including treasury shares held by Group entities
31/12/2017 31/12/2016
ValuesinCHFmillion Number Value Number Value
Held by SIX Group Ltd 10 0.0 10 0.0
Held by subsidiaries 607,854 23.3 607,854 23.3
There were no transactions with treasury shares in the reporting and in the previous year.
3.2.14 Securities in favor of third parties
CHFmillion 31/12/2017 31/12/2016
Assets pledged as collateral 0.6 0.6
of which covered through a provision – –
Assets pledged relate to a facility to hedge transactions in foreign currencies, under which cash deposited at a bank was pledged.
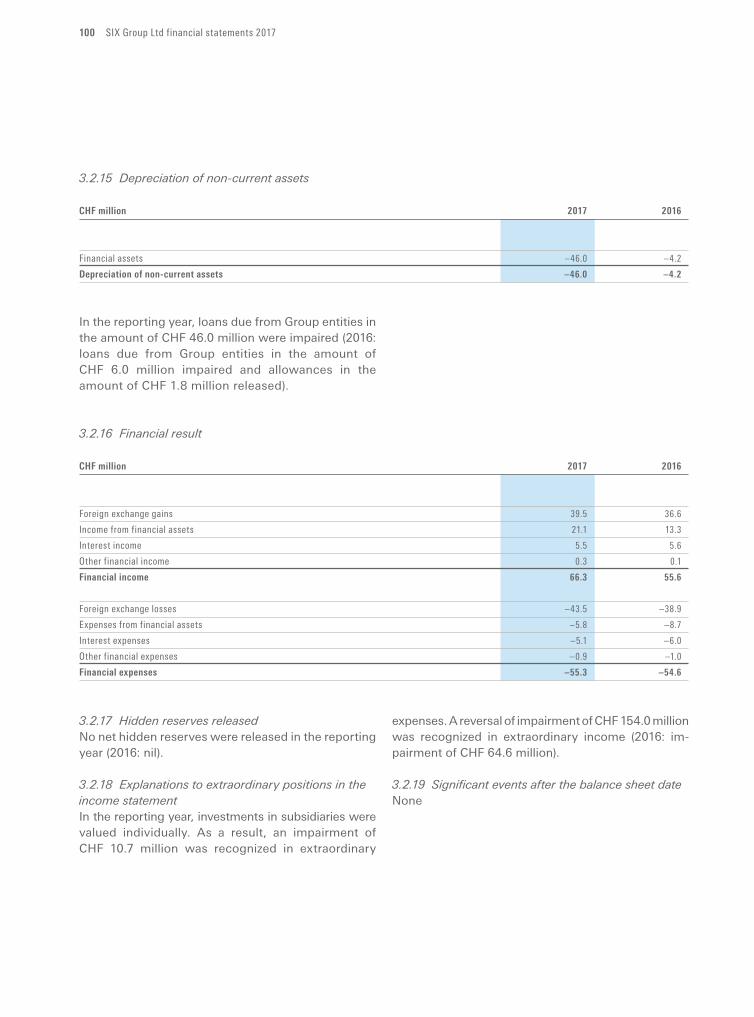
100 SIX Group Ltd financial statements 2017
3.2.15 Depreciation of non-current assets
CHFmillion 2017 2016
Financial assets –46.0 –4.2
Depreciationofnon-currentassets –46.0 –4.2
In the reporting year, loans due from Group entities in the amount of CHF 46.0 million were impaired (2016: loans due from Group entities in the amount of CHF 6.0 million impaired and allowances in the amount of CHF 1.8 million released).
3.2.16 Financial result
CHFmillion 2017 2016
Foreign exchange gains 39.5 36.6
Income from financial assets 21.1 13.3
Interest income 5.5 5.6
Other financial income 0.3 0.1
Financialincome 66.3 55.6
Foreign exchange losses –43.5 –38.9
Expenses from financial assets –5.8 –8.7
Interest expenses –5.1 –6.0
Other financial expenses –0.9 –1.0
Financialexpenses –55.3 –54.6
3.2.17 Hidden reserves releasedNo net hidden reserves were released in the reporting year (2016: nil).
3.2.18 Explanations to extraordinary positions in the income statementIn the reporting year, investments in subsidiaries were valued individually. As a result, an impairment of CHF 10.7 million was recognized in extraordinary
expenses. A reversal of impairment of CHF 154.0 million was recognized in extraordinary income (2016: impairment of CHF 64.6 million).
3.2.19 Significant events after the balance sheet dateNone
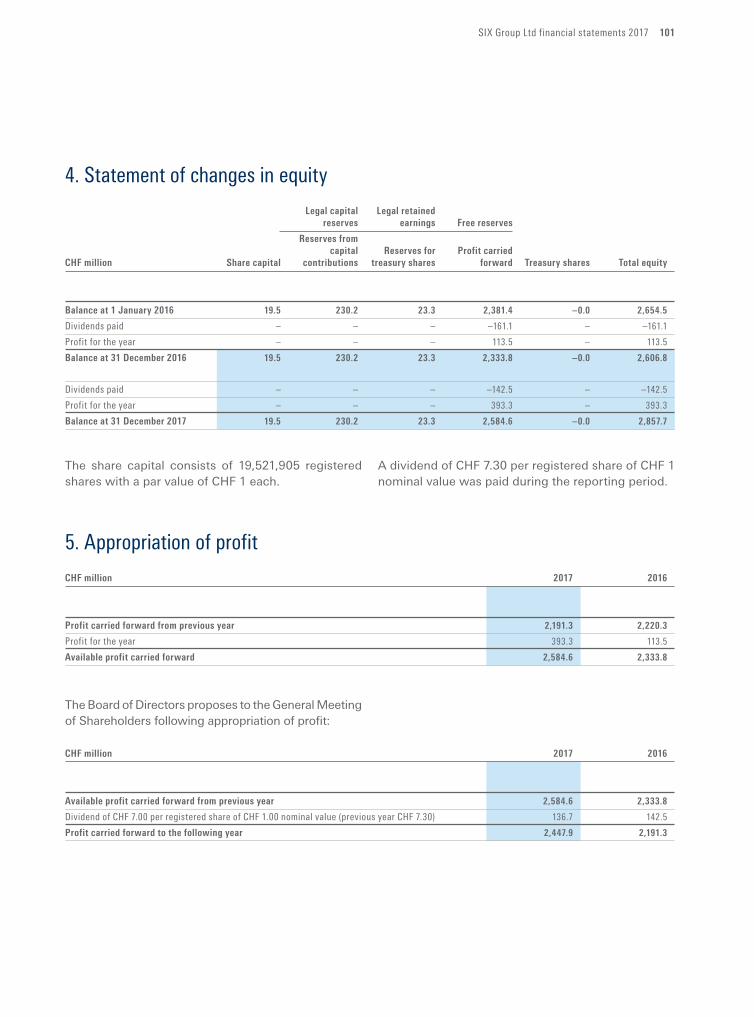
SIX Group Ltd financial statements 2017 101
4. Statement of changes in equity Legalcapital Legalretained
reserves earnings Freereserves
Reservesfrom
capital Reservesfor Profitcarried
CHFmillion Sharecapital contributions treasuryshares forward Treasuryshares Totalequity
Balanceat1January2016 19.5 230.2 23.3 2,381.4 –0.0 2,654.5
Dividends paid – – – –161.1 – –161.1
Profit for the year – – – 113.5 – 113.5
Balanceat31December2016 19.5 230.2 23.3 2,333.8 –0.0 2,606.8
Dividends paid – – – –142.5 – –142.5
Profit for the year – – – 393.3 – 393.3
Balanceat31December2017 19.5 230.2 23.3 2,584.6 –0.0 2,857.7
The share capital consists of 19,521,905 registered shares with a par value of CHF 1 each.
A dividend of CHF 7.30 per registered share of CHF 1 nominal value was paid during the reporting period.
5. Appropriation of profit
CHFmillion 2017 2016
Profitcarriedforwardfrompreviousyear 2,191.3 2,220.3
Profit for the year 393.3 113.5
Availableprofitcarriedforward 2,584.6 2,333.8
The Board of Directors proposes to the General Meeting of Shareholders following appropriation of profit:
CHFmillion 2017 2016
Availableprofitcarriedforwardfrompreviousyear 2,584.6 2,333.8
Dividend of CHF 7.00 per registered share of CHF 1.00 nominal value (previous year CHF 7.30) 136.7 142.5
Profitcarriedforwardtothefollowingyear 2,447.9 2,191.3
102 SIX Group Ltd financial statements 2017
Report of the statutory auditor on the financial statements
To the General Meeting of SIX Group Ltd, ZurichZurich, 15 March 2018
As statutory auditor, we have audited the accompanying financial statements of SIX Group Ltd., which comprise the balance sheet, income statement, notes and statement of changes in equity (pages 92 to 101), for the year ended 31 December 2017.
Board of Directors’ responsibilityThe Board of Directors is responsible for the preparation of the financial statements in accordance with the requirements of Swiss law and the company’s articles of incorporation. This responsibility includes designing, implementing and maintaining an internal control system relevant to the preparation of financial statements that are free from material misstatement, whether due to fraud or error. The Board of Directors is further responsible for selecting and applying appropriate accounting policies and making accounting estimates that are reasonable in the circumstances.
Auditor’s responsibilityOur responsibility is to express an opinion on these financial statements based on our audit. We conducted our audit in accordance with Swiss law and Swiss Auditing Standards. Those standards require that we plan and perform the audit to obtain reasonable assurance whether the financial statements are free from material misstatement.
An audit involves performing procedures to obtain audit evidence about the amounts and disclosures in the financial statements. The procedures selected depend on the auditor’s judgment, including the assessment of the risks of material misstatement of the financial statements, whether due to fraud or error. In making those risk assessments, the auditor considers the internal control system relevant to the entity’s preparation of the financial statements in order to design audit procedures that are appropriate in the circumstances, but not for the purpose of expressing an opinion on the effectiveness of the entity’s internal control system. An audit also includes evaluating the appropriateness of the accounting policies used and the reasonableness of accounting estimates made, as well as evaluating the overall presentation of the financial statements. We believe that the audit evidence we have obtained is sufficient and appropriate to provide a basis for our audit opinion.
OpinionIn our opinion, the financial statements for the year ended 31 December 2017 comply with Swiss law and the company’s articles of incorporation.
SIX Group Ltd financial statements 2017 103
Report on other legal requirementsWe confirm that we meet the legal requirements on licensing according to the Auditor Oversight Act (AOA) and independence (article 728 CO) and that there are no circumstances incompatible with our independence.
In accordance with article 728a paragraph 1 item 3 CO and Swiss Auditing Standard 890, we confirm that an internal control system exists, which has been designed for the preparation of financial statements according to the instructions of the Board of Directors.
We further confirm that the proposed appropriation of available earnings complies with Swiss law and the company’s articles of incorporation. We recommend that the financial statements submitted to you be approved.
Ernst & Young Ltd
Jan MarxfeldLicensed audit expert(Auditor in charge)
René HunzikerLicensed audit expert
six-group.com
© S
IX G
roup
Ltd
201
8