financial statements april 30, 2017 - imf · notes to the financial statements 53 schedule 1 ......
TRANSCRIPT

Financial Statements April 30, 2017

(i)
IMF Financial Statements 2017
General Department
Report of Independent Auditors 3
Statements of financial position 5
Statements of comprehensive income 6
Statements of changes in reserves, resources, and retained earnings 6
Statements of cash flows 7
Notes to the financial statements 8
Schedule 1—Quotas, IMF’s holdings of currencies, reserve tranche positions, and outstanding credit
and loans 29
Schedule 2—Financial resources and liquidity position in the General Resources Account 34
Schedule 3—Status of arrangements in the General Resources Account 35
Schedule 4—Schedule of borrowings in the General Resources Account 36
SDR Department
Report of Independent Auditors 37
Statements of financial position 39
Statements of comprehensive income 39
Notes to the financial statements 40
Schedule 1—Statements of changes in SDR holdings 43
Schedule 2—Allocations and holdings of participants 44
Concessional Lending and Debt Relief Trusts
Report of Independent Auditors 48
Statements of financial position 51
Statements of comprehensive income and changes in resources 51
Statements of cash flows 52
Notes to the financial statements 53
Schedule 1—PRG Trust: Schedule of outstanding loans 62
Schedule 2—PRG Trust: Status of arrangements 64
Schedule 3—PRG Trust – Loan Accounts: Resources available under borrowing and note purchase agreements 65
Schedule 4—PRG, PRG-HIPC, and CCR Trusts: Cumulative contributions 66
Administered Accounts
Report of Independent Auditors 71
Statements of financial position 74
Statements of comprehensive income and changes in resources 76
Statements of cash flows 78
(ii)
Notes to the financial statements 80
Schedule 1—Post-SCA-2, SCA-1/Deferred Charges, Windfall Gold Sales Profits, Remaining Windfall Gold Sales Profits, Post-EPCA/ENDA, and Post-MDRI-II: Balances, contributions, interest earned, and transfers 86
Schedule 2—Japan, Framework—TA, and Framework—SFA: Cumulative contributions and disbursements 87
pwc Report of Independent Auditors
To the Board of Governors of the International Monetary Fund
We have audited the accompanying financial statements of the General Department of the International Monetary Fund (the "Department"), which comprise the statements of financial position as of April 30, 2017 and 2016, and the related statements of comprehensive income, of changes in reserves, resources, and retained earnings and of cash flows for the years then ended.
We are independent of the Department in accordance with the ethical requirements that are relevant to our audit of the financial statements in the United States of America, together with the International Ethics Standards Board for Accountants' Code of Ethics for Professional Accountants, and we have fulfilled our other ethical responsibilities in accordance with these requirements, respectively.
Responsibilities of Management and Those Charged With Governance for the Financial Statements
Management is responsible for the preparation and fair presentation of the financial statements in accordance with International Financial Reporting Standards as issued by the International Accounting Standards Board; this includes the design, implementation, and maintenance of internal control relevant to the preparation and fair presentation of financial statements that are free from material misstatement, whether due to fraud or error.
In preparing the financial statements, management is responsible for assessing the Department's ability to continue as a going concern, disclosing, as applicable, matters related to going concern and using the going concern basis of accounting, unless management either intends to liquidate the Department or to cease operations or has no realistic alternative but to do so.
Those charged with governance are responsible for overseeing the Department's financial reporting process.
Auditors' Responsibility
Our responsibility is to express an opinion on the financial statements based on our audits. We conducted our audits in accordance with auditing standards generally accepted in the United States of America and International Standards on Auditing. Those standards require that we plan and perform the audit to obtain reasonable assurance about whether the financial statements are free from material misstatement, whether due to fraud or error. Reasonable assurance is a high level of assurance but is not a guarantee that an audit will always detect a material misstatement when it exists. Misstatements can arise from fraud or error and are considered material if, individually or in the aggregate, they could reasonably be expected to influence the economic decisions of users taken on the basis of the financial statements.
An audit involves performing procedures to obtain audit evidence about the amounts and disclosures in the financial statements. The procedures selected depend on our judgment, including the assessment of the risks of material misstatement of the financial statements, whether due to fraud or error. We design audit procedures responsive to those risks and obtain audit evidence that is sufficient and appropriate to provide a basis for our opinion. The risk of not detecting a material misstatement resulting from fraud is higher than for one resulting from error because fraud may involve collusion, forgery, intentional omissions, misrepresentations, or the override of internal control.
In making those risk assessments, we consider internal control relevant to the Department's preparation and fair presentation of the financial statements in order to design audit procedures that are appropriate in the circumstances but not for the purpose of expressing an opinion on the effectiveness of the Department's internal control. Accordingly, we express no such opinion. An audit also includes evaluating the appropriateness of accounting policies used and the reasonableness of significant
• PricewaterhouseCoopers LLP, 180o Tysons Boulevard, McLean, VA 22102-4261 T: (703) 918 3000, F: (703) 918 3100, www.pwc.com/us

June 23, 2017
LL-P
pwc accounting estimates made by management, as well as evaluating the overall presentation, structure, and content of the financial statements, including disclosures, and whether the financial statements represent the underlying transactions and events in a manner that achieves fair presentation.
As part of an audit:
• We exercise professional judgment and maintain professional skepticism throughout the audit. • We conclude on the appropriateness of management's use of the going concern basis of
accounting and based on the audit evidence obtained, whether a material uncertainty exists related to events or conditions that may cast significant doubt on the Department's ability to continue as a going concern. If we conclude that a material uncertainty exists, we are required to draw attention in our report to the related disclosures in the financial statements or, if such disclosures are inadequate, to modify our opinion. Our conclusions are based on the audit evidence obtained up to the date of our report. However, future events or conditions may cause the Department to cease to continue as a going concern.
• We communicate with those charged with governance regarding, among other matters, the planned scope and timing of the audit and significant audit findings, including any significant deficiencies or material weaknesses in internal control that we identify during our audit.
We believe that the audit evidence we have obtained is sufficient and appropriate to provide a basis for our audit opinion.
Opinion
In our opinion, the financial statements referred to above present fairly, in all material respects, the financial position of the General Department of the International Monetary Fund as of April 30, 2017 and 2016, and the results of its operations and its cash flows for the years then ended in accordance with International Financial Reporting Standards as issued by the International Accounting Standards Board.
Other Matter
Our audit was conducted for the purpose of forming an opinion on the financial statements taken as a whole. The supplemental schedules listed on pages 29 to 36 are presented for purposes of additional analysis and are not a required part of the financial statements. The information is the responsibility of management and was derived from and relates directly to the underlying accounting and other records used to prepare the financial statements. The information has been subjected to the auditing procedures applied in the audit of the financial statements and certain additional procedures, including comparing and reconciling such information directly to the underlying accounting and other records used to prepare the financial statements or to the financial statements themselves and other additional procedures, in accordance with auditing standards generally accepted in the United States of America. We also subjected the information to the applicable procedures required by the International Standards on Auditing. In our opinion, the information is fairly stated, in all material respects, in relation to the financial statements taken as a whole.
5
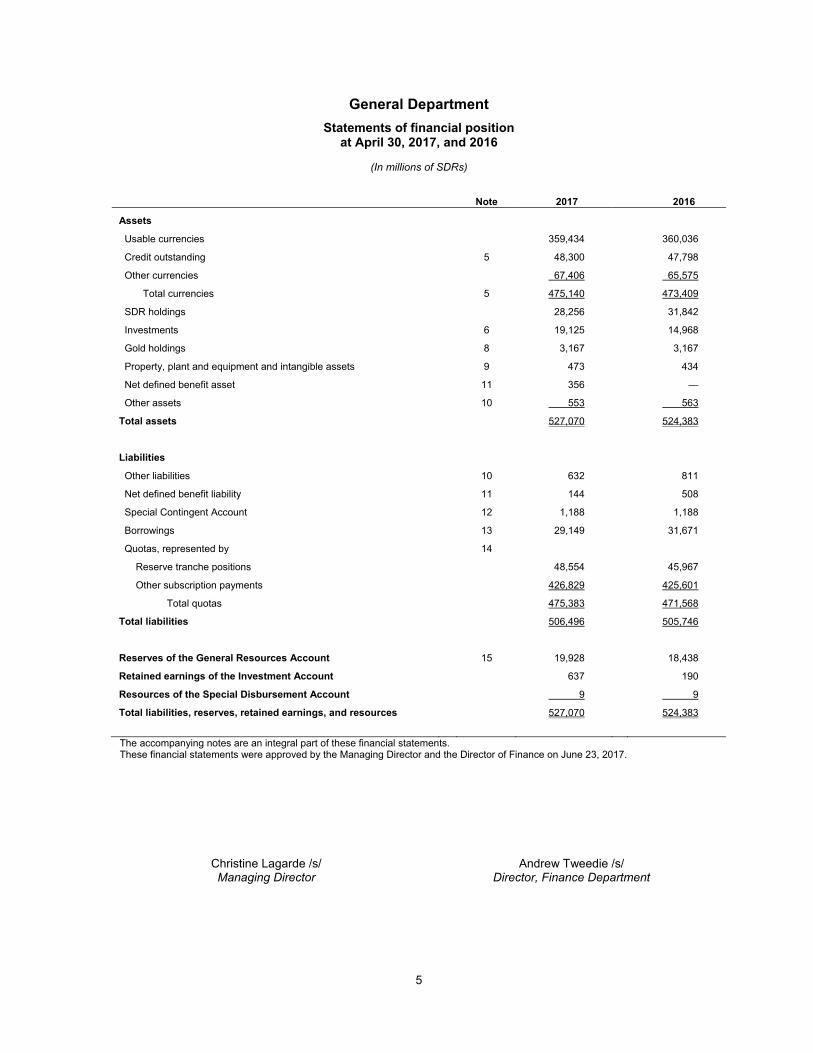
General Department
Statements of financial position at April 30, 2017, and 2016
(In millions of SDRs)
Note 2017
2016
Assets
Usable currencies
359,434
360,036
Credit outstanding
5 48,300
47,798
Other currencies
67,406
65,575
Total currencies
5 475,140
473,409
SDR holdings
28,256
31,842
Investments
6 19,125
14,968
Gold holdings
8 3,167
3,167
Property, plant and equipment and intangible assets
9 473
434
Net defined benefit asset
11 356
—
Other assets
10 553
563
Total assets 527,070 524,383
Liabilities
Other liabilities
10 632
811
Net defined benefit liability
11 144
508
Special Contingent Account
12 1,188
1,188
Borrowings
13 29,149
31,671
Quotas, represented by
14
Reserve tranche positions
48,554
45,967
Other subscription payments
426,829
425,601
Total quotas
475,383
471,568
Total liabilities
506,496
505,746
Reserves of the General Resources Account
15 19,928
18,438
Retained earnings of the Investment Account
637
190
Resources of the Special Disbursement Account
9
9
Total liabilities, reserves, retained earnings, and resources
527,070
524,383
The accompanying notes are an integral part of these financial statements. These financial statements were approved by the Managing Director and the Director of Finance on June 23, 2017.
Christine Lagarde /s/ Managing Director
Andrew Tweedie /s/ Director, Finance Department

6
General Department
Statements of comprehensive income for the financial years ended April 30, 2017, and 2016
(In millions of SDRs)
Note 2017 2016
Operational income
Charges 16 1,157 1,327)
Interest on SDR holdings 54 9)
Net income/(loss) from investments 6 527 (20)
Service charges and commitment fees 16 363 120
2,101 1,436 Operational expenses
Remuneration 17 75 12
Interest expense on borrowings 13 55 18
Administrative expenses 18 1,001 951
1,131 981
Net operational income 970 455 Other comprehensive income
Remeasurement of net defined benefit asset/liability 11 967 543)
Total comprehensive income 1,937 998)
Total comprehensive income of the General Department comprises:
Total comprehensive income of the General Resources Account 1,410 1,018)
Total comprehensive income/(loss) of the Investment Account 527 (20)
Total comprehensive loss of the Special Disbursement Account — —
1,937 998)
The accompanying notes are an integral part of these financial statements.
Statements of changes in reserves, resources, and retained earnings for the financial years ended April 30, 2017, and 2016
(In millions of SDRs)
General Resources Account Investment Account retained earnings
Special Disbursement
Account resources Note
Special Reserve
General Reserve
Total reserves
Balance at April 30, 2015 8,373 9,029 17,402 228. 9
Net operational income/(loss) 238 237 475 (20) —
Other comprehensive income 271 272 543 — —
Total comprehensive income/(loss) 15 509 509 1,018 (20) —
Transfer of Investment Account income 15 9 9 18 (18) —
Balance at April 30, 2016 8,891 9,547 18,438 190) 9
Net operational income 221 222 443 527) —
Other comprehensive income 484 483 967 —) —
Total comprehensive income 15 705 705 1,410 527) —
Transfer of Investment Account income 15 40 40 80 (80) —
Balance at April 30, 2017 9,636 10,292 19,928 637) 9
The accompanying notes are an integral part of these financial statements.

7
General Department
Statements of cash flows for the financial years ended April 30, 2017, and 2016
(In millions of SDRs)
2017 2016
Usable currencies and SDRs from operating activities
Total comprehensive income 1,937) 998)
Adjustments to reconcile total comprehensive income to usable currencies and SDRs generated by operations
Depreciation and amortization 28) 27) Charges (1,157) (1,327) Interest on SDR holdings (54) (9) Net (income)/loss from investments (527) 20) Remuneration 75) 12) Interest expense on borrowings 55) 18) Loss on the disposal of property, plant and equipment 5) — Changes in other assets and liabilities Changes in other assets (5) 4)
Changes in other liabilities (149) 107) Changes in the net defined benefit asset/liability (720) (321) Usable currencies and SDRs from credit to members Purchases, including reserve tranche purchases (6,191) (7,699) Repurchases 5,550) 12,115) Interest received and paid Charges 1,144) 1,473) Interest on SDR holdings 32) 7) Remuneration (42) (10) Interest on borrowings (33) (19) Net usable currencies and SDRs (used in)/provided by operating activities (52) 5,396) Usable currencies and SDRs from investing activities
Acquisition of property, plant and equipment and intangible assets (72) (81) (Acquisition)/disposal of investments (3,665) 84)
Net usable currencies and SDRs (used in)/provided by investing activities (3,737) 3) Usable currencies and SDRs from financing activities Borrowings 1,099) 3,402) Repayments of borrowings (3,621) (8,510) Quota subscription payments in SDRs and usable currencies 2,123) 208,159) Net usable currencies and SDRs (used in)/provided by financing activities (399) 203,051) Net (decrease)/increase in usable currencies and SDRs (4,188) 208,450) Usable currencies and SDRs, beginning of year 391,878)
183,428)
Usable currencies and SDRs, end of year 387,690) 391,878)
The accompanying notes are an integral part of these financial statements.

General Department
Notes to the financial statements for the financial years ended April 30, 2017, and 2016
8
1. Nature of operations The International Monetary Fund (“IMF” or “the Fund”) is an international organization with 189 member countries. It was established, pursuant to its Articles of Agreement, to promote international monetary cooperation and exchange stability and maintain orderly exchange arrangements among members; to facilitate the expansion and balanced growth of international trade and contribute thereby to the promotion and maintenance of high levels of employment; to assist in the establishment of a multilateral system of payments in respect of current transactions between members and in the elimination of foreign exchange restrictions, which hamper the growth of world trade; and to provide temporary financial assistance under adequate safeguards to member countries to assist in solving their balance of payments problems. It is headquartered in Washington, DC, U.S.A. The IMF conducts its operations and transactions through the General Department. The General Department comprises three accounts: (i) the General Resources Account (GRA); (ii) the Investment Account (IA); and (iii) the Special Disbursement Account (SDA).
1.1 General Resources Account The financial operations of the IMF with its members are primarily conducted through the GRA. The assets and liabilities in the GRA reflect the payment of member quota subscriptions, use and repayment of IMF credit, collection of charges from borrowers, payment of remuneration on creditor positions and interest to lenders, and other operations. A core responsibility of the IMF is to provide financial assistance to member countries experiencing actual or potential balance of payments problems. Upon the request of a member country, IMF resources are made available either under a lending arrangement or in the form of outright purchases (disbursements). An arrangement is a decision by the IMF Executive Board (Executive Board) that gives a member the assurance that the GRA stands ready to provide resources during a specified period and up to a specified amount, in accordance with the terms of the lending instrument. The Stand-By Arrangement (SBA), the core lending instrument in the GRA, is designed for members with medium-term balance of payments problems. The Extended Fund Facility (EFF) is an instrument for members with longer-term balance of payments problems that reflect structural impediments requiring fundamental economic reform. Resources under the SBA and the EFF are made available in phased installments as the member implements economic policies and measures specified under the arrangement. The Flexible Credit Line (FCL) is available for members with very strong fundamentals, policies, and track records of policy implementation and is intended for crisis prevention and resolution. The Precautionary Liquidity Line (PLL) is available for members with sound economic fundamentals but with some remaining vulnerabilities that preclude them from using the FCL. The FCL and the PLL provide one-time up-front access to IMF resources.
The lending instrument for outright purchases (disbursements) is the Rapid Financing Instrument (RFI), which is used by members that face an urgent balance of payments need without the need for a full-fledged program.
1.2 Investment Account The IA holds resources transferred from the GRA, which are invested to broaden the IMF’s income base. The Executive Board adopted the Rules and Regulations of the IA, which provide the framework for the implementation of the expanded investment authority authorized under the Fifth Amendment of the Articles of Agreement. The IA comprises two principal subaccounts: the Fixed-Income Subaccount and the Endowment Subaccount. The Fixed-Income Subaccount holds resources transferred from the GRA that are not related to profits from gold sales. With a view to generating income while protecting the Fund’s balance sheet, the investment objective of the Fixed-Income Subaccount is to produce returns in Special Drawing Rights (SDR) terms in excess of the SDR interest rate (see Note 2.2) over time while minimizing the frequency and extent of negative returns and underperformance over an investment horizon of three to four years. The Endowment Subaccount was credited with SDR 4.4 billion in profits from gold sales during financial years (FY) 2010 and 2011. The Endowment Subaccount’s investment objective is to achieve a real return of 3 percent in U.S. dollar terms over the long term, consistent with the IA’s objective to generate investment returns to contribute to the IMF’s income, while preserving the long-term real value of these assets. The bulk of the assets are managed passively. The actively managed portfolio of the Endowment Subaccount was initiated during the year ended April 30, 2017, with the investment of about 2.5 percent of total Endowment assets. This portfolio may grow to up to 10 percent of the Endowment assets.
1.3 Special Disbursement Account The SDA is the vehicle used to receive profits from the sale of gold held by the IMF at the time of the Second Amendment of the IMF’s Articles of Agreement (April 1978). SDA resources can be used for various purposes, as specified in the Articles of Agreement, including transfers to the GRA for immediate use in operations and transactions, transfers to the IA, or for operations and transactions that are not authorized by other provisions of the Articles but are consistent with the purposes of the Fund, in particular to provide balance of payments assistance on special terms to low-income member countries. The SDA currently holds claims related to overdue outstanding loans extended under the Structural Adjustment Facility (SAF). Repayments of principal and interest from SAF loans are transferred from the SDA to the Reserve Account of the Poverty Reduction and Growth Trust (PRG Trust), which is administered separately by the IMF as Trustee.
General Department
Notes to the financial statements for the financial years ended April 30, 2017, and 2016
9
1.4 Other entities administered by the IMF The IMF also administers the Special Drawing Rights Department (SDR Department) and other trusts and accounts established to perform financial and technical services consistent with the IMF’s purposes. As the General Department does not have control over these entities, their financial statements are presented separately. The resources of the SDR Department are held separately from the assets of all the other accounts owned or administered by the IMF. As specified in the IMF’s Articles of Agreement, these resources may not be used to meet the liabilities, obligations, or losses incurred in the operations of the General Department (or vice versa), except that expenses of conducting the business of the SDR Department are paid by the General Department and are then reimbursed by the SDR Department. The resources of other trusts and administered accounts are contributed by members, by other financial institutions, or by the IMF through the SDA. The assets of the other trusts and administered accounts are separate from the assets of the General Department and cannot be used to meet the liabilities, obligations, or losses incurred in the operations of the General Department. The General Department is reimbursed for the expenses incurred in conducting the business of other trusts and administered accounts.
2. Basis of preparation and measurement The financial statements of the General Department are prepared in accordance with International Financial Reporting Standards (IFRS) issued by the International Accounting Standards Board (IASB). The financial statements have been prepared under the historical cost convention, except for the revaluation of financial assets at fair value through profit or loss.
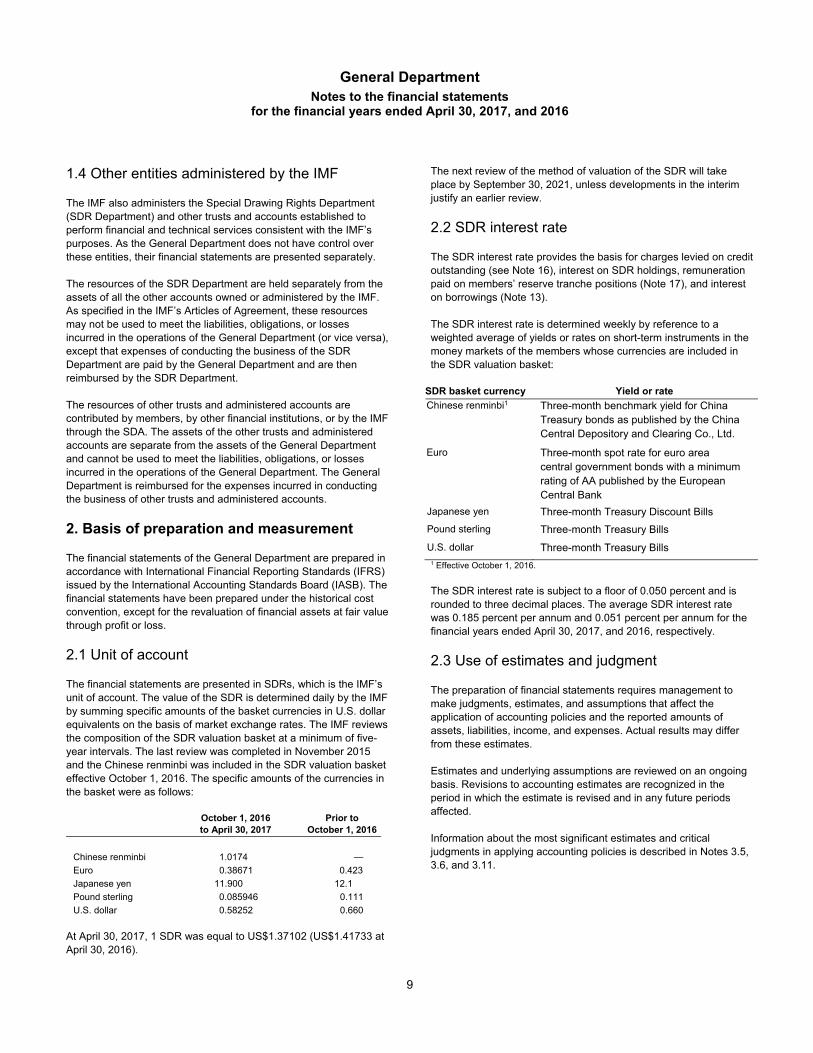
2.1 Unit of account The financial statements are presented in SDRs, which is the IMF’s unit of account. The value of the SDR is determined daily by the IMF by summing specific amounts of the basket currencies in U.S. dollar equivalents on the basis of market exchange rates. The IMF reviews the composition of the SDR valuation basket at a minimum of five-year intervals. The last review was completed in November 2015 and the Chinese renminbi was included in the SDR valuation basket effective October 1, 2016. The specific amounts of the currencies in the basket were as follows:
October 1, 2016 to April 30, 2017
Prior to October 1, 2016
Chinese renminbi 1.0174)0 —
Euro 0.38671) 0.423)
Japanese yen 11.900) 12.1)
Pound sterling 0.085946 0.111
U.S. dollar 0.582520 0.660 At April 30, 2017, 1 SDR was equal to US$1.37102 (US$1.41733 at April 30, 2016).
The next review of the method of valuation of the SDR will take place by September 30, 2021, unless developments in the interim justify an earlier review.
2.2 SDR interest rate The SDR interest rate provides the basis for charges levied on credit outstanding (see Note 16), interest on SDR holdings, remuneration paid on members’ reserve tranche positions (Note 17), and interest on borrowings (Note 13). The SDR interest rate is determined weekly by reference to a weighted average of yields or rates on short-term instruments in the money markets of the members whose currencies are included in the SDR valuation basket:
1 Effective October 1, 2016.
The SDR interest rate is subject to a floor of 0.050 percent and is rounded to three decimal places. The average SDR interest rate was 0.185 percent per annum and 0.051 percent per annum for the financial years ended April 30, 2017, and 2016, respectively.
2.3 Use of estimates and judgment The preparation of financial statements requires management to make judgments, estimates, and assumptions that affect the application of accounting policies and the reported amounts of assets, liabilities, income, and expenses. Actual results may differ from these estimates. Estimates and underlying assumptions are reviewed on an ongoing basis. Revisions to accounting estimates are recognized in the period in which the estimate is revised and in any future periods affected. Information about the most significant estimates and critical judgments in applying accounting policies is described in Notes 3.5, 3.6, and 3.11.
SDR basket currency Yield or rate
Chinese renminbi1 Three-month benchmark yield for China Treasury bonds as published by the China Central Depository and Clearing Co., Ltd.
Euro Three-month spot rate for euro area central government bonds with a minimum rating of AA published by the European Central Bank
Japanese yen Three-month Treasury Discount Bills
Pound sterling Three-month Treasury Bills
U.S. dollar Three-month Treasury Bills

General Department
Notes to the financial statements for the financial years ended April 30, 2017, and 2016
10
3. Summary of significant accounting policies
3.1 New and revised International Financial Reporting Standards
3.1.1 Amendments to existing standards that became effective in the financial year ended April 30, 2017 The following amendments to existing standards issued by the IASB and applicable to the General Department became effective in the financial year ended April 30, 2017. These amendments have no material impact on the General Department’s financial statements: Amendments to IFRS 7 “Financial Instruments: Disclosures”, issued in September 2014 and effective for annual periods starting on or after January 1, 2016. Amendments to IFRS 11 “Joint Arrangements”, issued in May 2014 and effective for annual periods starting on or after January 1, 2016. Amendments to IFRS 12 “Disclosure of Interests in Other Entities”, issued in December 2014 and effective for annual periods starting on or after January 1, 2016. Amendments to IAS 1 “Presentation of Financial Statements”, issued in December 2014 and effective for annual periods starting on or after January 1, 2016. Amendments to IAS 16 “Property, Plant and Equipment” and IAS 38 “Intangible Assets”, issued in May 2014 and effective for annual periods starting on or after January 1, 2016. Amendments to IAS 19 “Employee Benefits”, issued in September 2014 and effective for annual periods starting on or after January 1, 2016. Amendments to IAS 28 “Investments in Associates and Joint Ventures”, issued in December 2014 and effective for annual periods starting on or after January 1, 2016.
3.1.2 New standards to be adopted in future years The following new standard has been issued by the IASB and will be effective for annual periods starting on or after January 1, 2018: In July 2014, the IASB published the complete version of IFRS 9 “Financial Instruments”, which replaced most of the guidance in IAS 39 “Financial Instruments: Recognition and Measurement”. The standard requires financial assets to be classified at fair value through profit or loss, fair value through other comprehensive income, or amortized cost on the basis of the entity’s business model for managing the assets and the contractual cash flow characteristics of the financial asset. No changes were introduced for the classification and measurement of financial liabilities except for financial liabilities designated at fair value through profit or loss. For these financial liabilities, changes in the fair value due to the changes in an entity’s own credit risk must be recognized in other comprehensive income. The incurred loss model of IAS 39 has been
replaced by a forward-looking expected credit loss impairment model. The impact of the adoption of IFRS 9 on the General Department’s financial statements is being assessed. The following new standard has been issued by the IASB and will be effective for annual periods starting on or after January 1, 2019: In January 2016, the IASB published IFRS 16 “Leases”, which replaced IAS 17 “Leases”. The standard requires lessees to recognize a “right-of-use asset” and a lease liability reflecting future lease payments for all but short-term leases and leases of low-value assets. The impact of the adoption of IFRS 16 on the General Department’s financial statements is being assessed.
3.1.3 New standards and amendments to existing standards effective in future years that are not expected to have a material impact The following new standards and amendments to existing standards issued by the IASB will become effective in future financial years. These standards and amendments are not expected to have a material impact on the General Department’s financial statements: Amendments to IFRS 12 “Disclosure of Interests in Other Entities”, issued in December 2016 and effective for annual periods starting on or after January 1, 2017. IFRS 15 “Revenue from Contracts with Customers”, issued in May 2014 and effective for annual periods starting on or after January 1, 2018. Amendments to IAS 7 “Statement of Cash Flows”, issued in January 2016 and effective for annual periods starting on or after January 1, 2017. Amendments to IAS 28 “Investments in Associates and Joint Ventures”, issued in December 2016 and effective for annual periods starting on or after January 1, 2018.
3.2 Currencies Currencies consist of members’ currencies held by the GRA with the designated depositories, in the form of account balances or non-interest-bearing promissory notes that are encashable by the IMF on demand. Usable currencies are currencies of members considered to be in a sufficiently strong external position that they can be used to finance GRA transactions with other members. Holdings of member currencies that represent purchases of usable currencies or SDRs in exchange for their own currencies are presented as credit outstanding (see Note 3.5). Currencies of members that are not considered to have a sufficiently strong balance of payments and reserves position to finance the use of resources by members are not considered usable currencies or cash equivalents in the presentation of the statement of cash flows. All currencies in the GRA are revalued in terms of the SDR at the end of each financial year, resulting in currency valuation adjustments, which members are required to settle promptly. Member currencies are also revalued in SDR terms whenever used

General Department
Notes to the financial statements for the financial years ended April 30, 2017, and 2016
11
by the GRA in an operation or transaction with another member or at the request of a member. The currency balances in the statement of financial position include the receivables and payables arising from the revaluations.
3.3 SDR holdings The IMF, through the GRA, receives and holds SDRs from members in the settlement of their financial obligations to the GRA and quota payments. In addition, the GRA can use SDRs in transactions and operations with members, including the provision of financial assistance to members, the payment of charges and fees, and the payment of remuneration on reserve tranche positions or interest on borrowings to member countries and lenders. The GRA earns interest on its SDR holdings at the same rate as other holders of SDRs. Interest on SDR holdings is recognized using the effective interest method. Interest receivable is included in other assets in the statement of financial position.
3.4 Cash and cash equivalents Usable currencies and the SDR holdings are considered cash and cash equivalents in the statement of cash flows.
3.5 Credit outstanding Credit outstanding represents financing provided to members under the various IMF financing facilities. Members receive financing in the GRA by purchasing SDRs or usable currencies in exchange for their own currencies. IMF credit is repaid by members by repurchasing holdings of their currencies in exchange for SDRs or usable currencies. Credit outstanding is initially recorded at the amount disbursed, which represents the fair value of the consideration given. Thereafter, credit outstanding is carried at amortized cost. An impairment loss under IFRS would be recognized if there were objective evidence of impairment as a result of a loss event that occurred after initial recognition, and would be determined as the difference between the outstanding credit’s carrying value and the present value of the estimated future cash flows. Such cash flows would take into account the proceeds from the burden sharing mechanism (see Note 12).
3.6 Investments Investments in the Fixed-Income Subaccount include fixed-income securities, short-term investments, and fixed-term deposits. The fixed-income securities are designated as financial assets measured at fair value through profit or loss because they are managed and their performance is evaluated on a fair value basis. Short-term investments and fixed-term deposits are measured at amortized cost. Resources in the Endowment Subaccount are invested in equities, fixed-income securities, and real estate investment trusts (REITs). The investments are designated as financial assets measured at fair
value through profit or loss. Temporary holdings of fixed-term deposits and cash instruments are carried at amortized cost.
3.6.1 Recognition Investments are recognized on the trade date at which the IMF becomes a party to the contractual provisions of the instrument. The corresponding investment trades receivable or payable are recognized in other assets and other liabilities, respectively, pending settlement of a transaction.
3.6.2 Derecognition Investments are derecognized on the trade date when the contractual rights to the cash flows from the asset expire, or when substantially all the risks and rewards of ownership of the investment are transferred.
3.6.3 Investment income Investment income comprises interest and dividend income, realized gains and losses, and unrealized gains and losses, including currency valuation differences arising from exchange rate movements against the SDR. Interest income is recognized on an accrual basis under the effective interest method. Dividend income is recognized on an accrual basis based on the ex-dividend date.
3.6.4 Derivative instruments The fair value of derivative instruments is included in other assets and other liabilities, and changes in their fair value are recognized through profit or loss.
3.7 Fair value measurement Fair value is the price that would be received to sell an asset or paid to transfer a liability in an orderly transaction between market participants at the measurement date. A fair value measurement is based on the presumption that the transaction to sell the asset or transfer the liability takes place either in the principal market for the asset or liability or, in the absence of a principal market, in the most advantageous market. A three-level fair value hierarchy is used to determine fair value under which financial instruments are categorized based on the priority of the inputs to the valuation technique. The fair value hierarchy has the following levels: Level 1: Quoted prices (unadjusted) in active markets for identical assets or liabilities that the entity can access at the measurement date; Level 2: Inputs other than quoted prices included within Level 1 that are observable for the asset or liability, either directly (i.e., as prices) or indirectly (i.e., derived from prices); and

General Department
Notes to the financial statements for the financial years ended April 30, 2017, and 2016
12
Level 3: Inputs for the asset or liability that are not based on observable market data (unobservable inputs). When the inputs used to measure the fair value of an asset or liability fall within multiple levels of the hierarchy, the level within which the fair value measurement is categorized is based on the lowest-level input that is significant to the fair value measurement of the instrument in its entirety. Thus, a Level 3 fair value measurement may include inputs that are both observable and unobservable. The valuation techniques to determine fair value are described in Note 7.
3.8 Gold holdings The IMF values its gold holdings at historical cost using the specific identification method. In accordance with the provisions of the Articles of Agreement, whenever the IMF sells gold that was held on the date of the effectiveness of the Second Amendment of the Articles (April 1978), that portion of the proceeds equal to the historical cost must be placed in the GRA. Any proceeds in excess of the historical cost will be held in the SDA or transferred to the IA. Under the amendment to the Articles on the expanded investment authority of the IMF, profits from the sale of gold acquired after the Second Amendment are to be placed in the IA, while an amount equivalent to the historical cost is placed in the GRA (see Note 8).
3.9 Property, plant and equipment and intangible assets Property, plant and equipment and intangible assets are measured at cost less accumulated depreciation or amortization. Property, plant and equipment and intangible assets are capitalized and depreciated or amortized over the estimated remaining useful lives using the straight-line method. Buildings are depreciated over 30 years and other property, plant and equipment over three to 20 years. Leasehold improvements are depreciated over the term of the lease agreement. Software is amortized over three to five years.
3.10 Leases The IMF has entered into operating lease agreements as a lessor and lessee. As a lessee, all the risks and benefits of ownership are retained by the lessor. Payments made under operating leases are recognized as an expense on a straight-line basis over the period of the lease. As a lessor, the IMF retains the leased assets on its balance sheet and recognizes lease income on a straight-line basis over the period of the lease.
3.11 Post-employment benefits The IMF has a defined benefit Staff Retirement Plan (SRP) that covers all eligible staff, a Supplemental Retirement Benefits Plan (SRBP) for a subset of participants of the SRP, and a Retired Staff Benefits Investment Account (RSBIA) to hold and invest resources set aside to fund the cost of certain post-retirement benefits.
The net defined benefit liability or asset recognized in the statement of financial position is the present value of the defined benefit obligation less the fair value of the plan assets. Changes resulting from remeasurements are reported in other comprehensive income. The present value of the defined benefit obligation is determined by discounting the estimated future cash outflows using market yields on high-quality corporate bonds using the projected unit credit method. Net periodic pension cost includes service costs and net interest cost on the net defined benefit liability.
3.12 Special Contingent Account The IMF has accumulated precautionary balances against possible credit default in the Special Contingent Account (SCA-1) under the burden sharing mechanism (see Note 12). Balances in the SCA-1 are akin to refundable non-interest-bearing cash deposits and are recorded at cost.
3.13 Borrowings
The IMF can borrow to temporarily supplement its quota resources. The IMF’s main standing borrowing arrangement is the New Arrangements to Borrow (NAB). The IMF may also borrow under bilateral agreements, in particular loan and note purchase agreements (bilateral borrowing agreements), the General Arrangements to Borrow (GAB), and an associated agreement with Saudi Arabia (see Note 13). Borrowings are initially recognized at the amount drawn, which represents the fair value of the consideration received. Thereafter borrowings are measured at amortized cost.
3.14 Quotas and reserve tranche positions The IMF’s resources are primarily provided by its members through the payment of quotas, which broadly reflect each member’s relative position in the global economy. Quotas also determine each member’s relative voting power, its share in SDR allocations, and its access to IMF resources. Quotas for new members are recognized in the financial statements when paid. An increase in quota for an existing member becomes effective when the member consents to the quota increase and makes the actual payment, and is recorded in the financial statements on the payment date (see Note 14). Typically, a quarter of a member’s quota (reserve asset portion) is paid either in SDRs or in the currencies of other members specified by the IMF, or in any combination of SDRs and such currencies, and the remainder is paid in the member’s own currency. In exchange for the reserve asset portion of its quota payment, and from the use of the member’s currency in the GRA’s transactions or operations, a member acquires a reserve tranche position in the GRA. The reserve tranche is determined as the difference between the member’s quota and the GRA’s holdings of its currency, excluding holdings that reflect the member’s use of GRA credit. A member’s reserve tranche is also considered a part of its
General Department
Notes to the financial statements for the financial years ended April 30, 2017, and 2016
13
international reserves and a liquid claim against the GRA that can be encashed by the member at any time upon the representation of a balance of payments need. Should a member withdraw from the IMF, its quota subscription is refunded to the extent it is not needed to settle the member’s net obligations to the IMF. Quota subscriptions are classified as liabilities in the statement of financial position, as they embody an unconditional repayment obligation, in the case of a member’s withdrawal from the IMF.
3.15 Charges and fees The GRA earns interest, referred to as charges, on members’ use of IMF credit (see Note 16). Charges are recognized using the effective interest method. In addition to the basic rate of charge, outstanding GRA credit is also subject to level- and time-based surcharges (see Note 16). Surcharges are recognized when relevant level- and time-based thresholds are reached. The IMF does not recognize income from charges by members that are at least six months overdue in meeting any financial obligation to the IMF. The IMF fully recovers such interest income under the burden sharing mechanism, through adjustments to the rates of charge and remuneration (see Note 12). A service charge is levied by the IMF on all purchases except reserve tranche purchases. Service charges are paid when the purchases are made, and are recognized as income at the same time. A commitment fee is levied on the amount available for financing under an arrangement for each 12-month period. Commitment fees are refunded as the member makes purchases under the arrangement. At the arrangement’s expiration or cancellation, any unrefunded amount is recognized as income. Loans under the SAF are at a concessional interest rate of 0.5 percent per annum (see Note 19). All interest income is deferred.
3.16 Remuneration The IMF pays interest, referred to as remuneration, on a member’s reserve tranche position. Remuneration expense is recognized using the effective interest method.
3.17 Provisions Provisions are recognized when the IMF has a current legal or constructive obligation as a result of a past event, it is probable that an outflow of economic benefits will be required to settle the obligation, and a reliable estimate of the amount of the obligation can be made. Provisions are measured at the present value of the amounts that are expected to be paid to settle the obligations.
3.18 Foreign currency translation Transactions denominated in currencies and not in SDRs are recorded at the rate of exchange on the date of the transaction. Assets and liabilities denominated in other currencies are reported using the SDR exchange rate on the date of the financial statements. Exchange differences arising from the settlement of transactions at rates different from those at the originating date of the transactions are included in the determination of total comprehensive income.
4. Financial risk management The IMF is exposed to various types of operational and financial risks, including credit, market, and liquidity risks.
4.1 Risk management framework By virtue of its role established through the Articles of Agreement, the IMF faces a range of financial and nonfinancial risks. The Executive Board has approved a risk acceptance statement guiding risk acceptance and assessment across the IMF’s activities. The IMF has adopted the three lines of defense model for defining responsibilities for actively managing risk within these parameters. Departments conducting day-to-day operations are responsible for establishing and maintaining a system of internal controls for identifying and managing the risks inherent in those operations. An independent Risk Management Unit is responsible for developing and maintaining the risk management framework, fostering the development of risk management tools, and reporting to Management and the Executive Board on the IMF’s overall risk profile, highlighting areas where additional mitigation efforts are needed. Oversight is provided by committees established to monitor and make decisions in specific risk areas, and a Management-chaired Risk Committee, which supports the cycle of risk assessment, ownership, and mitigation vis-à-vis risk acceptance. Management and the Executive Board have the ultimate responsibility for maintaining effective risk management.
4.2 Credit risk
4.2.1 Credit outstanding Credit risk on credit outstanding refers to potential losses owing to the failure of member countries to make repurchases. Credit risk is inherent in the IMF’s unique role in the international monetary system because the IMF has limited ability to diversify its loan portfolio and generally provides financing when other sources are not available to a member. In addition, the IMF’s credit concentration is generally high due to the nature of its lending. Measures to help mitigate the IMF’s credit risk include program design and monitoring, and economic policies that members agree to follow as a condition for IMF financing; policies on access limits; surcharge policies; preventative, precautionary, and remedial measures; and the burden sharing mechanism (see Note 12). To protect the balance sheet against the financial consequences of protracted arrears, the Fund has accumulated precautionary
General Department
Notes to the financial statements for the financial years ended April 30, 2017, and 2016
14
balances. The adequacy of the precautionary balances is reviewed periodically by the Executive Board. The IMF generally provides a member access to its resources in support of an economic program adopted by the member to help it resolve its balance of payments difficulties. IMF financial assistance is normally disbursed in tranches, although the entire amount can be made available up front under certain lending instruments. Apart from IMF arrangements, members can also have access to IMF financing through reserve tranche purchases and outright purchases under policies on emergency assistance. The IMF has established limits on overall access to resources in the GRA. The annual limit is currently set at 145 percent of a member’s quota, with a cumulative limit of 435 percent of a member’s quota (net of scheduled repurchases). Access in excess of these limits is granted in exceptional circumstances. Except for PLL arrangements (see below), there is no pre-specified maximum on exceptional access to IMF resources which will be assessed on a case-by-case basis. The IMF assesses factors such as the size of balance of payments needs, the member's debt sustainability and its ability to regain access to financing from other sources, and the strength of policies to be adopted. There were no arrangements with exceptional access approved during financial years ended April 30, 2017 and 2016. FCL arrangements are not subject to any access limits. PLL arrangements have a cumulative access limit of 500 percent of quota (net of scheduled repurchases). Access under a six-month PLL arrangement is subject to a limit of 125 percent of quota. In exceptional circumstances where a member is experiencing or has the potential to experience larger short-term balance of payments needs due to the impact of exogenous shocks, including heightened regional or global stress conditions, access is subject to a higher limit of 250 percent of quota. In addition, the IMF has adopted a safeguards policy to mitigate the risk of misuse of resources and misreporting of monetary data that are reported under a program with the IMF. Safeguards assessments of member central banks are undertaken to provide the IMF with reasonable assurance that the central bank’s legal structure, governance, control, reporting, and auditing systems are adequate to maintain the integrity of their operations and to manage resources, including IMF disbursements. When IMF resources are provided as direct budget financing to the government, the safeguards policy also requires that IMF disbursements be deposited at the central bank, and that an appropriate framework agreement between the central bank and the government be in place to ensure timely servicing of the member’s financial obligations to the IMF. Further, a fiscal safeguards review of a state treasury is required for cases where a member requests exceptional access, and at least 25 percent of IMF funds are expected to be used for direct budget financing.
The maximum credit risk exposure is the carrying value of the IMF’s credit outstanding and undrawn commitments (see Note 5 and Schedule 3), which amounted to SDR 150.6 billion and SDR 125.4 billion at April 30, 2017, and 2016, respectively.
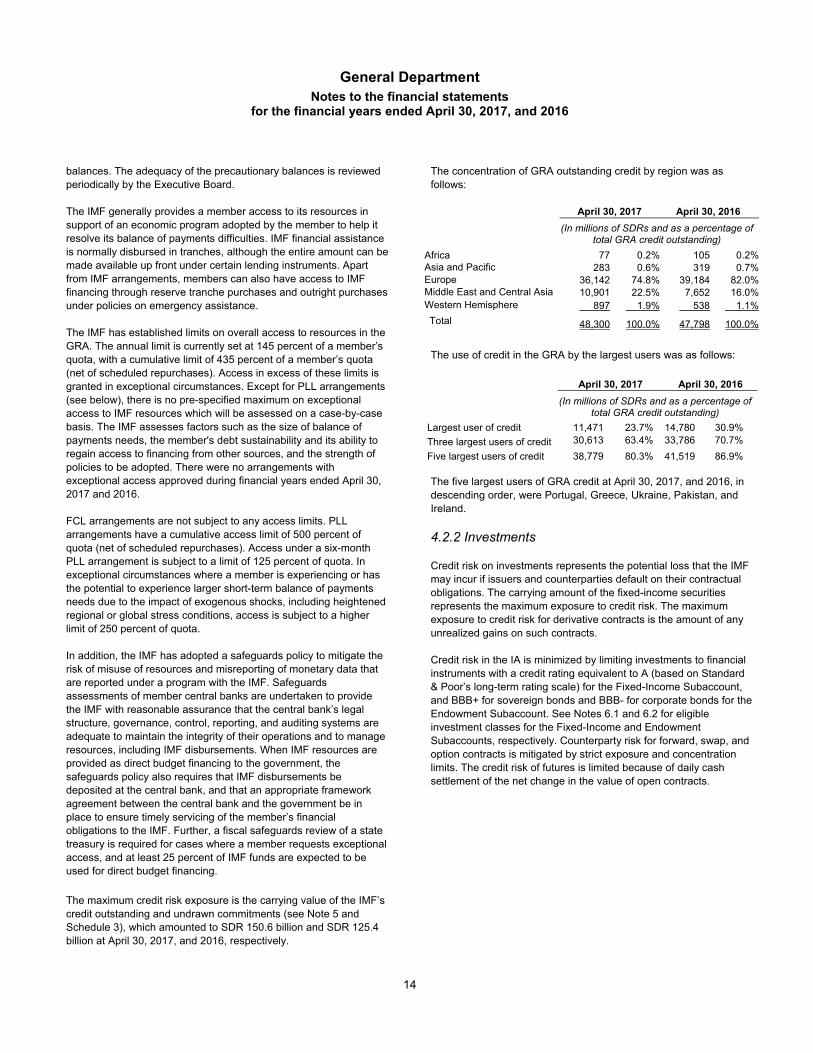
The concentration of GRA outstanding credit by region was as follows:
The use of credit in the GRA by the largest users was as follows:
The five largest users of GRA credit at April 30, 2017, and 2016, in descending order, were Portugal, Greece, Ukraine, Pakistan, and Ireland.
4.2.2 Investments Credit risk on investments represents the potential loss that the IMF may incur if issuers and counterparties default on their contractual obligations. The carrying amount of the fixed-income securities represents the maximum exposure to credit risk. The maximum exposure to credit risk for derivative contracts is the amount of any unrealized gains on such contracts. Credit risk in the IA is minimized by limiting investments to financial instruments with a credit rating equivalent to A (based on Standard & Poor’s long-term rating scale) for the Fixed-Income Subaccount, and BBB+ for sovereign bonds and BBB- for corporate bonds for the Endowment Subaccount. See Notes 6.1 and 6.2 for eligible investment classes for the Fixed-Income and Endowment Subaccounts, respectively. Counterparty risk for forward, swap, and option contracts is mitigated by strict exposure and concentration limits. The credit risk of futures is limited because of daily cash settlement of the net change in the value of open contracts.
April 30, 2017 April 30, 2016
(In millions of SDRs and as a percentage of total GRA credit outstanding)
Africa 77 0.2% 105 0.2%Asia and Pacific 283 0.6% 319 0.7%Europe 36,142 74.8% 39,184 82.0%Middle East and Central Asia 10,901 22.5% 7,652 16.0%Western Hemisphere 897 1.9% 538 1.1%
Total 48,300 100.0% 47,798 100.0%
April 30, 2017 April 30, 2016
(In millions of SDRs and as a percentage of total GRA credit outstanding)
Largest user of credit 11,471 23.7% 14,780 30.9%
Three largest users of credit 30,613 63.4% 33,786 70.7%
Five largest users of credit 38,779 80.3% 41,519 86.9%

General Department
Notes to the financial statements for the financial years ended April 30, 2017, and 2016
15
The credit risk exposure in the investments portfolio was as follows: Fixed-Income Subaccount
April 30, 2017 April 30, 2016
(As a percentage of total investments
in the subaccount) Sovereign bonds
AAA 9.2 14.8AA+ to AA– 19.0 25.3A+ to A 5.4 4.2
Corporate bonds AAA 2.0 —AA+ to AA– 6.1 —A+ to A 5.4 —
Securitized assets AAA 1.2 —
International financial institutions obligations:
BIS (not rated) 47.6 46.6 Others
AAA 3.5 7.1 AA+ to AA– 0.6 2.0
Total 100.0 100.0 The Fixed-Income Subaccount authorizes the use of derivatives for managing interest rate and currency risks, or reducing costs in the context of portfolio duration adjustments and portfolio rebalancing. At April 30, 2017, the maximum exposure to credit risk for forward contracts in the Fixed-Income Subaccount amounted to SDR 7 million (none at April 30, 2016). Endowment Subaccount
April 30, 2017 April 30, 2016
(As a percentage of total investments
in the subaccount) Passively managed portfolio: Developed market sovereign bonds
AAA 7.2 4.9AA+ to AA– 17.6 10.9A+ to A– 3.6 2.4BBB+ 0.9 0.6
Developed market corporate bonds AAA 0.3 0.2AA+ to AA– 2.9 2.0A+ to A– 8.4 5.8BBB+ to BBB– 10.7 6.5
Emerging market bonds AA+ to AA– 3.6 2.3A+ to A– 7.6 5.1BBB+ to BBB– 3.7 2.4
Inflation-linked bonds AAA 2.7 10.3AA+ to AA– 25.3 8.2A+ to A– 1.3 0.5BBB+ to BBB– 0.6 0.2
International financial institutions obligations:
BIS (not rated) 3.6 37.7Total 100.0 100.0 Actively managed portfolio:
AAA 1.7 —AA+ to AA– 14.8 —A+ to A– 26.1 —BBB+ to BBB– 57.4 —
Total 100.0 —
The passively managed portion of the Endowment Subaccount authorizes derivatives for currency hedging and to minimize transaction costs in the context of rebalancing or benchmark replication. The actively managed portion of the Endowment Subaccount permits derivatives subject to specific risk control parameters. At April 30, 2017, the maximum exposure to credit risk for forward contracts in the Endowment Subaccounts was SDR 9 million (SDR 10 million at April 30, 2016).
4.3 Market risk Market risk is the risk that the fair value or future cash flows of financial instruments will fluctuate because of changes in market prices. Market risk includes interest rate risk, exchange rate risk, and other price risks.
4.3.1 Financial assets and liabilities other than investments
4.3.1.1 Interest rate risk Interest rate risk on credit outstanding is the risk that future net cash flows will fluctuate because of changes in market interest rates. A floating market interest rate (the SDR interest rate) is used to determine the rate of charge. Interest rate risk is managed by linking the rate of charge directly, by means of a fixed margin, to the cost of financing (which is equal to the SDR interest rate). Accordingly, interest rate fluctuations do not adversely affect net lending income. Interest rate risk related to borrowings under bilateral borrowing agreements and under the NAB is limited because borrowings are currently levied interest at the SDR interest rate. The proceeds from borrowings are used to extend credit to member countries, at the rate of charge, which is based on the SDR interest rate plus a fixed margin.
4.3.1.2 Exchange rate risk Exchange rate risk is the risk that the IMF’s financial position and cash flows will be affected by fluctuations in foreign currency exchange rates. The IMF has no exchange rate risk exposure on its holdings of members’ currencies in the GRA, including those arising from the use of GRA credit. Under the Articles of Agreement, members are required to maintain the value of such holdings in terms of the SDR. Any depreciation or appreciation in a member’s currency vis-à-vis the SDR gives rise to a currency valuation adjustment, receivable or payable, that must be settled by the member promptly after the end of the financial year or at other times as requested by the IMF or the member. The IMF has other assets and liabilities, such as trade receivables and payables, denominated in currencies other than SDRs, and makes administrative payments largely in U.S. dollars, but the exchange rate risk exposure associated with these activities is limited. The IMF has no exchange rate exposure from its current borrowing arrangements because all drawings are denominated in SDRs.
General Department
Notes to the financial statements for the financial years ended April 30, 2017, and 2016
16
4.3.2 Investments The investment objectives of the Fixed-Income and Endowment Subaccounts differ, and the investment strategies, including asset allocation and risk tolerance, are tailored for each of the subaccounts, thereby exposing them to different types of market risk. The exposures to market risk, including interest rate and exchange rate risks, are measured using value at risk (VaR), which considers not only known market risks in each of the asset categories but also the effect of asset class diversification. The VaR estimates reported below represent the maximum potential loss in value of the assets over the next year due to adverse market movements with a 95 percent confidence level. Conversely, there is a 1 in 20 chance that annual losses on investment assets would be expected to equal or exceed the reported VaR. Losses in a single year could exceed the reported VaR by a significant amount. VaR models are based predominantly on historical simulations and provide plausible future scenarios based on these simulations. There is no standard methodology for estimating VaR, and the modeling of the market risk characteristics of the investments involves many assumptions and approximations. Different assumptions and/or approximations could produce significantly different VaR estimates.
4.3.2.1 Fixed-Income Subaccount Under the expanded mandate of the IA, the Fixed-Income Subaccount comprises two tranches, a shorter-duration Tranche 1 and a longer-duration Tranche 2. The eligible investment asset classes in Tranche 1 have been broadened to help diversify sources of income as well as risks beyond governments, official agencies, and international financial institutions (see Note 6.1 for the eligible asset classes). The market risk is mitigated through asset class diversification and within asset classes through broad security selection. The VaR for the Fixed-Income Subaccount portfolio was SDR 58 million and SDR 45 million at April 30, 2017, and 2016, respectively.
4.3.2.2 Endowment Subaccount Under the strategic asset allocation approved by the Executive Board for the passively managed portion of the portfolio, investments are divided into seven categories, which are subject to varying market risks and benefits from diversification properties. For the actively managed portion of the portfolio, the Rules and Regulations of the IA establish a 65/35 global bond/equity split but no strategic asset allocation is set for the subcomponents of the two broad asset classes (see Note 6.2 for the eligible asset classes). The market risk is mitigated through asset class diversification and within asset classes through broad security selection. The investment objective of the Endowment Subaccount is to achieve a long-term real return of 3 percent to provide a meaningful contribution to the IMF’s administrative expenditures. Because these expenditures are largely in U.S. dollars, the performance of the
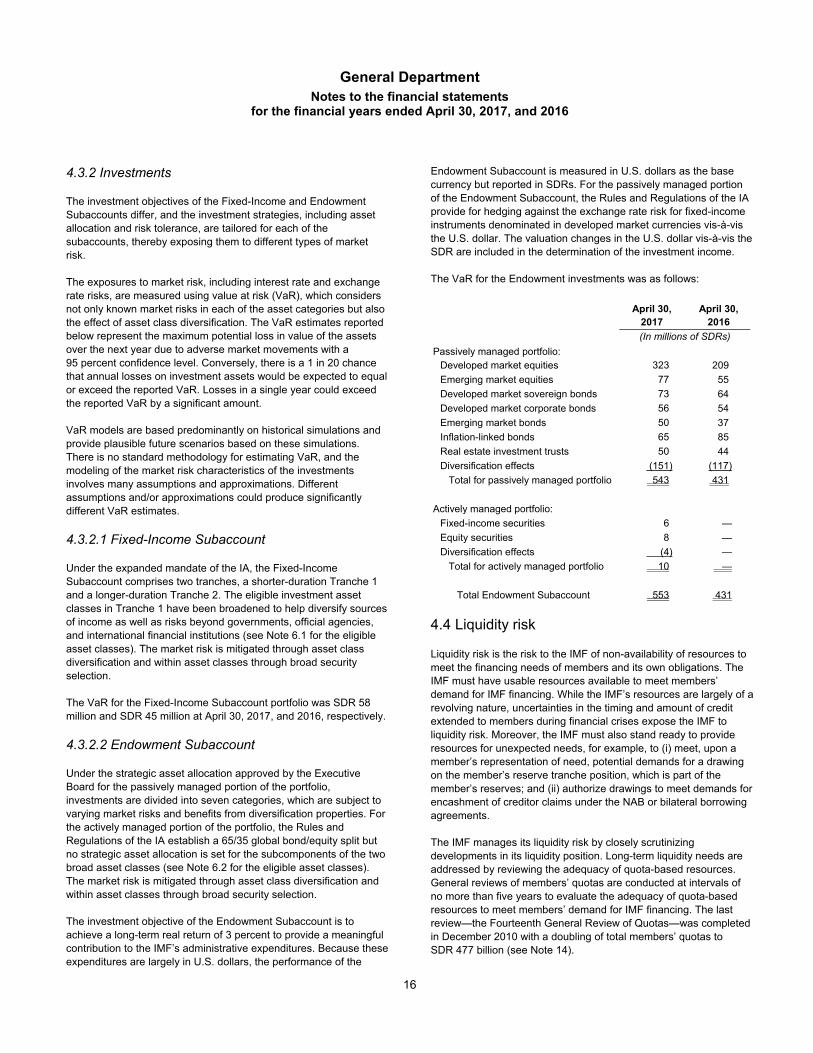
Endowment Subaccount is measured in U.S. dollars as the base currency but reported in SDRs. For the passively managed portion of the Endowment Subaccount, the Rules and Regulations of the IA provide for hedging against the exchange rate risk for fixed-income instruments denominated in developed market currencies vis-à-vis the U.S. dollar. The valuation changes in the U.S. dollar vis-à-vis the SDR are included in the determination of the investment income. The VaR for the Endowment investments was as follows:
4.4 Liquidity risk Liquidity risk is the risk to the IMF of non-availability of resources to meet the financing needs of members and its own obligations. The IMF must have usable resources available to meet members’ demand for IMF financing. While the IMF’s resources are largely of a revolving nature, uncertainties in the timing and amount of credit extended to members during financial crises expose the IMF to liquidity risk. Moreover, the IMF must also stand ready to provide resources for unexpected needs, for example, to (i) meet, upon a member’s representation of need, potential demands for a drawing on the member’s reserve tranche position, which is part of the member’s reserves; and (ii) authorize drawings to meet demands for encashment of creditor claims under the NAB or bilateral borrowing agreements. The IMF manages its liquidity risk by closely scrutinizing developments in its liquidity position. Long-term liquidity needs are addressed by reviewing the adequacy of quota-based resources. General reviews of members’ quotas are conducted at intervals of no more than five years to evaluate the adequacy of quota-based resources to meet members’ demand for IMF financing. The last review—the Fourteenth General Review of Quotas—was completed in December 2010 with a doubling of total members’ quotas to SDR 477 billion (see Note 14).
April 30, 2017
April 30, 2016
(In millions of SDRs)
Passively managed portfolio:
Developed market equities 323) 209)
Emerging market equities 77) 55)
Developed market sovereign bonds 73) 64)
Developed market corporate bonds 56) 54)
Emerging market bonds 50) 37)
Inflation-linked bonds 65) 85)
Real estate investment trusts 50) 44)
Diversification effects (151) (117)
Total for passively managed portfolio 543) 431)
Actively managed portfolio:
Fixed-income securities 6) —
Equity securities 8) —
Diversification effects (4) —
Total for actively managed portfolio 10) —
Total Endowment Subaccount 553) 431
General Department
Notes to the financial statements for the financial years ended April 30, 2017, and 2016
17
During the financial years ended April 30, 2017, and 2016, short-term liquidity needs for lending activities were reviewed and approved by the Executive Board on a quarterly basis through a financial transactions plan for quota resources, and the resource mobilization plan for use of resources under the NAB. Following the effectiveness of the quota increases under the Fourteenth General Review of Quotas, the NAB was deactivated on February 25, 2016. The IMF also monitors its short-term liquidity position using quantitative criteria such as the forward commitment capacity (see Schedule 2). The Executive Board decides at the end of each financial year whether to transfer the income earned in the Fixed-Income Subaccount in the IA to the GRA to help meet the expenses of conducting the business of the IMF (see Note 15). The Endowment Subaccount had no immediate liquidity needs for payout during the financial years ended April 30, 2017, and 2016, and the resources have been invested according to the approved strategic asset allocation.
5. Currencies, including credit outstanding Currency holdings of SDR 475,140 million at April 30, 2017, included receivables and payables arising from valuation adjustments at April 30, 2017 (when all holdings of currencies of members were last revalued), of SDR 10,295 million and SDR 9,648 million, respectively (currency holdings of SDR 473,409 million at April 30, 2016, included receivables and payables of SDR 11,998 million and SDR 5,690 million, respectively). Settlements of these receivables or payables are required to be made by or to members promptly after the end of each financial year.
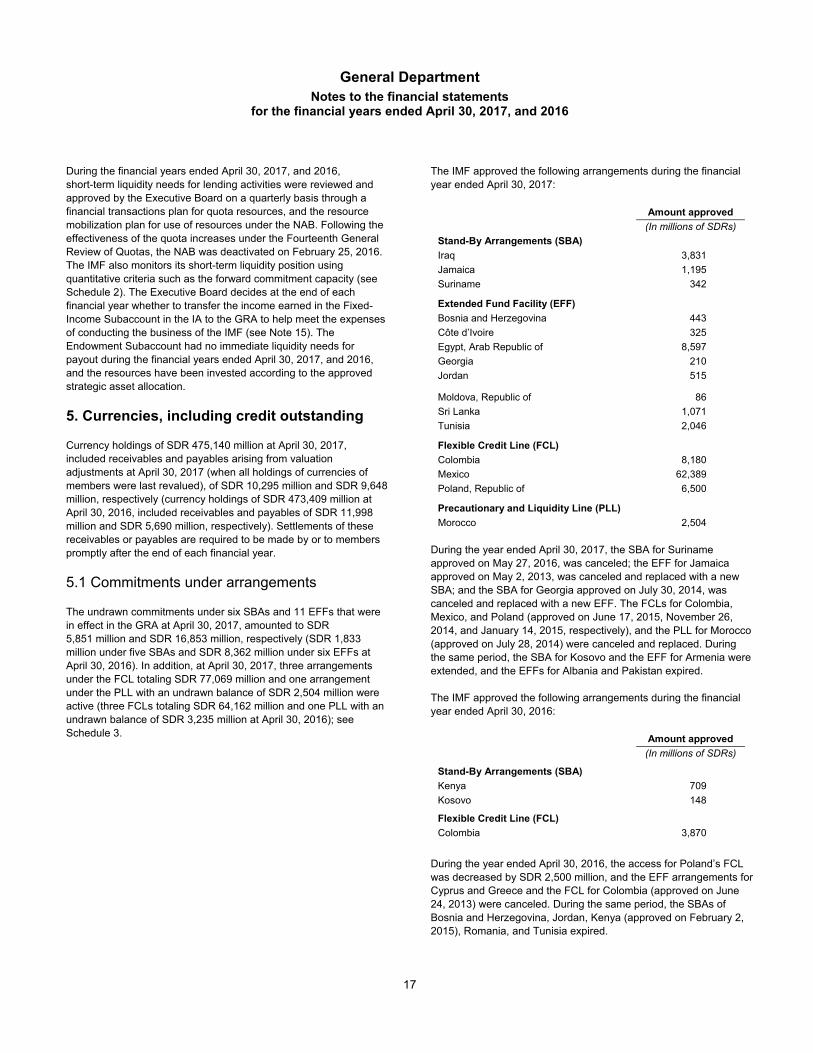
5.1 Commitments under arrangements The undrawn commitments under six SBAs and 11 EFFs that were in effect in the GRA at April 30, 2017, amounted to SDR 5,851 million and SDR 16,853 million, respectively (SDR 1,833 million under five SBAs and SDR 8,362 million under six EFFs at April 30, 2016). In addition, at April 30, 2017, three arrangements under the FCL totaling SDR 77,069 million and one arrangement under the PLL with an undrawn balance of SDR 2,504 million were active (three FCLs totaling SDR 64,162 million and one PLL with an undrawn balance of SDR 3,235 million at April 30, 2016); see Schedule 3.
The IMF approved the following arrangements during the financial year ended April 30, 2017:
Amount approved
(In millions of SDRs)
Stand-By Arrangements (SBA)
Iraq 3,831
Jamaica 1,195
Suriname 342
Extended Fund Facility (EFF)
Bosnia and Herzegovina 443
Côte d’Ivoire 325
Egypt, Arab Republic of 8,597
Georgia 210
Jordan 515
Moldova, Republic of 86
Sri Lanka 1,071
Tunisia 2,046
Flexible Credit Line (FCL)
Colombia 8,180
Mexico 62,389
Poland, Republic of 6,500
Precautionary and Liquidity Line (PLL)
Morocco 2,504 During the year ended April 30, 2017, the SBA for Suriname approved on May 27, 2016, was canceled; the EFF for Jamaica approved on May 2, 2013, was canceled and replaced with a new SBA; and the SBA for Georgia approved on July 30, 2014, was canceled and replaced with a new EFF. The FCLs for Colombia, Mexico, and Poland (approved on June 17, 2015, November 26, 2014, and January 14, 2015, respectively), and the PLL for Morocco (approved on July 28, 2014) were canceled and replaced. During the same period, the SBA for Kosovo and the EFF for Armenia were extended, and the EFFs for Albania and Pakistan expired. The IMF approved the following arrangements during the financial year ended April 30, 2016:
Amount approved
(In millions of SDRs)
Stand-By Arrangements (SBA)
Kenya 709
Kosovo 148
Flexible Credit Line (FCL)
Colombia 3,870
During the year ended April 30, 2016, the access for Poland’s FCL was decreased by SDR 2,500 million, and the EFF arrangements for Cyprus and Greece and the FCL for Colombia (approved on June 24, 2013) were canceled. During the same period, the SBAs of Bosnia and Herzegovina, Jordan, Kenya (approved on February 2, 2015), Romania, and Tunisia expired.
General Department
Notes to the financial statements for the financial years ended April 30, 2017, and 2016
18
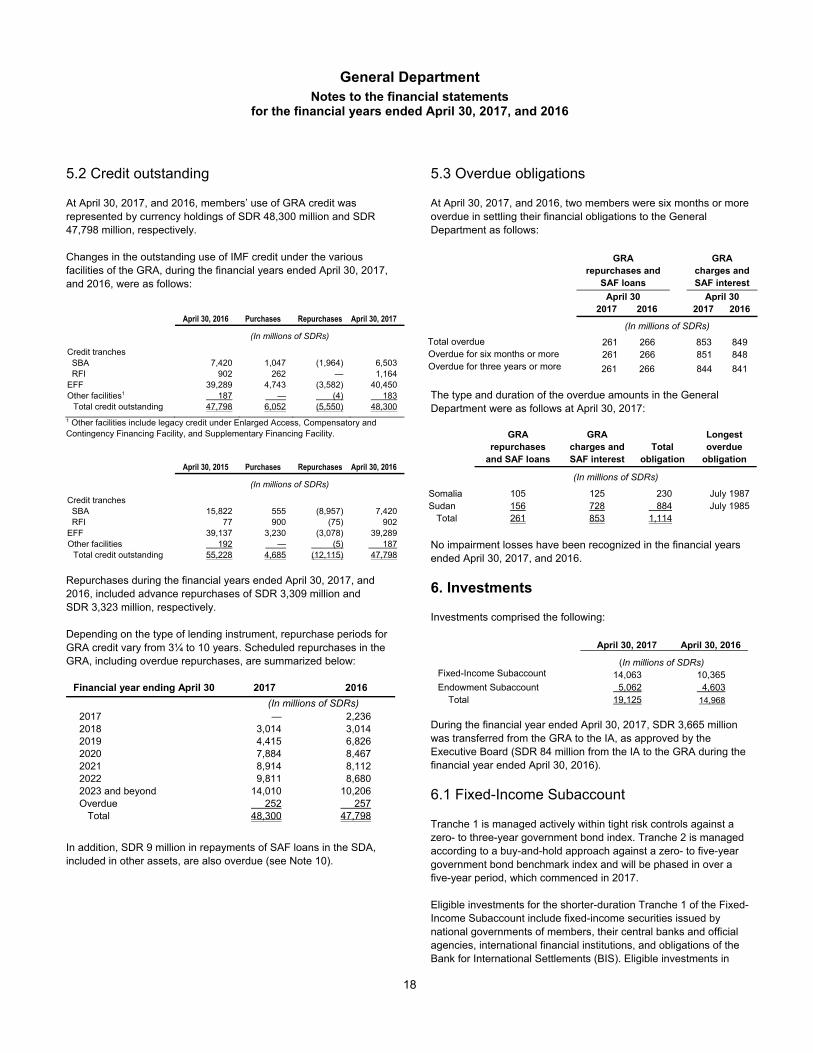
5.2 Credit outstanding At April 30, 2017, and 2016, members’ use of GRA credit was represented by currency holdings of SDR 48,300 million and SDR 47,798 million, respectively. Changes in the outstanding use of IMF credit under the various facilities of the GRA, during the financial years ended April 30, 2017, and 2016, were as follows:
1 Other facilities include legacy credit under Enlarged Access, Compensatory and Contingency Financing Facility, and Supplementary Financing Facility.
April 30, 2015 Purchases Repurchases April 30, 2016
(In millions of SDRs)
Credit tranches SBA 15,822 555 (8,957) 7,420 RFI 77 900 (75) 902 EFF 39,137 3,230 (3,078) 39,289 Other facilities 192 — (5) 187
Total credit outstanding 55,228 4,685 (12,115) 47,798
Repurchases during the financial years ended April 30, 2017, and 2016, included advance repurchases of SDR 3,309 million and SDR 3,323 million, respectively. Depending on the type of lending instrument, repurchase periods for GRA credit vary from 3¼ to 10 years. Scheduled repurchases in the GRA, including overdue repurchases, are summarized below:
Financial year ending April 30 2017 2016
(In millions of SDRs) 2017 — 2,236 2018 3,014 3,014 2019 4,415 6,826 2020 7,884 8,467 2021 8,914 8,112 2022 9,811 8,680 2023 and beyond 14,010 10,206 Overdue 252 257 Total 48,300 47,798
In addition, SDR 9 million in repayments of SAF loans in the SDA, included in other assets, are also overdue (see Note 10).
5.3 Overdue obligations At April 30, 2017, and 2016, two members were six months or more overdue in settling their financial obligations to the General Department as follows:
GRA repurchases and
SAF loans
GRA charges and SAF interest
April 30 April 30 2017 2016 2017 2016
(In millions of SDRs)
Total overdue 261 266 853 849 Overdue for six months or more 261 266 851 848 Overdue for three years or more 261 266 844 841 The type and duration of the overdue amounts in the General Department were as follows at April 30, 2017:
GRA repurchases
and SAF loans
GRA charges and SAF interest
Total obligation
Longest overdue
obligation
(In millions of SDRs)
Somalia 105 125 230 July 1987 Sudan 156 728 884 July 1985 Total 261 853 1,114
No impairment losses have been recognized in the financial years ended April 30, 2017, and 2016.
6. Investments Investments comprised the following:
During the financial year ended April 30, 2017, SDR 3,665 million was transferred from the GRA to the IA, as approved by the Executive Board (SDR 84 million from the IA to the GRA during the financial year ended April 30, 2016).
6.1 Fixed-Income Subaccount Tranche 1 is managed actively within tight risk controls against a zero- to three-year government bond index. Tranche 2 is managed according to a buy-and-hold approach against a zero- to five-year government bond benchmark index and will be phased in over a five-year period, which commenced in 2017. Eligible investments for the shorter-duration Tranche 1 of the Fixed-Income Subaccount include fixed-income securities issued by national governments of members, their central banks and official agencies, international financial institutions, and obligations of the Bank for International Settlements (BIS). Eligible investments in
April 30, 2016 Purchases Repurchases April 30, 2017
(In millions of SDRs)
Credit tranches SBA 7,420 1,047 (1,964) 6,503 RFI 902 262 — 1,164 EFF 39,289 4,743 (3,582) 40,450 Other facilities1 187 — (4) 183
Total credit outstanding 47,798 6,052 (5,550) 48,300
April 30, 2017 April 30, 2016
(In millions of SDRs) Fixed-Income Subaccount 14,063 10,365 Endowment Subaccount 5,062 4,603 Total 19,125 14,968
General Department
Notes to the financial statements for the financial years ended April 30, 2017, and 2016
19
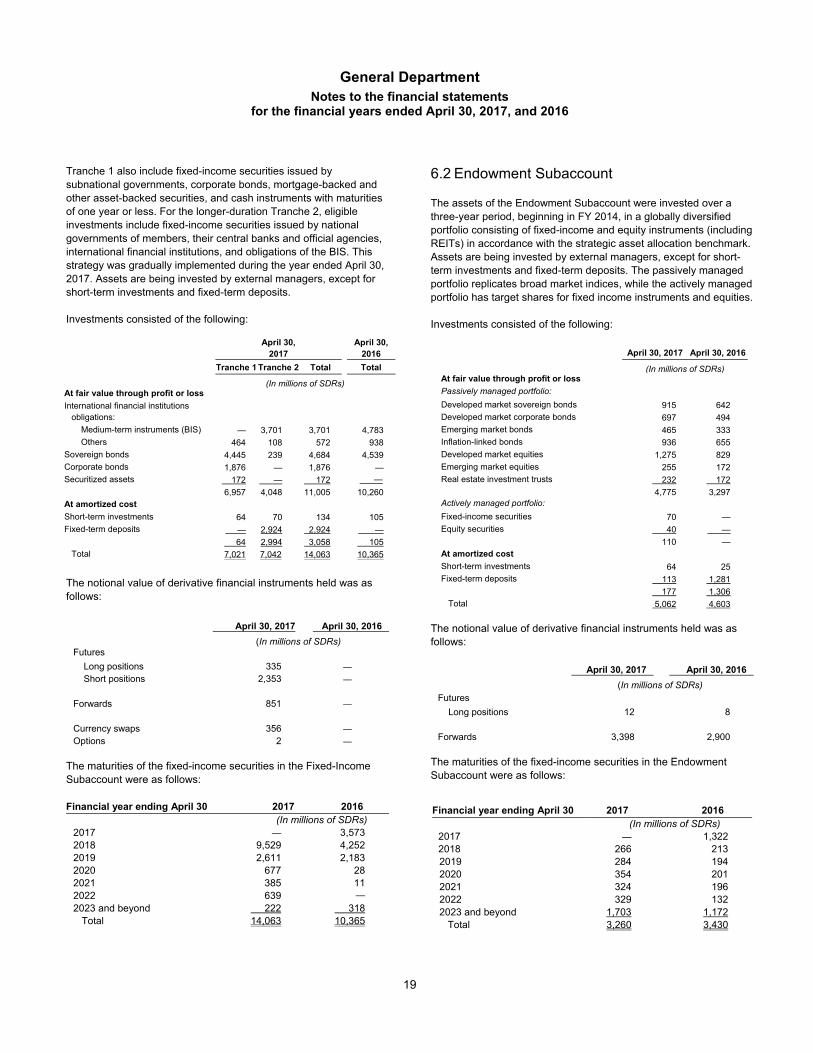
Tranche 1 also include fixed-income securities issued by subnational governments, corporate bonds, mortgage-backed and other asset-backed securities, and cash instruments with maturities of one year or less. For the longer-duration Tranche 2, eligible investments include fixed-income securities issued by national governments of members, their central banks and official agencies, international financial institutions, and obligations of the BIS. This strategy was gradually implemented during the year ended April 30, 2017. Assets are being invested by external managers, except for short-term investments and fixed-term deposits. Investments consisted of the following:
April 30, 2017
April 30, 2016
Tranche 1 Tranche 2 Total Total
(In millions of SDRs)At fair value through profit or loss
International financial institutions obligations: Medium-term instruments (BIS) — 3,701 3,701 4,783 Others 464 108 572 938 Sovereign bonds 4,445 239 4,684 4,539 Corporate bonds 1,876 — 1,876 — Securitized assets 172 — 172 —
6,957 4,048 11,005 10,260 At amortized cost Short-term investments 64 70 134 105 Fixed-term deposits — 2,924 2,924 — 64 2,994 3,058 105 Total 7,021 7,042 14,063 10,365
The notional value of derivative financial instruments held was as follows:
April 30, 2017 April 30, 2016 (In millions of SDRs)
Futures
Long positions 335 —
Short positions 2,353 —
Forwards 851 —
Currency swaps 356 —
Options 2 — The maturities of the fixed-income securities in the Fixed-Income Subaccount were as follows: Financial year ending April 30 2017 2016
(In millions of SDRs) 2017 — 3,573 2018 9,529 4,252 2019 2,611 2,183 2020 677 28 2021 385 11 2022 639 —
2023 and beyond 222 318 Total 14,063 10,365
6.2 Endowment Subaccount The assets of the Endowment Subaccount were invested over a three-year period, beginning in FY 2014, in a globally diversified portfolio consisting of fixed-income and equity instruments (including REITs) in accordance with the strategic asset allocation benchmark. Assets are being invested by external managers, except for short-term investments and fixed-term deposits. The passively managed portfolio replicates broad market indices, while the actively managed portfolio has target shares for fixed income instruments and equities. Investments consisted of the following:
April 30, 2017 April 30, 2016
(In millions of SDRs)At fair value through profit or loss
Passively managed portfolio:
Developed market sovereign bonds 915 642 Developed market corporate bonds 697 494 Emerging market bonds 465 333 Inflation-linked bonds 936 655 Developed market equities 1,275 829 Emerging market equities 255 172 Real estate investment trusts 232 172 4,775 3,297 Actively managed portfolio: Fixed-income securities 70 — Equity securities 40 — 110 — At amortized cost Short-term investments 64 25 Fixed-term deposits 113 1,281 177 1,306 Total 5,062 4,603
The notional value of derivative financial instruments held was as follows:
The maturities of the fixed-income securities in the Endowment Subaccount were as follows:
Financial year ending April 30 2017 2016 (In millions of SDRs)
2017 — 1,322 2018 266 213 2019 284 194 2020 354 201 2021 324 196 2022 329 132 2023 and beyond 1,703 1,172 Total 3,260 3,430
April 30, 2017 April 30, 2016
(In millions of SDRs) Futures
Long positions 12 8 Forwards 3,398 2,900

General Department
Notes to the financial statements for the financial years ended April 30, 2017, and 2016
20
6.3 Investment Income Net income/(loss) on investments for the IA consisted of the following:
7. Fair value measurement Specific valuation techniques used to value financial instruments include the following: (i) The fair value of publicly traded equities, bonds and treasury securities, REITs, and derivatives (interest rate futures and options) is based on quoted market prices, or binding dealer price quotations, in an active market for identical assets without any adjustments. The instruments are valued at mid prices (or bid price for long positions and ask price for short positions) and included within Level 1 of the hierarchy; (ii) The fair value of fixed-income securities not actively traded is determined on the basis of a compilation of significant observable market information, such as recently executed trades in securities of the issuer or comparable issuers and yield curves. The assessment also takes into account the inherent risk and terms and conditions of each security. The fair value of emerging market equity securities is the net asset value of the underlying funds. To the extent that the significant inputs are observable, these investments are included within Level 2 of the hierarchy; and (iii) The fair value of over-the-counter derivatives (foreign exchange forwards, currency swaps) not actively traded is determined using a pricing model that incorporates foreign exchange spot and forward rates and interest rate curves. For these derivatives, significant inputs into models are market observable and are included within Level 2.
7.1 Fixed-Income Subaccount The following tables present the fair value hierarchy used to determine the fair value of investments in the Fixed-Income Subaccount:
April 30, 2017
Level 1: Level 2: Quoted prices
in active markets
Based on observable market data Total
(In millions of SDRs)
Recurring fair value measurements
International financial institutions obligations:
Medium-term instruments (BIS) — 3,701 3,701
Others — 572 572
Sovereign bonds — 4,684 4,684
Corporate bonds — 1,876 1,876
Securitized assets — 172 172
Total — 11,005 11,005
April 30, 2016
Level 1: Level 2: Quoted prices
in active markets
Based on observable market data Total
(In millions of SDRs)
Recurring fair value measurements
International financial institutions obligations:
Medium-term instruments (BIS) — 4,783 4,783
Others — 938 938
Developed market sovereign bonds — 4,539 4,539
Total — 10,260 10,260
7.2 Endowment Subaccount The following tables present the fair value hierarchy used to determine the fair value of investments in the Endowment Subaccount:
April 30, 2017
Level 1: Level 2:
Quoted prices in active markets
Based on observable market data Total
(In millions of SDRs)
Recurring fair value measurements
Passively managed portfolio:
Developed market sovereign bonds — 915 915
Developed market corporate bonds — 697 697
Emerging market bonds — 465 465
Inflation-linked bonds — 936 936
Developed market equities 1,275 — 1,275
Emerging market equities 255 — 255
Real estate investment trusts 232 — 232
1,762 3,013 4,775
Actively managed portfolio:
Fixed-income securities — 70 70
Equity securities 40 — 40
40 70 110
Total 1,802 3,083 4,885
2017 2016
(In millions of SDRs) Interest and dividends 230 153) Net realized gains/(losses) 139 (90) Net unrealized gains/(losses) 158 (83) Total 527 (20)

General Department
Notes to the financial statements for the financial years ended April 30, 2017, and 2016
21
April 30, 2016
Level 1: Level 2:
Quoted prices in active markets
Based on observable market data Total
(In millions of SDRs)
Recurring fair value measurements
Developed market sovereign bonds — 642 642
Developed market corporate bonds — 494 494
Emerging market bonds — 333 333
Inflation-linked bonds — 655 655
Developed market equities 829 — 829
Emerging market equities 71 101 172
Real estate investment trusts 172 — 172
Total 1,072 2,225 3,297
There were no Level 3 financial instruments at April 30, 2017, and 2016, and there have been no transfers between Level 1 and Level 2 during the period. Investments in fixed-term deposits and short-term investments in the IA are generally of a short-term nature and are carried at amortized cost, which approximates fair value.
7.3 Financial assets and liabilities other than investments The IMF plays a unique role in providing balance of payments support to member countries. IMF financing features policy conditions that require member countries to implement macroeconomic and structural policies and are an integral part of IMF lending. These measures aim to help countries resolve their balance of payments problems while safeguarding IMF resources. The fair value of IMF credit outstanding as defined under IFRS 13 cannot be determined due to its unique characteristics, including the debtor’s membership relationship with the IMF, and the absence of a principal or most advantageous market for IMF credit. The carrying value of other financial assets and liabilities that are accounted for at amortized cost represents a reasonable estimate of their fair value.
8. Gold holdings The IMF acquired its gold holdings from quota subscriptions and financial transactions prior to the entry into force of the Second Amendment of the Articles of Agreement (April 1, 1978). The Articles of Agreement limit the use of gold in the IMF’s operations and transactions. Any transactions in gold provided for in the Articles of Agreement require a decision adopted by an 85 percent majority of the total voting power. The IMF may sell gold outright on the basis of prevailing market prices but cannot engage in any other gold transactions, such as loans, leases, or the use of gold as collateral. In addition, the IMF does not have the authority to buy gold, but it may accept payments from a member in gold instead of SDRs or currencies in any operation or transactions at prevailing market prices. At April 30, 2017, and 2016, the IMF held gold of 2,814 metric tons, equal to 90.474 million fine troy ounces, at designated depositories. Gold holdings were valued at a historical cost of SDR 3,167 million
at April 30, 2017, and 2016, based on a cost of SDR 35 per fine troy ounce. At April 30, 2017, the market value of the IMF’s holdings of gold was SDR 83.6 billion (SDR 82.1 billion at April 30, 2016). The market value of the gold holdings is determined based on quoted prices in active markets (Level 1 in the fair value hierarchy).
9. Property, plant and equipment and intangible assets Property, plant and equipment and intangible assets, net of depreciation and amortization, amounted to SDR 473 million and SDR 434 million at April 30, 2017, and 2016, respectively, and consisted of land, buildings, equipment, furniture, and software.
Other property, plant and equipment included construction in progress of SDR 54 million at April 30, 2017 (SDR 148 million at April 30, 2016), related to the renovation of the IMF headquarters building. At April 30, 2017, the IMF had commitments of SDR 70 million in respect of the renovation of the IMF headquarters building (SDR 95 million at April 30, 2016).
Land Buildings Other Total(In millions of SDRs)
Financial year ended April 30, 2017 Cost Beginning of the year 95 297) 368) 760) Additions — 1) 71 72 Transfers — 90) (90) — Disposals — (18) (10) (28) End of the year 95 370) 339 804
Accumulated depreciation and amortization Beginning of the year — 167) 159) 326) Depreciation and amortization — 6) 22 28 Disposals — (14) (9) (23) End of the year — 159) 172) 331)
Net book value at April 30, 2017 95 211) 167) 473)
Land Buildings Other Total (In millions of SDRs) Financial year ended April 30, 2016 Cost Beginning of the year 95 290 329) 714) Additions — — 81 81) Transfers — 7 (7) —) Disposals — — (35) (35) End of the year 95 297 368) 760)
Accumulated depreciation and amortization Beginning of the year — 162 172) 334) Depreciation and amortization — 5 22) 27) Disposals — — (35) (35) End of the year — 167 159) 326)
Net book value at April 30, 2016 95 130 209) 434)

General Department
Notes to the financial statements for the financial years ended April 30, 2017, and 2016
22
Depreciation and amortization expense of SDR 28 million and SDR 27 million is included in administrative expenses for the financial years ending April 30, 2017, and 2016, respectively (see Note 18).
10. Other assets and liabilities Other assets comprised the following:
April 30, 2017
April 30, 2016
(In millions of SDRs)Charges receivable 289 276 Investment trades receivable and derivatives 168 218 Accrued interest on SDR holdings 26 4 Overdue SAF loans 9 9 Miscellaneous receivables and prepaid expenses 61 56 Total other assets 553 563 Other liabilities comprised the following:
April 30, 2017
April 30, 2016
(In millions of SDRs)Refundable commitment fees on active
arrangements 272 415 Investment trades payable and derivatives 139 224 Miscellaneous payables 221 172 Total other liabilities 632 811
11. Employee benefits
11.1 Overview of the Plans Participants in the SRP and SRBP (the pension plans) are entitled to unreduced annual pensions beginning at the normal retirement age of 62 or earlier if certain conditions of age and service are met. The pension plans also provide an option for eligible staff to receive reduced pension benefits beginning at the age of 50. The level of pension benefits depends on the participants’ length of service and highest three-year average gross compensation. Participants may also elect upon retirement to commute up to one-third of the lifetime pension benefits into a lump sum payment. The SRBP provides for the payment of benefits that otherwise would have been payable had the qualified plan benefits and compensation limits not applied. The SRP and SRBP were amended in November 2016 to update the factors used in the determination of lump sum payments to participants who commute a portion of their pension. The amount of past service cost resulting from this amendment recognized in the statement of comprehensive income amounted to SDR 12 million. The IMF provides other employment and post-retirement benefits, including medical insurance, life insurance, and other non-pension long-term benefits, such as separation and repatriation benefits, accrued annual leave up to 60 days, and associated tax allowances. The IMF has established a separate account, the RSBIA, to hold and invest resources set aside to fund the cost of these post-retirement benefits of current and future retirees.
In April 2017, the Executive Board decided to expand coverage provided by the Fund’s medical benefits plan, effective January 1, 2018. The amount of past service cost resulting from this amendment recognized in the statements of comprehensive income amounted to SDR 76 million. The assets in the SRP, SRBP, and RSBIA (collectively, the Plans) are held separately from the assets of all other accounts of the IMF. In the event the IMF were to exercise its right to terminate the Plans, the assets of these plans would be used to satisfy all liabilities to participants, retired participants, and their beneficiaries, and all other liabilities of the pension plans. Any remaining assets would be returned to the GRA. The GRA meets the costs of administering the Plans, and the SRP and RSBIA reimburse the GRA for investment-related costs. The Executive Board and the Pension Committee are responsible for the governance of the Plans. The Executive Board approves the funding framework and amendments to the Plans. The Pension Committee, consisting of members of the Executive Board and senior staff, has overall responsibility for carrying out the provisions of the SRP and the SRBP. The Pension Committee also undertakes periodic valuations of the assets and liabilities related to the Plans, and advises the Executive Board on the appropriate funding framework. It is supported by an Investment Committee to oversee the investments of the Plans.
11.2 Risk management The IMF is exposed to investment, liquidity, and longevity risks associated with the Plans. These risks are balanced against the need to meet the financial obligations of each plan. The Plans have adopted general guidelines on permissible investments and plan assets are invested according to a strategic asset allocation, which is expected to generate a rate of return at or in excess of the rate of growth in the Plans’ liabilities. The strategic asset allocation is reviewed periodically by the Investment Committee. The strategic asset allocation is designed to minimize the level of portfolio market risk (volatility) for the targeted rate of return, while better aligning portfolio volatility with the potential volatility of the Plans’ liabilities. Through a global, multiple-asset-class investment approach, the portfolio risk is reduced for any targeted rate of return, because asset class returns are not perfectly correlated as regional and global economic, financial, and political events unfold. The Plans do not utilize specific, targeted asset-liability matching instruments or strategies such as annuities, longevity swaps, cash flow matching, or duration matching. The primary objective with respect to liquidity is to have sufficient liquid resources available to pay benefits when due. This risk is monitored to ensure that payments due to the participants and beneficiaries can be met from the holdings of cash and highly liquid investments of the Plans.

General Department
Notes to the financial statements for the financial years ended April 30, 2017, and 2016
23
11.3 Net defined benefit asset/liability and benefit costs The amounts recognized in the statements of financial position were determined as follows:
April 30, 2017
April 30, 2016
Pension benefits
Other employee benefits Total Total
(In millions of SDRs)
Defined benefit obligation (6,707) (1,726) (8,433) (8,068)
Plan assets 7,063)7 1,582)7 8,645) 7,560
Net defined benefit asset/(liability) 356)7 (144) ) 212) (508)
The amounts recognized in the statements of comprehensive income were as follows:
2017 2016
Pension benefits
Other employee benefits
Total Total
(In millions of SDRs)
Service cost 192) 74 266 303
Past service cost 12) 76 88 —
Interest expense related to defined benefit obligation 244) 64 308 356
Interest income related to plan assets (230) (51) (281) (314)
Net periodic pension cost 218) 163 381 345
Remeasurement of net defined benefit liability (222) (158) (380) (1,204)
Return on plan assets excluding amounts included in interest income (507) (109) (616) 674))
Exchange differences 15) 14 29 (13)
Amounts recognized in other comprehensive income (714) (253) (967) (543)
Total gain recognized in statements of comprehensive income (496) (90) (586) (198)
The reconciliation of the defined benefit obligation, based on actuarial estimates by independent actuaries using the projected unit credit method, was as follows:
2017 2016
Pension benefits
Other employee benefits Total Total
(In millions of SDRs)
Defined benefit obligation at the beginning of the year 6,407 1,661 8,068 8,882
Current service cost 192 74 266 303
Past service cost 12 76 88 —
Interest expense 244 64 308 356
Employee contributions 37 — 37 34
Actuarial loss due to demographic assumptions changes — — — 70
Actuarial gain due to financial assumptions changes (222) (158) (380) (1,274)
Benefits paid (195) (53) (248) (230)
Exchange differences 232 62 294 (73)
Defined benefit obligation at the end of the year 6,707 1,726 8,433 8,068
The reconciliation of changes in the fair value of plan assets was as follows:
2017 2016
Pension benefits
Other employee benefits
Total Total
(In millions of SDRs)
Fair value of plan assets at the beginning of the year 6,195 1,365 7,560 8,053
Return on plan assets excluding interest income 507 109 616 (674)
Interest income 230 51 281 314
Employer contributions 72 62 134 123
Employee contributions 37 — 37 34
Benefits paid (195) (53) (248) (230)
Exchange differences 217 48 265 (60)
Fair value of plan assets at the end of the year 7,063 1,582 8,645 7,560) )

General Department
Notes to the financial statements for the financial years ended April 30, 2017, and 2016
24
The fair value of major categories of plan assets was as follows:
April 30, 2017
April 30, 2016
Quoted market price in
an active market
No quoted market price in an active
market
Total
Total (In millions of SDRs)
Cash 246 — 246 321
Global equities 1,646 1,151 2,797 2,408
Emerging market equities 87 1,027 1,114 686
Global fixed income — 660 660 515
High-yield fixed income 6 729 735 679
Real assets 282 641 923 858
Private equity and absolute return — 2,170 2,170
2,093
Total 2,267 6,378 8,645 7,560 Participants in the pension plans contribute a fixed 7 percent of pensionable gross compensation. There were no actuarially determined employer contributions to the pension plans during the financial years ended April 30, 2017, and 2016. Under the IMF’s funding framework, the budgetary allocations for payments to the pension plans have been set at 14 percent of pensionable gross compensation. The IMF expects to contribute SDR 134 million to the Plans during the financial year ending April 30, 2018. The expected pension and benefits payments to be paid out by the Plans were as follows at April 30, 2017:
Financial year ending April 30 Pension benefits
Other employee benefits Total
(In millions of SDRs) 2018 228 72 300 2019 242 55 297 2020 258 58 316 2021 274 62 336 2022 287 65 352
11.4 Principal actuarial assumptions The IMF reviews the principal actuarial assumptions used in calculating the net defined benefit asset/liability every five years. The most recent review was completed in January 2016 and the principal actuarial assumptions were revised. The principal actuarial assumptions used in the actuarial valuation were as follows:
April 30, 2017
April 30, 2016
(In percent)
Discount rate/expected return on plan assets
3.97 3.75
Rate of salary increases (average) 4.50 Health care cost trend rate 4.00–6.50 4.00–6.75 Inflation 2.00
Life expectancy (In years) Male 88 Female 91
The assumed retirement rate ranges from 5 percent at age 50 to 100 percent at age 65, and the assumed participation rate for medical benefits upon retirement is 85 percent. The weighted average duration of the defined benefit obligation was 17.6 years as of April 30, 2017 (18.2 years as of April 30, 2016). The following shows the sensitivity of the present value of the defined benefit obligation to changes in actuarial assumptions at April 30, 2017:
Present value of the defined benefit obligation
Change in assumption
Increase in assumption
Decrease in assumption
(In millions of SDRs)
Discount rate 0.5% Decrease by 660 Increase by 760
Rate of salary increases 0.5% Increase by 110 Decrease by 110
Health care cost trend rate 0.5% Increase by 160 Decrease by 140
Inflation rate 0.5% Increase by 460 Decrease by 420
Life expectancy one year
in longevity
Increase by 260
The sensitivity analyses are based on a change in one assumption, while holding all other assumptions constant, so that the effects of correlation between the assumptions are excluded.
12. Burden sharing and the Special Contingent Account The IMF has adopted the burden sharing mechanism to cope with the financial consequences of member countries’ failure to settle financial obligations to the IMF on time. Under the burden sharing mechanism, resources are generated by increasing the rate of charge and reducing the rate of remuneration to cover shortfalls in the IMF’s income due to the nonpayment of charges. The burden sharing mechanism has also financed additions to the SCA-1, which offers protection against the risk of loss resulting from the ultimate failure of a member to repay its overdue obligations to the IMF. Members that participated in burden sharing for overdue charges receive refunds to the extent that these charges are subsequently settled. Contributions to the SCA-1 are returned when there are no outstanding overdue repurchases and charges, or at such earlier time as the IMF may decide. Cumulative overdue charges, net of settlements, that have resulted in adjustments to charges and remuneration since May 1, 1986 (the date the burden sharing mechanism was adopted), amounted to SDR 718 million at April 30, 2017 (SDR 715 million at April 30, 2016). The cumulative refunds for the same period, resulting from the settlements of overdue charges for which burden sharing adjustments have been made, amounted to SDR 1,320 million at April 30, 2017, and 2016. The SCA-1 balance amounted to SDR 1,188 million at April 30, 2017, and 2016. Effective November 1, 2006, the Executive Board decided to suspend, for the time being, further additions to the SCA-

General Department
Notes to the financial statements for the financial years ended April 30, 2017, and 2016
25
1. Accordingly, no additions have been made to the SCA-1 during the financial years ended April 30, 2017, and 2016.
13. Borrowings The Executive Board has established guidelines on borrowing by the IMF to ensure that the financing of the IMF is managed in a prudent and systemic manner. At April 30, 2017, the IMF had commitments of SDR 180.6 billion under the NAB, SDR 259 billion under the bilateral borrowing agreements, and SDR 18.5 billion under the GAB and an associated agreement with Saudi Arabia; see Schedule 4.
13.1 NAB, GAB, and associated agreement with Saudi Arabia The NAB is a standing set of credit arrangements with 38 participants that provide supplementary resources to the IMF as a second line of defense, when quota resources need to be supplemented in order to forestall or cope with an impairment of the international monetary system. Following the quota increases of all NAB participants under the Fourteenth General Review of Quotas, the total commitments under the NAB decreased from SDR 366.5 billion to SDR 180.6 billion during the financial year ended April 30, 2016.The NAB is the facility of first and principal recourse, and outstanding drawings and commitments under the NAB and GAB cannot exceed SDR 180.6 billion. The NAB is renewed periodically; in November 2016, the NAB was renewed through November 2022. NAB resources become available upon activation, which requires the consent of participants representing 85 percent of total NAB credit arrangements of participants eligible to vote and the approval of the Executive Board. Drawings under the NAB can be made to finance purchases by borrowing members for outright purchases and under arrangements that were approved during the period when NAB was activated. The NAB was deactivated in February 2016, but SDR 3,606 million remained available at April 30, 2017, to finance commitments approved during prior activation periods (SDR 38,441 million at April 30, 2016). Under the GAB and an associated agreement with Saudi Arabia, the IMF may potentially borrow up to SDR 17 billion and SDR 1.5 billion, respectively, when supplementary resources are needed to forestall or to cope with an impairment of the international monetary system. The GAB became effective on October 24, 1962, and has been renewed periodically, most recently through December 26, 2018. The borrowing agreement with Saudi Arabia entered into force on December 26, 1983, and was last renewed through December 26, 2018.
13.2 Bilateral Borrowing Agreements Since 2009, the IMF has entered into bilateral loan and note purchase agreements with member countries or their central banks. Drawings under the first round of bilateral borrowings—the 2009 borrowing agreements—were used to finance commitments under
IMF arrangements approved before the activation of the NAB in April 2011. Effective April 1, 2013, the Executive Board decided not to draw on these borrowing agreements. Borrowings under 2009 agreements were fully repaid at April 30, 2017. Following the joint announcement in 2012 by the International Monetary and Financial Committee and the Group of Twenty Finance Ministers and Governors to further bolster IMF resources through bilateral borrowing, the IMF entered into bilateral borrowing agreements under the 2012 borrowing framework with members or their central banks. The 2012 agreements provided for an initial term of two years, with the option to extend the term for up to two additional years, and these four-year terms began to expire in October 2016. In August 2016, the Executive Board approved a new framework for bilateral borrowing that retains key modalities of the 2012 borrowing framework and includes a new multilateral voting structure that gives creditors a formal say in any future activation decisions. Agreements signed under the 2016 framework expire at end-2019 and are extendable for another year with creditors’ consents. Bilateral borrowing agreements are intended to serve as a third line of defense to IMF quotas and NAB resources. At April 30, 2017, lenders’ commitments under effective borrowing agreements totaled US$355 billion, equivalent to SDR 259 billion (US$398 billion equivalent to SDR 281 billion at April 30, 2016). Resources under bilateral borrowing agreements can be activated only if the amount of resources available for lending has fallen below a threshold of SDR 100 billion and upon approval by creditors representing 85 percent of the total credit amount committed. Drawings under the borrowing agreements may be made to fund commitments made during the term of the agreements during which they were active. Drawings are repayable in three months but maturities can be unilaterally extended by the IMF for up to 10 years. Upon determination by the Executive Board that exceptional circumstances exist as a result of a shortage of resources in relation to obligations falling due, the IMF, with consent of lenders, may further extend the maturities of outstanding drawings under many of the borrowing agreements for up to an additional five years. Claims under the bilateral borrowing agreements are encashable on demand by lenders, subject to certain conditions.
13.3 Outstanding borrowings Outstanding borrowings are denominated in SDRs and carry the SDR interest rate. During the financial year ended April 30, 2017, drawings under the NAB and repayments under the 2009 bilateral borrowing agreements and the NAB amounted to SDR 1,099 million and SDR 3,621 million, respectively (SDR 3,402 million and SDR 8,510 million, respectively, during the financial year ended April 30, 2016). Total outstanding borrowings at April 30, 2017, and 2016, were SDR 29,149 million and SDR 31,671 million, respectively (see Schedule 4). The average interest rate on outstanding borrowings was 0.185 percent per annum and 0.051 percent per annum for the financial years ended April 30, 2017, and 2016, respectively. The

General Department
Notes to the financial statements for the financial years ended April 30, 2017, and 2016
26
interest expense on outstanding borrowings during the same periods was SDR 55 million and SDR 18 million, respectively. Scheduled repayments of outstanding borrowings are summarized below: Financial year ending April 30 2017 2016
(In millions of SDRs) 2017 — 2,770 2018 2,203 2,523 2019 3,235 5,044 2020 5,651 6,327 2021 5,986 5,897 2022 5,992 5,786 2023 and beyond 6,082 3,324 Total 29,149 31,671
14. Quotas The IMF conducts a general review of members’ quotas at intervals of not more than five years. The review allows the IMF to assess the adequacy of quota resources to meet its financing needs and to allow for adjustments to members’ quotas to reflect their relative positions in the world economy. The Fourteenth General Review of Quotas, which became effective in January 2016, included an aggregate doubling of IMF quotas and a realignment of quota shares. Quota increases for individual countries become effective upon payment. As at April 30, 2017, 179 members had consented and paid in full their quota increases, amounting to SDR 237 billion (SDR 233 billion for 167 members, at April 30, 2016). This amount represents over 99 percent of the total quota increases that members were eligible for as of January 26, 2016 (SDR 239 billion). The Executive Board is working expeditiously on the Fifteenth General Review of Quotas, with the aim of completing it by the Spring Meetings of 2019 and no later than the Annual Meetings of 2019. Members’ quotas and reserve tranche positions were as follows:
April 30,
2017 April 30,
2016
(In millions of SDRs)
Total quotas 475,383) 471,568)
Total currency holdings 475,140) 473,409) Less: members’ outstanding use of IMF credit (48,300) (47,798) Less: administrative balances (11) (10)
Other subscription payments 426,829) 425,601)
Reserve tranche positions 48,554) 45,967)
15. Reserves of the General Resources Account The IMF’s reserves consist of the Special Reserve and the General Reserve. The General Reserve may be used inter alia to meet
capital losses and operational deficits, or for distribution. The Special Reserve can be used for the same purposes except distribution to members. At April 30, 2017, the balances of Special and General Reserves amounted to SDR 9,636 million and SDR 10,292 million, respectively (SDR 8,891 million and SDR 9,547 million, respectively, at April 30, 2016). The Executive Board determines annually what part of the GRA net income will be placed to the General Reserve or the Special Reserve, and what part, if any, will be distributed. For the financial year ended April 30, 2017, the Executive Board decided to place the GRA net income of SDR 1,410 million and the income transferred from the Fixed-Income Subaccount of the IA of SDR 80 million to the two reserves in equal proportions (SDR 1,018 million and SDR 18 million, respectively, in equal proportions, for the financial year ended April 30, 2016). The IMF’s precautionary balances consist of its reserves (excluding SDR 4.4 billion currently held in the Special Reserve, and attributable to the profits from the limited gold sales in 2009–2010 that has been earmarked for the Endowment Subaccount) and the SCA-1 (see Note 12). As of April 30, 2017, and 2016, precautionary balances amounted to SDR 16.7 billion and SDR 15.2 billion, respectively. At the most recent review of the adequacy of precautionary balances in February 2016, the Executive Board supported retaining the medium-term indicative target for precautionary balances at SDR 20 billion, while the minimum floor for precautionary balances was raised to SDR 15 billion.
16. Charges and fees The average credit outstanding subject to charges amounted to SDR 48,610 million and SDR 51,451 million for the financial years ended April 30, 2017, and 2016, respectively. The rate of charge levied on outstanding credit is equal to the basic rate of charge adjusted for burden sharing (see Note 12). The basic rate of charge is the SDR interest rate plus a fixed margin as determined by the Executive Board, which for the years ended April 30, 2017, and 2016, amounted to 100 basis points. The average rate of charge (adjusted for burden sharing) was 1.187 percent per annum and 1.051 percent per annum for the financial years ended April 30, 2017, and 2016, respectively. Effective February 17, 2016, credit outstanding in excess of 187.5 percent (prior to February 17, 2016, 300 percent) of quota resulting from purchases in the credit tranches and under the EFF, is subject to a level-based surcharge of 200 basis points per annum above the basic rate of charge. An additional time-based surcharge of 100 basis points per annum applies to such credit outstanding for more than three years, except for purchases under the EFF, for which the additional surcharge of 100 basis points applies after 51 months. Prior to February 17, 2016, the trigger for the time-based surcharge was the same for all facilities.

General Department
Notes to the financial statements for the financial years ended April 30, 2017, and 2016
27
Charges income consisted of the following:
2017 2016
(In millions of SDRs)
Basic charges 572 539 Surcharges 583 787 Burden sharing adjustments 2 1 Total charges 1,157 1,327
A service charge of 50 basis points is levied by the IMF on all purchases. A commitment fee is levied on the amount available for financing under an arrangement for each 12-month period and refunded as the member makes purchases under the arrangement. The commitment fee amounts to 15 basis points per annum for access up to 115 percent of quota, 30 basis points for access between 115 and 575 percent of quota, and 60 basis points for access in excess of 575 percent of quota. Prior to February 17, 2016, the relevant thresholds were 200 percent and 1,000 percent, respectively. Service charges and commitment fee income consisted of the following:
17. Remuneration A portion of the reserve tranche position is unremunerated. For a member that joined the IMF on or before April 1, 1978, the unremunerated portion is equal to 25 percent of the member’s quota on April 1, 1978 (that part of the quota subscription that was paid in gold prior to the Second Amendment of the Articles). For a member that joined the IMF after that date, its unremunerated reserve tranche is a percentage of its initial quota equivalent to the ratio of total unremunerated reserve tranches for all other members to their total quotas when the new member joined the IMF. The average remunerated reserve tranche amounted to SDR 40,293 million and SDR 25,542 million during the financial years ended April 30, 2017, and 2016, respectively. The rate of remuneration is currently equal to the SDR interest rate. Burden sharing adjustments may reduce the rate of remuneration but under the Articles of Agreement, the rate of remuneration may be no lower than 80 percent of the SDR interest rate. The average rate of remuneration (adjusted for burden sharing) for the financial years ended April 30, 2017, and 2016, was 0.182 percent per annum and 0.045 percent per annum, respectively. Remuneration consisted of the following:
18. Administrative expenses Administrative expenses, most of which were incurred in U.S. dollars, were as follows:
19. Special Disbursement Account Assets in the SDA can be used for special purposes authorized in the Articles of Agreement, including providing financial assistance on special terms to low-income member countries.
19.1 Structural Adjustment Facility The last SAF loan disbursement was made in 1995, and currently one member (Somalia) has overdue SAF repayment obligations (see Note 10). Interest on SAF loans is levied at 0.5 percent per annum. All interest income is deferred.
19.2 Trust Fund The SDA was initially activated to receive transfers from the Trust Fund. The IMF is the Trustee of the Trust Fund, which was established in 1976 to provide balance of payments assistance on concessional terms to eligible members that qualified for such assistance. The Trust Fund is in liquidation following its termination in 1981. Since that date, the activities of the Trust Fund have been confined to the conclusion of its affairs. The Trust Fund has no assets other than loans and interest receivable from Somalia and Sudan amounting to SDR 91 million at April 30, 2017, and 2016. All interest income is deferred. Proceeds from the payments of SAF loans and Trust Fund loans are transferred from the SDA to the Reserve Account of the PRG Trust as contributions. During the financial years ended April 30, 2017, and 2016, there were no such transfers.
2017 2016
(In millions of SDRs)
Service charges 30 23 Commitment fee 333 97 Total charges 363 120
2017 2016 (In millions of SDRs)
Remuneration 77) 13)
Burden sharing adjustments (2) (1)
75) 12)
2017 2016
(In millions of SDRs) Personnel 536) 510) Pension and other long-term employee benefits 381) 345) Travel 86) 88) Other 196) 177) 1,199) 1,120) Reimbursements (198) (169) Administrative expenses 1,001) 951)
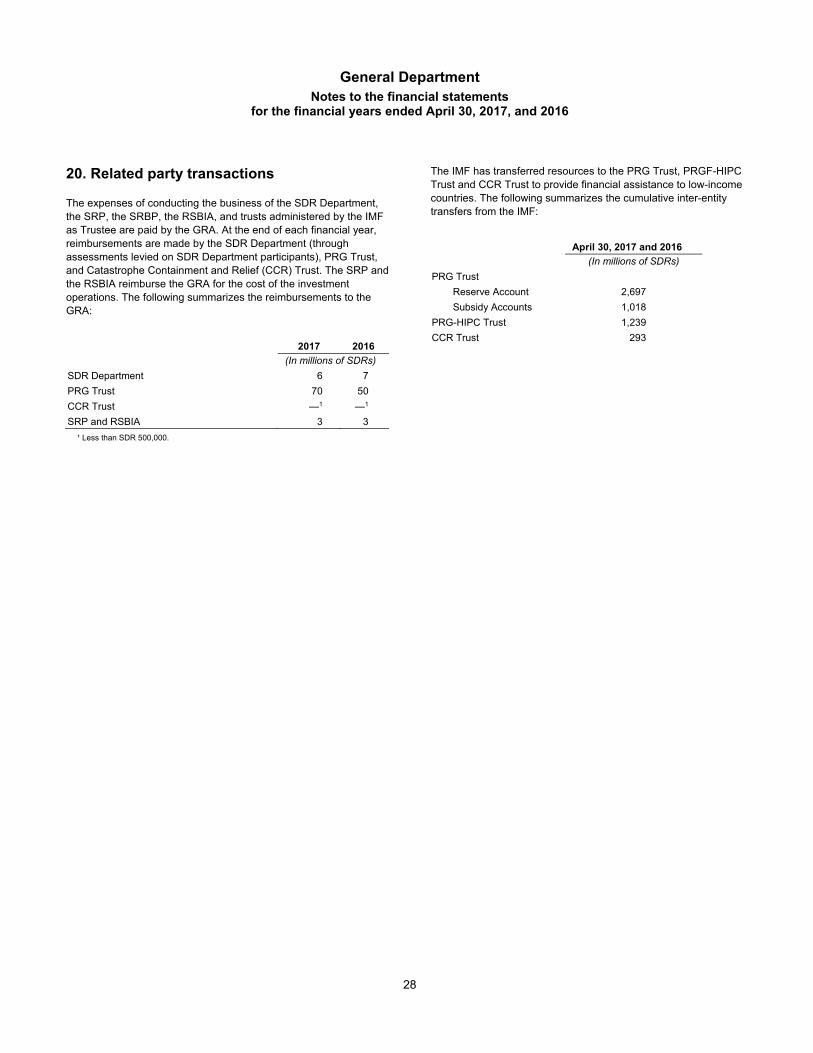
General Department
Notes to the financial statements for the financial years ended April 30, 2017, and 2016
28
20. Related party transactions The expenses of conducting the business of the SDR Department, the SRP, the SRBP, the RSBIA, and trusts administered by the IMF as Trustee are paid by the GRA. At the end of each financial year, reimbursements are made by the SDR Department (through assessments levied on SDR Department participants), PRG Trust, and Catastrophe Containment and Relief (CCR) Trust. The SRP and the RSBIA reimburse the GRA for the cost of the investment operations. The following summarizes the reimbursements to the GRA:
2017 2016
(In millions of SDRs)
SDR Department 6 7
PRG Trust 70 50
CCR Trust —1 —1
SRP and RSBIA 3 3
¹ Less than SDR 500,000.
The IMF has transferred resources to the PRG Trust, PRGF-HIPC Trust and CCR Trust to provide financial assistance to low-income countries. The following summarizes the cumulative inter-entity transfers from the IMF:
April 30, 2017 and 2016 (In millions of SDRs)
PRG Trust
Reserve Account 2,697
Subsidy Accounts 1,018
PRG-HIPC Trust 1,239
CCR Trust 293
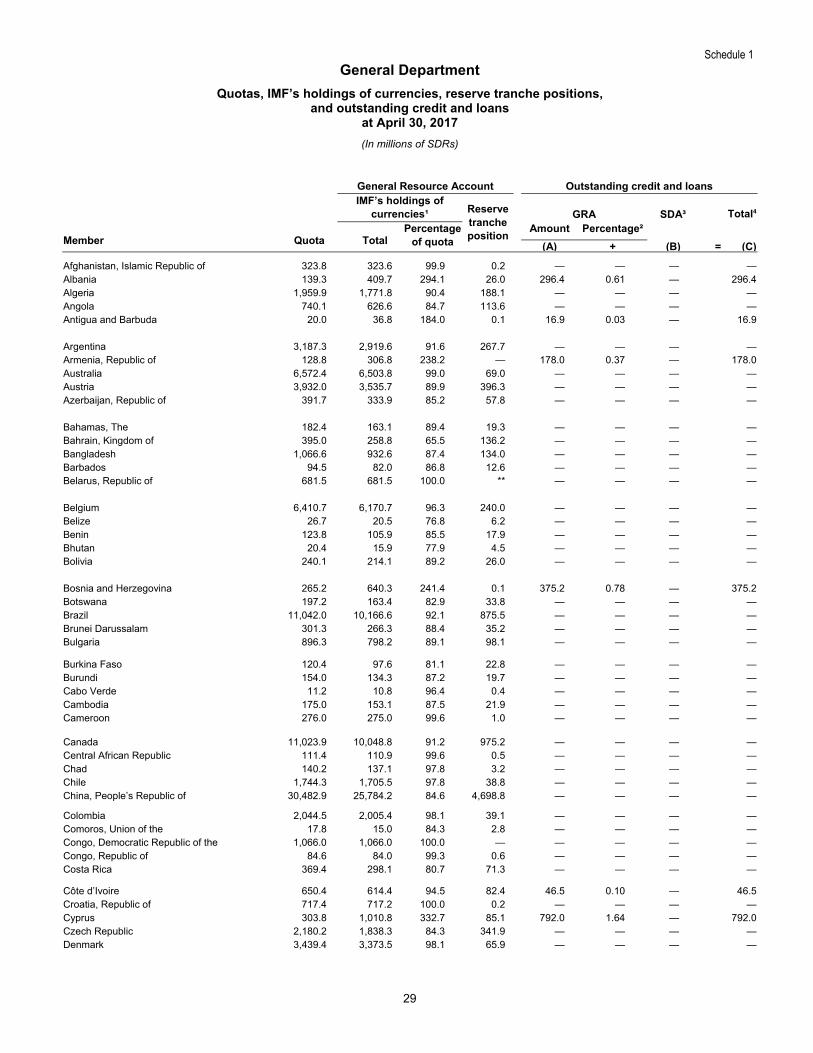
Schedule 1 General Department
Quotas, IMF’s holdings of currencies, reserve tranche positions, and outstanding credit and loans
at April 30, 2017
(In millions of SDRs)
29
General Resource Account Outstanding credit and loans IMF’s holdings of
currencies¹ Reserve tranche position
GRA SDA³ Total4
Member Quota Total Percentage
of quota Amount Percentage²
(A) + (B) = (C)
Afghanistan, Islamic Republic of 323.8 323.6 99.9 0.2 — — — —Albania 139.3 409.7 294.1 26.0 296.4 0.61 — 296.4Algeria 1,959.9 1,771.8 90.4 188.1 — — — —Angola 740.1 626.6 84.7 113.6 — — — —Antigua and Barbuda 20.0 36.8 184.0 0.1 16.9 0.03 — 16.9 Argentina 3,187.3 2,919.6 91.6 267.7 — — — —Armenia, Republic of 128.8 306.8 238.2 — 178.0 0.37 — 178.0Australia 6,572.4 6,503.8 99.0 69.0 — — — —Austria 3,932.0 3,535.7 89.9 396.3 — — — —Azerbaijan, Republic of 391.7 333.9 85.2 57.8 — — — — Bahamas, The 182.4 163.1 89.4 19.3 — — — —Bahrain, Kingdom of 395.0 258.8 65.5 136.2 — — — —Bangladesh 1,066.6 932.6 87.4 134.0 — — — —Barbados 94.5 82.0 86.8 12.6 — — — —Belarus, Republic of 681.5 681.5 100.0 ** — — — — Belgium 6,410.7 6,170.7 96.3 240.0 — — — —Belize 26.7 20.5 76.8 6.2 — — — —Benin 123.8 105.9 85.5 17.9 — — — —Bhutan 20.4 15.9 77.9 4.5 — — — —Bolivia 240.1 214.1 89.2 26.0 — — — — Bosnia and Herzegovina 265.2 640.3 241.4 0.1 375.2 0.78 — 375.2Botswana 197.2 163.4 82.9 33.8 — — — —Brazil 11,042.0 10,166.6 92.1 875.5 — — — —Brunei Darussalam 301.3 266.3 88.4 35.2 — — — —Bulgaria 896.3 798.2 89.1 98.1 — — — —
Burkina Faso 120.4 97.6 81.1 22.8 — — — —Burundi 154.0 134.3 87.2 19.7 — — — —Cabo Verde 11.2 10.8 96.4 0.4 — — — —Cambodia 175.0 153.1 87.5 21.9 — — — —Cameroon 276.0 275.0 99.6 1.0 — — — — Canada 11,023.9 10,048.8 91.2 975.2 — — — —Central African Republic 111.4 110.9 99.6 0.5 — — — —Chad 140.2 137.1 97.8 3.2 — — — —Chile 1,744.3 1,705.5 97.8 38.8 — — — —China, People’s Republic of 30,482.9 25,784.2 84.6 4,698.8 — — — —
Colombia 2,044.5 2,005.4 98.1 39.1 — — — —Comoros, Union of the 17.8 15.0 84.3 2.8 — — — —Congo, Democratic Republic of the 1,066.0 1,066.0 100.0 — — — — —Congo, Republic of 84.6 84.0 99.3 0.6 — — — —Costa Rica 369.4 298.1 80.7 71.3 — — — —
Côte d’Ivoire 650.4 614.4 94.5 82.4 46.5 0.10 — 46.5Croatia, Republic of 717.4 717.2 100.0 0.2 — — — —Cyprus 303.8 1,010.8 332.7 85.1 792.0 1.64 — 792.0Czech Republic 2,180.2 1,838.3 84.3 341.9 — — — —Denmark 3,439.4 3,373.5 98.1 65.9 — — — —

Schedule 1 (continued) General Department
Quotas, IMF’s holdings of currencies, reserve tranche positions, and outstanding credit and loans
at April 30, 2017
(In millions of SDRs)
30
General Resource Account Outstanding credit and loans IMF’s holdings of
currencies¹ Reserve tranche position
GRA SDA³ Total4
Member Quota Total Percentage
of quota Amount Percentage²
(A) + (B) = (C)
Djibouti 31.8 26.7 84.0 5.1 — — — —Dominica 11.5 11.5 100.0 ** — — — —Dominican Republic 477.4 412.8 86.5 64.6 — — — —Ecuador 697.7 930.8 133.4 28.5 261.6 0.54 — 261.6Egypt, Arab Republic of 2,037.1 3,733.8 183.3 273.4 1,970.1 4.08 — 1,970.1 El Salvador 287.2 287.2 100.0 — — — — —Equatorial Guinea, Republic of 157.5 152.6 96.9 4.9 — — — —Eritrea, The State of 15.9 15.9 100.0 ** — — — —Estonia, Republic of 243.6 202.0 82.9 41.6 — — — —Ethiopia, The Federal Democratic Republic of 300.7 293.3 97.5 7.5 — — — —
Fiji, Republic of 98.4 74.6 75.8 23.8 — — — —Finland 2,410.6 2,144.6 89.0 266.0 — — — —France 20,155.1 17,982.0 89.2 2,173.1 — — — —Gabon 216.0 199.4 92.3 16.7 — — — —Gambia, The 62.2 52.9 85.0 9.3 — — — — Georgia 210.4 290.4 138.0 ** 80.0 0.17 — 80.0Germany 26,634.4 23,799.6 89.4 2,834.9 — — — —Ghana 738.0 645.6 87.5 92.5 — — — —Greece 2,428.9 11,847.4 487.8 572.8 9,991.3 20.69 — 9,991.3Grenada 16.4 15.2 92.7 1.2 — — — —
Guatemala 428.6 374.0 87.3 54.6 — — — —Guinea 214.2 187.4 87.5 26.9 — — — —Guinea-Bissau 28.4 24.5 86.3 3.9 — — — —Guyana 181.8 181.8 100.0 — — — — —Haiti 163.8 143.3 87.5 20.5 — — — — Honduras 249.8 211.1 84.5 38.7 — — — —Hungary 1,940.0 1,640.8 84.6 299.2 — — — —Iceland 321.8 252.0 78.3 69.8 — — — —India 13,114.4 11,403.9 87.0 1,710.6 — — — —Indonesia 4,648.4 3,860.6 83.1 787.8 — — — —
Iran, Islamic Republic of 3,567.1 3,049.7 85.5 517.5 — — — —Iraq 1,663.8 3,175.2 190.8 290.0 1,801.3 3.73 — 1,801.3Ireland 3,449.9 6,416.0 186.0 806.8 3,772.8 7.81 — 3,772.8Israel 1,920.9 1,888.8 98.3 32.2 — — — —Italy 15,070.0 14,070.3 93.4 999.9 — — — — Jamaica 382.9 914.3 238.8 27.4 558.7 1.16 — 558.7Japan 30,820.5 27,224.9 88.3 3,596.1 — — — —Jordan 343.1 1,417.2 413.1 0.4 1,074.5 2.22 — 1,074.5Kazakhstan, Republic of 1,158.4 960.2 82.9 198.2 — — — —Kenya 542.8 529.5 97.5 13.4 — — — — Kiribati 11.2 9.8 87.5 1.4 — — — —Korea, Republic of 8,582.7 7,889.2 91.9 693.5 — — — —Kosovo 82.6 215.9 261.4 20.1 153.4 0.32 — 153.4Kuwait 1,933.5 1,778.2 92.0 155.5 — — — —Kyrgyz Republic 177.6 177.6 100.0 0.1 — — — —

Schedule 1 (continued) General Department
Quotas, IMF’s holdings of currencies, reserve tranche positions, and outstanding credit and loans
at April 30, 2017
(In millions of SDRs)
31
General Resource Account Outstanding credit and loans IMF’s holdings of
currencies¹ Reserve tranche
position
GRA SDA³ Total4
Member Quota Total Percentage
of quota Amount Percentage²
(A) + (B) = (C)
Lao People’s Democratic Republic 105.8 92.6 87.5 13.2 — — — —Latvia, Republic of 332.3 332.3 100.0 0.1 — — — —Lebanon 633.5 507.0 80.0 126.5 — — — —Lesotho, Kingdom of 69.8 57.2 81.9 12.6 — — — —Liberia 258.4 226.1 87.5 32.3 — — — — Libya 1,573.2 1,165.0 74.1 408.2 — — — —Lithuania, Republic of 441.6 441.6 100.0 ** — — — —Luxembourg 1,321.8 1,171.7 88.6 150.1 — — — —Macedonia, former Yugoslav Republic of 140.3 140.3 100.0 ** — — — —Madagascar, Republic of 244.4 213.8 87.5 30.6 — — — — Malawi 138.8 136.4 98.3 2.4 — — — —Malaysia 3,633.8 3,110.6 85.6 523.2 — — — —Maldives 21.2 16.4 77.4 4.8 — — — —Mali 186.6 153.3 82.2 33.3 — — — —Malta 168.3 139.5 82.9 28.9 — — — — Marshall Islands, Republic of the 3.5 3.5 100.0 ** — — — —Mauritania, Islamic Republic of 128.8 112.6 87.4 16.2 — — — —Mauritius 142.2 117.1 82.3 25.2 — — — —Mexico 8,912.7 8,018.2 90.0 894.6 — — — —Micronesia, Federated States of 5.1 5.1 100.0 ** — — — — Moldova, Republic of 172.5 311.7 180.7 ** 139.2 0.29 — 139.2Mongolia 72.3 66.9 92.5 5.4 — — — —Montenegro 60.5 45.7 75.5 14.9 — — — —Morocco 894.4 747.4 83.6 147.0 — — — —Mozambique, Republic of 227.2 198.8 87.5 28.4 — — — — Myanmar 516.8 516.8 100.0 — — — — —Namibia 191.1 191.0 99.9 0.1 — — — —Nauru 2.8 2.1 75.0 0.7 — — — —Nepal 156.9 140.9 89.8 16.0 — — — —Netherlands, Kingdom of the 8,736.5 8,260.5 94.6 476.0 — — — — New Zealand 1,252.1 1,122.6 89.7 129.6 — — — —Nicaragua 260.0 227.5 87.5 32.5 — — — —Niger 131.6 106.5 80.9 25.1 — — — —Nigeria 2,454.5 2,279.1 92.9 175.5 — — — —Norway 3,754.7 3,524.8 93.9 229.9 — — — — Oman 544.4 448.7 82.4 95.7 — — — —Pakistan 2,031.0 6,423.9 316.3 0.1 4,393.0 9.10 — 4,393.0Palau, Republic of 3.1 3.1 100.0 ** — — — —Panama 376.8 322.4 85.6 54.4 — — — —Papua New Guinea 131.6 131.2 99.7 0.5 — — — — Paraguay 201.4 154.6 76.8 46.9 — — — —Peru 1,334.5 1,304.2 97.7 30.4 — — — —Philippines 2,042.9 1,773.5 86.8 269.5 — — — —Poland, Republic of 4,095.4 3,865.8 94.4 229.6 — — — —Portugal 2,060.1 13,065.5 634.2 465.6 11,471.0 23.75 — 11,471.0

Schedule 1 (continued) General Department
Quotas, IMF’s holdings of currencies, reserve tranche positions, and outstanding credit and loans
at April 30, 2017
(In millions of SDRs)
32
General Resource Account Outstanding credit and loans IMF’s holdings of
currencies¹ Reserve tranche position
GRA SDA³ Total4
Member Quota Total Percentage
of quota Amount Percentage²
(A) + (B) = (C)
Qatar 735.1 563.7 76.7 171.4 — — — —Romania 1,811.4 1,811.4 100.0 — — — — —Russian Federation 12,903.7 11,425.3 88.5 1,478.5 — — — —Rwanda 160.2 140.2 87.5 20.0 — — — —St. Kitts and Nevis 12.5 11.5 92.0 1.0 — — — — St. Lucia 21.4 19.9 93.0 1.5 — — — —St. Vincent and the Grenadines 11.7 13.3 113.7 0.5 2.1 ** — 2.1Samoa 16.2 14.4 88.9 1.8 — — — —San Marino, Republic of 49.2 37.0 75.2 12.2 — — — —São Tomé and Príncipe, Democratic
Republic of 14.8 14.8 100.0 ** — — — —
Saudi Arabia 9,992.6 9,536.9 95.4 455.7 — — — —Senegal 323.6 281.3 86.9 42.3 — — — —Serbia, Republic of 654.8 608.0 92.9 46.8 — — — —Seychelles 22.9 50.0 218.3 3.5 30.6 0.06 — 30.6Sierra Leone 207.4 207.4 100.0 ** — — — — Singapore 3,891.9 3,314.0 85.2 578.0 — — — —Slovak Republic 1,001.0 847.6 84.7 153.4 — — — —Slovenia, Republic of 586.5 483.2 82.4 103.4 — — — —Solomon Islands 20.8 17.7 85.1 3.2 — — — —Somalia 44.2 140.5 317.9 — 96.2 0.20 8.8 111.5 South Africa 3,051.2 2,630.7 86.2 420.5 — — — —South Sudan, Republic of 246.0 246.0 100.0 — — — — —Spain 9,535.5 8,736.6 91.6 798.9 — — — —Sri Lanka 578.8 805.2 139.1 47.9 274.2 0.57 — 274.2Sudan 169.7 325.7 191.9 ** 156.0 0.32 — 215.2 Suriname 128.9 177.7 137.9 9.2 58.0 0.12 — 58.0Swaziland, Kingdom of 78.5 71.9 91.6 6.6 — — — —Sweden 4,430.0 4,348.8 98.2 81.2 — — — —Switzerland 5,771.1 5,758.0 99.8 13.1 — — — —Syrian Arab Republic 293.6 293.6 100.0 ** — — — — Tajikistan, Republic of 174.0 174.0 100.0 ** — — — —Tanzania, United Republic of 397.8 338.1 85.0 59.7 — — — —Thailand 3,211.9 2,751.5 85.7 460.4 — — — —Timor-Leste, Democratic Republic of 25.6 21.3 83.2 4.4 — — — —Togo 146.8 127.9 87.1 18.9 — — — — Tonga 13.8 10.4 75.4 3.4 — — — —Trinidad and Tobago 469.8 384.1 81.8 85.7 — — — —Tunisia 545.2 1,575.9 289.0 121.2 1,151.9 2.38 — 1,151.9Turkey 4,658.6 4,545.8 97.6 112.8 — — — —Turkmenistan 238.6 197.8 82.9 40.9 — — — —
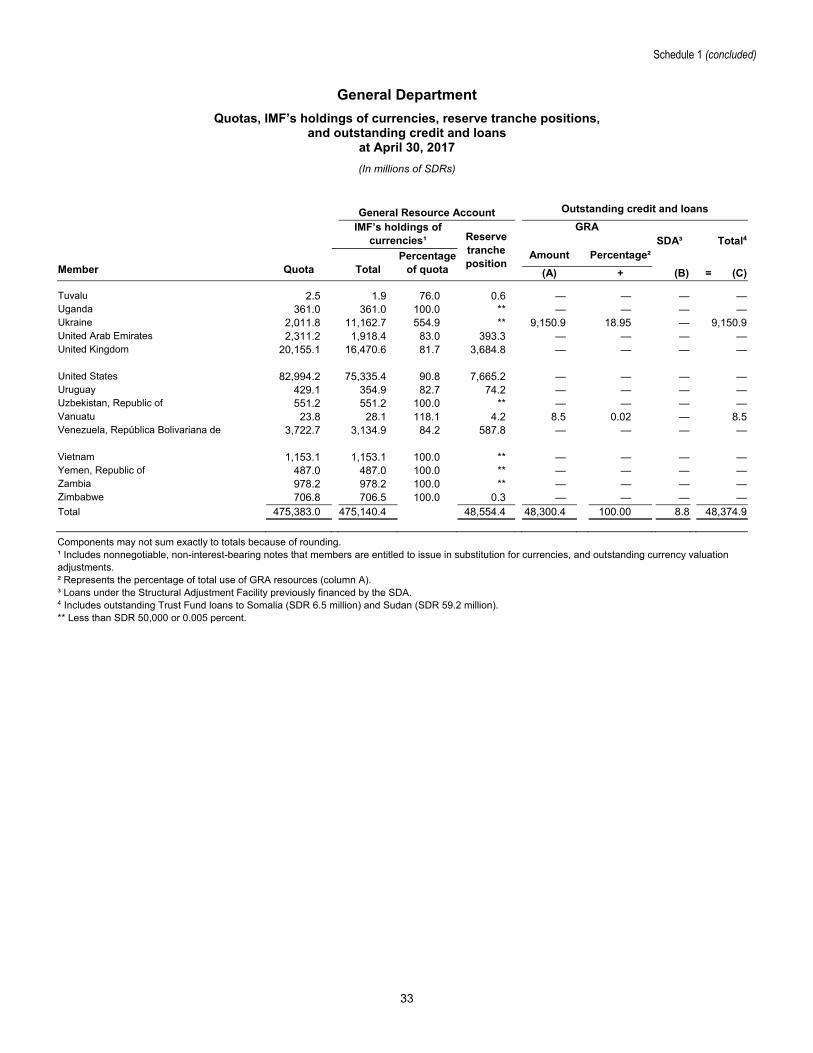
Schedule 1 (concluded)
General Department
Quotas, IMF’s holdings of currencies, reserve tranche positions, and outstanding credit and loans
at April 30, 2017
(In millions of SDRs)
33
Components may not sum exactly to totals because of rounding. ¹ Includes nonnegotiable, non-interest-bearing notes that members are entitled to issue in substitution for currencies, and outstanding currency valuation adjustments. ² Represents the percentage of total use of GRA resources (column A). ³ Loans under the Structural Adjustment Facility previously financed by the SDA. 4 Includes outstanding Trust Fund loans to Somalia (SDR 6.5 million) and Sudan (SDR 59.2 million). ** Less than SDR 50,000 or 0.005 percent.
General Resource Account Outstanding credit and loans
IMF’s holdings of currencies¹ Reserve
tranche position
GRA SDA³ Total4
Member Quota Total Percentage
of quota Amount Percentage²
(A) + (B) = (C)
Tuvalu 2.5 1.9 76.0 0.6 — — — —Uganda 361.0 361.0 100.0 ** — — — —Ukraine 2,011.8 11,162.7 554.9 ** 9,150.9 18.95 — 9,150.9United Arab Emirates 2,311.2 1,918.4 83.0 393.3 — — — —United Kingdom 20,155.1 16,470.6 81.7 3,684.8 — — — — United States 82,994.2 75,335.4 90.8 7,665.2 — — — —Uruguay 429.1 354.9 82.7 74.2 — — — —Uzbekistan, Republic of 551.2 551.2 100.0 ** — — — —Vanuatu 23.8 28.1 118.1 4.2 8.5 0.02 — 8.5Venezuela, República Bolivariana de 3,722.7 3,134.9 84.2 587.8 — — — — Vietnam 1,153.1 1,153.1 100.0 ** — — — —Yemen, Republic of 487.0 487.0 100.0 ** — — — —Zambia 978.2 978.2 100.0 ** — — — —Zimbabwe 706.8 706.5 100.0 0.3 — — — —Total 475,383.0 475,140.4 48,554.4 48,300.4 100.00 8.8 48,374.9

Schedule 2
34
General Department
Financial resources and liquidity position in the General Resources Account
at April 30, 2017, and 2016
(In millions of SDRs)
2017 2016
Usable resources
Usable currencies 359,434 360,036
SDR holdings 28,256 31,842
Available resources under borrowing arrangements1 3,606 38,441
Total usable resources2 391,296 430,319
Less: Undrawn balances under GRA arrangements 102,277 77,592
Equals: Uncommitted usable resources 289,019 352,727
Plus: Repurchases one-year forward3 3,014 2,236
Less: Repayments of borrowing one-year forward4 2,203 2,770
Less: Prudential balance5 79,925 79,613
Equals: One-year forward commitment capacity (FCC)6 209,905 272,580
Memorandum items
Resources committed under borrowing arrangements
GAB/NAB7 180,573 180,573
Bilateral borrowing agreements 259,006 280,817
Quotas of members that finance IMF transactions 399,626 398,067
Liquid liabilities
Reserve tranche positions 48,554 45,967
Outstanding borrowings 29,149 31,671
¹ The available resources under borrowing arrangements represent NAB financing from prior activation periods not yet drawn. ² Usable resources consist of (i) holdings of currencies of members considered by the IMF as having balance of payments and reserve positions sufficiently strong for their currencies to be used in transfers, (ii) SDR holdings, and (iii) any unused amounts under credit lines that have been activated. ³ Repurchases by member countries falling due during the coming 12-month period. ⁴ Repayments of borrowings falling due during the coming 12-month period. ⁵ Prudential balance is set at 20 percent of quotas of members whose currencies are used in the financing of IMF transactions. ⁶ The FCC does not include bilateral commitments from members to boost the IMF’s resources. These resources will be counted toward the FCC only once (i) individual bilateral agreements are effective and (ii) the associated resources are available for use by the IMF in accordance with the 2016 borrowing framework. 7 Outstanding drawings and commitments under the NAB and GAB cannot exceed SDR 180.6 billion.
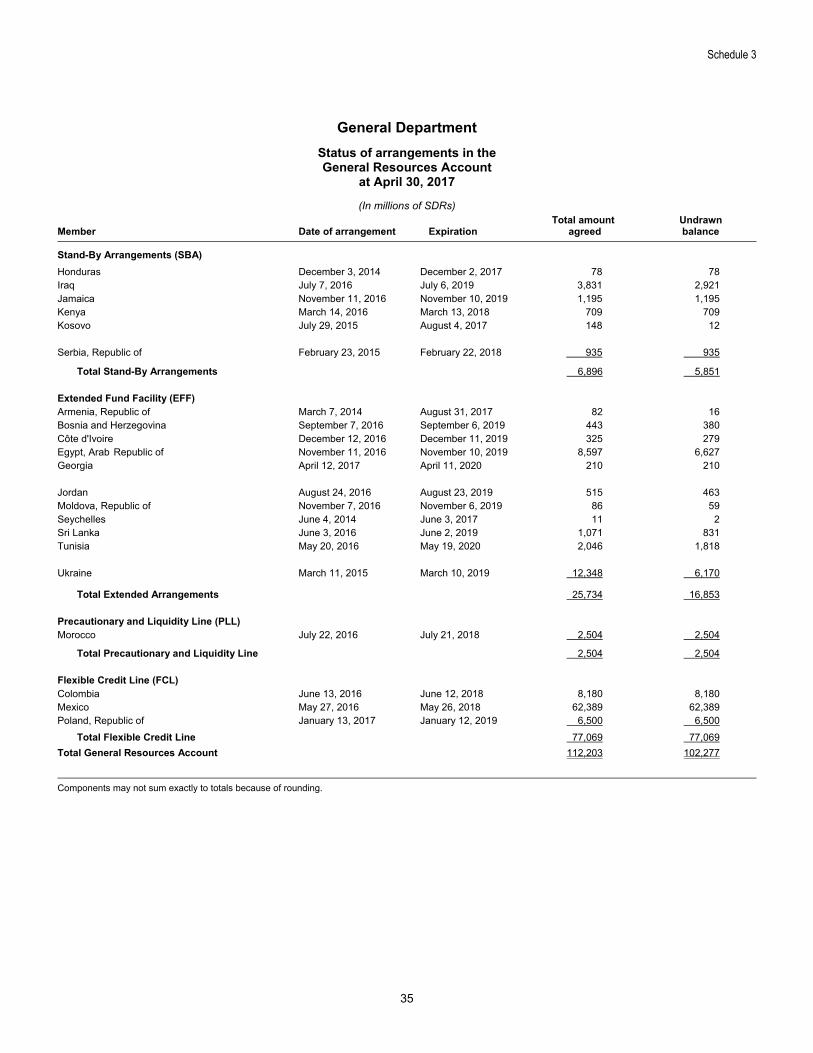
Schedule 3
35
General Department
Status of arrangements in the General Resources Account
at April 30, 2017
(In millions of SDRs)
Member Date of arrangement Expiration Total amount
agreed Undrawn balance
Stand-By Arrangements (SBA)
Honduras December 3, 2014 December 2, 2017 78 78 Iraq July 7, 2016 July 6, 2019 3,831 2,921 Jamaica November 11, 2016 November 10, 2019 1,195 1,195 Kenya March 14, 2016 March 13, 2018 709 709 Kosovo July 29, 2015 August 4, 2017 148 12 Serbia, Republic of February 23, 2015 February 22, 2018 935 935
Total Stand-By Arrangements 6,896 5,851 Extended Fund Facility (EFF) Armenia, Republic of March 7, 2014 August 31, 2017 82 16 Bosnia and Herzegovina September 7, 2016 September 6, 2019 443 380 Côte d'Ivoire December 12, 2016 December 11, 2019 325 279 Egypt, Arab Republic of November 11, 2016 November 10, 2019 8,597 6,627 Georgia April 12, 2017 April 11, 2020 210 210 Jordan August 24, 2016 August 23, 2019 515 463 Moldova, Republic of November 7, 2016 November 6, 2019 86 59 Seychelles June 4, 2014 June 3, 2017 11 2 Sri Lanka June 3, 2016 June 2, 2019 1,071 831 Tunisia May 20, 2016 May 19, 2020 2,046 1,818 Ukraine March 11, 2015 March 10, 2019 12,348 6,170
Total Extended Arrangements 25,734 16,853
Precautionary and Liquidity Line (PLL) Morocco July 22, 2016 July 21, 2018 2,504 2,504
Total Precautionary and Liquidity Line 2,504 2,504
Flexible Credit Line (FCL) Colombia June 13, 2016 June 12, 2018 8,180 8,180 Mexico May 27, 2016 May 26, 2018 62,389 62,389 Poland, Republic of January 13, 2017 January 12, 2019 6,500 6,500
Total Flexible Credit Line 77,069 77,069
Total General Resources Account 112,203 102,277
Components may not sum exactly to totals because of rounding.

Schedule 4
36
Components may not sum exactly to totals because of rounding. 1 The IMF may borrow under the NAB, the GAB, and the associated agreement with Saudi Arabia, none of which had been activated at April 30, 2017. Members have also entered into bilateral borrowing agreements with the IMF to boost its resources. The resources under these agreements serve as a third line of defense to the IMF’s quota and NAB resources. At April 30, 2017, bilateral agreements totaling US$355 billion (SDR 259 billion) with the following lenders were signed and effective: Bank of Algeria, Australia, Oesterreichische Nationalbank, Banco Central do Brasil, Government of Brunei Darussalam, Canada, Central Bank of Chile, People’s Bank of China, Czech National Bank, Danmarks Nationalbank, Bank of Finland, Government of France, Deutsche Bundesbank, Reserve Bank of India, Government of Japan, Korea, Government of Luxembourg, Bank Negara Malaysia, Banco de Mexico, New Zealand, Central Reserve Bank of Peru, Bangko Sentral ng Pilipinas, Narodowy Bank Polski, Saudi Arabia, Monetary Authority of Singapore, Slovak Republic, Bank of Slovenia, South African Reserve Bank, Kingdom of Spain, Sveriges Riksbank, Bank of Thailand, Central Bank of the Republic of Turkey, and United Kingdom. 2 The 2009 agreements have expired and all outstanding borrowings were fully repaid at April 30, 2017.
General Department
Schedule of borrowings in the
General Resources Account at April 30, 2017, and 20161
(In millions of SDRs)
Outstanding borrowings
Member, Central Bank Commitment amounts
2017
2016
NAB commitments
Australia 2,220 378 393 Austria 1,818 307 328 Belgium 3,994 568 720 Brazil 4,441 757 800 Canada 3,874 624 699 Banco Central de Chile 691 118 125 China 15,860 2,372 2,363 Cyprus 340 31 31 Danmarks Nationalbank 1,630 231 288 Deutsche Bundesbank 12,890 1,992 2,322 Finland 1,134 192 200 France 9,479 1,449 1,695 Hong Kong Monetary Authority 340 51 30 India 4,441 611 801 Bank of Israel 340 58 45 Italy 6,899 978 1,243 Japan 33,509 5,103 4,981 Korea 3,345 570 591 Kuwait 341 50 51 Luxembourg 493 84 89 Malaysia 340 51 51 Mexico 2,538 432 448 Netherlands 4,595 651 828 New Zealand 340 58 56 Norway 1,967 303 347 Bangko Sentral ng Pilipinas 340 58 30 National Bank of Poland 1,285 217 228 Banco de Portugal 784 — — Russian Federation 4,441 751 800 Saudi Arabia 5,653 956 998 Singapore 649 110 118 South Africa 340 58 30 Spain 3,405 428 613 Sveriges Riksbank 2,256 321 390 Swiss National Bank 5,541 937 978 Thailand 340 58 52 United Kingdom 9,479 1,342 1,672 United States 28,202 5,895 6,225
180,573 29,149 31,659 2009 Borrowing Agreements2
Czech National Bank — 6 Central Bank of Malta — 1 Slovak Republic — 3 Bank of Slovenia — 2
Total 29,149 31,671

pwc Report of Independent Auditors
To the Board of Governors of the International Monetary Fund
We have audited the accompanying financial statements of the Special Drawing Rights Department (SDR Department) of the International Monetary Fund (the "Department"), which comprise the statements of financial position as of April 30, 2017 and 2016, and the related statements of comprehensive income for the years then ended.
We are independent of the Department in accordance with the ethical requirements that are relevant to our audit of the financial statements in the United States of America, together with the International Ethics Standards Board for Accountants' Code of Ethics for Professional Accountants, and we have fulfilled our other ethical responsibilities in accordance with these requirements, respectively.
Responsibilities of Management and Those Charged With Governance for the Financial Statements
Management is responsible for the preparation and fair presentation of the financial statements in accordance with International Financial Reporting Standards as issued by the International Accounting Standards Board; this includes the design, implementation, and maintenance of internal control relevant to the preparation and fair presentation of financial statements that are free from material misstatement, whether due to fraud or error.
In preparing the financial statements, management is responsible for assessing the Department's ability to continue as a going concern, disclosing, as applicable, matters related to going concern and using the going concern basis of accounting, unless management either intends to liquidate the Department or to cease operations or has no realistic alternative but to do so.
Those charged with governance are responsible for overseeing the Department's financial reporting process.
Auditors' Responsibility
Our responsibility is to express an opinion on the financial statements based on our audits. We conducted our audits in accordance with auditing standards generally accepted in the United States of America and International Standards on Auditing. Those standards require that we plan and perform the audit to obtain reasonable assurance about whether the financial statements are free from material misstatement, whether due to fraud or error. Reasonable assurance is a high level of assurance but is not a guarantee that an audit will always detect a material misstatement when it exists. Misstatements can arise from fraud or error and are considered material if, individually or in the aggregate, they could reasonably be expected to influence the economic decisions of users taken on the basis of the financial statements.
An audit involves performing procedures to obtain audit evidence about the amounts and disclosures in the financial statements. The procedures selected depend on our judgment, including the assessment of the risks of material misstatement of the financial statements, whether due to fraud or error. We design audit procedures responsive to those risks and obtain audit evidence that is sufficient and appropriate to provide a basis for our opinion. The risk of not detecting a material misstatement resulting from fraud is higher than for one resulting from error because fraud may involve collusion, forgery, intentional omissions, misrepresentations, or the override of internal control.
In making those risk assessments, we consider internal control relevant to the Department's preparation and fair presentation of the financial statements in order to design audit procedures that are appropriate in the circumstances but not for the purpose of expressing an opinion on the effectiveness of the
PricewaterhouseCoopers LLP, 1800 Tysons Boulevard, McLean, VA 22102-4261 T: (703) 918 3000, F: (703) 918 3100, www.pwc.com/us

pwc Department's internal control. Accordingly, we express no such opinion. An audit also includes evaluating the appropriateness of accounting policies used and the reasonableness of significant accounting estimates made by management, as well as evaluating the overall presentation, structure, and content of the financial statements, including disclosures, and whether the financial statements represent the underlying transactions and events in a manner that achieves fair presentation.
As part of an audit:
• We exercise professional judgment and maintain professional skepticism throughout the audit. • We conclude on the appropriateness of management's use of the going concern basis of
accounting and based on the audit evidence obtained, whether a material uncertainty exists related to events or conditions that may cast significant doubt on the Department's ability to continue as a going concern. If we conclude that a material uncertainty exists, we are required to draw attention in our report to the related disclosures in the financial statements or, if such disclosures are inadequate, to modify our opinion. Our conclusions are based on the audit evidence obtained up to the date of our report. However, future events or conditions may cause the Department to cease to continue as a going concern.
• We communicate with those charged with governance regarding, among other matters, the planned scope and timing of the audit and significant audit findings, including any significant deficiencies or material weaknesses in internal control that we identify during our audit.
We believe that the audit evidence we have obtained is sufficient and appropriate to provide a basis for our audit opinion.
Opinion
In our opinion, the financial statements referred to above present fairly, in all material respects, the financial position of the Special Drawing Rights Department of the International Monetary Fund as of April 30, 2017 and 2016, and the results of its operations for the years then ended in accordance with International Financial Reporting Standards as issued by the International Accounting Standards Board.
Other Matter
Our audit was conducted for the purpose of forming an opinion on the financial statements taken as a whole. The supplemental schedules listed on pages 43 to 47 are presented for purposes of additional analysis and are not a required part of the financial statements. The information is the responsibility of management and was derived from and relates directly to the underlying accounting and other records used to prepare the financial statements. The information has been subjected to the auditing procedures applied in the audit of the financial statements and certain additional procedures, including comparing and reconciling such information directly to the underlying accounting and other records used to prepare the financial statements or to the financial statements themselves and other additional procedures, in accordance with auditing standards generally accepted in the United States of America. We also subjected the information to the applicable procedures required by the International Standards on Auditing. In our opinion, the information is fairly stated, in all material respects, in relation to the financial statements taken as a whole.
La? June 23, 2017

39
SDR Department
Statements of financial position at April 30, 2017, and 2016
(In millions of SDRs)
Note 2017 2016
Assets
Net charges receivable 32 4 Participants with holdings below allocations 4 Allocations 136,657 133,562 Less: SDR holdings 102,379 97,730 Allocations in excess of holdings 34,278 35,832 Total assets 34,310 35,836
Liabilities
Net interest payable 32 4 Participants with holdings above allocations 4 SDR holdings 72,438 73,197 Less: allocations 67,501 70,529 Holdings in excess of allocations 4,937 2,668 Holdings by the General Resources Account 28,256 31,842 Holdings by prescribed holders 1,085 1,322 Total liabilities 34,310 35,836 The accompanying notes are an integral part of these financial statements. These financial statements were approved by the Managing Director and the Director of Finance on June 23, 2017.
Christine Lagarde /s/ Managing Director
Andrew Tweedie /s/ Director, Finance Department
Statements of comprehensive income for the financial years ended April 30, 2017, and 2016
(In millions of SDRs)
2017 2016
Revenue
Net charges from participants with holdings below allocations 64 12 Assessment on SDR allocations 6 7 70 19 Expenses Interest on SDR holdings Net interest to participants with holdings above allocations 8 2 General Resources Account 54 9 Prescribed holders 2 1 64 12 Administrative expenses 6 7 70 19 Other comprehensive income — —
Total comprehensive income — —
The accompanying notes are an integral part of these financial statements.
SDR Department Notes to the financial statements
for the financial years ended April 30, 2017, and 2016
40
1. Nature of operations The Special Drawing Right (SDR) is an international interest-bearing reserve asset created by the International Monetary Fund (IMF) following the First Amendment of the Articles of Agreement in 1969. SDRs can be held and used only by participants in the SDR Department, by the IMF through the General Resources Account (GRA), and by certain official entities designated by the IMF and referred to as “prescribed holders”. The IMF may allocate SDRs, as a supplement to existing reserve assets, to members participating in the SDR Department. Their value as a reserve asset derives from the commitments of participants to hold and accept SDRs and to honor various obligations connected with the proper functioning of the SDR Department. A member earns interest on its holdings and pays interest on its cumulative allocations, both at the SDR interest rate. Members that use their SDRs, and therefore hold fewer SDRs than their cumulative allocations, will pay more interest than they will receive on their holdings. Conversely, members that hold more SDRs than their cumulative allocations will receive more interest than they will pay on their holdings. The resources of the SDR Department are held separately from the assets of all the other accounts of, or administered by, the IMF. They may not be used to meet the liabilities, obligations, or losses of the IMF incurred in the operations of the General Department or other accounts, except that the SDR Department reimburses the General Department for expenses incurred in conducting the business of the SDR Department. At April 30, 2017, and 2016, all members of the IMF were participants in the SDR Department. SDRs have been allocated by the IMF to members that are participants in the SDR Department in proportion to their quotas in the IMF at the time of the allocation. Since the creation of the SDR, three general allocations and one special allocation have been made, for a total of SDR 204.2 billion as of April 30, 2017 (SDR 204.1 billion as of April 30, 2016). Upon participants’ termination of participation in, or liquidation of, the SDR Department, the IMF will provide to holders freely usable currencies or currencies of holders received from the participants in settlement of their obligations. A freely usable currency is a member’s currency that the IMF has determined is widely used to make payments for international transactions and widely traded in the principal exchange markets. At present, the Chinese renminbi, euro, Japanese yen, pound sterling, and U.S. dollar are classified as freely usable currencies. The IMF may prescribe certain official entities as holders of SDRs; at April 30, 2017, and 2016, 15 institutions were prescribed as holders. Prescribed holders do not receive SDR allocations. The SDR is also used by several international and regional organizations as a unit of account or as the basis for their units of account. Several international conventions and treaties also use the SDR as a unit of account.
1.1 Uses of SDRs
Participants and prescribed holders can use and receive SDRs in transactions and operations by agreement among themselves. Participants can also use SDRs in operations and transactions involving the GRA of the General Department, such as the payment of quota, payment of charges, and repurchases. The GRA can use SDRs in operations and transactions involving participants, such as payment of remuneration and repayment of borrowings. If necessary, the IMF may also designate participants to provide freely usable
currency in exchange for SDRs; in doing so, the IMF ensures that a participant can use its SDRs to obtain an equivalent amount of freely usable currency if it has a need because of its balance of payments, its reserve position, or developments in its reserves.
1.2 Allocations and cancellations of SDRs
The IMF has the authority to provide unconditional liquidity through general allocations of SDRs to participants in the SDR Department in proportion to their quotas in the IMF. The IMF cannot allocate SDRs to itself or to other holders it prescribes. In its decisions on general allocations of SDRs, the IMF, as prescribed under its Articles, has sought to meet the long-term global need to supplement existing reserve assets and avoid economic stagnation and deflation as well as excess demand and inflation. A new IMF member that elects to participate in the SDR Department receives an initial allocation determined on the basis of its IMF quota. In addition, the member also receives a one-time special allocation of SDRs under the Fourth Amendment of the Articles of Agreement. The latter, which came to effect in 2009, was intended to enable all members at the time and new members to participate in the SDR system on an equitable basis. SDRs allocated under the special allocation to participants with overdue obligations to the IMF are held in an escrow account with the SDR Department and will be released to the participants upon their settlement of all overdue obligations (see Note 4). The Articles of Agreement also provide for cancellations of SDRs, although to date there have been no cancellations.
2. Basis of preparation and measurement The financial statements of the SDR Department are prepared in accordance with International Financial Reporting Standards (IFRS) issued by the International Accounting Standards Board (IASB). The financial statements have been prepared under the historical cost convention. The SDR Department is self-financed and does not have any equity as net cumulative allocations are equal to SDR holdings. It holds no cash or cash equivalents; and as net revenue and net expenditure are always equal, it generates no income. Cash flows arising from operating activities are limited to the receipt of charges and assessments and payment of interest and administrative expenses. A statement of cash flows is not presented as it would not provide additional information beyond that already contained in the Statements of Comprehensive Income. Changes in SDR holdings are shown in Schedule 1.
2.1 Unit of account The financial statements are presented in SDRs, which is the IMF’s unit of account. The value of the SDR is determined daily by the IMF by summing specific amounts of the basket currencies in U.S. dollar equivalents on the basis of market exchange rates. The IMF reviews the composition of the SDR valuation basket at a minimum of five-year intervals. The last review was completed in November 2015 and the Chinese renminbi was included in the SDR valuation basket effective
SDR Department Notes to the financial statements
for the financial years ended April 30, 2017, and 2016
41
October 1, 2016. The specific amounts of the currencies in the basket were as follows:
SDR basket currency October 1, 2016 to April 30, 2017
Prior to October 1, 2016
Chinese renminbi 1.01740 —
Euro 0.386710 0.423
Japanese yen 11.900 00 12.100
Pound sterling 0.085946 0.111
U.S. dollar 0.582520 0.660 At April 30, 2017, 1 SDR was equal to US$1.371020 (US$1.41733 at April 30, 2016). The next review of the method of valuation of the SDR will take place by September 30, 2021, unless developments in the interim justify an earlier review.
2.2 Use of estimates and judgment The preparation of financial statements requires management to make judgments, estimates, and assumptions that affect the application of the accounting policies and the reported amounts of assets, liabilities, income, and expenses. Actual results may differ from these estimates. Estimates and underlying assumptions are reviewed on an ongoing basis. Revisions to accounting estimates are recognized in the period in which the estimate is revised and in any future periods affected. Information about the most significant estimates and critical judgments used in applying accounting policies is described in Note 3.
3. Summary of significant accounting policies
3.1 New International Financial Reporting Standards The following amendments to existing standards issued by the IASB became effective in the financial year ended April 30, 2017. These amendments have no material impact on the SDR Department’s financial statements: Amendments to IFRS 7 “Financial Instruments: Disclosures”, issued in September 2014 and effective for annual periods starting on or after January 1, 2016. Amendments to IAS 1 “Presentation of Financial Statements”, issued in December 2014 and effective for annual periods starting on or after January 1, 2016. The following new standard has been issued by the IASB and will be effective for annual periods starting on or after January 1, 2018: In July 2014 the IASB published the complete version of IFRS 9 “Financial Instruments”, which replaced most of the guidance in IAS 39 “Financial Instruments: Recognition and Measurement”. The standard requires financial assets to be classified at fair value through profit or loss, fair value through other comprehensive income, or amortized cost on the basis of the entity’s business model for managing the assets and the contractual cash flow characteristics of the financial asset. No changes were introduced for the classification
and measurement of financial liabilities except for financial liabilities designated at fair value through profit or loss. For these financial liabilities, changes in the fair value due to the changes in an entity’s own credit risk must be recognized in other comprehensive income. The incurred loss model of IAS 39 has been replaced by a forward-looking expected credit loss impairment model. The impact of the adoption of IFRS 9 on the SDR Department’s financial statements is being assessed.
3.2. Interest and charges Interest is paid on holdings of SDRs, and charges are levied on each participant’s net cumulative SDR allocation at the SDR interest rate. Charges are also levied on any negative balance of the participant or unpaid charges (none during the years ended April 30, 2017, and 2016). If sufficient SDRs are not received because charges are overdue, additional SDRs are temporarily created. Interest and charges are settled by crediting and debiting the appropriate individual holdings accounts. The SDR interest rate is determined weekly by reference to a weighted average of yields or rates on short-term instruments in the money markets of the SDR basket currencies as follows:
1 Starting October 1, 2016.
The SDR interest rate is subject to a floor of 0.050 percent and is rounded to three decimal places. The average interest rate was 0.185 percent and 0.051 percent per annum for the financial years ended April 30, 2017, and 2016, respectively.
3.3 Overdue obligations An allowance for losses resulting from overdue SDR obligations would be created if a loss had been incurred. There were no overdue obligations and no losses have been incurred during the financial years ended April 30, 2017, and 2016.
4. Allocations and holdings At April 30, 2017, cumulative allocations to participants totaled SDR 204.2 billion (SDR 204.1 billion at April 30, 2016). Participants can use and receive SDRs in transactions and operations between themselves and with prescribed holders and the GRA. As a result, participants’ holdings may be greater or less than their allocations. Participants with holdings below their allocations have a net obligation
SDR basket currency Yield or rate
Chinese renminbi1 Three-month benchmark yield for China Treasury bonds as published by the China Central Depository and Clearing Co., Ltd.
Euro Three-month spot rate for euro area central government bonds with a minimum rating of AA published by the European Central Bank
Japanese yen Three-month Treasury Discount Bills
Pound sterling Three-month Treasury Bills
U.S. dollar Three-month Treasury Bills

SDR Department Notes to the financial statements
for the financial years ended April 30, 2017, and 2016
42
to the SDR Department, which is presented as an asset in the Statements of Financial Position. Participants with holdings in excess of their allocations have established a net claim on the SDR Department, which is presented in the Statements of Financial Position as a liability. Participants’ net SDR positions as of April 30, 2017, and 2016, were as follows:
2017 2016
Below Above Below Above allocations allocations Total allocations allocations Total
(In millions of SDRs) Cumulative allocations 136,657 67,501 204,158 133,562 70,529 204,091 Holdings of SDRs 102,379 72,438 174,817 97,730 73,197 170,927 Net SDR positions 34,278 (4,937) 29,341
35,832 (2,668) 33,164
The composition of SDR holdings as of April 30, 2017, and 2016, was as follows:
2017 2016
(In millions of SDRs) Participants 174,817 170,927 General Resources Account 28,256 31,842 Prescribed holders 1,085 1,322
Total holdings 204,158 204,091 In accordance with the provision of the Fourth Amendment of the IMF’s Articles of Agreement, SDRs are held in escrow on behalf of
participants with overdue obligations to the General Department and the Poverty Reduction and Growth (PRG) Trust. At April 30, 2017, SDR 20.3 million was held in escrow for Somalia (SDR 4.2 million) and Sudan (SDR 16.1 million) (SDR 86.7 million at April 30, 2016). These remaining amounts would be released to the participants upon the settlement of overdue obligations, and their allocations and holdings adjusted accordingly. Zimbabwe received SDR holdings of SDR 66.4 million previously held in escrow after settling its arrears in the PRG Trust in October 2016.
5. Related party transactions and administrative expenses The GRA is a holder of SDRs and conducts operations and transactions with the SDR Department participants. The GRA’s holdings of SDRs amounted to SDR 28.3 billion and SDR 31.8 billion at April 30, 2017, and 2016, respectively. The expenses of conducting the business of the SDR Department are paid by the IMF from the GRA, which is reimbursed by the SDR Department (SDR 6 million and SDR 7 million for the financial years ended April 30, 2017, and 2016, respectively). For this purpose, the SDR Department levies an assessment on all participants in proportion to their cumulative allocations at the end of each financial year.

Schedule 1 SDR Department
Statements of changes in SDR holdings for the financial years ended April 30, 2017, and 2016
(In millions of SDRs)
43
2017 2016
Participants
GeneralResources Account
Prescribed holders Participants
GeneralResources Account
Prescribed holders
Total holdings, beginning of the year 170,927 31,842 1,322
189,338 13,617 1,136
SDR allocation 67 — —
— — —
Transactions by agreement
Acquisitions 7,600 — 175
9,085 — 170
Sales (6,332) — (1,443)
(8,410) — (846)
Settlement of financial obligations (44) — 44
(100) — 100
Bridge loans —1 — —
—1 — —
GRA operations
Acquisitions in exchange for currencies of other members 750 (750) —
1,379 (1,379) —
Purchases 5,092 (5,092) —
3,134 (3,134) —
Repurchases (14) 14 —
(865) 865 —
Repayment of borrowings — — —
782 (782)
GRA charges (1,144) 1,144 —
(1,471) 1,471 —
Service charges and commitment fees, net of refunds (220) 220 —
(205) 205 —
Quota payments (845) 845 —
(20,943) 20,943 —
Remuneration 41 (41) —
10 (10) —
Interest on borrowings 33 (33) —
18 (18) —
Other IMF-related operations
PRG Trust disbursements 173 — (173)
372 — (372)
PRG Trust loan repayments and interest2 (806) — 806
(631) — 631
PRG Trust borrowings (576) — 576
(619) — 619
PRG Trust borrowing repayments and interest 157 — (157)
121 — (121)
Contributions to PRG Trust (4) — 4 (54) — 54
Net SDR charges (36) — —
(10) — —
Net SDR interest 4 31 1
2 7 1
Reimbursement of expenses (including SDR assessment) (6) 76 (70)
(7) 57 (50)
Total holdings, end of the year 174,817 28,256 1,085
170,927 31,842 1,322
Components may not sum exactly to totals because of rounding. 1 Participants without sufficient reserve assets to make their quota payment under the Fourteenth General Review of Quotas were provided with SDRs in loans by other participants. These loans were repaid on the same day. 2 The total PRG Trust loan repayments and interest for FY 2017 includes the settlement of overdue obligations (SDR 78 million) by Zimbabwe.

Schedule 2 SDR Department
Allocations and holdings of participants at April 30, 2017 (In millions of SDRs)
Holdings
Participant
Net cumulative allocations Total
Percentage of cumulative allocations
Above (below)
allocations
44
Afghanistan, Islamic Republic of 155.3 67.9 43.7 (87.5)Albania 46.5 140.9 303.3 94.4Algeria 1,198.2 898.4 75.0 (299.8)Angola 273.0 228.0 83.5 (45.0)Antigua and Barbuda 12.5 0.2 1.3 (12.3) Argentina 2,020.0 1,785.4 88.4 (234.7)Armenia, Republic of 88.0 7.1 8.1 (80.9)Australia 3,083.2 2,854.1 92.6 (229.0)Austria 1,736.3 1,624.2 93.5 (112.1)Azerbaijan, Republic of 153.6 95.9 62.4 (57.7) Bahamas, The 124.4 54.0 43.4 (70.4)Bahrain, Kingdom of 124.4 64.8 52.1 (59.6)Bangladesh 510.4 968.4 189.7 458.0Barbados 64.4 49.7 77.2 (14.7)Belarus, Republic of 368.6 371.8 100.9 3.1 Belgium 4,323.3 3,842.0 88.9 (481.4)Belize 17.9 20.0 111.9 2.1Benin 59.2 34.1 57.6 (25.1)Bhutan 6.0 6.0 100.1 **Bolivia 164.1 166.7 101.6 2.6 Bosnia and Herzegovina 160.9 2.5 1.6 (158.4)Botswana 57.4 58.5 101.8 1.0Brazil 2,887.1 2,597.9 90.0 (289.2)Brunei Darussalam 203.5 216.5 106.4 13.0Bulgaria 610.9 611.6 100.1 0.7 Burkina Faso 57.6 10.6 18.3 (47.0)Burundi 73.8 2.4 3.3 (71.4)Cabo Verde 9.2 0.8 8.8 (8.4)Cambodia 83.9 88.4 105.3 4.4Cameroon 177.3 15.5 8.8 (161.7) Canada 5,988.1 5,637.5 94.1 (350.6)Central African Republic 53.4 0.5 0.9 (52.9)Chad 53.6 0.2 0.3 (53.4)Chile 816.9 540.8 66.2 (276.0)China, People’s Republic of 6,989.7 7,194.4 102.9 204.7 Colombia 738.3 694.0 94.0 (44.3)Comoros, Union of the 8.5 8.0 94.1 (0.5)Congo, Democratic Republic of the 510.9 107.6 21.1 (403.2)Congo, Republic of 79.7 70.4 88.3 (9.3)Costa Rica 156.5 85.1 54.4 (71.5)
Côte d'Ivoire 310.9 147.7 47.5 (163.2)Croatia, Republic of 347.3 304.8 87.8 (42.5)Cyprus 132.8 49.2 37.1 (83.6)Czech Republic 780.2 457.1 58.6 (323.1)Denmark 1,531.5 1,430.0 93.4 (101.5)
Djibouti 15.2 0.7 4.4 (14.5)Dominica 7.8 0.9 11.6 (6.9)Dominican Republic 208.8 4.9 2.4 (203.9)Ecuador 288.4 14.7 5.1 (273.7)Egypt, Arab Republic of 898.5 558.4 62.2 (340.1)
El Salvador 163.8 165.6 101.1 1.7Equatorial Guinea, Republic of 31.3 21.1 67.6 (10.1)Eritrea, The State of 15.2 3.7 24.3 (11.5)Estonia, Republic of 62.0 24.6 39.8 (37.3)Ethiopia, The Federal Democratic Republic of 127.9 20.2 15.8 (107.8)
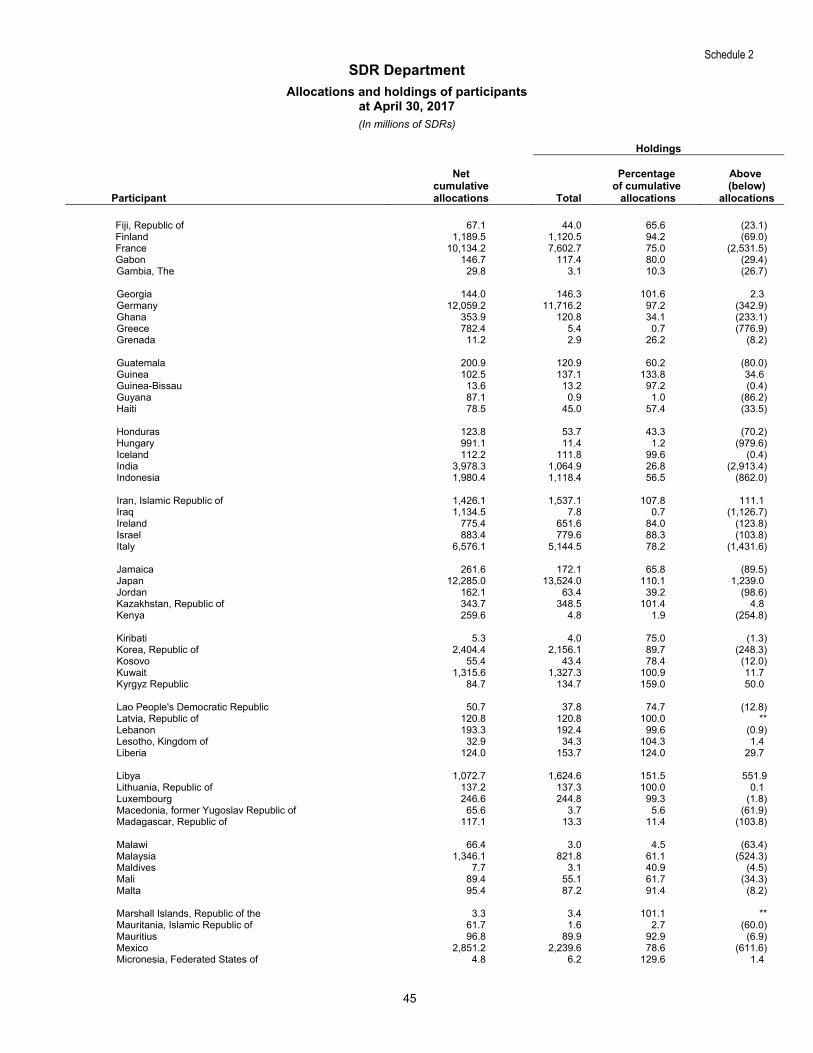
Schedule 2 SDR Department
Allocations and holdings of participants at April 30, 2017
(In millions of SDRs)
Holdings
Participant
Net cumulative allocations Total
Percentage of cumulative allocations
Above (below)
allocations
45
Fiji, Republic of 67.1 44.0 65.6 (23.1)Finland 1,189.5 1,120.5 94.2 (69.0)France 10,134.2 7,602.7 75.0 (2,531.5)Gabon 146.7 117.4 80.0 (29.4)Gambia, The 29.8 3.1 10.3 (26.7) Georgia 144.0 146.3 101.6 2.3Germany 12,059.2 11,716.2 97.2 (342.9)Ghana 353.9 120.8 34.1 (233.1)Greece 782.4 5.4 0.7 (776.9)Grenada 11.2 2.9 26.2 (8.2) Guatemala 200.9 120.9 60.2 (80.0)Guinea 102.5 137.1 133.8 34.6Guinea-Bissau 13.6 13.2 97.2 (0.4)Guyana 87.1 0.9 1.0 (86.2)Haiti 78.5 45.0 57.4 (33.5) Honduras 123.8 53.7 43.3 (70.2)Hungary 991.1 11.4 1.2 (979.6)Iceland 112.2 111.8 99.6 (0.4)India 3,978.3 1,064.9 26.8 (2,913.4)Indonesia 1,980.4 1,118.4 56.5 (862.0) Iran, Islamic Republic of 1,426.1 1,537.1 107.8 111.1Iraq 1,134.5 7.8 0.7 (1,126.7)Ireland 775.4 651.6 84.0 (123.8)Israel 883.4 779.6 88.3 (103.8)Italy 6,576.1 5,144.5 78.2 (1,431.6) Jamaica 261.6 172.1 65.8 (89.5)Japan 12,285.0 13,524.0 110.1 1,239.0Jordan 162.1 63.4 39.2 (98.6)Kazakhstan, Republic of 343.7 348.5 101.4 4.8Kenya 259.6 4.8 1.9 (254.8) Kiribati 5.3 4.0 75.0 (1.3)Korea, Republic of 2,404.4 2,156.1 89.7 (248.3)Kosovo 55.4 43.4 78.4 (12.0)Kuwait 1,315.6 1,327.3 100.9 11.7Kyrgyz Republic 84.7 134.7 159.0 50.0 Lao People's Democratic Republic 50.7 37.8 74.7 (12.8)Latvia, Republic of 120.8 120.8 100.0 **Lebanon 193.3 192.4 99.6 (0.9)Lesotho, Kingdom of 32.9 34.3 104.3 1.4Liberia 124.0 153.7 124.0 29.7 Libya 1,072.7 1,624.6 151.5 551.9Lithuania, Republic of 137.2 137.3 100.0 0.1Luxembourg 246.6 244.8 99.3 (1.8)Macedonia, former Yugoslav Republic of 65.6 3.7 5.6 (61.9)Madagascar, Republic of 117.1 13.3 11.4 (103.8) Malawi 66.4 3.0 4.5 (63.4)Malaysia 1,346.1 821.8 61.1 (524.3)Maldives 7.7 3.1 40.9 (4.5)Mali 89.4 55.1 61.7 (34.3)Malta 95.4 87.2 91.4 (8.2) Marshall Islands, Republic of the 3.3 3.4 101.1 **Mauritania, Islamic Republic of 61.7 1.6 2.7 (60.0)Mauritius 96.8 89.9 92.9 (6.9)Mexico 2,851.2 2,239.6 78.6 (611.6)Micronesia, Federated States of 4.8 6.2 129.6 1.4

Schedule 2 SDR Department
Allocations and holdings of participants at April 30, 2017 (In millions of SDRs)
Holdings
Participant
Net cumulative allocations Total
Percentage of cumulative allocations
Above (below)
allocations
46
Moldova, Republic of 117.7 10.7 9.1 (107.0)Mongolia 48.8 42.9 88.0 (5.8)Montenegro 25.8 18.1 70.1 (7.7)Morocco 561.4 548.5 97.7 (12.9)Mozambique, Republic of 108.8 18.0 16.6 (90.8) Myanmar 245.8 1.5 0.6 (244.3)Namibia 130.4 4.7 3.6 (125.7)Nauru 0.9 0.2 21.1 (0.7)Nepal 68.1 1.2 1.8 (66.9)Netherlands, Kingdom of the 4,836.6 4,481.3 92.7 (355.3) New Zealand 853.8 753.6 88.3 (100.1)Nicaragua 124.5 74.7 60.0 (49.9)Niger 62.9 39.2 62.3 (23.7)Nigeria 1,675.4 1,499.6 89.5 (175.7)Norway 1,563.1 1,380.7 88.3 (182.4) Oman 178.8 98.5 55.1 (80.3)Pakistan 988.6 454.6 46.0 (534.0)Palau, Republic of 3.0 3.0 101.1 **Panama 197.0 128.2 65.1 (68.8)Papua New Guinea 125.5 9.0 7.2 (116.5) Paraguay 95.2 95.7 100.6 0.5Peru 609.9 531.2 87.1 (78.7)Philippines 838.0 846.7 101.0 8.7Poland, Republic of 1,304.6 300.1 23.0 (1,004.6)Portugal 806.5 535.4 66.4 (271.1) Qatar 251.4 271.5 108.0 20.1Romania 984.8 988.0 100.3 3.2Russian Federation 5,671.8 4,823.3 85.0 (848.5)Rwanda 76.8 55.5 72.3 (21.3)St. Kitts and Nevis 8.5 4.7 55.6 (3.8) St. Lucia 14.6 9.7 66.3 (4.9)St. Vincent and the Grenadines 7.9 0.1 0.8 (7.8)Samoa 11.1 9.2 82.8 (1.9)San Marino 15.5 8.8 56.5 (6.8)São Tomé and Príncipe, Democratic Republic of 7.1 0.3 3.9 (6.8) Saudi Arabia 6,682.5 5,474.9 81.9 (1,207.6)Senegal 154.8 41.5 26.8 (113.3)Serbia, Republic of 445.0 10.0 2.2 (435.1)Seychelles 8.3 5.1 61.0 (3.2)Sierra Leone 99.5 105.1 105.6 5.6 Singapore 744.2 744.8 100.1 0.6Slovak Republic 340.5 185.3 54.4 (155.2)Slovenia, Republic of 215.9 162.6 75.3 (53.3)Solomon Islands 9.9 3.2 31.8 (6.8)Somalia 46.5 18.3 39.3 (28.2) South Africa 1,785.4 1,492.5 83.6 (292.9)South Sudan, Republic of 105.4 2.0 1.9 (103.4)Spain 2,827.6 2,767.3 97.9 (60.2)Sri Lanka 395.5 1.6 0.4 (393.9)Sudan 178.0 125.1 70.3 (52.9) Suriname 88.1 27.6 31.3 (60.5)Swaziland, Kingdom of 48.3 48.7 101.0 0.5Sweden 2,249.0 1,992.4 88.6 (256.6)Switzerland 3,288.0 3,204.4 97.5 (83.7)Syrian Arab Republic 279.2 282.2 101.1 3.0
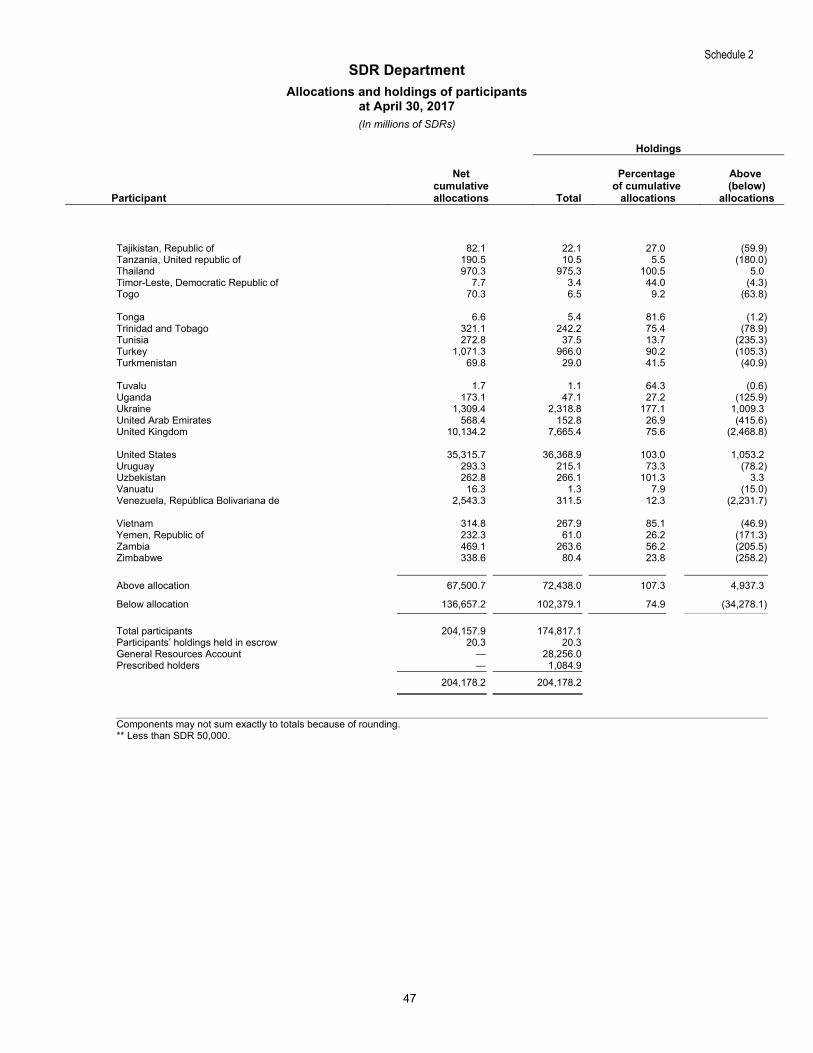
Schedule 2 SDR Department
Allocations and holdings of participants at April 30, 2017
(In millions of SDRs)
Holdings
Participant
Net cumulative allocations Total
Percentage of cumulative allocations
Above (below)
allocations
47
Tajikistan, Republic of 82.1 22.1 27.0 (59.9)Tanzania, United republic of 190.5 10.5 5.5 (180.0)Thailand 970.3 975.3 100.5 5.0Timor-Leste, Democratic Republic of 7.7 3.4 44.0 (4.3)Togo 70.3 6.5 9.2 (63.8) Tonga 6.6 5.4 81.6 (1.2)Trinidad and Tobago 321.1 242.2 75.4 (78.9)Tunisia 272.8 37.5 13.7 (235.3)Turkey 1,071.3 966.0 90.2 (105.3)Turkmenistan 69.8 29.0 41.5 (40.9) Tuvalu 1.7 1.1 64.3 (0.6)Uganda 173.1 47.1 27.2 (125.9)Ukraine 1,309.4 2,318.8 177.1 1,009.3United Arab Emirates 568.4 152.8 26.9 (415.6)United Kingdom 10,134.2 7,665.4 75.6 (2,468.8) United States 35,315.7 36,368.9 103.0 1,053.2Uruguay 293.3 215.1 73.3 (78.2)Uzbekistan 262.8 266.1 101.3 3.3Vanuatu 16.3 1.3 7.9 (15.0)Venezuela, República Bolivariana de 2,543.3 311.5 12.3 (2,231.7) Vietnam 314.8 267.9 85.1 (46.9)Yemen, Republic of 232.3 61.0 26.2 (171.3)Zambia 469.1 263.6 56.2 (205.5)Zimbabwe 338.6 80.4 23.8 (258.2)
Above allocation 67,500.7 72,438.0 107.3 4,937.3
Below allocation 136,657.2 102,379.1 74.9 (34,278.1)
Total participants 204,157.9 174,817.1 Participants’ holdings held in escrow 20.3 20.3 General Resources Account — 28,256.0 Prescribed holders — 1,084.9 204,178.2 204,178.2
Components may not sum exactly to totals because of rounding. ** Less than SDR 50,000.
pwc
Report of Independent Auditors
To the Board of Governors of the International Monetary Fund
We have audited the accompanying financial statements of the Poverty Reduction and Growth Trust (PRG Trust), the Trust for Special Poverty Reduction and Growth Operations for the Heavily Indebted Poor Countries and Interim ECF Subsidy Operations and related Umbrella Account for HIPC Operations (the PRG-HIPC Trust and related umbrella account), and the Catastrophe Containment and Relief Trust and the related Umbrella Account for CCR Operations (CCR Trust and related umbrella account) (collectively referred to as the "Concessional Lending and Debt Relief Trusts"), which comprise the statements of financial position as of April 30, 2017 and 2016, and the related statements of comprehensive income and changes in resources and of cash flows for the years then ended.
We are independent of the Trusts in accordance with the ethical requirements that are relevant to our audit of the financial statements in the United States of America, together with the International Ethics Standards Board for Accountants' Code of Ethics for Professional Accountants, and we have fulfilled our other ethical responsibilities in accordance with these requirements, respectively.
Responsibilities of Management and Those Charged With Governance for the Financial Statements
Management is responsible for the preparation and fair presentation of the financial statements in accordance with International Financial Reporting Standards as issued by the International Accounting Standards Board; this includes the design, implementation, and maintenance of internal control relevant to the preparation and fair presentation of financial statements that are free from material misstatement, whether due to fraud or error.
In preparing the financial statements, management is responsible for assessing the Trusts' ability to continue as a going concern, disclosing, as applicable, matters related to going concern and using the going concern basis of accounting, unless management either intends to liquidate the Trust or to cease operations or has no realistic alternative but to do so.
Those charged with governance are responsible for overseeing the Trusts' financial reporting process.
Auditors' Responsibility
Our responsibility is to express an opinion on the financial statements based on our audits. We conducted our audits in accordance with auditing standards generally accepted in the United States of America and International Standards on Auditing. Those standards require that we plan and perform the audit to obtain reasonable assurance about whether the financial statements are free from material misstatement, whether due to fraud or error. Reasonable assurance is a high level of assurance but is not a guarantee that an audit will always detect a material misstatement when it exists. Misstatements can arise from fraud or error and are considered material if, individually or in the aggregate, they could reasonably be expected to influence the economic decisions of users taken on the basis of the financial statements.
An audit involves performing procedures to obtain audit evidence about the amounts and disclosures in the financial statements. The procedures selected depend on our judgment, including the assessment of the risks of material misstatement of the financial statements, whether due to fraud or error. We design audit procedures responsive to those risks and obtain audit evidence that is sufficient and appropriate to
FricewaterhouseCoopers LLP, 180o Tysons Boulevard, McLean, VA 22102-4261 T: (703) 9183000, F: (703) 918 3100, www.pwc.com/us

pwc
provide a basis for our opinion. The risk of not detecting a material misstatement resulting from fraud is higher than for one resulting from error because fraud may involve collusion, forgery, intentional omissions, misrepresentations, or the override of internal control.
In making those risk assessments, we consider internal control relevant to the Trusts' preparation and fair presentation of the financial statements in order to design audit procedures that are appropriate in the circumstances but not for the purpose of expressing an opinion on the effectiveness of the Trusts' internal control. Accordingly, we express no such opinion. An audit also includes evaluating the appropriateness of accounting policies used and the reasonableness of significant accounting estimates made by management, as well as evaluating the overall presentation, structure, and content of the financial statements, including disclosures, and whether the financial statements represent the underlying transactions and events in a manner that achieves fair presentation.
As part of an audit:
• We exercise professional judgment and maintain professional skepticism throughout the audit. • We conclude on the appropriateness of management's use of the going concern basis of
accounting and based on the audit evidence obtained, whether a material uncertainty exists related to events or conditions that may cast significant doubt on the Trusts' ability to continue as a going concern. If we conclude that a material uncertainty exists, we are required to draw attention in our report to the related disclosures in the financial statements or, if such disclosures are inadequate, to modify our opinion. Our conclusions are based on the audit evidence obtained up to the date of our report. However, future events or conditions may cause the Trusts to cease to continue as a going concern.
• We communicate with those charged with governance regarding, among other matters, the planned scope and timing of the audit and significant audit findings, including any significant deficiencies or material weaknesses in internal control that we identify during our audit.
We believe that the audit evidence we have obtained is sufficient and appropriate to provide a basis for our audit opinions.
Opinion
In our opinion, the financial statements referred to above present fairly, in all material respects, the financial position of each of the Poverty Reduction and Growth Trust, the Trust for Special Poverty Reduction and Growth Operations for the Heavily Indebted Poor Countries and Interim ECF Subsidy Operations and the related Umbrella Account for HIPC Operations, and the Catastrophe Containment and Relief Trust and the related Umbrella Account for CCR Operations, as of April 30, 2017 and 2016, and the results of each of their operations and each of their cash flows for the years then ended in accordance with International Financial Reporting Standards as issued by the International Accounting Standards Board.

pwc
Other Matter
Our audit was conducted for the purpose of forming an opinion on each of the respective trust financial statements taken as a whole. The supplemental schedules listed on pages 62 to 70 are presented for purposes of additional analysis and are not a required part of the respective trust financial statements. The information is the responsibility of management and was derived from and relates directly to the underlying accounting and other records used to prepare the respective trust financial statements. The information has been subjected to the auditing procedures applied in the audit of the respective trust financial statements and certain additional procedures, including comparing and reconciling such information directly to the underlying accounting and other records used to prepare the respective trust financial statements or to the respective trust financial statements themselves and other additional procedures, in accordance with auditing standards generally accepted in the United States of America. We also subjected the information to the applicable procedures required by the International Standards on Auditing. In our opinion, the information is fairly stated, in all material respects, in relation to the respective trust financial statements taken as a whole.
Lip June 23, 2017

51
Concessional Lending and Debt Relief Trusts
Statements of financial position at April 30, 2017, and 2016
(In millions of SDRs)
PRG Trust
PRG-HIPC Trust and related Umbrella
Account
CCR Trust and related Umbrella
Account
Note 2017 2016 2017 2016 2017 2016
Assets
Cash and cash equivalents 181 218 — — 144 139
Interest receivable and other assets 237 259 28 27 — —
Investments 5 7,438 7,356 411 410 — —
Loans receivable 6 6,277 6,427 — — — —
Total assets 14,133 14,260 439 437 144 139
Liabilities and resources
Interest payable and other liabilities 220 253 24 25 — —
Borrowings 7 6,505 6,594 176 176 — —
Total liabilities 6,725 6,847 200 201 — —
Resources 7,408 7,413 239 236 144 139
Total liabilities and resources 14,133 14,260 439 437 144 139
The accompanying notes are an integral part of these financial statements.
The financial statements were approved by the Managing Director and the Director of Finance on June 23, 2017.
Christine Lagarde /s/ Managing Director
Andrew Tweedie /s/ Director, Finance Department
Statements of comprehensive income and changes in resources for the financial years ended April 30, 2017, and 2016
(In millions of SDRs)
PRG Trust
PRG-HIPC Trust and related Umbrella
Account
CCR Trust and related Umbrella
Account
Note 2017 2016 2017 2016 2017 2016
Resources, beginning of year 7,413 7,344 236 236 139 47
Net investment income 5 41 21 3 — — —
Interest on loans 6 16 — — — — —
Contributions 24 108 — — 5 92
Total income 81 129 3 — 5 92
Interest expense 16 10 — — — —
Administrative expense 9 70 50 — — — —
Total expenses 86 60 — — — —
Net (loss) income (5) 69 3 — 5 92
Other comprehensive income — — — — — —
Total comprehensive (loss) income/
changes in resources (5) 69 3 — 5 92
Resources, end of year 7,408 7,413 239 236 144 139
The accompanying notes are an integral part of these financial statements.

52
Concessional Lending and Debt Relief Trusts
Statements of cash flows for the financial years ended April 30, 2017, and 2016
(In millions of SDRs)
PRG Trust
PRG-HIPC Trust and related Umbrella
Account
CCR Trust and related Umbrella
Account 2017 2016 2017 2016 2017 2016
Cash flows from operating activities
Total comprehensive (loss) income (5) 69 3 — 5 92
Adjustments to reconcile total comprehensive (loss)/
income to cash generated by operations
Net investment income (41) (21) (3) — — —
Interest on loans (16) — — — — —
Interest expense 16 10 — — — —
Loan disbursements (641) (815) — — — —
Loan repayments 791 632 — — — —
Interest received 17 — — — — —
Interest paid (13) (10) — — — —
Net cash provided by/(used in) operating activities 108 (135) — — 5 92
Cash flows from investing activities
Acquisition of investments (244) (192) — (27) — —
Disposition of investments 188 214 — 19 — —
Net cash (used in)/provided by investing activities (56) 22 — (8) — —
Cash flows from financing activities
Borrowings 641 815 — — — —
Repayment of borrowings (730) (659) — — — —
Net cash (used in)/provided by financing activities (89) 156 — — — —
Net (decrease)/increase in cash and cash equivalents (37) 43 — (8) 5 92
Cash and cash equivalents, beginning of year 218 175 — 8 139 47
Cash and cash equivalents, end of year 181 218 — — 144 139
The accompanying notes are an integral part of these financial statements.
Concessional Lending and Debt Relief Trusts Notes to the financial statements
for the financial years ended April 30, 2017, and 2016
53
1. Nature of operations The International Monetary Fund (IMF) is the Trustee of the following trusts:
i. The Poverty Reduction and Growth Trust (PRG Trust);
ii. The Trust for Special Poverty Reduction and Growth Operations for the Heavily Indebted Poor Countries and Interim ECF Subsidy Operations (the PRG-HIPC Trust) and the related Umbrella Account for HIPC Operations (the PRG-HIPC Umbrella Account); and
iii. The Catastrophe Containment and Relief Trust (CCR Trust) and
the related Umbrella Account for CCR Operations (the CCR Umbrella Account).
Collectively, these trusts are referred to as the “Concessional Lending and Debt Relief Trusts” or the “Trusts”. The Trusts provide loans on concessional terms and/or debt relief assistance to low-income member countries. The resources of the Trusts are held separately from the assets of all other accounts of, or administered by, the IMF and may not be used to discharge liabilities or to meet losses incurred in the administration of other accounts. The expenses of conducting the business of the PRG and CCR Trusts are paid by the IMF and reimbursed by these trusts. Resources not immediately needed in operations are invested as allowed by the instruments (Trust Instruments) establishing the Trusts.
1.1 PRG Trust Established originally as the Enhanced Structural Adjustment Facility Trust in December 1987, the PRG Trust provides loans on concessional terms to qualifying low-income member countries. The PRG Trust provides financial assistance tailored to the diverse needs of low-income countries with higher concessionality of financial support. Financing is available under the following facilities:
i. The Extended Credit Facility (ECF) for members with protracted balance of payments problems under three- to four-year arrangements, which may be extended up to a total of five years;
ii. The Standby Credit Facility (SCF) for actual or potential short-term balance of payments needs under one- to two-year arrangements; and
iii. The Rapid Credit Facility (RCF) for urgent balance of payments
needs, which provides financial support in outright loan disbursements.
The repayment terms of PRG Trust loans are 5½ to 10 years for the Exogneous Shocks Facility (ESF), ECF, and RCF and four to eight years for the SCF, in equal semi-annual installments. The structure of interest rates on PRG Trust lending is reviewed every two years by the IMF Executive Board. The operations of the PRG Trust are conducted through four Loan Accounts, the Reserve Account, and four Subsidy Accounts. The
resources of the Loan Accounts consist of proceeds from borrowings, repayments of principal, and interest payments on loans extended by the Trust. The resources held in the Reserve Account consist of transfers by the IMF from the Special Disbursement Account (SDA) and net earnings from investments. Reserve Account resources are to be used by the Trustee in the event that PRG Trust loan principal repayments and interest payments, together with the authorized interest subsidy, are insufficient to repay loan principal and interest on borrowings of the Loan Accounts. The resources held in the Subsidy Accounts consist of grant contributions, borrowings, transfers from the SDA, transfers of earnings from other accounts administered by the IMF on behalf of donors (Administered Accounts), and net earnings from investments. The available resources in the Subsidy Accounts are drawn by the Trustee to pay the difference between the interest due on PRG Trust loans and the interest due on Loan Accounts borrowings.
1.2 PRG-HIPC Trust and the PRG-HIPC Umbrella Account The PRG-HIPC Trust was established in February 1997 to provide assistance to low-income countries by providing grants or loans for purposes of reducing their external debt burden to sustainable levels. The operations of the PRG-HIPC Trust are conducted through the PRG-HIPC Trust Account and the related Umbrella Account. Resources of the PRG-HIPC Trust Account consist of grant contributions, borrowings, transfers from the SDA, transfers of earnings from Administered Accounts, and net earnings from investments. The PRG-HIPC Umbrella Account receives and administers the proceeds of grants made by the PRG-HIPC Trust to the HIPC-eligible members for the purpose of repaying their debt to the IMF in accordance with the agreed-upon schedule.
1.3 CCR Trust and the CCR Umbrella Account Established originally as the Post-Catastrophe Debt Relief (PCDR) Trust in June 2010, the CCR Trust provides balance of payments assistance in the form of grants to eligible low-income members following catastrophic natural or public health disasters. Operations of the CCR Trust are conducted through three accounts: the General Account, containing non-earmarked funds available for either type of assistance, and two earmarked accounts for Post-Catastrophe and Catastrophe Containment assistance. Grants made by the CCR Trust are administered in the CCR Umbrella Account on behalf of the recipients.
2. Basis of preparation and measurement The financial statements of the Trusts are prepared in accordance with International Financial Reporting Standards (IFRS) issued by the International Accounting Standards Board (IASB). They have been prepared under the historical cost convention, except for the revaluation of financial instruments at fair value through profit or loss.
Concessional Lending and Debt Relief Trusts Notes to the financial statements
for the financial years ended April 30, 2017, and 2016
54
2.1 Unit of account The financial statements are presented in SDRs, which is the IMF’s unit of account. The value of the SDR is determined daily by the IMF by summing specific amounts of the basket currencies in U.S. dollar equivalents on the basis of market exchange rates. The IMF reviews the composition of the SDR valuation basket at a minimum of five-year intervals. The last review was completed in November 2015 and the Chinese renminbi was included in the SDR valuation basket, effective October 1, 2016. The specific amounts of the currencies in the basket were as follows:
SDR basket currency October 1, 2016 to
April 30, 2017 Prior to
October 1, 2016
Chinese renminbi 1.01740 —
Euro 0.386710 0.423
Japanese yen 11.900 00 12.100
Pound sterling 0.085946 0.111
U.S. dollar 0.582520 0.660 At April 30, 2017, 1 SDR was equal to US$1.37102 (US$1.41733 at April 30, 2016). The next review of the method of valuation of the SDR will take place by September 30, 2021, unless developments in the interim justify an earlier review.
2.2 SDR interest rate The SDR interest rate provides the basis for determining the interest levied on outstanding loans (see Note 6) and interest on certain borrowings (see Note 7). The SDR interest rate is determined weekly by reference to a weighted average of yields or rates on short-term instruments in the money markets of the members whose currencies are included in the SDR valuation basket:
1 Effective October 1, 2016.
The SDR interest rate is subject to a floor of 0.050 percent and is rounded to three decimal places. During the financial years ended April 30, 2017, and 2016, the average SDR interest rate was 0.185 percent per annum and 0.051 percent per annum, respectively.
2.3 Use of estimates and judgment The preparation of the financial statements requires management to make judgments, estimates, and assumptions that affect the application of accounting policies and the reported amounts of assets,
liabilities, income, and expenses. Actual results may differ from these estimates. Estimates and underlying assumptions are reviewed on an ongoing basis. Revisions to accounting estimates are recognized in the period in which the estimate is revised and in any future periods affected. Information about the most significant estimates and critical judgments used in applying accounting policies is described in Notes 3.3, 3.4, and 3.6.
3. Summary of significant accounting policies
3.1 New and revised International Financial Reporting Standards
3.1.1 Amendments to existing standards that became effective in the financial year ended April 30, 2017 The following amendments to existing standards issued by the IASB and applicable to the Trusts became effective in the financial year ended April 30, 2017. These amendments have no material impact on the Trusts’ financial statements: Amendments to IFRS 7 “Financial Instruments: Disclosures”, issued in September 2014 and effective for annual periods starting on or after January 1, 2016. Amendments to IAS 1 “Presentation of Financial Statements”, issued in December 2014 and effective for annual periods starting on or after January 1, 2016.
3.1.2 New standard to be adopted in future years The following new standard has been issued by the IASB and will be effective for annual periods starting on or after January 1, 2018: In July 2014 the IASB published the complete version of IFRS 9 “Financial Instruments”, which replaced most of the guidance in IAS 39 “Financial Instruments: Recognition and Measurement”. The standard requires financial assets to be classified at fair value through profit or loss, fair value through other comprehensive income, or amortized cost on the basis of the entity’s business model for managing the assets and the contractual cash flow characteristics of the financial asset. No changes were introduced for the classification and measurement of financial liabilities except for financial liabilities designated at fair value through profit or loss. For these financial liabilities, changes in the fair value due to the changes in an entity’s own credit risk must be recognized in other comprehensive income. The incurred loss model of IAS 39 has been replaced by a forward-looking expected credit loss impairment model. The impact of the adoption of IFRS 9 on the Trusts’ financial statements is being assessed.
3.1.3 Amendment to an existing standard effective in future years that is not expected to have a material impact The following amendment to an existing standard issued by the IASB and applicable to Trusts will become effective in future financial years. This amendment is not expected to have a material impact on the Trusts’ financial statements:
SDR basket currency Yield or rate
Chinese renminbi1 Three-month benchmark yield for China Treasury bonds as published by the China Central Depository and Clearing Co., Ltd.
Euro Three-month spot rate for euro area central government bonds with a minimum rating of AA published by the European Central Bank
Japanese yen Three-month Treasury Discount Bills
Pound sterling Three-month Treasury Bills
U.S. dollar Three-month Treasury Bills
Concessional Lending and Debt Relief Trusts Notes to the financial statements
for the financial years ended April 30, 2017, and 2016
55
Amendments to IAS 7 “Statement of Cash Flows”, issued in January 2016 and effective for annual periods starting on or after January 1, 2017.
3.2 Cash and cash equivalents Cash and cash equivalents comprise cash on hand and demand deposits and other highly liquid short-term investments that are readily convertible to a known amount of cash and are subject to an insignificant risk of changes in value. Cash and cash equivalents are held for the purpose of meeting short-term cash commitments rather than for investment or other purposes.
3.3 Investments Investments comprise short-term investments, fixed-term deposits, and fixed-income securities. The Trusts measure short-term investments and fixed-term deposits, which are held to maturity, at amortized cost. Fixed-income securities are designated as financial assets held at fair value through profit or loss, since they are managed and their performance is evaluated on a fair value basis, in accordance with the Trusts’ risk management and investment strategies. Such designation may be made only upon initial recognition and cannot subsequently be changed. The designated assets are carried at fair value in the statements of financial position, with changes in fair value included in the statements of comprehensive income in the period in which they arise.
3.3.1 Recognition Investments are recognized on the trade date at which the Trusts become a party to the contractual provisions of the instrument. The corresponding investment trades receivable or payable are recognized in other assets and other liabilities, respectively, pending settlement of the transactions.
3.3.2 Derecognition Investments are derecognized on the trade date when the contractual rights to the cash flows from the asset expire, or when substantially all the risks and rewards of ownership of the investment are transferred.
3.3.3 Investment income Investment income comprises interest income, realized gains and losses, and unrealized gains and losses, and includes currency valuation differences arising from exchange rate movements against the SDR. Interest income is recognized on an accrual basis under the effective interest rate method.
3.4 Loans
3.4.1 Recognition and measurement Loans in the PRG Trust are initially recorded at the amount disbursed, which represents the fair value of the consideration given. Thereafter, the carrying value of the loans is amortized cost.
3.4.2 Interest income
Interest income is recognized on loans on an accrual basis under the effective interest rate method. It is the PRG Trust’s policy to exclude from income interest on loans that are six months or more overdue. Such interest is deferred and only recognized upon the settlement of the amounts overdue.
3.4.3 Impairment Outstanding loans are assessed for impairment losses on a member-by-member basis using the incurred loss model. Impairment losses are recognized when objective evidence of a specific loss event has been observed, and the outstanding loan’s carrying value exceeds the present value of estimated future cash flows.
3.5 Borrowings
Borrowings are initially recorded at the amount drawn, which represents the fair value of the consideration received. Thereafter borrowings are measured at amortized cost.
3.6 Fair value measurement
Fair value is the price that would be received to sell an asset or paid to transfer a liability in an orderly transaction between market participants at the measurement date. A fair value measurement is based on the presumption that the transaction to sell the asset or transfer the liability takes place either in the principal market for the asset or liability, or in the absence of a principal market, in the most advantageous market.
A three-level fair value hierarchy is used to determine fair value under which financial instruments are categorized based on the priority of the inputs to the valuation technique. The fair value hierarchy has the following levels:
Level 1: Quoted prices (unadjusted) in active markets for identical assets or liabilities that the entity can access at the measurement date;
Level 2: Inputs other than quoted prices included within Level 1 that
are observable for the asset or liability, either directly (i.e., as prices) or indirectly (i.e., derived from prices); and
Level 3: Inputs for the asset or liability that are not based on observable market data (unobservable inputs).
When the inputs used to measure the fair value of an asset or liability fall within multiple levels of the hierarchy, the level within which the fair value measurement is categorized is based on the lowest-level input that is significant to the fair value measurement of the instrument in its entirety. Thus, a Level 3 fair value measurement may include inputs that are both observable and unobservable.
3.7 Foreign currency translation Transactions in currencies and not in SDRs are recorded at the rate of exchange on the date of the transaction. Assets and liabilities denominated in other currencies are reported using the SDR exchange rate on the date of the financial statements. Exchange

Concessional Lending and Debt Relief Trusts Notes to the financial statements
for the financial years ended April 30, 2017, and 2016
56
differences arising from the settlement of transactions at rates different from those at the originating date of the transaction are included in the determination of total comprehensive income.
3.8 Contributions The Trusts accept contributions on such terms and conditions as agreed between the trust and the contributor. Contributions are recognized as income after the achievement of specified conditions and are subject to the bilateral agreements stipulating how the resources are to be used.
4. Financial risk management In providing financial assistance to member countries, conducting operations, and investing resources, the Trusts are exposed to various types of financial risks, including credit, market, and liquidity risks.
4.1 Credit risk
4.1.1 PRG Trust lending Credit risk refers to potential losses on loans receivable owing to the inability, or unwillingness, of member countries to repay loans. Measures to help mitigate credit risk include policies on access limits, program design, monitoring, and economic policies the members agree to follow as a condition for PRG Trust financing. The PRG Trust has established limits on overall access to its resources. The amount of access in each individual case depends on relevant factors such as the country’s balance of payments need, the strength of its adjustment program, its capacity to repay, and its previous outstanding use of IMF credit. The IMF can approve access in excess of these limits in cases where the member is experiencing an exceptionally large balance of payments need and has a comparatively strong adjustment program, among other conditions. The access limits, which were revised on July 1, 2015, and following the effectiveness of quota increases under the Fourteenth General Review of IMF Quotas on January 26, 2016, are as follows:
Access limits
May 1, 2015 to
Jun. 30, 2015
Jul. 1, 2015 to
Jan. 25, 2016 From
Jan. 26, 2016
(In percent of quota)
Overall for all facilities
Normal access: annual 100 150 75
cumulative1 300 450 225
Exceptional access: annual 150 200 100
cumulative1 450 600 300
RCF
Normal access: annual 25 37.5 18.75
cumulative1 100 150 75
Exceptional access: annual 50 75 37.5
cumulative1 125 150 75
SCF
Annual 75 112.5 56.25
Average annual 50 75 37.5 1 Net of scheduled repayments.
Disbursements under PRG Trust arrangements are made in tranches and are subject to conditionality in the form of performance criteria, structural benchmarks, and prior actions. Safeguards assessments of member central banks are undertaken to provide the Trustee with reasonable assurance that the banks’ legal structure, controls, financial reporting, and internal and external audit arrangements are adequate to maintain the integrity of their operations and help ensure that PRG Trust loan proceeds are used for intended purposes. Misreporting by member countries on performance criteria and other conditions for disbursement may entail early repayment of non-complying disbursements. The maximum credit risk exposure is the carrying value of the PRG Trust’s outstanding loans and undrawn commitments (see Note 6), which amounted to SDR 7,909 million and SDR 8,027 million at April 30, 2017, and 2016, respectively. The concentration of PRG Trust outstanding loans by region was as follows:
April 30, 2017 April 30, 2016
(In millions of SDRs and as a percentage
of total outstanding loans)
Africa 4,632 73.8% 4,671 72.7%
Asia and Pacific 725 11.6% 749 11.6%
Europe 151 2.4% 185 2.9%
Middle East and Central Asia 609 9.7% 666 10.4%
Western Hemisphere 160 2.5% 156 2.4%
Total 6,277 100.0% 6,427 100.0%
Use of credit in the PRG Trust by the largest users was as follows:
April 30, 2017 April 30, 2016
(In millions of SDRs and as a percentage
of total outstanding loans)
Largest user of credit 727 11.6% 758 11.8%
Three largest users of credit 2,022 32.2% 2,021 31.4%
Five largest users of credit 2,798 44.6% 2,890 45.0%
The five largest users of credit at April 30, 2017, in descending order, were Cȏte d’Ivoire, Ghana, Bangladesh, Kenya, and Sierra Leone (Cȏte d’Ivoire, Bangladesh, Ghana, Kenya, and the Democratic Republic of the Congo at April 30, 2016). Outstanding loans by member are presented in Schedule 1. To protect the lenders to the PRG Trust, Reserve Account resources are available to repay the lenders in the event of delays in repayment or nonpayment by borrowers. At April 30, 2017, and 2016, available resources in the Reserve Account amounted to SDR 3,850 million and SDR 3,821 million, respectively.
4.1.2 Investments Credit risk on investments represents the potential loss that the Trusts may incur if issuers and counterparties default on their contractual obligations. The maximum exposure to credit risk is the carrying amount of investments (see Note 5), which amounted to SDR 7,438 million and SDR 7,356 million at April 30, 2017, and 2016, respectively.

Concessional Lending and Debt Relief Trusts Notes to the financial statements
for the financial years ended April 30, 2017, and 2016
57
On March 22, 2017, the Executive Board reviewed the investment strategy for Trusts and approved new investment guidelines under the Trust Instruments. The new strategy expands the range of eligible asset classes for the PRG Trust to include a broader range of fixed-income instruments (corporate and emerging market bonds) and equities according to a target allocation, which will be phased in over a three-year period, starting in financial year 2018. Eligible investments under the strategy for the CCR and PRG-HIPC Trusts will remain largely unchanged. Under the previous investment guidelines, in effect until March 22, 2017, credit risk was managed by limiting the range of investments to (i) domestic government bonds of countries in China, the euro area, Japan, the United Kingdom, and the United States (i.e., members whose currencies are included in the SDR basket); (ii) obligations of international financial institutions, including the Bank for International Settlements (BIS); and (iii) deposits with national official financial institutions, international financial institutions, or, with respect to non-SDA resources, commercial banks. Credit risk was also minimized by limiting eligible investments to marketable securities rated A or higher by Standard & Poor’s and, for deposits, obligations issued by institutions with a credit rating of A or higher. The credit risk exposure in the PRG Trust and PRG-HIPC Trust portfolios was as follows:
PRG Trust PRG-HIPC Trust April 30 April 30
2017 2016 2017 2016 (As a percentage of total investments)
Government bonds
AAA 9.2 13.6 22.7 28.2
AA+ to AA– 15.8 25.0 27.7 48.7
A+ to A 4.8 3.9 8.9 7.7
Nongovernment bonds and financial institutions obligations
AAA 7.4 5.6 17.0 12.5
AA+ to AA– 1.2 0.8 0.8 2.9
BIS (not rated) 61.6 51.1 22.9 —
Total 100.0 100.0 100.0 100.0
4.2. Market risk Market risk is the risk that the fair value or future cash flows of financial instruments will fluctuate because of changes in market prices. Market risk includes interest rate risk, exchange rate risk, and other price risks.
4.2.1 Interest rate risk Interest rate risk on lending is the risk that future cash flows will fluctuate because of changes in market interest rates.
PRG Trust lending The PRG Trust’s subsidy resources consist of contributions and investment earnings to cover the interest shortfall arising from the difference between the market-based interest rate paid on borrowings and the concessional interest rate, if any, applicable to outstanding loans. Should such resources be deemed inadequate for this purpose, the PRG Trust instrument allows an increase in the interest rate levied
on outstanding loans and a transfer of investment income from the Reserve Account to the General Subsidy Account, subject to consultations with all creditors to the Loan Accounts on the adequacy of the Reserve Account to protect their claims.
Investments
The investment portfolios (see Note 5) are exposed to market interest rate fluctuations. The interest rate risk is mitigated by limiting the duration of the portfolios to a weighted average of one to three years. The effect on the fair value of the portfolios of a 10 basis point fluctuation in the market interest rates at April 30, 2017, is approximately SDR 10 million or 0.15 percent of the PRG Trust portfolio (SDR 14 million or 0.19 percent at April 30, 2016) and approximately SDR 0.6 million or 0.19 percent of the PRG-HIPC Trust portfolio (SDR 0.8 million or 0.19 percent at April 30, 2016).
4.2.2 Exchange rate risk
Exchange rate risk is the risk that an entity’s financial position and cash flows will be affected by fluctuations in foreign currency exchange rates.
Lending and borrowing
The PRG and PRG-HIPC Trusts have no exchange rate risk on their loans and borrowings as receipts, disbursements, repayments, and interest payments are denominated in SDRs.
Investments
Investments in fixed-term deposits, held with the BIS, are denominated in SDRs. Exchange rate risk on investments in fixed-income securities is managed by investing in financial instruments denominated in SDRs or in constituent currencies of the SDR, with the relative amount of each currency matching its weight in the SDR basket. In addition, the portfolios are regularly rebalanced to reflect the currency weights in the SDR basket.
The effect on the PRG Trust and PRG-HIPC Trust portfolios of a 5 percent increase or decrease in the market exchange rates of each of the currencies included in the SDR valuation basket against the SDR was as follows:
5 percent increase in
exchange rate 5 percent decrease in
exchange rate
April 30 April 30
2017 2016 2017 2016
(Gain/(loss) in millions of SDRs)
PRG Trust
Chinese renminbi (37) N/A 41 N/A
Euro (107) (118) 118 130
Japanese yen (27) (26) 30 29
Pound sterling (28) (40) 31 44
U.S. dollar (148) (162) 163 179
PRG-HIPC Trust
Chinese renminbi (2) N/A 2 N/A
Euro (5) (7) 5 7
Japanese yen (1) (1) 1 2
Pound sterling (1) (2) 1 2
U.S. dollar (6) (9) 7 10

Concessional Lending and Debt Relief Trusts Notes to the financial statements
for the financial years ended April 30, 2017, and 2016
58
The sensitivity analyses are based on a change in the exchange rate of a single currency, while holding other currencies constant, so that the effects of correlation between the market exchange rates of constituent currencies are excluded.
4.3 Liquidity risk
Liquidity risk is the risk of non-availability of resources to meet the Trusts’ financing needs and obligations. The IMF, as Trustee, conducts annual reviews to determine the adequacy of resources in the Trusts to provide financial assistance to eligible IMF members and to meet the Trusts’ obligations.
The PRG Trust must have resources available to meet members’ demand for credit. Uncertainties in the timing and amount of credit extended to members expose the PRG Trust to liquidity risk. For this purpose, the approval of new lending agreements is subject to the availability of uncommitted resources. During the financial year, PRG Trust resources available for financing increased by SDR 7,650 million as a result of new borrowing agreements and augmentation of existing borrowing agreements under a Board-endorsed effort to raise SDR 11,000 million in new loan resources. Resources in the Subsidy Accounts are expected to meet the estimated needs based on the level of loans outstanding and current forecast of future commitments. Should such resources be deemed inadequate for this purpose, the PRG Trust has measures to cover the shortfall, as mentioned in Note 4.2.1.
Debt relief under the HIPC initiative has been provided to all eligible members that qualified for such debt relief in the PRG-HIPC Trust, except for those in protracted arrears.
To minimize the risk of loss from liquidating investments, the Trusts hold resources in readily marketable short-term financial instruments to meet anticipated liquidity needs.
5. Investments
The Trusts’ investments consisted of the following:
PRG Trust PRG-HIPC Trust
April 30 April 30 2017 2016 2017 2016
(In millions of SDRs)
Short-term investments 79 50 — —
Fixed-term deposits 621 87 94 —
Fixed-income securities 6,738 7,219 317 410
Total 7,438 7,356 411 410 Investments, managed primarily by external investment managers, include portfolios directly held by the Trusts. During the first half of the financial year, a portion of the Trusts’ assets were held in pooled investment accounts.
The maturities of the investments were as follows:
PRG Trust PRG-HIPC Trust
Financial year ending April 30 2017 2016 2017 2016 (In millions of SDRs) 2017 — 328 — 33 2018 2,067 3,440 130 191 2019 3,893 3,310 97 185 2020 1,404 43 169 — 2021 72 7 15 1 2022 2 — — — 2023 and beyond — 228 — — Total 7,438 7,356 411 410
Net investment income comprised the following:
PRG Trust PRG-HIPC Trust 2017 2016 2017 2016
(In millions of SDRs)
Interest income 71 58 6 4
Net realized losses (55) (4) (3) (2)
Net unrealized gains (losses) 27 (31) — (2)
Investment fees (2) (2) — —
Total 41 21 3 —
6. Commitments and outstanding loans
6.1 Commitments under PRG Trust arrangements An arrangement under the PRG Trust is a decision of the IMF as Trustee that gives a member the assurance that the Trust stands ready to provide freely usable currencies or SDRs during a specified period and up to a specified amount, in accordance with the terms of the arrangement. Upon approval by the Trustee, resources of the Loan Accounts of the PRG Trust are committed to qualifying members for a period from three and up to five years for ECF arrangements or from one to two years for SCF arrangements. At April 30, 2017, undrawn balances under 20 arrangements amounted to SDR 1,632 million (SDR 1,600 million under 18 arrangements at April 30, 2016). Commitments and undrawn balances under current arrangements by member are presented in Schedule 2.
6.2 Outstanding loans
On October 20, 2016, Zimbabwe settled all of its remaining overdue obligations to the PRG Trust of SDR 78 million, which comprised overdue principal and interest of SDR 62 million and SDR 16 million, respectively. The overdue interest, which had been deferred prior to settlement, was recognized as income. The proceeds from the settlement were transferred to the Reserve Account, which had previously made payments to PRG Trust lenders as a result of Zimbabwe’s arrears.

Concessional Lending and Debt Relief Trusts Notes to the financial statements
for the financial years ended April 30, 2017, and 2016
59
Scheduled repayments of outstanding loans are summarized below: Financial year ending April 30 2017 2016 (In millions of SDRs)
2017 — 729
2018 867 867
2019 958 958
2020 899 899
2021 866 846
2022 811 760
2023 and beyond 1,876 1,306
Overdue — 62
Total 6,277 6,427
No impairment losses were recognized in the financial years ended April 30, 2017, and 2016.
6.3 Interest on loans
During the financial year ended April 30, 2017, the PRG Trust recognized interest income of SDR 16 million as a result of the settlement of overdue financial obligations by Zimbabwe. Interest of all PRG Trust loans had been waived for the financial years ended April 30, 2017, and 2016. On October 3, 2016, the Executive Board approved a modification of the mechanism governing the interest rate setting of PRG Trust facilities and extended the interest waiver on ESF outstanding loans through end-December 2018. The modification sets the interest rates on ECF and SCF loans based on the SDR interest rate as follows: Average SDR interest rate for the latest 12-month period ECF SCF
(In percent)
Less than or equal 0.75% — —
Greater than 0.75% but less than 2% — 0.25
Greater than or equal to 2% but less than 5% 0.25 0.50
Greater than or equal to 5% 0.50 0.75
The interest rate on financial assistance provided under the RCF has been permanently set at zero percent for all PRGT-eligible members.
7. Borrowings The PRG and PRG-HIPC Trusts borrow on such terms and conditions as agreed between the Trustee and lenders. The repayment periods for the PRG Trust Loan Accounts borrowings typically match the maturity of the loans extended by the PRG Trust, which are to be repaid in equal semi-annual installments beginning 5½ years from the date of each disbursement in the case of the ECF, ESF, and RCF; and beginning four years from the date of each disbursement in the case of the SCF. Drawings under some PRG Trust borrowing agreements may have shorter initial maturities (e.g., six months) that can be extended, at the sole discretion of the Trustee, up to the maturity dates of the corresponding Trust loans for which they were drawn. Certain creditors of the PRG Trust participate in a voluntary “encashment” regime, under which they can seek early repayment of outstanding claims in case of balance of payments needs, provided they allow drawings under their own agreements for encashment by other
participating creditors. Early repayment is subject to availability of resources under borrowing agreements with other lenders. Most of the borrowings of the PRG Trust Subsidy Accounts and PRG-HIPC Trust are repayable in one installment at their maturity dates.
7.1 Resources available under borrowing agreements PRG Trust resources available in the Loan Accounts amounted to SDR 13,104 million and SDR 6,095 million at April 30, 2017, and 2016, respectively. Undrawn balances in the PRG Trust Subsidy Accounts amounted to SDR 17 million at April 30, 2017, and 2016. Resources available under borrowing agreements of PRG Trust Loan Accounts by lender are presented in Schedule 3. All available PRG-HIPC Trust borrowing arrangements have been fully drawn.
7.2 Outstanding borrowings Scheduled repayments of outstanding borrowings are summarized below:
PRG Trust PRG-HIPC Trust Financial year ending April 30 2017 2016 2017 2016 (In millions of SDRs) 2017 — 2,687 — — 2018 2,991 848 — — 2019 716 716 121 121 2020 586 586 16 16 2021 472 472 39 39 2022 527 500 — — 2023 and beyond 1,213 785 — — Total 6,505 6,594 176 176
7.3 Interest on borrowings The weighted average interest rate on PRG Trust variable interest rate borrowings was 0.25 percent per annum and 0.16 percent per annum for the financial years ended April 30, 2017, and 2016, respectively. Most PRG-HIPC Trust borrowings carry a fixed interest rate.
8. Fair value measurement Valuation techniques used to value financial instruments include the following:
i. The fair value of publicly traded sovereign bonds is based on
quoted market prices, or binding dealer price quotations, in active markets for identical assets without any adjustments. The instruments are valued at mid prices (or bid price for long positions and ask price for short positions) and included within Level 1 of the hierarchy; and
ii. The fair value of fixed-income securities not traded in active markets is determined on the basis of a compilation of significant observable market information such as recently executed trades in securities of the issuer or comparable issuers and yield curves. The assessment also takes into account the inherent risk and
Concessional Lending and Debt Relief Trusts Notes to the financial statements
for the financial years ended April 30, 2017, and 2016
60
terms and conditions of each security. To the extent that the significant inputs are observable, these investments are included within Level 2 of the hierarchy.
8.1 Investments At April 30, 2017, and 2016, the Trusts’ investments in fixed-income securities (see Note 5) were categorized as Level 2 based on the fair value hierarchy (there were no Level 1 or Level 3 securities). Fixed-term deposits and short-term investments are generally of a short-term nature and are carried at amortized cost, which approximates fair value.
8.2 Loans receivable and other financial assets and liabilities The PRG Trust, and the IMF as Trustee, plays a unique role in providing balance of payments support to member countries. PRG Trust financing features policy conditions that require member countries to implement macroeconomic and structural policies, and are an integral part of Trust lending. These measures aim to help countries solve their balance of payments problems while safeguarding Trust resources. The fair value of PRG Trust loans receivable as defined under IFRS 13 cannot be determined due to their unique characteristics, including the debtor’s membership relationship with the IMF, the Trustee, and the absence of a principal or most advantageous market for PRG Trust loans. The carrying value of other assets and liabilities accounted for at amortized cost represents a reasonable estimate of their fair value.
9. Related party transactions The expenses of conducting the business of the Trusts are paid by the IMF from the General Resources Account (GRA) and reimbursed by the PRG and CCR Trusts annually. For the financial year ended
April 30, 2017, the PRG and CCR Trusts reimbursed the GRA SDR 70 million and SDR 0.1 million, respectively, for these expenses (SDR 50 million and SDR 0.3 million, respectively, for the financial year ended April 30, 2016). In addition to bilateral contributions from member countries, the IMF also made contributions to the Trusts to meet the financing needs of low-income countries. Cumulative contributions from the IMF were as follows:
April 30, 2017, and 2016
(In millions of SDRs)
PRG Trust Reserve Account 2,697
PRG Trust Subsidy Accounts 1,018
PRG-HIPC Trust 1,239
CCR Trust 293
Total 5,247
10. Combining statements of financial position and statements of comprehensive income and changes in resources The combining statements of financial position and statements of comprehensive income and changes in resources of the PRG Trust are presented below. The same statements are not presented for the PRG-HIPC and CCR Trusts as the financial positions of the respective umbrella accounts remained unchanged for the financial years ending April 30, 2017, and 2016.

61
Note 10 (concluded)
PRG Trust
Combining statements of financial position at April 30, 2017, and 2016
(In millions of SDRs)
2017 2016
Loan
Accounts Reserve Account
Subsidy Accounts Total Total
Assets
Cash and cash equivalents 21) 109 51) 181 218
Interest receivable and other assets —) 182 55) 237 259
Investments —) 3,664 3,774) 7,438 7,356
Loans receivable 6,277) — —) 6,277 6,427
Accrued account transfers (47) 62 (15) — —
Total assets 6,251 4,017 3,865 14,133 14,260
Liabilities and resources
Interest payable and other liabilities 7) 167 46) 220 253
Borrowings 6,244) — 261) 6,505 6,594
Total liabilities 6,251) 167 307) 6,725 6,847
Resources —) 3,850 3,558) 7,408 7,413
Total liabilities and resources 6,251 4,017 3,865) 14,133 14,260
Combining statements of comprehensive income and changes in resources
for the financial years ended April 30, 2017, and 2016
(In millions of SDRs)
2017 2016
Loan
Accounts Reserve Account
Subsidy Accounts Total Total
Resources, beginning of year 63) 3,821 3,529) 7,413) 7,344
Net investment income —) 20 21) 41) 21
Interest on loans 16) — —) 16) —
Contributions —) — 24) 24) 108
Total income 16) 20 45) 81) 129
Interest expense 16) — —) 16) 10
Administrative expense —) 70 —) 70) 50
Total expenses 16) 70 —) 86) 60
Transfers
Subsidies 16) — (16) —) —
Repayment of advances (63) 63 —) —) —
Additional interest on overdue obligations (16) 16 — —) —
Total transfers (63) 79 (16) —) —
Net (loss) income (63) 29 29) (5) 69
Other comprehensive (loss) income —) — —) — —
Total comprehensive (loss) income/changes in resources (63) 29 29) (5) 69
Resources, end of year — 3,850 3,558 7,408 7,413

62
Schedule 1 PRG Trust
Schedule of outstanding loans at April 30, 2017
(In millions of SDRs)
Member ECF ESF1 RCF SCF Total loansoutstanding
Percent of total
Afghanistan, Islamic Republic of 43.2 — — — 43.2 0.69
Albania 1.2 — — — 1.2 0.02
Armenia, Republic of 124.7 — — — 124.7 1.99
Bangladesh 640.0 — — — 640.0 10.20
Benin 92.6 — — — 92.6 1.48
Burkina Faso 153.8 — — — 153.8 2.45
Burundi 64.2 — — — 64.2 1.02
Cameroon 2.7 46.4 — — 49.1 0.78
Central African Republic 57.3 — 22.3 — 79.6 1.27
Chad 89.8 — — — 89.8 1.43
Comoros, Union of the 10.7 — — — 10.7 0.17
Congo, Democratic Republic of the 148.5 53.3 — — 201.8 3.21
Congo, Republic of 5.8 — — — 5.8 0.09
Côte d'Ivoire 653.8 — 73.2 — 727.0 11.58
Djibouti 18.1 — — — 18.1 0.29
Dominica — 1.6 8.2 — 9.8 0.16
Ethiopia, The Federal Democratic Republic of — 110.3 — — 110.3 1.76
Gambia, The 19.7 — 7.8 — 27.5 0.44
Georgia 1.4 — — — 1.4 0.02
Ghana 655.3 — — — 655.3 10.44
Grenada 20.9 — — — 20.9 0.33
Guinea 152.7 — 26.8 — 179.5 2.86
Guinea-Bissau 14.5 — 3.6 — 18.0 0.29
Haiti 44.7 — 30.7 — 75.4 1.20
Kenya 478.7 67.9 — — 546.5 8.71
Kyrgyz Republic 107.1 15.0 15.5 — 137.7 2.19
Lesotho, Kingdom of 47.1 — — — 47.1 0.75
Liberia 111.1 — 32.3 — 143.4 2.28
Madagascar, Republic of 41.1 — 61.1 — 102.2 1.63
Malawi 135.9 13.9 — — 149.7 2.39
Maldives — 1.2 — — 1.2 0.02
Mali 102.3 — 22.0 — 124.3 1.98
Mauritania, Islamic Republic of 70.5 — — — 70.5 1.12
Moldova, Republic of 149.5 — — — 149.5 2.38
Mozambique, Republic of 0.2 61.1 — 85.2 146.4 2.33
Nepal 3.2 — 55.6 — 58.8 0.94
Nicaragua 40.7 — — — 40.7 0.65
Niger 128.3 — — — 128.3 2.04
Rwanda 1.7 — — 108.1 109.9 1.75
St. Lucia — 3.4 3.1 — 6.5 0.10
St. Vincent and the Grenadines — 1.9 4.9 — 6.7 0.11
Samoa — 3.5 5.8 — 9.3 0.15
São Tomé and Príncipe, Democratic Republic of 3.6 — — — 3.6 0.06
Senegal — 68.0 — — 68.0 1.08
Sierra Leone 229.1 — — — 229.1 3.65
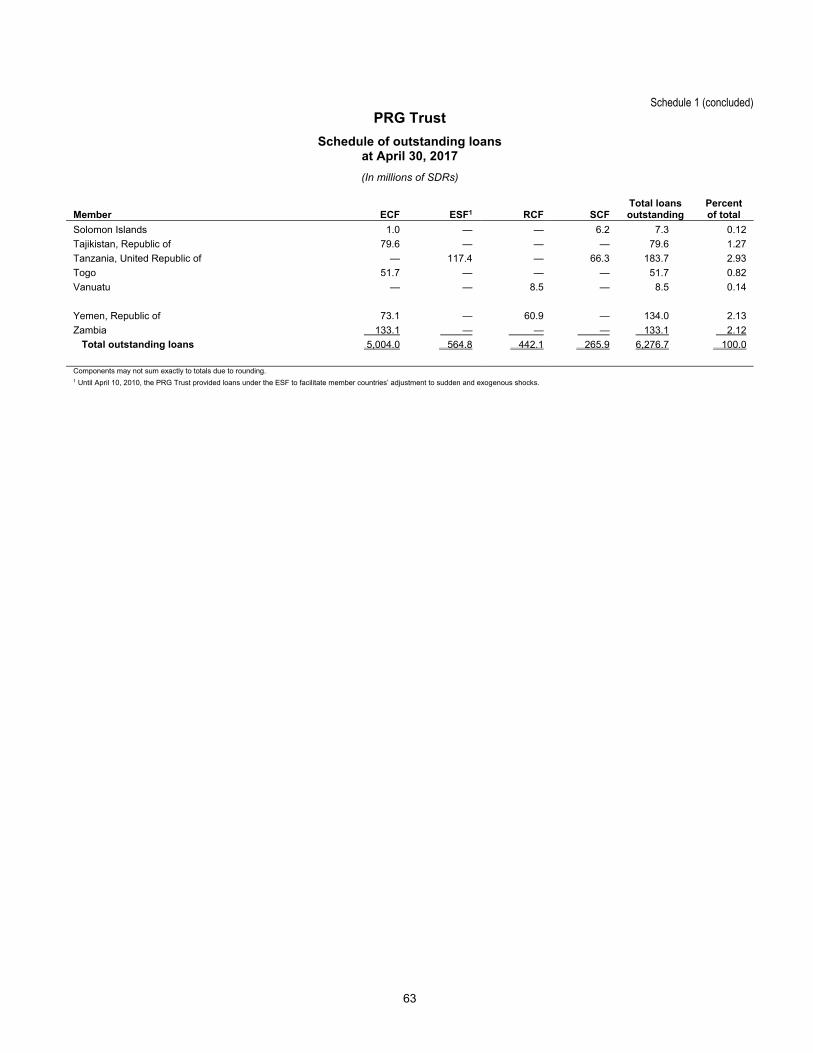
63
Schedule 1 (concluded) PRG Trust
Schedule of outstanding loans at April 30, 2017
(In millions of SDRs)
Member ECF ESF1 RCF SCF Total loans outstanding
Percent of total
Solomon Islands 1.0 — — 6.2 7.3 0.12
Tajikistan, Republic of 79.6 — — — 79.6 1.27
Tanzania, United Republic of — 117.4 — 66.3 183.7 2.93
Togo 51.7 — — — 51.7 0.82
Vanuatu — — 8.5 — 8.5 0.14
Yemen, Republic of 73.1 — 60.9 — 134.0 2.13
Zambia 133.1 — — — 133.1 2.12
Total outstanding loans 5,004.0 564.8 442.1 265.9 6,276.7 100.0
Components may not sum exactly to totals due to rounding. 1 Until April 10, 2010, the PRG Trust provided loans under the ESF to facilitate member countries’ adjustment to sudden and exogenous shocks.

64
Schedule 2 PRG Trust
Status of arrangements at April 30, 2017
(In millions of SDRs)
Member Date of arrangement Expiration date Amount agreed
Undrawn balance
ECF arrangements
Afghanistan, Islamic Republic of July 20, 2016 July 19, 2019 32.4 27.9
Benin April 7, 2017 April 6, 2020 111.4 95.5
Burkina Faso December 27, 2013 September 26, 2017 55.6 4.5
Central African Republic July 20, 2016 July 19, 2019 83.6 58.5
Chad August 1, 2014 November 30, 2017 140.2 41.9 Côte d'Ivoire December 12, 2016 December 11, 2019 162.6 139.4
Ghana April 3, 2015 April 2, 2018 664.2 332.1
Grenada June 26, 2014 June 25, 2017 14.0 2.0
Guinea-Bissau July 10, 2015 July 9, 2018 17.0 9.1
Kyrgyz Republic April 8, 2015 April 7, 2018 66.6 28.5
Liberia November 19, 2012 November 18, 2017 111.7 14.8 Madagascar, Republic of July 27, 2016 November 26, 2019 220.0 188.6 Malawi July 23, 2012 June 30, 2017 138.8 19.5
Mali December 18, 2013 December 17, 2017 98.0 38.0
Moldova, Republic of November 7, 2016 November 6, 2019 43.1 34.4
Niger January 23, 2017 January 22, 2020 98.7 84.6
São Tomé and Príncipe, Democratic Republic of July 13, 2015 July 12, 2018 4.4 2.5
Total ECF arrangements 2,062.4 1,121.7
SCF arrangements
Kenya March 14, 2016 March 13, 2018 354.6 354.6
Mozambique, Republic of December 18, 2015 June 17, 2017 204.5 119.3
Rwanda June 8, 2016 December 7, 2017 144.2 36.0 Total SCF arrangements 703.3 510.0 Total PRG Trust arrangements 2,765.7 1,631.6
Components may not sum exactly to totals due to rounding.

65
Schedule 3
PRG Trust – Loan Accounts
Resources available under borrowing and note purchase agreements at April 30, 2017
(In millions of SDRs)
Lender Date of agreement Expiration date Amount agreed
Undrawn balance
National Bank of Belgium November 12, 2012 December 31, 2024 350.0 16.2
Canada March 5, 2010 December 31, 2024 500.0 348.5
Canada January 10, 2017 December 31, 2024 500.0 500.0
People’s Bank of China September 3, 2010 December 31, 2024 800.0 36.8
People’s Bank of China April 21, 2017 December 31, 2024 800.0 800.0
Danmarks Nationalbank January 28, 2010 December 31, 2024 500.0 460.5
Banque de France September 3, 2010 December 31, 2018 1,328.0 110.1
Bank of Italy April 18, 2011 December 31, 2024 800.0 74.5
Japan September 3, 2010 December 31, 2024 3,600.0 3,521.2
Bank of Korea January 7, 2011 December 31, 2024 1,000.0 990.0
De Nederlandsche Bank NV July 27, 2010 December 31, 2024 1,000.0 991.6
Norway1 November 17, 2016 December 31, 2024 150.0 150.0
Norway1 November 17, 2016 December 31, 2024 150.0 150.0
Saudi Arabian Monetary Agency May 13, 2011 December 31, 2024 500.0 427.9
Bank of Spain December 17, 2009 December 31, 2024 405.0 378.2
Bank of Spain February 22, 2017 December 31, 2024 450.0 450.0
Sveriges Riksbank November 17, 2016 December 31, 2024 500.0 500.0
Swiss National Bank April 21, 2011 December 31, 2024 500.0 455.4
United Kingdom November 30, 2015 December 31, 2024 1,312.5 743.0
United Kingdom January 23, 2017 December 31, 2024 2,000.0 2,000.0
Total 17,145.5 13,103.8
Components may not sum exactly to totals due to rounding. 1 Lender agreed to provide earmarked financing under two separate borrowings agreements.

66
Schedule 4
PRG, PRG-HIPC, and CCR Trusts
Cumulative contributions at April 30, 2017
(In millions of SDRs)
Contributor
PRG Trust
PRG-HIPC Trust
CCR Trust
Of which: Attributable
to the MDRI-II Trust
liquidation3
General Subsidy Account
Earmarked Subsidy
Accounts1 Total
Of which:Windfall
Gold Sales
Profits2
Afghanistan, Islamic Republic of 1.2 — 1.2 1.2 — — —
Albania 0.4 — 0.4 0.4 — — —
Algeria 15.2 — 15.2 12.9 0.4 — —
Angola 2.1 — 2.1 2.1 — — —
Antigua and Barbuda 0.1 — 0.1 0.1 — — — Argentina 25.7 27.2 52.9 21.8 11.7 0.4 0.4
Armenia, Republic of 1.0 — 1.0 1.0 — — —
Australia 50.5 14.7 65.2 32.8 17.0 0.1 0.1
Austria 21.7 3.9 25.6 21.7 15.0 — —
Bahamas, The 1.0 — 1.0 1.0 — — — Bangladesh 5.5 0.7 6.2 5.5 1.2 ** **
Barbados 0.5 — 0.5 0.5 0.3 — —
Belarus, Republic of 1.1 2.8 3.9 3.9 — — —
Belgium 35.6 0.2 35.8 35.6 25.9 1.4 1.4
Belize 0.2 — 0.2 0.2 0.2 — — Benin — 0.7 0.7 0.7 — — —
Bhutan ** — ** ** — — —
Bosnia and Herzegovina 1.7 — 1.7 1.7 — — —
Botswana 0.8 — 0.8 0.8 — ** **
Brazil — — — — 11.0 — — Brunei Darussalam 2.2 — 2.2 2.2 ** — —
Bulgaria 5.9 — 5.9 5.9 — — —
Burkina Faso 0.6 — 0.6 0.6 — — —
Burundi 0.8 — 0.8 0.8 — — —
Cabo Verde ** — ** ** — — — Cambodia 0.9 — 0.9 0.9 ** — —
Cameroon 1.9 — 1.9 1.9 — — —
Canada 91.5 214.9 306.4 65.5 32.9 2.9 2.9
Central African Republic 0.2 — 0.2 0.2 — — —
Chad 0.7 — 0.7 0.7 — — — Chile — — — — — ** **
China, People’s Republic of — 110.1 110.1 98.0 13.1 0.1 0.1
Colombia — — — — ** — —
Comoros, Union of the 0.1 — 0.1 0.1 — — —
Congo, Democratic Republic of the 5.5 — 5.5 5.5 — — — Congo, Republic of — 0.6 0.6 0.6 — — —
Côte d’Ivoire 2.4 1.0 3.4 3.4 — — —
Croatia, Republic of 1.9 — 1.9 1.8 ** — —
Cyprus 1.6 — 1.6 1.6 0.5 — —
Czech Republic 10.3 10.0 20.3 10.3 — — —

67
Schedule 4 (continued)
PRG, PRG-HIPC, and CCR Trusts
Cumulative contributions at April 30, 2017
(In millions of SDRs)
Contributor
PRG Trust
PRG-HIPC Trust
CCR Trust
Of which: Attributable
to the MDRI-II Trust
liquidation3
General Subsidy Account
Earmarked Subsidy
Accounts1 Total
Of which:Windfall
Gold Sales
Profits2
Denmark 23.0 38.3 61.3 19.4 13.1 0.8 0.8
Djibouti 0.1 — 0.1 0.1 — — —
Dominica 0.1 — 0.1 0.1 — — —
Egypt, Arab Republic of 9.7 10.0 19.7 9.7 ** 0.2 0.2
Estonia, Republic of 1.0 — 1.0 1.0 0.4 — —
Ethiopia, The Federal Democratic Republic of 1.4 — 1.4 1.4 — — —
Fiji, Republic of 0.7 — 0.7 0.7 ** — —
Finland 13.0 22.7 35.7 13.0 2.6 0.5 0.5
France — 127.9 127.9 110.5 60.9 4.0 4.0
Gabon 1.6 — 1.6 1.6 0.5 — —
Gambia, The — 0.3 0.3 0.3 — — —
Georgia 1.5 — 1.5 1.5 — — —
Germany 149.8 154.4 304.3 149.8 45.6 23.8 2.3
Ghana 1.1 — 1.1 1.1 — — —
Greece 11.3 — 11.3 11.3 2.2 0.5 0.5
Guinea 1.1 — 1.1 1.1 — — —
Guinea-Bissau 0.1 — 0.1 0.1 — — —
Haiti 0.8 — 0.8 0.8 — — —
Honduras 1.4 — 1.4 1.4 — — —
Iceland 1.2 3.3 4.5 1.2 0.6 0.1 0.1
India 59.9 10.5 70.4 59.9 0.4 — —
Indonesia — — — — 5.1 0.1 0.1
Iran, Islamic Republic of 15.4 — 15.4 15.4 — — —
Iraq 3.5 — 3.5 3.5 — — —
Ireland — 6.9 6.9 — 3.9 0.1 0.1
Israel — — — — 1.2 — —
Italy — 255.6 255.6 81.1 43.3 2.9 2.9
Jamaica 2.8 — 2.8 2.8 1.8 — —
Japan 185.1 541.1 726.2 148.7 98.4 13.2 8.8
Jordan 1.8 — 1.8 1.8 — — —
Kenya 2.8 — 2.8 2.8 — — —
Korea, Republic of 43.7 36.0 79.7 34.7 10.6 0.7 0.7
Kosovo 0.4 — 0.4 0.4 — — —
Kuwait 16.9 — 16.9 14.3 0.1 — —
Kyrgyz Republic 1.0 — 1.0 1.0 — — —
Lao People’s Democratic Republic 0.6 — 0.6 0.6 — — —
Latvia, Republic of 1.4 — 1.4 1.4 0.7 — —
Lesotho, Kingdom of — 0.4 0.4 0.4 — — —
Liberia 0.4 — 0.4 0.4 — — —
Lithuania, Republic of 1.9 — 1.9 1.9 0.7 — —

68
Schedule 4 (continued)
PRG, PRG-HIPC, and CCR Trusts
Cumulative contributions at April 30, 2017
(In millions of SDRs)
Contributor
PRG Trust
PRG-HIPC Trust
CCR Trust
Of which: Attributable
to the MDRI-II Trust
liquidation3
General Subsidy Account
Earmarked Subsidy
Accounts1 Total
Of which:Windfall
Gold Sales
Profits2
Luxembourg 4.3 10.6 14.9 4.3 0.9 — —
Macedonia, former Yugoslav Republic of 0.7 — 0.7 0.7 — — —
Malawi 0.2 0.5 0.7 0.7 — — —
Malaysia 18.2 — 18.2 18.2 4.1 0.4 0.4
Maldives 0.1 — 0.1 0.1 — — —
Mali 1.0 — 1.0 1.0 — — —
Malta 1.0 0.2 1.2 1.0 0.7 ** **
Mauritania, Islamic Republic of 0.7 — 0.7 0.7 — — —
Mauritius 1.0 — 1.0 1.0 ** — —
Mexico 37.3 — 37.3 37.3 40.0 — —
Micronesia, Federated States of ** — ** ** — — —
Moldova, Republic of 1.3 — 1.3 1.3 — — —
Mongolia 0.6 — 0.6 0.6 — — —
Montenegro 0.1 — 0.1 0.1 — — —
Morocco 6.0 7.3 13.3 6.0 ** 0.1 0.1
Mozambique, Republic of 1.1 — 1.1 1.1 — — —
Myanmar 2.7 — 2.7 2.7 — — —
Namibia 1.4 — 1.4 1.4 — — —
Nepal 0.7 — 0.7 0.7 0.1 — —
Netherlands, Kingdom of the 62.0 100.5 162.5 53.1 52.0 — —
New Zealand 9.2 — 9.2 9.2 2.2 — —
Nicaragua — 1.4 1.4 1.4 — — —
Niger 0.5 0.2 0.7 0.7 — — —
Nigeria 18.1 — 18.1 18.1 6.2 — —
Norway — 72.2 72.2 19.3 12.9 0.5 0.5
Oman 2.4 2.2 4.6 2.4 0.1 — —
Pakistan 10.6 — 10.6 10.6 0.1 ** **
Panama 2.1 — 2.1 2.1 — — —
Papua New Guinea 0.4 — 0.4 0.4 — — —
Paraguay 1.0 — 1.0 1.0 — — —
Philippines 4.9 — 4.9 3.0 4.5 — —
Poland, Republic of — — — — 8.8 — —
Portugal — 10.6 10.6 10.6 4.4 1.5 **
Qatar 1.5 — 1.5 0.9 — — —
Romania 7.6 — 7.6 7.6 — — —
Russian Federation 61.2 35.7 96.9 61.2 10.2 — —
Rwanda 0.8 — 0.8 0.8 — — —
St. Lucia 0.1 — 0.1 0.1 — — —
St. Vincent and the Grenadines — — — — 0.1 — —
Samoa 0.1 — 0.1 0.1 ** — —
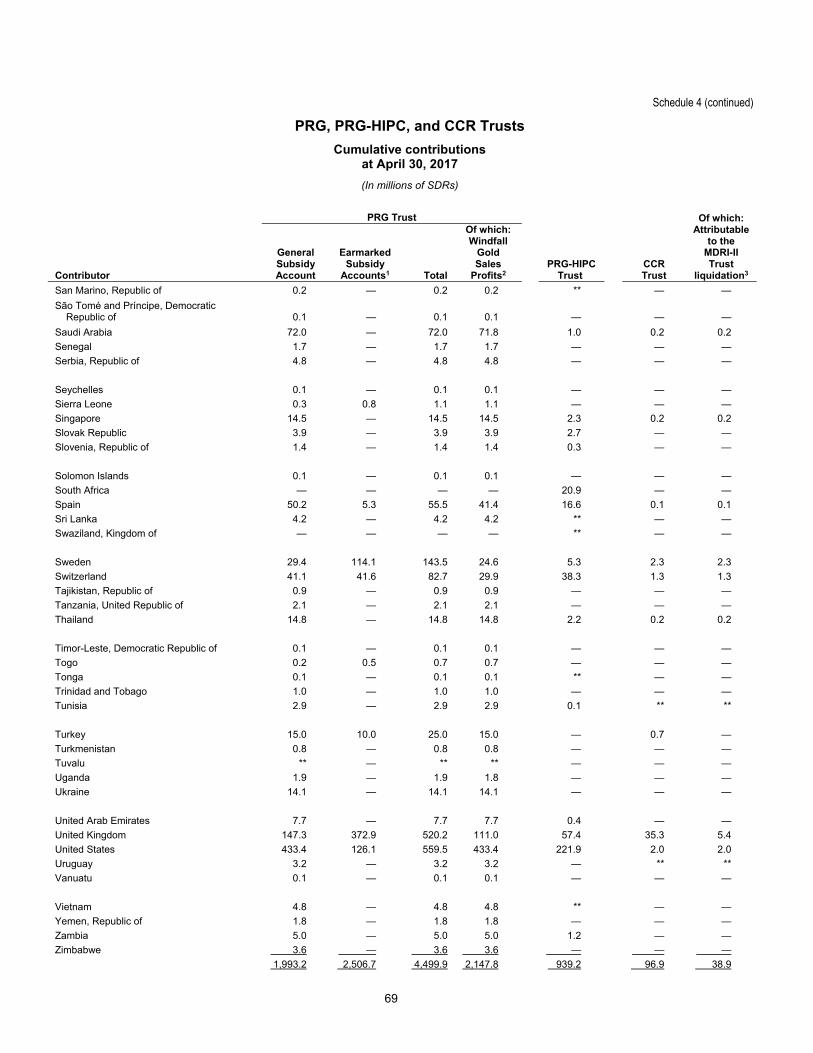
69
Schedule 4 (continued)
PRG, PRG-HIPC, and CCR Trusts
Cumulative contributions at April 30, 2017
(In millions of SDRs)
Contributor
PRG Trust
PRG-HIPC
Trust
CCR Trust
Of which: Attributable
to the MDRI-II Trust
liquidation3
General Subsidy Account
Earmarked Subsidy
Accounts1 Total
Of which:Windfall
Gold Sales
Profits2
San Marino, Republic of 0.2 — 0.2 0.2 ** — —
São Tomé and Príncipe, Democratic Republic of
0.1
—
0.1
0.1
—
—
—
Saudi Arabia 72.0 — 72.0 71.8 1.0 0.2 0.2
Senegal 1.7 — 1.7 1.7 — — —
Serbia, Republic of 4.8 — 4.8 4.8 — — —
Seychelles 0.1 — 0.1 0.1 — — —
Sierra Leone 0.3 0.8 1.1 1.1 — — —
Singapore 14.5 — 14.5 14.5 2.3 0.2 0.2
Slovak Republic 3.9 — 3.9 3.9 2.7 — —
Slovenia, Republic of 1.4 — 1.4 1.4 0.3 — —
Solomon Islands 0.1 — 0.1 0.1 — — —
South Africa — — — — 20.9 — —
Spain 50.2 5.3 55.5 41.4 16.6 0.1 0.1
Sri Lanka 4.2 — 4.2 4.2 ** — —
Swaziland, Kingdom of — — — — ** — —
Sweden 29.4 114.1 143.5 24.6 5.3 2.3 2.3
Switzerland 41.1 41.6 82.7 29.9 38.3 1.3 1.3
Tajikistan, Republic of 0.9 — 0.9 0.9 — — —
Tanzania, United Republic of 2.1 — 2.1 2.1 — — —
Thailand 14.8 — 14.8 14.8 2.2 0.2 0.2
Timor-Leste, Democratic Republic of 0.1 — 0.1 0.1 — — —
Togo 0.2 0.5 0.7 0.7 — — —
Tonga 0.1 — 0.1 0.1 ** — —
Trinidad and Tobago 1.0 — 1.0 1.0 — — —
Tunisia 2.9 — 2.9 2.9 0.1 ** **
Turkey 15.0 10.0 25.0 15.0 — 0.7 —
Turkmenistan 0.8 — 0.8 0.8 — — —
Tuvalu ** — ** ** — — —
Uganda 1.9 — 1.9 1.8 — — —
Ukraine 14.1 — 14.1 14.1 — — —
United Arab Emirates 7.7 — 7.7 7.7 0.4 — —
United Kingdom 147.3 372.9 520.2 111.0 57.4 35.3 5.4
United States 433.4 126.1 559.5 433.4 221.9 2.0 2.0
Uruguay 3.2 — 3.2 3.2 — ** **
Vanuatu 0.1 — 0.1 0.1 — — —
Vietnam 4.8 — 4.8 4.8 ** — —
Yemen, Republic of 1.8 — 1.8 1.8 — — —
Zambia 5.0 — 5.0 5.0 1.2 — —
Zimbabwe 3.6 — 3.6 3.6 — — —
1,993.2 2,506.7 4,499.9 2,147.8 939.2 96.9 38.9

70
Schedule 4 (concluded)
PRG, PRG-HIPC, and CCR Trusts
Cumulative contributions at April 30, 2017
(In millions of SDRs)
Contributor
PRG Trust
PRG-HIPC Trust
CCR Trust
Of which: Attributable
to the MDRI-II Trust
liquidation3
General Subsidy Account
Earmarked Subsidy
Accounts1 Total
Of which: Windfall Gold Sales Profits2
Special Disbursement Account 147.9 870.3 1,018.2 — 1,166.8 293.2 —
Administered Accounts — 159.5 159.5 — 342.4 — —
General Resources Account — — — — 72.5 — —
147.9 1,029.8 1,177.7 — 1,581.7 293.2 —
Total 2,141.1 3,536.5 5,677.6 2,147.8 2,520.9 390.1 38.9 Components may not sum exactly to totals due to rounding. 1 Includes contributions to the following earmarked subsidy accounts: Extended Credit Facility, Standby Credit Facility, Rapid Credit Facility, Poverty Reduction and Growth Facility, and the Exogenous Shocks Facility.
2 Includes voluntary contributions made by IMF members following the distributions from the IMF’s General Reserve of SDR 0.7 billion and SDR 1.75 billion in October 2012 and 2013, respectively, attributable to windfall gold sales profits.
3 The MDRI-II Trust was liquidated on August 1, 2015.
** Less than SDR 50,000.

pwc
Report of Independent Auditors
To the Board of Governors of the International Monetary Fund
We have audited the accompanying financial statements of each of the entities of the International Monetary Fund listed in the table below (the "Administered Accounts"), which comprise the statements of financial position as of the dates listed in the table below and the related statements of comprehensive income and changes in resources and of cash flows for the periods listed in the table below.
Administered Accounts Administered Account — Japan (Japan) (1) SCA-1/Deferred Charges Administered
Account (SCA-1/Deferred Charges) (1) Framework Administered Account for Technical Assistance Activities (Framework-TA) (1)
Administered Account People's Bank of China (People's Bank of China) (1)
Framework Administered Account for Selected Fund Activities (Framework-SFA) (1)
Interim Administered Account for Windfall Gold Sale Profits (Windfall Gold Sales Profits) (1)
Administered Account for Interim Holdings of Voluntary Contributions (Interim Holdings) (1)
Interim Administered Account for Remaining Windfall Gold Sales Profits (Remaining Windfall Gold Sales Profits) (1)
Administered Account — Switzerland (Switzerland) (2) Post-EPCA/ENDA Interim Administered Account (Post-EPCA/ENDA) (1)
Supplementary Financing Facility Subsidy Account (SFF Subsidy) (1)
Post-MDRI-II Interim Administered Account ("MAA") (Post-MDRI-II) (3)
Post-SCA-2 Administered Account (Post-SCA-2) (1) (1) As of and for the years ended April 30, 2017 and 2016 (2) As of April 30, 2017 and for the period from February 1, 2017 (date of inception) to April 30, 2017 (3) As of April 30, 2017 and 2016 and for the period from June 23, 2015 (date of inception) to April 30,
2016 and for the period from May 1, 2016 to February 1, 2017
We are independent of the Accounts in accordance with the ethical requirements that are relevant to our audit of the financial statements in the United States of America, together with the International Ethics Standards Board for Accountants' Code of Ethics for Professional Accountants, and we have fulfilled our other ethical responsibilities in accordance with these requirements, respectively.
Responsibilities ofManagement and Those Charged With Governance for the Financial Statements
Management is responsible for the preparation and fair presentation of the financial statements in accordance with International Financial Reporting Standards as issued by the International Accounting Standards Board; this includes the design, implementation, and maintenance of internal control relevant to the preparation and fair presentation of financial statements that are free from material misstatement, whether due to fraud or error.
In preparing the financial statements, management is responsible for assessing the Accounts' ability to continue as a going concern, disclosing, as applicable, matters related to going concern and using the
• PricewaterhouseCoopers LLP, 180o 7'ysons Boulevard, McLean, VA 22102-4261 T: (703) 918 3000, F: (703) 918 3100, www.pwc.com/us
pwc
going concern basis of accounting, unless management either intends to liquidate the Accounts or to cease operations or has no realistic alternative but to do so.
Those charged with governance are responsible for overseeing the Accounts' financial reporting process.
Auditors' Responsibility
Our responsibility is to express an opinion on the financial statements based on our audits. We conducted our audits in accordance with auditing standards generally accepted in the United States of America and International Standards on Auditing. Those standards require that we plan and perform the audit to obtain reasonable assurance about whether the financial statements are free from material misstatement, whether due to fraud or error. Reasonable assurance is a high level of assurance but is not a guarantee that an audit will always detect a material misstatement when it exists. Misstatements can arise from fraud or error and are considered material if, individually or in the aggregate, they could reasonably be expected to influence the economic decisions of users taken on the basis of the financial statements.
An audit involves performing procedures to obtain audit evidence about the amounts and disclosures in the financial statements. The procedures selected depend on our judgment, including the assessment of the risks of material misstatement of the financial statements, whether due to fraud or error. We design audit procedures responsive to those risks and obtain audit evidence that is sufficient and appropriate to provide a basis for our opinion. The risk of not detecting a material misstatement resulting from fraud is higher than for one resulting from error because fraud may involve collusion, forgery, intentional omissions, misrepresentations, or the override of internal control.
In making those risk assessments, we consider internal control relevant to the Accounts' preparation and fair presentation of the financial statements in order to design audit procedures that are appropriate in the circumstances but not for the purpose of expressing an opinion on the effectiveness of the Accounts' internal control. Accordingly, we express no such opinion. An audit also includes evaluating the appropriateness of accounting policies used and the reasonableness of significant accounting estimates made by management, as well as evaluating the overall presentation, structure, and content of the financial statements, including disclosures, and whether the financial statements represent the underlying transactions and events in a manner that achieves fair presentation.
As part of an audit:
• We exercise professional judgment and maintain professional skepticism throughout the audit. • We conclude on the appropriateness of management's use of the going concern basis of
accounting and based on the audit evidence obtained, whether a material uncertainty exists related to events or conditions that may cast significant doubt on the Accounts' ability to continue as a going concern. If we conclude that a material uncertainty exists, we are required to draw attention in our report to the related disclosures in the financial statements or, if such disclosures are inadequate, to modify our opinion. Our conclusions are based on the audit evidence obtained up to the date of our report. However, future events or conditions may cause the Accounts to cease to continue as a going concern.
• We communicate with those charged with governance regarding, among other matters, the planned scope and timing of the audit and significant audit findings, including any significant deficiencies or material weaknesses in internal control that we identify during our audit.

June 23, 2017
pwc
We believe that the audit evidence we have obtained is sufficient and appropriate to provide a basis for our audit opinion.
Opinion
In our opinion, the financial statements referred to above present fairly, in all material respects, the financial position of each of the Administered Accounts as of the dates listed in the table above, and the results of each of their operations and each of their cash flows for the periods listed in the table above in accordance with International Financial Reporting Standards as issued by the International Accounting Standards Board.
Other Matter
Our audit was conducted for the purpose of forming an opinion on each of the Administered Account financial statements taken as a whole. The supplemental schedules listed on pages 86 to 88 are presented for purposes of additional analysis and are not a required part of the respective Administered Account financial statements. The information is the responsibility of management and was derived from and relates directly to the underlying accounting and other records used to prepare the respective Administered Account financial statements. The information has been subjected to the auditing procedures applied in the audit of the respective Administered Account financial statements and certain additional procedures, including comparing and reconciling such information directly to the underlying accounting and other records used to prepare the respective Administered Account financial statements or to the respective Administered Account financial statements themselves and other additional procedures, in accordance with auditing standards generally accepted in the United States of America. We also subjected the information to the applicable procedures required by the International Standards on Auditing. In our opinion, the information is fairly stated, in all material respects, in relation to the respective Administered Account financial statements taken as a whole.

Administered Accounts Statements of financial position
at April 30, 2017, and 2016
(In thousands of U.S. dollars)
Japan Framework—TA Framework—SFA Interim Holdings Switzerland 2017 2016 2017 2016 2017 2016 2017 2016 2017
Assets
Cash and cash equivalents 132,232 131,667 569 818 262,054 280,485 — 7 —
Other assets — — — — — — — — 8
Total assets 132,232 131,667 569 818 262,054 280,485 — 7 8
Liabilities
Accounts payable — — — — 30,554 29,154 — — —
Other liabilities — — — — — — — — 8
Total liabilities — — — — 30,554 29,154 — — 8
Resources 132,232 131,667 569 818 231,500 251,331 — 7 —
Total liabilities and resources 132,232 131,667 569 818 262,054 280,485 — 7 8
The accompanying notes are an integral part of these financial statements. The financial statements were approved by the Managing Director and the Director of Finance on June 23, 2017.
Christine Lagarde /s/ Managing Director
Andrew Tweedie /s/ Director, Finance Department
74

Administered Accounts Statements of financial position
at April 30, 2017, and 2016
(In thousands of SDRs)
SFF Subsidy Post-SCA-2 SCA-1/ Deferred
Charges People's Bank of
China Windfall Gold Sales Profits
Remaining Windfall Gold Sales Profits
Post-EPCA/ENDA Post-MDRI-II
Note 2017 2016 2017 2016 2017 2016 2017 2016 2017 2016 2017 2016 2017 2016 2017 2016 Assets Cash and cash
equivalents 906 905 41,033 40,990 34,999 34,962 5,091 4,872 37,686 37,646 78,538 88,819 — 85 — 225
Interest receivable — — 38 5 32 4 363 91 35 5 73 12 — — — —
Investments 5 — — — — — — 168,416 168,369 — — — — — — — —
Total assets 906 905 41,071 40,995 35,031 34,966 173,870 173,332 37,721 37,651 78,611 88,831 — 85 — 225
Liabilities
Interest payable — — — — — — 141 141 — — — — — — — —
Borrowings 6 — — — — — — 170,000 170,000 — — — — — — — —
Total liabilities — — — — — — 170,141 170,141 — — — — — — — —
Resources 906 905 41,071 40,995 35,031 34,966 3,729 3,191 37,721 37,651 78,611 88,831 — 85 — 225 Total liabilities and
resources 906 905 41,071 40,995 35,031 34,966 173,870 173,332 37,721 37,651 78,611 88,831 — 85 — 225
The accompanying notes are an integral part of these financial statements.
75

Administered Accounts Statements of comprehensive income and changes in resources
for the financial years ended April 30, 2017, and 2016
(In thousands of U.S. dollars)
Japan Framework—TA Framework—SFA Interim Holdings Switzerland Note 2017 2016 2017 2016 2017 2016 2017 2016 20171
Resources, beginning of year
131,667 131,432 818 8,323 251,331 280,147 7 7 —
Investment income
565 235 1 4 1,354 507 — — —
Contributions (returned)/received
— — (250) (7,509) 141,367 122,524 — — 100,296
Other income
— — — — — — — — 8
Operating expenses
— — — — (162,552) (151,847) — — (8)
Operational income/(loss)
565 235 (249) (7,505) (19,831) (28,816) — — 100,296
Transfers 7 — — — — — — (7) — (100,296)
Other comprehensive income
— — — — — — — — —
Total comprehensive income
(loss)/changes in resources
565 235 (249) (7,505) (19,831) (28,816) (7) — —
Resources, end of year
132,232 131,667 569 818 231,500 251,331 — 7 —
The accompanying notes are an integral part of these financial statements. 1 From inception to April 30, 2017.
76

Administered Accounts Statements of comprehensive income and changes in resources
for the financial years ended April 30, 2017, and 2016
(In thousands of SDRs)
SFF Subsidy Post-SCA-2 SCA-1/ Deferred
Charges People's Bank of
China Windfall Gold Sales Profits
Remaining Windfall Gold Sales Profits
Post-EPCA/ENDA Post-MDRI-II
Note 2017 2016 2017 2016 2017 2016 2017 2016 2017 2016 2017 2016 2017 2016 20171 20161
Resources, beginning of year 905 904
40,995
40,974
34,966
34,949 3,191 3,269
37,651 38,098 88,831 97,530 85
85
225 —
Investment Income 5 1 1 76 21 65 17 1,233 618 70 19 155 48 — — — —
Contributions — — — — — — — — — — — — — — — 4,472 Interest expense on
borrowings — — — — — — (170) (171) — — — — — — — —
Operational income 1 1 76 21 65 17
1,063 447 70 19 155 48 — — — 4,472
Transfers 7 — — — — — — (525) (525) — (466) (10,375) (8,747) (85) — (225) (4,247)
Other comprehensive income — — — — — — — — — — — — — — — —
Total comprehensive income/ (loss) changes in resources 1 1 76 21 65 17 538 (78) 70 (447) (10,220) (8,699) (85) — (225) 225
Resources, end of year 906 905 41,071 40,995 35,031 34,966 3,729 3,191 37,721 37,651 78,611 88,831 — 85 — 225
The accompanying notes are an integral part of these financial statements. 1 From inception to April 30, 2016, and for the period May 1, 2016, to February 1, 2017.
77

Administered Accounts Statements of cash flows
for the financial years ended April 30, 2017, and 2016
(In thousands of U.S. dollars)
Japan Framework—TA Framework—SFA Interim Holdings Switzerland 2017 2016 2017 2016 2017 2016 2017 2016 20171
Cash flows from operating activities Total comprehensive income/(loss) 565 235 (249) (7,505) (19,831) (28,816) (7) — — Adjustments to reconcile total comprehensive income/(loss) to
cash generated by operations
Interest income (565) (235) (1) (4) (1,354) (507) — — —
Changes in other assets — — — — — — — — (8)
Changes in other liabilities — — — — 1,400 520 — — 8
Interest received 565 235 1 4 1,354 507 — — —
Net cash provided by/(used in) operating activities 565 235 (249) (7,505) (18,431) (28,296) (7) — —
Net cash provided by investment activities — — — — — — — — —
Net cash provided by financing activities — — — — — — — — —
Net increase/(decrease) in cash and cash equivalents 565 235 (249) (7,505) (18,431) (28,296) (7) — —
Cash and cash equivalents, beginning of year 131,667 131,432 818 8,323 280,485 308,781 7 7 —
Cash and cash equivalents, end of year 132,232 131,667 569 818 262,054 280,485 — 7 — The accompanying notes are an integral part of these financial statements. 1 From inception to April 30, 2017.
78
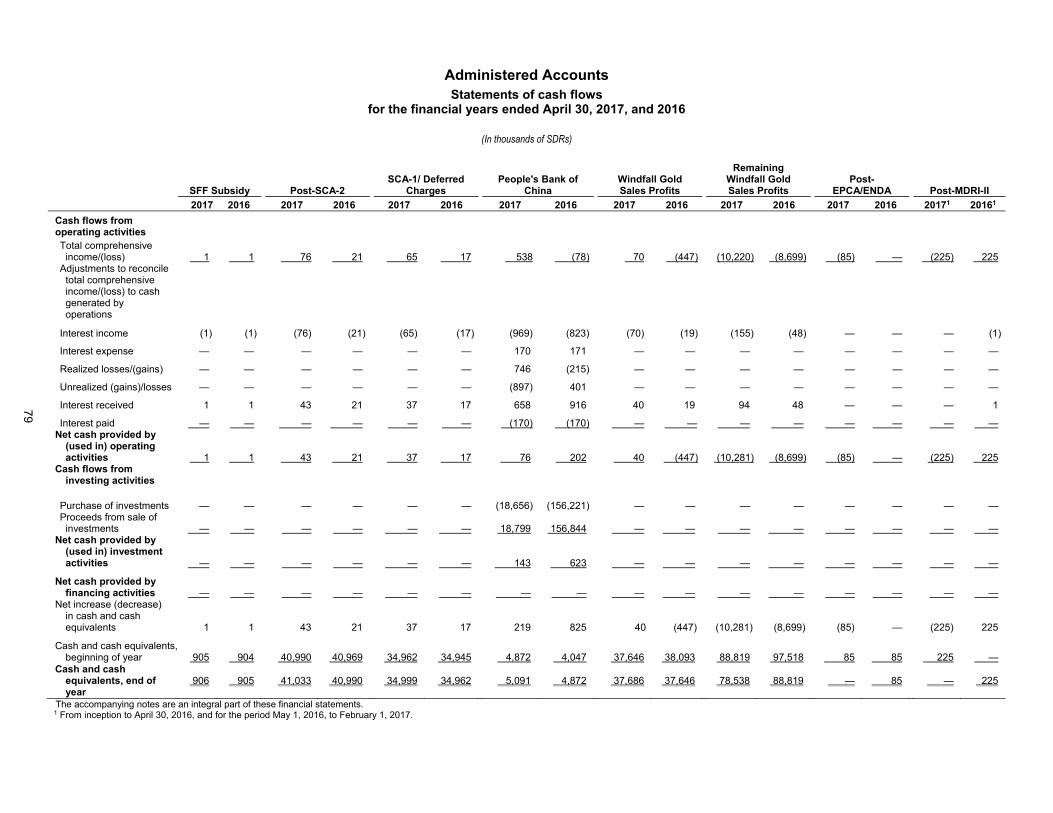
Administered Accounts Statements of cash flows
for the financial years ended April 30, 2017, and 2016
(In thousands of SDRs)
SFF Subsidy Post-SCA-2 SCA-1/ Deferred
Charges People's Bank of
China Windfall Gold Sales Profits
Remaining Windfall Gold Sales Profits
Post-EPCA/ENDA Post-MDRI-II
2017 2016 2017 2016 2017 2016 2017 2016 2017 2016 2017 2016 2017 2016 20171 20161
Cash flows from operating activities Total comprehensive
income/(loss) 1 1 76 21 65 17 538 (78) 70 (447)
(10,220) (8,699) (85) — (225) 225 Adjustments to reconcile
total comprehensive income/(loss) to cash generated by operations
Interest income (1) (1) (76) (21) (65) (17) (969) (823) (70) (19) (155) (48) — — — (1)
Interest expense — — — — — — 170 171 — — — — — — — —
Realized losses/(gains) — — — — — — 746 (215) — — — — — — — —
Unrealized (gains)/losses — — — — — — (897) 401 — — — — — — — —
Interest received 1 1 43 21 37 17 658 916 40 19 94 48 — — — 1
Interest paid — — — — — — (170) (170) — — — — — — — — Net cash provided by
(used in) operating activities 1 1 43 21 37 17 76 202 40 (447) (10,281) (8,699) (85) — (225) 225
Cash flows from investing activities
Purchase of investments — — — — — — (18,656) (156,221) — — — — — — — — Proceeds from sale of
investments — — — — — — 18,799 156,844 — — — — — — — — Net cash provided by
(used in) investment activities — — — — — — 143 623 — — — — — — — —
Net cash provided by financing activities — — — — — — — — — — — — — — — —
Net increase (decrease) in cash and cash equivalents 1 1 43 21 37 17 219 825 40 (447) (10,281) (8,699) (85) — (225) 225
Cash and cash equivalents, beginning of year 905 904 40,990 40,969 34,962 34,945 4,872 4,047 37,646 38,093 88,819 97,518 85 85 225 —
Cash and cash equivalents, end of year
906 905 41,033 40,990 34,999 34,962 5,091 4,872 37,686 37,646 78,538 88,819 — 85 — 225
The accompanying notes are an integral part of these financial statements. 1 From inception to April 30, 2016, and for the period May 1, 2016, to February 1, 2017.
79
Administered Accounts Notes to the financial statements
for the financial years ended April 30, 2017, and 2016
80
1. Nature of operations At the request of members, the International Monetary Fund (IMF) has established special-purpose accounts (the Administered Accounts) to administer contributed resources provided to fund financial and technical services consistent with the purposes of the IMF. The instruments establishing the Administered Accounts provide the terms and conditions, as agreed with the IMF and contributing members, under which the resources may be used. The assets of each account and each subaccount are separate from the assets of all other accounts of, or administered by, the IMF and are not to be used to discharge liabilities or to meet losses incurred in the administration of other accounts.
1.1 Administered Account—Japan (Japan) The account was established in March 1989 to administer resources made available by Japan—and, under a subsequent amendment, by other countries with Japan’s concurrence—that are to be used to assist certain members with overdue obligations to the IMF. The resources of the account are to be disbursed in amounts specified by Japan and to members designated by Japan. Effective March 5, 2008, the instrument governing the account was amended to allow the provision of assistance to these members in the context of an internationally agreed comprehensive package that integrates arrears clearance and subsequent debt relief. The account can be terminated by the IMF or by Japan at any time. Upon termination of the account, any remaining resources in the account are to be returned to Japan.
1.2 Framework Administered Account for Technical Assistance Activities (Framework—TA) The account was established by the IMF in April 1995 to receive and administer contributed resources that are to be used to finance technical assistance activities of the IMF. During the financial year ended April 30, 2015, the account was terminated. The account is in the process of liquidation and any funds remaining in the account will either be refunded to the contributors, or at their request, transferred to the Framework Administered Account for Selected Fund Activities.
1.3 Framework Administered Account for Selected Fund Activities (Framework—SFA) The account was established in March 2009 to administer externally contributed resources that are to be used to finance selected IMF activities, including the full range of IMF technical assistance activities provided to recipients. The financing of selected Fund activities is implemented through the establishment and operation of subaccounts within the Framework—SFA. At April 30, 2017, there were 46 subaccounts, including one new subaccount that was established during the financial year; no subaccounts were terminated during the financial year (three new subaccounts were established and one subaccount was terminated in the financial year ended April 30, 2016). Disbursements are made from the respective subaccounts under the Framework—SFA to the General Resources Account (GRA) to reimburse the IMF for costs incurred in connection with activities financed by the respective subaccounts. Framework—SFA resources are to be used in
accordance with terms and conditions established by the IMF, with the concurrence of contributors. Resources in Framework—SFA subaccounts may be transferred to other subaccounts if the terms and conditions of the subaccounts so provide. The Framework—SFA or any subaccount thereof may be terminated by the IMF at any time with the concurrence of all contributors and the Managing Director. A subaccount may also be terminated by the contributor of the resources to the subaccount or, in the case of a subaccount comprising resources from more than one contributor, by all the contributors participating in the subaccount at the time of termination, provided that a contributor to such a subaccount may cease its own participation in the subaccount at any time without termination of the subaccount. The disposition of any balances, net of liabilities and commitments under the activities financed, is governed by the conditions agreed between the IMF and the contributor, or contributors in the case of a subaccount with more than one contributor. Absent such agreement, the balances are returned to the contributor(s) upon withdrawal from or termination of the subaccount.
1.4 Administered Account for Interim Holdings of Voluntary Contributions for Fund Activities (Interim Holdings) The account was established in April 2010 to receive and hold externally contributed resources for an interim period until such time as they can be transferred to other Trusts or accounts administered by the IMF. The account may be terminated by the IMF at any time and uncommitted resources in the account at the time of termination are to be returned to the contributors.
1.5 Administered Account—Switzerland (Switzerland) The account was established in February 2017 to facilitate the settlement of payments under the bilateral financing agreement between the Swiss National Bank (SNB) and the National Bank of Ukraine (NBU). The administered account will be terminated upon agreement between the SNB and the IMF, following consultations between the SNB and NBU.
1.6 Supplementary Financing Facility Subsidy Account (SFF Subsidy) The account was established in December 1980 to assist low-income member countries to meet the costs of using resources made available through the IMF’s Supplementary Financing Facility and under the policy on exceptional access. All repurchases under these policies were due on or before January 31, 1991, and the final subsidy payments were approved in July 1991. However, one member (Sudan), overdue in the payment of charges to the IMF at April 30, 2017, remains eligible to receive previously approved subsidy payments of SDR 0.9 million at April 30, 2017, and 2016, when its overdue charges are settled. Accordingly, the account remains in operation and has retained amounts for payment to Sudan once the overdue charges are paid.
Administered Accounts Notes to the financial statements
for the financial years ended April 30, 2017, and 2016
81
1.7 Post-SCA-2 Administered Account (Post-SCA-2) The account was established in December 1999 for the temporary administration of resources transferred by members following the termination of the second Special Contingent Account (SCA-2) in the General Department of the IMF, prior to the final disposition of those resources in accordance with members’ instructions. The account will be terminated upon completion of its operations.
1.8 SCA-1/Deferred Charges Administered Account (SCA-1/Deferred Charges) The account was established in March 2008 as an interim vehicle to hold and administer members’ refunds resulting from the distribution of certain SCA-1 balances and from the payment of deferred charges adjustments that had been made in respect of overdue charges attributed to Liberia. Following Liberia’s arrears clearance, members were given the option to temporarily deposit their refunds into this account pending their decisions as to the final disposition of those resources. The account will be terminated three years from the effective date of decisions establishing the account. This termination date was extended four times, most recently to March 13, 2018, by the IMF Executive Board at the request of the remaining contributors.
1.9 Administered Account People’s Bank of China (People’s Bank of China) The account was established in June 2012 in order to administer and invest resources provided by the People’s Bank of China to support the IMF’s technical assistance and training programs. The account will be terminated upon completion of operations, or at such earlier time by the IMF in consultation with the People’s Bank of China. Once the obligation to repay the outstanding loan has been discharged and the final payment of interest has been made, any surplus remaining in the account will be transferred to the People’s Bank of China.
1.10 Interim Administered Account for Windfall Gold Sales Profits (Windfall Gold Sales Profits) The account was established in October 2012 to temporarily hold and administer contributions representing all or a portion of members’ shares of the partial distribution of amounts in the IMF’s General Reserve attributable to windfall gold sales profits. Members were given the option to temporarily deposit the proceeds from the distribution into this account pending their decisions as to the final disposition of these resources. The account will be terminated on October 11, 2017, or as promptly as practicable following the receipt of instructions from all contributors regarding the distribution of the resources in the accounts, whichever is earlier. Any balances remaining in the account upon termination are to be transferred to the respective contributors.
1.11 Interim Administered Account for Remaining Windfall Gold Sales Profits (Remaining Windfall Gold Sales Profits) The account was established in October 2013 to temporarily hold and administer contributions representing all or a portion of members’ shares of the final distribution of amounts in the IMF’s General Reserve attributable to remaining windfall gold sales profits. Members were given the option to temporarily deposit the proceeds from the distribution into this account pending their decisions as to the final disposition of these resources. The account will be terminated on October 9, 2018, or as promptly as practicable following the receipt of instructions from all contributors regarding the distribution of the resources in the accounts, whichever is earlier. Any balances remaining in the account upon termination are to be transferred to the respective contributors.
1.12 Post-EPCA/ENDA Interim Administered Account (Post-EPCA/ENDA) The account was established in January 2014 to temporarily hold and administer resources transferred by members in the context of the termination of the Post-Conflict and Natural Disaster Emergency Assistance Subsidy Account, prior to the final disposition of those resources in accordance with members’ instructions. The account was terminated on January 27, 2017, and liquidated on May 1, 2017.
1.13 Post-MDRI-II Interim Administered Account (Post-MDRI-II) The account was established in June 2015 to temporarily hold and administer resources transferred by members in the context of the termination of the Multilateral Debt Relief Initiative-II Trust, prior to the final disposition of those resources in accordance with members’ instructions. The account was liquidated upon completion of all transfers on February 1, 2017.
2. Basis of preparation and measurement The financial statements of the Administered Accounts are prepared in accordance with International Financial Reporting Standards (IFRS) issued by the International Accounting Standards Board (IASB). The financial statements have been prepared under the historical cost convention, except for the revaluation of financial instruments at fair value through profit or loss.
2.1 Unit of account
2.1.1 Japan, Framework—TA, Framework—SFA, Interim Holdings, and Switzerland The functional and reporting currency of these accounts is the U.S. dollar. All transactions and operations of these accounts, including the transfers to and from these accounts, are denominated in U.S. dollars. Contributions denominated in other currencies are converted into U.S. dollars upon receipt of the funds.

Administered Accounts Notes to the financial statements
for the financial years ended April 30, 2017, and 2016
82
2.1.2 SFF Subsidy, Post-SCA-2, SCA-1/Deferred Charges, People’s Bank of China, Windfall Gold Sales Profits, Remaining Windfall Gold Sales Profits, Post-EPCA/ENDA, and Post-MDRI-II The financial statements for these accounts are presented in SDRs, which is the IMF’s unit of account. The value of the SDR is determined daily by the IMF by summing specific amounts of the basket currencies in U.S. dollar equivalents on the basis of market exchange rates. Contributions denominated in other currencies are converted into the component currencies in the SDR basket upon receipt of the funds. The IMF reviews the composition of the SDR valuation basket at a minimum of five-year intervals. The latest review was completed in November 2015 and the Chinese renminbi was included in the SDR valuation basket effective October 1, 2016. The specific amounts of the currencies in the SDR basket were as follows:
SDR basket currency October 1, 2016 to April 30, 2017
Prior to October 1, 2016
Chinese renminbi 1.0174 0 — Euro 0.386710 0.423 Japanese yen 11.900 12.100 Pound sterling 0.085946 0.111 U.S. dollar 0.582520 0.660
At April 30, 2017, 1 SDR was equal to US$1.371020 (US$1.41733 at April 30, 2016). The next review of the method of valuation of the SDR will take place by September 30, 2021, unless developments in the interim justify an earlier review.
2.2 Use of estimates and judgment The preparation of financial statements requires management to make judgments, estimates, and assumptions that affect the application of accounting policies and the reported amounts of assets, liabilities, income, and expenses. Actual results may differ from these estimates. Estimates and underlying assumptions are reviewed on an ongoing basis. Revisions to accounting estimates are recognized in the period in which the estimate is revised and in any future periods affected. Information about the most significant estimates and critical judgments used in applying accounting policies is described in Note 3.3.
3. Summary of significant accounting policies
3.1 New and revised International Financial Reporting Standards and interpretations 3.1.1 Amendments to existing standards that became effective in the financial year ended April 30, 2017 The following amendments to existing standards issued by the IASB became effective in the financial year ended April 30, 2017. These
amendments have no material impact on the Administered Accounts’ financial statements: Amendments to IFRS 7 “Financial Instruments: Disclosures,” issued in September 2014 and effective for annual periods starting on or after January 1, 2016. Amendments to IFRS 11 “Joint Arrangements,” issued in May 2014 and effective for annual periods starting on or after January 1, 2016. Amendments to IFRS 12 “Disclosure of Interests in Other Entities,” issued in December 2014 and effective for annual periods starting on or after January 1, 2016. Amendments to IAS 1 “Presentation of Financial Statements,” issued in December 2014 and effective for annual periods starting on or after January 1, 2016. Amendments to IAS 28 “Investments in Associates and Joint Ventures,” issued in December 2014 and effective for annual periods starting on or after January 1, 2016.
3.1.2 New standard to be adopted in future years The following new standard has been issued by the IASB and will be effective for annual periods starting on or after January 1, 2018: In July 2014, the IASB published the complete version of IFRS 9 “Financial Instruments,” which replaced most of the guidance in IAS 39 “Financial Instruments: Recognition and Measurement.” The standard requires financial assets to be classified at fair value through profit or loss, fair value through other comprehensive income, or amortized cost on the basis of the entity’s business model for managing the assets and the contractual cash flow characteristics of the financial asset. No changes were introduced for the classification and measurement of financial liabilities except for financial liabilities designated at fair value through profit or loss. For these financial liabilities, changes in the fair value due to the changes in an entity’s own credit risk must be recognized in other comprehensive income. The incurred loss model of IAS 39 has been replaced by a forward-looking expected credit loss impairment model. The impact of the adoption of IFRS 9 on the Administered Accounts’ financial statements is being assessed.
3.1.3 New standards and amendments to existing standards effective in future years that are not expected to have a material impact The following new standards and amendments to existing standards issued by the IASB will become effective in future financial years. These standards and amendments are not expected to have a material impact on the Administered Accounts’ financial statements: Amendments to IFRS 12 “Disclosure of Interests in Other Entities,” issued in December 2016 and effective for annual periods starting on or after January 1, 2017. IFRS 15 “Revenue from Contracts with Customers,” issued in May 2014 and effective for annual periods starting on or after January 1, 2018.

Administered Accounts Notes to the financial statements
for the financial years ended April 30, 2017, and 2016
83
Amendments to IAS 7 “Statement of Cash Flows,” issued in January 2016 and effective for annual periods starting on or after January 1, 2017. Amendments to IAS 28 “Investments in Associates and Joint Ventures,” issued in December 2016 and effective for annual periods starting on or after January 1, 2018.
3.2 Cash and cash equivalents Cash and cash equivalents comprise cash on hand and demand deposits and other highly liquid short-term investments that are readily convertible to a known amount of cash and are subject to an insignificant risk of changes in value. Cash and cash equivalents are held for the purpose of meeting short-term cash commitments rather than for investment or other purposes.
3.3 Investments Investments are held in the People’s Bank of China account, which measures fixed-term deposits (FTDs) at amortized cost, and has designated the investments in fixed-income securities as financial assets held at fair value through profit or loss because they are managed and their performance is evaluated on a fair value basis. Such designation may be made only upon initial recognition and cannot subsequently be changed. The designated assets are carried at fair value in the statements of financial position, with changes in fair value included in the statements of comprehensive income in the period in which they arise. The valuation techniques to determine fair value are described in Note 5.
3.3.1 Recognition Investments are recognized on the trade date at which the People’s Bank of China account becomes a party to the contractual provisions of the instrument.
3.3.2 Derecognition Investments are derecognized on the trade date when the contractual rights to the cash flows from the asset expire, or when substantially all the risks and rewards of ownership of the investment are transferred.
3.3.3 Investment income Investment income comprises interest income, realized gains and losses, and unrealized gains and losses, including currency valuation differences arising from exchange rate movements against the functional currency. Interest income is recognized on an accrual basis under the effective interest rate method.
3.4 Borrowings The People’s Bank of China account borrows from the contributing member for the purpose of generating investment income to support the activities of the Framework—SFA account. All borrowings are carried at amortized cost.
3.5 Fair value measurement Fair value is the price that would be received to sell an asset or paid to transfer a liability in an orderly transaction between market participants at the measurement date. A fair value measurement is based on the presumption that the transaction to sell the asset or transfer the liability takes place either in the principal market for the asset or liability, or in the absence of a principal market, in the most advantageous market. A three-level fair value hierarchy is used to determine fair value under which financial instruments are categorized based on the priority of the inputs to the valuation technique. The fair value hierarchy has the following levels: Level 1: Quoted prices (unadjusted) in active markets for identical assets or liabilities that the entity can access at the measurement date; Level 2: Inputs other than quoted prices included within Level 1 that are observable for the asset or liability, either directly (i.e., prices) or indirectly (i.e., derived from prices); and Level 3: Inputs for the asset or liability that are not based on observable market data (unobservable inputs). When the inputs used to measure the fair value of an asset or liability fall within different levels of the hierarchy, the level within which the fair value measurement is categorized is based on the lowest-level input that is significant to the fair value measurement of the instrument in its entirety. Thus, a Level 3 fair value measurement may include inputs that are both observable and unobservable. For the Administered Accounts’ short-term financial assets and liabilities, the carrying value at April 30, 2017, and 2016, approximates the fair value. The carrying value of borrowings accounted for at amortized cost represents a reasonable estimate of their fair value.
3.6 Contributions Bilateral contributions are recognized as income after the achievement of specified conditions and are subject to the bilateral agreements stipulating how the resources are to be used.
3.7 Operating expenses Operating expenses consist of reimbursements to the IMF for program and administrative costs incurred on behalf of technical assistance activities for select accounts, as agreed between the IMF and contributing members to the Administered Accounts.
3.8 Foreign currency translation Transactions in currencies other than the reporting currency are recorded at the rate of exchange on the date of the transaction. Exchange differences arising from the settlement of transactions at rates different from those on the date of the transactions are included in the determination of total comprehensive income.

Administered Accounts Notes to the financial statements
for the financial years ended April 30, 2017, and 2016
84
3.9 Administrative expenses The expenses of conducting the activities of the Administered Accounts are paid by the IMF and partial reimbursements are made by selected accounts. For Framework—SFA Account reimbursements of US$10.7 million and US$9.9 million are included in operating expenses in the statements of comprehensive income and changes in resources during the financial years ended April 30, 2017, and 2016, respectively.
4. Financial risk management In administering contributed resources and funding financial and technical services, the Administered Accounts have minimal exposure to credit, liquidity, and market risks.
4.1 Credit risk Credit risk on investment activities represents the potential loss that the Administered Accounts may incur if obligors and counterparties default on their contractual obligations. Credit risk is minimized by holding resources at the Bank for International Settlements (BIS), an international financial institution that provides financial services to central banks and other international financial institutions.
4.2 Liquidity risk Liquidity risk is the risk of non-availability of resources to meet financing needs and obligations. Liquidity risk is monitored to ensure that upcoming payments or transfers can be met from the Administered Accounts’ cash and highly liquid investments. For the People’s Bank of China account, the principal resources are invested and the investment proceeds are held in currencies to ensure that the account has sufficient liquidity to transfer up to US$2 million annually to the Framework—SFA account. The maturity of the investments matches the repayment of the principal to the People’s Bank of China due in July 2017.
4.3 Market risk Market risk is the risk that the fair value or future cash flows of financial instruments will fluctuate because of changes in market prices. Market risk includes interest rate risk, exchange rate risk, and other price risks.
4.3.1 Interest rate risk Interest rate risk is the risk that future cash flows will fluctuate because of changes in market interest rates. The People’s Bank of China account invests in the BIS medium-term investments (MTIs), and the intent is to hold them until maturity. Prior to maturities of the MTIs, their carrying value fluctuates. A 10 basis point increase and a 10 basis point decrease in the average effective yields at April 30, 2017, would result in a loss and gain, respectively, of SDR 0.06 million or approximately 0.04 percent of the portfolio (SDR 0.2 million or approximately 0.1 percent at April 30, 2016).
4.3.2 Exchange rate risk Exchange rate risk is the risk that the entity’s financial position and cash flows will be affected by fluctuations in prevailing foreign currency exchange rates. Exchange rate risk is managed, to the extent possible, by holding all financial assets and liabilities in the reporting currency designated for each of the accounts or, in the case of accounts whose unit of account is the SDR, in the constituent currencies included in the SDR valuation basket. The exchange rate risk on investments held by the People’s Bank of China account is managed by investing in MTIs and FTDs denominated in the constituent currencies included in the SDR’s valuation basket with the relative amount of each currency matching its weight in the SDR basket. In addition, the cash holdings are adjusted as needed in order to offset the effect of exchange rate movements against the SDR. The value of the SDR is the sum of the market values, in U.S. dollar equivalents, of the predetermined amounts of the currencies in the SDR valuation basket (see Note 2). The effective share of each currency in the valuation of the SDR fluctuates daily and depends on the prevailing exchange rate at noon in the London market against the U.S. dollar on that day. The effect on the investment portfolio of a 5 percent increase or decrease in the market exchange rates of each of the currencies included in the SDR valuation basket against the SDR, for the People’s Bank of China account, at April 30, 2017, and 2016, was as follows:
5 percent increase in exchange rate
5 percent decrease in exchange rate
2017 2016 2017 2016 (Gain/(loss) in millions of SDRs)
Chinese renminbi (0.9) N/A 1.0 N/A
Euro (2.5) (2.8) 2.8 3.1
Japanese yen (0.6) (0.6) 0.7 0.7
Pound sterling (0.7) (0.9) 0.7 1.0
U.S. dollar (3.5) (3.9) 3.9 4.3
The sensitivity analyses are based on a change in one market exchange rate, while holding other currencies constant, so that the effects of correlation between the market exchange rates of constituent currencies are excluded.
5. Investments Investments in the People’s Bank of China account consisted of MTIs, which are measured at fair value, and fixed-term deposits, which are measured at amortized cost and approximate fair value. The investments of the People’s Bank of China account consisted of the following, at April 30, 2017, and 2016:
2017 2016
(In thousands of SDRs)
Fixed-term deposits 18,346 —
Fixed-income securities 150,070 168,369
Total 168,416 168,369

Administered Accounts Notes to the financial statements
for the financial years ended April 30, 2017, and 2016
85
The fixed-term deposits and fixed-income securities mature in financial year 2018. The fair value of MTIs, which are not traded in an active market, is determined on the basis of a compilation of significant observable market information such as recently executed trades in securities of the issuer or comparable issuers and yield curves. The investments are categorized as Level 2 based on the fair value hierarchy. Investment income for the Administered Accounts consisted of interest income only, except for the People’s Bank of China account, whose investment income comprised the following for the financial years ending April 30, 2017, and 2016:
2017 2016
(In millions of SDRs)
Interest income 0.9 0.8
Net realized (losses)/gains (0.6) 0.3
Net unrealized gains/(losses) 0.9 (0.5)
Total 1.2 0.6
6. Borrowings The People’s Bank of China account was funded by a SDR 170 million loan from the People’s Bank of China on July 2, 2012. The loan is to be repaid in one installment within 90 days following the fifth anniversary date of the deposit. The interest on the loan is one-tenth of 1 percent per annum, payable annually, but only if the net investment earnings on the corresponding investment exceed that amount per annum.
7. Transfer of resources The Switzerland account transfers amounting to US$100.3 million consist of the settlement of resources contributed by Swiss National Bank and payments made by the National Bank of Ukraine under the bilateral financing agreement. Transfer of resources between other accounts and Trusts administered by the IMF during the financial year ended were as follows:
Transfer from Transfer to 2017 2016
(In millions of SDR)
People’s Bank of China account Framework—SFA 0.5 0.5
Windfall Gold Sales Profits
Poverty Reduction and Growth (PRG) Trust — 0.5
Remaining Windfall Gold Sales Profits PRG Trust 10.4 8.7
Post-EPCA/ENDA India’s SDR account 0.1 —
Post-MDRI-II Catastrophe Containment and Relief Trust 0.2 4.2

Schedule 1
86
Post-SCA-2, SCA-1/Deferred Charges, Windfall Gold Sales Profits, Remaining Windfall Gold Sales Profits,
Post-EPCA/ENDA, and Post-MDRI-II
Balances, contributions, interest earned, and transfers for the financial year ended April 30, 2017
(In thousands of SDRs)
Beginning balance Contributions
Interest earned Transfers
Ending balance Member
Post-SCA-2 Dominican Republic 1,193 — 2 — 1,195
Jordan 1,354 — 3 — 1,357
Trinidad and Tobago 2,910 — 5 — 2,915
Vanuatu 58 — — — 58
Venezuela, República Bolivariana de 35,480 — 66 — 35,546
Total Post-SCA-2 40,995 — 76 — 41,071
SCA-1/Deferred Charges Brazil 34,966 — 65 — 35,031
Total SCA-1/Deferred Charges 34,966 — 65 — 35,031
Windfall Gold Sales Profits Brazil 12,526 — 23 — 12,549
Costa Rica 483 — 1 — 484
Dominican Republic 646 — 1 — 647
Grenada 34 — — — 34
Indonesia 6,128 — 11 — 6,139
Ireland 3,706 — 7 — 3,713
Lebanon 785 — 2 — 787
South Africa 5,507 — 10 — 5,517
Venezuela, República Bolivariana de 7,836 — 15 — 7,851
Total Windfall Gold Sales Profits 37,651 — 70 — 37,721
Remaining Windfall Gold Sales Profits
Brazil 31,292 — 58 — 31,350
Costa Rica 1,209 — 2 — 1,211
Dominican Republic 1,612 — 2 — 1,614
Equatorial Guinea, Republic of 385 — 1 — 386
Ghana 2,716 — 6 — 2,722
Indonesia 15,308 — 28 — 15,336
Ireland 9,259 — 17 — 9,276
Lebanon 1,961 — 4 — 1,965
Papua New Guinea 968 — 2 — 970
Singapore 10,365 — 10 (10,375) —
South Africa 13,756 — 25 — 13,781
Total Remaining Windfall Gold Sales Profits 88,831 — 155 (10,375) 78,611
Post-EPCA/ENDA India 85 — — (85) —
Total Post-EPCA/ENDA 85 — — (85) —
Post-MDRI-II Singapore 225 — — (225) —
Total Post-MDRI-II 225 — — (225) —

Schedule 2
Japan, Framework—TA, and Framework—SFA
Cumulative contributions and disbursements at April 30, 2017, and 2016
87
2017 2016
Account Cumulative
contributions1 Cumulative
disbursements2Cumulative
contributions1 Cumulative
disbursements2
(In millions of U.S. dollars)
Japan 135.2 82.4 135.2 82.4
Framework—TA3 203.9 209.3 204.2 209.3 Africa Regional Technical Assistance Centers Subaccount 37.4 38.2 37.4 38.2 Australia Technical Assistance Subaccount 5.2 5.4 5.2 5.4 Australia—IMF Scholarship Program for Asia Subaccount 5.5 5.6 5.5 5.6 Belgium Technical Assistance Subaccount 4.4 4.4 4.4 4.4 Canadian Technical Assistance Subaccount 8.6 8.7 8.6 8.7 Central Africa Regional Technical Assistance Center Subaccount 15.3 15.5 15.3 15.5 China Technical Assistance Subaccount 0.4 0.4 0.4 0.4 Denmark Technical Assistance Subaccount 6.3 6.7 6.3 6.7 European Commission Technical Assistance Subaccount for METAC 1.1 1.2 1.1 1.2 European Investment Bank Technical Assistance Subaccount 1.2 1.2 1.2 1.2 FIRST Technical Assistance Subaccount 8.4 8.5 8.4 8.5 French Technical Assistance Subaccount 1.2 0.7 1.2 0.7 Islamic Development Bank Technical Assistance Subaccount 0.5 0.5 0.5 0.5 Italy Technical Assistance Subaccount 3.6 4.0 3.6 4.0 Japan Advanced Scholarship Program Subaccount 19.3 20.0 19.3 20.0 Middle East Regional Technical Assistance Center Subaccount 11.0 11.1 11.1 11.1 Pacific Financial Technical Assistance Centre Subaccount 13.1 13.2 13.1 13.2
Rwanda—Macroeconomic Management Capacity Subaccount 1.5 1.6 1.5 1.6
Spain Technical Assistance Subaccount 0.8 1.0 0.8 1.0 Sweden Technical Assistance Subaccount 1.5 1.6 1.5 1.6 Switzerland Technical Assistance Subaccount 17.8 18.9 17.8 18.9 Technical Assistance Subaccount for Iraq 5.8 6.2 5.8 6.2 Technical Assistance Subaccount to Support Macroeconomic and
Financial Policy Formulation and Management 3.6 3.6
3.6 3.6
The Netherlands Technical Assistance Subaccount 14.9 15.0 14.9 15.0 The United Kingdom DFID Technical Assistance Subaccount 15.8 16.0 15.8 16.0
Framework—SFA4 1,097.3 868.1 955.9 705.6 Africa Regional Technical Assistance Center South (AFRITAC South)
Subaccount 52.4 49.9
50.1 38.1
Africa Regional Technical Assistance Center West 2 Subaccount 29.0 17.4 28.7 9.9 Africa Training Institute Subaccount for Selected Fund Activities 20.8 13.3 14.8 9.4 African Development Bank Subaccount for Selected Fund Activities 1.5 — — — Anti-Money Laundering and Combating the Financing of Terrorism
(AML/CFT) Subaccount 47.5 39.6
43.8 35.3
Belgium Subaccount for Selected Fund Activities 10.6 8.5 12.3 6.4 Caribbean Regional Technical Assistance Center (CARTAC)
Subaccount 60.5 54.0
51.1 43.7
Central African Regional Technical Assistance Center (AFRITAC Central) Subaccount
32.0 31.0
32.0 24.7
Central America, Panama, and the Dominican Republic Technical Assistance Center (CAPTAC-DR) Subaccount
53.5 45.0
49.7 39.3
Denmark Subaccount for Selected Fund Activities 3.1 2.7 2.5 2.2 East Africa Regional Technical Assistance Center (AFRITAC East)
Subaccount 58.7 56.0
54.3 46.9
European Commission Subaccount for Selected Fund Activities 38.1 34.3 33.6 26.9 European Investment Bank Subaccount for Selected Fund Activities 0.3 — 0.3 — Externally Financed Appointee Subaccount 8.7 5.7 6.7 3.6 Financial Access Survey Subaccount for Selected Fund Activities 2.7 2.0 2.3 1.6 Germany Subaccount for Selected Fund Activities 0.5 0.3 0.5 0.3 Government of Australia Subaccount for Selected Fund Activities 0.9 0.6 0.7 0.5 Government of Canada Subaccount 47.9 31.7 46.3 21.1 IMF-Middle East Center for Economics and Finance Subaccount for
Selected Fund Activities 30.0 29.0
25.6 24.4
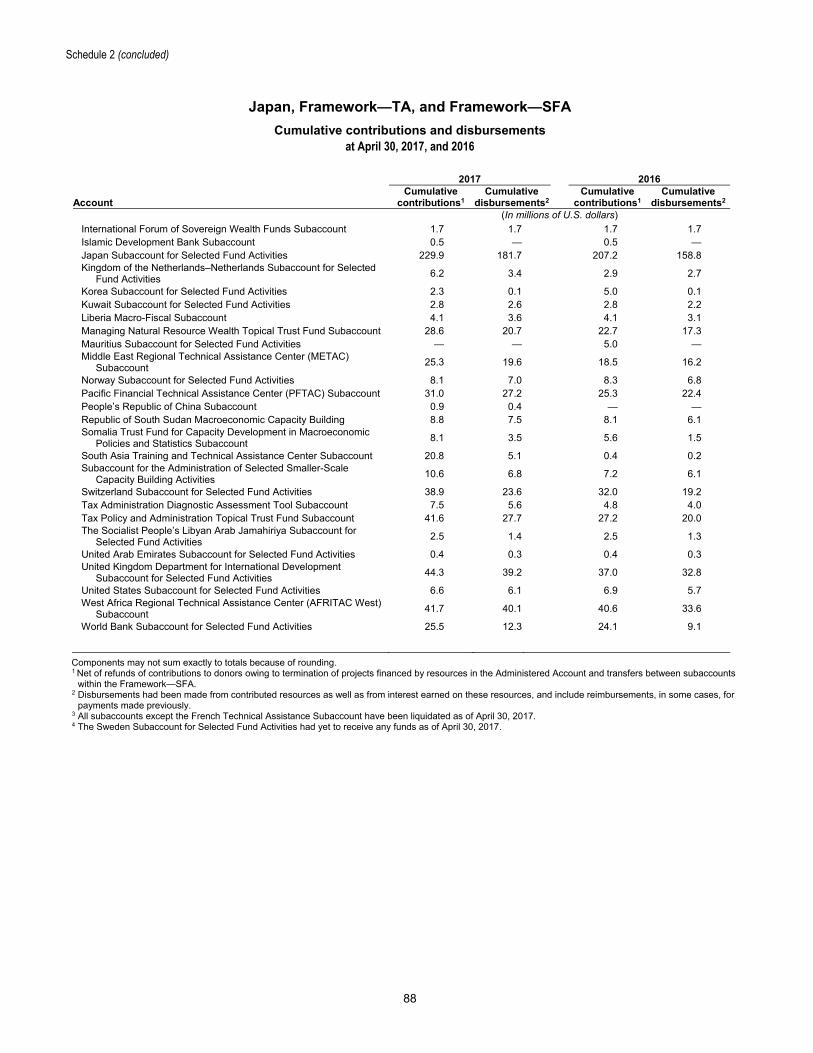
Schedule 2 (concluded)
Japan, Framework—TA, and Framework—SFA
Cumulative contributions and disbursements at April 30, 2017, and 2016
88
2017 2016
Account Cumulative
contributions1 Cumulative
disbursements2Cumulative
contributions1 Cumulative
disbursements2
(In millions of U.S. dollars)
International Forum of Sovereign Wealth Funds Subaccount 1.7 1.7 1.7 1.7 Islamic Development Bank Subaccount 0.5 — 0.5 — Japan Subaccount for Selected Fund Activities 229.9 181.7 207.2 158.8 Kingdom of the Netherlands–Netherlands Subaccount for Selected
Fund Activities 6.2 3.4
2.9 2.7
Korea Subaccount for Selected Fund Activities 2.3 0.1 5.0 0.1 Kuwait Subaccount for Selected Fund Activities 2.8 2.6 2.8 2.2 Liberia Macro-Fiscal Subaccount 4.1 3.6 4.1 3.1 Managing Natural Resource Wealth Topical Trust Fund Subaccount 28.6 20.7 22.7 17.3 Mauritius Subaccount for Selected Fund Activities — — 5.0 — Middle East Regional Technical Assistance Center (METAC)
Subaccount 25.3 19.6
18.5 16.2
Norway Subaccount for Selected Fund Activities 8.1 7.0 8.3 6.8 Pacific Financial Technical Assistance Center (PFTAC) Subaccount 31.0 27.2 25.3 22.4 People’s Republic of China Subaccount 0.9 0.4 — — Republic of South Sudan Macroeconomic Capacity Building 8.8 7.5 8.1 6.1 Somalia Trust Fund for Capacity Development in Macroeconomic
Policies and Statistics Subaccount 8.1 3.5
5.6 1.5
South Asia Training and Technical Assistance Center Subaccount 20.8 5.1 0.4 0.2 Subaccount for the Administration of Selected Smaller-Scale
Capacity Building Activities 10.6 6.8
7.2 6.1
Switzerland Subaccount for Selected Fund Activities 38.9 23.6 32.0 19.2 Tax Administration Diagnostic Assessment Tool Subaccount 7.5 5.6 4.8 4.0 Tax Policy and Administration Topical Trust Fund Subaccount 41.6 27.7 27.2 20.0 The Socialist People’s Libyan Arab Jamahiriya Subaccount for
Selected Fund Activities 2.5 1.4
2.5 1.3
United Arab Emirates Subaccount for Selected Fund Activities 0.4 0.3 0.4 0.3 United Kingdom Department for International Development
Subaccount for Selected Fund Activities 44.3 39.2
37.0 32.8
United States Subaccount for Selected Fund Activities 6.6 6.1 6.9 5.7 West Africa Regional Technical Assistance Center (AFRITAC West)
Subaccount 41.7 40.1
40.6 33.6
World Bank Subaccount for Selected Fund Activities 25.5 12.3 24.1 9.1
Components may not sum exactly to totals because of rounding. 1 Net of refunds of contributions to donors owing to termination of projects financed by resources in the Administered Account and transfers between subaccounts
within the Framework—SFA. 2 Disbursements had been made from contributed resources as well as from interest earned on these resources, and include reimbursements, in some cases, for
payments made previously. 3 All subaccounts except the French Technical Assistance Subaccount have been liquidated as of April 30, 2017. 4 The Sweden Subaccount for Selected Fund Activities had yet to receive any funds as of April 30, 2017.