financial statements independent auditor’s report to the … · 2019-10-10 · financial...
TRANSCRIPT

Financial Statements Independent auditor’s report to the members of Kier Group plc
Kier Group plc | Report and Accounts 2019 101
Report on the audit of the financial statements Opinion In our opinion: › Kier Group plc’s Group financial statements and Company
financial statements (the “financial statements”) give a true and fair view of the state of the Group’s and of the Company’s affairs as at 30 June 2019 and of the Group’s loss and cash flows for the year then ended;
› the Group financial statements have been properly prepared in accordance with International Financial Reporting Standards (IFRSs) as adopted by the European Union;
› the Company financial statements have been properly prepared in accordance with United Kingdom Generally Accepted Accounting Practice (United Kingdom Accounting Standards, comprising FRS 101 “Reduced Disclosure Framework”, and applicable law); and
› the financial statements have been prepared in accordance with the requirements of the Companies Act 2006 and, as regards the Group financial statements, Article 4 of the IAS Regulation
We have audited the financial statements, included within the Annual Report and Accounts 2019 (the “Annual Report”), which comprise: the Consolidated and Company balance sheets as at 30 June 2019; the Consolidated income statement and Consolidated statement of comprehensive income, the Consolidated and Company statements of changes in equity, and the Consolidated cash flow statement for the year then ended; and the notes to the financial statements, which include a description of the significant accounting policies.
Our opinion is consistent with our reporting to the Risk Management and Audit Committee.
Basis for opinion We conducted our audit in accordance with International Standards on Auditing (UK) (“ISAs (UK)”) and applicable law. Our responsibilities under ISAs (UK) are further described in the Auditors’ responsibilities for the audit of the financial statements section of our report. We believe that the audit evidence we have obtained is sufficient and appropriate to provide a basis for our opinion.
Independence We remained independent of the Group in accordance with the ethical requirements that are relevant to our audit of the financial statements in the UK, which includes the FRC’s Ethical Standard, as applicable to listed public interest entities, and we have fulfilled our other ethical responsibilities in accordance with these requirements.
To the best of our knowledge and belief, we declare that non-audit services prohibited by the FRC’s Ethical Standard were not provided to the Group or the Company.
Other than those disclosed in the Risk Management and Audit Committee report and note 4 within the financial statements, we have provided no non-audit services to the Group or the Company in the period from 1 July 2018 to 30 June 2019.
Our audit approach Overview
› Overall Group materiality: £6.2 million (2018: £6.8 million), based on 5% of the Group’s profit from operations, before exceptional items and amortisation of acquired intangibles, of £124.1 million.
› Overall Company materiality: £4.9 million (2018: £4.9 million), based on the lower of component materiality and 1% of total assets.
› We have conducted audit work across all three of the Group’s divisions and achieved coverage over 94% (2018: 90%) of Group revenues.
› Going concern (Group).
› Presentation of the Group’s financial performance (Group).
› Contract accounting (Group).
› Impairment of goodwill and other intangibles (Group).
› IFRS 15 transition adjustments (Group).
› Carrying value of land and development inventory (Group).
› Carrying value of investment in Kier Limited (Company).
MATERIALITY
AUDIT SCOPE
KEY AUDITMATTERS
Kier Group plc | Report and Accounts 2019 101
STRATEGIC REPORT GOVERNANCE FINANCIAL STATEMENTS

Financial Statements Independent auditor’s report to the members of Kier Group plc / continued
102 Kier Group plc | Report and Accounts 2019
The scope of our audit As part of designing our audit, we determined materiality and assessed the risks of material misstatement in the financial statements. In particular, we looked at where the Directors made subjective judgements, for example in respect of significant accounting estimates that involved making assumptions and considering future events that are inherently uncertain.
Capability of the audit in detecting irregularities, including fraud Based on our understanding of the Group and industry, we identified that the principal risks of non-compliance with laws and regulations related to acts by the Group which were contrary to applicable laws and regulations, including fraud. We considered those laws and regulations that have a direct impact on the preparation of the financial statements, including, but not limited to the Companies Act 2006, the Listing Rules, UK pensions and tax legislation, the Health and Safety Executive legislation and equivalent local laws and regulations applicable to overseas operations. We evaluated management’s incentives and opportunities for fraudulent manipulation of the financial statements (including the risk of override of controls), and determined that the principal risks were related to fraudulent financial reporting. Audit procedures performed by the Group engagement team and/or component auditors included, but were not limited to, discussion of compliance with internal legal counsel, review of correspondence with external legal advisors, review of external press releases and inquiries of management. We also addressed the risk of management override of internal controls, including testing of journals and evaluating whether there was evidence of bias by the Directors that represented a risk of material misstatement due to fraud.
There are inherent limitations in the audit procedures described above and the further removed non-compliance with laws and regulations is from the events and transactions reflected in the financial statements, the less likely we would become aware of it. Also, the risk of not detecting a material misstatement due to fraud is higher than the risk of not detecting one resulting from error, as fraud may involve deliberate concealment by, for example, forgery or intentional misrepresentations, or through collusion.
Key audit matters Key audit matters are those matters that, in the auditors’ professional judgement, were of most significance in the audit of the financial statements of the current period and include the most significant assessed risks of material misstatement (whether or not due to fraud) identified by the auditors, including those which had the greatest effect on: the overall audit strategy; the allocation of resources in the audit; and directing the efforts of the engagement team. These matters, and any comments we make on the results of our procedures thereon, were addressed in the context of our audit of the financial statements as a whole, and in forming our opinion thereon, and we do not provide a separate opinion on these matters. This is not a complete list of all risks identified by our audit.
Kier Group plc | Report and Accounts 2019102

Kier Group plc | Report and Accounts 2019 103
Key audit matter How our audit addressed the key audit matter
Group Going concern Refer to page 67 (Risk Management and Audit Committee Report) and page 117 (accounting policy).
The Group’s forecast cash flows for the period to 31 December 2020, included within the Group’s three-year strategic plan, contain assumptions over the revenue, profitability and cash generation of existing businesses. These forecasts have been stress-tested for severe but plausible scenarios that could impact the Group, including the possible impact of Brexit.
The Group’s £922 million of committed facilities are subject to covenant testing at 31 December 2019, 30 June 2020 and 31 December 2020.
We considered the risk of going concern to have significantly increased this year in the context of the deterioration in the Group’s results over this financial year (including an increase in average net debt) and current market sentiment.
We evaluated the Directors’ going concern assessment and in particular, with the support of internal industry experts in this area, performed the following procedures:
› We assessed the appropriateness of the cash flow forecasts in the context of the Group’s 2019 financial position, the planned sales of, and/or exit from, a number of non-core businesses and evaluated the Directors’ downside sensitivities against these forecasts;
› We evaluated the key assumptions in the forecasts and considered whether these appeared reasonable, for example by comparing forecast sales growth to levels of future revenue that has been secured;
› We obtained and evaluated the Directors’ Brexit impact assessment and considered whether this was appropriately reflected in the going concern model;
› We examined the minimum committed facility headroom under the base case cash flow forecasts and sensitised cases and evaluated whether the Directors’ conclusion that liquidity headroom remained in all events was reasonable;
› We obtained and reperformed the Group’s June 2019 and forecast covenant compliance calculations, including sensitising the profits and cash flows as applicable for each covenant to assess the potential impact of downside sensitivities on covenant compliance;
› We considered the impact of the Group’s financial performance, and specifically its presentation of profit before exceptional items and amortisation of acquired intangibles, on its covenant calculations;
› We considered the risk to the Group’s cash flows and covenant compliance in the event that the planned sales and exits of certain businesses either did not take place or were significantly delayed; and
› We evaluated the extent to which the cost savings articulated in the Directors’ forecasts were based on controllable activities, or whether they simply represented possible future upside, including inspecting plans prepared by the Group’s advisors in respect of its restructuring programme.
We also reviewed the disclosures provided relating to the going concern basis of preparation, and found that these provided an explanation of the Directors’ assessment that was consistent with the evidence we obtained.
Our conclusions on going concern are set out in the “Going concern” section below.
Kier Group plc | Report and Accounts 2019 103
STRATEGIC REPORT GOVERNANCE FINANCIAL STATEMENTS

Financial Statements Independent auditor’s report to the members of Kier Group plc / continued
104 Kier Group plc | Report and Accounts 2019
Key audit matter How our audit addressed the key audit matter
Group Contract accounting Refer to page 70 (Risk Management and Audit Committee Report) and page 119 (accounting policy).
The Group has significant long-term contracts in its Infrastructure Services and Buildings businesses.
The recognition of revenue in respect of construction contracts in accordance with IFRS 15 is now based on the stage of completion of contract activity. The Group’s accounting policy is also now to recognise claims receivable from third parties other than its customers once they are determined to be ‘virtually certain’ of recoverability.
Profit on contracts is a significant risk for our audit because of the uncertainty inherent in preparing suitable estimates of the forecast costs and revenue on contracts. An error in the contract forecast could result in a material variance in the amount of profit or loss recognised to date and therefore also in the current period.
The Group operates in an industry in which contracts allow a route to recovery that may be disputed or become subject to contract resolution procedures. The settlement process can be time-consuming and can result in an outcome that varies from the amount claimed. These contract issues may exist in the supply chain, or with customers.
In addition, recoverability of work in progress on long-term services contracts involves significant estimates, including an assessment of the end of life outcome of the projects.
These estimates include the expected recovery of costs arising from the following: variations to the contract requested by the customer, compensation events, and claims made both by and against the Group for delays or other additional costs arising or projected to arise.
The inclusion of these estimated amounts in the contract forecast at an inappropriate level could result in a material error in the level of profit or loss recognised by the Group.
We focused our work on those contracts with the greatest estimation uncertainty over the final contract values and therefore profit outcome. These in particular included the forecast end of life positions on a number of projects which have experienced significant change and therefore cost growth. Our work included the following procedures:
› We challenged management’s forecasts, in particular the key assumptions, which included the expected recovery of variations, claims and compensation events from clients, to determine the basis on which the associated revenue was considered to be ‘highly probable of not reversing’;
› We also challenged those assumptions in respect of estimated recoveries from subcontractors, designers, and insurers included in the forecast, to determine whether these could be considered ‘virtually certain’ of recoverability;
› We attended contract review meetings, and inspected value cost reconciliations (‘VCRs’) to obtain evidence regarding the controls in place;
› We substantively tested costs incurred to date to check that these had been recorded accurately;
› We performed a margin analysis on the end of life forecasts (‘ELFs’) to assess the performance of the contract portfolios year on year;
› We inspected correspondence and meeting minutes with customers concerning variations, claims and compensation events, and obtained third-party assessments of these from legal or technical experts contracted by the Group, if applicable, to assess whether this information was consistent with the estimates made;
› We discussed the status of certain claims with external solicitors and, where relevant, external experts, and assessed the objectivity and independence of these third parties;
› We inspected correspondence with insurers relating to recognised insurance claims as well as assessments of these undertaken by the insurers and Group’s legal experts, where applicable, to assess whether this information supported the position taken on the contract; and
› We considered the adequacy of the disclosures in the financial statements in relation to specific contracts and also the disclosures in respect of significant judgements and estimates.
Overall based on these procedures, we are satisfied that the work in progress relating to the Group’s contracts is appropriately stated and that revenue and profits have been recorded appropriately.
Kier Group plc | Report and Accounts 2019104

Kier Group plc | Report and Accounts 2019 105
Key audit matter How our audit addressed the key audit matter
Group Presentation of the Group’s financial performance Refer to page 70 (Risk Management and Audit Committee Report) and page 121 (accounting policy).
The Group has updated the Group’s Alternative Performance Measure to ‘Profit before exceptional items and amortisation of acquired intangible assets’ to improve the transparency and clarity of the Group’s financial performance.
The Group’s profit before tax before exceptional items and amortisation of acquired intangibles of £97.6 million is stated before charging £24.8 million of amortisation of acquired intangibles, and charging £317.7 million of exceptional items as follows:
› £29.3 million of costs associated with previous acquisitions;
› £56.4 million of restructuring charges;
› £171.7 million of costs associated with the preparation for business divestment or sale;
› £49.9 million of exceptional contract losses;
› £10.4 million of other exceptional charges including a net £10.0 million credit in respect of one-off pension remeasurements, and a £16.1 million charge in respect of procurement write-offs.
The change in presentation has also resulted in £27.0 million of contract losses reported within the Group’s underlying profit before tax in 2018 now being classified as exceptional, and the results of the Group’s Mining business, previously presented as non-underlying, are now reported within the Group’s headline profit before tax.
The determination of which items are classified as exceptional is subject to judgement and therefore users of the consolidated financial statements could be misled if amounts are not classified and disclosed in a transparent manner and consistently with the Group’s accounting policy.
We considered whether the presentation of profit before exceptional items and amortisation of intangibles is appropriate. In doing this weperformed the following procedures:
› We reviewed the Directors’ definition and classification of exceptional items, including the sub-categorisation of these items. In particular, we challenged whether it was appropriate to present a contract loss as exceptional, on the basis that significant losses may occur from time to time in contracting businesses. We accepted this judgement on the basis of the size of the losses in respect of two specific contracts - Broadmoor (in 2019) and Mersey (in 2018 and therefore in 2019 for consistency) and the unusual nature of these contracts entered into by the respective businesses;
› We audited the accuracy and completeness of exceptional items, including assessing the impact on amounts previously reported within underlying profits and the resulting adjustments to the 2018 Mersey contract loss of £27.0 million and the result of the Mining business. We found that these adjustments were appropriate and consistent with the Group’s policy on exceptional items; and
› We reviewed management's disclosures on the change in the primary measure for adjusted profit and ensured that the updated measure was not given undue prominence in the Annual Report. We also ensured that sufficient disclosure was provided to justify why individual items were treated as exceptional.
We did not identify any material issues in our work over those items presented as exceptional, although we identified a small number of individually immaterial items that were subsequently reclassified outside of exceptional.
Overall based on these procedures we were satisfied with the presentation of the Group’s profit before exceptional items and amortisation of acquired intangibles, and that the reason for its use has been properly disclosed.
Kier Group plc | Report and Accounts 2019 105
STRATEGIC REPORT GOVERNANCE FINANCIAL STATEMENTS

Financial Statements Independent auditor’s report to the members of Kier Group plc / continued
106 Kier Group plc | Report and Accounts 2019
Key audit matter How our audit addressed the key audit matter
Group Impairment of goodwill and other intangibles Refer to page 71 (Risk Management and Audit Committee Report) and page 121 (accounting policy).
The Group carried £536.7 million of goodwill and £230.0 million of other intangibles at 30 June 2019 (2018: £560.2 million of goodwill and £302.0 million of other intangibles), following impairment charges of £37.7 million recorded against Developments and Housing that included fully writing off the £8.0 million of goodwill allocated to that cash generating unit (‘CGU’).
£516.3 million of the Group’s £536.7 million goodwill relates to Infrastructure Services and £20.4m relates to Buildings.
The other intangibles includes £81.6 million (after impairment charges of £29.5 million) of software assets, largely associated with the Group’s recently implemented ERP, which have been allocated across the Group’s CGUs.
The audit of goodwill and other intangibles was a focus area given the value of these assets when compared to a market capitalisation of under £250 million, the publically announced reduction in volumes in the Group’s core businesses and deterioration in micro and macro trading conditions during the financial year. Furthermore, we considered specific risks associated with the goodwill and other intangible assets allocated to Developments and Housing in light of the Group’s announcement of its plans to sell Kier Living and reduce its investment in (or sell) Kier Property.
We considered the risk that the carrying value of goodwill and other intangible assets allocated to Infrastructure Services and Developments and Housing may not be supportable when compared to their respective recoverable amounts.
In evaluating the Directors’ annual impairment assessment for goodwill and other intangibles, we performed the following procedures:
› We assessed the allocation of goodwill and acquired intangibles to CGUs, following the change in year reflecting the reorganisation of the Group from 1 July 2018, and supported the Directors’ conclusion that the significant majority relates to Infrastructure Services;
› We evaluated the allocation of the ERP asset to the CGUs based on the relative headcount of each business and concluded this was a reasonable basis for allocation;
› We obtained the Board-approved three year cash flow forecasts which formed the basis of the model used in the Directors’ impairment calculation. We considered whether the planned growth rates and expected operating margins in the impairment model were consistent with the Board-approved cash flows;
› We tested the discount rate applied with the support of our internal valuation experts;
› We challenged management's forecasts and compared future cash flow performance to historic levels to ensure that the planned performance was considered achievable;
› In respect of Infrastructure Services we sensitised the short term and long term growth rates applied to revenue and operating profit and established what reasonably possible changes in these assumptions would lead to an impairment; we then ensured that these changes were appropriately disclosed in accordance with IAS 36; and
› We reperformed the calculations in the impairment model for Developments and Housing to check that the impairments recorded against goodwill and other intangibles were reasonable, and concluded that these charges were recognised appropriately.
Based on the procedures performed, we were satisfied with the carrying value of goodwill and other intangibles following the impairments recorded against Developments and Housing, and with the associated disclosures included in the financial statements.
Kier Group plc | Report and Accounts 2019106

Kier Group plc | Report and Accounts 2019 107
Key audit matter How our audit addressed the key audit matter
Group IFRS 15 transition adjustments Refer to page 71 (Risk Management and Audit Committee Report) and page 118 (accounting policy).
IFRS 15 “Revenue from Contracts with Customers” became effective for the Group for the first time during this financial year.
In applying this standard to the Group’s financial statements for the first time, the Directors identified three material areas of transition within a total pre-tax adjustment to opening retained earnings of £73.0 million:
i) £28.0 million – moving to a percentage of cost completed revenue recognition basis rather than recognising revenue based on external certification;
ii) £26.0 million – derecognising certain downstream claims on the basis that such claims are outside the scope of IFRS 15 (which only addresses revenue from the customer), resulting in the Groupnow assessing recoverability of such claims under IAS 37 instead of IAS 11 (i.e. they must be 'virtually certain' of recovery); and
iii) £9.7 million – derecognising certain variable revenue items which did not meet the IFRS 15 criteria of ‘highly probable of not reversing’but had satisfied the recognition criteria of IAS 11 previously.
The basis for recording these transition adjustments involved significant judgements to be made, particularly in determining whether an asset that was determined to be recoverable under IAS 11 would, following the adoption of IFRS 15, not be considered recoverable.
The unwind of these adjustments in the 2019 financial statements resulted in a £24.8 million beneficial impact to the Group’s profit before tax.
We considered the risk that items may be treated as transition adjustments which did not meet the criteria noted above.
We assessed management's transition exercise and evaluated the existence, valuation and completeness of adjustments identified. In particular, we performed the following procedures:
› We challenged the extent to which customer contract variations that were previously deemed to meet the IAS 11 recognition criteria could not be characterised as 'highly probable of not reversing' under IFRS 15. We were satisfied that for certain contracts this was reasonable;
› We considered the recognition policy for downstream claims not captured under IFRS 15 and therefore now assessed under IAS 37, and evaluated management's judgement in derecognising these claims on transition to the new standard given that these now needed to be 'virtually certain' of recoverability, as compared to the previous requirements under IAS 11;
› We checked the mathematical accuracy of the calculation to derecognise certain contract receivables by moving to a percentage of cost completed basis of accounting, and agreed the transition adjustment to work performed on contracts at 30 June 2018;
› We ensured that the principles established on adoption of IFRS 15 were applied consistently in the 2019 financial year; and
› We ensured that the disclosures addressing the requirements of IFRS 15 and its impact on the 2019 financial statements have been properly included. We also considered these disclosures in the context of the Group’s covenants, which are measured on a constant GAAP basis.
We obtained sufficient evidence to satisfy ourselves that the Directors have assessed and disclosed the impact of adopting IFRS 15 in the financial statements.
Kier Group plc | Report and Accounts 2019 107
STRATEGIC REPORT GOVERNANCE FINANCIAL STATEMENTS

Financial Statements Independent auditor’s report to the members of Kier Group plc / continued
108 Kier Group plc | Report and Accounts 2019
Key audit matter How our audit addressed the key audit matter
Group Carrying value of land and development inventory Refer to page 71 (Risk Management and Audit Committee report), page 122 (accounting policy).
Inventory in the Developments and Housing division is stated at the lower of cost and net realisable value (i.e. the forecast selling price less the remaining costs to build and sell).
An assessment of the net realisable value of inventory is carried out at each balance sheet date and is dependent upon management’s estimate of forecast selling prices and build / development costs (by reference to current prices), which may require significant judgement.
In particular, we focused our work on ten residential sites previously held at a carrying value of £60.2 million, for which there had previously been no immediate intention of development. The carrying value was previously supportable by the value in use that would be achieved once the sites were developed at a future point in time.
Following the Group’s announcement in June 2019 of its intention to sell its Residential business, the Directors determined that these sites would be sold rather than held for future development.
The recoverable amount of the sites, determined by their respective fair values less costs to sell, was calculated to be £10.2 million, resulting in an impairment charge of £50.0 million. This has been recorded in the Group’s Income Statement as an exceptional charge.
We obtained the Directors’ assessment of the valuation of the ten sites, and performed the following procedures:
› We compared the valuations in the Directors’ assessment to external valuations of each site, and evaluated the independence and competence of the external valuers;
› We assessed the methodology and key assumptions in these valuations with the support of our internal real estate valuation experts, and considered the independence and competence of those experts; and
› We considered whether the Directors’ estimate of forecast selling costs associated with the sites appeared reasonable.
Based on the evidence obtained, we were satisfied with the calculation of the impairment charge of £50.0 million.
Company Carrying value of investment in Kier Limited Refer to page 71 (Risk Management and Audit Committee Report) and page 197 (Company notes to the financial statements).
The Company holds investments in subsidiaries of £486.2 million (2018: £479.0 million), the largest of which is an investment in Kier Limited of £400.2 million (2018: £400.2 million).
We focused on this area due to the size of the investment balance in the context of the Group’s recent market capitalisation which remains below £250 million.
The Directors’ assessment of the carrying value of this investment was that no impairment was required.
We reviewed the Directors’ impairment assessment of the carrying value of the investment in Kier Limited.
We agreed the cash flows used in the assessment to the forecasts used in the assessment of impairment of goodwill and other intangible assets.
Following the conclusion of our procedures above, we were satisfied with the Directors’ conclusion that no impairment was required against the carrying value of the investment held by the Company.
How we tailored the audit scope We tailored the scope of our audit to ensure that we performed enough work to be able to give an opinion on the financial statements as a whole, taking into account the structure of the Group and the Company, the accounting processes and controls, and the industry in which they operate.
The Group’s operations and reporting process is structured into three divisions represented by Infrastructure Services, Development and Housing and Buildings. The Group audit partner, supported by other UK engagement leaders, led UK based teams responsible for the audit of each of these divisions. The three divisions include a number of reporting units in the Group’s consolidation, each of which is considered to be a financial component.
The vast majority of the Group’s operations are concentrated in the UK and account for 98% of the Group revenue, with the remaining 2% generated from overseas businesses. We instructed a component team in Dubai to perform full scope audit procedures on the Group’s Middle East construction business. Our audit approach was designed to obtain coverage over 94% of the Group’s revenue which included UK and overseas operations. We are satisfied that we obtained appropriate audit coverage over the Group's Income statement, Balance sheet and cash flows through our audit work on the UK and overseas operations.
During the course of the audit, we have visited a number of projects and operations located across the UK and held meetings with local management. These included a property development site acquired in the year, a residential housebuilding site and six construction contract projects.
Kier Group plc | Report and Accounts 2019108
Kier Group plc | Report and Accounts 2019 109
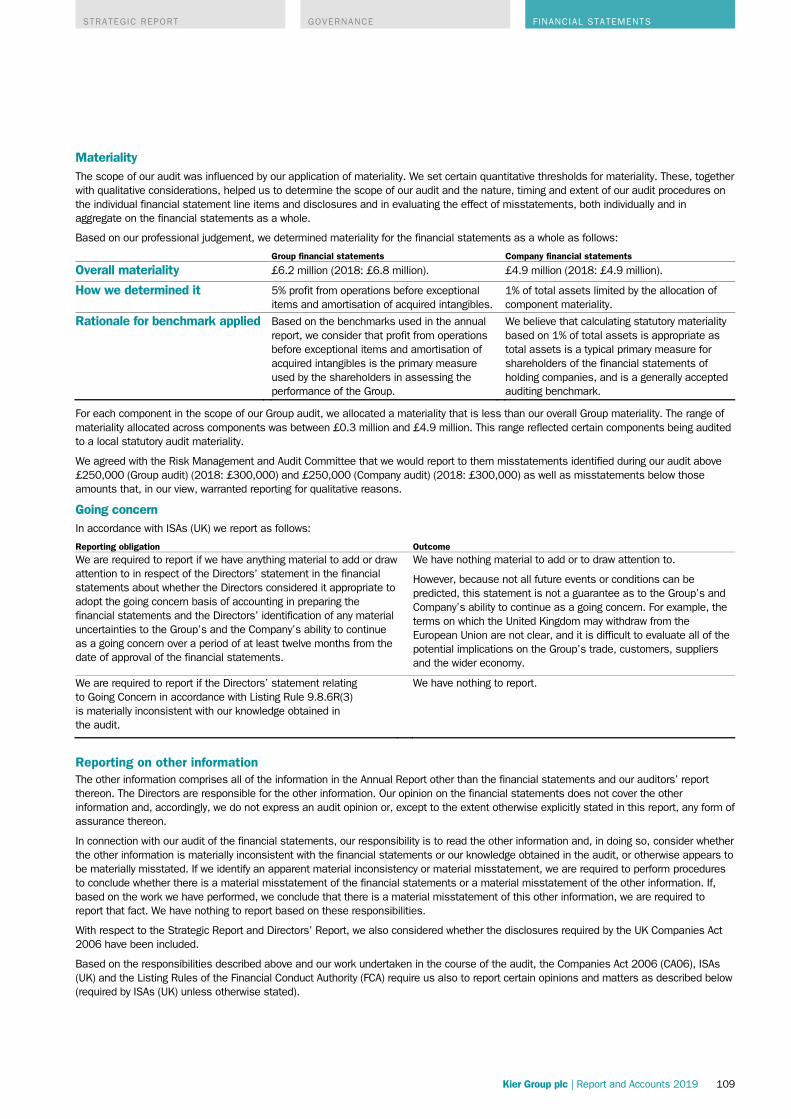
Materiality The scope of our audit was influenced by our application of materiality. We set certain quantitative thresholds for materiality. These, together with qualitative considerations, helped us to determine the scope of our audit and the nature, timing and extent of our audit procedures on the individual financial statement line items and disclosures and in evaluating the effect of misstatements, both individually and in aggregate on the financial statements as a whole.
Based on our professional judgement, we determined materiality for the financial statements as a whole as follows:
Group financial statements Company financial statements
Overall materiality £6.2 million (2018: £6.8 million). £4.9 million (2018: £4.9 million).
How we determined it
5% profit from operations before exceptional items and amortisation of acquired intangibles.
1% of total assets limited by the allocation of component materiality.
Rationale for benchmark applied
Based on the benchmarks used in the annual report, we consider that profit from operations before exceptional items and amortisation of acquired intangibles is the primary measure used by the shareholders in assessing the performance of the Group.
We believe that calculating statutory materiality based on 1% of total assets is appropriate as total assets is a typical primary measure for shareholders of the financial statements of holding companies, and is a generally accepted auditing benchmark.
For each component in the scope of our Group audit, we allocated a materiality that is less than our overall Group materiality. The range of materiality allocated across components was between £0.3 million and £4.9 million. This range reflected certain components being audited to a local statutory audit materiality.
We agreed with the Risk Management and Audit Committee that we would report to them misstatements identified during our audit above £250,000 (Group audit) (2018: £300,000) and £250,000 (Company audit) (2018: £300,000) as well as misstatements below those amounts that, in our view, warranted reporting for qualitative reasons.
Going concern In accordance with ISAs (UK) we report as follows:
Reporting obligation OutcomeWe are required to report if we have anything material to add or draw attention to in respect of the Directors’ statement in the financial statements about whether the Directors considered it appropriate to adopt the going concern basis of accounting in preparing the financial statements and the Directors’ identification of any material uncertainties to the Group’s and the Company’s ability to continue as a going concern over a period of at least twelve months from the date of approval of the financial statements.
We have nothing material to add or to draw attention to.
However, because not all future events or conditions can be predicted, this statement is not a guarantee as to the Group’s and Company’s ability to continue as a going concern. For example, the terms on which the United Kingdom may withdraw from the European Union are not clear, and it is difficult to evaluate all of the potential implications on the Group’s trade, customers, suppliers and the wider economy.
We are required to report if the Directors’ statement relating to Going Concern in accordance with Listing Rule 9.8.6R(3) is materially inconsistent with our knowledge obtained in the audit.
We have nothing to report.
Reporting on other information The other information comprises all of the information in the Annual Report other than the financial statements and our auditors’ report thereon. The Directors are responsible for the other information. Our opinion on the financial statements does not cover the other information and, accordingly, we do not express an audit opinion or, except to the extent otherwise explicitly stated in this report, any form of assurance thereon.
In connection with our audit of the financial statements, our responsibility is to read the other information and, in doing so, consider whether the other information is materially inconsistent with the financial statements or our knowledge obtained in the audit, or otherwise appears to be materially misstated. If we identify an apparent material inconsistency or material misstatement, we are required to perform procedures to conclude whether there is a material misstatement of the financial statements or a material misstatement of the other information. If, based on the work we have performed, we conclude that there is a material misstatement of this other information, we are required to report that fact. We have nothing to report based on these responsibilities.
With respect to the Strategic Report and Directors’ Report, we also considered whether the disclosures required by the UK Companies Act 2006 have been included.
Based on the responsibilities described above and our work undertaken in the course of the audit, the Companies Act 2006 (CA06), ISAs (UK) and the Listing Rules of the Financial Conduct Authority (FCA) require us also to report certain opinions and matters as described below (required by ISAs (UK) unless otherwise stated).
Kier Group plc | Report and Accounts 2019 109
STRATEGIC REPORT GOVERNANCE FINANCIAL STATEMENTS

Financial Statements Independent auditor’s report to the members of Kier Group plc / continued
110 Kier Group plc | Report and Accounts 2019
Strategic Report and Directors’ ReportIn our opinion, based on the work undertaken in the course of the audit, the information given in the Strategic Report and Directors’ Report for the year ended 30 June 2019 is consistent with the financial statements and has been prepared in accordance with applicable legal requirements. (CA06)
In light of the knowledge and understanding of the Group and Company and their environment obtained in the course of the audit, we did not identify any material misstatements in the Strategic Report and Directors’ Report. (CA06)
The Directors’ assessment of the prospects of the Group and of the principal risks that would threaten the solvency or liquidity of the Group We have nothing material to add or draw attention to regarding:
› The Directors’ confirmation on page 62 of the Annual Report that they have carried out a robust assessment of the principal risks facing the Group, including those that would threaten its business model, future performance, solvency or liquidity.
› The disclosures in the Annual Report that describe those risks and explain how they are being managed or mitigated.
› The Directors’ explanation on page 46 of the Annual Report as to how they have assessed the prospects of the Group, over what period they have done so and why they consider that period to be appropriate, and their statement as to whether they have a reasonable expectation that the Group will be able to continue in operation and meet its liabilities as they fall due over the period of their assessment, including any related disclosures drawing attention to any necessary qualifications or assumptions.
We have nothing to report having performed a review of the Directors’ statement that they have carried out a robust assessment of the principal risks facing the Group and statement in relation to the longer-term viability of the Group. Our review was substantially less in scope than an audit and only consisted of making inquiries and considering the Directors’ process supporting their statements; checking that the statements are in alignment with the relevant provisions of the UK Corporate Governance Code (the “Code”); and considering whether the statements are consistent with the knowledge and understanding of the Group and Company and their environment obtained in the course of the audit. (Listing Rules)
Other Code Provisions We have nothing to report in respect of our responsibility to report when:
› The statement given by the Directors, on page 50, that they consider the Annual Report taken as a whole to be fair, balanced and understandable, and provides the information necessary for the members to assess the Group’s and Company’s position and performance, business model and strategy is materially inconsistent with our knowledge of the Group and Company obtained in the course of performing our audit.
› The section of the Annual Report on page 70 describing the work of the Risk Management and Audit Committee does not appropriately address matters communicated by us to the Risk Management and Audit Committee.
› The Directors’ statement relating to the Company’s compliance with the Code does not properly disclose a departure from a relevant provision of the Code specified, under the Listing Rules, for review by the auditors.
Directors’ Remuneration In our opinion, the part of the Directors’ Remuneration Report to be audited has been properly prepared in accordance with the Companies Act 2006. (CA06)
Kier Group plc | Report and Accounts 2019110

Kier Group plc | Report and Accounts 2019 111
Responsibilities for the financial statements and the audit Responsibilities of the Directors for the financial statements As explained more fully in the Directors’ Report set out on page 98, the Directors are responsible for the preparation of the financial statements in accordance with the applicable framework and for being satisfied that they give a true and fair view. The Directors are also responsible for such internal control as they determine is necessary to enable the preparation of financial statements that are free from material misstatement, whether due to fraud or error.
In preparing the financial statements, the Directors are responsible for assessing the Group’s and the Company’s ability to continue as a going concern, disclosing as applicable, matters related to going concern and using the going concern basis of accounting unless the Directors either intend to liquidate the Group or the Company or to cease operations, or have no realistic alternative but to do so.
Auditor’s responsibilities for the audit of the financial statements Our objectives are to obtain reasonable assurance about whether the financial statements as a whole are free from material misstatement, whether due to fraud or error, and to issue an auditor’s report that includes our opinion. Reasonable assurance is a high level of assurance, but is not a guarantee that an audit conducted in accordance with ISAs (UK) will always detect a material misstatement when it exists. Misstatements can arise from fraud or error and are considered material if, individually or in the aggregate, they could reasonably be expected to influence the economic decisions of users taken on the basis of these financial statements.
A further description of our responsibilities for the audit of the financial statements is located on the FRC’s website at: www.frc.org.uk/auditorsresponsibilities. This description forms part of our auditor’s report.
Use of this report This report, including the opinions, has been prepared for and only for the Company’s members as a body in accordance with Chapter 3 of Part 16 of the Companies Act 2006 and for no other purpose. We do not, in giving these opinions, accept or assume responsibility for any other purpose or to any other person to whom this report is shown or into whose hands it may come save where expressly agreed by our prior consent in writing.
Other required reporting Companies Act 2006 exception reporting Under the Companies Act 2006 we are required to report to you if, in our opinion:
› we have not received all the information and explanations we require for our audit; or
› adequate accounting records have not been kept by the Company, or returns adequate for our audit have not been received from branches not visited by us; or
› certain disclosures of Directors’ remuneration specified by law are not made; or
› the Company financial statements and the part of the Directors’ Remuneration Report to be audited are not in agreement with the accounting records and returns.
We have no exceptions to report arising from this responsibility.
Appointment Following the recommendation of the Risk Management and Audit Committee, we were appointed by the Directors on 24 September 2014 to audit the financial statements for the year ended 30 June 2015 and subsequent financial periods. The period of total uninterrupted engagement is 5 years, covering the years ended 30 June 2015 to 30 June 2019.
Andrew Paynter SENIOR STATUTORY AUDITOR
for and on behalf of PricewaterhouseCoopers LLP Chartered Accountants and Statutory Auditors London
26 September 2019
Kier Group plc | Report and Accounts 2019 111
STRATEGIC REPORT GOVERNANCE FINANCIAL STATEMENTS

Financial Statements Consolidated income statement For the year ended 30 June 2019
112 Kier Group plc | Report and Accounts 2019
2019 2018
Notes
Before exceptional
items£m
Exceptional items
(note 5)1
£mTotal
£m
Before exceptional
items3 £m
Exceptional items
(note 5)1,3 £m
Total£m
Continuing operations
Revenue 2
Group and share of joint ventures 3 4,494.4 (15.0) 4,479.4 4,512.8 – 4,512.8
Less share of joint ventures 3 (357.7) – (357.7) (273.2) – (273.2)
Group revenue 4,136.7 (15.0) 4,121.7 4,239.6 – 4,239.6
Cost of sales (3,753.5) (111.2) (3,864.7) (3,810.7) (27.0) (3,837.7)
Gross profit/(loss) 383.2 (126.2) 257.0 428.9 (27.0) 401.9
Administrative expenses (289.8) (214.2) (504.0) (288.1) (25.6) (313.7)
Share of post-tax results of joint ventures 14 30.7 – 30.7 42.7 – 42.7
(Loss)/profit on disposal of joint ventures and subsidiaries 31 – (0.4) (0.4) 3.5 – 3.5
Profit/(loss) from operations 3,4 124.1 (340.8) (216.7) 187.0 (52.6) 134.4
Finance income 6 0.2 – 0.2 0.9 – 0.9
Finance costs 6 (26.7) (1.7) (28.4) (24.0) (5.1) (29.1)
Profit/(loss) before tax 3 97.6 (342.5) (244.9) 163.9 (57.7) 106.2
Taxation 9a (20.2) 55.9 35.7 (28.4) 10.7 (17.7)
Profit/(loss) for the year from continuing operations 77.4 (286.6) (209.2) 135.5 (47.0) 88.5
Discontinued operations
Loss for the year from discontinued operations (attributable to equity holders of the parent) 21b – – – (1.0) – (1.0)
Profit/(loss) for the year 77.4 (286.6) (209.2) 134.5 (47.0) 87.5
Attributable to:
Owners of the parent 77.0 (286.6) (209.6) 134.3 (47.0) 87.3
Non-controlling interests 0.4 – 0.4 0.2 – 0.2
77.4 (286.6) (209.2) 134.5 (47.0) 87.5
Basic earnings/(loss) per share2 – From continuing operations 11 58.2p (216.7)p (158.5)p 136.8p (47.5)p 89.3p– From discontinued operations 11 – – – (1.0)p – (1.0)p
Total 58.2p (216.7)p (158.5)p 135.8p (47.5)p 88.3p
Diluted earnings/(loss) per share – From continuing operations 11 58.2p (216.7)p (158.5)p 135.3p (47.0)p 88.3p– From discontinued operations 11 – – – (1.0)p – (1.0)p
Total 58.2p (216.7)p (158.5)p 134.3p (47.0)p 87.3p
1 Reference to ‘exceptional items’ includes exceptional items of £316.0m (2018: £27.0m) and amortisation of acquired intangible assets of £24.8m (2018: £25.6m), see note 1, page 121, and note 5.
2 Earnings per share for the year to 30 June 2018 restated as a result of the rights issue which completed on 20 December 2018, see note 11 to the financial statements.
3 The prior year comparative information for profit before exceptional items and exceptional items has been re-presented to reflect the change in the Group’s Alternative Performance Measure, see note 5. This has had no impact on the statutory reported results for the year ended 30 June 2018.
Kier Group plc | Report and Accounts 2019112

Consolidated statement of comprehensive income For the year ended 30 June 2019
Kier Group plc | Report and Accounts 2019 113
Notes 2019
£m2018
£m
(Loss)/profit for the year (209.2) 87.5
Items that may be reclassified subsequently to the income statement
Share of joint venture fair value movements on cash flow hedging instruments 14 0.2 0.4
Deferred tax on share of joint venture fair value movements on cash flow hedging instruments 9c – (0.1)
Share of joint venture fair value movements on cash flow hedging instruments recycled to the income statement 14 – 2.3
Deferred tax on share of joint venture fair value movements on cash flow hedging instruments recycled to the income statement 14 – (0.4)
Fair value gain/(loss) on cash flow hedging instruments 8.6 (3.4)
Fair value movements on cash flow hedging instruments recycled to the income statement 6 (4.3) 1.6
Deferred tax (charge)/credit on fair value movements on cash flow hedging instruments 9c (0.7) 0.3
Foreign exchange gains/(losses) on long-term funding of foreign operations 0.9 (0.2)
Foreign exchange translation differences – (0.3)
Foreign exchange movements recycled to the income statement (0.7) (0.9)
Total items that may be reclassified subsequently to the income statement 4.0 (0.7)
Items that will not be reclassified to the income statement
Re-measurement of defined benefit liabilities 8 (22.9) 79.8
Deferred tax credit/(charge) on actuarial (losses)/gains on defined benefit liabilities 9c 3.9 (13.6)
Total items that will not be reclassified to the income statement (19.0) 66.2
Other comprehensive (loss)/income for the year (15.0) 65.5
Total comprehensive (loss)/income for the year (224.2) 153.0
Attributable to:
Equity holders of the parent (224.6) 152.8
Non-controlling interests – continuing operations 0.4 0.2
(224.2) 153.0
Total comprehensive (loss)/income attributable to equity shareholders arises from:
Continuing operations (224.6) 153.8
Discontinued operations – (1.0)
(224.6) 152.8
Kier Group plc | Report and Accounts 2019 113
STRATEGIC REPORT GOVERNANCE FINANCIAL STATEMENTS

Financial Statements Consolidated statement of changes in equity For the year ended 30 June 2019
114 Kier Group plc | Report and Accounts 2019
Notes
Share capital
£m
Share premium
£m
Capital redemption
reserve£m
Retained earnings
£m
Cash flow hedge
reserve £m
Translationreserve
£m
Merger reserve
£m
Equity attributable to
owners of the parent
£m
Non-controlling
interests £m
Total equity
£m
At 1 July 2017 1.0 434.8 2.7 (63.9) (5.7) 4.7 134.8 508.4 3.0 511.4
Profit for the year – – – 87.3 – – – 87.3 0.2 87.5
Other comprehensive income/(loss) – – – 66.2 0.7 (1.4) – 65.5 – 65.5
Dividends paid 10 – – – (66.1) – – – (66.1) (1.5) (67.6)
Issue of own shares 25 – 0.2 – – – – – 0.2 – 0.2
Share-based payments 26 – – – 5.4 – – – 5.4 – 5.4
Purchase of own shares 26 – – – (1.3) – – – (1.3) – (1.3)
At 30 June 2018 1.0 435.0 2.7 27.6 (5.0) 3.3 134.8 599.4 1.7 601.1Impact of adopting IFRS 15 34 – – – (60.8) – 0.2 – (60.6) – (60.6)
At 1 July 2018 1.0 435.0 2.7 (33.2) (5.0) 3.5 134.8 538.8 1.7 540.5(Loss)/profit for the year – – – (209.6) – – – (209.6) 0.4 (209.2)Other comprehensive (loss)/ income – – – (19.0) 3.8 0.2 – (15.0) – (15.0)Dividends paid 10 – – – (52.6) – – – (52.6) (1.6) (54.2)Issue of own shares 25 0.6 249.3 – – – – – 249.9 – 249.9Share-based payments 26 – – – 7.2 – – – 7.2 – 7.2Sale of own shares 26 – – – 0.4 – – – 0.4 – 0.4
At 30 June 2019 1.6 684.3 2.7 (306.8) (1.2) 3.7 134.8 519.1 0.5 519.6
The numbers in the table above are shown net of tax as applicable.
Under the terms of a fully underwritten rights issue, ordinary shareholders of the Company on the register at the close of business on 30 November 2018 were offered 64,455,707 new ordinary shares of 1 pence each on the basis of 33 new ordinary shares for every existing 50 ordinary shares held. The new shares were fully subscribed on 20 December 2018, resulting in proceeds on issue of £249.9m, net of expenses of £13.7m, that were charged against the share premium account.
Kier Group plc | Report and Accounts 2019114

Consolidated balance sheet At 30 June 2019
Kier Group plc | Report and Accounts 2019 115
Notes 2019
£m20181
£m
Non-current assets Intangible assets 12 766.7 862.2Property, plant and equipment 13 57.3 91.6Investments in and loans to joint ventures 14 237.9 226.1Capitalised mobilisation costs 15 3.3 –Deferred tax assets 16 47.7 –Contract assets 17 25.2 –Trade and other receivables 18 29.0 49.2Retirement benefit assets 8 58.4 39.5Other financial assets 28 22.1 15.2Non-current assets 1,247.6 1,283.8Current assets Inventories 19 217.9 575.0Contract assets 17 466.0 –Trade and other receivables 18 372.9 603.0Corporation tax receivable 9.1 15.4Other financial assets 28 2.0 –Cash and cash equivalents 20 311.7 330.9Current assets 1,379.6 1,524.3Assets held for sale as part of a disposal group 21 14.6 1.3Total assets 2,641.8 2,809.4Current liabilities Borrowings 20 (30.3) (12.0)Finance lease obligations 22 (1.1) (4.0)Trade and other payables 23 (1,311.0) (1,526.8)Contract liabilities 17 (134.0) –Provisions 24 (25.0) (15.4)Current liabilities (1,501.4) (1,558.2)Liabilities held for sale as part of a disposal group 21 (1.5) (3.4)Non-current liabilities Borrowings 20 (473.6) (524.9)Finance lease obligations 22 (2.0) (3.1)Trade and other payables 23 (39.5) (24.2)Retirement benefit obligations 8 (38.9) (31.6)Provisions 24 (65.3) (52.1)Deferred tax liability 16 – (10.8)Non-current liabilities (619.3) (646.7)Total liabilities (2,122.2) (2,208.3)Net assets 3 519.6 601.1Equity Share capital 25 1.6 1.0Share premium 684.3 435.0Capital redemption reserve 2.7 2.7Retained earnings (306.8) 27.6Cash flow hedge reserve (1.2) (5.0)Translation reserve 3.7 3.3Merger reserve 134.8 134.8Equity attributable to owners of the parent 519.1 599.4Non-controlling interests 0.5 1.7Total equity 519.6 601.1
1 2018 balance sheet reclassed to move £15.2m of ‘Other financial assets’ from current assets to non-current assets.
The financial statements of Kier Group plc, company registration number 2708030, on pages 112 to 192 were approved by the Board of Directors on 26 September 2019 and were signed on its behalf by:
Andrew Davies, CHIEF EXECUTIVE Bev Dew, FINANCE DIRECTOR
Kier Group plc | Report and Accounts 2019 115
STRATEGIC REPORT GOVERNANCE FINANCIAL STATEMENTS

Financial Statements Consolidated cash flow statement For the year ended 30 June 2019
116 Kier Group plc | Report and Accounts 2019
Notes 2019
£m 2018
£m
Cash flows from operating activities (Loss)/profit before tax – continuing operations (244.9) 106.2 – discontinued operations 21 – (1.0)Exceptional items excluding impairment, amortisation and finance costs 268.8 –Net finance cost 6 28.2 28.2Share of post-tax trading results of joint ventures 14 (30.7) (42.7)Normal cash contributions to pension fund in excess of pension charge 0.3 0.8Equity settled share-based payments charge 26 7.2 5.4Amortisation of intangible assets less negative goodwill recognised 38.7 37.7Impairment of goodwill and intangible assets 12 47.8 –Research and development expenditure credit 4 (7.8) (8.6)Depreciation charges 13 15.5 19.1Loss/(profit) on disposal of joint ventures and subsidiaries 31 0.4 (3.5)Profit on disposal of property, plant and equipment and intangible assets (0.2) (0.8)Operating cash flows before movements in working capital 123.3 140.8Deficit contributions to pension funds (24.2) (26.6)Decrease in inventories 20 8.8 33.4Decrease/(increase) in receivables 20 94.1 (29.4)Increase in contract assets (97.2) –(Decrease)/increase in payables 20 (103.8) 32.5Decrease in contract liabilities 17 (61.4) –Decrease in provisions 20 (3.2) (9.9)Cash (outflow)/inflow from operating activities before exceptional items (63.6) 140.8Cash outflow from operating activities (exceptional items) (60.8) (32.0)Cash (outflow)/ inflow from operating activities (124.4) 108.8Dividends received from joint ventures 14 31.4 30.5Interest received 6 0.2 0.9Income tax received/(paid) 9 10.1 (9.9)Net cash (outflow)/inflow from operating activities (82.7) 130.3Cash flows from investing activities Proceeds from sale of property, plant and equipment – 3.6Proceeds from sale of subsidiaries and joint ventures, net of cash disposed 18.7 5.0Purchase of property, plant and equipment 13 (11.6) (22.1)Purchase of intangible assets 12 (19.8) (41.2)Purchase of capitalised mobilisation costs (0.9) –Acquisition of subsidiaries, net of cash acquired (29.0) (16.7)Investment in joint ventures 14 (52.0) (77.6)Return of equity from joint ventures 14 25.2 40.6Loan repayment from joint ventures 6.1 –Classification (from)/to assets held for resale (2.2) 2.1Net cash used in investing activities (65.5) (106.3)Cash flows from financing activities Issue of shares 25 249.9 0.2Sale/(purchase) of own shares 26 0.4 (1.3)Interest paid (24.3) (21.7)Cash outflow incurred from raising finance – (2.0)Inflow from finance leases on property, plant and equipment 22 – 2.5Finance lease repayments 22 (4.5) (10.2)Repayment of borrowings (39.2) (91.3)Dividends paid to equity holders of the parent 10 (52.6) (66.1)Dividends paid to non-controlling interests (1.6) (1.5)Net cash from/(used in) financing activities 128.1 (191.4)Decrease in cash, cash equivalents and overdraft (20.1) (167.4)Effect of change in foreign exchange rates 0.9 (1.5)Opening cash, cash equivalents and overdraft 330.9 499.8Closing cash, cash equivalents and overdraft 20 311.7 330.9
Kier Group plc | Report and Accounts 2019116

Notes to the consolidated financial statements For the year ended 30 June 2019
Kier Group plc | Report and Accounts 2019 117
1 Significant accounting policies Kier Group plc (the Company) is a public limited company domiciled in the United Kingdom (UK), incorporated in England and Wales and listed on the London Stock Exchange. The Company’s registered number is 2708030. The consolidated financial statements of the Company for the year ended 30 June 2019 comprise the Company and its subsidiaries (together referred to as the Group) and the Group’s interest in joint arrangements.
The consolidated financial statements were approved by the Directors on 26 September 2019.
Statement of compliance The Group’s consolidated financial statements have been prepared and approved by the Directors in accordance with International Financial Reporting Standards as adopted by the European Union (IFRS) and therefore comply with Article 4 of the EU IAS Regulation and with those parts of the Companies Act 2006 that are applicable to companies reporting under IFRS. The Group has applied all accounting standards issued by the International Accounting Standards Board (‘IASB’) and interpretations issued by the IFRS Interpretations Committee as adopted by the European Union and effective for accounting periods beginning on 1 July 2018.
The Company has elected to prepare its parent company financial statements in accordance with the FRS 101 ‘Reduced Disclosure Framework’. These are presented on pages 193 to 198.
Basis of preparation The financial statements are presented in pounds sterling. They have been prepared on the historical cost basis except for derivative financial instruments which are stated at their fair value and the IFRS 2 share-based payments charge which is based on fair value movements of the Group’s share price.
The following amendments to standards are effective for the financial year ended 30 June 2019 onwards:
› IFRS 9 ‘Financial Instruments’
› IFRS 15 ‘Revenue from Contracts with Customers’
› Amendments to IFRS 2 ‘Share-based Payments’
› Amendments to IFRS 4 ‘Insurance Contracts’
› Amendments to IAS 40 ‘Investment Property’
› Annual Improvements to 2014-2016 cycle
› IFRS 1 and IAS 28 amendments
› IFRIC 22 ‘Foreign Currency Transactions and Advance Consideration’
Other than the impact of IFRS 9 and IFRS 15 as noted below, none of the above amendments to standards or interpretations has had a material effect on the Group’s financial statements.
The following new standards and amendments to standards have been issued but were not yet effective and therefore have not been applied in these financial statements:
IFRS 16 ‘Leases’
IFRS 17 ‘Insurance Contracts’
IFRS 3 (amendments) ‘Business Combinations’
IAS 1 (amendments) ‘Presentation of Financial Statements’
IAS 8 (amendments) ‘Accounting Policies, Changes in Accounting Estimates and Errors’
IAS 19 (amendments) ‘Employee Benefits’
IAS 28 (amendments) ‘Investments in Associates’
IFRIC 23 ‘Uncertainty over Income Tax Treatments’
Annual Improvements 2015-2017 cycle
Other than the impact of IFRS 16 as noted below, no significant net impact from the adoption of these new standards, amendments or interpretations is expected. The Group has chosen not to adopt any of the above standards, amendments and interpretations earlier than required.
Going concern The Directors continue to adopt the going concern basis in preparing the Group’s 2019 financial statements.
The Group announced the conclusions of its strategic review in June 2019, which set out the Group’s plans to focus on its core businesses of Regional Building, Infrastructure, Utilities and Highways; to simplify the Group by selling or substantially exiting non-core activities, including Kier Living, Property, Facilities Management and Environmental Services; to restructure the Group by reducing headcount by c.1,200 and deliver annual cost savings of c.£55m from FY2021; and to embed a culture of performance excellence with a particular focus on cash generation to deliver a reduction in average month-end net debt.
As at 19 September 2019, the Group has received a number of offers for its Residential business and has taken cost reduction actions to realise significant annualised benefits. The results of these actions will result in reduced leverage and reduced costs over the next 12 months.
At 30 June 2019, the Group had £922m of unsecured committed facilities, £20m of uncommitted overdrafts and £195m of uncommitted supply chain financing facilities.
Noting that the Group has £(121.8)m net current liabilities as at 30 June 2019, the Group has at the balance sheet date undrawn committed banking facilities of £440.7m that could be called upon as cash to increase its net current assets. The Directors have reviewed the Group’s short-term cash flow forecasts to 31 December 2020 which are included in the Group’s three-year strategic plan, on the basis of certain key assumptions and including a number of stressed but plausible downside scenarios. These included consideration of the risks to the Group relating to pension funding, working capital, supply chain finance, volume reductions, margin erosion, project specific risks, delivery of the cost reduction plans, delivery of the business disposal programme and the recoverability of work in progress and debtor balances. This stress-testing also considered a combination of the individual downside profit and cashflow scenarios. The Board undertook this assessment in the context of macro-economic and political risks affecting the UK economy, including Brexit. Brexit has the potential to disrupt the Group’s operations, particularly in relation to materials, people and the supply-chain. The Group has established a ‘Brexit task force’ and has in place business continuity plans to mitigate the risks associated with Brexit. The Board noted that the Group’s forecasts are underpinned by a significant proportion of revenue that is either secured or considered probable, often as part of long-term framework agreements, and that the Group operates primarily in sectors such as health, education and utilities, which are considered to be more insulated from macro-economic factors. In addition, significant cost reduction actions have already been taken to improve the Group’s profitability. However, in light of the current macro-economic and political risks affecting the UK economy, and other risks to business performance, the Board has also planned further mitigating actions which could be taken and are within its control to ensure that the Group remains in compliance with its debt facilities and covenant requirements in severe but plausible downside business scenarios over the forecast period.
Kier Group plc | Report and Accounts 2019 117
STRATEGIC REPORT GOVERNANCE FINANCIAL STATEMENTS

Financial Statements Notes to the consolidated financial statements / continued For the year ended 30 June 2019
118 Kier Group plc | Report and Accounts 2019
1 Significant accounting policies continued As a result, the Directors are satisfied that the Group has adequate resources to meet its obligations as they fall due and, for this reason, they continue to adopt the going concern basis in preparing the Group’s 2019 financial statements.
FRC Corporate Reporting Review On 30 July 2018, the Company received a letter from the FRC’s Corporate Reporting Review Team (CRRT) raising a number of points on the Group’s 2017 Annual Report. Details regarding the CRRT’s enquiry were disclosed on page 78 of the 2018 Annual Report.
During the year, the Company has continued to engage with the FRC, principally in relation to: (i) the Group’s accounting treatment of certain joint ventures; and (ii) the basis of revenue recognition of certain contract claims.
The CRRT has considered the accounting treatment of certain joint ventures in the Property and Residential businesses. In particular, the CRRT challenged whether contractual provisions giving Kier pre-emption rights to buy out its joint venture partners in the event of a dispute that leads to a deadlock result in an ‘asymmetry’ between the parties’ rights and could in substance mean that Kier controls these investments. The Company does not believe that these are substantive rights and, consequently, these investments have historically been accounted for as joint ventures under the equity accounting method and not consolidated into the Group’s financial statements. The Group received an unqualified audit opinion on its financial statements for the years ended 30 June 2017 and 2018.
As at 30 June 2017, the Group’s joint venture investments containing such pre-emptive rights were Kier Cross Keys within the Residential division as well as Kier Foley Street, Kier Reading and Kier Trade City within the Property division. During the year ended 30 June 2018, the Residential division also established Kier Community Living and the Property division established Kier Cornwall Street.
The Company acknowledges that this is an area of significant accounting judgement. However, in order to address the concerns raised by the FRC and demonstrate that the pre-emption provisions were never intended to be substantive, the relevant agreements have been amended to remove these rights. The Kier Cross Keys and Kier Community Living Members’ Agreements were amended prior to 30 June 2019. The Members’ Agreements for Kier Trade City and Kier Cornwall Street have been amended in September 2019. Kier Foley Street and Kier Reading sold their remaining property assets in June 2017 and December 2017 respectively. Following these amendments, Kier has no pre-emption rights to buy-out its joint venture partners.
The Group’s accounts continue to be presented on a consistent basis and have not been restated. However, had each of these investments containing pre-emption rights been consolidated as subsidiaries, rather than being equity accounted for as joint ventures, as at 30 June 2017, 30 June 2018 and 30 June 2019 respectively in accordance with IFRS 10 ‘Consolidated Financial Statements’, the effect on the Group’s balance sheet and income statement has been shown in note 14(g).
The Directors concluded that the Group’s 2019 financial statements, including its 2018 comparative, include a fair reflection of the net assets, net results and cash flows of these joint ventures.
The FRC also questioned whether the amounts receivable relating to certain contract claims on which significant losses were recognised in subsequent accounting periods were in accordance with the requirements of IAS 11 ‘Construction Contracts’.
Although it is recognised that the recovery on these particular items was subsequently lower than expected, the recoverability of the claims recognised were considered by management to be supported by the facts, and in accordance with IAS 11 at the time of approving the accounts.
The Group has revised its process for assessing the recoverability of such claims and IFRS15 ‘Revenue from Contracts with Customers’ has been adopted, replacing IAS 11, which has raised the threshold for recognition of certain claims, as explained in note 34.
Impact of IFRS 15 The Group adopted IFRS 15 during the year using the cumulative catch-up method of transition, wherein the results of the prior year are not restated. Instead, the initial impact of adopting the standard has been taken to reserves on the date of initial application (1 July 2018). The Group has recognised a debit adjustment to reserves of £60.6m (net of the associated tax effect) in respect of the transitional adjustments.
Greater detail on the transitional adjustment has been provided in note 34.
Under the Group’s chosen method of adoption, comparative figures for the preceding financial period have not been restated and are still presented under the previous revenue standards (IAS 11 & IAS 18). In order to provide some comparability, the current year figures have been presented under both old and new standards in note 34.
Following adoption of IFRS 15 the Group has revised its revenue and profit recognition accounting policies, below, to ensure compliance with the standard.
Impact of IFRS 9 From 1 July 2018, Kier Group plc retrospectively adopted IFRS 9 ‘Financial Instruments’. The adoption of IFRS 9 has had no material impact on the Group’s financial statements for the financial year ended 30 June 2019.
The Group has implemented an expected credit loss impairment model with respect to trade receivables and contract assets using the simplified approach. Trade receivables and contract assets have been grouped on the basis of their shared risk characteristics and a provision matrix has been developed and applied to these balances to generate the loss allowance. The majority of the Group’s receivables are with utility companies, transport agencies, government agencies and local authorities and the incidence of credit loss is low. Therefore, only an immaterial adjustment was generated as a result of transition from the previous bad debt provision under IAS 39 to the loss allowance under IFRS 9.
The Group does not hold complex financial instruments and the impact of IFRS 9 on the Group’s hedge accounting is not material. As permitted by the standard, the Group has chosen to delay the adoption of IFRS 9 for hedge accounting and therefore the Group’s hedge accounting continues to be performed in accordance with IAS 39 for the year ended 30 June 2019.
Impact of IFRS 16 The Group continues to work on assessing the impact of IFRS 16 ‘Leases’. As previously disclosed, the main impact of IFRS 16 will be to move the Group’s larger, longer-term operating leases, primarily in respect of property, onto the balance sheet, with a consequential increase in non-current assets and finance lease obligations. Operating lease charges included in administrative expenses will be replaced by depreciation and interest costs.
Kier Group plc | Report and Accounts 2019118

Kier Group plc | Report and Accounts 2019 119
The Group will transition to IFRS 16 using the modified retrospective approach whereby the cumulative impact of applying the standard is accounted for as an adjustment to equity at the start of the accounting period in which it is first applied (i.e. 1 July 2019).
IFRS 16 introduces a new category of non-current assets for ‘right of use assets’ associated with leases. At the date of initial application of IFRS 16, the carrying value of the Group’s right of use assets is expected to be less than the additional lease borrowings that will be coming on to the balance sheet.
Whilst work on the impact of IFRS 16 is ongoing, lease liabilities of between £190m and £200m are expected to be brought onto the balance sheet along with associated right-of-use assets of between £170m and £180m. In addition, prepaid rental amounts will be removed from the balance sheet. The net impact of these adjustments is expected to result in a material debit to opening reserves at 1 July 2019 of around £15m to £25m.
Basis of consolidation (a) Subsidiaries The consolidated financial statements comprise the financial statements of the Company and subsidiaries controlled by the Company drawn up to 30 June 2019. Control exists when the Group has direct or indirect power to govern the financial and operating policies of an entity so as to obtain economic benefits from its activities. Subsidiaries are included in the consolidated financial statements from the date that control transfers to the Group until the date that control ceases.
Business combinations are accounted for using the acquisition method as at the acquisition date, which is the date on which control is transferred to the Group. Control is the power to govern the financial and operating policies of an entity so as to obtain benefits from its activities. In assessing control, the Group takes into consideration potential voting rights that currently are exercisable.
If a business combination is achieved in stages, the acquisition date carrying value of the acquirer’s previously held equity interest in the acquiree is remeasured to fair value at the acquisition date; any gains or losses arising from such remeasurements are recognised in profit or loss.
The Group measures goodwill at the acquisition date as:
› The fair value of the consideration transferred; plus
› The recognised amount of any non-controlling interests in the acquiree; plus
› If the business combination is achieved in stages, the fair value of the existing equity interest in the acquiree; less
› The net recognised amount (generally fair value) of the identifiable assets acquired and liabilities assumed.
When the result is negative, a ‘bargain purchase’ gain is recognised immediately in the income statement.
Provisional fair values allocated at a reporting date are finalised within 12 months of the acquisition date.
The consideration transferred does not include amounts related to the settlement of pre-existing relationships. Such amounts are generally recognised in the income statement. Costs related to the acquisition, other than those associated with the issue of debt or equity securities, that the Group incurs in connection with a business combination are expensed as incurred. Any contingent consideration payable is recognised at fair value at the acquisition date. Subsequent changes to the fair value of the contingent consideration are recognised in the income statement unless the contingent consideration is classified as equity, in which case settlement is accounted for within reserves.
Accounting policies of subsidiaries are adjusted where necessary to ensure consistency with those used by the Group. All intra-Group transactions, balances, income and expenses are eliminated on consolidation.
(b) Joint arrangements A joint arrangement is a contractual arrangement whereby the Group undertakes an economic activity that is subject to joint control with third parties.
The Group’s interests in joint ventures are accounted for using the equity method. Under this method the Group’s share of the profits less losses of joint ventures is included in the consolidated income statement and its interest in their net assets is included in investments in the consolidated balance sheet. Where the share of losses exceeds the Group’s interest in the entity and there is no obligation to fund these losses the carrying amount is reduced to nil, following which no further losses are recognised. Interest in the entity is the carrying amount of the investment together with any long-term interests that, in substance, form part of the net investment in the entity.
From time to time the Group undertakes contracts jointly with other parties. These fall under the category of joint operations as defined by IFRS 11. In accordance with IFRS 11, the Group accounts for its own share of sales, profits, assets, liabilities and cash flows measured according to the terms of the agreements.
Foreign currencies Transactions denominated in foreign currencies are recorded at the exchange rates in effect when they take place. Resulting foreign currency denominated assets and liabilities are translated at the exchange rates ruling at the balance sheet date. Exchange differences arising from foreign currency transactions are reflected in the income statement.
Items included in the financial statements of each of the Group’s subsidiaries are measured using the currency of the primary economic environment in which each entity operates (‘the functional currency’). The consolidated financial statements are presented in GBP, which is the Group’s presentation currency.
The assets and liabilities of overseas subsidiary undertakings are translated at the rate of exchange ruling at the balance sheet date. Trading profits or losses are translated at average rates prevailing during the accounting period. Differences on exchange arising from the retranslation of net investments in overseas subsidiary undertakings at the year-end rates are recognised in other comprehensive income. All other translation differences are reflected in the income statement.
Revenue and profit recognition Revenue comprises the fair value of the consideration received or receivable, net of value added tax, rebates and discounts and after eliminating sales within the Group. It also includes the Group’s proportion of work carried out under jointly controlled operations.
Where revenue that has been recognised is subsequently determined not to be recoverable due to a dispute with the customer, these amounts are accounted for as a reduction in revenue. Where non-recovery is as a result of inability of a customer to meet its obligations, these amounts are charged to administrative expenses as a credit loss.
The general principles for revenue and profit recognition across the Group are as follows:
Kier Group plc | Report and Accounts 2019 119
STRATEGIC REPORT GOVERNANCE FINANCIAL STATEMENTS

Financial Statements Notes to the consolidated financial statements / continued For the year ended 30 June 2019
120 Kier Group plc | Report and Accounts 2019
1 Significant accounting policies continued › Provision is made for any unavoidable future net losses arising
from contract obligations, as soon as they become apparent;
› Additional consideration for contract modifications (variations) is only included in revenue (or the forecast contract out-turn) if the scope of the modification has been approved by the customer. If the scope of the modification has been approved but the parties have not yet determined the corresponding change in the contract price, an estimate of the change to the transaction price is made and included in calculating revenue to the extent that any increase in price is highly probable not to reverse;
› Contract modifications are treated as separate contracts if the scope of the contract increases because of the addition of promised goods or services that are distinct, and the price of the contract increases by an amount of consideration that reflects the Group’s stand-alone selling prices of the additional promised goods or services and any appropriate adjustments to that price to reflect the circumstances of the particular contract;
› Variable consideration amounts (gain-share amounts, KPI bonuses, milestone bonuses, compensation event claims, etc.) are included in revenue (or forecasts to completion) only to the extent that it is highly probable that a significant reversal of the amount in cumulative revenue recognised will not occur;
› Refund liabilities (liquidated damages, pain-share amounts, KPI penalties, etc.) are accounted for as a reduction in revenue (or in forecasting contract out-turns) as soon as it is expected that the Group will be required to refund some or all of the consideration it has received from the customer;
› Claims against third-parties (such as insurance recoveries and claims for cost reimbursements) outside of normal supplier price adjustments are recognised only when the realisation of income is virtually certain. The associated income is accounted for as reduction in costs rather than revenue; and
› Contract mobilisation is not considered to be a separate performance obligation in most situations, as the customer receives little or no benefit from mobilisation activities. Any consideration received from the customer in relation to the mobilisation phase of a contract is deferred and recognised as additional revenue relating to the performance obligations in the contract that benefit the customer.
If the timing of payments agreed with the customer provides the Group or the customer with a significant benefit of financing the transfer of goods or services, the amount of consideration is adjusted for the effects of the time value of money. The Group does not make an adjustment for the time value of money in the following circumstances:
› When the Group expects, at contract inception, that the period between the entity transferring a good or service and the customer paying for it will be one year or less; or
› Where the timing of the payments is for commercial rather than financing reasons, e.g. construction contract retentions.
Revenue and profit recognition policies applied to specific businesses are as follows:
(a) Construction contracts Revenue is recognised on construction services over time as the benefit is transferred to the customer. The Group uses an input method to measure progress. The percentage of completion is measured using cost incurred to date as a proportion of the estimated full costs of completing the contract and is applied to the total expected contract revenue to determine the revenue to be recognised to date.
The assessment of the final outcome of each contract is determined by regular review of the revenues and costs to complete that contract. Consistent contract review procedures are in place in respect of contract forecasting.
(b) Services Revenue and profit from services rendered, which include facilities management, highways maintenance, utilities maintenance, street cleaning and recycling, are recognised over time as the service is performed.
Progress on capital works and infrastructure renewal projects in the highways and utilities businesses is measured using costs incurred as a percentage of the estimated full costs of completing the performance obligation.
Where the contract includes bundled services, the transaction price is allocated to each performance obligation identified in the contract based on the relative stand-alone selling prices of each of the performance obligations. Revenue is then recognised independently when each of the performance obligations is satisfied.
Any variable consideration (e.g. performance bonus) attributable to a single performance obligation is allocated entirely to that performance obligation. Where variable consideration is attributable to the entire contract and is not specific to part of the contract, the consideration is allocated based on the stand-alone selling prices of each of the performance obligations within the contract.
Service contracts are reviewed monthly to assess their future operational performance and profitability.
(c) Private housing and land sales Revenue from housing sales is recognised at the fair value of the consideration received or receivable on legal completion, being the point that control is deemed to pass to the customer.
Profit is recognised on the sale of each housing plot by reference to the estimated cost of that plot based on an allocation from the expected overall cost out-turn for the development site. The principal estimation technique used by the Group in attributing profit on sites to a particular period is the preparation of forecasts of costs to complete on a site-by-site basis. Consistent review procedures are in place in respect of site forecasting.
Revenue from land sales and land exchanges is recognised on the unconditional exchange of contracts.
Where plots are sold part-way through construction (e.g. affordable housing plots acquired by a housing association), subsequent revenue is recognised over time based on the stage of completion reflecting the transfer of benefit to the customer. If it is not possible to establish an accurate allocation of cost from the overall site costs and therefore not possible to establish the stage of completion based on actual costs, external valuations are used to estimate the percentage of completion.
Kier Group plc | Report and Accounts 2019120

Kier Group plc | Report and Accounts 2019 121
(d) Property development Revenue in respect of property developments is recorded on unconditional exchange of contracts on disposal of finished developments. Profit taken is subject to any amounts necessary to cover residual commitments relating to development performance.
Where developments are sold in advance of construction being completed, revenue and profit are recognised at the point of sale, reflecting the transfer of control to the customer in its current stage of completion. Thereafter, revenue for construction services provided to the customer to complete the property is recognised over time in line with the percentage of completion, consistent with the Group’s accounting policy on recognising revenue on construction contracts (see page 120).
(e) Private Finance Initiative (PFI) service concession agreements Revenue relating to construction or upgrade services under a service concession agreement is recognised based on the stage of completion of the work performed, consistent with the Group’s accounting policy on recognising revenue on construction contracts (see page 120).
Operation or service revenue is recognised in the period in which the services were provided by the Group. When the Group provides more than one service in a service concession agreement, the consideration received is allocated by reference to the relative stand-alone selling prices of the services delivered.
Pre-contract and contract mobilisation costs Pre-contract costs to obtain a contract that would have been incurred irrespective of whether the contract was obtained are recognised as an expense when incurred, unless those costs are explicitly chargeable to the customer irrespective of whether the contract is obtained.
Mobilisation costs incurred in respect of a specific contract that has been won or an anticipated contract that is expected to be won (e.g. when the Group has secured preferred bidder status), are carried forward in the balance sheet as capitalised mobilisation costs if: the costs generate or enhance resources of the Group that will be used in satisfying (or in continuing to satisfy) performance obligations in the future; and the costs are expected to be recovered (i.e. the contract is expected to be sufficiently profitable to cover the mobilisation costs).
The vast majority of contracts incurring significant mobilisation costs are contracts that exceed 12 months in duration. The Group’s policy is therefore to show its capitalised mobilisation costs as a non-current asset, amortised over the expected contract duration.
Warranties and rectification costs The Group does not offer extended insurance-type warranties at an additional cost to the customer (which would represent separate performance obligations). Standard industry assurance-type warranties are provided and are accounted for as rectification cost provisions based on the estimated costs of making good any latent defects.
Exceptional items and amortisation of acquired intangible assets During the year, the Directors have reviewed the previous accounting presentation for disclosed non-underlying items. As part of this review, the Directors have changed the Group’s Alternative Performance Measure to ‘Profit before exceptional items and amortisation of acquired intangible assets’ to improve the transparency and clarity of the Group’s financial performance.
Items which are significant by virtue of their size and/or nature are now presented as exceptional items within their relevant consolidated income statement category.
Exceptional items are items of financial performance which the Group believes should be separately identified on the face of the Income Statement to provide additional useful information and to assist in understanding the financial performance achieved by the Group and are highlighted separately in the notes to the consolidated financial statements.
Separate presentation of these items is intended to enhance understanding of the financial performance of the Group in the year and the extent to which results are influenced by material unusual and/or non-recurring items.
The Directors exercise judgement in determining the classification of certain items as exceptional using quantitative and qualitative factors. In assessing whether an item is exceptional, the Directors give consideration, both individually and collectively, as to whether the item is unusual by virtue of its size, the specific circumstances which have led to the item arising and if the item is likely to recur, or whether the matter forms part of a group of similar items. No single criteria alone classifies an item as exceptional and management must therefore exercise judgement as to whether, on balance, classifying as such will help users of the financial statements understand the Group’s business performance.
Amortisation of acquired intangible assets and certain financing costs are also included alongside exceptional items on the basis of being ongoing non-cash items generated from acquisition related activity.
As a result of the Group’s change in its Alternative Performance Measure, a review of the comparative year has been conducted to align to the revised presentation. A material charge of £27.0m in relation to the Mersey Gateway project within the Infrastructure division has been identified as meeting the revised exceptional classification. The results for the year ended 30 June 2018 have been re-presented accordingly. The results from the Mining operations, which were previously disclosed as non-underlying, do not meet the definition for exceptional items and therefore have been re-presented within profit before exceptional items and amortisation of acquired intangible assets.
A reconciliation from the reported results in the 30 June 2018 Annual Report to the revised comparative amounts is included in note 5.
Finance income and costs Interest receivable and payable on bank balances is credited or charged to the income statement as incurred using the effective interest rate method.
Borrowing costs are capitalised where the Group constructs qualifying assets. All other borrowing costs are written off to the income statement as incurred.
Borrowing costs incurred within the Group’s jointly controlled entities relating to the construction of assets in PFI and PPP projects are capitalised until the relevant assets are brought into operational use.
Notional interest payable, representing the unwinding of the discount on long-term liabilities, is charged to finance costs.
Taxation Income tax comprises current and deferred tax. Income tax is recognised in the income statement except to the extent that it relates to items recognised directly in equity, in which case it is recognised in equity.
Current tax is the expected tax payable on taxable income for the year, using tax rates enacted or substantively enacted at the balance sheet date, and any adjustment to tax payable in respect of previous years.
Kier Group plc | Report and Accounts 2019 121
STRATEGIC REPORT GOVERNANCE FINANCIAL STATEMENTS

Financial Statements Notes to the consolidated financial statements / continued For the year ended 30 June 2019
122 Kier Group plc | Report and Accounts 2019
1 Significant accounting policies continued Deferred tax is provided using the balance sheet method, providing for temporary differences between the carrying amounts of assets and liabilities for financial reporting purposes and the amounts used for taxation purposes. The deferred tax provision is based on the expected manner of realisation or settlement of the carrying amount of the assets and liabilities, using tax rates enacted or substantively enacted at the balance sheet date.
A deferred tax asset is recognised only to the extent that it is probable that future taxable profits will be available against which the asset can be utilised. Deferred tax assets are reduced to the extent that it is no longer probable that the related tax benefit will be realised.
Goodwill and other intangible assets Goodwill arising on consolidation represents the excess of the consideration over the Group’s interest in the fair value of the identifiable assets and liabilities of a subsidiary.
Goodwill is recognised as an asset and reviewed for impairment at least annually. Any impairment is recognised immediately in the income statement and is not subsequently reversed. Negative goodwill is recognised in the income statement immediately. On disposal of a subsidiary or jointly controlled entity, the attributable carrying amount of goodwill is included in the determination of the profit or loss on disposal.
Other intangible assets which comprise contract rights and computer software are stated at cost less accumulated amortisation and impairment losses. Amortisation is charged to administrative expenses in the income statement on a straight-line basis over the expected useful lives of the assets, which are principally as follows:
Contract rights Over the remaining contract life
Computer software 3–10 years
Amortisation of the ERP computer software was initially set at a 7-year useful life but has now been extended to 10 years as the Directors now anticipate the asset will be in use for longer than initially expected. The impact was a £4.0m reduction in the amortisation charge for the year.
Internally generated intangible assets developed by the Group are recognised only if all of the following conditions are met:
› An asset is created that can be identified;
› It is probable that the asset created will generate future economic benefits; and
› The development cost of the asset can be measured reliably.
Other research expenditure is written off in the period in which it is incurred.
Property, plant and equipment and depreciation Depreciation is based on historical or deemed cost, including expenditure that is directly attributable to the acquisition of the items, less the estimated residual value, and the estimated economic lives of the assets concerned. Freehold land is not depreciated. Other tangible assets are depreciated to residual values in equal annual instalments over the period of their estimated economic lives, which are principally as follows:
Freehold land and buildings 25–50 years
Leasehold buildings and improvements Period of lease
Plant and equipment (including vehicles) 3–12 years
Assets held under finance leases are depreciated over the shorter of the term of the lease or the expected useful life of the asset.
Leases Leases in terms of which the Group assumes substantially all of the risks and rewards of ownership are classified as finance leases. On initial recognition the leased asset is measured at an amount equal to the lower of its fair value and the present value of the minimum lease payments. Subsequent to initial recognition, the asset is accounted for in accordance with the accounting policy applicable to that asset.
Other leases are operating leases, and the rental charges are charged to the income statement on a straight-line basis over the life of each lease.
Mining assets Opencast expenditure incurred prior to the commencement of operating an opencast site is capitalised and the cost less the residual value is depreciated over the ‘coaling life’ of the site on a coal extraction basis.
The cost of restoration is recognised as a provision as soon as the restoration liability arises. The amount provided represents the present value of the anticipated costs. Costs are charged against the provision as incurred and the unwinding of the discount is included within finance costs. A tangible asset is created for an amount equivalent to the initial provision and depreciated on a coal extraction basis over the life of the asset.
Where there is a subsequent change to the estimated restoration costs or discount rate, the present value of the change is recognised as a change in the restoration provision with a corresponding change in the cost of the tangible asset until the asset is fully depreciated when the remaining adjustment is taken to the income statement.
Inventories Inventories, including land held for and in the course of development, are valued at the lower of cost and net realisable value. Cost comprises direct materials and, where appropriate, labour and production overheads which have been incurred in bringing the inventories and work in progress to their present location and condition. Cost in certain circumstances also includes notional interest as explained in the accounting policy for finance income and costs. Net realisable value represents the estimated selling price less all estimated costs of completion and costs to be incurred in marketing, selling and distribution.
Inventories are valued on a first in, first out (FIFO) basis.
Land inventory is recognised at the time a liability is recognised, generally after exchange of unconditional contracts.
Property inventory, which represents all development land and work in progress, is included at cost less any losses foreseen in completing and disposing of the development less any amounts received or receivable as progress payments or part disposals. Where a property is being developed, cost includes cost of acquisition and development to date, including directly attributable fees, expenses and finance charges net of rental or other income attributable to the development. Where development property is not being actively developed, net rental income and finance costs are taken to the income statement.
Assets held for sale Assets classified as held for sale are measured at the lower of their carrying amount and fair value less costs to sell.
Assets are classified as held for sale if their carrying amount will be recovered through a sale transaction rather than through continuing use. This condition is regarded as met only when the sale is highly probable, and the assets are available for sale in their present condition.
Kier Group plc | Report and Accounts 2019122

Kier Group plc | Report and Accounts 2019 123
Share capital The ordinary share capital of the Company is recorded as the proceeds received, net of directly attributable incremental issue costs.
Provisions Provisions are recognised when the Group has a present legal or constructive obligation as a result of a past event, and where it is probable that an outflow will be required to settle the obligation and the amount can be reliably estimated.
Contingent liabilities The Group discloses a contingent liability in circumstances where it has a possible obligation depending on whether some uncertain future event occurs, or has a present obligation but payment is not probable, or the amount cannot be measured reliably.
Government grants Government grant income is recognised at the point that there is reasonable assurance that the Group will comply with the conditions attached to it, and that the grant will be received.
Employee benefits (a) Retirement benefit obligations For defined contribution pension schemes operated by the Group, amounts payable are charged to the income statement as they fall due.
The Group accounts for defined benefit obligations in accordance with IAS 19. Obligations are measured at discounted present value while plan assets are measured at fair value. The operating and financing costs of such plans are recognised separately in the income statement; current service costs are spread systematically over the lives of employees and financing costs are recognised in full in the period in which they arise. Remeasurements of the net defined pension liability, including actuarial gains and losses, are recognised immediately in other comprehensive income.
The net finance cost is calculated by applying the discount rate to the net balance of the defined benefit obligation and the fair value of plan assets. This cost is included in finance costs in the income statement.
Where the calculations result in a surplus to the Group, the recognised asset is limited to the present value of any available future refunds from the plan or reductions in future contributions to the plan.
(b) Share-based payments Share-based payments granted but not vested are valued at the fair value of the shares at the date of grant. This affects the Sharesave and Long Term Incentive Plan (LTIP) schemes. The fair value of these schemes at the date of award is calculated using the Black-Scholes model apart from the total shareholder return element of the LTIP which is based on a Stochastic model.
The cost to the Group of awards to employees under the LTIP scheme is spread on a straight-line basis over the relevant performance period. The scheme awards to senior employees a number of shares which will vest after three years if particular criteria are met. The cost of the scheme is based on the fair value of the shares at the date the options are granted.
Shares purchased and held in trust in connection with the Group’s share schemes are deducted from retained earnings. No gain or loss is recognised within the income statement on the market value of these shares compared with the original cost.
Financial instruments Financial assets and financial liabilities are recognised in the Group’s balance sheet when the Group becomes a party to the contractual provisions of the instrument. An assessment of whether a financial asset is impaired is made at least at each reporting date. The principal financial assets and liabilities of the Group are as follows:
(a) Trade receivables and trade payables Given the varied activities of the Group it is not practicable to identify a common operating cycle. The Group has therefore allocated receivables and payables due within 12 months of the balance sheet date to current with the remainder included in non-current.
A trade receivable is recognised when the Group has a right to consideration that is unconditional (subject only to the passage of time before payment is due). Trade receivables do not carry interest and are stated at their initial cost reduced by appropriate allowances for expected credit losses.
Trade payables on normal terms are not interest bearing and are stated at their nominal value. Trade payables on extended terms, particularly in respect of land purchases, are discounted and recorded at their present value.
Amounts owing under supply chain finance arrangements are included within trade payables rather than bank debt. The purpose of supply chain finance is purely to grant subcontractors and suppliers access to credit and improve their cashflows. There have been no changes to the underlying terms of the supply chain finance arrangements.
The designation in trade payables is due to the assignment of invoice rather than a novation, Kier acting as an agent with fees related to supply chain finance being borne by the supplier and the final payment date to the bank being set by Kier with interest accrued for any late payments.
(b) Contract assets and liabilities When the Group transfers goods or services to a customer before the customer pays consideration or before payment is due, the amount of revenue associated with the transfer of goods or services is accrued and presented as a contract asset in the balance sheet (excluding any amounts presented as a receivable). A contract asset represents the Group’s right to consideration in exchange for goods or services that the Group has transferred to a customer.
If a customer pays consideration, or the Group has a right to an amount of consideration that is unconditional (i.e. a receivable), before the Group transfers a good or service to the customer, the amount is presented as a contract liability on the balance sheet. A contract liability represents the Group’s obligation to transfer goods or services to a customer for which the entity has received consideration (or an amount of consideration is due) from the customer.
(c) Cash and cash equivalents Cash and cash equivalents in the cash flow statement comprise cash at bank and in hand, including bank deposits with original maturities of three months or less, net of bank overdrafts where legal right of set off exists. Bank overdrafts are included within financial liabilities in current liabilities in the balance sheet.
(d) Bank and other borrowings Interest-bearing bank and other borrowings are recorded at the fair value of the proceeds received, net of direct issue costs. Finance charges, including premiums payable on settlement or redemption and direct issue costs, are accounted for on an accruals basis in the income statement using the effective interest method and are added to the carrying value of the instrument to the extent that they are not settled in the period in which they arise.
Kier Group plc | Report and Accounts 2019 123
STRATEGIC REPORT GOVERNANCE FINANCIAL STATEMENTS

Financial Statements Notes to the consolidated financial statements / continued For the year ended 30 June 2019
124 Kier Group plc | Report and Accounts 2019
1 Significant accounting policies continued (e) Private Finance Initiative (PFI) assets Under the terms of a PFI or similar project, where the risks and rewards of ownership remain largely with the purchaser of the associated services, the Group’s interest in the asset is classified as a financial asset and included at its amortised cost within investment in joint ventures.
(f) Derivative financial instruments As permitted by IFRS 9, the Group has chosen to continue to apply the hedge accounting requirements of IAS 39.
Derivatives are initially recognised at fair value on the date that the contract is entered into and subsequently remeasured in future periods at their fair value. The method of recognising the resulting change in fair value depends on whether the derivative is designated as a hedging instrument and whether the hedging relationship is effective.
For cash flow hedges the effective part of the change in fair value of these derivatives is recognised directly in other comprehensive income. Any ineffective portion is recognised immediately in the income statement. Amounts accumulated in equity are recycled to the income statement in the periods when the hedged items will affect profit or loss. The fair value of interest rate derivatives is the estimated amount that the Group would receive or pay to terminate the derivatives at the balance sheet date.
If the hedging instrument no longer meets the criteria for hedge accounting, expires or is sold, terminated or exercised, the hedge accounting is discontinued prospectively. The cumulative gain or loss previously recognised in equity remains there until the forecast transaction occurs.
The Group enters into forward contracts in order to hedge against transactional foreign currency exposures. In cases where these derivative instruments are significant, hedge accounting is applied as described above. Where hedge accounting is not applied, changes in fair value of derivatives are recognised in the income statement. Fair values are based on quoted market prices at the balance sheet date.
Critical accounting estimates and judgements The key assumptions concerning the future and other key sources of estimation uncertainty at the balance sheet date that have a significant risk of causing a material adjustment to the carrying amounts of assets and liabilities within the next financial year are as follows:
(a) Revenue and profit recognition The estimation techniques used for revenue and profit recognition in respect of property development, housing sales, construction contracts and services contracts require forecasts to be made of the outcome of long-term contracts which require assessments and judgements to be made on the recovery of pre-contract costs, changes in the scope of work, contract programmes, maintenance and defects liabilities and changes in costs.
There are 10 contracts that the Group considers require significant accounting estimates and, as at 30 June 2019, the Group has included estimated recoveries from customers with a combined value of £29.3m. These recoveries are recognised on the basis that they are considered highly probable not to reverse, however, there is clearly a range of factors affecting potential outcomes once these contracts are finalised and the Group estimates the values on these contracts could collectively range from an upside of £12.9m to a downside of £7.4m. One of these contracts is a significant ongoing rebuild project that is covered by a fixed insurance recovery, for which there are no balances with customers however there is risk associated with the future costs of rebuild.
Over 500 construction contracts (2018: over 500) were income generating during the year within the Group’s Buildings and Infrastructure Services operating divisions. Of these, five (2018: three) individually had a material impact on operating profit.
The key judgements and estimates relating to determining the revenue and profit of these material contracts are:
› costs to complete
› achieving the planned build programme
› recoverability of claims and variations in accordance with IFRS 15
› each contract is treated on its merits and subject to a regular review of the revenue and costs to complete that contract, determined by a combination of management judgement and external professional assistance, backed up by judgements papers for the contracts that have a material impact on the income statement.
The level of estimation uncertainty in our Construction business is reduced by the effect of its substantial portfolio and significant experience of the division’s management team. The level of estimation is further reduced by the combination of the modest scale and short contract durations of our projects. Nevertheless, the profit recognition in our Construction business is a key estimate, due to the inherent uncertainties in any construction project over revenues and costs.
The level of estimation and uncertainty differs between our construction businesses, particularly between Regional Building, Major Projects – Building and Infrastructure. UK Building operates around 400 sites each year with an average project size of £8m. These projects typically operate under framework contracts where costs are known with a greater degree of certainty. Infrastructure manages around 30 sites with projects ranging from a relatively small number of higher value major Infrastructure Civil Engineering projects to a larger number of more modest minor signalling upgrades and replacements.
The major Infrastructure Civil Engineering projects typically include Design and Build, Construct only and Lump Sum contracts. The nature and length of these contracts means there can be a greater level of estimation and uncertainty. The blended portfolio risk of the overall construction businesses is mitigated by the relative sizes of the Regional Building, Major Projects – Building and Infrastructure businesses.
Our construction revenue for the year is £1.9bn (2018: £2.0bn) with an associated margin of 2.7% (2018: 3.4%). The historic profit margins in our construction businesses typically range from 1.8% to 3.4%. We therefore determined that a potential downside risk in margin would be 0.9% (2018: 1.6%). Given the short-term average duration (approximately 12 months) of our construction portfolio, the impact of such a decrease in margin across our projects in delivery at the year end would be a decrease in operating profit of £8.6m (2018: £16.0m). The FY2018 comparatives have been re-presented to reflect the move to reporting profit before exceptional items (see note 5).
(b) Valuation of land and work in progress The inventory balance brought forward from the prior year end included £60m relating to 10 land sites acquired for development as residential sites, on which development had been temporarily suspended. Historically, these assets were accounted for as work in progress in the balance sheet and are carried at net book value, representing the lower of cost and net realisable value in accordance with IAS 2 ‘Inventories’, para 9.
Kier Group plc | Report and Accounts 2019124

Kier Group plc | Report and Accounts 2019 125
The net realisable value of the land is a key estimate.
Following the Group’s decision to dispose of the Residential division, these assets have been written down to their fair value. A material exceptional charge has been recorded in the year totalling £50m (see note 5).
(c) Life cycle assets The Group has a number of ongoing contracts where life cycle funds are established to meet contractual obligations. The key sensitivity in our calculation is the percentage of the funds build-up required for future maintenance. A reasonably likely change would be an increase or decrease of 10% in the percentage of funds build-up required. Such a change would result in a profit impact of approximately £1m in any one year.
(d) Defined benefit pension scheme valuations In determining the valuation of defined benefit pension scheme assets and liabilities, a number of key assumptions have been made. The key assumptions, which are given below, are largely dependent on factors outside the control of the Group:
› Expected return on plan assets;
› Inflation rate;
› Mortality;
› Discount rate; and
› Salary and pension increases.
Details of the assumptions used and sensitivity to changes in these assumptions are included in note 8.
(e) Goodwill Determining whether goodwill is impaired requires an estimation of the value in use of cash generating units (CGUs) to which the goodwill has been allocated. The value in use calculation requires an estimate to be made of the timing and amount of future cash flows expected to arise from the CGU and the application of a suitable discount rate in order to calculate the net present value. Cash flow forecasts for the next three years are based on the Group’s budgets and forecasts. Other key inputs in assessing each CGU are revenue growth, operating margin and discount rate. The assumptions are set out in note 12 together with an assessment of the impact of reasonably possible sensitivities.
(f) Joint ventures In accordance with IFRS 11 para 7, joint ventures are identified where the control of an arrangement is shared and decisions around activities require unanimous consent if the action significantly affects the investee’s return. The key judgement involved in determining joint control is that the board structure and the mechanisms, including deadlock mechanisms, in the reserved matters do not give any one party majority control over relevant activities, regardless of the economic split between partners.
Further detail on the nature of this judgement, in the context of the FRC review, is given on page 118.
(g) Exceptional items The Group changed the presentation of its financial statements for FY2019 to profit before exceptional items and amortisation of acquired intangible assets. In prior years, the Group has reported underlying profit. The principal reason for the change is to improve the transparency and clarity of the Group’s financial performance.
Exceptional items are items of financial performance which the Group believes should be separately identified on the face of the income statement to assist in understanding the financial performance achieved by the Group in accordance with the accounting policy set out on page 121. Determining whether an item is classified as an exceptional item requires significant judgement.
A total net exceptional cost of £286.6m after tax was charged to the income statement for the year ended 30 June 2019 (2018: £47.0m). The items that comprise this are set out in note 5 together with an explanation of their nature and consideration points as to why the Directors believe these to be exceptional.
(h) Taxation The Group is subject to tax in a number of jurisdictions and judgement is required in determining the overall provision for income taxes. The Group provides for future liabilities in respect of uncertain tax positions where additional tax may become payable in future periods and such provisions are based on management’s assessment of exposures.
Deferred tax liabilities are generally provided for in full and deferred tax assets are recognised to the extent that it is judged probable that future taxable profit will arise against which the temporary differences will be utilised.
Kier Group plc | Report and Accounts 2019 125
STRATEGIC REPORT GOVERNANCE FINANCIAL STATEMENTS

Financial Statements Notes to the consolidated financial statements / continued For the year ended 30 June 2019
126 Kier Group plc | Report and Accounts 2019
2 Revenue Revenue is entirely derived from contracts with customers.
Infrastructure services The Group derives revenue from capital infrastructure projects as well as the maintenance of infrastructure assets across various sectors including highways, rail, water, gas and domestic fibre installation.
Capital projects can range from the construction of power stations, roads, bridges and tunnels over a period of several years (e.g. Hinkley Point C, Mersey Gateway bridge, Crossrail and HS2), to small schemes completed in a matter of days. Revenue is recognised over time as the construction services are rendered to the customer. Each capital project is typically a single performance obligation.
The Group also provides maintenance services for the UK road, rail and utilities infrastructure through both routine, preventative maintenance as well as reactive repairs. These services are generally delivered under framework contracts of between 5 to 8 years, however, individual performance obligations under the framework are normally determined on an annual, monthly or ad hoc basis. Revenue is recognised over time as the maintenance services are rendered to the customer.
Where multiple services are supplied under a single contract they are treated as separate performance obligations and revenue is recognised separately as each performance obligation is satisfied.
Services are normally invoiced monthly in arrears under normal commercial credit terms. Under some contracts, amounts are held back as a retention for periods that can exceed 12 months. However, as the purpose of the retentions is to ensure that the performance obligations on the contract are carried out to a satisfactory standard, the Group does not deem there to be a significant financing component in the timing of the cash flows on these amounts.
The Group’s obligation to make good faulty workmanship under standard industry warranty terms is recognised as a provision (see note 24).
Buildings The Group undertakes over 400 building projects each year, providing construction services in the private, education and health sectors and on public sector frameworks. Projects range from extensions costing £0.3m to the construction of major strategic assets costing hundreds of millions of pounds. The construction of a building, including any associated design work, is normally accounted for as a single performance obligation as the services provided are normally highly interrelated. Revenue is recognised over time as the performance obligation is satisfied.
Invoices are typically raised monthly, based on valuations of the work completed, and have normal commercial payment terms. It is common in the construction industry for an amount to be held back as a retention for periods that can exceed 12 months. However, as the purpose of the retentions is to ensure that the performance obligations on the contract are carried out to a satisfactory standard, the Group does not deem there to be a significant financing component in the timing of the cash flows on these amounts.
Whilst the bulk of consideration associated with construction contracts is fixed, variable consideration elements can exist (milestone bonuses, gain share, event claims, etc.). The Group only recognises revenue for these amounts if they are highly probable not to reverse.
Liquidated and ascertained damages (‘LADs’) clauses are often present in construction contracts. Where it is anticipated that a LADs clause will be triggered (e.g. through overrunning works), revenue is constrained to reflect the highly probable amount of the deduction.
Modifications to the scope of construction work are agreed in principle with the customer before additional work is carried out. However, the price is not always determined until the final account stage. In these circumstances the Group treats the revenue associated with the modification as variable consideration and only recognises amounts that are highly probable not to reverse.
The Group’s obligation to repair building faults under standard industry warranty terms is recognised as a provision (see note 24).
For the Group’s construction activities in the Middle East, in some circumstances, customers pay upfront amounts to protect the Group against payment default. Payments on account are not normally made more than 12 months in advance of the service delivery.
The Group also provides facilities management and maintenance services. Revenue for these services is recognised over time as the services are rendered. Invoices for services rendered are typically raised monthly. Typically, normal commercial payment terms apply, with the exception of the PFI lifecycle contracts, as noted below.
The Group has a number of long-term PFI lifecycle contracts to maintain properties over periods of 25-30 years. A fund is established at the start of the contract and amounts are drawn down by the Group as maintenance work is performed. The Group is also entitled to share in any surplus left in the fund at the end of the contract. Revenue is recognised over time to reflect the rendering of the service including an assessment of the appropriate proportion of the likely surplus in the fund, subject to being highly probable not to reverse. As the surplus amount will not be paid until the end of the contracts, the contract asset associated with the surplus recognised to date is shown as a non-current asset in the balance sheet. The surplus is payable at the end of the contract to ensure that the property is maintained to a satisfactory standard over the full term of the contract and to promote efficiencies. As such the Group does not deem there to be a significant financing component.
Kier Group plc | Report and Accounts 2019126

Kier Group plc | Report and Accounts 2019 127
Developments & Housing The Group undertakes property development and house building on its own sites as well as a service for customers. The Group also provides maintenance services to local authorities and private landlords with large housing portfolios, and waste and recycling collection services for local authority and commercial customers.
Revenue in respect of property developments is recorded on unconditional exchange of contracts. In most cases payment is received on legal completion.
Where developments are sold in advance of construction being completed, revenue and profit are recognised at the point of sale, reflecting the transfer of control to the customer in its current stage of completion. Thereafter, revenue for construction services provided to the customer to complete the property development is recognised over time as the construction services are rendered. Construction services are normally invoiced monthly based on valuations under normal commercial payment terms.
Revenue from house sales is recognised on legal completion, being the point that control is deemed to pass to the customer. Payment is also received at the point of legal completion.
Where housing plots are sold part-way through construction (e.g. affordable housing plots acquired by a housing association), subsequent revenue is recognised over time based on the stage of completion of the build reflecting the transfer of benefit to the customer.
Occasionally the Group will sell land that it has previously acquired for potential commercial property or housing developments. Revenue from land sales and land exchanges is recognised on the unconditional exchange of contracts.
Revenue for maintenance services is recognised over time as the services are rendered. Services are either invoiced monthly or shortly after completion of individual performance obligations. Normal commercial payment terms apply.
Environmental services contracts with local authorities, for domestic waste and recyclate collections and operation of household waste and recycling centre, have a typical duration of between 7 and 10 years. Contract with commercial customers are typically for 12 months. Revenue from environmental services contracts is recognised over time as the services are performed. Invoices are raised monthly in arrears and normal commercial payment terms apply.
Transaction price allocated to remaining performance obligations The following table includes revenue expected to be recognised in the future related to performance obligations that are unsatisfied (or partially unsatisfied) at the reporting date.
The above transaction prices only include variable consideration if it is highly probable not to reverse and exclude any estimate of revenue from framework contracts for which a firm commitment or order has not been received at the reporting date.
The Group applies the practical expedient in paragraph 121 of IFRS 15 and does not disclose information about remaining performance obligations that have original expected durations of one year or less.
2020
£m 2021
£m
2022onwards
£m
Infrastructure Services 369.5 98.5 32.0
Buildings 1,184.9 355.6 10.3
Developments & Housing 137.8 15.9 23.5
Total transaction price allocated to remaining performance obligations 1,692.2 470.0 65.8
Kier Group plc | Report and Accounts 2019 127
STRATEGIC REPORT GOVERNANCE FINANCIAL STATEMENTS

Financial Statements Notes to the consolidated financial statements / continued For the year ended 30 June 2019
128 Kier Group plc | Report and Accounts 2019
3 Segmental reporting From 1 July 2018, the Group changed its reporting format to focus on three market positions to comprise Infrastructure Services, Buildings and Developments & Housing. This is the basis on which the Group reports its primary segmental information for the year ended 30 June 2019. Corporate includes unrecovered overheads and the charge for defined benefit pension schemes.
The change in reporting structure has also resulted in a change to the Group’s previously reported cash generating units (‘CGU’). In accordance with IAS 36 ‘Impairment of Assets’ the Group has reallocated the carrying value of the Group’s goodwill as at 1 July 2018 to each of the Group’s new CGUs as follows:
£m
Infrastructure Services 527.0
Buildings 20.4
Developments & Housing 12.8
560.2
Segment information is based on the information provided to the Chief Executive, together with the Board, who is the chief operating decision maker. The segments are strategic business units with separate management and have different core customers and offer different services. The segments are discussed in the Business Review on pages 38 to 40.
The accounting policies of the operating segments are the same as those described in the summary of significant accounting policies on pages 117 to 125. The Group evaluates segmental information on the basis of profit or loss from operations before exceptional items, amortisation of intangible contract rights, interest and income tax expense. The segmental results that are reported to the Chief Executive include items directly attributable to a segment as well as those that can be allocated on a reasonable basis.
Year to 30 June 2019
Continuing operations
Infrastructure Services
£mBuildings
£m
Developments & Housing
£m Corporate
£m Group
£m
Revenue1
Group and share of joint ventures 1,670.7 1,882.7 939.8 1.2 4,494.4Less share of joint ventures – – (357.7) – (357.7)
Group revenue 1,670.7 1,882.7 582.1 1.2 4,136.7
Timing of revenue1
Products and services transferred at a point in time 4.0 – 319.3 – 323.3Products and services transferred over time 1,666.7 1,882.7 620.5 1.2 4,171.1
Group and share of joint ventures 1,670.7 1,882.7 939.8 1.2 4,494.4
Profit
Group operating profit/(loss) 56.4 62.4 24.8 (50.2) 93.4Share of post-tax results of joint ventures – – 30.7 – 30.7
Operating profit/(loss) before exceptional items 56.4 62.4 55.5 (50.2) 124.1Net finance (costs)/income before exceptional items2 (5.7) 4.4 (18.3) (6.9) (26.5)
Profit/(loss) before tax and exceptional items 50.7 66.8 37.2 (57.1) 97.6
Exceptional items
Revenue – (15.0) – – (15.0)Amortisation of acquired intangible assets relating to contract rights (20.9) – (3.9) – (24.8)Net finance costs – – (1.1) (0.6) (1.7)Other exceptional items (39.9) (47.2) (103.8) (110.1) (301.0)
(Loss)/profit before tax from continuing operations (10.1) 4.6 (71.6) (167.8) (244.9)
Kier Group plc | Report and Accounts 2019128

Kier Group plc | Report and Accounts 2019 129
Year to 30 June 2019
Continuing operations
Infrastructure Services
£mBuildings
£m
Developments & Housing
£m Corporate
£mGroup
£m
Balance sheet
Operating assets3 985.8 551.9 568.9 184.8 2,291.4Operating liabilities3 (359.5) (756.7) (307.1) (193.5) (1,616.8)
Net operating assets/(liabilities)3 626.3 (204.8) 261.8 (8.7) 674.6Cash, cash equivalents and borrowings 139.1 298.2 (308.7) (320.8) (192.2)Net financial assets – – – 24.1 24.1
Net assets/(liabilities) excluding net assets held for sale 765.4 93.4 (46.9) (305.4) 506.5
Net assets held for sale – – 13.1 – 13.1
Net assets/(liabilities) 765.4 93.4 (33.8) (305.4) 519.6
Other information
Inter-segmental revenue 67.2 2.2 2.5 0.5 72.4Capital expenditure on property, plant, equipment and intangible assets 2.1 5.5 5.3 18.5 31.4Depreciation of property, plant and equipment (1.9) (0.8) (6.6) (6.2) (15.5)Amortisation of computer software (1.5) (1.9) (1.9) (10.0) (15.3)
Year to 30 June 20184
Continuing operations
Infrastructure Services
£mBuildings
£m
Developments & Housing
£m Corporate
£mGroup
£m
Revenue1
Group and share of joint ventures 1,733.4 1,777.5 1,001.9 – 4,512.8Less share of joint ventures – – (273.2) – (273.2)
Group revenue 1,733.4 1,777.5 728.7 – 4,239.6
Timing of revenue1
Products and services transferred at a point in time 5.2 – 421.2 – 426.4Products and services transferred over time 1,728.2 1,777.5 580.7 – 4,086.4
Group and share of joint ventures 1,733.4 1,777.5 1,001.9 – 4,512.8
Profit
Group operating profit/(loss) 95.3 54.7 25.9 (35.1) 140.8Share of post-tax results of joint ventures – – 42.7 – 42.7Profit on disposal of joint ventures and subsidiaries – – 3.5 – 3.5
Operating profit/(loss) before exceptional items 95.3 54.7 72.1 (35.1) 187.0Net finance (costs)/income before exceptional items2 (3.8) 7.0 (17.0) (9.3) (23.1)
Profit/(loss) before tax and exceptional items 91.5 61.7 55.1 (44.4) 163.9
Exceptional items Exceptional contract losses (27.0) – – – (27.0)Amortisation of acquired intangible assets relating to contract rights (25.0) – (0.6) – (25.6)Net finance costs (1.4) – (3.7) – (5.1)
Profit/(loss) before tax from continuing operations 38.1 61.7 50.8 (44.4) 106.2
Kier Group plc | Report and Accounts 2019 129
STRATEGIC REPORT GOVERNANCE FINANCIAL STATEMENTS

Financial Statements Notes to the consolidated financial statements / continued For the year ended 30 June 2019
130 Kier Group plc | Report and Accounts 2019
3 Segmental reporting continued Year to 30 June 20184
Continuing operations
Infrastructure Services
£mBuildings
£m
Developments & Housing
£m Corporate
£m Group
£m
Balance sheet
Operating assets3 1,142.8 504.3 715.8 99.1 2,462.0Operating liabilities3 (522.9) (752.9) (310.7) (81.5) (1,668.0)
Net operating assets/(liabilities)3 619.9 (248.6) 405.1 17.6 794.0Cash, cash equivalents and borrowings 141.1 340.0 (343.7) (343.4) (206.0)Net financial assets – – – 15.2 15.2
Net assets/(liabilities) excluding net assets held for sale 761.0 91.4 61.4 (310.6) 603.2
Net liabilities held for sale – – (2.1) – (2.1)
Net assets/(liabilities) 761.0 91.4 59.3 (310.6) 601.1
Other information
Inter-segmental revenue 71.3 2.2 1.4 10.1 85.0Capital expenditure on property, plant, equipment and intangible assets 4.5 4.6 3.0 51.2 63.3Depreciation of property, plant and equipment (8.3) (0.8) (4.8) (5.2) (19.1)Amortisation of computer software (0.5) (0.9) (0.3) (12.2) (13.9)
1 Revenue is stated after the exclusion of inter-segmental revenue and before exceptional items. Over 90% of the Group’s revenue is derived from UK based customers.
2 Interest was (charged)/credited to the divisions at a notional rate of 4.0%. 3 Net operating assets/(liabilities) represent assets excluding cash, cash equivalents, bank overdrafts, borrowings, financial assets and liabilities, assets and
liabilities classified as held for sale and interest-bearing inter-company loans. 4 Prior year re-presented to show the new reporting segments focused on the Group’s three market positions of Infrastructure Services, Buildings and
Developments & Housing and to reflect the change in the Group’s Alternative Performance Measure. This has had no impact on the statutory reported results for the year ended 30 June 2018.
4 Profit/(loss) for the year Profit/(loss) from operations is stated after charging/(crediting):
Note 2019
£m 2018
£m
Auditor’s remuneration:
Fees payable for the audit of the parent company and consolidated financial statements 0.4 0.2
Fees payable to the Company’s auditor for other services1: Audit of the Company’s subsidiaries, pursuant to legislation 1.2 1.2
Other services 0.2 0.1
Amortisation of intangible assets 12 40.3 39.5
Impairment of intangible assets 12 37.8 –
Loss on disposal of computer software 12 12.8 –
Depreciation of property, plant and equipment: Owned 13 12.0 14.9
Finance leases 13 3.5 4.2
Profit on sale of property, plant and equipment (0.2) (0.8)
Impairment of property, plant and equipment 13 10.0 0.6
Amortisation of capitalised mobilisation cost 15 1.4 –
Negative goodwill recognised 31 (0.8) (2.6)
Hire of plant and machinery 120.2 111.3
Operating lease rentals: Land and buildings 16.4 15.0
Plant and machinery 21.8 29.4
Research and Development Expenditure Credit receivable (7.8) (8.8)
Net loss from operations related to mining (4.3) –
1 The Auditor’s remuneration relate to amounts paid to PricewaterhouseCoopers LLP. A summary of other services provided by PricewaterhouseCoopers LLP during the year is provided on page 72. An additional £1.0m was paid to PricewaterhouseCoopers LLP in respect of reporting accountant services associated with the rights issue which have been charged to the share premium account.
Kier Group plc | Report and Accounts 2019130

Kier Group plc | Report and Accounts 2019 131
5 Exceptional items and amortisation of acquired intangible assets The Directors consider that alternative performance measures referred to in these results provide useful information for readers of the accounts on the Group’s financial performance. The adjustments made to statutory loss/profit are to exclude exceptional items, which may be part of trading of the Group but are significant in size and/or nature and meet the criteria as set out on page 121, and the amortisation of acquired intangible assets.
(Loss)/profit before taxation is stated after (charging)/crediting exceptional items and amortisation of acquired intangible assets:
Continuing operations
Amortisation of acquired intangible
assets £m
Costs associated
with previous acquisitions
£m
Restructuring charges
£m
Preparation for business divestment or closure
Exceptional contract
losses Other
2019Total
£m
2018Total
£m
Revenue
Group and share of joint ventures – – – – (15.0) – (15.0) –
Less share of joint ventures – – – – – – – –
Group revenue – – – – (15.0) – (15.0) –
Cost of sales – – – (76.9) (34.3) – (111.2) (27.0)
Gross loss – – – (76.9) (49.3) – (126.2) (27.0)
Administrative expenses (24.8) (29.3) (56.4) (94.4) (0.6) (8.7) (214.2) (25.6)
Loss on disposal of joint ventures and subsidiaries – – – (0.4) – – (0.4) –
Loss from operations (24.8) (29.3) (56.4) (171.7) (49.9) (8.7) (340.8) (52.6)
Net finance charges – – – – – (1.7) (1.7) (5.1)
Loss before tax (24.8) (29.3) (56.4) (171.7) (49.9) (10.4) (342.5) (57.7)
Associated tax credit 4.1 4.8 9.2 28.0 8.2 1.6 55.9 10.7
Charged against profit for the year (20.7) (24.5) (47.2) (143.7) (41.7) (8.8) (286.6) (47.0)
Amortisation of acquired intangible assets Amortisation of intangible assets before tax is £24.8m (2018: £25.6m).
Costs associated with previous acquisitions
2019
£m2018
£m
Impairment of McNicholas assets included at acquisition1 (21.5) –
Integration costs relating to the McNicholas acquisition2 (11.8) –
Release of deferred and contingent consideration3 4.0 –
Total charge before tax (29.3) –
1 A provision against WIP acquired with McNicholas in respect of a major customer contract. The charge is considered to be exceptional on the basis of its size and the fact that these assets were acquired, as a result of which the associated income has never been recorded by the Group.
2 Costs incurred to integrate the McNicholas acquisition into the Utilities business including significant double-running of people and lease costs. These are considered to be exceptional on the basis of their size, the fact that they relate to a recent major acquisition and that the integration is now substantially complete.
3 The Group has released contingent consideration relating to the McNicholas acquisition which is not payable.
Restructuring charges The Group has incurred significant restructuring charges relating to costs of organisational change associated with the Group’s Future Proofing Kier project and, latterly, the Group’s Strategic Review programme announced following the appointment of Andrew Davies as CEO. These are discussed further in the Financial Review. These are considered to be exceptional on the basis of their size and the fact that they relate to major restructuring activities.
2019
£m2018
£m
Future Proofing Kier redundancies1 (20.0) –
Strategic headcount reductions2 (18.7) –
Professional advisor fees associated with restructuring programme (9.7)Costs incurred implementing non-people initiatives3 (8.0) –
Total charge before tax (56.4) –
1 Costs in respect of roles made redundant as a result of the Future Proofing Kier project. 2 Redundancy costs arising from strategic decisions taken to reduce headcount in a number of the Group’s principal operating divisions following the
announcement of the strategic review. 3 The Group incurred various costs in running the restructuring activities during the year. These include the incremental costs of teams involved in the
management of the restructuring activities, costs incurred implementing non-people initiatives and certain external fees.
Due to the substantial nature of the project and the fact that, as previously communicated, a further 550 heads are expected to leave the business by the end of FY2020, the Group expects to incur further redundancy costs in the coming financial year.
Kier Group plc | Report and Accounts 2019 131
STRATEGIC REPORT GOVERNANCE FINANCIAL STATEMENTS

Financial Statements Notes to the consolidated financial statements / continued For the year ended 30 June 2019
132 Kier Group plc | Report and Accounts 2019
5 Exceptional items and amortisation of acquired intangible assets continued
Costs incurred in the disposal of operations or in preparation for business divestment or closure The Group has incurred various charges driven by the change in strategic direction of the Group and the decision to exit certain divisions deemed non-core to its ongoing operations. Most of these charges are non-cash and are considered to be exceptional on the basis that they relate to a major restructuring of the Group following the Strategic Review that took place earlier this year.
2019 £m
2018£m
Impairment of residential development sites1 (50.0) –
Impairment of Developments & Housing goodwill and other assets2 (47.8) –
Environmental Waste contract termination provision3 (26.8) –
Facilities Management exit costs, abandonment of software and onerous contracts4 (23.1) –
Abandonment of ERP computer software5 (7.3) –
Fair value adjustment of disposal group – note 21 (8.4) –
Loss on disposal of subsidiaries, joint-ventures and other assets, with associated fees6 (8.3) –
Total charge before tax (171.7) –
1 This impairment charge has been triggered by the Group’s decision to dispose of its Residential division and the subsequent decision to sell certain mothballed land banks. Previously the Group had intended to develop these sites and had therefore maintained a carrying value of these assets above their market valuations at £60.0m, on a development value basis.
2 During the year, the Directors assessed the recoverability of assets within the Developments & Housing CGU. A non-cash impairment of goodwill (£8.0m) and other assets (£39.8m) has been triggered by the impairment of the Developments & Housing CGU following the decision to dispose of various non-core divisions. See notes 12 and 13.
3 In securing the termination of its largest loss-making environmental waste contract, the Group has agreed to pay the local authority £27.3m over a period of six years. The Group agreed to this payment to help it exit the Environmental business by reducing a significant future central overhead that would have otherwise still been needed to service the loss-making contract.
4 Following the announcement of the Group’s intention to exit the Facilities Management division, a number of charges have been recognised. These include costs incurred in exiting contracts (£9.6m) and contract exit charges (£3.6m). In addition, a disposal of software (£5.5m) has also been incurred as a result of the decision to abandon some functionality of certain assets following the announcement of the intention to exit the division and an onerous contract (£4.4m) has been recognised in respect of a vacated property.
5 £7.3m net book value has been disposed of due to software functionality which will no longer be utilised within the Group. 6 Comprises advisers fees associated with divestments along with the loss on disposal of Unity (£1.9m), gain on disposal of the Group’s pension administration
business (£2.5m), loss on disposal of KHSA Limited (£1.4m) and loss on disposal of Living’s shared equity portfolio (£1.3m).
Exceptional contract loss The Group has incurred significant losses of £43.5m relating to the Broadmoor Hospital development project in respect of future recoveries of costs from the client and other third parties. The loss is split between revenue (£15.0m) and cost of sales (£28.5m).
The Group has incurred significant charges in relation to the completion of the Mersey Gateway project, for which an exceptional charge of £27.0m was incurred in the year ended 30 June 2018, with further costs of £6.4m incurred in the current year.
The charges in relation to Broadmoor and Mersey Gateway have been classified as exceptional items on the basis of the highly material size of the charges incurred in the current and prior years. In the view of the Directors, both of these contract losses are also considered exceptional on the basis that they arose from contractual arrangements that would not typically be agreed to by the respective businesses.
Other exceptional items Other exceptional items are analysed below:
2019
£m 2018
£m
Procurement charge1 (16.1) –
PIE pension gain – note 8 16.1 –
GMP Pension charge – note 8 (6.1) –
External fees2 (2.6) –
Net financing costs3 (1.7) (5.1)
Total charge before tax (10.4) (5.1)
1 The Group has incurred a charge in relation to certain aged procurement recoveries that have been written off as a result of changes in the Group’s commercial landscape over the course of the financial year. The charge is deemed exceptional on the basis of its size. None of the associated income was recognised during this financial year.
2 External fees include £1.5m in relation to the pension increase exchange gain and £1.1m of other fees. 3 Net financial costs relate to discount unwinding of acquired intangible assets and other exceptional provisions.
Kier Group plc | Report and Accounts 2019132

Kier Group plc | Report and Accounts 2019 133
As a result of the Group’s change in its Alternative Performance Measure, a review of the comparative year has been conducted to align to the revised presentation. A reconciliation from the reported results in the 30 June 2018 Annual Report to the revised comparative amounts is as follows:
Continuing Operations
Previously reported
underlying£m
Mining1
£m
Mersey Gateway2
£m
Profit before exceptional
items£m
Previously reported
non-underlying
£m Mining1
£m
Mersey Gateway2
£m
Exceptional items
£m
Revenue
Group and share of joint ventures 4,493.3 19.5 – 4,512.8 19.5 (19.5) – –Less share of joint ventures (273.2) – – (273.2) – – – –
Group revenue 4,220.1 19.5 – 4,239.6 19.5 (19.5) – –Cost of sales (3,818.2) (19.5) 27.0 (3,810.7) (19.5) 19.5 (27.0) (27.0)
Gross profit/(loss) 401.9 – 27.0 428.9 – – (27.0) (27.0)Administrative expenses (288.1) – – (288.1) (25.6) – – (25.6)Share of post-tax results of joint ventures 42.7 – – 42.7 – – – –(Loss)/profit on disposal of joint ventures and subsidiaries 3.5 – – 3.5 – – – –
Profit/(loss) from operations 160.0 – 27.0 187.0 (25.6) – (27.0) (52.6)Finance income 0.9 – – 0.9 – – – –Finance cost (24.0) – – (24.0) (5.1) – – (5.1)
Profit/(loss) before tax 136.9 – 27.0 163.9 (30.7) – (27.0) (57.7)Taxation (23.3) – (5.1) (28.4) 5.6 – 5.1 10.7
Profit/(loss) for the year from continuing operations 113.6 – 21.9 135.5 (25.1) – (21.9) (47.0)
1 The results from the mining operations were previously disclosed as non-underlying. They do not meet the definition for exceptional items and therefore have been re-presented within profit before exceptional items and amortisation of acquired intangible assets.
2 A material charge of £27.0m in relation to the Mersey Gateway project within the Infrastructure division has been identified as meeting the revised exceptional classification.
Kier Group plc | Report and Accounts 2019 133
STRATEGIC REPORT GOVERNANCE FINANCIAL STATEMENTS

Financial Statements Notes to the consolidated financial statements / continued For the year ended 30 June 2019
134 Kier Group plc | Report and Accounts 2019
6 Finance income and costs 2019 2018
Before exceptional
items £m
Exceptional items1
£mTotal
£m
Before exceptional
items £m
Exceptional items1
£m Total
£m
Finance income
Interest receivable on bank deposits 0.1 – 0.1 0.2 – 0.2
Interest receivable on loans to joint ventures – – – 0.7 – 0.7
Interest receivable on corporation tax 0.1 – 0.1 – – –
0.2 – 0.2 0.9 – 0.9
Finance costs
Interest payable and fees on bank overdrafts and loans (3.3) – (3.3) (2.5) – (2.5)
Interest payable on borrowings (21.5) – (21.5) (17.4) (1.4) (18.8)
Interest payable on finance leases (0.2) – (0.2) (0.4) – (0.4)
Discount unwind (2.3) (1.7) (4.0) (1.5) (3.7) (5.2)
Net interest on net defined benefit obligation 0.6 – 0.6 (2.2) – (2.2)
Foreign exchange (losses)/gains on foreign denominated borrowings (4.3) – (4.3) 1.6 – 1.6
Fair value gains/(losses) on cash flow hedges recycled from Other Comprehensive Income 4.3 – 4.3 (1.6) – (1.6)
(26.7) (1.7) (28.4) (24.0) (5.1) (29.1)
Net finance costs (26.5) (1.7) (28.2) (23.1) (5.1) (28.2)
1 Unwind of discount in respect of deferred consideration.
7 Information relating to Directors and employees
Note 2019
No. 2018
No.
Monthly average number of people employed during the year including Executive Directors was: United Kingdom 17,092 18,064
Rest of world 1,686 2,000
18,778 20,064
£m £m
Group staff costs are as follows: United Kingdom 850.7 873.3
Rest of world 1.2 53.1
851.9 926.4
Comprising: Wages and salaries 750.8 795.9
Social security costs 73.4 76.3
Defined benefit pension scheme net (gains)/costs (2019 includes an exceptional net gain of £10.1m; 2018 includes curtailment gain of £0.3m)
8 (10.3) 3.0
Contributions to defined contribution pension schemes 8 30.8 45.8
Share-based payments charge 26 7.2 5.4
851.9 926.4
Information relating to Directors’ emoluments, pension entitlements, share options and LTIP interests appears in the Directors’ Remuneration Report on pages 78 to 97. Redundancy costs incurred during the year of £38.7m have been classed as exceptional, see note 5.
Kier Group plc | Report and Accounts 2019134

Kier Group plc | Report and Accounts 2019 135
8 Retirement benefit obligations The Group operates a number of pension schemes for eligible employees as described below.
For the defined benefit schemes, the assets of all schemes are held in trust separate from the assets of the Group. The Trustees are responsible for investing the assets and delegate day-to-day decisions to independent professional investment managers. The schemes are established under UK trust law and have a corporate trustee that is required to run the schemes in accordance with the schemes’ Trust Deed and Rules and to comply with all relevant legislation. Responsibility for the governance of the schemes lies with the Trustees.
The Group has agreed deficit recovery plans with the trustees of each of its defined benefit schemes which constitute minimum funding requirements for the purposes of IFRIC 14. These minimum funding requirements do not give rise to any additional liabilities on the Group’s balance sheet as the Group has determined that it has a right to benefit from any surplus created by overpaid contributions, through either a reduction in future contributions or refunds of the surpluses on winding up of the schemes. Details of the contributions agreed for each of the schemes are provided in the individual scheme information sections below. The majority of these deficit payment plans include lump sum contributions payable on 1 July 2020 that have been guaranteed by surety bonds.
The pension obligations of the Group are valued separately for accounting and funding purposes. The accounting valuations under IAS 19 require ‘best estimate’ assumptions to be used whereas the funding valuations use more prudent assumptions. A further difference arises from the differing dates of the valuations. The accounting pension deficit or surplus is calculated at the balance sheet date (30 June) each year, whereas the actuarial valuations are carried out on a triennial basis at 31 March. The differing bases and timings of the valuations can result in materially different pension deficit amounts. The date of the latest triennial funding valuation for each scheme is noted in the individual scheme information sections below.
On 26 October 2018, the High Court ruled in the Lloyds Banking Group case that pension schemes must equalise Guaranteed Minimum Pensions (‘GMP’) between male and female members. As a result of this ruling, amounts charged to the income statement for the year ended 30 June 2019 include a one-off exceptional charge of £6.1m in respect of GMP equalisation.
During the year, the Group launched a member options exercise, offering a Pension Increase Exchange (‘PIE’) to members of the Kier Group Pension Scheme and the Mouchel Business Services Limited Pension Scheme. The initiative was carried out with support from the Trustees of the pension schemes, in order to provide more flexibility and choice for members, reduce risk, and reduce cost in the Group’s defined benefit pension schemes. The PIE offering was introduced as follows:
› A bulk PIE exercise, offering members who are already drawing a pension a one-off increase in pension in lieu of future annual increases on part of their pension, supported with independent financial advice paid for by Kier. The terms are such that the IAS 19 pension liabilities are reduced if pensioners take this option, with the gain of £6.8m recognised as a one-off income credit recognised during the year to 30 June 2019.
› PIE option at the point of retirement as ‘business as usual’ on the same terms as the bulk exercise. Kier will pay for members to take financial advice at point of retirement, including on the PIE at retirement option. A reduction in IAS 19 pension liabilities can be recognised based on an assumed rate of future take-up. The PIE at retirement option has resulted in a further income credit of £9.3m recognised during the year to 30 June 2019.
A combined gain, for both the bulk PIE exercise and the introduction of the at retirement option, of £16.1m has been recognised as an exceptional gain in the year to 30 June 2019.
Kier is directly meeting the costs of implementing the PIE exercises and has incurred an exceptional cost of £1.5m in the year to 30 June 2019.
Kier Group scheme This is the principal scheme and includes a defined benefit section and a defined contribution section. The defined benefit section of the scheme was closed to new entrants on 1 January 2002; existing members continued to accrue benefits for service until the scheme was closed to future accrual on 28 February 2015.
The most recent triennial valuation of the Kier Group scheme was carried out by the trustees’ independent actuaries as at 31 March 2016. At the valuation date the pension scheme’s assets were less than the technical provisions and therefore the scheme was in deficit. The triennial valuation as at 31 March 2019 has not yet been finalised.
The contributions paid during the year were £12.2m (2018: £13.4m) which included contributions of £12.2m (2018: £13.1m) to fund the past service deficit. In July 2017, the Group agreed a revised deficit recovery plan with the scheme’s trustees. Based on this payment plan the Group expects to make the following contributions over the next five years:
2020 £m
20211 £m
2022 £m
2023 £m
2024£m
Deficit contributions 12.4 29.2 16.5 6.9 –
1. The contributions for the year ended 30 June 2021 include a one-off lump sum payment of £13.4m, which is guaranteed by a third-party surety bond.
In addition to the above contributions, the Group has agreed to meet the scheme’s expenses including the Pension Protection Fund levy.
As at 30 June 2019 the scheme had 381 employed deferred members (2018: 443), 2,199 deferred members (2018: 2,271) and 2,836 retirees (2018: 2,805).
The IAS 19 accounting valuation of the Kier Group scheme at 30 June 2019 indicated that the scheme’s assets exceeded its liabilities. The Group has recognised the surplus as a retirement benefit pension asset on its balance sheet under IAS 19 and IFRIC 14, as the Group has determined that it has a right to benefit from any surplus, through either reduced contributions or a refund of the surplus on winding up of the scheme.
Kier Group plc | Report and Accounts 2019 135
STRATEGIC REPORT GOVERNANCE FINANCIAL STATEMENTS

Financial Statements Notes to the consolidated financial statements / continued For the year ended 30 June 2019
136 Kier Group plc | Report and Accounts 2019
8 Retirement benefit obligations continued
Other defined benefit schemes Acquired with the May Gurney Group The May Gurney defined benefit scheme was acquired with May Gurney in the year to 30 June 2014 and is closed to future accrual. The most recent triennial valuation of the May Gurney scheme was carried out by the trustees’ independent actuaries as at 31 March 2017. At the valuation date the pension scheme’s assets were less than the technical provisions and therefore the scheme was in deficit.
The deficit contributions payable in the year ended 30 June 2019 amounted to £1.8m (2018: £2.4m). In June 2018, the Group agreed a revised deficit recovery plan with the trustees of the May Gurney scheme. Based on this payment plan the Group expects to make the following contributions over the next five years:
2020 £m
20211 £m
2022 £m
2023 £m
2024£m
Deficit contributions 2.0 11.8 – – –
1 The contributions for the year ended 30 June 2021 include a one-off lump sum payment of £3.0m, which is guaranteed by a third-party surety bond.
In addition to the above contributions, the Group has agreed to meet the scheme’s expenses including the Pension Protection Fund levy.
As at 30 June 2019, the scheme had 316 deferred members (2018: 340) and 280 retirees (2018: 278).
The IAS 19 accounting valuation of the May Gurney scheme at 30 June 2019 indicated that the scheme’s assets exceeded its liabilities. The Group has recognised the surplus as a retirement benefit pension asset on its balance sheet under IAS 19 and IFRIC 14, as the Group has determined that it has a right to benefit from any surplus, through either reduced contributions or a refund of the surplus on winding up of the scheme.
Acquired with the Mouchel Group The Group acquired four defined benefit pension schemes with the Mouchel Group. The Mouchel figures comprise four individual pension schemes, Mouchel Superannuation Fund, Mouchel Staff Pension Scheme, Mouchel Business Services Limited Pension Scheme (Final Salary Section) and EM Highways Prudential Platinum Scheme, which have been grouped together because they were purchased as part of the Mouchel Group. The composition of these schemes has not changed since the prior year.
These schemes were closed to new entrants in 2001 and were closed to future accrual between 2010 and 2017, with the exception of a single ‘public sector comparable’ scheme which remains open to future accrual.
The EM Highways Prudential Platinum Scheme is a multi-employer scheme, however, Kier’s share is separately identifiable. Therefore, the charge for the period is determined by reference to the change in valuation of this separate section.
The Mouchel schemes were formally valued by the trustees’ independent actuaries as at 31 March 2016. At the valuation date the assets of each of the pension schemes were less than the respective technical provisions for each scheme and therefore the schemes were in deficit. The triennial valuation as at 31 March 2019 has not yet been finalised.
The contributions payable in the year ended 30 June 2019 amounted to £9.0m (2018: £9.2m) which included contributions of £8.6m (2018: £8.3m) to fund the past service deficit. In September 2017, the Group agreed a revised deficit recovery plan with the trustees of the Mouchel schemes. Based on this payment plan the Group expects to make the following combined contributions over the next five years:
2020 £m
20211 £m
2022 £m
2023 £m
2024£m
Deficit contributions 9.3 22.5 15.7 17.1 16.1
1 The contributions for the year ended 30 June 2021 include one-off lump sum payments for each of the three principal Mouchel schemes totalling £9.6m, which are guaranteed by third-party surety bonds.
In addition to the above contributions, the Group has agreed to meet the scheme’s expenses including the Pension Protection Fund levy.
As at 30 June 2019, the schemes had a total of 13 active members (2018: 18), 69 employed deferred members (2018: 82), 1,770 deferred members (2018: 1,837) and 1,546 retirees (2018: 1,491).
The IAS 19 accounting valuation at 30 June 2018 of the Mouchel Business Services Limited Pension Scheme (Final Salary Section) and EM Highways Prudential Platinum Scheme indicated that the assets of each of these schemes exceeded their respective scheme liabilities. The Group has recognised these surpluses as retirement benefit assets on its balance sheet under IAS 19 and IFRIC 14, as the Group has determined that it has a right to benefit from any surplus, through either reduced contributions or a refund of the surpluses on winding up of the schemes.
Kier Group plc | Report and Accounts 2019136

Kier Group plc | Report and Accounts 2019 137
Acquired with the McNicholas Group The McNicholas defined benefit pension scheme was acquired with the McNicholas Group in the year ended 30 June 2018. The scheme is closed to new entrants and no benefits have accrued since 30 April 2012.
The most recent triennial valuation of the McNicholas scheme was carried out by the trustees’ independent actuaries as at 31 March 2017.
The deficit contributions payable in the year ended 30 June 2019 amounted to £1.2m (2018: £1.6m). In June 2018, the Group agreed a revised deficit recovery plan with the trustees of the McNicholas scheme. Based on this payment plan the Group expects to make the following contributions over the next five years:
2020 £m
2021 £m
2022 £m
2023 £m
2024£m
Deficit contributions 1.2 1.2 1.0 – –
In addition to the above contributions, all of the scheme’s expenses including the Pension Protection Fund levy are met by the Group.
As at 30 June 2019, the scheme had a total of 62 deferred members (2018: 65) and 79 retirees (2018: 78).
Other defined contribution schemes Contributions are also made to a number of other defined contribution arrangements. The Group paid contributions of £30.8m (2018: £45.8m) during the year to these arrangements.
The Group also makes contributions to local government defined benefit pension schemes in respect of certain employees who have transferred to the Group under TUPE transfer arrangements. The Group is unable to identify its share of the underlying assets and liabilities in the schemes on a consistent and reasonable basis and consequently the pension costs for these schemes are treated as if they were defined contribution schemes.
IAS 19 ‘Employee Benefits’ disclosures The Group recognises any actuarial gains or losses through the statement of comprehensive income as required under IAS 19.
The average weighted duration of the schemes’ liabilities is 20 years (2018: 20 years).
The principal assumptions used by the independent qualified actuaries are shown below. This set of assumptions was used to value all of the defined benefit schemes.
2019 %
2018 %
Rate of increase in pensions payments liable for Limited Price Indexation: – RPI subject to a minimum of 0% and a maximum of 5% 3.0 3.0– RPI subject to a minimum of 0% and a maximum of 2.5% 2.2 2.1
Rate of general increases in pensionable salaries 3.1 3.0
Discount rate 2.3 2.8
Inflation rate (Retail Price Index (RPI)) 3.1 3.0
Inflation rate (Consumer Price Index (CPI)) 2.0 1.9
The mortality assumptions used were as follows:
2019 years
2018 years
Life expectancy for a male / female currently aged 60 – Kier Group scheme 26.8 / 28.4 27.4 / 29.0– May Gurney scheme 26.6 / 28.6 27.1 / 29.2– Mouchel schemes 26.1 / 27.9 26.5 / 28.3– McNicholas scheme 26.0 / 28.0 26.2 / 28.6
Life expectancy for a male / female member aged 60, in twenty years’ time – Kier Group scheme 28.1 / 30.3 28.8 / 30.9– May Gurney scheme 28.1 / 30.2 28.7 / 30.8– Mouchel schemes 27.5 / 29.5 28.0 / 30.0– McNicholas scheme 27.5 / 29.6 28.1 / 30.2
Kier Group plc | Report and Accounts 2019 137
STRATEGIC REPORT GOVERNANCE FINANCIAL STATEMENTS

Financial Statements Notes to the consolidated financial statements / continued For the year ended 30 June 2019
138 Kier Group plc | Report and Accounts 2019
8 Retirement benefit obligations continued
The assets, liabilities and net pension liabilities for the defined benefit arrangements are shown below. The assets are invested with professional investment managers and are measured based on quoted market valuations at the balance sheet date, except for land and property investments that are not held in unitised funds, which are valued based on the latest available professional valuation in accordance with RICS standards.
2019 2018
Kier
Group £m
May Gurney
£m Mouchel
£mMcNicholas
£mTotal
£m
KierGroup
£m
May Gurney
£m Mouchel
£m McNicholas
£mTotal
£m
Equities 472.9 18.1 91.8 – 582.8 442.6 18.4 127.8 – 588.8
Corporate bonds 369.2 – 38.6 7.9 415.7 345.6 – 36.3 8.5 390.4
Cash 64.0 3.1 113.4 0.1 180.6 56.5 0.8 30.7 0.1 88.1
Land and property – – 5.1 0.1 5.2 9.8 5.3 18.7 0.1 33.9
Absolute return 283.7 13.4 40.6 – 337.7 265.5 6.4 75.5 – 347.4
Annuity policies – 1.5 – – 1.5 – 1.4 – – 1.4
Multi-asset – 8.0 42.3 17.9 68.2 – 17.9 – 14.0 31.9
Liability-driven investments – 36.9 160.8 – 197.7 – 24.9 174.4 – 199.3
Total market value of assets 1,189.8 81.0 492.6 26.0 1,789.4 1,120.0 75.1 463.4 22.7 1,681.2
Present value of liabilities (1,150.4) (79.6) (507.2) (32.7) (1,769.9) (1,094.8) (76.2) (472.2) (30.1) (1,673.3)
Surplus/(deficit) 39.4 1.4 (14.6) (6.7) 19.5 25.2 (1.1) (8.8) (7.4) 7.9
Related deferred tax (liability)/asset (6.7) (0.2) 2.5 1.1 (3.3) (4.3) 0.2 1.5 1.3 (1.3)
Net pension asset/(liability) 32.7 1.2 (12.1) (5.6) 16.2 20.9 (0.9) (7.3) (6.1) 6.6
Kier Group plc | Report and Accounts 2019138

Kier Group plc | Report and Accounts 2019 139
Amounts recognised in the financial statements in respect of these defined benefit schemes are as follows:
2019 2018
Kier Group
£m
May Gurney
£mMouchel
£mMcNicholas
£mTotal
£m
KierGroup
£m
May Gurney
£m Mouchel
£m McNicholas
£m Total
£m
(Charged)/credited to operating profit in the income statement
Current service cost – – (0.3) – (0.3) – – (0.3) – (0.3)
Administration expenses – – – – – (0.3) (0.1) (0.4) – (0.8)
Past service gain/(cost) 10.8 (0.5) (0.2) (0.1) 10.0 – – 0.3 – 0.3
Net interest on net defined benefit obligation 0.9 – (0.1) (0.2) 0.6 (0.7) (0.1) (1.2) (0.2) (2.2)
Pension (expense)/income recognised in the income statement 11.7 (0.5) (0.6) (0.3) 10.3 (1.0) (0.2) (1.6) (0.2) (3.0)
Remeasurement in comprehensive income
Actual return in excess of that recognised in net interest 76.2 7.6 28.0 2.1 113.9 15.1 (0.8) 5.0 (0.1) 19.2
Actuarial (losses)/gains due to changes in financial assumptions (104.9) (7.7) (50.2) (3.0) (165.8) 56.8 4.0 22.6 1.6 85.0
Actuarial (losses)/gains due to changes in demographic assumptions 22.3 1.6 10.0 0.7 34.6 (26.2) 0.4 1.7 0.4 (23.7)
Actuarial (losses)/gains due to liability experience (3.3) (0.3) (2.0) – (5.6) (1.8) (1.0) 1.9 0.2 (0.7)
Total amount recognised in full (9.7) 1.2 (14.2) (0.2) (22.9) 43.9 2.6 31.2 2.1 79.8
Changes in the fair value of scheme assets
Fair value at 1 July 1,120.0 75.1 463.4 22.7 1,681.2 1,108.4 76.9 451.5 – 1,636.8
Acquired in the year – – – – – – – – 21.3 21.3
Annuity policies included – – – – – – 1.4 – – 1.4
Interest income on scheme assets 30.8 2.0 12.9 0.6 46.3 28.9 2.0 11.9 0.6 43.4
Remeasurement gains/(losses) on scheme assets 76.2 7.6 28.0 2.1 113.9 15.1 (0.8) 5.0 (0.1) 19.2
Contributions by the employer 12.2 1.8 9.0 1.2 24.2 13.4 2.4 9.2 1.6 26.6
Net benefits paid out (49.4) (5.5) (20.7) (0.6) (76.2) (45.5) (6.7) (13.8) (0.7) (66.7)
Administration expenses – – – – – (0.3) (0.1) (0.4) – (0.8)
Fair value at 30 June 1,189.8 81.0 492.6 26.0 1,789.4 1,120.0 75.1 463.4 22.7 1,681.2
Changes in the present value of the defined benefit obligation
Fair value at 1 July (1,094.8) (76.2) (472.2) (30.1) (1,673.3) (1,139.5) (82.8) (499.1) – (1,721.4)
Acquired in the year – – – – – – – – (32.2) (32.2)
Annuity policies included – – – – – – (1.4) – – (1.4)
Current service cost – – (0.3) – (0.3) – – (0.3) – (0.3)
Interest expense on scheme liabilities (29.9) (2.0) (13.0) (0.8) (45.7) (29.6) (2.1) (13.1) (0.8) (45.6)
Past service cost (including curtailment gain) 10.8 (0.5) (0.2) (0.1) 10.0 – – 0.3 – 0.3
Actuarial gains/(losses) due to changes in financial assumptions (104.9) (7.7) (50.2) (3.0) (165.8) 56.8 4.0 22.6 1.6 85.0
Actuarial (losses)/gains due to changes in demographic assumptions 22.3 1.6 10.0 0.7 34.6 (26.2) 0.4 1.7 0.4 (23.7)
Actuarial (losses)/gains due to liability experience (3.3) (0.3) (2.0) – (5.6) (1.8) (1.0) 1.9 0.2 (0.7)
Net benefits paid out 49.4 5.5 20.7 0.6 76.2 45.5 6.7 13.8 0.7 66.7
Fair value at 30 June (1,150.4) (79.6) (507.2) (32.7) (1,769.9) (1,094.8) (76.2) (472.2) (30.1) (1,673.3)
Amounts included in the balance sheet
Fair value of scheme assets 1,189.8 81.0 492.6 26.0 1,789.4 1,120.0 75.1 463.4 22.7 1,681.2
Net present value of the defined benefit obligation (1,150.4) (79.6) (507.2) (32.7) (1,769.9) (1,094.8) (76.2) (472.2) (30.1) (1,673.3)
Net surplus/(deficit) 39.4 1.4 (14.6) (6.7) 19.5 25.2 (1.1) (8.8) (7.4) 7.9
Related deferred tax (liability)/asset (6.7) (0.2) 2.5 1.1 (3.3) (4.3) 0.2 1.5 1.3 (1.3)
Net pension asset/(liability) 32.7 1.2 (12.1) (5.6) 16.2 20.9 (0.9) (7.3) (6.1) 6.6
Kier Group plc | Report and Accounts 2019 139
STRATEGIC REPORT GOVERNANCE FINANCIAL STATEMENTS

Financial Statements Notes to the consolidated financial statements / continued For the year ended 30 June 2019
140 Kier Group plc | Report and Accounts 2019
8 Retirement benefit obligations continued The net surplus/(deficit) above is split between retirement benefit assets and obligations in the statement of financial position as follows:
2019 2018
Kier Group
£m
May Gurney
£m Mouchel
£mMcNicholas
£mTotal
£m
KierGroup
£m
May Gurney
£mMouchel
£m McNicholas
£mTotal
£m
Retirement benefit assets 39.4 1.4 17.6 – 58.4 25.2 – 14.3 – 39.5
Retirement benefit obligation – – (32.2) (6.7) (38.9) – (1.1) (23.1) (7.4) (31.6)
Net surplus/(deficit) 39.4 1.4 (14.6) (6.7) 19.5 25.2 (1.1) (8.8) (7.4) 7.9
The movements in the net retirement benefit surplus/(deficit) are summarised as follows:
2019 2018
Kier Group
£m
May Gurney
£m Mouchel
£mMcNicholas
£mTotal
£m
KierGroup
£m
May Gurney
£mMouchel
£m McNicholas
£mTotal
£m
Opening net surplus/(deficit) 25.2 (1.1) (8.8) (7.4) 7.9 (31.1) (5.9) (47.6) – (84.6)
Acquired deficit – – – – – – – – (10.9) (10.9)
Current service cost – – (0.3) – (0.3) – – (0.3) – (0.3)
Administration expenses – – – – – (0.3) (0.1) (0.4) – (0.8)
Past service gain/(cost) 10.8 (0.5) (0.2) (0.1) 10.0 – – 0.3 – 0.3
Net interest on net defined benefit obligation 0.9 – (0.1) (0.2) 0.6 (0.7) (0.1) (1.2) (0.2) (2.2)
Contributions by the employer 12.2 1.8 9.0 1.2 24.2 13.4 2.4 9.2 1.6 26.6
Actual return in excess of that recognised in net interest 76.2 7.6 28.0 2.1 113.9 15.1 (0.8) 5.0 (0.1) 19.2
Actuarial gains/(losses) due to changes in financial assumptions (104.9) (7.7) (50.2) (3.0) (165.8) 56.8 4.0 22.6 1.6 85.0
Actuarial (losses)/gains due to changes in demographic assumptions 22.3 1.6 10.0 0.7 34.6 (26.2) 0.4 1.7 0.4 (23.7)
Actuarial (losses)/gains due to liability experience (3.3) (0.3) (2.0) – (5.6) (1.8) (1.0) 1.9 0.2 (0.7)
Net surplus/(deficit) 39.4 1.4 (14.6) (6.7) 19.5 25.2 (1.1) (8.8) (7.4) 7.9
History of experience gains and losses for defined benefit schemes in aggregate:
2019
£m2018
£m2017
£m 2016
£m 2015
£m
Fair value of scheme assets 1,789.4 1,681.2 1,636.8 1,560.6 1,342.1
Net present value of the defined benefit obligation (1,769.9) (1,673.3) (1,721.4) (1,648.4) (1,495.7)
Net surplus/(deficit) 19.5 7.9 (84.6) (87.8) (153.6)
Related deferred tax (liability)/asset (3.3) (1.3) 14.4 15.8 30.7
Net pension asset/(liability) 16.2 6.6 (70.2) (72.0) (122.9)
Difference between expected and actual return on scheme assets 113.9 19.2 71.9 210.2 66.3
Experience (losses)/gains on scheme liabilities (5.6) (0.7) 0.1 – 4.9
Risk exposure As IAS 19 actual assumptions are driven by market conditions, there is a risk that significant changes in financial market conditions could lead to volatility in the defined benefit obligation disclosed in the balance sheet from year to year. In addition, the asset position may also be volatile as it will be influenced by changes in market conditions. However, the risk of significant changes to the overall balance sheet position has been mitigated to an extent due to the asset hedging strategies in place for the schemes as described below.
The following schemes, Kier Group Pension Scheme, May Gurney Pension Scheme, Mouchel Business Services Limited Pension Scheme (Final Salary Section), Mouchel Superannuation Fund and Mouchel Staff Pension Scheme (the “Schemes”), have aligned their investments so that the liability hedging instruments are managed by BMO including cash, physical gilts, gilt repurchase agreements as well as interest and inflation swaps. In combination, this portfolio is designed to hedge the Schemes’ sensitivity to changes in interest rate and inflation by reference to 100% of the value of the technical provisions liabilities. The Kier Group Pension Scheme also has a currency hedging strategy in place with SSGA. As at 31 March 2019 (the scheme’s year end date), this hedges 50% of the Kier Group Pension Scheme’s exposure to US dollars, euros, yen and Canadian dollars for two equity managers. In addition, the scheme hedges 100% exposure to two global property and one hedge fund allocation, all denominated in US dollars.
Kier Group plc | Report and Accounts 2019140

Kier Group plc | Report and Accounts 2019 141
Pension sensitivity The following tables show the change in the net surplus or deficit arising from a change in the significant actuarial assumptions used to determine the retirement benefit obligations:
Kier Group scheme: 2019 2018
+0.25%/+1 year
£m-0.25%/-1 year
£m +0.25%/+1 year
£m-0.25%/-1 year
£mDiscount rate (+/-0.25%) 46.7 (49.6) 44.1 (46.9)Inflation rate (+/-0.25%) (45.1) 42.5 (42.9) 40.4Members assumed to be one year older/younger in age (+/-1 year) 41.2 (41.6) 36.0 (36.2)
May Gurney defined benefit scheme: 2019 2018
+0.25%/+1 year£m
-0.25%/-1 year £m
+0.25%/+1 year£m
-0.25%/-1 year £m
Discount rate (+/-0.25%) 3.4 (3.6) 3.3 (3.5)Inflation rate (+/-0.25%) (3.3) 3.1 (3.2) 3.1Members assumed to be one year older/younger in age (+/-1 year) 2.8 (2.8) 2.1 (2.5)
Mouchel defined benefit schemes: 2019 2018
+0.25%/+1 year£m
-0.25%/-1 year £m
+0.25%/+1 year£m
-0.25%/-1 year £m
Discount rate (+/-0.25%) 22.2 (23.6) 21.6 (23.0)Inflation rate (+/-0.25%) (22.7) 21.3 (22.1) 20.8Members assumed to be one year older/younger in age (+/-1 year) 17.5 (17.6) 15.2 (15.2)
McNicholas defined benefit scheme: 2019 2018
+0.25%/+1 year£m
-0.25%/-1 year £m
+0.25%/+1 year£m
-0.25%/-1 year £m
Discount rate (+/-0.25%) 1.4 (1.5) 1.3 (1.4)Inflation rate (+/-0.25%) (0.8) 0.8 (0.7) 0.7Members assumed to be one year older/younger in age (+/-1 year) 1.3 (1.3) 1.1 (1.1)
The sensitivity analyses above have been determined based on reasonably possible changes of the respective assumptions occurring at the end of the reporting period and may not be representative of the actual change, which is based on a change in a key assumption while holding all other assumptions constant. When calculating the sensitivity to the assumption, the same method used to calculate the liability recognised in the balance sheet has been applied. The methods and types of assumptions used in preparing the sensitivity analyses did not change compared with the previous year.
Kier Group plc | Report and Accounts 2019 141
STRATEGIC REPORT GOVERNANCE FINANCIAL STATEMENTS

Financial Statements Notes to the consolidated financial statements / continued For the year ended 30 June 2019
142 Kier Group plc | Report and Accounts 2019
9 Taxation (a) Recognised in the income statement
2019 2018
Before exceptional
items£m
Exceptionalitems
(note 5)1
£mTotal
£m
Before exceptional
items2 £m
Exceptional items
(note 5)1,2 £m
Total£m
Current tax expense/(credit)
UK corporation tax 2.7 – 2.7 10.5 (6.3) 4.2
Adjustments in respect of prior years 2.9 – 2.9 0.1 – 0.1
Foreign tax relief (0.3) – (0.3) (1.6) – (1.6)
5.3 – 5.3 9.0 (6.3) 2.7
Foreign tax suffered 2.4 – 2.4 2.6 – 2.6
Total current tax 7.7 – 7.7 11.6 (6.3) 5.3
Deferred tax expense/(credit)
Origination and reversal of temporary differences 17.5 (62.5) (45.0) 21.6 (4.4) 17.2
Adjustments in respect of prior years (2.3) – (2.3) (3.0) – (3.0)
Rate change effect on deferred tax (2.7) 6.6 3.9 (1.8) – (1.8)
Total deferred tax 12.5 (55.9) (43.4) 16.8 (4.4) 12.4
Total tax charge/(credit) in the income statement 20.2 (55.9) (35.7) 28.4 (10.7) 17.7
Reconciliation of effective tax rate
Profit/(loss) before tax 97.6 (342.5) (244.9) 163.9 (57.7) 106.2
Add: tax on joint ventures included above – – – 0.1 – 0.1
Adjusted profit/(loss) before tax 97.6 (342.5) (244.9) 164.0 (57.7) 106.3
Income tax at UK corporation tax rate of 19.00% (2018: 19.00%) 18.5 (65.1) (46.6) 31.1 (10.9) 20.2
Non-deductible expenses and unusable tax losses 1.7 3.2 4.9 0.7 0.1 0.8
Income not taxable (1.1) (0.7) (1.8) (0.3) – (0.3)
Effect of tax rates in foreign jurisdictions 1.3 – 1.3 1.1 – 1.1
Effect of change in UK corporation tax rate (2.6) 6.6 4.0 (1.9) 0.1 (1.8)
Share-based payment deduction 1.4 – 1.4 1.5 – 1.5
Capital gains not taxed – 0.1 0.1 (0.5) – (0.5)
Utilisation of tax losses 0.4 – 0.4 (0.3) – (0.3)
Adjustments in respect of prior years 0.6 – 0.6 (2.9) – (2.9)
Total tax (including joint ventures) 20.2 (55.9) (35.7) 28.5 (10.7) 17.8
Tax on joint ventures – – – (0.1) – (0.1)
Group tax charge/(credit) 20.2 (55.9) (35.7) 28.4 (10.7) 17.7
1 Reference to ‘Exceptional items’ includes exceptional items and amortisation of acquired intangible assets, see page 121. 2 The prior year comparative information has been re-presented to reflect the change in the Group’s Alternative Performance Measure. This has had no impact
on the statutory reported results for the year ended 30 June 2018.
Kier Group and its subsidiaries are based predominantly in the UK and are subject to UK corporation tax. However, the Group does operate and pay taxes in jurisdictions where the tax rate is higher than the UK’s statutory rate. The Group does not have an aggressive tax policy and since 1 July 2012 Kier has not entered into any tax avoidance schemes which were or should have been notified under the Disclosure of Tax Avoidance Scheme (DOTAS) rules.
The Group tax charge before exceptional items and amortisation of acquired intangible assets of £20.2m (2018: £28.4m) shown in the table above equates to an effective tax rate of 20.6% (2018: 17.3%) on adjusted profit before tax of £97.6m (2018: £164.0m). This effective rate is higher than the standard rate of corporation tax of 19.0% (2018: 19.0%) due to items shown in the table above. The non-deductible expenses included before exceptional items and amortisation of acquired intangible assets mainly relate to depreciation on non-qualifying assets.
In accordance with UK tax legislation, capital gains arising on disposal of certain investments, including some of the joint ventures disposed of during the year, are not subject to tax.
Tax relief on expenses not recognised in the income statement includes the impact of the tax deduction received in respect of the cost of shares exercised under the Group’s employee Save As You Earn Scheme and Long Term Incentive Plan.
Kier Group plc | Report and Accounts 2019142

Kier Group plc | Report and Accounts 2019 143
The Group provides for future liabilities in respect of uncertain tax positions where additional tax may become payable in future periods and such provisions are based on management’s assessment of exposure. At the balance sheet date, a deferred tax liability of £3.4m (2018: £5.5m) has been recognised in respect of uncertain tax positions.
The net charge of £0.6m (2018: £2.9m credit) in respect of prior years’ results arises from differences between the estimates of taxation included in the previous years’ financial statements and the actual tax liabilities calculated in the tax returns submitted to and agreed by HMRC.
(b) Recognised in the cash flow statement The cash flow statement shows cash received of £10.1m during the year (2018: £9.9m paid).
(c) Recognised in the statement of comprehensive income
2019
£m2018
£m
Deferred tax charge/(credit) (including effect of change in tax rate) Share of fair value movements on joint venture cash flow hedging instruments – 0.1
Fair value movements on cash flow hedging instruments 0.7 (0.3)
Actuarial (losses)/gains on defined benefit pension schemes (3.9) 13.6
Total tax (credit)/charge in the statement of comprehensive income (3.2) 13.4
(d) Factors that may affect future tax charges The deferred tax balance as at the year end has been recognised at 17.0%, which is the enacted corporation tax rate that will be effective from 1 April 2020.
(e) Tax losses At the balance sheet date, the Group has unused tax losses of £514.6m (2018: £217.4m) available for offset against future profits. A deferred tax asset has been recognised on £348.5m (2018: £39.4m) of these losses.
No deferred tax asset has been recognised in respect of the remaining losses due to the unpredictability of future profit streams against which these losses could be offset. Under present tax legislation, these losses may be carried forward indefinitely.
10 Dividends Amounts recognised as distributions to owners of the parent in the year:
2019
£m2018
£m
Final dividend for the year ended 30 June 2018 of 46.0 pence (2017: 45.0 pence) 44.7 43.7
Interim dividend for the year ended 30 June 2019 of 4.9 pence (2018: 23.0 pence) 7.9 22.4
52.6 66.1
The Group’s focus on cash generation and reducing net debt has required a suspension in dividend payments for the second half of FY2019 and the whole of FY2020. The last dividend declared was the FY2019 interim dividend of 4.9 pence per share (2018: 23.0 pence). The total dividend for the year is therefore 4.9 pence (2018: 69.0 pence). This was approved and paid before the balance sheet date.
The parent company of the Group, Kier Group plc, is a non-trading holding company which derives its distributable reserves in part from dividends received from its subsidiaries. In determining the level of dividend payable in any year, in addition to the stated policy, the Board considers a number of other factors, including the following:
› the level of distributable reserves in the parent company, Kier Group plc;
› the level of distributable reserves in Kier Group plc’s subsidiaries that are available to be distributed to Kier Group plc;
› the availability of cash resources;
› the Group’s borrowing covenants;
› future cash commitments and investment plans to support the long-term growth of the Group; and
› potential strategic opportunities under consideration.
The Board reviews the level of distributable reserves in the parent company at least twice a year ahead of announcing proposed interim and final dividends. The dividends paid out during the year total 4.9 pence per share (2018: 69.0 pence) on an earnings per share before exceptional items and amortisation of acquired intangible assets of 58.2 pence (2018: 136.8 pence), giving a dividend cover before exceptional items and amortisation of acquired intangible assets of 11.9x (2018: 2.0x).
Distributable reserves can be significantly impacted by movements in pension liabilities. The reserves of Kier Group plc are not directly affected by these movements as the pension surpluses and liabilities are on the balance sheets of a certain number of the Company’s subsidiaries. However, movements in the pension liabilities do have an effect on the level of distributable reserves in Kier Group plc’s subsidiaries that are available to be paid up to the parent. Actuarial gains only increase the distributable reserves to the extent that they represent reversals of previous actuarial losses, otherwise they are treated as unrealised and are not distributable.
Kier Group plc | Report and Accounts 2019 143
STRATEGIC REPORT GOVERNANCE FINANCIAL STATEMENTS

Financial Statements Notes to the consolidated financial statements / continued For the year ended 30 June 2019
144 Kier Group plc | Report and Accounts 2019
11 Earnings per share A reconciliation of profit and earnings per share, as reported in the income statement, to profit and earnings per share before exceptional items and amortisation of acquired intangible assets is set out below. The adjustments are made to illustrate the impact of exceptional items and amortisation of acquired intangible assets.
2019 20182
(Loss)/earnings Basic
£mDiluted
£m Basic
£m Diluted3
£m
Continuing operations
(Loss)/earnings (after tax and minority interests), being net (losses)/profits attributable to equity holders of the parent (209.6) (209.6) 88.3 88.3
Impact of exceptional items net of tax1:
Amortisation of intangible assets – net of tax credit of £4.2m (2018: £4.7m) 20.5 20.5 20.9 20.9
Acquisition discount unwind – net of tax credit of £0.3m (2018: £0.9m)4 1.4 1.4 2.8 2.8
Other exceptional items – net of tax credit of £51.4m (2018: £3.4m) 264.7 264.7 23.3 23.3
Earnings from continuing operations 77.0 77.0 135.3 135.3
Discontinued operations
Loss (after tax and non-controlling interests), being net loss attributable to equity holders of the parent – – (1.0) (1.0)
Loss from discontinued operations – – (1.0) (1.0)
Million Million Million Million
Weighted average number of shares used for earnings per share 132.2 132.2 98.9 100.0
2019 20181
(Loss)/earnings per share Basicpence
Diluted pence
Basic pence
Dilutedpence
Continuing operations
Loss/(earnings) (after tax and minority interests), being net (losses)/ profits attributable to equity holders of the parent (158.5) (158.5) 89.3 88.3
Impact of exceptional items net of tax1:
Amortisation of intangible assets 15.5 15.5 21.1 20.9
Acquisition discount unwind4 1.0 1.0 2.8 2.8
Other exceptional items 200.2 200.2 23.6 23.3
(Loss)/earnings from continuing operations 58.2 58.2 136.8 135.3
Discontinued operations
Loss (after tax and minority interests), being net profits attributable to equity holders of the parent – – (1.0) (1.0)
(Loss)/earnings from discontinued operations – – (1.0) (1.0)
Total (loss)/earnings per share
Statutory (158.5) (158.5) 88.3 87.3
Before exceptional items1 58.2 58.2 135.8 134.3
1 Reference to ‘Exceptional items’ includes exceptional items and amortisation of acquired intangible assets, see page 121. 2 Restated as a result of the rights issue which completed on 20 December 2018 and the re-presentation of the Group’s revised Alternative Performance Measure. 3 In calculating the diluted earnings per share for 2018, the weighted average number of ordinary shares used as the denominator in calculating the basic
earnings per share was adjusted by 1.1 million shares in relation to share options. No dilution was required in 2019 due to the net loss position. 4 Unwind of discount in respect of deferred consideration.
Kier Group plc | Report and Accounts 2019144

Kier Group plc | Report and Accounts 2019 145
Under the terms of a fully underwritten rights issue, ordinary shareholders of the Company on the register at the close of business on 30 November 2018 were offered 64,455,707 new ordinary shares of 1 pence each on the basis of 33 new ordinary shares for every existing 50 ordinary shares held. The new shares were fully subscribed on 20 December 2018, resulting in proceeds on issue of £249.9m, net of expenses of £13.7m that were charged against the share premium account.
In calculating the diluted earnings per share, the weighted average number of ordinary shares used as the denominator in calculating the basic earnings per share has been adjusted by 1.1 million shares in 2018 in relation to share options. Options granted to employees under the Sharesave, CSAP and LTIP schemes are considered to be potential ordinary shares. They have been included in the determination of diluted earnings per share if the required performance obligations would have been met based on the Group’s performance up to the reporting date, and to the extent to which they are dilutive. The options have not been included in the determination of basic earnings per share. Details relating to the share option schemes are set out in note 26.
12 Intangible assets
Goodwill£m
Intangible contract rights
£m
Computer software1,3
£m Total
£m
Cost At 1 July 2017 517.4 283.4 112.2 913.0Additions – 1.6 39.6 41.2Acquired 42.8 15.0 – 57.8Disposals – (25.5) – (25.5)Transfers to assets held for sale – – (0.2) (0.2)At 30 June 2018 560.2 274.5 151.6 986.3Additions – – 19.8 19.8Disposals2 (10.7) (15.1) (15.6) (41.4)Transfers to assets held for sale (4.8) – (0.8) (5.6)At 30 June 2019 544.7 259.4 155.0 959.1
Accumulated amortisation and impairment At 1 July 2017 – (92.7) (17.5) (110.2)Charge for the year – (25.6) (13.9) (39.5)Disposals – 25.5 – 25.5Transfers to assets held for sale – – 0.1 0.1At 30 June 2018 – (92.8) (31.3) (124.1)Charge for the year – (25.0) (15.3) (40.3)Disposals2 – 7.0 2.8 9.8Impairment (8.0) (0.2) (29.6) (37.8)At 30 June 2019 (8.0) (111.0) (73.4) (192.4)
Net book value
At 30 June 2019 536.7 148.4 81.6 766.7At 30 June 2018 560.2 181.7 120.3 862.2
1 Computer software mainly relates to the Group’s ERP implementation which is now complete and being amortised. 2 Included within disposals is the abandonment of software no longer utilised. The Directors have concluded that some functionality built in the ERP will not be
utilised and derecognised £7.3m of net book value in the year. A further £5.5m of Facilities Management software has been derecognised following the announcement of the intention to exit the division.
3 Included within computer software is £3.9m of assets under construction which have not started to be amortised (2018: £10.2m).
Kier Group plc | Report and Accounts 2019 145
STRATEGIC REPORT GOVERNANCE FINANCIAL STATEMENTS

Financial Statements Notes to the consolidated financial statements / continued For the year ended 30 June 2019
146 Kier Group plc | Report and Accounts 2019
12 Intangible assets continued
Goodwill largely relates to the Infrastructure Services cash generating unit (“CGU”) and has been built up through acquisitions, primarily MRBL Limited (Mouchel Group) (£299.2m), May Gurney Integrated Services PLC (£194.7m) and McNicholas Construction Holdings Limited (£42.8m). These balances have been subject to an annual impairment review based upon the projected profits of each CGU. The disposal in the year relates wholly to the sale of KHSA Limited (note 31). Goodwill to the value of £4.8m in relation to Pure Recycling Warwick Limited has been transferred to assets held for sale and subsequently impaired (note 21).
The cost of contract rights relates to the acquisition of:
› North Tyneside Council – Cost £7.2m. Net book value £nil.
› Stewart Milne – Cost £1.0m. Net book value £0.3m.
› May Gurney Integrated Services plc – Cost £106.7m. Net book value £60.8m.
› MRBL Limited (Mouchel Group) – Cost £127.1m. Net book value £79.6m.
› McNicholas Construction (Holdings) Limited – Cost £12.1m. Net book value £5.2m.
› Kier Education Services Limited – Cost £2.8m. Net book value £1.1m.
› Certain business and assets of Babcock Civil Infrastructure Limited – Cost £1.6m. Net book value £1.5m.
› Solum Regeneration LLP joint venture – Cost £0.4m. Net book value £nil
› Watford Health Campus LLP joint venture – Cost £0.4m. Net book value £0.1m
The disposal of contract rights in the year relates to KHSA Limited £7.8m (note 31) and Wealden District Council £0.3m.
Contract rights on May Gurney and Mouchel are amortised on a straight-line basis over the expected total contract duration. All other contract rights are amortised on a straight-line basis over the remaining contract life.
Carrying amounts of goodwill and intangible contract rights by CGU
2019 2018
Goodwill£m
Intangible contract
rights£m
Total£m
Goodwill £m
Intangible contract
rights £m
Total£m
Infrastructure Services 516.3 146.6 662.9 527.0 178.6 705.6
Buildings 20.4 1.7 22.1 20.4 1.8 22.2
Developments & Housing – 0.1 0.1 12.8 1.3 14.1
536.7 148.4 685.1 560.2 181.7 741.9
For impairment testing purposes, the goodwill has been allocated to the above three CGUs, being the lowest level at which management monitor goodwill. Following a change in reporting structure, the Group has reallocated the carrying value of goodwill to these CGUs as disclosed in note 3. The recoverable amount of the goodwill and intangibles has been determined based on value in use calculations, which use cash flow projections based on the Group’s forecasts approved by management, covering a five-year period.
The resulting cash flows are discounted to present value, with the discount rate used in the value in use calculations based on the Group’s weighted average cost of capital, adjusted as necessary to reflect the risk associated with the assets being tested. We have applied pre-tax discount rates to the cash flows for each CGU that are derived from the Group’s weighted average cost of capital of 10.1% (2018: 8.0%).
The key assumptions in the value in use calculations are the forecast revenues and operating margins, the discount rates applied to future cash flows, the value and timing of disposal proceeds for the Living and Property businesses and the terminal growth rate assumptions applied.
Following the Strategic Review, the Directors reassessed the recoverability of the goodwill allocated to the Development & Housing CGU in light of the decision to dispose of the Living and Property businesses and concluded an impairment of £8.0m was required. A further £39.8m impairment was required to reduce a portion of the remaining assets allocated to this CGU. This resulted in additional impairments of intangible assets totalling £29.8m and of property, plant and equipment totalling £10m. These impairments have been recorded as an exceptional item.
Kier Group plc | Report and Accounts 2019146

Kier Group plc | Report and Accounts 2019 147
Infrastructure Services CGU Forecast revenue growth rates and operating profit margins are based on historical experience, adjusted for the impact of expected changes to contract portfolio and profitability and committed cost-saving initiatives. Revenue growth rates from year 4 onwards are considered reasonable in line with long term inflation expectations for the UK. Based on the value in use calculation, these assumptions detailed below derived a recoverable amount for the Infrastructure Services CGU that is £89.3m above the carrying value of CGU assets.
The Infrastructure Services CGU impairment review is sensitive to changes in the following key assumptions: discount rate, revenue growth rate, operating margin and perpetual growth rates. Management considers that a reasonably possible change in any single assumption could give rise to an impairment of the carrying value of goodwill and intangibles.
Forecast revenue growth rate ranges from 2% to 17% with higher growth noted in earlier years. A reduction of 3.8% (not reducing the growth rate below 0%) in the growth rate per year would be required for headroom to be eliminated. A 0.5% reduction in growth rate in each year would reduce headroom by £17.0m.
A terminal revenue growth rate of 2.0% has been applied into perpetuity. This would need to reduce by 1.8% to 0.2% to eliminate headroom. A 0.5% reduction in growth rate would lead to a £27.8m reduction in headroom.
Forecast operating margins range from 3.3% to 4.1%. A reduction of 1.1% in operating margins across the board would be required to eliminate headroom. A 0.5% reduction in margins would reduce headroom by £40.1m.
A fixed operating margin of 4.1% has been applied into perpetuity. A reduction of 0.7% in margin to 3.4% would be required to eliminate headroom. A 0.5% reduction in operating margin would reduce headroom by £67.8m.
The pre-tax discount rate used is 10.7%. An increase in discount rate from 10.7% to 11.6% would eliminate headroom. A 0.5% increase in discount rate would reduce headroom by £53.0m.
Buildings CGU A revenue growth rate of 2.0% and a fixed operating margin of 3.0% have been applied to the Buildings CGU cash flows into perpetuity. These assumptions are in line with current trading and current forecasts of UK GDP growth rate. The pre-tax discount rate used is 10.4%.
Based on the value in use calculation, these assumptions derived a recoverable amount for the Buildings CGU that is £446.2m above the carrying value of CGU assets.
The Buildings CGU impairment review is not sensitive to changes in any key assumption and management does not consider that any reasonably possible change in any single assumption would give rise to an impairment of the carrying value of goodwill and intangibles.
Developments & Housing CGU A revenue growth rate of 2.0% and a fixed operating margin of 2.0% have been applied to the Developments & Housing CGU cash flows into perpetuity. These assumptions are in line with current trading assumptions adjusted to reflect the impact of the divestment of the Living and Property businesses. The pre-tax discount rate used is 11.0%.
Based on the value in use calculation, these assumptions derived a recoverable amount for the Development & Housing CGU that is £47.8m below the carrying value of CGU assets and as a result an impairment has been booked against the assets of this CGU. All intangible assets directly held by the CGU have been impaired with the exception of £0.1m of intangible contract rights. Any further impairment would reduce the remaining intangible contract rights to nil and then be applied to the other assets within the CGU.
The Development & Housing CGU impairment review is sensitive to changes in the following key assumptions: discount rate, revenue growth rate, operating margin as well as to any change in the anticipated sale proceeds from or timing of the disposal of the Living and Property businesses.
In years 1 to 3 the key assumption relates to the expected timing and net sale proceeds of the Living and Property businesses, both of which are assumed to be sold in FY2020. Any change in the expected net sale proceeds from those assumed would have a pound for pound impact on the impairment value.
Forecast revenue growth rate in years 3 to 5 range from 2.0% to 9.5% and a 0.5% reduction in these growth rates each year would result in further impairment of £0.4m. A 0.5% reduction in the revenue terminal growth rate assumptions would lead to a £1.5m increase in impairment.
Operating margin in years 3 to 5 ranges from -0.2% to 2% and a 0.5% reduction in margin in each year would lead to a further £1.9m impairment. A 0.5% reduction, from 2.0% to 1.5%, in the operating margin assumed into perpetuity would result in a £6.6m increase in impairment.
A 0.5% increase in discount rate from 11.0% to 11.6% would result in a further impairment of £1.6m.
Kier Group plc | Report and Accounts 2019 147
STRATEGIC REPORT GOVERNANCE FINANCIAL STATEMENTS

Financial Statements Notes to the consolidated financial statements / continued For the year ended 30 June 2019
148 Kier Group plc | Report and Accounts 2019
13 Property, plant and equipment Land and buildings
£m
Plant and equipment4
£m
Mining asset5
£m Total
£m
Cost
At 1 July 2017 66.0 85.1 4.8 155.9Additions 9.1 13.0 – 22.1Acquired 0.5 4.5 – 5.0Disposals (1.1) (7.6) – (8.7)Currency realignment – (0.1) – (0.1)
At 30 June 2018 74.5 94.9 4.8 174.2Impact of adopting IFRS 15 (note 34) – (3.4) – (3.4)
At 1 July 2018 74.5 91.5 4.8 170.8Additions 4.5 7.1 – 11.6Disposals (12.9) (10.8) – (23.7)Transfers3 (3.9) (8.0) – (11.9)Currency realignment – 0.3 – 0.3
At 30 June 2019 62.2 80.1 4.8 147.1
Accumulated depreciation
At 1 July 2017 (16.7) (48.8) – (65.5)Charge for the year (1.3) (13.2) (4.6) (19.1)Impairment1 (0.6) – – (0.6)Acquired (0.3) (3.0) – (3.3)Disposals 1.1 4.8 – 5.9
At 30 June 2018 (17.8) (60.2) (4.6) (82.6)Impact of adopting IFRS 15 (note 34) – 0.6 – 0.6
At 1 July 2018 (17.8) (59.6) (4.6) (82.0)Charge for the year (2.2) (13.1) (0.2) (15.5)Impairment2 (4.1) (5.9) – (10.0)Disposals 7.3 5.9 – 13.2Transfers3 (2.1) 6.8 – 4.7Currency realignment – (0.2) – (0.2)
At 30 June 2019 (18.9) (66.1) (4.8) (89.8)
Net book value
At 30 June 2019 43.3 14.0 – 57.3
At 30 June 2018 56.7 34.7 0.2 91.6
1 The £0.6m land impairment is in relation to UK Mining operations. 2 During the year, the Directors assessed the recoverability assets within the Developments & Housing CGU. An impairment of £10.0m has been triggered by
the impairment of the Developments & Housing CGU following the decision to dispose of various non-core divisions. 3 Transfers include transfers between asset classes and to assets held for sale. Total net book value of property, plant and equipment transferred to assets
held for sale was £7.2m which has subsequently been impaired to £4.8m as a fair value adjustment to the anticipated sales proceeds. 4 The net book value of plant and equipment includes an amount of £7.6m (2018: £9.7m) in respect of assets held under finance leases (see note 22). 5 The mining asset represents the stripping activity at the UK Mining operations site. The asset is depreciated over the expected useful life of the coal that
becomes more accessible as a result of the stripping activity.
Kier Group plc | Report and Accounts 2019148

Kier Group plc | Report and Accounts 2019 149
14 Investments in and loans to joint ventures (a) Movements in year
2019
£m2018
£m
Investment in joint ventures At 1 July 226.1 184.4
Additions 52.0 71.5
Loan repayments (6.1) –
Disposals – (3.6)
Transferred to assets held for sale (8.4) –
Share of:
Operating profit 37.1 47.8
Finance costs (6.9) (5.0)
Taxation 0.5 (0.1)
Post-tax results of joint ventures 30.7 42.7
Dividends received (31.4) (30.5)
Return of equity (25.2) (40.6)
Items recognised directly in other comprehensive income:
Fair value movements in cash flow hedging instruments1 0.2 2.7
Deferred tax on fair value movements in cash flow hedging instruments1 – (0.5)
At 30 June 237.9 226.1
(b) Analysis of investment in and loans to joint ventures
2019
£m20182
£m
Non-current assets Property, plant and equipment 66.7 86.1
Other non-current assets 7.5 8.7
Non-current assets 74.2 94.8
Current assets Cash and trade receivables 430.3 366.4
Current assets 430.3 366.4
Total assets 504.5 461.2
Current liabilities Trade and other payables – current (61.1) (35.5)
Borrowings – current (63.6) (16.6)
Current liabilities (124.7) (52.1)
Non-current liabilities Borrowings (335.0) (352.6)
Financial instruments – (0.2)
Deferred tax liabilities (0.5) (0.5)
Non-current liabilities (335.5) (353.3)
Total liabilities (460.2) (405.4)
Net external assets 44.3 55.8
Loans provided to joint ventures 193.6 170.3
Total investments in and loans to joint ventures 237.9 226.1
1 £nil of fair value movements in cash flow hedging instruments (2018: £2.3m) and £nil of deferred tax on fair value movements in cash flow hedging instruments (2018: £0.4m) have been recycled to the income statement.
2 The comparative figures have been restated to include £68.1m of loans to joint ventures not previously disclosed within non-current borrowings and loans provided to joint ventures.
Kier Group plc | Report and Accounts 2019 149
STRATEGIC REPORT GOVERNANCE FINANCIAL STATEMENTS

Financial Statements Notes to the consolidated financial statements / continued For the year ended 30 June 2019
150 Kier Group plc | Report and Accounts 2019
14 Investments in and loans to joint ventures continued (c) Interests in joint ventures Set out below are the joint ventures of the Group as at 30 June 2019 which, in the opinion of the Directors, are material to the Group. All of the entities are private entities and therefore do not have a quoted fair value. The country of incorporation or registration is also their principal place of business. All are measured under the equity method.
Name of entity
Place of business / country of incorporation
% of ownership interest /
voting rights 2019
% of ownership interest /
voting rights 20181 Nature of relationship
Carrying amount
2019£m
Carrying amount
2018 £m
Kier Hammersmith2 England and Wales 50% / 50% 50% / 50% Property division – 8.5
Kier Reading3 England and Wales 90% / 50% 90% / 50% Property division 0.9 14.7
Kier Trade City4 England and Wales 90% / 50% 90% / 50% Property division 13.1 4.3
Kier Sydenham5 England and Wales 50% / 50% 50% / 50% Property division 0.3 11.3
Solum Regeneration6 England and Wales 50% / 50% 50% / 50% Property division 38.2 30.3
Kier Cornwall Street7 England and Wales 90% / 50% 90% / 50% Property division 14.3 13.5
Lysander Student Properties8 England and Wales 75% / 50% 75% / 50% Property division 0.3 6.6
50 Bothwell Street9 England and Wales 50% / 50% 50% / 50% Property division 5.8 5.4
Kier (Newcastle)10 England and Wales 75% / 50% 75% / 50% Property division 7.0 9.8
Kier (Southampton)11 England and Wales 75% / 50% 75% / 50% Property division 11.1 9.3
Watford Health Campus12 England and Wales 50% / 50% 50% / 50% Property division 10.2 2.0
Strawberry Percy13 England and Wales 50% / 50% 50% / 50% Property division 3.6 3.4
Kier Richmond14 England and Wales 90% / 50% 90% / 50% Property division 10.2 10.0
Dragon Lane15 England and Wales 50% / 50% 50% / 50% Property division 1.3 0.5
Kier Cross Keys16 England and Wales 90% / 50% 90% / 50% Residential division 61.4 59.7
KCK Peterborough17 England and Wales 90% / 50% 90% / 50% Residential division 6.0 6.6
Kier Sovereign LLP England and Wales 50% / 50% 50% / 50% Residential division 2.2 5.5
Notaro Kier LLP England and Wales 50% / 50% 50% / 50% Residential division 1.8 2.9
Kier Community Living18 England and Wales 69% / 50% 69% / 50% Residential division 37.2 10.5
Immaterial joint ventures 13.0 11.3
237.9 226.1
1 Restated to correct the % of ownership interest of Kier Community Living to 69% from 50%. 2 Kier Hammersmith consists of Kier Hammersmith Holdco Limited and Kier Hammersmith Limited. 3 Kier Reading consists of Kier Reading Holdco 1 LLP, Kier Reading Holdco 2 LLP and Kier Reading LLP. 4 Kier Trade City consists of Kier Trade City Holdco 1 LLP, Kier Trade City Holdco 2 LLP and Kier Trade City LLP. 5 Kier Sydenham consists of Kier Sydenham GP Holdco Limited, Kier Sydenham GP Limited, Kier Sydenham LP and Kier Sydenham Nominee Limited. 6 Solum Regeneration consists of Solum Regeneration Bishops LLP, Solum Regeneration (Epsom) Limited Partnership, Solum Regeneration (Guildford) LLP,
Solum Regeneration (Haywards) LLP, Solum Regeneration (Kingswood) LLP, Solum Regeneration (Maidstone) LLP, Solum Regeneration (Redhill) LLP, Solum Regeneration (Surbiton) LLP, Solum Regeneration (Twickenham) LLP, Solum Regeneration (Walthamstow) LLP, Solum Regeneration Epsom (GP Subsidiary) Limited, Solum Regeneration Epsom (GP) Limited, Solum Regeneration Epsom (Residential) LLP, Solum Regeneration Holding 1 LLP and Solum Regeneration Holding 2 LLP.
7 Kier Cornwall Street consists of Kier Cornwall Street Holdings 1 LLP, Kier Cornwall Street Holdings 2 LLP and Kier Cornwall Street LLP. 8 Lysander Student Properties consists of Lysander Student Properties Investments Limited, Lysander Student Properties Limited and Lysander Student
Properties Operations Limited. 9 50 Bothwell Street consists of 50 Bothwell Street Holdco 1 LLP, 50 Bothwell Street Holdco 2 LLP and 50 Bothwell Street LLP. 10 Kier (Newcastle) consists of Kier (Newcastle) Investment Limited, Kier (Newcastle) Operation Limited and Magnetic Limited. 11 Kier (Southampton) consists of Kier (Southampton) Development Limited, Kier (Southampton) Investment Limited and Kier (Southampton) Operations Limited. 12 Watford Health Campus consists of Watford Health Campus Limited, Watford Health Campus Partnership LLP, Watford Waterside 1 LLP and Watford
Woodlands LLP. 13 Strawberry Percy consists of Strawberry Percy Holdings 1 LLP, Strawberry Percy Holdings 2 LLP and Strawberry Percy LLP. 14 Kier Richmond consists of Kier Richmond Holdings Limited and Kier Richmond Limited. 15 Dragon Lane consists of Dragon Lane Holdings 1 LLP, Dragon Lane Holdings 2 LLP and Dragon Lane LLP. 16 Kier Cross Keys consists of Kier Cross Keys Holdco 1 LLP, Kier Cross Keys Holdco 2 LLP and Kier Cross Keys Dev LLP. 17 KCK Peterborough consists of KCK Peterborough Devco LLP, KCK Peterborough Holdco 1 LLP and KCK Peterborough Holdco 2 LLP. 18 Kier Community Living consists of Kier Community Living Holdco 1 LLP, Kier Community Living Holdco 2 LLP, Kier Community Living LLP, Kier Community Living
Topco 1 LLP and Kier Community Living Topco 2 LLP.
Kier Group plc | Report and Accounts 2019150

Kier Group plc | Report and Accounts 2019 151
(d) Borrowing facilities and guarantees to joint ventures The Group has provided guarantees to support borrowing facilities of joint ventures as follows:
2019 2018
Borrowing facility
£mGuarantees
£m
Drawnat 30 June
£m
Borrowing facility
£m Guarantees
£m
Drawnat 30 June
£m
Kier Sydenham LP – – – 43.2 7.5 43.2
Kier Hammersmith Limited 24.5 1.0 24.5 24.1 24.1 24.1
Kier Trade City LLP 32.5 6.3 16.6 12.2 3.6 3.6
Tri-Link 140 LLP 5.5 4.7 4.7 5.5 5.5 4.7
50 Bothwell Street LLP 16.5 16.5 16.5 16.5 16.5 16.5
Solum Regeneration (Walthamstow) LLP – – – 20.9 3.8 5.0
Solum Regeneration (Twickenham) LLP 38.2 9.5 23.6 38.2 4.8 3.7
Watford Woodlands LLP 13.7 1.5 3.3 13.7 1.5 0.4
Black Rock Devco LLP – – – 4.6 3.4 0.9
KCK Peterborough Devco LLP – – – 6.7 2.0 1.2
130.9 39.5 89.2 185.6 72.7 103.3
Other than as disclosed above the liabilities of the joint ventures are without recourse to the Group. Details of the Group’s interests in joint ventures are given in note 32.
Kier Group plc | Report and Accounts 2019 151
STRATEGIC REPORT GOVERNANCE FINANCIAL STATEMENTS

Financial Statements Notes to the consolidated financial statements / continued For the year ended 30 June 2019
152 Kier Group plc | Report and Accounts 2019
14 Investments in and loans to joint ventures continued (e) Summarised financial information for joint ventures The tables below provide summarised financial information for those joint ventures that are material to the Group. The information disclosed reflects the amounts presented in the financial statements of the relevant joint ventures and not the Group’s share of those amounts. They have been amended to reflect adjustments made by the entity when using the equity method, including fair value adjustments and modifications for differences in accounting policy.
Kier Hammersmith Kier Reading Kier Trade City Kier Sydenham
Summarised balance sheet 20191
£m 2018
£m2019
£m2018
£m2019
£m2018
£m 2019
£m2018
£m
Current assets
Cash and cash equivalents – 0.4 – 1.2 – 0.4 – 1.2
Other current assets – – 2.5 15.4 33.1 9.2 0.9 0.8
Current assets – 0.4 2.5 16.6 33.1 9.6 0.9 2.0
Non-current assets – 42.3 – – – – – 66.2
Current liabilities
Financial liabilities (excluding trade payables) – (23.8) – – (16.6) (3.6) – (0.9)
Other current liabilities – (2.0) (1.5) (0.3) (1.7) (1.2) (0.3) (2.4)
Total current liabilities – (25.8) (1.5) (0.3) (18.3) (4.8) (0.3) (3.3)
Non-current liabilities
Financial liabilities (excluding trade payables) – – – – – – – (42.3)
Other non-current liabilities – – – – (0.2) – – –
Total non-current liabilities – – – – (0.2) – – (42.3)
Net assets – 16.9 1.0 16.3 14.6 4.8 0.6 22.6
Reconciliation to carrying amounts: Net assets at 1 July 16.9 18.0 16.3 20.9 4.8 13.7 22.6 20.9Capital introduced – – – – 9.3 4.8 – –(Loss)/profit for the year (0.1) (1.1) 6.5 1.9 0.5 11.2 (1.4) 2.4Other comprehensive income – – – – – – 0.4 0.5Return of equity – – (11.7) (5.0) – (11.7) (14.0) –Dividends paid – – (10.1) (1.5) – (13.2) (7.0) (1.2)Transferred to assets held for sale (16.8) – – – – – – –Net assets at 30 June – 16.9 1.0 16.3 14.6 4.8 0.6 22.6
Group’s share (%) 50% 50% 90% 90% 90% 90% 50% 50%Group’s share – 8.5 0.9 14.7 13.1 4.3 0.3 11.3Fair value adjustment – – – – – – – –Investment in joint venture – 8.5 0.9 14.7 13.1 4.3 0.3 11.3 Summarised income statement Revenue 0.4 0.3 26.1 30.3 – 29.6 67.3 3.6Finance income – – – – – – – –Depreciation and amortisation – – – – – – – –Finance costs (0.4) (0.8) – – – – (1.0) (1.9)Taxation – – – – – – – –
(Loss)/profit for the year from continuing operations (0.1) (1.1) 6.5 1.9 0.5 11.2 (1.4) 2.4
Profit/(loss) for the year from discontinued operations – – – – – – – – (Loss)/profit for the year (0.1) (1.1) 6.5 1.9 0.5 11.2 (1.4) 2.4Other comprehensive income – – – – – – 0.4 0.5Total comprehensive (expense)/income (0.1) (1.1) 6.5 1.9 0.5 11.2 (1.0) 2.9 Dividends received from joint ventures – – 9.1 1.4 – 11.9 3.5 0.61. The Group’s investment in its joint venture interest in Kier Hammersmith has been classified as held for sale.
Kier Group plc | Report and Accounts 2019152

Kier Group plc | Report and Accounts 2019 153
Solum Regeneration Kier Cornwall StreetLysander Student
Properties 50 Bothwell Street
2019
£m2018
£m2019
£m2018
£m2019
£m 2018
£m 2019
£m2018
£m
Current assets
Cash and cash equivalents 4.5 0.2 3.1 1.2 0.3 0.6 1.0 2.0
Other current assets 112.6 71.1 39.1 40.4 0.9 – 3.6 0.9
Current assets 117.1 71.3 42.2 41.6 1.2 0.6 4.6 2.9
Non-current assets – – – – – 22.8 24.5 24.7
Current liabilities
Financial liabilities (excluding trade payables) – – – – – – – –
Other current liabilities (18.8) (5.3) (1.3) (1.6) (0.6) (0.9) (0.3) (0.1)
Total current liabilities (18.8) (5.3) (1.3) (1.6) (0.6) (0.9) (0.3) (0.1)
Non-current liabilities
Financial liabilities (excluding trade payables) (21.8) (5.3) (25.0) (25.0) – (13.7) (17.2) (16.7)
Other non-current liabilities – – – – (0.2) – – –
Total non-current liabilities (21.8) (5.3) (25.0) (25.0) (0.2) (13.7) (17.2) (16.7)
Net assets 76.5 60.7 15.9 15.0 0.4 8.8 11.6 10.8
Reconciliation to carrying amounts:
Net assets at 1 July 60.7 30.1 15.0 – 8.8 8.4 10.8 10.0
Capital introduced 16.7 26.6 – 14.5 – – 0.7 0.3
Profit/(loss) for the year 4.8 4.0 1.0 0.5 (0.2) 0.7 (0.1) 0.5
Other comprehensive (loss)/income – – (0.1) – – – 0.2 –
Return of equity (5.7) – – – (5.1) – – –
Dividends paid – – – – (3.1) (0.3) – –
Transferred to assets held for sale – – – – – – – –
Net assets at 30 June 76.5 60.7 15.9 15.0 0.4 8.8 11.6 10.8
Group’s share (%) 50% 50% 90% 90% 75% 75% 50% 50%
Group’s share 38.2 30.3 14.3 13.5 0.3 6.6 5.8 5.4
Fair value adjustment – – – – – – – –
Investment in joint venture 38.2 30.3 14.3 13.5 0.3 6.6 5.8 5.4
Summarised income statement
Revenue 33.9 12.1 2.9 1.5 24.2 1.8 – 1.0
Finance income – – – – – – – –
Depreciation and amortisation – – – – – – – –
Finance costs – – (1.6) (0.9) (0.4) (0.5) – (0.6)
Taxation – – – – – (0.1) – –
Profit/(loss) for the year from continuing operations 4.8 4.0 1.0 0.5 (0.2) 0.7 (0.1) 0.5
Profit/(loss) for the year from discontinued operations – – – – – – – –
Profit/(loss) for the year 4.8 4.0 1.0 0.5 (0.2) 0.7 (0.1) 0.5
Other comprehensive (loss)/income – – (0.1) – – – 0.2 –
Total comprehensive income/(expense) 4.8 4.0 0.9 0.5 (0.2) 0.7 0.1 0.5
Dividends received from joint ventures – – – – 2.3 0.2 – –
Kier Group plc | Report and Accounts 2019 153
STRATEGIC REPORT GOVERNANCE FINANCIAL STATEMENTS

Financial Statements Notes to the consolidated financial statements / continued For the year ended 30 June 2019
154 Kier Group plc | Report and Accounts 2019
14 Investments in and loans to joint ventures continued Kier (Newcastle) Kier (Southampton) Watford Health Campus Strawberry Percy
2019
£m 20181
£m2019
£m2018
£m2019
£m2018
£m 2019
£m2018
£m
Current assets
Cash and cash equivalents 0.1 0.2 0.7 0.2 1.7 1.4 1.0 0.6
Other current assets 0.5 30.4 0.6 27.3 32.5 25.8 0.4 13.3
Current assets 0.6 30.6 1.3 27.5 34.2 27.2 1.4 13.9
Non-current assets 26.3 – 36.4 – – – 13.0 –
Current liabilities
Financial liabilities (excluding trade payables) – – – – – – – –
Other current liabilities (0.1) (0.7) (2.3) (1.0) (4.8) (16.7) (0.7) (0.5)
Total current liabilities (0.1) (0.7) (2.3) (1.0) (4.8) (16.7) (0.7) (0.5)
Non-current liabilities
Financial liabilities (excluding trade payables) (17.0) (16.9) (20.5) (14.0) (8.2) (6.4) (6.5) (6.5)
Other non-current liabilities (0.5) – – – (0.7) – – –
Total non-current liabilities (17.5) (16.9) (20.5) (14.0) (8.9) (6.4) (6.5) (6.5)
Net assets 9.3 13.0 14.9 12.5 20.5 4.1 7.2 6.9
Reconciliation to carrying amounts:
Net assets at 1 July 13.0 12.5 12.5 9.3 4.1 10.9 6.9 –
Capital introduced 0.6 0.3 1.0 3.2 12.8 9.5 – 6.6
(Loss)/profit for the year (4.3) 0.2 1.4 – 3.6 14.5 0.3 0.3
Other comprehensive income – – – – – – – –
Return of equity – – – – – (9.4) – –
Dividends paid – – – – – (21.4) – –
Transferred to assets held for sale – – – – – – – –
Net assets at 30 June 9.3 13.0 14.9 12.5 20.5 4.1 7.2 6.9
Group’s share (%) 75% 75% 75% 75% 50% 50% 50% 50%
Group’s share 7.0 9.8 11.1 9.3 10.2 2.0 3.6 3.4
Fair value adjustment – – – – – – – –
Investment in joint venture 7.0 9.8 11.1 9.3 10.2 2.0 3.6 3.4
Summarised income statement
Revenue 1.5 31.5 37.4 – 12.0 38.3 0.8 0.7
Finance income – – – – – – – –
Depreciation and amortisation – – – – – – – –
Finance costs (0.9) (0.7) – – – – – (0.1)
Taxation 1.0 – (0.3) – – – – –
(Loss)/profit for the year from continuing operations (4.3) 0.2 1.4 – 3.6 14.5 0.3 0.3
Profit/(loss) for the year from discontinued operations – – – – – – – –
(Loss)/profit for the year (4.3) 0.2 1.4 – 3.6 14.5 0.3 0.3
Other comprehensive income – – – – – – – –
Total comprehensive (expense)/income (4.3) 0.2 1.4 – 3.6 14.5 0.3 0.3
Dividends received from joint ventures – – – – – 10.7 – –
1 Restated financial liabilities to reflect the correct allocation between current and non-current.
Kier Group plc | Report and Accounts 2019154

Kier Group plc | Report and Accounts 2019 155
Kier Richmond Dragon Lane Kier Cross Keys KCK Peterborough
2019
£m2018
£m2019
£m2018
£m2019
£m 20181
£m 2019
£m2018
£m
Current assets
Cash and cash equivalents 0.3 – 0.9 – 9.6 5.3 – 1.6
Other current assets 22.8 22.0 2.6 1.9 130.4 160.2 6.9 5.7
Current assets 23.1 22.0 3.5 1.9 140.0 165.5 6.9 7.3
Non-current assets – – – – – – – –
Current liabilities
Financial liabilities (excluding trade payables) – – – – (68.0) (63.5) – –
Other current liabilities (1.0) (0.6) (0.8) (0.9) (9.0) (44.0) (0.3) –
Total current liabilities (1.0) (0.6) (0.8) (0.9) (77.0) (107.5) (0.3) –
Non-current liabilities
Financial liabilities (excluding trade payables) (10.8) (10.3) – – – – – –
Other non-current liabilities – – – – – – – –
Total non-current liabilities (10.8) (10.3) – – – – – –
Net assets 11.3 11.1 2.7 1.0 63.0 58.0 6.6 7.3 Reconciliation to carrying amounts:
Net assets at 1 July 11.1 – 1.0 – 58.0 43.3 7.3 5.4
Capital introduced – 10.9 – – – – – –
Profit for the year 0.3 0.2 1.7 1.0 18.5 18.0 2.9 1.9
Other comprehensive income – – – – – – – –
Return of equity – – – – – – – –
Dividends paid (0.1) – – – (13.5) (3.3) (3.6) –
Transferred to assets held for sale – – – – – – – –
Net assets at 30 June 11.3 11.1 2.7 1.0 63.0 58.0 6.6 7.3
Group’s share (%) 90% 90% 50% 50% 90% 90% 90% 90%
Group’s share 10.2 10.0 1.3 0.5 56.7 52.2 6.0 6.6
Fair value adjustment – – – – 4.7 7.5 – –
Investment in joint venture 10.2 10.0 1.3 0.5 61.4 59.7 6.0 6.6
Summarised income statement
Revenue 1.1 0.3 8.5 4.2 151.3 121.1 15.2 9.8
Finance income – – – – – – – –
Depreciation and amortisation – – – – – – – –
Finance costs – (0.1) – – (2.6) (1.8) – (0.1)
Taxation (0.1) – – – – – – –
Profit for the year from continuing operations 0.3 0.2 1.7 1.0 18.5 18.0 2.9 1.9
Profit for the year from discontinued operations – – – – –
– – –
Profit for the year 0.3 0.2 1.7 1.0 18.5 18.0 2.9 1.9
Other comprehensive income – – – – – – – –
Total comprehensive income 0.3 0.2 1.7 1.0 18.5 18.0 2.9 1.9
Dividends received from joint ventures 0.1 – – – 12.1 3.0 3.2 –
1 Restated to reflect final prior year figures for Kier Cross Keys which were not available at the time of publishing the Group’s prior year financial statements and a fair value adjustment not previously disclosed.
Kier Group plc | Report and Accounts 2019 155
STRATEGIC REPORT GOVERNANCE FINANCIAL STATEMENTS

Financial Statements Notes to the consolidated financial statements / continued For the year ended 30 June 2019
156 Kier Group plc | Report and Accounts 2019
14 Investments in and loans to joint ventures continued Kier Sovereign Notaro Kier Kier Community Living
2019
£m2018
£m2019
£m2018
£m 2019
£m20181
£m
Current assets
Cash and cash equivalents 1.1 1.3 0.2 – 14.6 7.3
Other current assets 4.9 11.9 4.4 5.9 113.9 29.1
Current assets 6.0 13.2 4.6 5.9 128.5 36.4
Non-current assets – – – – – –
Current liabilities
Financial liabilities (excluding trade payables) – – – – – –
Other current liabilities (0.5) (2.2) (0.5) (0.1) (35.8) (5.8)
Total current liabilities (0.5) (2.2) (0.5) (0.1) (35.8) (5.8)
Non-current liabilities
Financial liabilities (excluding trade payables) – – – – (35.0) (17.2)
Other non-current liabilities (1.1) – (0.4) – (7.8) –
Total non-current liabilities (1.1) – (0.4) – (42.8) (17.2)
Net assets 4.4 11.0 3.7 5.8 49.9 13.4 Reconciliation to carrying amounts:
Net assets at 1 July 11.0 – 5.8 – 13.4 –
Capital introduced 0.4 9.6 0.4 5.7 36.2 12.8
Profit for the year 2.9 1.4 1.1 0.1 0.3 0.6
Other comprehensive income – – – – – –
Return of equity (8.5) – (3.6) – – –
Dividends paid (1.4) – – – – –
Transferred to assets held for sale – – – – – –
Net assets at 30 June 4.4 11.0 3.7 5.8 49.9 13.4
Group’s share (%) 50% 50% 50% 50% 69% 69%
Group’s share 2.2 5.5 1.8 2.9 34.4 9.3
Fair value adjustment – – – – 2.8 1.2
Investment in joint venture 2.2 5.5 1.8 2.9 37.2 10.5
Summarised income statement
Revenue 19.7 8.8 6.5 0.4 44.2 5.5
Finance income – – – – – –
Depreciation and amortisation – – – – – –
Finance costs – – – – (0.4) (0.1)
Taxation – – – – – –
Profit for the year from continuing operations 2.9 1.4 1.1 0.1 0.3 0.6
Profit for the year from discontinued operations – – – – – –
Profit for the year 2.9 1.4 1.1 0.1 0.3 0.6
Other comprehensive income – – – – – –
Total comprehensive income 2.9 1.4 1.1 0.1 0.3 0.6
Dividends received from joint ventures 0.7 – – – – –
1 Restated to reflect final prior year figures for Kier Community Living which were not available at the time of publishing the Group’s prior year financial statements and a fair value adjustment not previously disclosed.
Kier Group plc | Report and Accounts 2019156

Kier Group plc | Report and Accounts 2019 157
(f) Individually immaterial joint ventures In addition to the interests in joint ventures disclosed above, the Group also has interests in a number of individually immaterial joint ventures that are accounted for using the equity method.
2019
£m20181
£m
Aggregate carrying amount of individually immaterial joint ventures 13.0 11.3
Aggregate amounts of the Group’s share of:
Profit from continuing operations (0.3) (1.3)
Post-tax profit or loss from discontinued operations – –
Other comprehensive income – 1.9
Total comprehensive income (0.3) 0.6
1 Restated to remove those joint ventures which are considered material to the Group in the current year but were not in the prior year.
(g) Impact of investments in joint ventures containing pre-emption rights In accordance with the FRC’s queries with the Group regarding its joint ventures (see note 1, page 118), the impact on the Group’s balance sheet and income statement had investments in joint ventures containing pre-emption rights been consolidated as subsidiaries, rather than being equity accounted for as joint ventures, is disclosed as follows:
2019 2018 2017As
presented £m
Impact£m
Proforma£m
As presented
£mImpact
£mProforma
£m
As presented
£m Impact
£mProforma
£m
Balance sheet
Net debt (167.2) (107.2) (274.4) (185.7) (83.7) (269.4) (110.0) (100.6) (210.6)
Net assets 519.6 26.8 546.4 601.1 14.6 615.7 511.4 10.3 521.7
Total assets 2,673.5 234.9 2,908.4 2,809.4 177.9 2,987.3 2,776.6 139.4 2,916.0
Total liabilities (2,153.9) (208.1) (2,362.0) (2,208.3) (163.2) (2,371.5) (2,265.2) (129.1) (2,394.3)
Non-controlling interests 0.5 26.8 27.3 1.7 14.8 16.5 3.0 10.3 13.3
Income statement
Group revenue2 4,136.7 224.5 4,361.2 4,239.6 220.0 4,459.6 4,111.7 135.2 4,246.9
Gross profit2 383.2 40.7 423.9 428.9 42.9 471.8 383.4 20.2 403.6
Profit from operations2 124.1 7.6 131.7 187.0 6.2 193.2 145.6 2.3 147.9
Finance costs2 (26.7) (4.6) (31.3) (24.0) (2.8) (26.8) (21.3) (0.4) (21.7)
Profit for the year – parent (209.6) – (209.6) 87.3 – 87.3 10.7 – 10.7
Profit for the year – non-controlling interests 0.4 3.0 3.4 0.2 3.4 3.6 1.1 1.9 3.0
Cash flow statement
(Decrease)/increase in cash, cash equivalents and overdraft (20.1) 11.6 (8.5) (167.4) 4.3 (163.1) 314.0 7.4 321.4
1 For 2019 and 2018 the figures presented are for continuing operations before exceptional items. For 2017 the figures presented are for continuing operations before non-underlying items.
15 Capitalised mobilisation costs
2019
£m2018
£m
At 1 July (recognised on initial application of IFRS 15) 2.4 –
Additions 2.3 –
Amortisation (1.4) –
At 30 June 3.3 –
Kier Group plc | Report and Accounts 2019 157
STRATEGIC REPORT GOVERNANCE FINANCIAL STATEMENTS

Financial Statements Notes to the consolidated financial statements / continued For the year ended 30 June 2019
158 Kier Group plc | Report and Accounts 2019
16 Deferred tax The following are the major deferred tax assets and liabilities recognised by the Group and movements thereon during the current and prior reporting year:
Intangible assets
£m
Property,plant and
equipment£m
Short-termtemporary
differences£m
Retirement benefit
obligations £m
Tax losses
£m Total
£m
At 1 July 2017 (32.5) 25.5 2.4 14.4 1.8 11.6Credited/(charged) to income statement 4.4 (5.8) (7.9) (3.9) 0.8 (12.4)Transfers (2.7) 1.0 (0.7) 1.8 4.0 3.4Credited/(charged) directly to comprehensive income – – 0.2 (13.6) – (13.4)
At 30 June 2018 (30.8) 20.7 (6.0) (1.3) 6.6 (10.8)Credited/(charged) to income statement 4.9 (1.7) 5.9 (5.9) 40.2 43.4Acquisitions and disposals 1.3 – (1.9) – – (0.6)Reserves – – – – 12.5 12.5Credited/(charged) directly to comprehensive income – – (0.7) 3.9 – 3.2
At 30 June 2019 (24.6) 19.0 (2.7) (3.3) 59.3 47.7
Deferred tax assets and liabilities are attributed to temporary differences relating to the following:
Assets Liabilities Total2019
£m 2018
£m2019
£m2018
£m 2019
£m 2018
£m
Property, plant and equipment 19.0 20.7 – – 19.0 20.7
Intangible assets – – (24.6) (30.8) (24.6) (30.8)
Retirement benefit obligations – – (3.3) (1.3) (3.3) (1.3)
Share-based payments – 0.4 – – – 0.4
Other short-term timing differences – – (2.6) (6.4) (2.6) (6.4)
Tax losses 59.2 6.6 – – 59.2 6.6
Total 78.2 27.7 (30.5) (38.5) 47.7 (10.8)
Set-off tax (30.5) (27.7) 30.5 27.7 – –
Net tax assets/(liabilities) 47.7 – – (10.8) 47.7 (10.8)
Kier Group plc | Report and Accounts 2019158

Kier Group plc | Report and Accounts 2019 159
17 Contract assets and liabilities (a) Current contract assets
(b) Non-current contract assets
(c) Current contract liabilities
2019
£m 2018
£m
At 1 July 409.6 –
Revenue recognised in the period for performance obligations satisfied in previous periods due to changes in the transaction price arising from changes in estimates of variable revenue
(42.3) –
Transfered to receivables (344.3) –
Balances removed due to business disposals (10.3) –
Balance remaining in relation to contract assets at the start of the year 12.7 –
Changes due to business combinations 9.3 –
Increase related to services provided in the year 444.0 –
At 30 June 466.0 –
2019
£m 2018
£m
At 1 July 21.1 –
Increase related to services provided in the year 4.1 –
At 30 June 25.2 –
2019
£m 2018
£m
At 1 July (195.4) –
Revenue recognised in the year that was included in contract liabilities at the beginning of the year 180.2 –
Contract liabilities repaid 0.2 –
Balances removed due to business disposals 2.5 –
Balance remaining in relation to contract liabilities at the start of the year (12.5) –
Increase due to cash received or invoices raised in the year for performance obligations not recognised in revenue
(121.5) –
At 30 June (134.0) –
Kier Group plc | Report and Accounts 2019 159
STRATEGIC REPORT GOVERNANCE FINANCIAL STATEMENTS

Financial Statements Notes to the consolidated financial statements / continued For the year ended 30 June 2019
160 Kier Group plc | Report and Accounts 2019
18 Trade and other receivables
2019
£m 2018
£m
Current: Trade receivables 153.2 198.9
Construction contract retentions 81.5 92.9
Amounts receivable from joint ventures 18.7 5.4
Other receivables 28.0 49.7
Prepayments 74.6 52.0
Accrued income 16.6 204.1
Other taxation and social security 0.3 –
372.9 603.0
Non-current: Construction contract retentions 28.9 23.1
Other receivables 0.1 26.1
29.0 49.2
19 Inventories
Ten residential development sites held in land and work in progress held for development have been impaired by £50m during the year. The impairment has been classified as an exceptional charge, see note 5.
20 Cash, cash equivalents, overdrafts and borrowings
2019
£m 2018
£m
Cash and cash equivalents – bank balances and cash in hand 311.7 330.9
Borrowings due within one year (30.3) (12.0)
Borrowings due after one year (473.6) (524.9)
Impact of cross-currency hedging 25.0 20.3
Net debt (167.2) (185.7)
Average net debt on a monthly basis was £422m (2018: £375m).
Cash and cash equivalents are subject to Group-wide cash pooling arrangements. On a gross basis, cash and cash equivalents were £1,891.6m (2018: £1,393.2m) and overdrafts were £1,579.9m (2018: £1,062.3m).
Cash and cash equivalents include £57.3m (2018: £66.2m) being the Group’s share of cash and cash equivalents held by joint operations and £43.2m (2018: £75.7m) of bank balances that are not part of the Group-wide cash pooling arrangement.
Information on borrowings is detailed in note 28.
2019
£m 2018
£m
Raw materials and consumables 18.8 17.5
Construction contracts in progress (note 34) – 105.9
Land and work in progress held for development 190.0 214.4
Other work in progress 9.1 237.2
217.9 575.0
Kier Group plc | Report and Accounts 2019160

Kier Group plc | Report and Accounts 2019 161
(a) Reconciliation of working capital between the consolidated balance sheet and consolidated cash flow statement
2019 2018
Inventories
£m
Trade and other
receivables£m
Trade and other
payables £m
Provisions£m
Inventories£m
Trade and other
receivables £m
Trade and other
payables £m
Provisions£m
30 June balance sheet 575.0 652.2 (1,551.0) (67.5) 593.9 569.3 (1,450.3) (79.3)
IFRS 15 adjustments (322.9) (171.1) 187.1 – – – – –
1 July balance sheet 252.1 481.1 (1,363.9) (67.5) 593.9 569.3 (1,450.3) (79.3)
30 June balance sheet 217.9 401.9 (1,350.5) (90.3) 575.0 652.2 (1,551.0) (67.5)
Movement per balance sheet (34.2) (79.2) 13.4 (22.8) (18.9) 82.9 (100.7) 11.8
Transfers to and from assets held for sale – (0.1) (0.3) – 0.5 0.8 (1.3) –
Impact of exceptional items 50.0 16.1 61.4 26.0 (15.0) – – (17.6)
Disposal of subsidiary – (19.2) 21.5 – – – – –
Acquisition of subsidiary (24.6) (11.0) 3.4 – – (54.3) 70.4 11.0
Discount unwind1 – – 4.0 – – – – 4.7
Other – (0.7) 0.4 – – – (0.9) –
Movement per cash flow statement (8.8) (94.1) 103.8 3.2 (33.4) 29.4 (32.5) 9.9
1 Discount unwind primarily relates to onerous loss-making contracts and deferred consideration.
(b) Reconciliation of movements in net borrowings
Cash and cash equivalents
£m
Borrowings due within one year
£m
Borrowings due after one year
£m
Impact of cross-currency hedging
£mTotal
£m
Net borrowings as at 1 July 2017 499.8 (50.0) (581.8) 21.9 (110.1)Cash flows (167.4) 50.0 43.3 – (74.1)Transfers – (12.0) 12.0 – –Foreign exchange movements (1.5) – 1.6 (1.6) (1.5)
Net borrowings as at 30 June 2018 330.9 (12.0) (524.9) 20.3 (185.7)Cash flows (20.1) 12.0 25.7 – 17.6Transfers – (30.3) 30.3 – –Foreign exchange movements 0.9 – (4.7) 4.7 0.9
Net borrowings as at 30 June 2019 311.7 (30.3) (473.6) 25.0 (167.2)
(c) Free cash flow The Group generated free cash flow in the year to 30 June 2019 of £137.3m (2018: £72.9m) representing a reduction/(increase) in net debt of £18.5m (2018: (£75.6m)) before acquisitions and disposals of £12.6m (2018: £14.4m), dividends of £54.2m (2018: £67.6m) and net investment in joint ventures and subsidiaries of £52.0m (2018: £66.5m).
Kier Group plc | Report and Accounts 2019 161
STRATEGIC REPORT GOVERNANCE FINANCIAL STATEMENTS

Financial Statements Notes to the consolidated financial statements / continued For the year ended 30 June 2019
162 Kier Group plc | Report and Accounts 2019
21 Non-current assets held for sale and discontinued operations (a) Assets held for sale In December 2018, the Group began a formal sales process to dispose of its interest in Pure Recycling Warwick Limited (‘Pure’). Heads of terms were signed in June 2019 with a view to completing the sale before the end of the next financial year. After the balance sheet date, an interested buyer was identified, and the assets were impaired to their realisable fair value, including goodwill of £4.8m – see note 33. The remaining value classified as held for sale as at 30 June 2019 is £6.2m of assets and £1.5m of liabilities.
The Group’s investment in its joint venture interest in Kier Hammersmith Limited (‘KHL’) of £8.4m has been classified as held for sale. The Group’s interest in this joint venture is being actively marketed and discussions are well advanced as at 30 June 2019. The transaction is expected to complete in the first half of the next financial year.
The Group’s investment in its joint venture interest in Strawberry Percy LLP (‘SPL’) had previously been classified as held for sale at 31 December 2018. However, the sale is no longer expected to take place therefore the assets and liabilities of SPL have not been classified as held for sale as at 30 June 2019.
During the prior year the pensions administration business was deemed non-core to the Kier Group portfolio. The Group exchanged contracts to dispose of the business on 17 September 2018 and therefore its assets and liabilities were classified as held for sale as at 30 June 2018. The disposal was completed on 31 October 2018. See note 31 to the consolidated financial statements for further details.
2019
£m 2018
£m
Assets of disposal group classified as held for sale
Intangible assets – computer software 0.5 0.1
Property, plant and equipment 4.8 –
Investments in and loans to joint ventures 8.4 –
Contract assets 0.5 –
Trade and other receivables 0.1 1.2
Corporation tax receivable 0.3 –
Total 14.6 1.3
Liabilities of disposal group classified as held for sale
Overdrafts – (2.2)
Trade and other payables (1.5) (1.2)
Total (1.5) (3.4)
Kier Group plc | Report and Accounts 2019162

Kier Group plc | Report and Accounts 2019 163
(b) Results of discontinued operations Wheldon’s (subsidiary) On 29 June 2018 the Group, through its subsidiary McNicholas Construction (Holdings) Limited, disposed of its investment in Wheldon Contracts & Services Limited (“Wheldon’s”). No gain or loss has been made regarding this disposal. Wheldon’s was acquired as part of the McNicholas acquisition and was identified as a non-core activity for disposal at that point.
The results are as follows:
2019
£m2018
£m
Results of discontinued operations Wheldon’s
Revenue – 7.3
Operating costs – (8.3)
Operating loss – (1.0)
Finance costs – –
Loss before tax – (1.0)
Tax – –
Loss for the period from discontinued operations after tax – (1.0)
Gain on sale of the subsidiary (see note 31) – –
Income tax credit on gain on sale of the subsidiary – –
Loss from discontinued operations – (1.0)
2019
£m2018
£m
Cash flows from discontinued operations Wheldon’s
Operating cash flows – (1.0)
Investing cash flows – exceptional – 0.1
Financing cash flows – –
Total cash flows – (0.9)
Kier Group plc | Report and Accounts 2019 163
STRATEGIC REPORT GOVERNANCE FINANCIAL STATEMENTS

Financial Statements Notes to the consolidated financial statements / continued For the year ended 30 June 2019
164 Kier Group plc | Report and Accounts 2019
22 Finance lease obligations 2019 2018
Future minimum
leasepayments
£mInterest
£m
Presentvalue of
minimumlease
payments£m
Future minimum
lease payments
£m Interest
£m
Presentvalue of
minimumlease
payments£m
At 1 July 7.9 (0.8) 7.1 15.2 (0.9) 14.3
New obligations 0.5 – 0.5 2.7 (0.2) 2.5
Acquired – – – 0.6 (0.1) 0.5
Repayments (5.2) 0.7 (4.5) (10.6) 0.4 (10.2)
At 30 June 3.2 (0.1) 3.1 7.9 (0.8) 7.1
Finance lease liabilities are payable as follows:
2019 2018
Future minimum
leasepayments
£mInterest
£m
Presentvalue of
minimumlease
payments£m
Future minimum
lease payments
£m Interest
£m
Presentvalue of
minimumlease
payments£m
Less than one year 1.2 (0.1) 1.1 4.4 (0.4) 4.0
Between two and five years 2.0 – 2.0 2.9 (0.3) 2.6
Over five years – – – 0.6 (0.1) 0.5
At 30 June 3.2 (0.1) 3.1 7.9 (0.8) 7.1
23 Trade and other payables
2019
£m 2018
£m
Current: Trade payables 545.9 620.5
Sub-contract retentions 45.0 61.7
Construction contract balances (note 34) – 406.8
Other taxation and social security 74.6 85.6
Deferred consideration 5.0 4.0
Other payables 98.2 39.4
Accruals 540.0 280.9
Deferred income 2.3 11.8
Payments received on account – 16.1
1,311.0 1,526.8
Non-current: Trade payables – 1.6
Sub-contract retentions 39.5 15.6
Deferred consideration – 7.0
39.5 24.2
Included within the trade and other payables balance is £170.2m (2018: £184.8m) relating to payments due to suppliers who are on bank-supported supply chain finance arrangements.
Kier Group plc | Report and Accounts 2019164

Kier Group plc | Report and Accounts 2019 165
24 Provisions
Insurance claims
£m
Restoration of mining sites
£m
HSEregulatory
£m
Onerous contracts
£m
Redundancy, site closure & dilapidations
£m
Warranty, rectification
and other contractual obligations
£mTotal
£m
At 1 July 2017 20.9 5.5 5.1 27.5 10.1 10.2 79.3
Charged/(credited) to income statement 12.8 1.7 (1.6) 1.0 (1.2) 1.8 14.5
Acquired – – – – 1.5 9.7 11.2
Utilised (13.3) (2.9) (2.5) (13.8) (6.5) (3.2) (42.2)
Unwinding of discount – – – 3.2 – 1.5 4.7
At 30 June 2018 20.4 4.3 1.0 17.9 3.9 20.0 67.5Charged/(credited) to income statement (0.7) (0.9) 0.4 19.9 39.5 4.5 62.7Acquired – – – – – – –Utilised – – – (3.0) (35.2) (2.8) (41.0)Unwinding of discount – – – 1.1 – – 1.1
At 30 June 2019 19.7 3.4 1.4 35.9 8.2 21.7 90.3
Insurance provisions are in respect of legal and other disputes in various Group companies.
Mining provisions of £3.4m (2018: £4.3m) represent the cost of restoration of opencast mining sites.
HSE regulatory provisions are in respect of potential fines arising from changes to safety, health and environmental legislation and regulation.
Onerous contracts provisions are for loss-making contracts that the Group is legally obligated to complete.
Redundancy and dilapidations provisions are in respect of office closure, and site closure provisions relate to adoption costs payable to local authorities on completion of development sites.
Warranty and rectification provisions are for potential claims against work completed by the Group, and other contractual obligations are primarily end of service costs associated with the Group’s overseas workforce and potential costs associated with purchases of land held for development.
It is anticipated that the amounts provided will be utilised as follows:
2019
£m2018
£m
Due within one year 25.0 15.4
Due after one year 65.3 52.1
90.3 67.5
Due to the nature of the provision for insurance claims, the timing of any potential future outflows in respect of these liabilities is uncertain as such they are classified as due after one year.
Future outflows in respect of other provisions are expected to occur over the next 10 years.
Kier Group plc | Report and Accounts 2019 165
STRATEGIC REPORT GOVERNANCE FINANCIAL STATEMENTS

Financial Statements Notes to the consolidated financial statements / continued For the year ended 30 June 2019
166 Kier Group plc | Report and Accounts 2019
25 Share capital and reserves
Share capital The share capital of the Company comprises:
2019 2018
Number £m Number £m
Issued and fully paid ordinary shares of 1 pence each 162,115,870 1.6 97,460,163 1.0
Under the terms of a fully underwritten rights issue, ordinary shareholders of the Company on the register at the close of business on 30 November 2018 were offered 64,455,707 new ordinary shares of 1 pence each on the basis of 33 new ordinary shares for every existing 50 ordinary shares held. The new shares were fully subscribed on 20 December 2018, resulting in proceeds on issue of £249.9m, net of expenses of £13.7m, that were charged against the share premium account.
No (2018: 17,128) shares were issued under the Sharesave Scheme (2018: premium of £0.2m).
200,000 ordinary shares were issued to the Kier Group 1999 Employee Benefit Trust – to be used to satisfy future obligations of the Company under the Kier Group plc 2010 Long Term Incentive Plan. The shares were issued at the nominal value of £0.01.
The holders of ordinary shares are entitled to receive dividends as declared from time to time and are entitled to one vote per share at meetings of the Company.
Cash flow hedge reserve This reserve comprises the effective portion of the cumulative net change in the fair value of the cash flow hedging instruments related to hedged transactions that have not yet occurred, net of any related deferred tax.
Translation reserve This reserve comprises the cumulative difference on exchange arising from the retranslation of net investments in overseas subsidiary undertakings. In accordance with the transitional provisions of IFRS 1, this reserve was set to nil at 1 July 2004.
Merger reserve The merger reserve arose on the shares issued at a premium to acquire May Gurney on 8 July 2013.
26 Share-based payments
Sharesave Scheme Options over the Company’s ordinary shares at 30 June 2019 were as follows:
Date of grant
SharesaveScheme31 Oct2015
SharesaveScheme31 Oct2016
Sharesave Scheme
1 Nov 2017
Sharesave Scheme
1 Nov 2018 Total
Awards outstanding at 30 June 2019 – Directors – – – – –– Employees1 20,156 195,172 401,888 1,362,147 1,979,363
20,156 195,172 401,888 1,362,147 1,979,363
Exercise price (pence) 1 1,127 1,135 966 757
1 Adjusted as a result of the rights issue which completed on 20 December 2018.
Options to acquire shares in the capital of Kier Group plc have been granted to eligible employees who enter into a Sharesave contract. The number of options granted to each participating employee are the number of shares which have an aggregate option price not exceeding the projected proceeds of the employee’s Sharesave contract. Participation in the Kier Sharesave scheme is offered to all employees of the Group who have been employed for a continuous period determined by the Board. Under the Sharesave contract, participating employees save a regular sum each month for three years up to a maximum of £500 per month.
2,205,158 options were granted in the year (2018: 1,306,453) under the Sharesave Scheme, which will all be equity settled. The number of options in all schemes was adjusted as a result of the rights issue which completed on 20 December 2018.
No Sharesave Scheme options were exercised during the year. The weighted average market price of Kier Group plc shares at the date of exercise of Sharesave Scheme options during the prior year was 1,238 pence.
Kier Group plc | Report and Accounts 2019166

Kier Group plc | Report and Accounts 2019 167
Conditional Share Award Plan Awards over the Company’s ordinary shares at 30 June 2019 were as follows:
Date of grant
CSAP award
23 Oct 2017
CSAP award
22 Oct2018 Total
Awards outstanding at 30 June 2019 – Directors – – –– Employees1 645,219 876,019 1,521,238
645,219 876,019 1,521,238
Exercise price (pence) nil nil
1 Adjusted as a result of the rights issue which completed on 20 December 2018.
In 2018, the Group established a conditional share award plan (CSAP) under which senior employees receive awards of shares subject only to service conditions, i.e. the requirement for participants to remain in employment with the Group over the vesting period. Participants are entitled to receive dividend equivalents on these awards. Awards under the CSAP are all equity settled. No shares have yet vested under the CSAP.
948,287 awards were granted in the year (2018: 810,637) under the CSAP. The number of awards in all schemes was adjusted as a result of the rights issue which completed on 20 December 2018.
Long Term Incentive Plan Awards over the Company’s ordinary shares at 30 June 2019 were as follows:
Date of grant
LTIP award
21 Oct2016
LTIP award
17 Nov 2017
LTIP award
22 Oct2018 Total
Awards outstanding at 30 June 2019 – Directors1 206,365 235,891 242,754 685,010– Employees1 963,787 – – 963,787
1,170,152 235,891 242,754 1,648,797
Exercise price (pence) nil nil nil
1 Adjusted as a result of the rights issue which completed on 20 December 2018.
The Group has established a Long Term Incentive Plan (LTIP) under which Directors can receive awards of shares. Senior employees also participate in LTIP awards granted before the introduction of the CSAP, which replaced the LTIP awards for senior employees who were not main board Directors. Awards made under the scheme are normally able to vest following the third anniversary of the date of the grant. Vesting may be in full or in part (with the balance of the award lapsing) and is subject to the Group achieving specific performance targets. Participants in the 2017 and 2018 schemes are entitled to receive dividend equivalents on these awards. Awards under the LTIP are all equity settled. The market price of Kier Group plc shares at the date of exercise of LTIP options during the year was 886 pence (2018: 1,078 pence).
238,558 options were granted in the year (2018: 298,426) under the LTIP. The number of awards in all schemes was adjusted as a result of the rights issue which completed on 20 December 2018.
The awards, which are taken as shares, are intended to be satisfied from shares held by the Kier Group 1999 Employee Benefit Trust and May Gurney Group Trustees Ltd Employee Share Ownership Plan Trust or from the issue of new shares. The shares held by the trusts are accounted for as a deduction from equity within retained earnings. The movements in the number and historical cost value of shares held by the trusts are as follows:
2019
2018
Numberof shares
Value £m
Numberof shares
Value£m
At 1 July 251,701 2.5 368,067 4.0
Acquired during the year 385,721 1.0 153,340 1.6
Issued in satisfaction of awards and other schemes (269,307) (1.0) (239,514) (2.8)
Issued in satisfaction of deferred bonus schemes (61,798) (0.2) (30,192) (0.3)
At 30 June 306,317 2.3 251,701 2.5
Kier Group plc | Report and Accounts 2019 167
STRATEGIC REPORT GOVERNANCE FINANCIAL STATEMENTS

Financial Statements Notes to the consolidated financial statements / continued For the year ended 30 June 2019
168 Kier Group plc | Report and Accounts 2019
26 Share-based payments continued
The market value of these shares at 30 June 2019 was £0.3m (2018: £2.4m). The dividends on these shares have been waived.
The shares acquired by the trusts in the year at a cost of nil (2018: £1.6m), net of the cash received by the trusts in respect of the deferred bonus schemes of £0.4m (2018: £0.3m), is reflected in the statement of changes in equity as a net sale of own shares of £0.4m (2018: net purchase of (£1.3m)).
Further description of the above share schemes and the terms and conditions of each scheme are included in the Directors’ Remuneration Report on pages 78 to 97.
Value of share schemes The fair value per option granted has been calculated using the following assumptions. These calculations are based on the Black-Scholes model for all options apart from the total shareholder return (TSR) element of the LTIP which is based on a Stochastic model.
Sharesave Scheme
Date of grant 31 October
201531 October
2016 1 November
2017 1 November
2018
Share price at grant (pence) 1,377 1,329 1,055 924
Exercise price (pence) – at grant 1,147 1,155 983 770
Exercise price (pence) – rights adjusted 1,127 1,135 966 757
Option life (years) 3.0 3.0 3.0 3.0
Expected volatility 22.0% 25.5% 24.9% 28.1%
Dividend yield 4.7% 4.7% 6.4% 7.3%
Risk-free interest rate 0.9% 0.3% 0.6% 0.8%
Value per option (pence) – at grant 222.6 205.8 113.1 137.0
Value per option (pence) – rights adjusted 218.8 202.2 111.1 134.6
Conditional Share Award Plan
Date of grant 23 October
2017 22 October
2018
Share price at grant (pence) 1,063 886
Exercise price (pence) nil nil
Option life (years) 3.0 3.0
Value per option (pence) – at grant 1,063.0 886.0
Value per option (pence) – rights adjusted 1,044.6 870.7
Kier Group plc | Report and Accounts 2019168

Kier Group plc | Report and Accounts 2019 169
Long Term Incentive Plan
Date of grant
21 October2016
(EPS & Net Debt:EBITDA
element)
21 October2016
(TSR element)
17 November2017
(EPS & Net Debt:EBITDA
element)
17 November 2017
(TSR element)
22 October2018
(EPS & Net Debt:EBITDA
element)
22 October2018
(TSR element)
Share price at grant (pence) 1,360 1,360 1,049 1,049 886 886
Exercise price nil nil nil nil nil nil
Option life (years) 3.0 3.0 2.9 2.9 3.0 3.0
Expected volatility n/a 26.5% n/a 27.5% n/a 25.8%
Dividend yield 4.7% 4.7% n/a n/a n/a n/a
Risk-free interest rate n/a 0.2% n/a 0.5% n/a 1.1%
Value per option (pence) – at grant 1,182.3 609.1 968.2 345.4 825.0 455.0
Value per option (pence) – rights adjusted 1,161.9 598.6 951.4 339.5 810.7 447.1
The value per option represents the fair value of the option less the consideration payable.
The fair value of the TSR element incorporates an assessment of the number of shares that will vest, as the performance conditions are market conditions under IFRS 2 ‘Share-based Payments’.
The performance conditions of the EPS and the net debt to earnings before interest, tax, depreciation and amortisation ratio (Net Debt: EBITDA) elements are non-market conditions under IFRS 2. The fair value therefore does not include an assessment of the number of shares that will vest. Instead the amount charged for this element is based on the fair value factored by a ‘true-up’ for the number of awards that are expected to vest.
The expected volatility is based on historical volatility over the last three years. The risk-free rate of return is the yield on zero-coupon UK Government bonds of a term consistent with the assumed option life.
The dividend yield does not have an impact on the fair value of the 2017 LTIP as participants are entitled to receive dividend equivalents on these awards.
An amount of £7.2m relating to share-based payments has been recognised in the income statement as employee costs (2018: £5.4m). Included in other payables is an amount of £0.1m (2018: £0.3m) relating to provisions for employer’s national insurance.
A reconciliation of option movements is shown below:
2019
2018
Numberof options
Weighted average exercise
price Number
of options
Weightedaverageexercise
price
Outstanding at 1 July 5,734,414 414.1p 5,411,912 443.7p
Granted 3,392,003 500.6p 2,415,516 531.7p
Lapsed or forfeited (3,820,997) 630.0p (1,813,933) 697.7p
Exercised (268,307) 0.0p (279,081) 161.8p
Adjustment for rights issue1 112,285 – – –
Outstanding at 30 June 5,149,398 323.0p 5,734,414 414.1p
Exercisable at 30 June 20,156 1,127.2p 1,860 1,159.0p
1 The number of options awarded to each scheme participant was adjusted as a result of the rights issue which completed on 20 December 2018.
The options outstanding at 30 June 2019 have a weighted average remaining contractual life of 1.57 years (2018: 1.45 years).
Kier Group plc | Report and Accounts 2019 169
STRATEGIC REPORT GOVERNANCE FINANCIAL STATEMENTS

Financial Statements Notes to the consolidated financial statements / continued For the year ended 30 June 2019
170 Kier Group plc | Report and Accounts 2019
27 Guarantees, contingent liabilities and contingent assets The Company has given guarantees and entered into counter-indemnities in respect of bonds relating to certain of the Group’s own contracts. The Company has also given guarantees in respect of certain contractual obligations of its subsidiaries and joint ventures, which were entered into in the normal course of business, as well as certain of the Group’s other obligations (for example, in respect of the Group’s finance facilities and its pension schemes). Financial guarantees over the obligations of the Company’s subsidiaries and joint ventures are measured at fair value. The fair value measurement is based on the premium received from the joint venture or the differential in the interest rate of the borrowing including and excluding the guarantee. Performance guarantees are treated as a contingent liability until such time as it becomes probable that payment will be required under its terms.
Provisions are made for the Directors’ best estimate of known legal claims, investigations and legal actions relating to the Group which are considered more likely than not to result in an outflow of economic benefit. If the Directors consider that a claim, investigation or action relating to the Group is unlikely to succeed, no provision is made. If the Directors cannot make a reliable estimate of a potential, material obligation, no provision is made but details of the claim are disclosed.
At 30 June 2019 the Group had contingent assets of £18.7m (on transition to IFRS 15 at 1 July 2018: £24.3m) in relation to claims against third-parties for the reimbursement of costs on construction contracts. Under IAS 37 these amounts may only be recognised when the economic benefit arising from the claims is virtually certain. It is probable that these amounts will be recognised in future periods when the uncertainty over their recoverability has been removed.
28 Financial instruments The following table summarises the Group’s financial instruments as at 30 June 2019:
2019 2018
Loans and receivables at
amortised cost, cash and cash
equivalents £m
Financial liabilities at
amortised cost £m
Derivatives £m
Loans and receivables at
amortised cost, cash and cash
equivalents £m
Financial liabilities at
amortised cost £m
Derivatives £m
Financial assets
Trade and other receivables (less prepayments)1 327.3 – – 600.3 – –
Cash and cash equivalents 311.7 – – 330.9 – –
Loans provided to joint ventures2 193.6 – – 170.3 – –
Other financial assets – – 24.1 – – 15.2
Total 832.6 – 24.1 1,101.5 – 15.2
Financial liabilities
Borrowings – (503.9) – – (536.9) –
Finance lease obligations – (3.1) – – (7.1) –
Trade and other payables3 – (1,273.6) – – (1,437.5) –
Other financial liabilities – – – – – –
Total – (1,780.6) – – (1,981.5) –
Net 832.6 (1,780.6) 24.1 1,101.5 (1,981.5) 15.2
1 The comparative figures have been restated to include £204.1m of accrued income which was previously not reported under trade and other receivables. 2 The comparative figures have been restated to include £68.1m of loans to joint ventures not previously disclosed. 3 Trade and other payables exclude other taxes and social security, deferred income and payments on account.
Capital risk management The Group’s capital management objectives are to ensure the Group’s ability to continue as a going concern and to optimise the capital structure in order to minimise the cost of capital whilst maintaining a strong balance sheet to support business development and tender qualification. The Group’s capital management strategy is to use a blend of capital types with different risk, return and maturity profiles to support the operating divisions and deliver the Group’s capital management objectives. The Group’s overall capital risk management strategy remains unchanged from 2018. The Group announced its strategic objective for the disposal of the Developments & Housing division and this will have the impact in line with its targeting objective of reducing the capital indebtedness of the Group.
The capital structure of the Group comprises: equity, consisting of share capital, share premium, retained earnings and other reserves as disclosed in the consolidated statement of changes in equity; and cash, cash equivalents and borrowings as disclosed in note 20 and described further below. The Group forecasts and monitors short, medium and longer-term capital needs on a regular basis and adjusts its capital structure as required through the payment of dividends to shareholders, the issue of new share capital and the increase or repayment of borrowings. All investment decisions are made with regard to the Group’s weighted average cost of capital and typically a pre-tax annualised return of at least 15.0% is required to ensure such investments are value enhancing for shareholders.
Kier Group plc | Report and Accounts 2019170

Kier Group plc | Report and Accounts 2019 171
Financial risk management Financial risk management is an integral part of the way the Group is managed. In the course of its business, the Group is exposed primarily to credit risk, market risk and liquidity risk. The overall aim of the Group’s financial risk management policies is to minimise any potential adverse effects on financial performance and net assets.
The Group’s treasury team manages the principal financial risks within policies and operating limits approved by the Board. The treasury function is not a profit centre and does not enter into speculative transactions. Derivative financial instruments are used to hedge exposure to fluctuations in interest and exchange rates and some commodity prices.
Credit risk Credit risk arises on financial instruments such as trade receivables, short-term bank deposits and interest rate and currency hedges.
Policies and procedures exist to ensure that customers have an appropriate credit history. The Group’s most significant clients are public or regulated industry entities which generally have high credit ratings or are of a high credit quality due to the nature of the client.
Short-term bank deposits and hedging transactions are executed only with highly credit-rated authorised counterparties based on ratings issued by the major ratings agencies. Counterparty exposure positions are monitored regularly so that credit exposures to any one counterparty are within acceptable limits. At the balance sheet date there were no significant concentrations of credit risk.
Trade and other receivables and contract assets included in the balance sheet are stated net of expected credit loss (ECL) provisions which have been calculated using a provision matrix grouping trade receivables and contract assets on the basis of their shared credit risk characteristics.
An analysis of the provision held against trade receivables is set out below:
2019
£m2018
£m
Provision as at 1 July 2.0 8.2Credited to the income statement (0.9) (0.6)Utilised in the year – (5.7)Acquired in the year – 0.6Divested in the year – (0.5)
Provision as at 30 June 1.1 2.0
There were £80.8m (2018: £73.8m) of trade receivables that were overdue at the balance sheet date that have not been provided against, of which £34.4m (2018: £29.5m) had been received by the end of August 2019. There are no indications as at 30 June 2019 that the debtors will not meet their payment obligations in respect of the amount of trade receivables recognised in the balance sheet that are overdue and unprovided. The proportion of trade receivables at 30 June 2019 that were overdue for payment was 47% (2018: 37.1%). Credit terms vary across the Group; the average age of trade receivables was as follows:
Infrastructure Services 9 days (2018: 10 days)
Buildings 12 days (2018: 15 days)
Developments & Housing 13 days (2018: 20 days)
Overall, the Group considers that it is not exposed to significant credit risk.
Market risk Interest rate risk The Group has borrowing facilities to finance short-term working capital requirements and term loans to finance medium-term capital requirements, which carry interest at floating rates, at a margin over LIBOR. The Group’s borrowings, excluding the effect of derivatives, can be analysed as follows:
2019£m
2018£m
Fixed rate 275.1 285.6
Variable rate 229.2 255.8
Cost of raising finance (2.6) (4.5)
501.7 536.9
In addition, one of the Group’s joint ventures has entered into interest rate swaps in order to mitigate significant interest rate risk.
Interest rate risk also arises on the Group’s borrowings where they are not at fixed interest rates. A 50 basis point increase/decrease in the interest rate would lead to a £2.2m increase (2018: £2.2m)/£2.2m decrease (2018: £1.9m) in the Group’s net finance cost.
Kier Group plc | Report and Accounts 2019 171
STRATEGIC REPORT GOVERNANCE FINANCIAL STATEMENTS

Financial Statements Notes to the consolidated financial statements / continued For the year ended 30 June 2019
172 Kier Group plc | Report and Accounts 2019
28 Financial instruments continued Foreign currency risk The Group operates primarily within the UK such that its exposure to currency risk is not considered to be significant. Where significant foreign currency exposures are identified, these are hedged using forward foreign exchange contracts or swaps.
Changes in foreign exchange rates affect the carrying amount of the liability relating to foreign currency denominated debt on the Group’s balance sheet. The utilisation of derivatives ensures that the movement is recognised in other comprehensive income rather than profit and loss. A 5% increase/decrease in the US dollar to sterling exchange rate combined with a 5% increase/decrease in the Euro to sterling exchange rate would lead to a £6.0m decrease (2018: £6.0m)/£6.3m increase (2018: £6.3m) in the carrying amount of the liability on the Group’s balance sheet, with the movement recognised in other comprehensive income.
Liquidity risk The Group’s policy on liquidity risk is to ensure that sufficient borrowing facilities are available to fund operations without the need to carry significant net debt over the medium term. The Group’s principal borrowing facilities are provided by a syndicate of relationship banks and established investors, and in the case of a number of our Loan Notes, in the form of unsecured committed borrowing facilities. The amount of committed borrowing facilities available to the Group is reviewed regularly and is designed to exceed forecast peak gross debt levels.
Derivative financial instruments During 2013 the Group entered into three cross-currency swaps to hedge the currency risk on US dollar-denominated loan, nominal value US$28.0m. During 2014 the Group entered into four cross-currency swaps to hedge the currency risk on a US dollar-denominated loan, nominal value US$116.0m. During 2016 the Group entered into two cross-currency swaps to hedge the currency risk on a Euro-denominated loan, nominal value €20.0m, and three interest rate swaps to hedge the interest rate risk on GBP-denominated loans, nominal value £65.5m. During 2019 the Group reduced the value on one of the interest rate swaps by £12.0m, reducing the value of these swaps held from £65.5m to the total value of £53.5m. The Group has assessed the effectiveness of these swaps and concluded that they are 100% effective. Therefore, no amount in relation to hedge ineffectiveness has been charged or credited to the income statement in relation to any cross currency or interest rate swap.
The following table indicates the periods in which the cash flows associated with cash flow hedges are expected to occur and the fair value of the related hedging instruments:
Expected cash flows
Continuing operations Fair value
£m Total
£m0–1 years
£m1–2 years
£m 2–5 years
£m
More than5 years
£m
Cross-currency swaps: asset Gross settled inflows 155.8 11.7 14.2 53.4 76.5
Gross settled outflows (126.5) (9.6) (12.3) (43.5) (61.1)
24.2 29.3 2.1 1.9 9.9 15.4
Interest rate swaps: asset Net settled (0.1) (0.2) (0.1) (0.1) – –
In addition to the above, two of the Group’s property joint ventures have entered into interest rate derivatives as a means of hedging interest rate risk. Interest-bearing debts and associated interest rate derivatives within these joint ventures have a typical term of between 2 and 4 years and are without recourse to the Group. At 30 June 2019, the aggregate amount outstanding on these interest-bearing debts against which interest rate derivatives are held is £31.5m (2018: £46.9m). The Group’s share of the total net fair value liability of these interest rate derivatives at 30 June 2019 amounted to £0.3m (2018: £0.3m) which, together with the related deferred tax asset of £0.1m (2018: £nil), have met the criteria for hedge accounting.
Financial assets
Loans and receivables at amortised cost, cash and cash equivalents: 2019
£m 2018
£m
Cash and cash equivalents 311.7 330.9
Trade and other receivables (including £29.0m due after more than one year (2018: £49.2m) – excluding prepayments 327.3 600.3
Loans to joint ventures 193.6 170.3 832.6 1,101.5
Kier Group plc | Report and Accounts 2019172

Kier Group plc | Report and Accounts 2019 173
Financial liabilities – analysis of maturity dates At 30 June 2019, the Group had the following financial liabilities at amortised cost together with the maturity profile of their contractual cash flows:
Continuing operations
30 June 2019
Trade and other
payables1
£mBorrowings
£m
Finance lease obligations
£m Total
£m
Carrying value 1,273.6 503.9 3.1 1,780.6
Contractual cash flows Less than one year 1,234.1 26.9 1.1 1,262.1
One to two years 39.5 38.5 0.6 78.6
Two to three years – 62.8 0.6 63.4
Three to four years – 32.3 0.6 32.9
Four to five years – 278.7 0.6 279.3
Over five years – 88.0 – 88.0
1,273.6 527.2 3.5 1,804.3
30 June 2018
Carrying value 1,437.5 536.9 7.1 1,981.5
Contractual cash flows
Less than one year 1,413.3 28.7 4.4 1,446.4
One to two years 24.7 39.2 1.1 65.0
Two to three years – 65.8 0.6 66.4
Three to four years – 34.3 0.6 34.9
Four to five years – 301.1 0.6 301.7
Over five years – 87.2 0.6 87.8
1,438.0 556.3 7.9 2,002.2
1 Trade and other payables exclude other taxes and social security, deferred income and payments on account.
There is no material difference between the carrying value and fair value of the Group’s financial assets and liabilities.
Fair value estimation The table below analyses financial instruments carried at fair value, by valuation method. The different levels have been defined as follows:
Level 1 – Quoted prices (unadjusted) in active markets for identical assets or liabilities.
Level 2 – Inputs other than quoted prices included within level 1 that are observable for the asset or liability, either directly (that is, as prices) or indirectly (that is, derived from prices). The Group uses cross-currency and interest rate swaps for hedging. These derivatives are classified as level 2. The prices of derivative transactions have been derived from proprietary models used by the bank counterparties using mid-market mark to market valuations for trades at the close of business on 30 June 2019.
Level 3 – Inputs for the asset or liability that are not based on observable market data (that is, unobservable inputs).
The following table presents the Group’s financial assets and liabilities that are measured at fair value at 30 June 2019:
Level 1£m
Level 2 £m
Level 3£m
Total£m
Assets
Derivatives used for hedging – Cross-currency swaps – 24.1 – 24.1Derivatives used for hedging – Interest rate swaps – – – –
Kier Group plc | Report and Accounts 2019 173
STRATEGIC REPORT GOVERNANCE FINANCIAL STATEMENTS

Financial Statements Notes to the consolidated financial statements / continued For the year ended 30 June 2019
174 Kier Group plc | Report and Accounts 2019
28 Financial instruments continued The following table presents the Group’s financial assets and liabilities that are measured at fair value at 30 June 2018:
Level 1£m
Level 2 £m
Level 3 £m
Total£m
Assets
Derivatives used for hedging – Cross-currency swaps – 15.0 – 15.0Derivatives used for hedging – Interest rate swaps – 0.2 – 0.2
There were no transfers between Levels 1 and 2 during the year.
Borrowings and borrowing facilities As at 30 June 2019, the Group had the following unsecured committed facilities after the effect of derivatives:
› Revolving credit facility of £670.0m, at a margin over LIBOR, due for renewal in July 2022, £229.2m drawn at 30 June 2019 (2018: £255.8m);
› Four loan notes, principal amounts of £45.0m, US$28.0m, £47.0m and US$116.0m, with fixed coupons of between 4.1% and 4.9%, repayable in four repayments, December 2019, December 2022, November 2021 and November 2024, fully drawn at 30 June 2019, totalling £182.7m at hedged rates (2018: £182.7m);
› Two loan notes, principal amounts of €10.0m and €10.0m, with fixed coupons of between 1.5% and 2.1%, repayable in May 2021 and May 2023, fully drawn at 30 June 2019 totalling £15.7m at hedged rates (2018: £15.7m); and
› One loan note, principal amount of £53.5m at a margin over LIBOR with a maturity date of May 2021, fully drawn at 30 June 2019, totalling £53.5m (2018: £53.5m).
› One loan note, principal amount £12.0m, that was fully drawn as at 30 June 2018 was repaid during the year.
In addition, the Group has unsecured overdraft facilities of £20.0m (2018: £52.5m), at a margin over LIBOR, repayable on demand, undrawn at 30 June 2019 and 2018, and a bank loan of £0.5m (2018: £1.4m).
The committed facilities are subject to certain covenants linked to the Group’s financing structure, specifically regarding the ratios of debt to EBITDA, interest cover, and consolidated net worth. The Group has complied with these covenants throughout the period.
Included within borrowings are capitalised loan fees of £2.6m (2018: £4.5m).
Kier Group plc | Report and Accounts 2019174

Kier Group plc | Report and Accounts 2019 175
29 Financial and capital commitment
2019
£m2018
£m
Commitments for capital expenditure 0.8 –
Commitments for equity and subordinate debt in joint ventures 0.6 1.0
1.4 1.0
The total of future minimum lease payments under non-cancellable operating lease rentals are payable as follows:
2019 2018
Property
£m
Plant and machinery
£m Property
£m
Plant andmachinery
£m
Within one year 11.9 22.5 13.0 37.7
Between one and five years 41.3 24.5 39.6 53.2
Over five years 114.3 5.1 117.5 0.4
167.5 52.1 170.1 91.3
The Group leases properties and vehicles for operational purposes. Property leases vary considerably in length up to a maximum period beyond 30 June 2019 of 25 years. Vehicle leases typically run for a period of four years. No leases include contingent rentals.
30 Related parties Identity of related parties The Group has a related party relationship with its joint ventures, key management personnel and pension schemes in which its employees participate.
Transactions with key management personnel The Group’s key management personnel are the Executive and Non-Executive Directors as identified in the Directors’ Remuneration Report on pages 78 to 97.
In addition to their salaries, the Group also provides non-cash benefits to Directors and contributes to their pension arrangements as disclosed on page 83. Key management personnel also participate in the Group’s share option programme (see note 26).
Key management personnel compensation comprised:
2019£m
2018£m
Emoluments as analysed in the Directors’ Remuneration Report 5.2 5.6
Employer’s national insurance contributions 0.6 0.8
Total short-term employment benefits 5.8 6.4
Share-based payment charge 0.7 0.7
6.5 7.1
Transactions with pension schemes Details of transactions between the Group and pension schemes in which its employees participate are detailed in note 8.
Kier Group plc | Report and Accounts 2019 175
STRATEGIC REPORT GOVERNANCE FINANCIAL STATEMENTS

Financial Statements Notes to the consolidated financial statements / continued For the year ended 30 June 2019
176 Kier Group plc | Report and Accounts 2019
30 Related parties continued
Transactions with joint ventures
2019 £m
2018£m
Construction services and materials 278.2 116.9Staff and associated costs 10.0 8.9Management services 16.0 4.4Interest on loans to joint ventures 0.6 0.7Plant hire 1.3 0.8 306.1 131.7
Equity loans due from joint ventures are analysed below:
2019 £m
20181
£mKier Cross Keys Holdco 1 LLP 38.9 35.0Kier Community Living Topco 1 LLP 32.1 8.9Solum Regeneration (Twickenham LLP) 14.2 12.2Kier Trade City Holdco 1 LLP 12.7 4.3Kier (Newcastle) Investment Ltd 10.1 9.7Kier (Southampton) Investment Limited 10.0 9.3Kier Richmond Holdings Limited 9.9 9.9Watford Health Campus Partnership LLP 7.0 7.7Kier Cornwall Street Holdings 1 LLP 6.5 6.5Kier Cornwall Street Holdings 2 LLP 6.5 6.5Solum Regeneration (Epsom) LP 5.3 5.350 Bothwell Street Holdco 1 LLP 5.2 4.8Solum Regeneration (Bishops) LLP 5.0 1.1KCK Peterborough Holdco 1 LLP 4.8 4.8Solum Regeneration (Guildford) LLP 3.4 1.9Easingwold Holdco 1 LLP 2.9 2.9Stokesley Holdco 1 LLP 2.7 2.7Driffield Holdco 1 LLP 2.5 0.8Solum Regeneration (Walthamstow) LLP 2.0 3.8Strawberry Percy Holdings 1 LLP 1.6 1.6Strawberry Percy Holdings 2 LLP 1.6 1.6Tri-link 140 Holdings 1 LLP 1.4 1.4Notaro Kier LLP 1.3 2.9Black Rock Holdco 1 LLP 1.2 1.2Solum Regeneration (Redhill) LLP 1.2 1.2Winsford Holdings 1 LLP 1.2 1.1Kier Sovereign LLP 0.8 5.2Solum Regeneration (Maidstone) LLP 0.6 0.6Solum Regeneration (Haywards) LLP 0.4 0.4Solum Regeneration Holding 1 LLP 0.2 0.2Solum Regeneration Holding 2 LLP 0.2 0.2Solum Regeneration (Kingswood) LLP 0.1 0.1Solum Regeneration (Surbiton) LLP 0.1 0.1Kier Reading Holdco 1 LLP – 10.5Lysander Student Properties Investments Limited – 3.9 193.6 170.3
1 The comparative figures have been restated to include £68.1m of loans to joint ventures not previously disclosed.
Kier Group plc | Report and Accounts 2019176

Kier Group plc | Report and Accounts 2019 177
Trading balances due from joint ventures are analysed below:
2019
£m2018
£m
Kier Cross Keys Dev LLP 6.0 –
Kier Community Living LLP 4.2 0.2
Tri-Link 140 LLP 3.8 –
Stokesley Devco LLP 3.3 0.5
Hackney Schools for the Future Limited 1.4 2.7
Winsford Devco LLP 0.8 –
Easingwold Devco LLP 0.5 –
Driffield Devco LLP 0.4 1.4
Kier Richmond Limited 0.3 –
Team Van Oord Limited 0.1 0.1
KCK Peterborough Devco LLP 0.1 –
Solum Regeneration (Guildford) LLP – 0.9
Kier (Southampton) Investment Limited – 0.3
Watford Health Campus Partnership LLP – 0.2
Kier Sydenham LP – 0.1
Kier Trade City LLP – 0.1
20.9 6.5
31 Acquisitions and disposals The Group has completed a number of acquisitions and disposals during the year, in chronological order:
(a) Prior year acquisition of McNicholas On 12 July 2017, the Group acquired the entire share capital of McNicholas Construction (Holdings) Limited (‘McNicholas’). Included in the acquisition consideration payable was £14.0m of deferred contingent consideration. £4.0m of the deferred consideration has been released to the Income statement as an exceptional item, see note 5.
(b) Disposal of Unity On 2 July 2018, the Group, through its subsidiary MPHBS Limited (‘MPHBS’), disposed of its interest in The Unity Partnership Limited (‘Unity’) for a total consideration of £1.5m. Unity was a partnership between MPHBS and Oldham Metropolitan Borough Council (‘OMBC’) and delivered property, highways, transactional services, information and communication technology and business services.
2019
£m
Consideration 1.5Costs of disposal (0.4)Book value of net assets sold (3.0)
Loss on disposal (1.9)
The costs of disposal comprise £0.3m of internal costs, including redundancy, and £0.1m of legal fees.
Kier Group plc | Report and Accounts 2019 177
STRATEGIC REPORT GOVERNANCE FINANCIAL STATEMENTS

Financial Statements Notes to the consolidated financial statements / continued For the year ended 30 June 2019
178 Kier Group plc | Report and Accounts 2019
31 Acquisitions and disposals continued
(c) Disposal of the Group’s pension administration business On 31 October 2018, the Group disposed of its pension administration business, which was deemed non-core to the Kier Group portfolio, for a total consideration of £3.7m. The business was classified as held for sale as at 30 June 2018.
2019
£m
Consideration 3.7Costs of disposal (0.9)Book value of net assets sold (0.3)
Gain on disposal 2.5
The costs of disposal comprise £0.5m of legal and professional fees, a £0.1m provision for bad debts and pension costs, £0.1m of IT separation costs and £0.2m of internal staff costs.
(d) Disposal of KHSA Limited On 21 December 2018, the Group, through its subsidiary Kier Holdings Limited, disposed of its interest in KHSA Limited (‘KHSA’) for a total consideration of AUS$43.7m (£24.5m), of which AUS$41.7m (£23.4m) was received on completion, and the balance of AUS$2.0m (£1.1m) is deferred subject to satisfaction of future contractual commitments. KHSA, which was acquired as part of the Mouchel group of companies in 2015, was a joint operation providing road asset management and maintenance services in Australia.
2019
£m
Cash consideration 24.5Costs of disposal (1.7)Book value of assets sold excluding goodwill and intangible contract rights (6.9)
Profit on disposal excluding goodwill and intangible contract rights 15.9Goodwill disposed (10.7)Intangible contract rights disposed (net of related deferred tax liability of £1.3m) (6.6)
Loss on disposal (1.4)
The costs of disposal comprise £0.3m legal and professional fees, £0.7m stranded management fees, £0.5m software licences, £0.1m closure expenses and £0.1m of IT separation costs.
(e) Acquisition of Arena Central On 22 February 2019, the Group acquired control of Arena Central Developments LLP (‘Arena Central’) through two of its subsidiary companies, Kier Property Developments Limited and Kier Ventures Limited, who each acquired a 50% share. Arena Central is a 9.2 acre mixed-use city centre development in Birmingham, providing office space, retail, leisure and residential buildings. The Group has the rights to develop three further phases of the site’s existing master plan. The development includes three office buildings totalling 526,009 square foot, phased over five to seven years, known as 5 Centenary Square, 4 Arena Central and 5 Arena Central.
The total consideration paid was £29.7m of cash paid on acquisition. £0.9m of acquisition costs were incurred in the year and expensed to the income statement.
Kier Group plc | Report and Accounts 2019178

Kier Group plc | Report and Accounts 2019 179
The fair values attributable to the transaction are set out below:
2019
£m
Inventories 24.6
Trade and other receivables 11.0
Cash and cash equivalents 0.7
Trade and other payables (3.3)
Deferred tax liabilities (2.5)
30.5Negative goodwill (0.8)
Total assets acquired 29.7
Satisfied by:
Cash consideration 29.7
Total consideration 29.7
The Arena Central business contributed £17.9m to Group revenue and £1.1m to profit before exceptional items and amortisation of acquired intangible assets for the year to 30 June 2019. If the business was part of the Group for the full year, then £21.1m of revenue and £1.1m of profit before exceptional items and amortisation of acquired intangible assets for the year ended 30 June 2019 would have been recognised.
(f) Disposal of Social Power (Harlow) Holdings Limited On 14 June 2019, the Group, through its subsidiary Kier Project Investment Limited, disposed of its investment in Social Power (Harlow) Holdings Limited for proceeds of £1.0m.
2019
£m
Sale proceeds 1.0Costs of disposal (0.1)Carrying value of assets (0.7)
Gain on disposal 0.2
The costs of disposal comprise legal and professional fees.
(g) Prior year disposal of other investments in joint ventures During the prior year the Group, through its subsidiary Kier Project Investment Limited, disposed of its interest in Evolution (Woking) Holdings Limited, for a total consideration of £4.9m. In the profit before exceptional items and amortisation of acquired intangible assets of the property segment the profit on disposal recognised in the prior year was £2.7m.
The total disposal proceeds of all investments in joint ventures during the year can be reconciled to total profit and loss as follows:
2018 £m
Sale proceeds 4.9
Book value of net assets (1.9)
Sale costs (0.3)
Profit on disposal 2.7
Deemed disposal 0.8
Total profit on disposal 3.5
Kier Group plc | Report and Accounts 2019 179
STRATEGIC REPORT GOVERNANCE FINANCIAL STATEMENTS

Financial Statements Notes to the consolidated financial statements / continued For the year ended 30 June 2019
180 Kier Group plc | Report and Accounts 2019
32 Subsidiaries and other undertakings A full list of subsidiaries, branches, associated undertakings, and joint arrangements as at 30 June 2019 is detailed below. Unless stated otherwise, all undertakings are wholly owned and held indirectly by Kier Group plc.
Subsidiaries Company name Registered office1 Share class(es) held % held by Group
2020 Liverpool Limited 1 Ordinary 100% A C Chesters & Son Limited 1 Ordinary 100% AK Student Living Limited 1 A Ordinary 100% B Ordinary 100% Allison Homes Eastern Limited 1 Ordinary 100% Arena Central Developments LLP 1 - 100% Arena Central Management Limited 1 A Ordinary 100% 25%3
Balaam Wood Management Company Limited 2 Ordinary 100% Bellwinch Homes (Western) Limited 1 Ordinary 100% Bellwinch Homes Limited 1 Ordinary 100% Bellwinch Limited 1 Ordinary 100% Caribbean Construction Company Limited 3 Ordinary 100% Caxton Integrated Services Holdings Limited 1 Ordinary 100% ClearBOX Limited 1 Ordinary 75% Connect 21 Community Limited 4 Ordinary 100% Constantine Place (Longstanton) Management Company Limited 5 Ordinary 100% Dudley Coles Limited 1 Ordinary 100% Elsea Park Bourne Management Company Limited 5 Ordinary 100% Engage Lambeth Limited (in liquidation) 6 C Ordinary 100% 52%3 Engineered Products Limited (in liquidation) 6 Ordinary 100% FDT (Holdings) Ltd 1 Ordinary 100% FDT Associates Ltd 1 Ordinary A 100% Heart of Wales Property Services Limited 7 Ordinary 50% Heatherwood (Thetford) Management Company Limited 5 Ordinary 100% Hugh Bourn Developments (Wragby) Limited (in liquidation) 8 Ordinary 100% I E I Limited5 6 Ordinary 100% J L Kier & Company (London) Limited 1 Ordinary 100% J L Kier & Company Limited 1 Ordinary 100% Javelin Construction Company Limited (in liquidation) 6 Ordinary 100% Kier (Catterick) Limited 1 A Ordinary 100% B Ordinary 100% Kier (Kent) PSP Limited 1 A Ordinary 100% B Ordinary 100% Kier (Malaysia) SDN. BHD. 9 Ordinary 100% Kier (NR) Limited 1 Ordinary 100% Kier Asset Partnership Services Limited 1 Ordinary 100% Kier Benefits Limited 1 Ordinary 100% Kier Build Limited 1 Ordinary 100% Kier Building Limited (in liquidation) 6 Ordinary 100% Kier Business Services Limited 1 Ordinary 100% Kier Caribbean and Industrial Limited 1 Ordinary 100% Kier CB Limited 1 Ordinary 100% Kier Commercial Investments Limited 1 Ordinary 100% Kier Commercial UKSC Limited 1 Ordinary 100% Kier Construction Limited 1 Ordinary 100% Kier Construction Limited 10 Ordinary 100% Kier Construction LLC 11 Ordinary 49% Kier Construction SA 12 Ordinary 100% Kier Developments Limited 1 A Ordinary 100% B Ordinary 100% C Ordinary 100% Kier Dormant Holdings Limited 1 Ordinary 100% Kier Dubai LLC 13 Ordinary 49% Kier Education Investments Limited 1 B Ordinary 100% M Ordinary 100%
Kier Education Services Limited 1 B Ordinary 100% M Ordinary 100%
Kier Energy Solutions Limited 1 Ordinary 100% A Ordinary 100%
Kier Group plc | Report and Accounts 2019180

Kier Group plc | Report and Accounts 2019 181
Subsidiaries continued Company name Registered office1 Share class(es) held % held by Group
Kier Ewan Limited 1 Ordinary 100% Kier Facilities Services Limited 1 Ordinary 100% Kier Finance & Treasury Holdings Limited 1 Ordinary 100%
Kier Finance Limited 1 Ordinary 100%
Kier Fleet Services Limited 1 Ordinary 100%
Kier Group Trustees Limited2 1 Ordinary 100%
Kier Harlow Limited 1 A Ordinary 100%
B Ordinary 100%
Kier Highways Limited 1 A Ordinary 100%
B Ordinary 100%
Kier Holdco 2 Limited 1 Ordinary 100% Kier Holdings Limited 1 Ordinary 100%
Irredeemable preference 100%
Kier Homes Caledonia Limited 1 Ordinary 100%
Kier Homes Northern Limited 1 Ordinary 100%
Kier Infrastructure and Overseas Limited 1 Ordinary 100%
Kier Infrastructure and Overseas Limited – Hong Kong Branch 100%
Kier Infrastructure and Overseas Limited – Jamaica Branch 100%
Kier Infrastructure and Overseas Limited – Trinidad Branch 100% Kier Infrastructure Pty Ltd 14 Ordinary 100%
Kier Insurance Limited 15 Ordinary 100%
Kier Insurance Management Services Limited 1 Ordinary 100%
Kier Integrated Services (Estates) Limited 1 Ordinary 100%
Kier Integrated Services (Holdings) Limited 1 Ordinary 100%
Deferred 100%
Kier Integrated Services (Trustees) Limited 1 Ordinary 100%
Kier Integrated Services Group Limited 1 Ordinary 100%
Kier Integrated Services Limited 1 Ordinary 100%
Kier International (Investments) Limited 1 Ordinary 100%
Kier International Limited 1 Ordinary 100%
Kier International Limited – India Branch Kier International Limited – Jamaica Branch
Kier International Limited 16 Ordinary 100%
Kier Islington Limited 1 Ordinary 100%
Islington 100%
Kier Jamaica Development Limited 1 Ordinary 100%
Kier Land Limited 1 Ordinary 100%
Kier Limited2 1 Ordinary 100%
Kier Living Limited2 1 Ordinary 100%
Kier Management Consulting Limited 1 Ordinary 100%
A Ordinary 100%
B Ordinary 100%
Kier MBS Limited 1 Ordinary 100% Kier Midlands Limited 1 Ordinary 100%
Kier Minerals Limited 1 Ordinary 100%
Kier Mining Investments Limited 1 Ordinary 100%
Kier Mortimer Limited6 6 Ordinary 100%
Kier National Limited 1 Ordinary 100%
Kier North Tyneside Limited7 1 B Ordinary 100%
80%3
Kier Overseas (Four) Limited 1 Ordinary 100%
Kier Overseas (Nine) Limited 1 Ordinary 100%
Kier Overseas (Seventeen) Limited 1 Ordinary 100%
Kier Overseas (Twenty-Three) Limited 1 Ordinary 100% Kier Parkman Ewan Associates Limited 1 Ordinary A 100% Kier Parkman GB Limited 1 Ordinary 100% Kier Parkman ServiGroup Limited 1 Ordinary 100% Kier Parkman Two (NI) Limited (in liquidation) 17 Ordinary 100% Kier Partnership Homes Limited 1 Ordinary 100%
Kier Group plc | Report and Accounts 2019 181
STRATEGIC REPORT GOVERNANCE FINANCIAL STATEMENTS

Financial Statements Notes to the consolidated financial statements / continued For the year ended 30 June 2019
182 Kier Group plc | Report and Accounts 2019
32 Subsidiaries and other undertakings continued Company name Registered office1 Share class(es) held % held by Group
Kier Plant Limited 1 Ordinary 100% Kier Professional Services Limited 1 Ordinary 100% Kier Project Investment Limited 1 Ordinary 100% Kier Property Developments Limited 1 Ordinary 100% Kier Property Limited 1 Ordinary 100% Kier Property Management Company Limited 1 Ordinary 100% Kier Rail Limited 1 Ordinary 100% Kier Rail No.2 Limited (in liquidation) 6 Ordinary 100% Kier Recycling CIC 1 Ordinary 100% Kier Scotland Limited7 18 Ordinary 100% Kier Services Limited 1 Ordinary 100% Kier Sheffield LLP 1 – 80.1% Kier South East Limited 1 Ordinary 100% Kier Southern Limited 1 Ordinary 100% Kier Stoke Limited 1 A Ordinary 100% 80.1%3
Kier Sydenham Limited 1 Ordinary 100% Kier Thurrock Limited 1 Ordinary 100% Kier Traffic Support Limited 1 Ordinary 100% Kier UKSC LLP 1 – 100% Kier Ventures Limited 1 Ordinary 100% Kier Ventures UKSC Limited 1 Ordinary 100% Kier York Street LLP 1 – 100% Lambeth Learning Partnership (PSP) Limited (in liquidation) 6 Ordinary 65% Leyden Transport Limited (in liquidation) 6 Ordinary 100% Liferange Limited 1 Ordinary 100% Marriott Limited6 6 Ordinary 100% McNicholas Communications Limited5 6 Ordinary 100% McNicholas Construction (Holdings) Limited 1 Ordinary 100% McNicholas Construction Services Limited 1 Ordinary 100% Moss Construction Northern Limited (in liquidation) 6 Ordinary 100% MPHBS Limited 1 Ordinary 100% MRBL Limited 1 Ordinary A 100% Ordinary B 100% Deferred B 100%
Kier Group plc | Report and Accounts 2019182

Kier Group plc | Report and Accounts 2019 183
Subsidiaries continued Company name Registered office1 Share class(es) held % held by Group
Parkman Consultants Limited 1 Ordinary 100% Parkman Consultants Limited – Abu Dhabi Branch
Parkman Holdings Limited 1 Ordinary 100% Parkman Kenya Limited 19 Ordinary 100% Parkman Nigeria Limited 20 Ordinary 100% Pure Buildings Limited 1 Ordinary 100% Pure Recycling Warwick Limited 1 Ordinary A 100% Ordinary B 100%
Robert Marriott Group Limited (in liquidation) 6 Ordinary 100% Saudi Kier Construction Limited 21 Ordinary 100% T Cartledge Limited 1 Ordinary 100% T H Construction Limited 1 Ordinary 100% T J Brent Limited 1 Ordinary 100% Ordinary B 100% Ordinary C 100%
Tempsford Cedars Limited 1 Ordinary 100% Tempsford Insurance Company Limited2 15 Ordinary 100% The Impact Partnership (Rochdale Borough) Limited 1 Ordinary 80.1% Tor2 Limited 1 PSP Shares 100% 80.01%3
TradeDirect Logistics Limited 1 Ordinary 100% Turriff Contractors Limited 22 Ordinary 100% Turriff Group Limited 22 Ordinary 100% Ordinary A 100% Ordinary B 100%
Turriff Smart Services Limited7 18 Ordinary 100% Twigden Homes Limited 1 Ordinary 100% Twigden Homes Southern Limited 1 Ordinary 100% Underground Moling Services Limited (in liquidation) 18 Ordinary 100% Usherlink Limited 1 Ordinary 100% W. & C. French (Construction) Limited 1 Ordinary 100% Wallis Builders Limited6 6 Ordinary 100% Wallis Limited 1 Ordinary 100% Wallis Western Limited 1 Ordinary 100% William Moss Group Limited (The) 1 Ordinary 100%
1 See list of registered office details and explanatory notes on page 186.
Kier Group plc | Report and Accounts 2019 183
STRATEGIC REPORT GOVERNANCE FINANCIAL STATEMENTS

Financial Statements Notes to the consolidated financial statements / continued For the year ended 30 June 2019
184 Kier Group plc | Report and Accounts 2019
32 Subsidiaries and other undertakings continued Joint ventures
Company name Registered office1 Interest held
Registered office1 Interest held
Property
3 Sovereign Square Holdings 1 LLP 1 50% Kier Sovereign LLP 1 50%3 Sovereign Square Holdings 2 LLP 1 50% Kier Sydenham GP Holdco Limited 1 50%3 Sovereign Square LLP 1 50% Kier Sydenham GP Limited 1 50%50 Bothwell Street Holdco 1 LLP 23 50% Kier Sydenham LP 1 50%50 Bothwell Street Holdco 2 LLP 23 50% Kier Sydenham Nominee Limited 1 50%50 Bothwell Street LLP 23 50% Kier Trade City Holdco 1 LLP 1 90%Alliance Community Partnership Limited 24 10% Kier Trade City Holdco 2 LLP 1 90%Black Rock Devco LLP 1 50% Kier Trade City LLP 1 90%Black Rock Holdco 1 LLP 1 50% Kier Warth Limited 1 50%Black Rock Holdco 2 LLP 1 50% Kingswood Devco Holdings 1 LLP 1 50%Dragon Lane Holdings 1 LLP 1 50% Kingswood Devco Holdings 2 LLP 1 50%Dragon Lane Holdings 2 LLP 1 50% Kingswood Devco LLP 1 50%Dragon Lane LLP 1 50% Lysander Student Properties Investments 1 75%Driffield Devco LLP 1 50% Lysander Student Properties Limited 1 75%Driffield Holdco 1 LLP 1 50% Lysander Student Properties Operations Limited 1 75%Driffield Holdco 2 LLP 1 50% Magnetic Limited 1 75%Easingwold Devco LLP 1 50% Notaro Kier LLP 1 50%Easingwold Holdco 1 LLP 1 50% Penda Limited 1 50%Easingwold Holdco 2 LLP 1 50% Premier Inn Kier Limited 1 50%Farington Moss Devco LLP 1 10% Solum Regeneration (Bishops) LLP 1 50%Farington Moss Holdco 1 LLP 1 10% Solum Regeneration (Epsom) Limited Partnership 1 50%Farington Moss Holdco 2 LLP 1 10% Solum Regeneration (Guildford) LLP 1 50%KCK Peterborough Devco LLP 1 90% Solum Regeneration (Haywards) LLP 1 50%KCK Peterborough Holdco 1 LLP 1 90% Solum Regeneration (Kingswood) LLP 1 50%KCK Peterborough Holdco 2 LLP 1 90% Solum Regeneration (Maidstone) LLP 1 50%Kent LEP 1 Limited 1 80% Solum Regeneration (Redhill) LLP 1 50%Kier (Newcastle) Investment Ltd 1 75% Solum Regeneration (Surbiton) LLP 1 50%Kier (Newcastle) Operation Limited 1 75% Solum Regeneration (Twickenham) LLP 1 50%Kier (Southampton) Development Limited 1 75% Solum Regeneration (Walthamstow) LLP 1 50%Kier (Southampton) Investment Limited 1 75% Solum Regeneration Epsom (GP Subsidiary) 1 50%Kier (Southampton) Operations Limited 1 75% Solum Regeneration Epsom (GP) Limited 1 50%Kier Community Living Holdco 1 LLP 1 69% Solum Regeneration Epsom (Residential) LLP 1 50%Kier Community Living Holdco 2 LLP 1 69% Solum Regeneration Holding 1 LLP 1 50%Kier Community Living LLP 1 69% Solum Regeneration Holding 2 LLP 1 50%Kier Community Living Topco 1 LLP 1 69% Stokesley Devco LLP 1 50%Kier Community Living Topco 2 LLP 1 69% Stokesley Holdco 1 LLP 1 50%Kier Cornwall Street Holdings 1 LLP 1 90% Stokesley Holdco 2 LLP 1 50%Kier Cornwall Street Holdings 2 LLP 1 90% Strawberry Percy Holdings 1 LLP 1 50%Kier Cornwall Street LLP 1 90% Strawberry Percy Holdings 2 LLP 1 50%Kier Cross Keys Dev LLP 1 90% Strawberry Percy LLP 1 50%Kier Cross Keys Holdco 1 LLP 1 90% Transcend Property Limited 26 50%Kier Cross Keys Holdco 2 LLP 1 90% Tri-Link 140 Holdings 1 LLP 1 50%Kier Foley Street Holdco 1 LLP 1 90% Tri-Link 140 Holdings 2 LLP 1 50%Kier Foley Street Holdco 2 LLP 1 90% Tri-Link 140 LLP 1 50%Kier Foley Street LLP 1 90% Watford Health Campus Limited 1 50%Kier Hammersmith Holdco Limited 1 50% Watford Health Campus Partnership LLP 1 50%Kier Hammersmith Limited 1 50% Watford Waterside 1 LLP 1 50%Kier Reading Holdco 1 LLP 1 90% Watford Woodlands LLP 1 50%Kier Reading Holdco 2 LLP 1 90% Winsford Devco LLP 1 50%Kier Reading LLP 1 90% Winsford Holdings 1 LLP 1 50%Kier Richmond Holdings Limited 1 90% Winsford Holdings 2 LLP 1 50%Kier Richmond Limited 1 90% Services Construction 2020 Knowsley Limited 1 80.1%Kier Graham Defence Limited 1 50% Hackney Schools for the Future Limited 1 80% Team Van Oord Limited 25 25%
1 See list of registered office details and explanatory notes on page 186.
Kier Group plc | Report and Accounts 2019184

Kier Group plc | Report and Accounts 2019 185
Joint operations Joint operation name Description Trading address
UK Crossrail Contracts 300/410/435
a joint arrangement between Kier Infrastructure and Overseas Limited, BAM Nuttall Limited and Ferrovial Agroman (UK) Limited
Farringdon Road, London ECIM 3HN
Deephams a joint arrangement between Kier Infrastructure and Overseas Limited, J Murphy & Sons Limited, and Aecom Limited
Deephams Sewage Treatment Wales, Pickett’s Lock Lane, Edmonton, N9 0BA
Hercules a joint arrangement between Kier Construction Limited, Kier Living Limited and Balfour Beatty
Hercules Site Offices, The Wessex Building, MOD Lyneham, Calne Road, Lyneham, Chippenham, SN15 4PZ
Hinkley Point C a joint arrangement between Kier Infrastructure and Overseas Limited and BAM Nuttall Limited
Hinkley Point C Construction Site, Wick Moor Drove, Bridgwater, Somerset, TA5 1UD
KCD a joint arrangement between Kier Integrated Services Limited and Clancy Docwra Limited
Thames Water Offices, Clear Water Court, Vastern Rd, Reading, RG1 8DB
KMI Plus a joint arrangement between Kier Infrastructure and Overseas Limited, J Murphy & Sons Limited, Interserve Project Services Limited and Mouchel Limited
Tempsford Hall, Sandy, Bedfordshire, SG19 2BD
KMI Water a joint arrangement between Kier Infrastructure and Overseas Limited, J Murphy & Sons Limited and Interserve Project Services Limited
Tempsford Hall, Sandy, Bedfordshire, SG19 2BD
Mersey Gateway a joint arrangement between Kier Infrastructure and Overseas Limited, Samsung C&T ECUK Limited and FCC Construccion S.A.
Forward Point, Tan House Lane, Widnes, WA8 0SL
Luton People Mover a joint arrangement between Kier Infrastructure and Overseas Limited and VolkerFitzpatrick Limited
Hertford Road, Hoddesdon, EN11 9BX
HS2 a joint arrangement between Kier Infrastructure and Overseas Limited and Eiffage Génie Civil
19 Cornwall Street, Birmingham, B3 2DT
RAF Lakenheath a joint arrangement between Kier Construction Limited and VolkerFitzpatrick Limited
Hertford Road, Hoddesdon, EN11 9BX
Kier WSP a joint arrangement between Kier Integrated Services Limited and WSP UK Limited
Northamptonshire Highways, Highways Depot, Harborough Rd, Brixworth, Northants NN6 9BX
International
The following joint operations, in which the Group participation is between 30% and 65%, operate overseas in the territory indicated:
DPDP-6003 Residential Project (Bluewaters)
a joint arrangement between Kier Infrastructure and Overseas Limited and AI Shafar General Contracting Co LLC
Bluewaters Island, Dubai
MTRC Contract 824 a joint arrangement between Kier Infrastructure and Overseas Limited and Kaden Construction Limited
Area 3.6, Tai Kong Po Tsuen, Kam Tin, Yuen Long, N.T., Hong Kong
MTRC Contract 901 a joint arrangement between Kier Infrastructure and Overseas Limited, Laing O’Rourke Hong Kong Limited and Kaden Construction Limited
Admiralty Station, Hong Kong Island
Saadiyat Rotana Hotel and Resort Complex
a joint arrangement between Kier Construction LLC and Ali and Sons Contracting Co LLC
Saadiyat Island, Abu Dhabi
Kier ACC a joint arrangement between Kier Dubai LLC and Arabian Construction Co.SAL
AL Qudra Road, Dubai
Kier Group plc | Report and Accounts 2019 185
STRATEGIC REPORT GOVERNANCE FINANCIAL STATEMENTS

Financial Statements Notes to the consolidated financial statements / continued For the year ended 30 June 2019
186 Kier Group plc | Report and Accounts 2019
32 Subsidiaries and other undertakings continued Registered office addresses Number Address
1 Tempsford Hall, Sandy, Bedfordshire, SG19 2BD, UK
2 154-155, Great Charles Street, Queensway, Birmingham, B3 3LP, UK
3 Harbour Head, Harbour View, Kingston 17, Jamaica
4 The Maltings, Sandon, Buntingford, SG9 0RU, UK
5 82, The Maltings, Roydon Road, Stanstead Abbotts, Hertfordshire, SG12 8HG, UK
6 1 More London Place, London, SE1 2AF, UK
7 Unit 31, Ddole Road Industrial Estate, Llandrindod Wells, Powys, LD1 6DF, UK
8 KPMG LLP, 15 Canada Square, Canary Wharf, London, E14 5GL, UK
9 9-5 & 7-5, Jalan 8/146, Bandar Tasik Selatan, Kuala Lumpur, 57000, Malaysia
10 Grant Thornton, C/O Cnr Bank Street and West Independence Sq Street, Basseterre, Saint Kitts and Nevis
11 Unit 869, PO Box: 61967 Level 08, Aya Business Center, Al Gaith Tower, Hamdan Street, Abu Dhabi, United Arab Emirates
12 151 Angle Avenue, Jean Paul II et Impasse Duverger, Turgeau, Port-au-Prince, Haiti
13 Unit 1501, P.O. Box 2, Thuraya Tower, Plot No C-008-001, TECOM, Dubai, United Arab Emirates
14 181 Adelaide Terrace, East Perth, WA 6004, Australia
15 PO Box 33, Dorey Court, Admiral Park, St Peter Port, GY1 4AT, Guernsey
16 6th Floor, Emperor Commercial Centre, 39 Des Voeux Road Central, Hong Kong
17 Shorefield House, Kinnegar Drive, Holywood, Co. Down, BT18 9JQ, UK
18 Atria One, 144 Morrison Street, Edinburgh, EH3 8EB, UK
19 5th Floor, Agip House, P.O. Box 41425, Nairobi, Kenya
20 9, N/Azikiwe St., Lagos, Nigeria
21 PO Box 667, 4th Floor, ATCO Building, King Khaled Road, Dammam-31421, KSA, United Arab Emirates
22 Campsie House, Buchanan Business Park, Cumbernauld Road, Stepps, Glasgow, G33 6HZ, UK
23 18 Savile Row, London, W1S 3PW, UK
24 Avondale House, Suites 1l – 1o Phoenix Crescent, Strathclyde Business Park, Bellshill, Lanarkshire, ML4 3NJ, UK
25 Bankside House, Henfield Road, Small Dole, Henfield, West Sussex, BN5 9XQ, UK
26 1 Kingsway, London, WC2B 6AN, UK
Explanatory notes
1 The share capital of all entities is wholly owned and held indirectly by Kier Group plc unless indicated otherwise. 2 Shares held directly by Kier Group plc. 3 Total interest in entity held by the Group as there are other share class(es) held by a third party. 4 In some jurisdictions in which the Group operates, share classes are not defined and in these instances, for the purposes of disclosure, these holdings have
been classified as ordinary shares. 5 Members voluntary liquidation completed on 6 July 2019. 6 Members voluntary liquidation completed on 14 August 2019. 7 Members voluntary liquidation completed on 23 August 2019. 8 The Group has entered into a partnership arrangement with North Tyneside Council whereby the Council has a participating ownership interest and receives a
minority share of the profits of Kier North Tyneside Limited. 9 Joint operations are contracted agreements to co-operate on a specific project which is an extension of the Group’s existing business. Joint ventures are
ongoing businesses carrying on their own trade. 10 Interests in the above joint ventures are held by subsidiary undertakings. 11 The joint ventures where the Group has an interest in excess of 50% are still considered joint ventures as the Group has joint control. 12 Where companies are shown as being in liquidation, in all cases this is a members voluntary liquidation.
Kier Group plc | Report and Accounts 2019186

Kier Group plc | Report and Accounts 2019 187
33 Events after the reporting period In December 2018, the Group began a formal sales process to dispose of its interest in Pure Recycling Warwick Limited (‘Pure’) – see note 21. The net assets for Pure are held on the balance sheet as an asset held for sale. Indicative bids from buyers were lower than the net asset value. As a result, a fair value impairment of £8.4m was completed to lower the asset value to the anticipated net sales proceeds. This has been classified as an exceptional item in note 5. At the date of signing the financial statements, the sale had not completed. 34 Changes in accounting policies The Group has adopted IFRS 9 ‘Financial Instruments’ and IFRS 15 ‘Revenue from Contracts with Customers’ with effect from 1 July 2018 using the cumulative effect method, and as such comparative information has not been restated.
IFRS 9 ‘Financial Instruments’ IFRS 9 replaced IAS 39 ‘Financial Instruments: Recognition and Measurement’. All financial instruments classified as trade and other receivables under IAS 39, as well as contract assets recognised in accordance with IFRS 15, have been classified and measured at amortised cost under IFRS 9.
IFRS 9 requires the Group to recognise expected credit losses (‘ECL’) whereby expected losses as well as incurred losses are provided for. The Group applies the simplified approach when determining ECL provisions for contract assets and trade receivables. In making the assessment of credit risk and estimating ECL provisions, the Group uses reasonable and supportable information about past events, current conditions and forecasts of future events and economic conditions.
The adoption of IFRS 9 has had no material impact on the Group’s interim financial statements.
IFRS 15 ‘Revenue from Contracts with Customers’ IFRS 15 replaces IAS 18 ‘Revenue’ and IAS 11 ‘Construction Contracts’ and introduces a 5-step model to account for revenue, with new guidance provided in areas on which previous IFRSs were silent.
It is important to note that, whilst the change from the old revenue recognition standards to IFRS 15 can impact on the timing of revenue and profit recognition on individual contracts in a particular accounting period, it does not change the overall revenue, profit or cash generated over the life of the contract.
The adoption of IFRS 15 has resulted in additional line items being disclosed on the Group’s Consolidated balance sheet and Consolidated cash flow statement as follows:
› Consolidated balance sheet: Capitalised mobilisation costs and contract assets have been included within non-current assets; contract assets have been included within current assets; and contract liabilities have been included within current liabilities.
› Consolidated cash flow statement: Increase in contract assets and decrease in contract liabilities have been included within cash flow from operating activities; and purchase of capitalised mobilisation costs have been included within cash flows from investing activities.
Kier Group plc | Report and Accounts 2019 187
STRATEGIC REPORT GOVERNANCE FINANCIAL STATEMENTS

Financial Statements Notes to the consolidated financial statements / continued For the year ended 30 June 2019
188 Kier Group plc | Report and Accounts 2019
34 Changes in accounting policies continued
Transition adjustments The table below summarises the impact of the adoption of IFRS 15 at the date of first application:
Consolidated balance sheet
Adjustment reference
30 June 20181
£m
Impact of adopting IFRS 15
£m
1 July2018
£m
Non-current assets Intangible assets E 862.2 (0.9) 861.3Property, plant and equipment E 91.6 (2.8) 88.8Capitalised mobilisation costs E – 2.4 2.4Deferred tax asset A-E – 1.6 1.6Contract assets F – 21.1 21.1Trade and other receivables F 49.2 (21.1) 28.1Other non-current assets 280.8 – 280.8
Non-current assets 1,283.8 0.3 1,284.1
Current assets
Inventories A,E,F 575.0 (322.9) 252.1Contract assets A,F – 409.6 409.6Trade and other receivables F 603.0 (150.0) 453.0Other current assets 346.3 – 346.3
Current assets 1,524.3 (63.3) 1,461.0
Assets held for sale as part of a disposal group 1.3 – 1.3
Total assets 2,809.4 (63.0) 2,746.4
Current liabilities
Trade and other payables A,F (1,526.8) 187.0 (1,339.8)Contract liabilities F – (195.4) (195.4)Other current liabilities (31.4) – (31.4)
Current liabilities (1,558.2) (8.4) (1,566.6)
Liabilities held for sale as part of a disposal group (3.4) – (3.4)
Non-current liabilities
Deferred tax liability A-E (10.8) 10.8 –Other non-current liabilities (635.9) – (635.9)
Non-current liabilities (646.7) 10.8 (635.9)
Total liabilities (2,208.3) 2.4 (2,205.9)
Net assets 601.1 (60.6) 540.5
Equity
Retained earnings A-E 27.6 (60.8) (33.2)Other equity A,C 571.8 0.2 572.0
Equity attributable to owners of the parent 599.4 (60.6) 538.8Non-controlling interests 1.7 – 1.7
Total equity 601.1 (60.6) 540.5
1 2018 balance sheet reclassed to move £15.2m ‘Other financial assets’ from current assets to non-current assets.
Kier Group plc | Report and Accounts 2019188

Kier Group plc | Report and Accounts 2019 189
The table below provides a breakdown of the movement in the opening retained earnings by each of the principal adjustments. Explanatory notes for each of the adjustments are provided below the table.
Impact on reserves
Adjustment
Impact of adoptingIFRS 15
£m
A Change in method of calculating the percentage of completion on construction contracts (28.1)
B Third party claims (26.0)
C Derecognition of certain variable revenue items (9.7)
D Disaggregation of performance obligations (3.4)
E Capitalised mobilisation costs (5.8)
(73.0)Deferred tax credit on the above (at 17.0%) 12.4
Total adjustment to reserves (60.6)
A - Change in the method of calculating the percentage of completion on construction contracts IFRS 15 requires a consistent revenue recognition method for contracts and performance obligations with similar characteristics. Previously, the Group used an output measure of progress (based on external valuations) in its construction businesses and input methods in its services businesses. For its construction businesses, the Group has chosen to move to using the percentage of completion method, using cost incurred to date as a proportion of the estimated full costs of completing the contract, applied to the total expected contract revenue. The Group believes that moving to this input measure of progress better reflects the pattern of transfer of control to the customer and achieves consistency with other businesses within the Group. Contracts were found, on average, to have a lower percentage of completion when compared to the previous measure.
B - Third-party claims IAS 11 ‘Construction Contracts’ permitted the recognition of expected cost reimbursements resulting from claims against a third party (as well as the customer) if it was probable that the claim would be accepted. Certain third-party claims (such as insurance recoveries and claims for cost reimbursements) are not covered by similar provisions in IFRS 15, which only deals with claims against the customer. Following the withdrawal of IAS 11, in order to recognise an asset for these third-party claims the Group will need to comply with the requirements of IAS 37 ‘Provisions, Contingent Liabilities and Contingent Assets’. The requirements of IAS 37 are more stringent than IAS 11, requiring recovery to be virtually certain before an asset can be recognised. Whilst the Group still expects to recover the amounts claimed from third parties that the Group had recognised at the 30 June 2018 balance sheet date, certain claims do not meet the virtually certain criteria of IAS 37. These claims have therefore been de-recognised at the transition date and will be accounted for in future periods, when the uncertainty over their recovery has been removed.
C - Derecognition of certain variable revenue items IFRS 15 introduces a requirement for recognition of variable consideration (for example pain/gain shares and milestone payments) that is “highly probable not to reverse”. The Group has therefore reviewed its construction contracts and concluded that recognition of some of these items will occur later in the projects.
D - Disaggregation of performance obligations IFRS 15 introduces a clear link between the value provided to the customer and the timing of revenue recognition. One of the principles of the new standard is that individual performance obligations within contracts should be identified and accounted for separately. In the majority of cases, the Group’s previous accounting treatment was consistent with the principles of IFRS 15. However, on some contracts in the IT business support area, it has been necessary to disaggregate contracts and performance obligations and account for them separately. This gives rise to changes in the timing of revenue recognition. The Group will potentially recognise lower profits in the early years of these contracts, where there are higher operating costs compared to the level of service delivered to the customer, with a compensating increase in profits in later years. The impact on the Group on transition to IFRS 15 reflects the fact that these contracts are in the later stages of their contract life cycles at the transition date.
E - Capitalised mobilisation costs IFRS 15 contains new guidance on which pre-contract costs can and can’t be capitalised. Some costs that the Group had previously capitalised can no longer be carried forward on the balance sheet and therefore an adjustment has been made to remove these assets. In addition, under IFRS 15 a specific category has been introduced in non-current assets for capitalised mobilisation costs. There have therefore been presentational changes as the amounts that can continue to be capitalised have been reallocated to the new category.
F - Other balance sheet adjustments The introduction of IFRS 15 does not only affect the timing of revenues and profit recognition in the income statement. The new standard introduces ‘contract assets’ and ‘contract liabilities’ as new balance sheet categories. There are therefore a number of presentational changes as accrued revenue amounts for work undertaken, but not yet certified/invoiced, have been reclassified as contract assets and amounts received or certified in advance of completing performance obligations have been reclassified as contract liabilities.
Kier Group plc | Report and Accounts 2019 189
STRATEGIC REPORT GOVERNANCE FINANCIAL STATEMENTS

Financial Statements Notes to the consolidated financial statements / continued For the year ended 30 June 2019
190 Kier Group plc | Report and Accounts 2019
34 Changes in accounting policies continued Conversely, balances within the IAS 11 related balance sheet headings of ‘amounts recoverable on contracts’ within inventories and ‘construction contract balances’ within trade and other payables have been eliminated either through the adoption of the new method of calculating the percentage of completion on construction contracts (which no longer necessitates adjustments to cost of sales) or else by reclassification to more appropriate balance sheet categories, including contract assets and contract liabilities.
Impact on the results for the year ended 30 June 2019 The tables below summarise the impact of the adoption of IFRS 15 on the Group’s interim consolidated income statement for the year ended 30 June 2019, and the consolidated balance sheet for the year then ended. With the exception of the impact of changes to the income statement, there was no material impact on the Group’s interim consolidated other comprehensive income. There was no material impact on the Group’s net cash flows from operating activities, investing activities and financing activities.
Consolidated income statement – year to 30 June 2019 Amounts without adoption of IFRS 15 Impact of adopting IFRS 15 As reported
Continuing operations Adjustment
ref
Before exceptional
items1 £m
Exceptional items1
(note 5)£m
Total£m
Before exceptional
items1
£m
Exceptional items1
£mTotal
£m
Before exceptional
items1 £m
Exceptional items1
(note 5)£m
Total£m
Group revenue A,C,D 4,034.3 (15.0) 4,019.3 102.4 – 102.4 4,136.7 (15.0) 4,121.7
Cost of sales A,B,E (3,675.9) (111.2) (3,787.1) (77.6) – (77.6) (3,753.5) (111.2) (3,864.7)
Gross profit/(loss) 358.4 (126.2) 232.2 24.8 – 24.8 383.2 (126.2) 257.0
Administrative expenses (289.8) (214.2) (504.0) – – – (289.8) (214.2) (504.0)
Share of post-tax results of joint ventures A 30.7 – 30.7 – – – 30.7 – 30.7
Loss on disposal of joint ventures and subsidiaries – (0.4) (0.4) – – – – (0.4) (0.4)
Profit/(loss) from operations 99.3 (340.8) (241.5) 24.8 – 24.8 124.1 (340.8) (216.7)
Finance income 0.2 – 0.2 – – – 0.2 – 0.2
Finance cost (26.7) (1.7) (28.4) – – – (26.7) (1.7) (28.4)
Profit/(loss) before tax 72.8 (342.5) (269.7) 24.8 – 24.8 97.6 (342.5) (244.9)
Taxation A-E (16.0) 55.9 39.9 (4.2) – (4.2) (20.2) 55.9 35.7
Profit/(loss) for the year from continuing operations 56.8 (286.6) (229.8) 20.6 – 20.6 77.4 (286.6) (209.2)
Discontinued operations Profit for the year from discontinued operations – – – – – – – – –
Profit/(loss) for the year 56.8 (286.6) (229.8) 20.6 – 20.6 77.4 (286.6) (209.2)
Attributable to:
Owners of the parent 56.4 (286.6) (230.2) 20.6 – 20.6 77.0 (286.6) (209.6)
Non-controlling interests 0.4 – 0.4 – – – 0.4 – 0.4
56.8 (286.6) (229.8) 20.6 – 20.6 77.4 (286.6) (209.2)
Basic earnings/(losses) per share
From continuing operations 42.6p (216.7)p (174.1)p 15.6p – 15.6p 58.2p (216.7)p (158.5)p
From discontinued operations – – – – – – – – –
Total 42.6p (216.7)p (174.1)p 15.6p – 15.6p 58.2p (216.7)p (158.5)p
Diluted earnings/(losses) per share
From continuing operations 42.6p (216.7)p (174.1)p 15.6p – 15.6p 58.2p (216.7)p (158.5)p
From discontinued operations – – – – – – – – –
Total 42.6p (216.7)p (174.1)p 15.6p – 15.6p 58.2p (216.7)p (158.5)p
1 Reference to ‘exceptional items’ includes exceptional items and the amortisation of acquired intangible assets, see note 5.
Kier Group plc | Report and Accounts 2019190

Kier Group plc | Report and Accounts 2019 191
Impact on profit for the year
Adjustment
Impact of IFRS 15
£m
A Change in method of calculating the percentage of completion on construction contracts 12.2
B Third party claims 7.3
C Derecognition of certain variable revenue items 4.6
D Disaggregation of performance obligations 3.4
E Capitalised mobilisation costs (2.7)
24.8Tax charge on the above (4.2)
Total impact on profit for the year 20.6
A – Change in the method of calculating the percentage of completion on construction contracts Additional profit has been recognised in relation to the relative percentage of completion of construction jobs, under the old and new calculation methods, at 30 June 2019 compared with 30 June 2018. The additional profit recognised in the year reflects the fact that the cumulative impact of IFRS 15 compared to the old percentage of completion measurement basis is, on average, less marked at 30 June 2019, than at 30 June 2018, i.e. there has been an acceleration of work when measured on a cost basis compared to the previous, external valuation, basis.
B - Third-party claims Some of the third-party claims that were derecognised as an IFRS 15 transitional adjustment at 1 July 2018, were settled or became virtually certain of recovery in the year to 30 June 2019. This has resulted in a difference in the timing of the accounting for the income associated with the claims.
C - Derecognition of certain variable revenue items The credit to the income statement is a result of the timing difference in relation to when certain claims (accounted for as variable consideration) should be recognised under IFRS 15 compared to the previous standards.
D - Disaggregation of performance obligations As described in the transitional adjustments section above, it has been necessary to disaggregate contracts and performance obligations in relation to some contracts in the IT business support area, and account for them separately. This gives rise to changes in the timing of revenue recognition. On these contracts a transitional adjustment has been made to reflect the fact that less revenue and profit would have been recognised in the earlier years of these contracts. Conversely, more profit is recognised in the later years under IFRS 15. The impact on the income statement for the year to 30 June 2019 reflects the fact that these contracts are in the later stages of their contract life cycles.
E – Capitalised mobilisation costs Some costs that would have been capitalised in the year under the Group’s old accounting policy, have been expensed to the Income Statement. The adjustment is net of amortisation charges that would have been charged under the previous policy.
Kier Group plc | Report and Accounts 2019 191
STRATEGIC REPORT GOVERNANCE FINANCIAL STATEMENTS

Financial Statements Notes to the consolidated financial statements / continued For the year ended 30 June 2019
192 Kier Group plc | Report and Accounts 2019
34 Changes in accounting policies continued Consolidated balance sheet – as at 30 June 2019
Adjustment reference
Amounts without adoption
of IFRS 15 £m
Impact of adopting IFRS 15
£m As reported
£m
Non-current assets
Intangible assets E 766.9 (0.2) 766.7Property, plant and equipment E 64.5 (7.2) 57.3Capitalised mobilisation costs E – 3.3 3.3Deferred tax asset A-E 39.5 8.2 47.7Contract assets F – 25.2 25.2Trade and other receivables F 54.2 (25.2) 29.0Other non-current assets 318.4 – 318.4
Non-current assets 1,243.5 4.1 1,247.6
Current assets
Inventories A,E,F 634.5 (416.6) 217.9Contract assets A,F – 466.0 466.0Trade and other receivables F 397.9 (25.0) 372.9Other current assets 322.8 – 322.8
Current assets 1,355.2 24.4 1,379.6
Assets held for sale as part of a disposal group 14.6 – 14.6
Total assets 2,613.3 28.5 2,641.8
Current liabilities
Trade and other payables A,F (1,376.3) 65.3 (1,311.0)Contract liabilities F – (134.0) (134.0)Other current liabilities (56.4) – (56.4)
Current liabilities (1,432.7) (68.7) (1,501.4)
Liabilities held for sale as part of a disposal group (1.5) – (1.5)
Non-current liabilities (619.3) – (619.3)
Total liabilities (2,053.5) (68.7) (2,122.2)
Net assets 559.8 (40.2) 519.6
Equity
Retained earnings A-E (266.6) (40.2) (306.8)Other equity 825.9 – 825.9
Equity attributable to owners of the parent 559.3 (40.2) 519.1Non-controlling interests 0.5 – 0.5
Total equity 559.8 (40.2) 519.6
The areas of the balance sheet impacted by the adoption of IFRS 15 and the nature of the adjustments are consistent with the transitional adjustments noted above.
Kier Group plc | Report and Accounts 2019192

Company balance sheet As at 30 June 2019
193 Kier Group plc | Report and Accounts 2019
Notes 2019
£m 20181
£m
Fixed assets Investments 5 486.2 479.0
Amounts due from subsidiary undertakings 871.8 705.9
Other financial assets 8 22.1 15.2
1,380.1 1,200.1
Current assets Debtors 6 2.6 0.4
Other financial assets 8 2.0 –
Cash and cash equivalents 165.2 97.7
169.9 98.1
Current liabilities Creditors – amounts falling due within one year 7 (41.6) (21.8)
(41.6) (21.8)
Net current assets 128.3 76.3
Total assets less current liabilities 1,508.5 1,276.4
Non-current liabilities Creditors – amounts falling due after more than one year 7 (473.4) (523.5)
Net assets 1,035.1 752.9
Shareholders’ funds Called up share capital 9 1.6 1.0
Share premium account 684.3 435.0
Merger reserve 134.8 134.8
Capital redemption reserve 2.7 2.7
Cash flow hedge reserve (0.7) (4.3)
Profit and loss account 212.4 183.7
Total shareholders’ funds 1,035.1 752.9
1 2018 balance sheet reclassed to move £15.2m ‘Other financial assets’ from current assets to non-current assets.
The profit for the year was £74.6m (2018: £132.8m).
The financial statements of Kier plc, company registration number 2708030, on pages 193 to 198 were approved by the Board of Directors on 26 September 2019 and were signed on its behalf by:
Andrew Davies Bev Dew CHIEF EXECUTIVE FINANCE DIRECTOR
Kier Group plc | Report and Accounts 2019 193
STRATEGIC REPORT GOVERNANCE FINANCIAL STATEMENTS

Financial Statements Company statement of changes in equity For the year ended 30 June 2019
194 Kier Group plc | Report and Accounts 2019
Share capital
£m
Sharepremium
£m
Mergerreserve
£m
Capitalredemption
reserve£m
Profit and loss account
£m
Cash flow hedge
reserve £m
Totalequity
£m
At 1 July 2017 1.0 434.8 134.8 2.7 112.9 (2.8) 683.4Profit for the year – – – – 132.8 – 132.8Other comprehensive loss – – – – – (1.5) (1.5)Dividends paid – – – – (66.1) – (66.1)Issue of own shares – 0.2 – – – – 0.2Share-based payments – – – – 5.4 – 5.4Purchase of own shares – – – – (1.3) – (1.3)
At 30 June 2018 1.0 435.0 134.8 2.7 183.7 (4.3) 752.9Profit for the year – – – – 74.6 – 74.6Other comprehensive loss – – – – – 3.6 3.6Dividends paid – – – – (52.6) – (52.6)Issue of own shares 0.6 249.3 – – – – 249.9Share-based payments – – – – 7.2 – 7.2Purchase of own shares – – – – (0.5) – (0.5)
At 30 June 2019 1.6 684.3 134.8 2.7 212.4 (0.7) 1,035.1
Included in the profit and loss account is the balance on the share scheme reserve which comprises the investment in own shares of £nil (2018: £0.1m) and a credit balance on the share scheme reserve of £6.7m (2018: £8.1m).
Details of the shares held by the Kier Group 1999 Employee Benefit Trust and of the share-based payment scheme are included in note 26 to the consolidated financial statements.
Kier Group plc | Report and Accounts 2019194

Notes to the Company financial statements For the year ended 30 June 2019
Kier Group plc | Report and Accounts 2019 195
1 Accounting policies The principal accounting policies are summarised below. They have been applied consistently throughout the year and the preceding year.
Basis of preparation The financial statements have been prepared in accordance with Financial Reporting Standard 101 ‘Reduced Disclosure Framework’ (FRS 101) and the Companies Act 2006. The financial statements have been prepared under the historical cost convention.
Kier Group plc is a company incorporated in the United Kingdom under the Companies Act. The address of the registered office is given on page 200.
The Company’s financial statements are included in the Kier Group plc consolidated financial statements for the year ended 30 June 2019. As permitted by Section 408 of the Companies Act 2006, the Company has not presented its own profit and loss account.
None of the standards, interpretations or amendments effective for the first time from 1 July 2018 (including IFRS 15 and IFRS 9) have had a material effect on the Company’s financial statements.
The Company has taken advantage of the following disclosure exemptions in preparing these financial statements, as permitted by FRS 101.
› The requirement of paragraphs 45(b) and 46 to 52 of IFRS 2 ‘Share Based Payment’
› The requirements of IFRS 7 ‘Financial Instruments: Disclosures’
› The requirements of paragraphs 91 to 99 of IFRS 13 ‘Fair Value Measurement’
› The requirement in paragraph 38 of IAS 1 ‘Presentation of Financial Statements’ to present comparative information in respect of paragraph 79(a)(iv) of IAS 1
› The requirements of paragraphs 10(d), 10a(f), 16, 38A, 38B, 38C, 38D, 40A, 40B, 40C, 40D and 111 of IAS 1 ‘Presentation of Financial Statements’
› The requirements of paragraphs 134 to 136 of IAS 1 ‘Presentation of Financial Statements’
› The requirements of IAS 7 ‘Statement of Cash Flows’
› The requirements of paragraphs 30 and 31 of IAS 8 ‘Accounting Policies, Changes in Accounting Estimates and Errors’
› The requirements of paragraphs 17 and 18A of IAS 24 ‘Related Party Disclosures’
› The requirements in IAS 24 ‘Related party disclosures’ to disclose related party transaction entered into between two or more members of a group
› The requirements of paragraphs 134(d) to 134(f) and 135(c) to 135(e) of IAS 36 ‘Impairment of Assets’
These financial statements are separate financial statements. The Company is exempt from the preparation of consolidated financial statements because these are included in the Annual Report and Financial Statements of the Group.
Where required, equivalent disclosures are given in the Annual Report and Financial Statements of the Group as shown in notes 1 to 9.
Going concern The Directors have made enquiries and have a reasonable expectation that the Company has adequate resources to continue in existence for the foreseeable future. For this reason, they adopt the going concern basis in preparing the financial statements. See also page 46.
Fixed asset investments Investments in subsidiary undertakings are included in the balance sheet at cost less any provision for impairment.
Taxation Income tax comprises current and deferred tax. Income tax is recognised in the income statement except to the extent that it relates to items recognised directly in equity, in which case it is recognised in equity.
Current tax is the expected tax payable on taxable income for the year, using tax rates enacted or substantively enacted at the balance sheet date, and any adjustment to tax payable in respect of previous years.
Deferred tax is provided using the balance sheet method, providing for temporary differences between the carrying amounts of assets and liabilities for financial reporting purposes and the amounts used for taxation purposes. The deferred tax provision is based on the expected manner of realisation or settlement of the carrying amount of the assets and liabilities, using tax rates enacted or substantively enacted at the balance sheet date.
A deferred tax asset is recognised only to the extent that it is probable that future taxable profits will be available against which the asset can be utilised. Deferred tax assets are reduced to the extent that it is no longer probable that the related tax benefit will be realised.
Financial instruments Financial assets and financial liabilities are recognised in the Company’s balance sheet when the Company becomes a party to the contractual provisions of the instrument. The principal financial assets and liabilities of the Company are as follows:
(a) Cash and cash equivalents Cash and cash equivalents comprise cash at bank and in hand, including bank deposits with original maturities of three months or less, net of bank overdrafts where legal right of set-off exists. Bank overdrafts are included within financial liabilities in current liabilities in the balance sheet.
(b) Bank and other borrowings Interest-bearing bank and other borrowings are recorded at the fair value of the proceeds received, net of direct issue costs. Finance charges, including premiums payable on settlement or redemption and direct issue costs, are accounted for on an accruals basis in the income statement using the effective interest method and are added to the carrying value of the instrument to the extent that they are not settled in the period in which they arise.
Kier Group plc | Report and Accounts 2019 195
STRATEGIC REPORT GOVERNANCE FINANCIAL STATEMENTS

Financial Statements Notes to the Company financial statements / continued For the year ended 30 June 2019
196 Kier Group plc | Report and Accounts 2019
1 Accounting policies continued (c) Amounts due from subsidiary undertakings Amounts due from subsidiaries are initially recorded at their fair value. Subsequent to initial recognition, the loans are measured at amortised cost. In accordance with IFRS 9, the Company has undertaken an exercise of calculating the expected credit losses on the amounts due from subsidiaries. The Directors regard the relevant subsidiaries as having a relatively low probability of default on the loans and do not consider that there has been a significant increase in credit risk since the loan was first recognised. By virtue of their participation in Group bank pooling arrangements, the subsidiaries had access to sufficient facilities to enable them to repay the loans, if demanded, at the reporting date. Only immaterial amounts of expected credit losses were calculated and, therefore, the Company has chosen not to adjust the value of the loans for any expected credit loss provisions.
(d) Derivative financial instruments As permitted by IFRS 9, the Group has chosen to continue to apply the hedge accounting requirements of IAS 39.
Derivatives are initially recognised at fair value on the date that the contract is entered into and subsequently remeasured in future periods at their fair value. The method of recognising the resulting change in fair value depends on whether the derivative is designated as a hedging instrument and whether the hedging relationship is effective.
For cash flow hedges the effective part of the change in fair value of these derivatives is recognised directly in other comprehensive income. Any ineffective portion is recognised immediately in the income statement. Amounts accumulated in equity are recycled to the income statement in the periods when the hedged items will affect profit or loss. The fair value of interest rate derivatives is the estimated amount that the Company would receive or pay to terminate the derivatives at the balance sheet date.
If the hedging instrument no longer meets the criteria for hedge accounting, expires or is sold, terminated or exercised, the hedge accounting is discontinued prospectively. The cumulative gain or loss previously recognised in equity remains there until the forecast transaction occurs.
The Company enters into forward contracts in order to hedge against transactional foreign currency exposures. In cases where these derivative instruments are significant, hedge accounting is applied as described above. Where hedge accounting is not applied, changes in fair value of derivatives are recognised in the income statement. Fair values are based on quoted market prices at the balance sheet date.
Share-based payments Share-based payments granted but not vested are valued at the fair value of the shares at the date of grant. This affects the Sharesave and Long Term Incentive Plan (‘LTIP’) schemes. The fair value of these schemes at the date of award is calculated using the Black-Scholes model apart from the total shareholder return element of the LTIP which is based on a Stochastic model.
The cost to the Company of awards to employees under the LTIP scheme is spread on a straight-line basis over the relevant performance period. The scheme awards to senior employees a number of shares which will vest after three years if particular criteria are met. The cost of the scheme is based on the fair value of the shares at the date the options are granted.
Shares purchased and held in trust in connection with the Company’s share schemes are deducted from retained earnings. No gain or loss is recognised within the income statement on the market value of these shares compared with the original cost.
Critical accounting judgements and key sources of estimation uncertainty In the application of the Company accounting policies which are described above, the Directors are required to make judgements, estimates and assumptions about the carrying amounts of assets and liabilities that are not readily apparent from other sources. The estimates are based on historical experience and the factors that are considered to be relevant. Actual results may differ from those estimates.
The estimates are reviewed on an ongoing basis. Revisions to accounting estimates are recognised in the period in which the estimate is revised.
There are no critical judgements, apart from those involving estimates, that the Directors have made in the process of applying the Company’s accounting policies and that have a significant effect on the amounts recognised in the financial statements.
Valuation of investments The Company tests annually whether its investments have suffered any impairment. The recoverable amounts of subsidiaries are determined based on value-in-use calculations or fair value less cost to sell, if held for sale. These calculations require the use of estimates.
Whilst the recoverable amount exceeds the carrying value of the investments and amounts due from subsidiary undertakings, the value-in-use calculation is sensitive to reasonably possible changes in key assumptions that could result in an impairment. The future cash flows that underpin the value-in-use calculations are consistent with those used in the Group’s goodwill impairment assessment. Further details of these assumptions are disclosed in note 12 of the consolidated accounts. 2 Profit for the year As permitted by section 408 of the Companies Act 2006, the Company has elected not to present its own profit and loss account for the year. The profit for the year was £74.6m (2018: £132.8m).
The auditor’s remuneration for audit services to the Company was £0.1m (2018: £0.1m).
3 Information relating to Directors and employees Information relating to Directors’ emoluments, pension entitlements, share options and LTIP interests appears in the Directors’ Remuneration Report on pages 78 to 97. The Company has no employees other than the Directors.
4 Dividends Details of the dividends paid by the Company are included in note 10 to the consolidated financial statements.
Kier Group plc | Report and Accounts 2019196

Kier Group plc | Report and Accounts 2019 197
5 Fixed assets – investments
2019
£m 2018
£m
At 1 July 479.0 173.6
Capital contributions 7.2 305.4
At 30 June 486.2 479.0
Capital contributions of £7.2m were made during the year ended 30 June 2019 in relation to share based payments on behalf of subsidiaries (2018: £5.4m). In the prior year, the Company made a lump sum capital contribution of £300m to Kier Limited.
Details of the Company’s subsidiaries at 30 June 2019 are provided in note 32 to the consolidated financial statements.
6 Debtors
2019
£m 2018
£m
Other debtors 1.9 –
Deferred tax 0.7 0.4
2.6 0.4
7 Creditors
2019
£m2018
£m
Amounts falling due within one year: Borrowings 30.0 12.0
Corporation tax 9.1 7.0
Other creditors 2.5 2.8
41.6 21.8
Amounts falling due after more than one year:
Borrowings 473.4 523.5
Further details on borrowings are included in note 20 to the consolidated financial statements.
Kier Group plc | Report and Accounts 2019 197
STRATEGIC REPORT GOVERNANCE FINANCIAL STATEMENTS

Financial Statements Notes to the Company financial statements / continued For the year ended 30 June 2019
198 Kier Group plc | Report and Accounts 2019
8 Derivative financial instruments The Company has the following cross-currency swaps:
› Three cross-currency swaps taken out in 2013 to hedge the currency risk on a US dollar-denominated loan, nominal value US$28.0m.
› Four cross-currency swaps taken out in 2014 to hedge the currency risk on a US dollar-denominated loan, nominal value US$116.0m.
› Two cross-currency swaps taken out in 2016 to hedge the currency risk on a Euro-denominated loan, nominal value €20.0m
The Company has three interest rate swaps taken out in 2016 to hedge the interest rate risk on a sterling-denominated loan, nominal value £58.5m. During 2017 the Group reduced the value on one of the interest rate swaps from £15.0m to £10.0m and entered into an additional swap of £12.0m bringing the total value to £65.5m.
The Company has assessed the effectiveness of these swaps and concluded that they are 100% effective. Therefore, no amount in relation to hedge ineffectiveness has been charged or credited to the income statement in relation to any cross-currency or interest rate swap.
The following table indicates the periods in which the cash flows associated with cash flow hedges are expected to occur and the fair value of the related hedging instruments:
Expected cash flows
Fair value
£mTotal
£m0–1 year
£m1–2 years
£m 2–5 years
£m
More than5 years
£m
Cross-currency swaps: asset Gross settled inflows – 150.3 11.2 13.9 51.6 73.6Gross settled outflows – (126.5) (9.6) (12.3) (43.5) (61.1)
24.2 23.8 1.6 1.6 8.1 12.5
Interest rate swaps: asset Net settled (0.1) (0.2) (0.1) (0.1) – –
Fair value estimation The table below analyses financial instruments carried at fair value, by valuation method. The different levels have been defined as follows:
Level 1 – Quoted prices (unadjusted) in active markets for identical assets or liabilities.
Level 2 – Inputs other than quoted prices included within level 1 that are observable for the asset or liability, either directly (that is, as prices) or indirectly (that is, derived from prices). The Group uses cross currency and interest rate swaps for hedging. These derivatives are classified as level 2. The prices of derivative transactions have been derived from proprietary models used by the bank counterparties using mid-market mark to market valuations for trades at the close of business on 30 June 2019.
Level 3 – Inputs for the asset or liability that are not based on observable market data (that is, unobservable inputs).
The following table presents the Company’s financial assets and liabilities that are measured at fair value at 30 June 2019.
Level 1
£mLevel 2
£m Level 3
£m Total
£m
Assets
Derivatives used for hedging – Cross-currency swaps – 24.2 – 24.2
Liabilities
Derivatives used for hedging – Interest rate swaps – (0.1) – (0.1)
The following table presents the Company’s financial assets and liabilities that are measured at fair value at 30 June 2018:
Level 1
£mLevel 2
£m Level 3
£m Total
£m
Assets
Derivatives used for hedging – Cross-currency swaps – 15.0 – 15.0Derivatives used for hedging – Interest rate swaps – 0.2 – 0.2
Liabilities
Derivatives used for hedging – Interest rate swaps – – – –
There were no transfers between Levels 1 and 2 during the year.
9 Called up share capital Details of the share capital of the Company are included in note 25 to the consolidated financial statements.
Kier Group plc | Report and Accounts 2019198

Financial Record (unaudited)
Kier Group plc | Report and Accounts 2019 199
Continuing operations
Year ended 30 June 2019
£m20181
£m2017
£m 2016
£m2015
£m
Revenue: Group and share of joint ventures 4,494.4 4,512.8 4,265.2 4,078.7 3,322.5
Less share of joint ventures (357.7) (273.2) (153.5) (90.9) (67.9)
Group revenue 4,136.7 4,239.6 4,111.7 3,987.8 3,254.6
Profit
Group operating profit2 93.4 140.8 115.2 124.3 81.7
Share of post-tax results of joint ventures 30.7 42.7 25.0 14.2 9.1
Profit on disposal of joint ventures – 3.5 5.4 2.6 14.8
Operating profit before exceptional items2 124.1 187.0 145.6 141.1 105.6
Net finance costs before exceptional items2 (26.5) (23.1) (19.5) (24.7) (15.8)
Profit before exceptional items and tax2 97.6 163.9 126.1 116.4 89.8
Amortisation of acquired intangible assets relating to contract rights (24.8) (25.6) (22.3) (21.5) (11.2)
Exceptional finance costs (1.7) (5.1) (2.9) (2.8) (3.6)
Other exceptional items (316.0) (27.0) (115.1) (127.0) (55.1)
Profit/(loss) before tax (244.9) 106.2 (14.2) (34.9) 19.9
Basic earnings per share before exceptional items2, 3 58.2p 136.8p 106.8p 99.5p 101.6p
Dividend per share 4.9p 69.0p 67.5p 64.5p 55.2p
At 30 June
Shareholders’ funds (£m) 519.6 601.1 511.4 576.1 585.4
Net assets per share 320.5p 616.8p 524.8p 600.0p 615.2p
1 The prior year comparative information has been re-presented to reflect the change in the Group’s Alternative Performance Measure. This has had no impact on the statutory reported results for the year ended 30 June 2018.
2 Stated before Exceptional items. Reference to ‘Exceptional items’ includes exceptional items and amortisation of acquired intangible assets, see note 1, page 121, and note 5.
3 Earnings per share for the year to 30 June 2018 restated as a result of the rights issue which completed on 20 December 2018, see note 11 to the financial statements.
Kier Group plc | Report and Accounts 2019 199
STRATEGIC REPORT GOVERNANCE FINANCIAL STATEMENTS

Corporate information
200 Kier Group plc | Report and Accounts 2019
Board of Directors P G Cox CBE A O B Davies B E J Dew S J Kesterton C Veritiero J R Atkinson C F Baroudel A K Bashforth A C Walker
Secretary H E Raven
Headquarters and registered office Kier Group plc Tempsford Hall Sandy Bedfordshire SG19 2BD
Registered number England and Wales 2708030
Financial calendar 15 November 2019 Annual general meeting
March 2020 Announcement of half-year results for the six months ending 31 December 2019
September 2020 Announcement of preliminary full-year results for the year ending 30 June 2020
Independent auditors PricewaterhouseCoopers LLP 1 Embankment Place London WC2N 6RH
Principal bankers Barclays Bank plc 1 Churchill Place London E14 5HP
Lloyds Banking Group plc 10 Gresham Street London EC2V 7AE
HSBC Bank plc Metropolitan House 321 Avebury Boulevard Milton Keynes MK9 2GA
Santander UK plc 2 Triton Square Regent’s Place London NW1 3AN
The Royal Bank of Scotland plc 250 Bishopsgate London EC2M 4AA
Registrars Link Asset Services 34 Beckenham Road Beckenham Kent BR3 4TU
Financial advisers Gleacher Shacklock LLP Cleveland House 33 King Street London SW1Y 6RJ Numis Securities Limited 10 Paternoster Square London EC4M 7LT
Peel Hunt LLP Moor House 120 London Wall London EC2Y 5ET
Kier Group plc | Report and Accounts 2019200

Printed on Amadeus Primo Silk which is produced using wood fibre from fully responsible forests with FSC® certification. All pulps used are Elemental Chlorine Free (ECF). The manufacturing mill holds the ISO 14001 and EU Ecolabel certificates for environmental management.
Printed by Perivan. www.perivan.co.uk
Kier Group plc Tempsford Hall, Sandy Bedfordshire SG19 2BD Tel: 01767 355000 www.kier.co.uk
www.kier.co.ukOur corporate website has key information covering our capabilities, markets, corporate responsibility and investor relations.
Join the conversationEngage with us and keep up with the latest news and developments via social media.

Kier Group plcTempsford Hall, Sandy Bedfordshire SG19 2BD Tel: 01767 355000 www.kier.co.uk
Kier G
roup plc Annual R
eport and Accounts 2019