financial strategy optimization april 2015 final -...
TRANSCRIPT

Financial Strategy OptimizationApril 2015
Legal NoticeThis presentation includes certain forward looking information (FLI) to provide Enbridge shareholders and potential investors with information about Enbridgeand management’s assessment of its future plans and operations, which may not be appropriate for other purposes. FLI is typically identified by words such as“anticipate”, “expect”, “project”, “estimate”, “forecast”, “plan”, “intend”, “illustrative” “target”, “believe” and similar words suggesting future outcomes orstatements regarding an outlook. All statements other than statements of historical fact may be forward‐looking statements. In particular, this Presentationmay contain forward‐looking statements pertaining to the following: expectations regarding the restructuring, revised dividend payout policy and earnings pershare guidance, including the negotiation of definitive terms, satisfaction of conditions and the obtaining of consents and approvals required to complete therestructuring; effect, results and perceived benefits of the restructuring; expected timing and completion of the restructuring and revised dividend payoutpolicy; impact of the restructuring, revised dividend payout policy and adjusted earnings guidance on the Company’s future cash flows and capital projectfunding; impact of the restructuring and revised dividend payout policy on the Company’s credit ratings; and future equity and debt offerings, debt exchangetransactions and proposed financing of the restructuring.
Although we believe that our FLI is reasonable based on the information available today and processes used to prepare it, such statements are not guaranteesof future performance and you are cautioned against placing undue reliance on FLI. By its nature, FLI involves a variety of assumptions, risks, uncertainties andother factors which may cause actual results, levels of activity and achievements to differ materially from those expressed or implied in our FLI. Materialassumptions include those assumptions and notes contained within this presentation and assumptions about: expected timing and terms of the restructuring;anticipated completion of the restructuring; adoption of the revised dividend policy; receipt of regulatory, shareholder and third party consents and approvalswith respect to the restructuring; impact of the restructuring and revised dividend policy on the Company’s future cash flows and capital project funding;impact of the restructuring and revised dividend policy on the Company’s credit ratings; expected earnings/(loss) or adjusted earnings/(loss); expectedearnings/(loss) or adjusted earnings/(loss) per share; expected future cash flows; estimated future dividends; debt and equity market conditions; expectedsupply and demand for crude oil, natural gas and natural gas liquids; prices of crude oil, natural gas and natural gas liquids; expected exchange rates; inflation;interest rates; availability and price of labour and pipeline construction materials; operational reliability; anticipated in‐service dates and weather. Due to theinterdependencies and correlation of these macroeconomic factors, the impact of any one assumption on FLI cannot be determined with certainty, particularlywith respect to expected earnings and associated per unit or per share amounts, or estimated future distributions or dividends.
Our FLI is subject to risks and uncertainties pertaining to the restructuring, revised dividend policy, adjusted earnings guidance, operating performance,regulatory parameters, weather, economic conditions, exchange rates, interest rates and commodity prices, including but not limited to those discussed moreextensively in our filings with Canadian and US securities regulators. The impact of any one risk, uncertainty or factor on any particular FLI is not determinablewith certainty as these are interdependent and our future course of action depends on management’s assessment of all information available at the relevanttime. Except to the extent required by law, we assume no obligation to publicly update or revise any FLI, whether as a result of new information, future eventsor otherwise. All FLI in this presentation is expressly qualified in its entirety by these cautionary statements.
You should be cautioned that there is no assurance that the planned restructuring will be completed in the manner contemplated, or at all, or that the currentmarket conditions and Enbridge’s assumptions and forecasts based on such market conditions will not materially change.
This presentation will make reference to non‐GAAP measures including adjusted earnings, adjusted funds from operations and free cash flow, together withrespective per share amounts. These measures are not measures that have a standardized meaning prescribed by U.S. GAAP and may not be comparable withsimilar measures presented by other issuers. Additional information on the Company’s use of non‐GAAP measures can be found in Management’s Discussionand Analysis available on the Company’s website and www.SEDAR.com.
Table of Contents
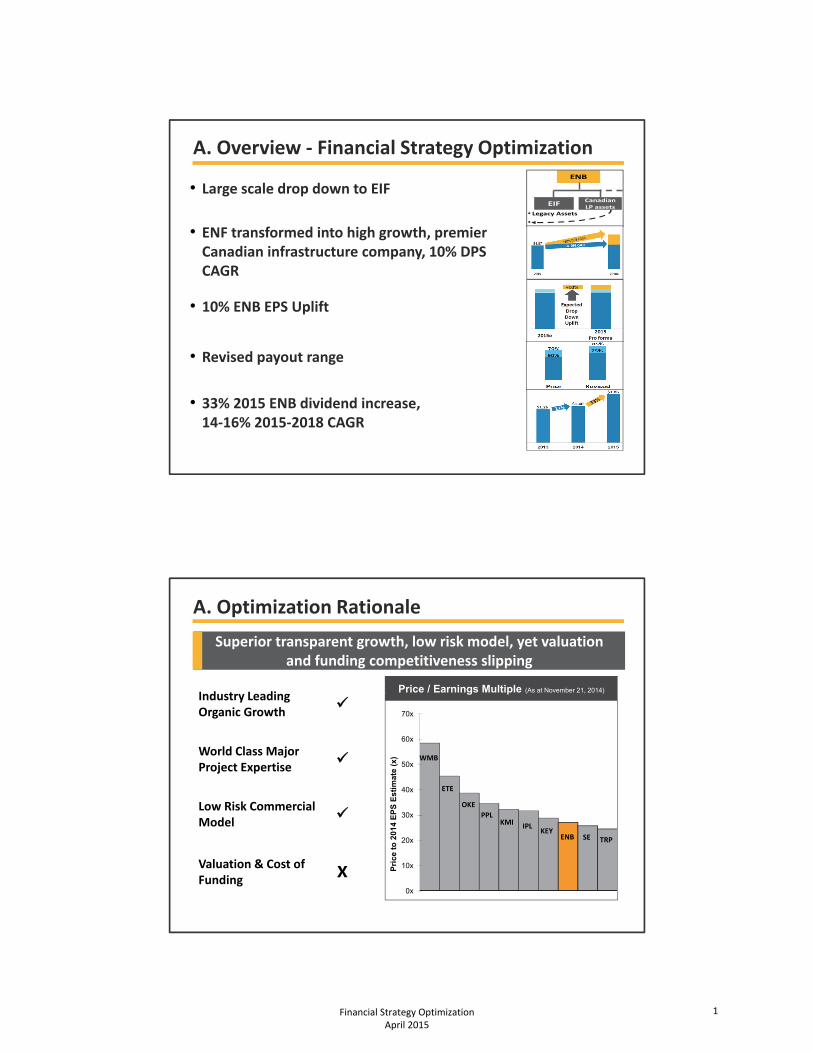
A. Overview ‐ Financial Strategy Optimization
• Large scale drop down to EIF
• ENF transformed into high growth, premier Canadian infrastructure company, 10% DPS CAGR
• 10% ENB EPS Uplift
• Revised payout range
• 33% 2015 ENB dividend increase, 14‐16% 2015‐2018 CAGR
• Legacy Assets
•
ENB
EIFCanadian LP assets
A. Optimization Rationale
Superior transparent growth, low risk model, yet valuation and funding competitiveness slipping
Industry Leading Organic Growth
World Class Major Project Expertise
Low Risk Commercial Model
Valuation & Cost of Funding
X0x
10x
20x
30x
40x
50x
60x
70x
Pri
ce
to
20
14
EP
S E
sti
ma
te (
x)
E Multiple vs. Market CapitalizatE Multiple vs. Market CapitalizatE Multiple vs. Market CapitalizatE Multiple vs. Market CapitalizatE Multiple vs. Market CapitalizatE Multiple vs. Market CapitalizatE Multiple vs. Market CapitalizatE Multiple vs. Market CapitalizatPrice / Earnings Multiple (As at November 21, 2014)
WMB
ETE
OKE
KMI
ENB SE
PPL
IPL
TRPKEY
Financial Strategy Optimization April 2015
1

A. Drop Down Plan Overview
Large scale drop down to EIF enhances shareholder value for both ENB and ENF
AssetsCanadian Liquids Pipelines &
Renewable Energy
Book Value ~$17 billion
Secured Growth Capital ~$15 billion
EBITDA Multiple 13x – 15x
Enbridge Incentive Share 25%
Accretive to ENB Accretive to ENF ENB Economic Interest in EIF(post transaction)
90%
Estimated Closing Mid 2015
Financial Strategy Optimization April 2015
2

A. Existing Structure (Simplified)
• Legacy Assets
Enbridge Inc.
EIF
ENF
EPI EPA EGD GP&P
• Canadian Mainline
• Renewable Energy
• EEP
• Regional Oil Sands System
U.S. LP
19.9%80.1%
Public
42% 58%
ENF – Enbridge Income Fund Holdings (ticker ENF)
EIF – Enbridge Income Fund
EPI – Enbridge Pipelines Inc.
EEP – Enbridge Energy Partners L.P, the U.S. MLP which holds the bulk of the Enbridge U.S. Liquids Pipelines assets
EPA – Enbridge Pipelines (Athabasca) Inc.
U.S. LP – U.S. Liquids Pipelines assets held outside of EEP
EGD – Enbridge Gas Distribution
GP&P – Enbridge’s gas pipelines and processing assets (other than Alliance Pipeline which is within EIF)
Financial Strategy Optimization April 2015
3

A. New Structure (Simplified) ‐ 2015
Enbridge Inc.
EIF
ENF
EEP EGD GP&PU.S. LP
19.9%80.1%
Public
12% 88%
EPI EPA
2015e 2015Pro Forma(Annualized)
2018e
A. ENB Expected EPS Accretion
*Adjusted earnings are non-GAAP measures. For more information on non-GAAP measures please refer to disclosure in MD&A.
Drop down plan expected to contribute an approximate 10% uplift in EPS for each full year from closing to 2018
Adjusted EPS*
Expected Drop Down
Uplift
+10%
$2.05
$2.35
Financial Strategy Optimization April 2015
4
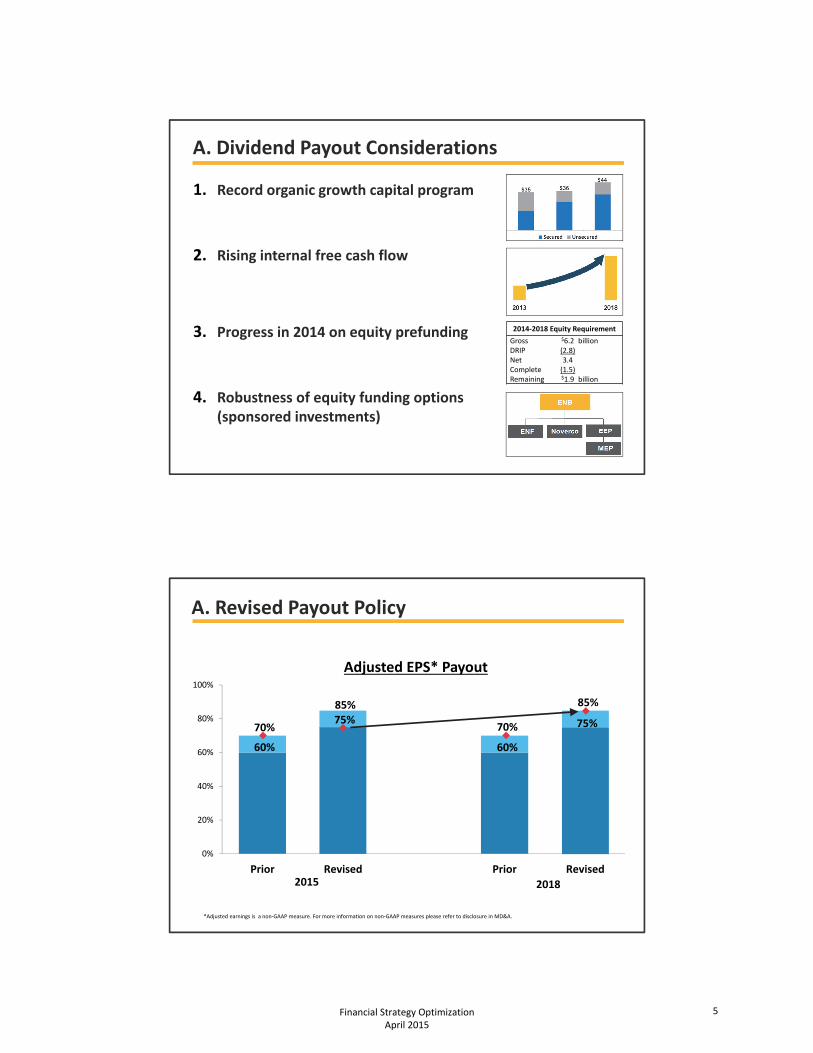
A. Dividend Payout Considerations
1. Record organic growth capital program
2. Rising internal free cash flow
3. Progress in 2014 on equity prefunding
4. Robustness of equity funding options (sponsored investments)
2014‐2018 Equity Requirement
Gross $6.2 billionDRIP (2.8)Net 3.4Complete (1.5)Remaining $1.9 billion
0%
20%
40%
60%
80%
100%
Prior Revised Prior Revised
A. Revised Payout Policy
*Adjusted earnings is a non‐GAAP measure. For more information on non‐GAAP measures please refer to disclosure in MD&A.
70%
60%
85%
60%
70%
85%
75%
Adjusted EPS* Payout
2015 2018
75%
Financial Strategy Optimization April 2015
5
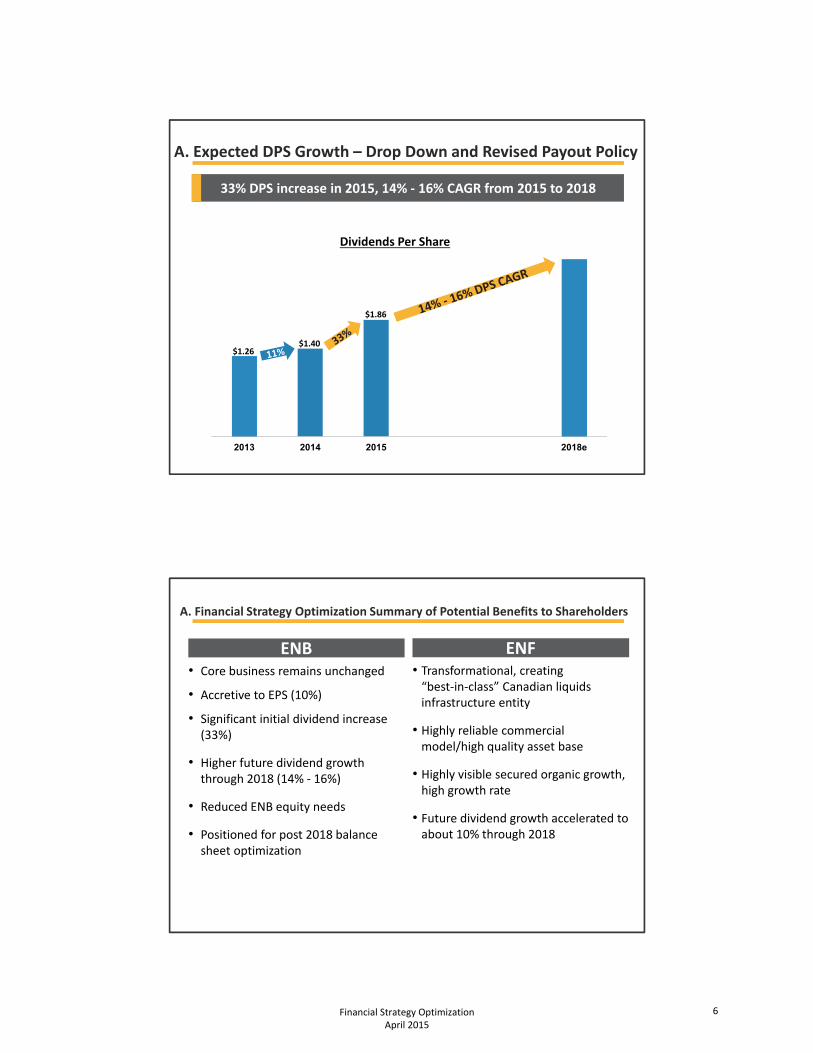
A. Expected DPS Growth – Drop Down and Revised Payout Policy
2013 2014 2015 2018e
Dividends Per Share
$1.26$1.40
$1.86
33% DPS increase in 2015, 14% ‐ 16% CAGR from 2015 to 2018
A. Financial Strategy Optimization Summary of Potential Benefits to Shareholders
• Core business remains unchanged
• Accretive to EPS (10%)
• Significant initial dividend increase (33%)
• Higher future dividend growth through 2018 (14% ‐ 16%)
• Reduced ENB equity needs
• Positioned for post 2018 balance sheet optimization
• Transformational, creating “best‐in‐class” Canadian liquids infrastructure entity
• Highly reliable commercial model/high quality asset base
• Highly visible secured organic growth, high growth rate
• Future dividend growth accelerated to about 10% through 2018
ENB ENF
Financial Strategy Optimization April 2015
6
B. Sponsored Vehicle Enhancement of Enbridge Shareholder Value
• Premium valuation for and lower funding cost of assets with suitable cash flows
• Retention of strategic, development and operational control
• Conservation of capital for incubation of longer term, higher total return opportunities
Notes:
• For many years Enbridge shareholders have been benefitting from enhanced returns resulting fromthe utilization of the sponsored vehicles, EIF and EEP, to hold and fund selected assets within theenterprise group. The drop down of the Canadian Liquids Pipelines assets to EIF involves applying thesame principles on a larger scale.
• The fundamental source of the value enhancement for Enbridge shareholders is the premiumvaluation which the sponsored vehicles can ascribe to suitable cash flow streams, and hence theadvantageous cost of funding which the vehicle can supply for assets which generate suitable cashflows.
• The cash flow characteristics which are favoured by the investors in the sponsored vehicle includesufficient initial cash flow to support a high front end cash payout, with a high degree of assurancearound the future growth. Future growth which may be high, but has a wide range of uncertainty isnot favoured as much.
• The driver of the premium valuation can be, in part, the existence of tax benefits associated with thestructural design of the vehicle. That has been the case for EEP as an MLP. It was the case initially forEIF as a trust, though is no longer.
• The one enduring driver of the premium valuation for both EEP and EIF is the equity market premiumascribed by the income oriented segment of the equity market to high front‐end cash payout.
• The drop down of a suitable asset to a sponsored vehicle enables Enbridge to capture the premiumvaluation for the asset while still retaining control of the asset for strategic, development andoperational purposes.
• Drop downs enable Enbridge to conserve a portion of its capital for incubating longer term, highertotal return opportunities which may not be suitable for a high payout vehicle, while reducing theoverall cost of funding the growth program.
Financial Strategy Optimization April 2015
7
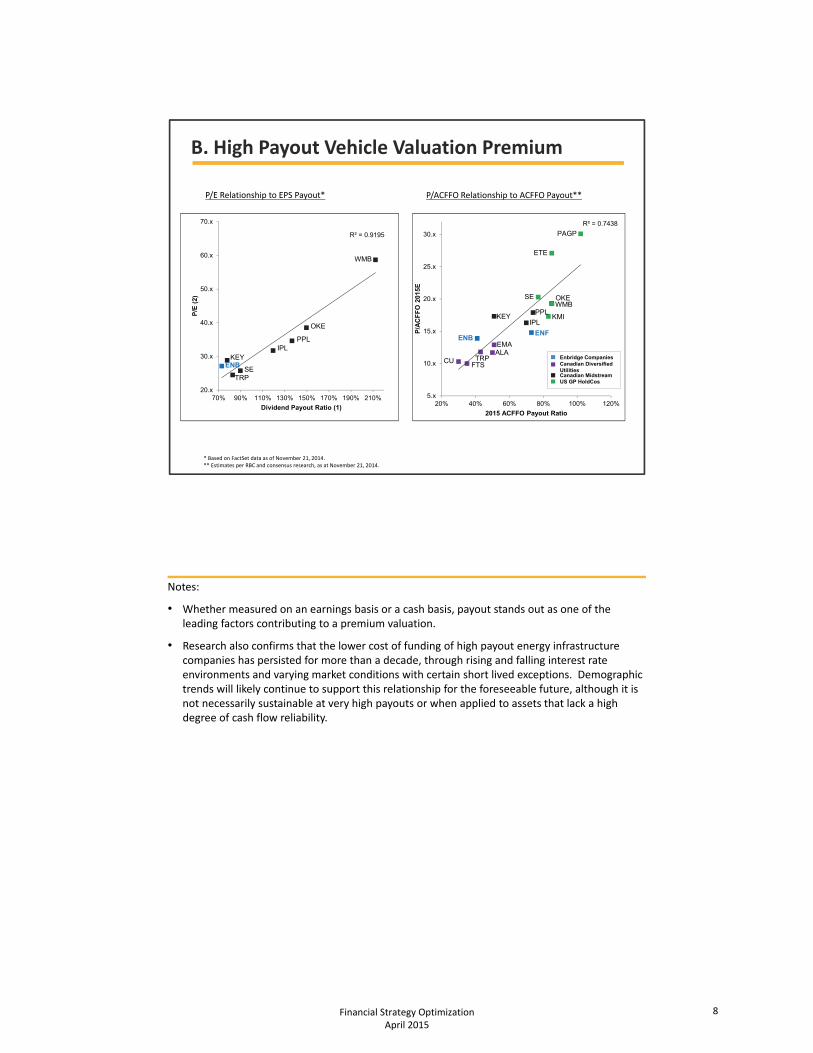
B. High Payout Vehicle Valuation Premium
P/ACFFO Relationship to ACFFO Payout**P/E Relationship to EPS Payout*
R² = 0.9195
20.x
30.x
40.x
50.x
60.x
70.x
70% 90% 110% 130% 150% 170% 190% 210%
P/E
(2)
Dividend Payout Ratio (1)
ENBKEY
TRPSE
IPLPPL
OKE
WMB
R² = 0.7438
5.x
10.x
15.x
20.x
25.x
30.x
20% 40% 60% 80% 100% 120%
P/A
CF
FO
201
5E2015 ACFFO Payout Ratio
Enbridge CompaniesCanadian Diversified UtilitiesCanadian MidstreamUS GP HoldCos
CUFTSTRP
ENB
KEY
EMAALA
IPL
ENF
PPL
SE
KMI
OKEWMB
ETE
PAGP
* Based on FactSet data as of November 21, 2014.** Estimates per RBC and consensus research, as at November 21, 2014.
Notes:
• Whether measured on an earnings basis or a cash basis, payout stands out as one of the leading factors contributing to a premium valuation.
• Research also confirms that the lower cost of funding of high payout energy infrastructure companies has persisted for more than a decade, through rising and falling interest rate environments and varying market conditions with certain short lived exceptions. Demographic trends will likely continue to support this relationship for the foreseeable future, although it is not necessarily sustainable at very high payouts or when applied to assets that lack a high degree of cash flow reliability.
Financial Strategy Optimization April 2015
8
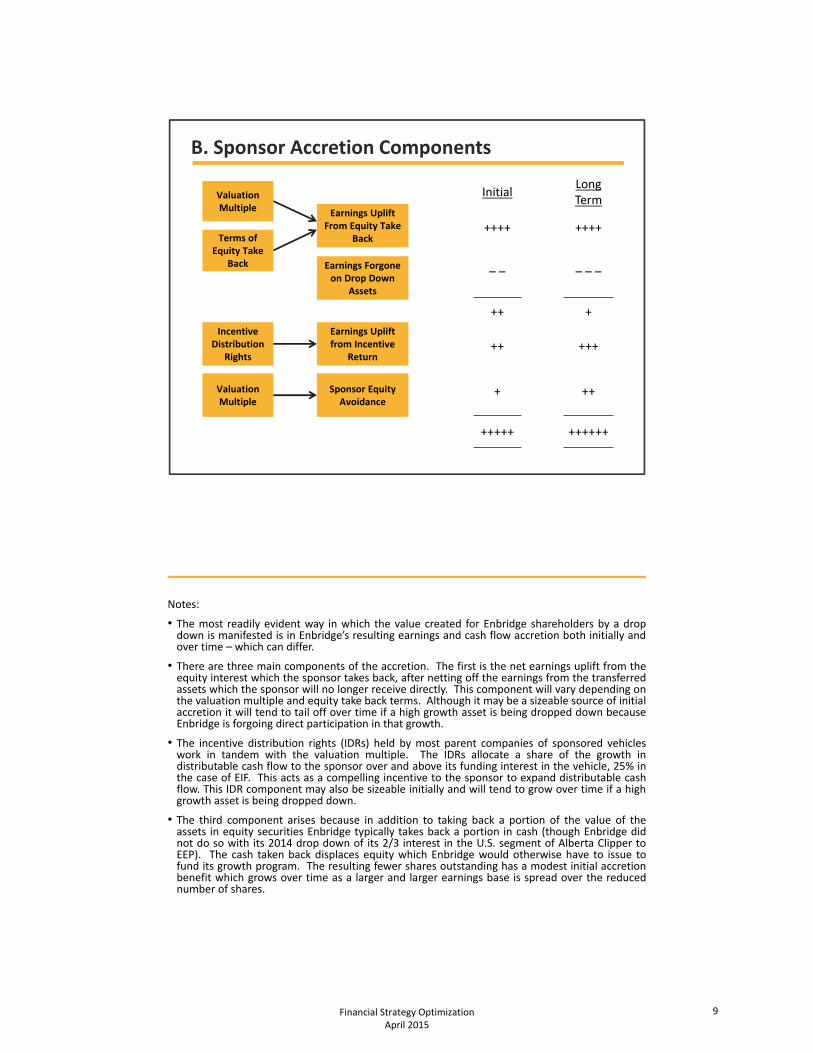
B. Sponsor Accretion Components
InitialLongTerm
++++ ++++
– – – – –
++ +
++ +++
+ ++
+++++ ++++++
Valuation Multiple
Terms of Equity Take
Back Earnings Forgone on Drop Down
Assets
Earnings Uplift From Equity Take
Back
Earnings Uplift from Incentive
Return
Incentive Distribution
Rights
Sponsor Equity Avoidance
Valuation Multiple
Notes:
• The most readily evident way in which the value created for Enbridge shareholders by a dropdown is manifested is in Enbridge’s resulting earnings and cash flow accretion both initially andover time – which can differ.
• There are three main components of the accretion. The first is the net earnings uplift from theequity interest which the sponsor takes back, after netting off the earnings from the transferredassets which the sponsor will no longer receive directly. This component will vary depending onthe valuation multiple and equity take back terms. Although it may be a sizeable source of initialaccretion it will tend to tail off over time if a high growth asset is being dropped down becauseEnbridge is forgoing direct participation in that growth.
• The incentive distribution rights (IDRs) held by most parent companies of sponsored vehicleswork in tandem with the valuation multiple. The IDRs allocate a share of the growth indistributable cash flow to the sponsor over and above its funding interest in the vehicle, 25% inthe case of EIF. This acts as a compelling incentive to the sponsor to expand distributable cashflow. This IDR component may also be sizeable initially and will tend to grow over time if a highgrowth asset is being dropped down.
• The third component arises because in addition to taking back a portion of the value of theassets in equity securities Enbridge typically takes back a portion in cash (though Enbridge didnot do so with its 2014 drop down of its 2/3 interest in the U.S. segment of Alberta Clipper toEEP). The cash taken back displaces equity which Enbridge would otherwise have to issue tofund its growth program. The resulting fewer shares outstanding has a modest initial accretionbenefit which grows over time as a larger and larger earnings base is spread over the reducednumber of shares.
Financial Strategy Optimization April 2015
9

B. ENB Incentive Distribution Right
CAD $ Millions
ENB’s incentive distribution is initially expected to increase significantly as a result of the substantial expansion in EIF distributable cash flow; and is expected to continue to grow rapidly as cash flow continues to build from the Liquids Pipelines organic growth.
Simplified Incentive FormulaAnnual Incentive at Current Rate
EIF Distribution per unit $1.89
Less: Threshold 1.295
Per Unit Excess 0.595
Times: Units Outstanding (millions) 168
Aggregate Excess ($ millions) 100
Times: Incentive Share of Excess 0.25
25
Plus: Base Incentive 8
Pre‐Tax Incentive 33
After Tax Incentive at 25% Tax Rate 25
Note:
• The proposed drop down is anticipated to result in a significant and growing increase in EIF’sdistributable cash flow sufficient both to cover the distribution on the increased number of unitsissued by EIF to fund the acquisition of the assets, and to fund the subsequent organic growth ofthe assets, as well as to provide significant and growing accretion to distributions per unit.
Financial Strategy Optimization April 2015
10

B. Reduced ENB Equity Issuance Needs – Illustrative*
*Illustrative only
$ millions
Proceeds to ENB of ENF public offering 600*
Less: Increased equity requirement due to higher dividend (255)
Net equity reduction 345
Shares millions
Reduction in shares issued due to lower equity requirement ~6.5*
Reduction in DRIP shares issued due to higher share price ~1.5*
~8.0
Notes:
• Enbridge’s standing equity funding strategy has been to rely on preferred share issuances anddrop downs to its sponsored vehicles to supplement retained earnings and DividendReinvestment Plan (DRIP) equity to the greatest possible extent, in preference to public commonequity offerings. The proposed drop down of the Canadian Liquids Pipelines assets is alignedwith this strategy with respect to Enbridge’s 2015 equity funding requirements, though isanticipated to have more extensive impacts than just the 2015 funding aspect. In total, the netreduction in Enbridge common share issuance over 2015 to 2018 is expected to beapproximately $0.8 billion inclusive of the reduced DRIP issuances.
• Enbridge’s 2015 funding plan, and its $2.05 to $2.35 adjusted EPS guidance range, carries a basecase assumption that ENB common shares are issued to meet its residual equity fundingrequirement. The drop down is anticipated to displace a certain amount of the planned equity,which in general could be either less or more than the residual requirement for the year, with acorresponding reduction to the common shares which would otherwise be outstanding.
• Based on $600 million of initial year public equity issuance by ENF, in one or two tranches,Enbridge’s gross equity requirement would be reduced by the same amount. However, theincreased dividend payout adopted as a part of the Financial Strategy Optimization results in a$255 million increase in the 2015 equity requirement, for a net equity reduction of $345 million.
• The reduction in shares issued due to the lower net equity requirement would amount to about6.5 million shares. A smaller share issuance reduction of about 1.5 million would result fromissuing fewer DRIP shares because of the assumed higher Enbridge share price.
Financial Strategy Optimization April 2015
11
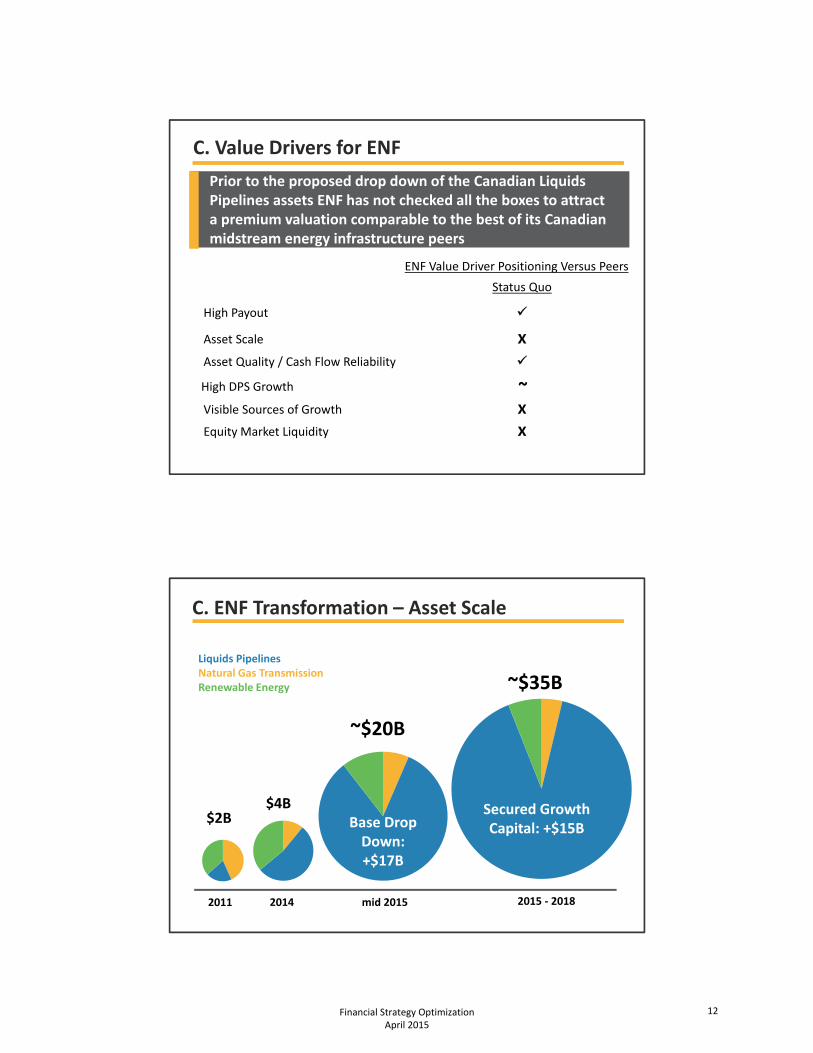
C. Value Drivers for ENF
Prior to the proposed drop down of the Canadian Liquids Pipelines assets ENF has not checked all the boxes to attract a premium valuation comparable to the best of its Canadian midstream energy infrastructure peers
ENF Value Driver Positioning Versus Peers
Status Quo
High Payout
Asset Scale X
Asset Quality / Cash Flow Reliability
High DPS Growth ~Visible Sources of Growth X
Equity Market Liquidity X
C. ENF Transformation – Asset Scale
$2B
~$20B
~$35B
2011
Base Drop Down: +$17B
Secured Growth Capital: +$15B
mid 2015 2015 ‐ 2018
Liquids PipelinesNatural Gas TransmissionRenewable Energy
2014
$4B
Financial Strategy Optimization April 2015
12
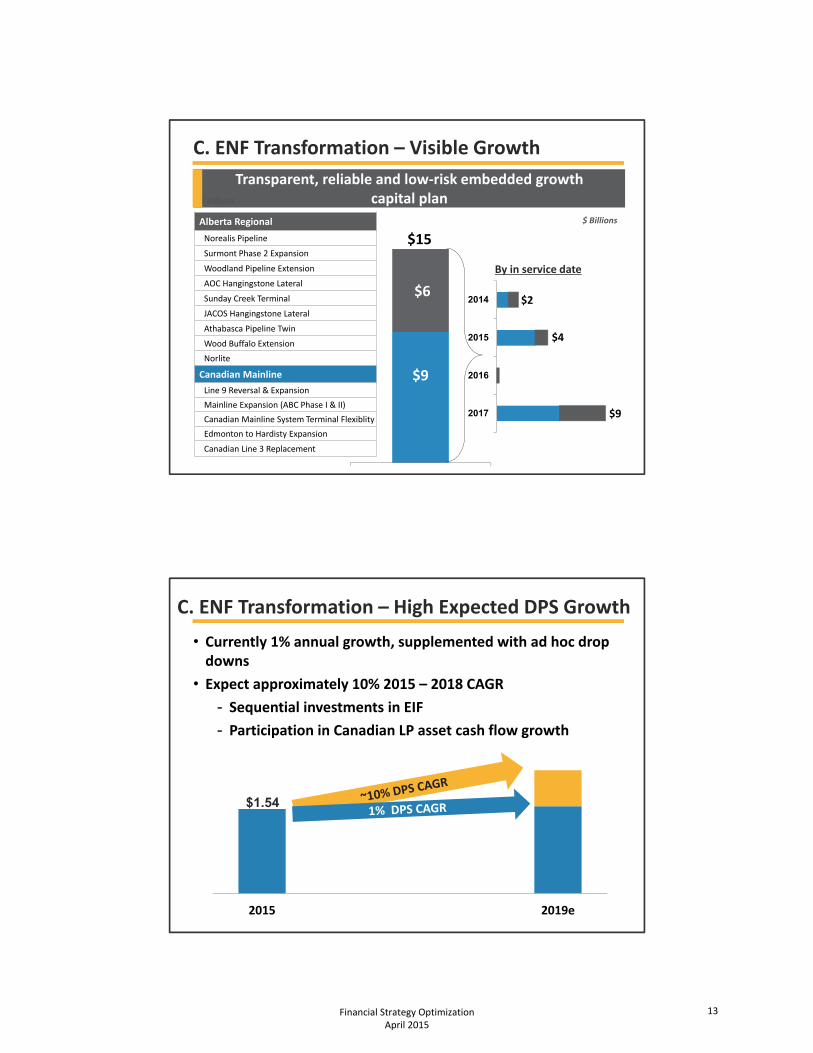
Transparent, reliable and low‐risk embedded growth capital plan
C. ENF Transformation – Visible Growth
$9
$6
2017
2016
2015
2014
$15
By in service date
$ Billions
Alberta Regional
Norealis Pipeline
Surmont Phase 2 Expansion
Woodland Pipeline Extension
AOC Hangingstone Lateral
Sunday Creek Terminal
JACOS Hangingstone Lateral
Athabasca Pipeline Twin
Wood Buffalo Extension
Norlite
Canadian Mainline
Line 9 Reversal & Expansion
Mainline Expansion (ABC Phase I & II)
Canadian Mainline System Terminal Flexiblity
Edmonton to Hardisty Expansion
Canadian Line 3 Replacement
$2
$4
$9
$ Billions
C. ENF Transformation – High Expected DPS Growth
2015 2019e
• Currently 1% annual growth, supplemented with ad hoc drop downs
• Expect approximately 10% 2015 – 2018 CAGR
- Sequential investments in EIF
- Participation in Canadian LP asset cash flow growth
$1.54
Financial Strategy Optimization April 2015
13
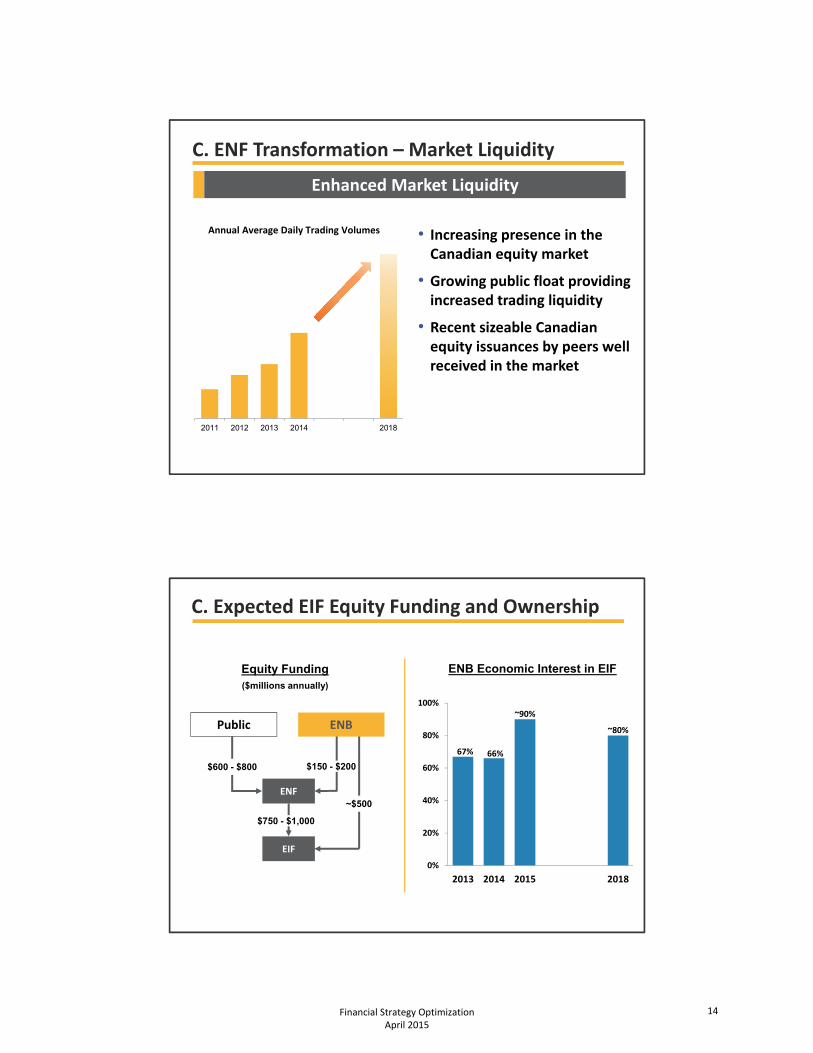
C. ENF Transformation – Market Liquidity
Enhanced Market Liquidity
2011 2012 2013 2014 2018
Annual Average Daily Trading Volumes • Increasing presence in the Canadian equity market
• Growing public float providing increased trading liquidity
• Recent sizeable Canadian equity issuances by peers well received in the market
0%
20%
40%
60%
80%
100%
2013 2014 2015 2018
C. Expected EIF Equity Funding and Ownership
EIF
ENF
67%
~90%
~80%
66%
ENB Economic Interest in EIFEquity Funding ($millions annually)
Public
$600 - $800
$750 - $1,000
$150 - $200
ENB
~$500
Financial Strategy Optimization April 2015
14
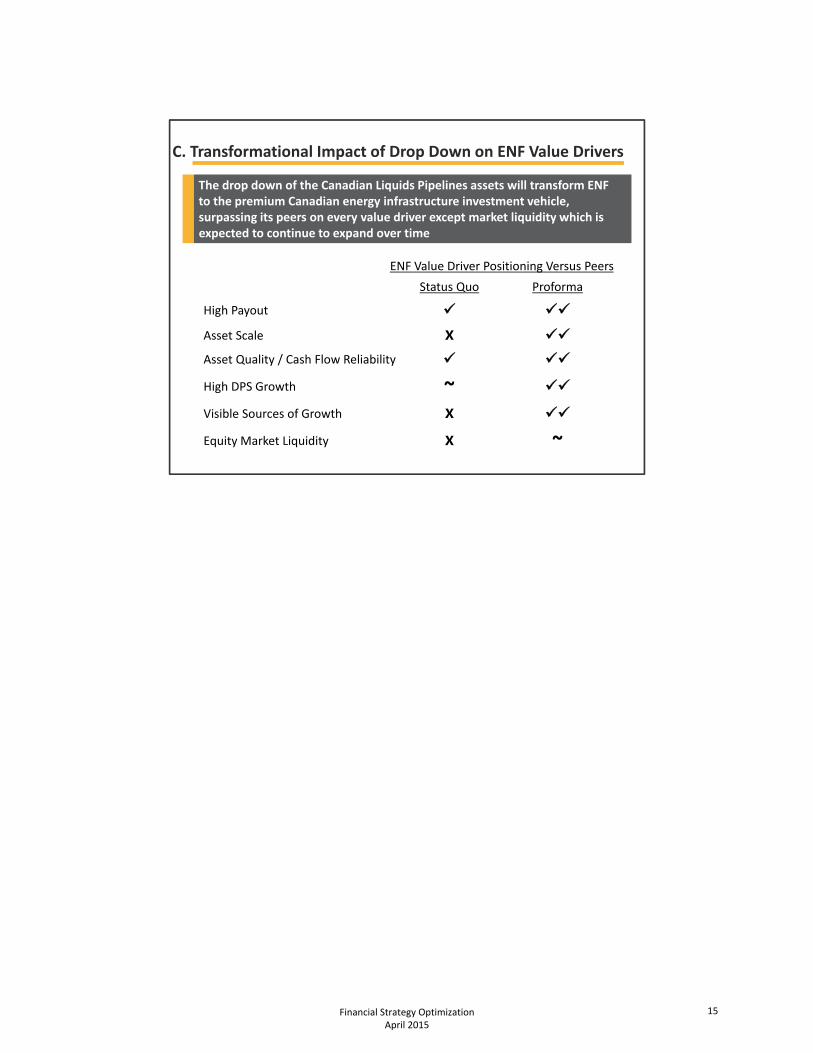
C. Transformational Impact of Drop Down on ENF Value Drivers
The drop down of the Canadian Liquids Pipelines assets will transform ENF to the premium Canadian energy infrastructure investment vehicle, surpassing its peers on every value driver except market liquidity which is expected to continue to expand over time
ENF Value Driver Positioning Versus Peers
Status Quo Proforma
High Payout
Asset Scale X
Asset Quality / Cash Flow Reliability
High DPS Growth ~
Visible Sources of Growth X
Equity Market Liquidity X ~
Financial Strategy Optimization April 2015
15

D. Enbridge Energy Partners
• Potential restructuring would involve transfer of U.S. Liquids Pipelines assets, with embedded growth capital
• $10B in potential drop downs
• Review targeted for completion in first half of 2015
EEP Relative Price PerformanceJanuary 1, 2013 to January 30, 2015
Parallel U.S. restructuring plan under review
80%
90%
100%
110%
120%
130%
140%
150%Date Yield1/1/2013 7.7%1/30/2015 5.6%
EEP: +41%MLP Alerian Index: +40%
Financial Strategy Optimization April 2015
16

E. Enbridge Inc. Creditworthiness Maintenance
Enbridge Inc., the parent company of the Enbridge group will remain as an attractive, low risk, creditworthy fixed income investment opportunity
• Reliable business model ensures stable, predictable cash flows from underlying asset base, all the way through to Enbridge fixed income investors and even to common shareholders
• Enbridge Inc. fixed income investors continue to benefit from a diversified array of low risk cash flow sources relative to operating company investors, further reinforcing cash flow stability
• No incremental debt is added through the financial strategy optimization, consolidated leverage metrics are unchanged and the Enbridge Inc. stand‐alone legal entity debt is expected to be reduced and credit metrics enhanced
• The Enbridge Inc. dividend payout remains conservative relative to most peers, particularly in the context of Enbridge’s low business risk
E. Predictability of Cash Flows
Reliable business model ensures stable, predictable cash flows all the way through to Enbridge Inc. fixed income investors as reflected in Enbridge’s tight EPS guidance range and historical track record of achieving that range
EPS Guidance Adjusted EPS*
$‐
$0.50
$1.00
$1.50
$2.00
$2.50
$3.00
2008 2009 2010 2011 2012 2013 2014 2015e
Financial Strategy Optimization April 2015
17

E. Diversified Sources of Cash Flows
Enbridge Inc.
EIF~30%
ENF
EEP~20%
EGD~20%
GP&P~10%
U.S. LP~10%
EPI EPA
Enbridge Inc. fixed income investors continue to benefit from greater diversity in cash flow sources than operating company investors
U.S. JFA~10%
Total 2015e EBITDA to ENB
E. Consolidated External Debt Map
ENB EPI EIFShort Term
Long Term
Short Term
Long Term
Short Term
Long Term
Current $4.7 $9.5 $0.3 $3.0 $2.5
Migration of CP from ENB to EPI ($2.0) $2.0
Potential ENB Debt Exchange with EIF ($4.0) $4.0
Revised Debt $2.7 $5.5 $2.3 $3.0 $6.5
CAD $ Billions
• $2 billion ENB CP inclusive of back stop credit facilities proposed to be migrated to EPI, with largest construction spend
• ENB’s remaining Canadian CP program $0.5B
• Potential exchange of ENB Canadian term debt for identical term EIF notes assumed to be approximately $4 billion based on outstanding intercompany debt
No incremental debt is added; Enbridge Inc. stand‐alone legal entity debt is reduced
Financial Strategy Optimization April 2015
18
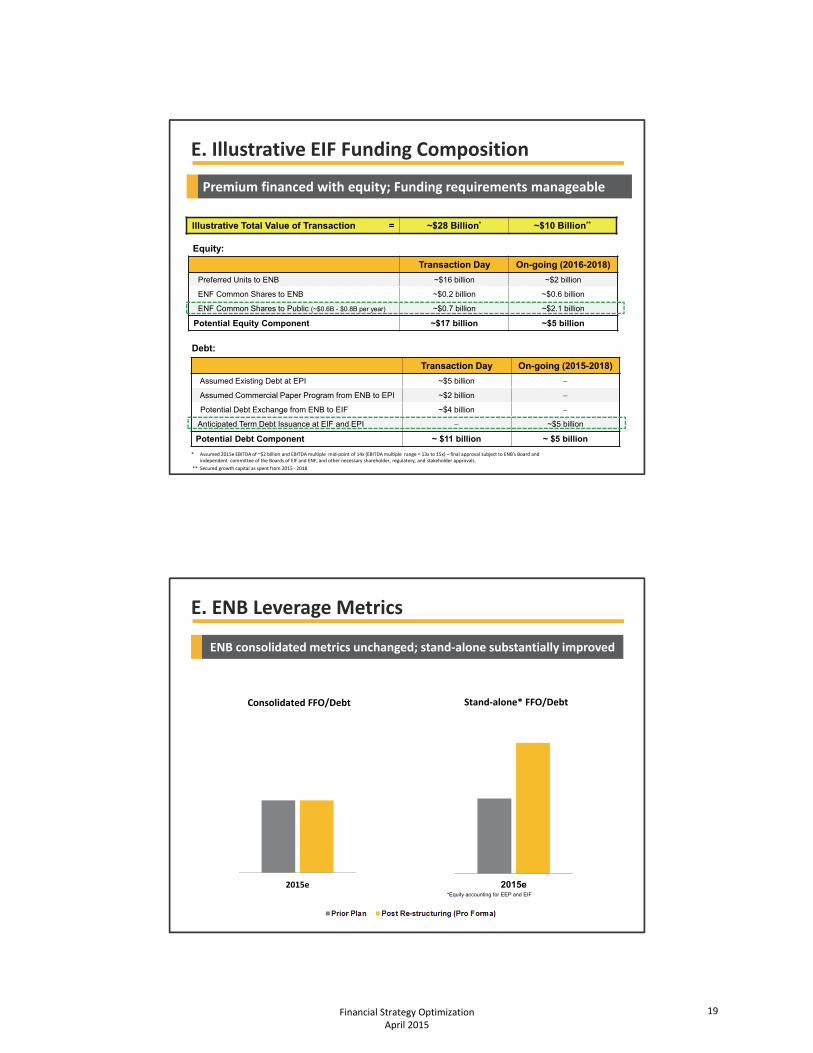
E. Illustrative EIF Funding Composition
Premium financed with equity; Funding requirements manageable
Illustrative Total Value of Transaction = ~$28 Billion* ~$10 Billion**
Equity:
Transaction Day On-going (2016-2018)
Preferred Units to ENB ~$16 billion ~$2 billion
ENF Common Shares to ENB ~$0.2 billion ~$0.6 billion
ENF Common Shares to Public (~$0.6B - $0.8B per year) ~$0.7 billion ~$2.1 billion
Potential Equity Component ~$17 billion ~$5 billion
Debt:
Transaction Day On-going (2015-2018)
Assumed Existing Debt at EPI ~$5 billion
Assumed Commercial Paper Program from ENB to EPI ~$2 billion
Potential Debt Exchange from ENB to EIF ~$4 billion
Anticipated Term Debt Issuance at EIF and EPI ~$5 billion
Potential Debt Component ~ $11 billion ~ $5 billion
* Assumed 2015e EBITDA of ~$2 billion and EBITDA multiple mid‐point of 14x (EBITDA multiple range = 13x to 15x) – final approval subject to ENB's Board and independent committee of the Boards of EIF and ENF, and other necessary shareholder, regulatory, and stakeholder approvals.
** Secured growth capital as spent from 2015 ‐ 2018
E. ENB Leverage Metrics
ENB consolidated metrics unchanged; stand‐alone substantially improved
2015e
Consolidated FFO/Debt
2015e
Stand‐alone* FFO/Debt
*Equity accounting for EEP and EIF
Financial Strategy Optimization April 2015
19

E. Conservative Payout Policy
Higher payout remains conservative compared to peers, particularly in view of Enbridge’s business risk position
Lower Risk Medium Risk Higher Risk
EP
S P
ayo
ut
100%
Business Risk
Pro Forma
Current
Canadian Peer # 1
Canadian Peer # 2
Canadian Peer # 3
US Peer # 4
US Peer # 5
US Peer # 1 US Peer # 2 US Peer # 3
Source: RBC
E. Creditworthiness Maintenance: Key Takeaways
• Enhances long‐term competitiveness and sustainability of Enbridge
• No incremental debt; leverage unchanged on a consolidated basis
- Transaction premium funded with equity
- Conservative dividend payout increase funded with equity
• Enbridge’s cash flow characteristics retain diversified, low risk profile
- Provides highly predictable cash flows to service debt
• Enbridge’s stand‐alone credit metrics expected to benefit from reduced leverage
Financial Strategy Optimization April 2015
20
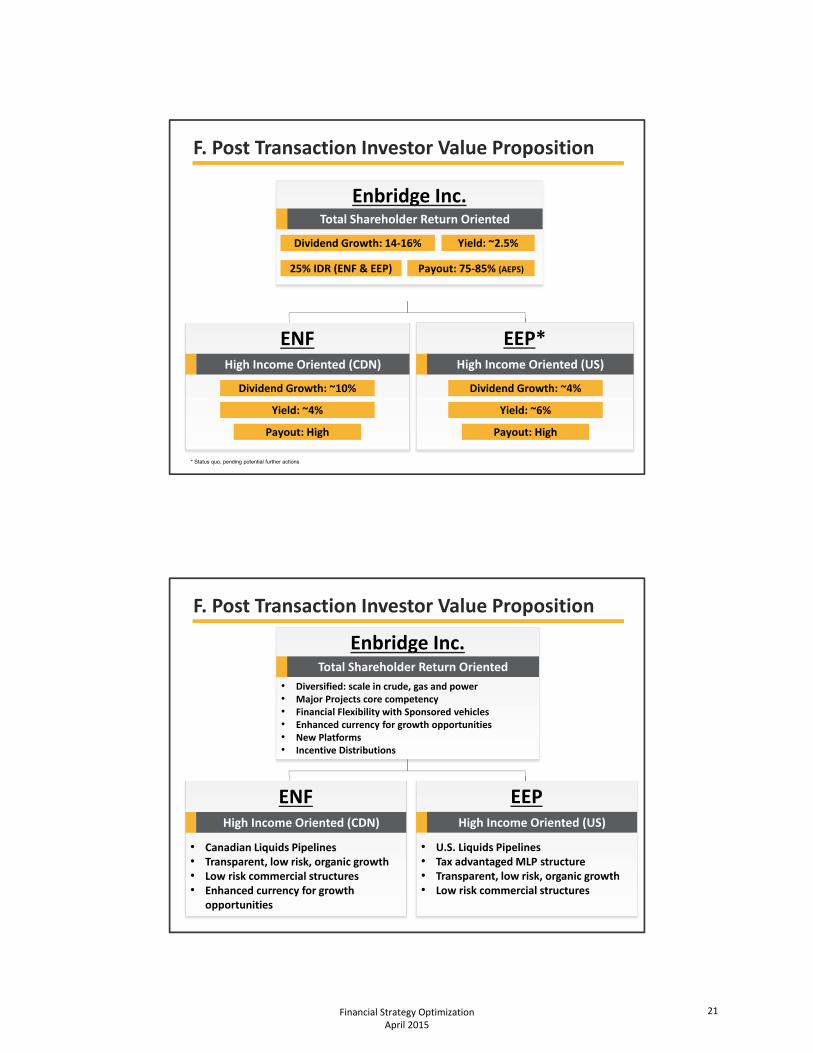
F. Post Transaction Investor Value Proposition
Enbridge Inc.
(CAFD) (CAFD)
Total Shareholder Return Oriented
ENFHigh Income Oriented (CDN)
EEP*High Income Oriented (US)
Dividend Growth: 14‐16% Yield: ~2.5%
25% IDR (ENF & EEP) Payout: 75‐85% (AEPS)
Dividend Growth: ~10%
Yield: ~4%
Payout: High
Dividend Growth: ~4%
Yield: ~6%
Payout: High
* Status quo, pending potential further actions
F. Post Transaction Investor Value Proposition
Enbridge Inc.
• Diversified: scale in crude, gas and power • Major Projects core competency• Financial Flexibility with Sponsored vehicles• Enhanced currency for growth opportunities• New Platforms• Incentive Distributions
(CAFD) (CAFD)
Total Shareholder Return Oriented
ENF
• Canadian Liquids Pipelines • Transparent, low risk, organic growth• Low risk commercial structures• Enhanced currency for growth
opportunities
High Income Oriented (CDN)
EEP
• U.S. Liquids Pipelines• Tax advantaged MLP structure• Transparent, low risk, organic growth• Low risk commercial structures
High Income Oriented (US)
Financial Strategy Optimization April 2015
21
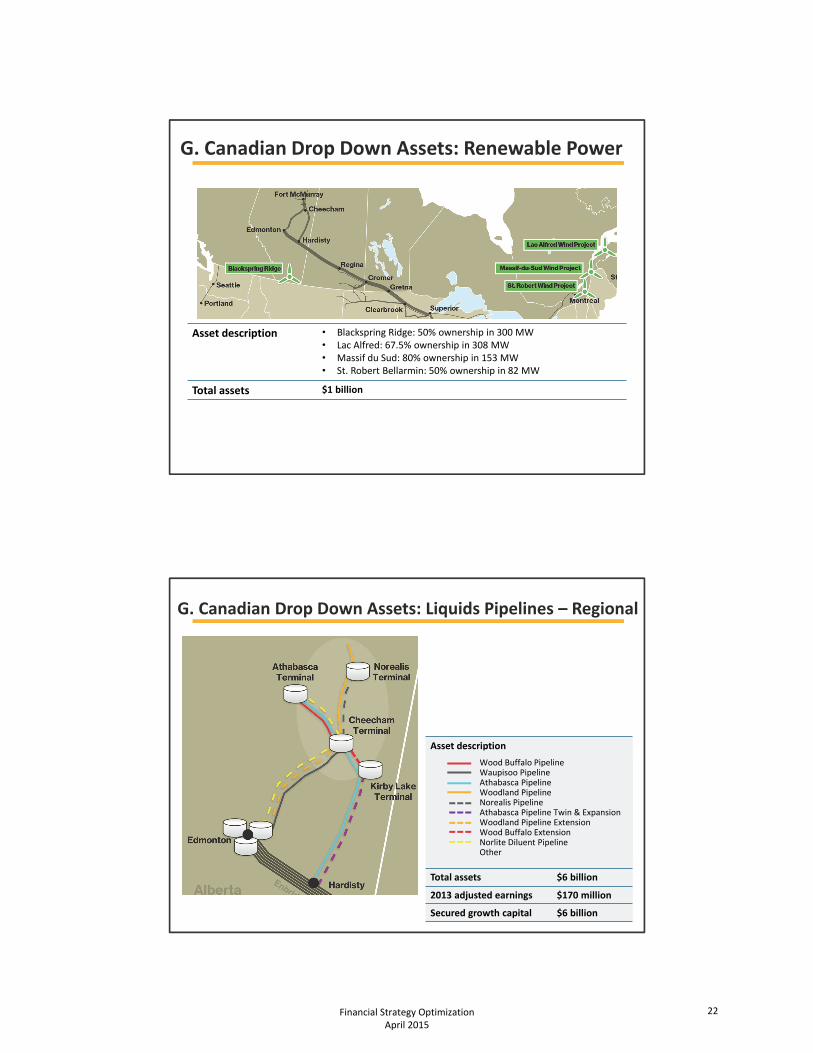
G. Canadian Drop Down Assets: Renewable Power
Asset description • Blackspring Ridge: 50% ownership in 300 MW• Lac Alfred: 67.5% ownership in 308 MW• Massif du Sud: 80% ownership in 153 MW• St. Robert Bellarmin: 50% ownership in 82 MW
Total assets $1 billion
Asset description
Total assets $6 billion
2013 adjusted earnings $170 million
Secured growth capital $6 billion
G. Canadian Drop Down Assets: Liquids Pipelines – Regional
Wood Buffalo PipelineWaupisoo PipelineAthabasca PipelineWoodland PipelineNorealis PipelineAthabasca Pipeline Twin & ExpansionWoodland Pipeline ExtensionWood Buffalo ExtensionNorlite Diluent PipelineOther
Financial Strategy Optimization April 2015
22

Asset description Six adjacent pipelines originating in western Canada that deliver into the US system Lines 7, 8, 9, 10, and 11 that deliver into eastern Canada and the Northwestern U.S.Residual interest in Canadian portion of Southern Lights diluent line
Total assets $10 billion
2013 adjusted earnings $460 million
Secured growth capital $9 billion
G. Canadian Drop Down Assets: Liquids Pipelines – Mainline
Financial Strategy Optimization April 2015
23