financial supplement fourth quarter 2009
TRANSCRIPT
Financial Supplement
(Unaudited)
Fourth Quarter 2009
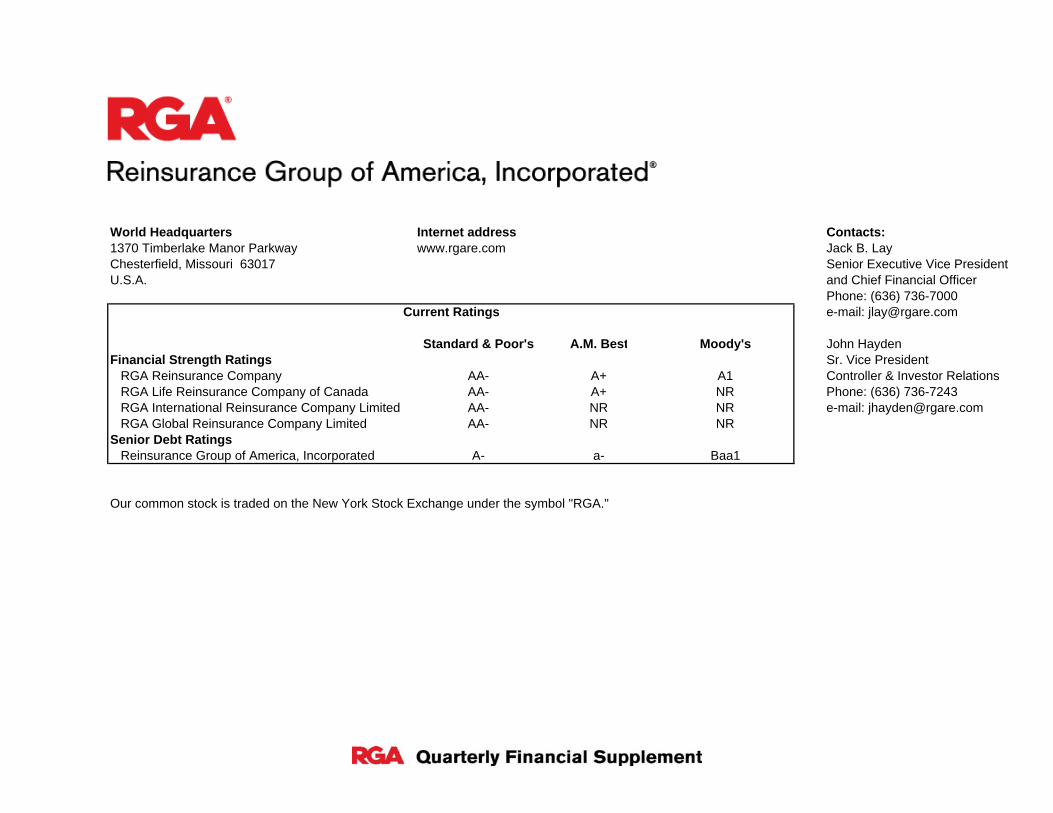
World Headquarters Internet address Contacts:1370 Timberlake Manor Parkway www.rgare.com Jack B. LayChesterfield, Missouri 63017 Senior Executive Vice PresidentU.S.A. and Chief Financial Officer
Phone: (636) 736-7000e-mail: [email protected]
Standard & Poor's A.M. Best Moody's John HaydenFinancial Strength Ratings Sr. Vice President
RGA Reinsurance Company AA- A+ A1 Controller & Investor RelationsRGA Life Reinsurance Company of Canada AA- A+ NR Phone: (636) 736-7243RGA International Reinsurance Company Limited AA- NR NR e-mail: [email protected] Global Reinsurance Company Limited AA- NR NR
Senior Debt RatingsReinsurance Group of America, Incorporated A- a- Baa1
Our common stock is traded on the New York Stock Exchange under the symbol "RGA."
Current Ratings
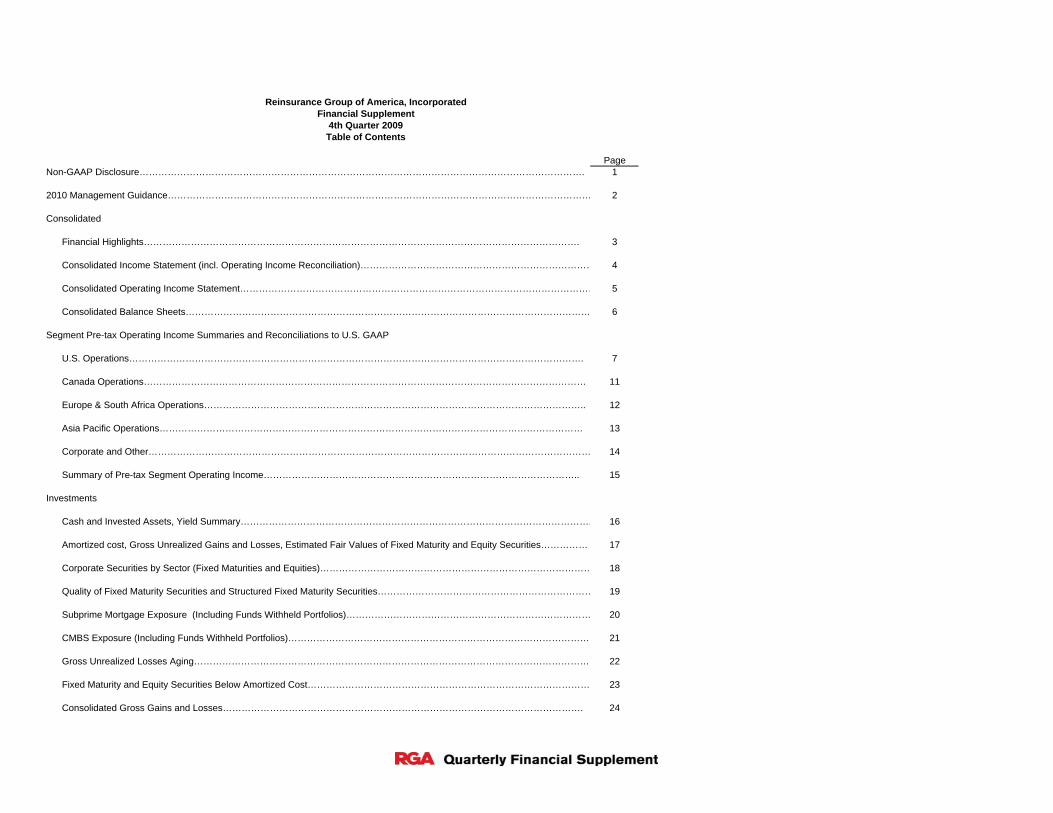
PageNon-GAAP Disclosure……………………………………………………………………………………………………………………………. 1
2010 Management Guidance……………………………………………………………………………………………………………………… 2
Consolidated
Financial Highlights…………………………………………………………………………………………………………………………. 3
Consolidated Income Statement (incl. Operating Income Reconciliation)………………………………………………………………… 4
Consolidated Operating Income Statement…………………………………………………………………………………………………… 5
Consolidated Balance Sheets………………………………………………………………………………………………………………… 6
Segment Pre-tax Operating Income Summaries and Reconciliations to U.S. GAAP
U.S. Operations………………………………………………………………………………………………………………………………. 7
Canada Operations…………………………………………………………………………………………………………………………… 11
Europe & South Africa Operations………………………………………………………………………………………………………….. 12
Asia Pacific Operations……………………………………………………………………………………………………………………… 13
Corporate and Other…………………………………………………………………………………………………………………………… 14
Summary of Pre-tax Segment Operating Income……………………………………………………………………………………….. 15
Investments
Cash and Invested Assets, Yield Summary…………………………………………………………………………………………………. 16
Amortized cost, Gross Unrealized Gains and Losses, Estimated Fair Values of Fixed Maturity and Equity Securities…………… 17
Corporate Securities by Sector (Fixed Maturities and Equities)…………………………………………………………………………… 18
Quality of Fixed Maturity Securities and Structured Fixed Maturity Securities…………………………………………………………… 19
Subprime Mortgage Exposure (Including Funds Withheld Portfolios)…………………………………………………………………… 20
CMBS Exposure (Including Funds Withheld Portfolios)…………………………………………………………………………………… 21
Gross Unrealized Losses Aging……………………………………………………………………………………………………………… 22
Fixed Maturity and Equity Securities Below Amortized Cost……………………………………………………………………………… 23
Consolidated Gross Gains and Losses……………………………………………………………………………………………………. 24
Reinsurance Group of America, IncorporatedFinancial Supplement
Table of Contents4th Quarter 2009
Non-GAAP Disclosures
Additionally, RGA evaluates its stockholder equity position excluding the impact of Accumulated Other Comprehensive Income ("AOCI") since the net unrealized gains or losses included in AOCI primarily relate to changes in interest rates, credit spreads on its investment securities and foreign currency fluctuations that are not permanent and can fluctuate significantly from period to period.
This Financial Supplement is for information purposes only and includes unaudited figures. This report should be read in conjunction with documents filed by Reinsurance Group of America, Incorporated with the SEC.
RGA uses a non-GAAP financial measure called operating income as a basis for analyzing financial results. This measure also serves as a basis for establishing target levels and awards under RGA’s management incentive programs. Management believes that operating income, on a pre-tax and after-tax basis, better measures the ongoing profitability and underlying trends of the company’s continuing operations, primarily because that measure excludes the effect of net investment related gains and losses, as well as changes in the fair value of certain embedded derivatives and related deferred acquisition costs. These items can be volatile, primarily due to the credit market and interest rate environment and are not necessarily indicative of the performance of the company’s underlying businesses. Additionally, operating income excludes any net gain or loss from discontinued operations and the cumulative effect of any accounting changes, which management believes are not indicative of the company’s ongoing operations. The definition of operating income can vary by company and is not considered a substitute for GAAP net income. A reconciliation of income before income taxes of the operating segments to pre-tax operating income (loss) is presented herein.
Reinsurance Group of America, IncorporatedFinancial Supplement
Page 1
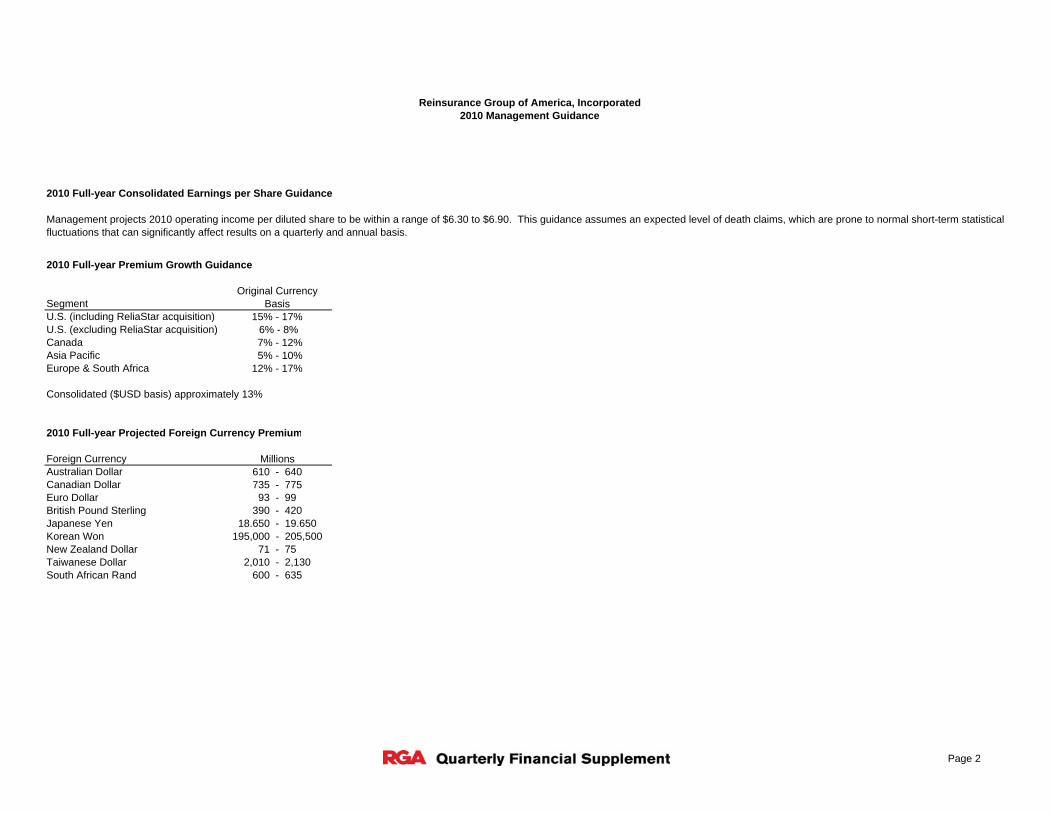
2010 Full-year Consolidated Earnings per Share Guidance
2010 Full-year Premium Growth Guidance
SegmentOriginal Currency
BasisU.S. (including ReliaStar acquisition) 15% - 17%U.S. (excluding ReliaStar acquisition) 6% - 8%Canada 7% - 12%Asia Pacific 5% - 10%Europe & South Africa 12% - 17%
Consolidated ($USD basis) approximately 13%
2010 Full-year Projected Foreign Currency Premium
Foreign Currency MillionsAustralian Dollar 610 - 640Canadian Dollar 735 - 775Euro Dollar 93 - 99British Pound Sterling 390 - 420Japanese Yen 18.650 - 19.650Korean Won 195,000 - 205,500New Zealand Dollar 71 - 75Taiwanese Dollar 2,010 - 2,130South African Rand 600 - 635
Management projects 2010 operating income per diluted share to be within a range of $6.30 to $6.90. This guidance assumes an expected level of death claims, which are prone to normal short-term statistical fluctuations that can significantly affect results on a quarterly and annual basis.
Reinsurance Group of America, Incorporated2010 Management Guidance
Page 2
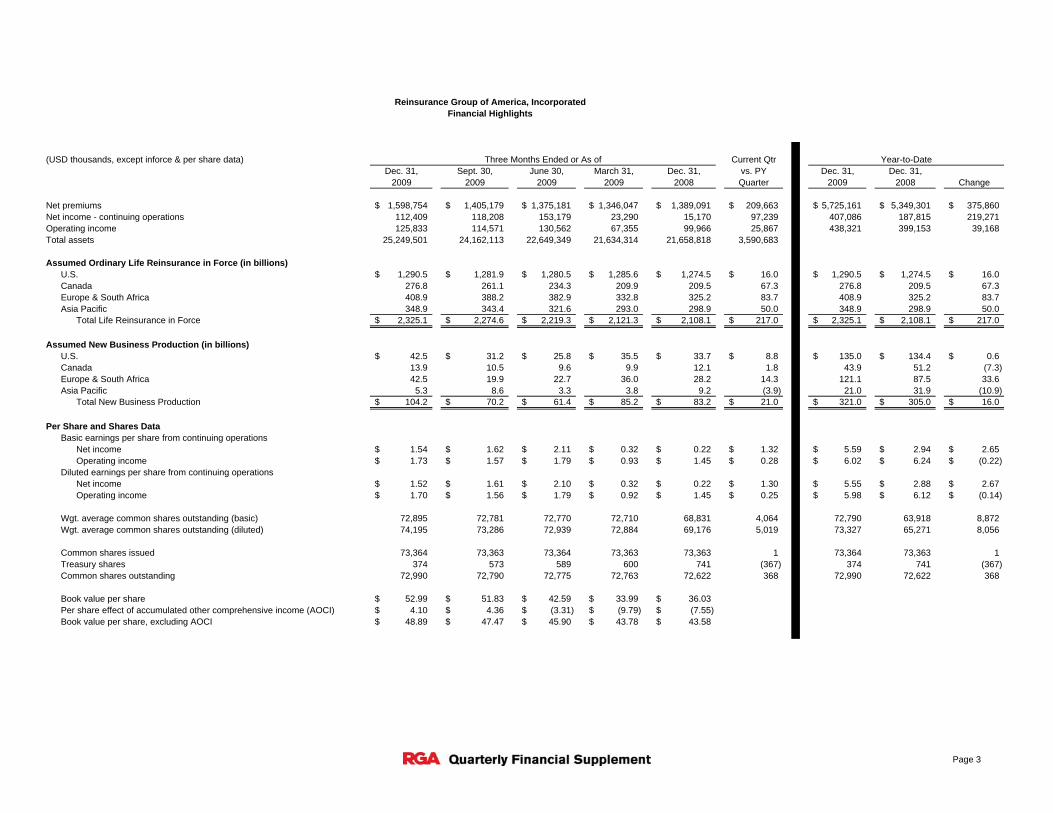
(USD thousands, except inforce & per share data) Current QtrDec. 31, Sept. 30, June 30, March 31, Dec. 31, vs. PY Dec. 31, Dec. 31,
2009 2009 2009 2009 2008 Quarter 2009 2008 Change
Net premiums 1,598,754$ 1,405,179$ 1,375,181$ 1,346,047$ 1,389,091$ 209,663$ 5,725,161$ 5,349,301$ 375,860$ Net income - continuing operations 112,409 118,208 153,179 23,290 15,170 97,239 407,086 187,815 219,271 Operating income 125,833 114,571 130,562 67,355 99,966 25,867 438,321 399,153 39,168 Total assets 25,249,501 24,162,113 22,649,349 21,634,314 21,658,818 3,590,683
Assumed Ordinary Life Reinsurance in Force (in billions)U.S. 1,290.5$ 1,281.9$ 1,280.5$ 1,285.6$ 1,274.5$ 16.0$ 1,290.5$ 1,274.5$ 16.0$ Canada 276.8 261.1 234.3 209.9 209.5 67.3 276.8 209.5 67.3 Europe & South Africa 408.9 388.2 382.9 332.8 325.2 83.7 408.9 325.2 83.7 Asia Pacific 348.9 343.4 321.6 293.0 298.9 50.0 348.9 298.9 50.0
Total Life Reinsurance in Force 2,325.1$ 2,274.6$ 2,219.3$ 2,121.3$ 2,108.1$ 217.0$ 2,325.1$ 2,108.1$ 217.0$
Assumed New Business Production (in billions)U.S. 42.5$ 31.2$ 25.8$ 35.5$ 33.7$ 8.8$ 135.0$ 134.4$ 0.6$ Canada 13.9 10.5 9.6 9.9 12.1 1.8 43.9 51.2 (7.3) Europe & South Africa 42.5 19.9 22.7 36.0 28.2 14.3 121.1 87.5 33.6 Asia Pacific 5.3 8.6 3.3 3.8 9.2 (3.9) 21.0 31.9 (10.9)
Total New Business Production 104.2$ 70.2$ 61.4$ 85.2$ 83.2$ 21.0$ 321.0$ 305.0$ 16.0$
Per Share and Shares DataBasic earnings per share from continuing operations
Net income 1.54$ 1.62$ 2.11$ 0.32$ 0.22$ 1.32$ 5.59$ 2.94$ 2.65$ Operating income 1.73$ 1.57$ 1.79$ 0.93$ 1.45$ 0.28$ 6.02$ 6.24$ (0.22)$
Diluted earnings per share from continuing operationsNet income 1.52$ 1.61$ 2.10$ 0.32$ 0.22$ 1.30$ 5.55$ 2.88$ 2.67$ Operating income 1.70$ 1.56$ 1.79$ 0.92$ 1.45$ 0.25$ 5.98$ 6.12$ (0.14)$
Wgt. average common shares outstanding (basic) 72,895 72,781 72,770 72,710 68,831 4,064 72,790 63,918 8,872 Wgt. average common shares outstanding (diluted) 74,195 73,286 72,939 72,884 69,176 5,019 73,327 65,271 8,056
Common shares issued 73,364 73,363 73,364 73,363 73,363 1 73,364 73,363 1 Treasury shares 374 573 589 600 741 (367) 374 741 (367) Common shares outstanding 72,990 72,790 72,775 72,763 72,622 368 72,990 72,622 368
Book value per share 52.99$ 51.83$ 42.59$ 33.99$ 36.03$ Per share effect of accumulated other comprehensive income (AOCI) 4.10$ 4.36$ (3.31)$ (9.79)$ (7.55)$ Book value per share, excluding AOCI 48.89$ 47.47$ 45.90$ 43.78$ 43.58$
Reinsurance Group of America, IncorporatedFinancial Highlights
Year-to-DateThree Months Ended or As of
Page 3

Current QtrDec. 31, Sept. 30, June 30, March 31, Dec. 31, vs. PY Dec. 31, Dec. 31,
(USD thousands) 2009 2009 2009 2009 2008 Quarter 2009 2008 Change
Revenues:Net premiums 1,598,754$ 1,405,179$ 1,375,181$ 1,346,047$ 1,389,091$ 209,663$ 5,725,161$ 5,349,301$ 375,860$ Investment income, net of related expenses 315,159 299,471 284,636 223,196 196,634 118,525 1,122,462 871,276 251,186 Investment related gains (losses), net
OTTI on fixed maturity securities (40,552) (16,945) (36,942) (34,395) (15,226) (25,326) (128,834) (113,313) (15,521) OTTI on fixed maturity securities transferred to/from AOCI 3,910 (4,000) 16,135 - - 3,910 16,045 - 16,045 Other investment related gains (losses), net 22,505 63,304 98,995 (37,867) (228,333) 250,838 146,937 (533,892) 680,829 Total investment related gains (losses), net (14,137) 42,359 78,188 (72,262) (243,559) 229,422 34,148 (647,205) 681,353
Other revenue 44,059 31,972 75,161 33,859 25,869 18,190 185,051 107,831 77,220 Total revenues 1,943,835 1,778,981 1,813,166 1,530,840 1,368,035 575,800 7,066,822 5,681,203 1,385,619
Benefits and expenses:Claims and other policy benefits 1,370,175 1,155,811 1,123,696 1,169,744 1,150,645 219,530 4,819,426 4,461,932 357,494 Interest credited 128,779 85,153 72,897 36,909 86,989 41,790 323,738 233,179 90,559 Policy acquisition costs and other insurance expenses 179,333 271,789 308,403 198,801 27,529 151,804 958,326 357,899 600,427 Other operating expenses 80,532 76,403 71,095 66,749 53,694 26,838 294,779 242,917 51,862 Interest expense 22,985 5,243 19,595 22,117 21,552 1,433 69,940 76,161 (6,221) Collateral finance facility expense 1,866 2,031 2,057 2,314 7,432 (5,566) 8,268 28,723 (20,455)
Total benefits and expenses 1,783,670 1,596,430 1,597,743 1,496,634 1,347,841 435,829 6,474,477 5,400,811 1,073,666
Income before income taxes - continuing operations 160,165 182,551 215,423 34,206 20,194 139,971 592,345 280,392 311,953
Income tax expense 47,756 64,343 62,244 10,916 5,024 42,732 185,259 92,577 92,682 Income - continuing operations 112,409 118,208 153,179 23,290 15,170 97,239 407,086 187,815 219,271
Loss from discontinued operations - - - - (5,809) 5,809 - (11,019) 11,019 Net income 112,409$ 118,208$ 153,179$ 23,290$ 9,361$ 103,048$ 407,086$ 176,796$ 230,290$
Pre-tax Operating Income Reconciliation:Income before income taxes - continuing operations 160,165 182,551 215,423 34,206 20,194 139,971 592,345 280,392 311,953 Investment and derivative losses (gains) - non-operating (1) 65,676 20,616 148,794 68,312 (146,818) 212,494 303,398 (44,193) 347,591 Change in value of modified coinsurance and funds withheld embedded derivatives (1) (3,028) (51,454) (64,337) 40,425 161,021 (164,049) (78,394) 427,798 (506,192) GMXB embedded derivatives (1) (46,120) (10,127) (161,237) (35,213) 230,775 (276,895) (252,697) 267,482 (520,179) EIA embedded derivatives - interest credited 12,563 (5,248) (12,772) (8,124) 48,896 (36,333) (13,581) 60,263 (73,844) EIA embedded derivatives - policy acq. costs (801) 191 1,748 1,304 (5,697) 4,896 2,442 (7,123) 9,565 DAC offset, net (5,572) 40,780 92,846 1,529 (157,941) 152,369 129,583 (379,453) 509,036 Gain on debt repurchase - - (38,875) - - - (38,875) - (38,875) Operating Income Before Income Taxes 182,883$ 177,309$ 181,590$ 102,439$ 150,430$ 32,453$ 644,221$ 605,166$ 39,055$
After-tax Operating Income Reconciliation:Income - continuing operations 112,409 118,208 153,179 23,290 15,170 97,239 407,086 187,815 219,271Investment and derivative losses (gains) - non-operating (1) 41,347 13,170 96,091 44,117 (95,289) 136,636 194,725 (28,491) 223,216Change in value of modified coinsurance and funds withheld embedded derivatives (1) (1,968) (33,445) (41,819) 26,276 104,664 (106,632) (50,956) 278,069 (329,025)GMXB embedded derivatives (1) (29,978) (6,582) (104,805) (22,888) 150,003 (179,981) (164,253) 173,863 (338,116)EIA embedded derivatives - interest credited 8,166 (3,412) (8,301) (5,281) 31,782 (23,616) (8,828) 39,171 (47,999) EIA embedded derivatives - policy acq. costs (521) 124 1,136 848 (3,703) 3,182 1,587 (4,630) 6,217 DAC offset, net (3,622) 26,508 60,350 993 (102,661) 99,039 84,229 (246,644) 330,873 Gain on debt repurchase - - (25,269) - - - (25,269) - (25,269) Operating Income 125,833$ 114,571$ 130,562$ 67,355$ 99,966$ 25,867$ 438,321$ 399,153$ 39,168$
(1) Included in "Investment related gains (losses), net" on Consolidated GAAP Income Statement
Reinsurance Group of America, IncorporatedConsolidated GAAP Income Statement (incl. Operating Income Reconciliation)
Three Months Ended Year-to-Date
Page 4
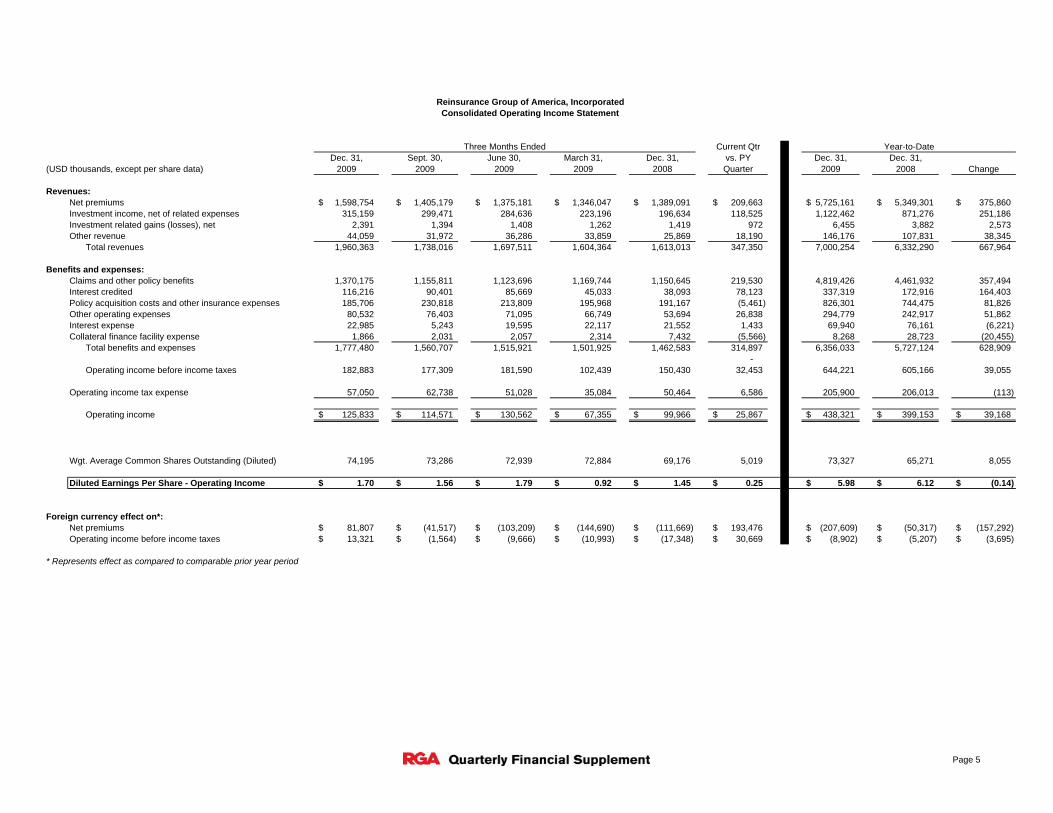
Current QtrDec. 31, Sept. 30, June 30, March 31, Dec. 31, vs. PY Dec. 31, Dec. 31,
(USD thousands, except per share data) 2009 2009 2009 2009 2008 Quarter 2009 2008 Change
Revenues:Net premiums 1,598,754$ 1,405,179$ 1,375,181$ 1,346,047$ 1,389,091$ 209,663$ 5,725,161$ 5,349,301$ 375,860$ Investment income, net of related expenses 315,159 299,471 284,636 223,196 196,634 118,525 1,122,462 871,276 251,186 Investment related gains (losses), net 2,391 1,394 1,408 1,262 1,419 972 6,455 3,882 2,573 Other revenue 44,059 31,972 36,286 33,859 25,869 18,190 146,176 107,831 38,345
Total revenues 1,960,363 1,738,016 1,697,511 1,604,364 1,613,013 347,350 7,000,254 6,332,290 667,964
Benefits and expenses:Claims and other policy benefits 1,370,175 1,155,811 1,123,696 1,169,744 1,150,645 219,530 4,819,426 4,461,932 357,494 Interest credited 116,216 90,401 85,669 45,033 38,093 78,123 337,319 172,916 164,403 Policy acquisition costs and other insurance expenses 185,706 230,818 213,809 195,968 191,167 (5,461) 826,301 744,475 81,826 Other operating expenses 80,532 76,403 71,095 66,749 53,694 26,838 294,779 242,917 51,862 Interest expense 22,985 5,243 19,595 22,117 21,552 1,433 69,940 76,161 (6,221) Collateral finance facility expense 1,866 2,031 2,057 2,314 7,432 (5,566) 8,268 28,723 (20,455)
Total benefits and expenses 1,777,480 1,560,707 1,515,921 1,501,925 1,462,583 314,897 6,356,033 5,727,124 628,909 -
Operating income before income taxes 182,883 177,309 181,590 102,439 150,430 32,453 644,221 605,166 39,055
Operating income tax expense 57,050 62,738 51,028 35,084 50,464 6,586 205,900 206,013 (113)
Operating income 125,833$ 114,571$ 130,562$ 67,355$ 99,966$ 25,867$ 438,321$ 399,153$ 39,168$
Wgt. Average Common Shares Outstanding (Diluted) 74,195 73,286 72,939 72,884 69,176 5,019 73,327 65,271 8,055
Diluted Earnings Per Share - Operating Income 1.70$ 1.56$ 1.79$ 0.92$ 1.45$ 0.25$ 5.98$ 6.12$ (0.14)$
Foreign currency effect on*:Net premiums 81,807$ (41,517)$ (103,209)$ (144,690)$ (111,669)$ 193,476$ (207,609)$ (50,317)$ (157,292)$ Operating income before income taxes 13,321$ (1,564)$ (9,666)$ (10,993)$ (17,348)$ 30,669$ (8,902)$ (5,207)$ (3,695)$
* Represents effect as compared to comparable prior year period
Reinsurance Group of America, IncorporatedConsolidated Operating Income Statement
Three Months Ended Year-to-Date
Page 5
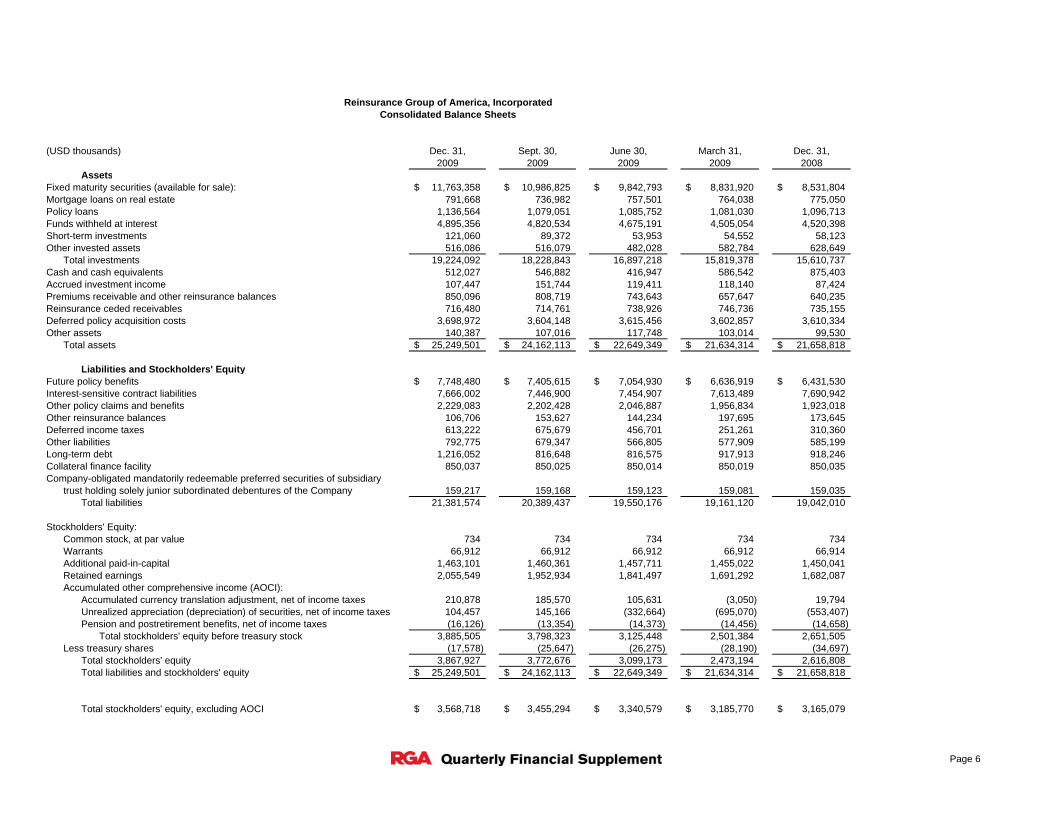
(USD thousands) Dec. 31, Sept. 30, June 30, March 31, Dec. 31,2009 2009 2009 2009 2008
AssetsFixed maturity securities (available for sale): 11,763,358$ 10,986,825$ 9,842,793$ 8,831,920$ 8,531,804$ Mortgage loans on real estate 791,668 736,982 757,501 764,038 775,050 Policy loans 1,136,564 1,079,051 1,085,752 1,081,030 1,096,713 Funds withheld at interest 4,895,356 4,820,534 4,675,191 4,505,054 4,520,398 Short-term investments 121,060 89,372 53,953 54,552 58,123 Other invested assets 516,086 516,079 482,028 582,784 628,649
Total investments 19,224,092 18,228,843 16,897,218 15,819,378 15,610,737 Cash and cash equivalents 512,027 546,882 416,947 586,542 875,403 Accrued investment income 107,447 151,744 119,411 118,140 87,424 Premiums receivable and other reinsurance balances 850,096 808,719 743,643 657,647 640,235 Reinsurance ceded receivables 716,480 714,761 738,926 746,736 735,155 Deferred policy acquisition costs 3,698,972 3,604,148 3,615,456 3,602,857 3,610,334 Other assets 140,387 107,016 117,748 103,014 99,530
Total assets 25,249,501$ 24,162,113$ 22,649,349$ 21,634,314$ 21,658,818$
Liabilities and Stockholders' EquityFuture policy benefits 7,748,480$ 7,405,615$ 7,054,930$ 6,636,919$ 6,431,530$ Interest-sensitive contract liabilities 7,666,002 7,446,900 7,454,907 7,613,489 7,690,942 Other policy claims and benefits 2,229,083 2,202,428 2,046,887 1,956,834 1,923,018 Other reinsurance balances 106,706 153,627 144,234 197,695 173,645 Deferred income taxes 613,222 675,679 456,701 251,261 310,360 Other liabilities 792,775 679,347 566,805 577,909 585,199 Long-term debt 1,216,052 816,648 816,575 917,913 918,246 Collateral finance facility 850,037 850,025 850,014 850,019 850,035 Company-obligated mandatorily redeemable preferred securities of subsidiary
trust holding solely junior subordinated debentures of the Company 159,217 159,168 159,123 159,081 159,035 Total liabilities 21,381,574 20,389,437 19,550,176 19,161,120 19,042,010
Stockholders' Equity:Common stock, at par value 734 734 734 734 734 Warrants 66,912 66,912 66,912 66,912 66,914 Additional paid-in-capital 1,463,101 1,460,361 1,457,711 1,455,022 1,450,041 Retained earnings 2,055,549 1,952,934 1,841,497 1,691,292 1,682,087 Accumulated other comprehensive income (AOCI):
Accumulated currency translation adjustment, net of income taxes 210,878 185,570 105,631 (3,050) 19,794 Unrealized appreciation (depreciation) of securities, net of income taxes 104,457 145,166 (332,664) (695,070) (553,407) Pension and postretirement benefits, net of income taxes (16,126) (13,354) (14,373) (14,456) (14,658)
Total stockholders' equity before treasury stock 3,885,505 3,798,323 3,125,448 2,501,384 2,651,505 Less treasury shares (17,578) (25,647) (26,275) (28,190) (34,697)
Total stockholders' equity 3,867,927 3,772,676 3,099,173 2,473,194 2,616,808 Total liabilities and stockholders' equity 25,249,501$ 24,162,113$ 22,649,349$ 21,634,314$ 21,658,818$
Total stockholders' equity, excluding AOCI 3,568,718$ 3,455,294$ 3,340,579$ 3,185,770$ 3,165,079$
Reinsurance Group of America, IncorporatedConsolidated Balance Sheets
Page 6
Current QtrDec. 31, Sept. 30, June 30, March 31, Dec. 31, vs. PY Dec. 31, Dec. 31,
(USD thousands) 2009 2009 2009 2009 2008 Quarter 2009 2008 Change
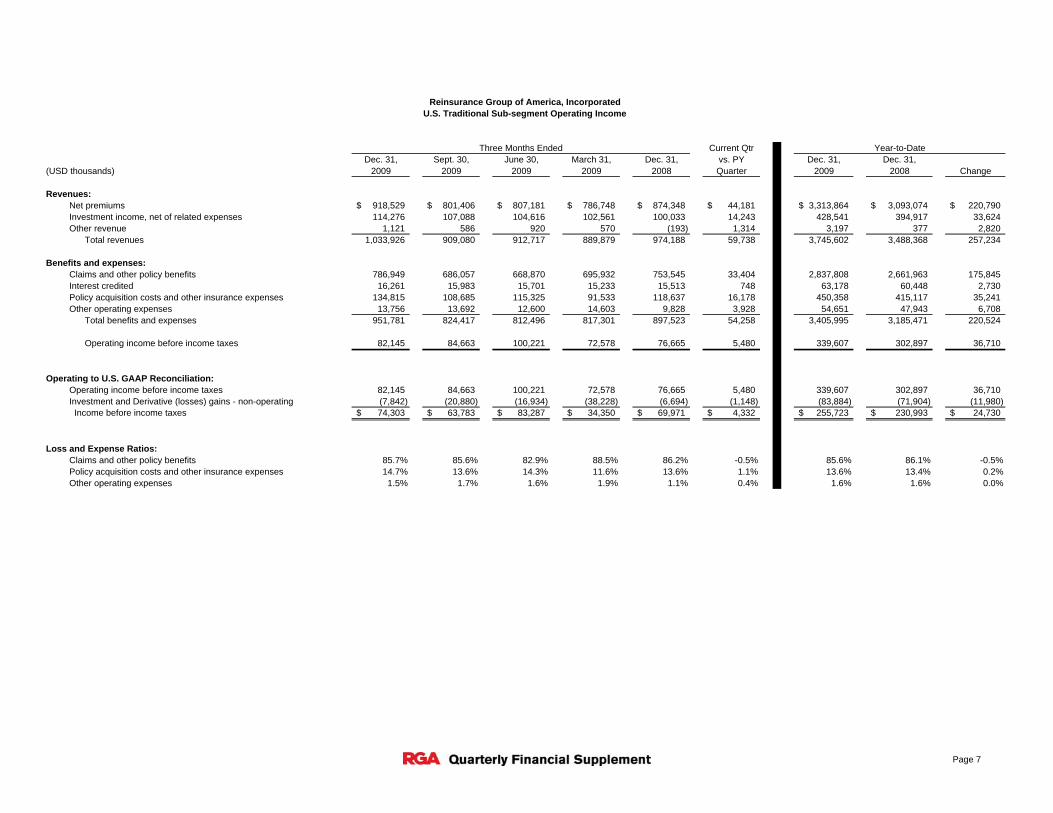
Revenues:Net premiums 918,529$ 801,406$ 807,181$ 786,748$ 874,348$ 44,181$ 3,313,864$ 3,093,074$ 220,790$ Investment income, net of related expenses 114,276 107,088 104,616 102,561 100,033 14,243 428,541 394,917 33,624 Other revenue 1,121 586 920 570 (193) 1,314 3,197 377 2,820
Total revenues 1,033,926 909,080 912,717 889,879 974,188 59,738 3,745,602 3,488,368 257,234
Benefits and expenses:Claims and other policy benefits 786,949 686,057 668,870 695,932 753,545 33,404 2,837,808 2,661,963 175,845 Interest credited 16,261 15,983 15,701 15,233 15,513 748 63,178 60,448 2,730 Policy acquisition costs and other insurance expenses 134,815 108,685 115,325 91,533 118,637 16,178 450,358 415,117 35,241 Other operating expenses 13,756 13,692 12,600 14,603 9,828 3,928 54,651 47,943 6,708
Total benefits and expenses 951,781 824,417 812,496 817,301 897,523 54,258 3,405,995 3,185,471 220,524
Operating income before income taxes 82,145 84,663 100,221 72,578 76,665 5,480 339,607 302,897 36,710
Operating to U.S. GAAP Reconciliation:Operating income before income taxes 82,145 84,663 100,221 72,578 76,665 5,480 339,607 302,897 36,710 Investment and Derivative (losses) gains - non-operating (7,842) (20,880) (16,934) (38,228) (6,694) (1,148) (83,884) (71,904) (11,980) Income before income taxes 74,303$ 63,783$ 83,287$ 34,350$ 69,971$ 4,332$ 255,723$ 230,993$ 24,730$
Loss and Expense Ratios:Claims and other policy benefits 85.7% 85.6% 82.9% 88.5% 86.2% -0.5% 85.6% 86.1% -0.5%Policy acquisition costs and other insurance expenses 14.7% 13.6% 14.3% 11.6% 13.6% 1.1% 13.6% 13.4% 0.2%Other operating expenses 1.5% 1.7% 1.6% 1.9% 1.1% 0.4% 1.6% 1.6% 0.0%
Three Months Ended Year-to-Date
Reinsurance Group of America, IncorporatedU.S. Traditional Sub-segment Operating Income
Page 7
Current QtrDec. 31, Sept. 30, June 30, March 31, Dec. 31, vs. PY Dec. 31, Dec. 31,
(USD thousands except account values) 2009 2009 2009 2009 2008 Quarter 2009 2008 Change
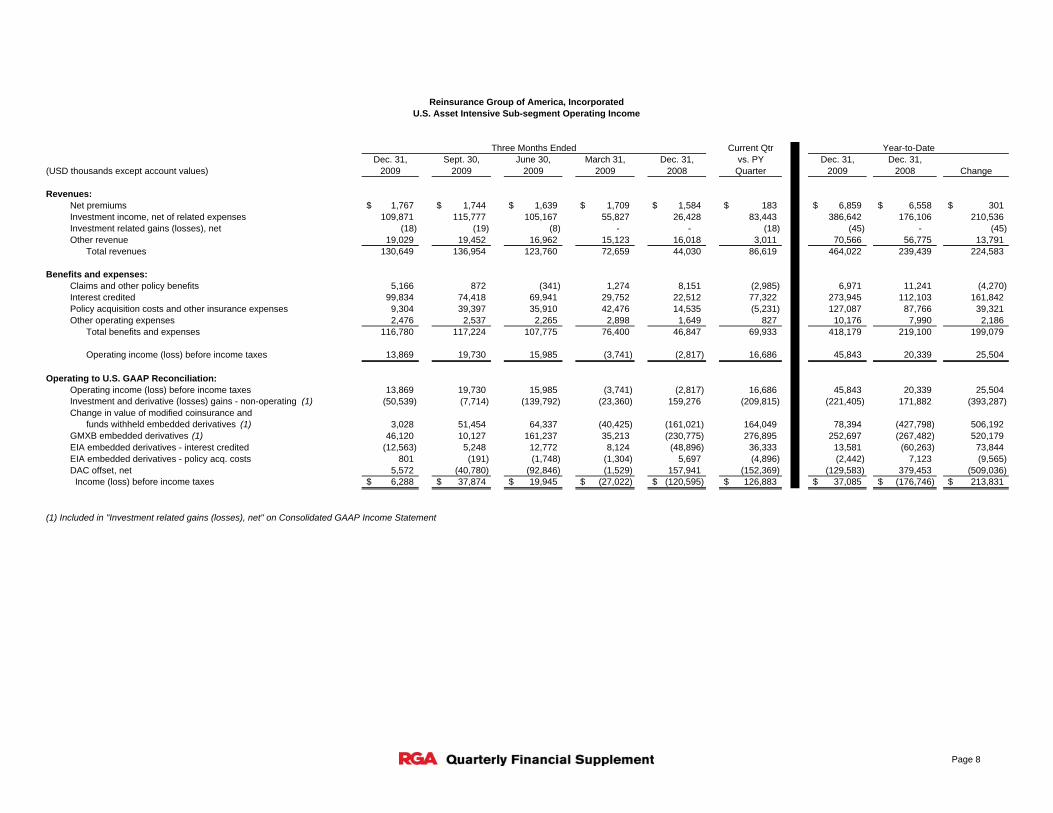
Revenues:Net premiums 1,767$ 1,744$ 1,639$ 1,709$ 1,584$ 183$ 6,859$ 6,558$ 301$ Investment income, net of related expenses 109,871 115,777 105,167 55,827 26,428 83,443 386,642 176,106 210,536 Investment related gains (losses), net (18) (19) (8) - - (18) (45) - (45) Other revenue 19,029 19,452 16,962 15,123 16,018 3,011 70,566 56,775 13,791
Total revenues 130,649 136,954 123,760 72,659 44,030 86,619 464,022 239,439 224,583
Benefits and expenses:Claims and other policy benefits 5,166 872 (341) 1,274 8,151 (2,985) 6,971 11,241 (4,270) Interest credited 99,834 74,418 69,941 29,752 22,512 77,322 273,945 112,103 161,842 Policy acquisition costs and other insurance expenses 9,304 39,397 35,910 42,476 14,535 (5,231) 127,087 87,766 39,321 Other operating expenses 2,476 2,537 2,265 2,898 1,649 827 10,176 7,990 2,186
Total benefits and expenses 116,780 117,224 107,775 76,400 46,847 69,933 418,179 219,100 199,079
Operating income (loss) before income taxes 13,869 19,730 15,985 (3,741) (2,817) 16,686 45,843 20,339 25,504
Operating to U.S. GAAP Reconciliation:Operating income (loss) before income taxes 13,869 19,730 15,985 (3,741) (2,817) 16,686 45,843 20,339 25,504 Investment and derivative (losses) gains - non-operating (1) (50,539) (7,714) (139,792) (23,360) 159,276 (209,815) (221,405) 171,882 (393,287) Change in value of modified coinsurance and
funds withheld embedded derivatives (1) 3,028 51,454 64,337 (40,425) (161,021) 164,049 78,394 (427,798) 506,192 GMXB embedded derivatives (1) 46,120 10,127 161,237 35,213 (230,775) 276,895 252,697 (267,482) 520,179 EIA embedded derivatives - interest credited (12,563) 5,248 12,772 8,124 (48,896) 36,333 13,581 (60,263) 73,844 EIA embedded derivatives - policy acq. costs 801 (191) (1,748) (1,304) 5,697 (4,896) (2,442) 7,123 (9,565) DAC offset, net 5,572 (40,780) (92,846) (1,529) 157,941 (152,369) (129,583) 379,453 (509,036) Income (loss) before income taxes 6,288$ 37,874$ 19,945$ (27,022)$ (120,595)$ 126,883$ 37,085$ (176,746)$ 213,831$
(1) Included in "Investment related gains (losses), net" on Consolidated GAAP Income Statement
Three Months Ended Year-to-Date
Reinsurance Group of America, IncorporatedU.S. Asset Intensive Sub-segment Operating Income
Page 8
Dec. 31, Sept. 30, June 30, March 31, Dec. 31,2009 2009 2009 2009 2008
Annuity account values (in millions):
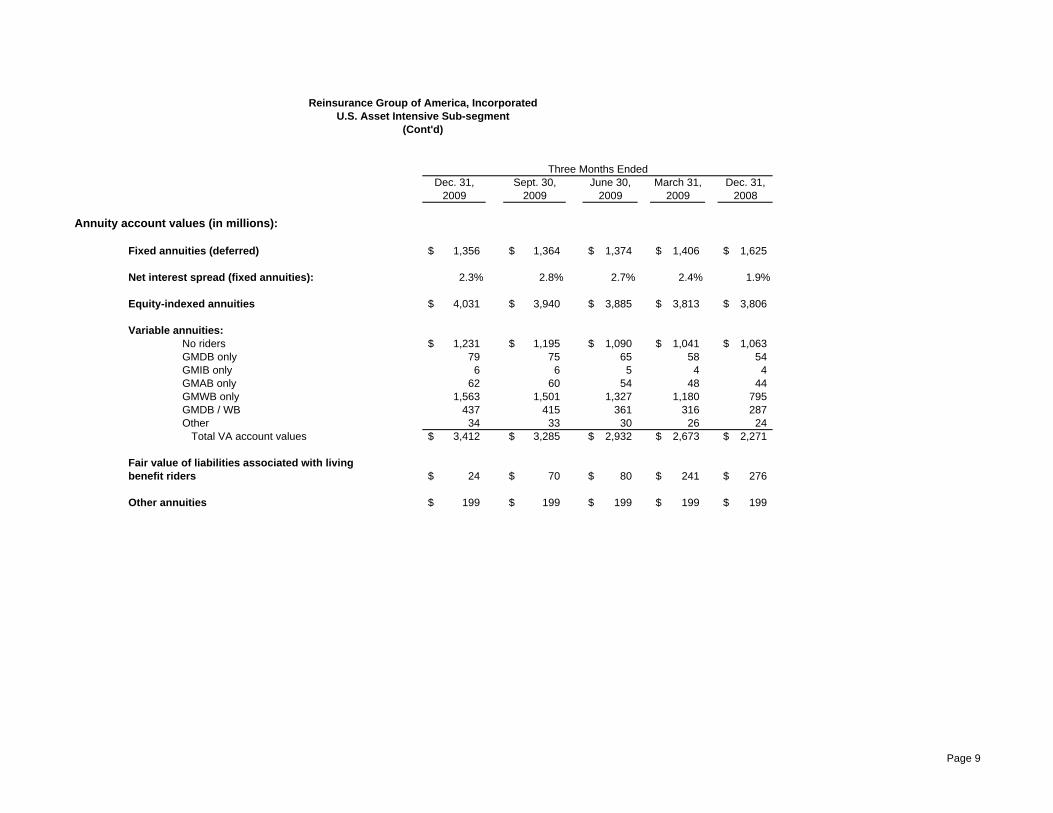
Fixed annuities (deferred) 1,356$ 1,364$ 1,374$ 1,406$ 1,625$
Net interest spread (fixed annuities): 2.3% 2.8% 2.7% 2.4% 1.9%
Equity-indexed annuities 4,031$ 3,940$ 3,885$ 3,813$ 3,806$
Variable annuities:No riders 1,231$ 1,195$ 1,090$ 1,041$ 1,063$ GMDB only 79 75 65 58 54 GMIB only 6 6 5 4 4 GMAB only 62 60 54 48 44 GMWB only 1,563 1,501 1,327 1,180 795 GMDB / WB 437 415 361 316 287 Other 34 33 30 26 24
Total VA account values 3,412$ 3,285$ 2,932$ 2,673$ 2,271$
Fair value of liabilities associated with livingbenefit riders 24$ 70$ 80$ 241$ 276$
Other annuities 199$ 199$ 199$ 199$ 199$
Three Months Ended
Reinsurance Group of America, IncorporatedU.S. Asset Intensive Sub-segment
(Cont'd)
Page 9
Current QtrDec. 31, Sept. 30, June 30, March 31, Dec. 31, vs. PY Dec. 31, Dec. 31,
(USD thousands) 2009 2009 2009 2009 2008 Quarter 2009 2008 Change
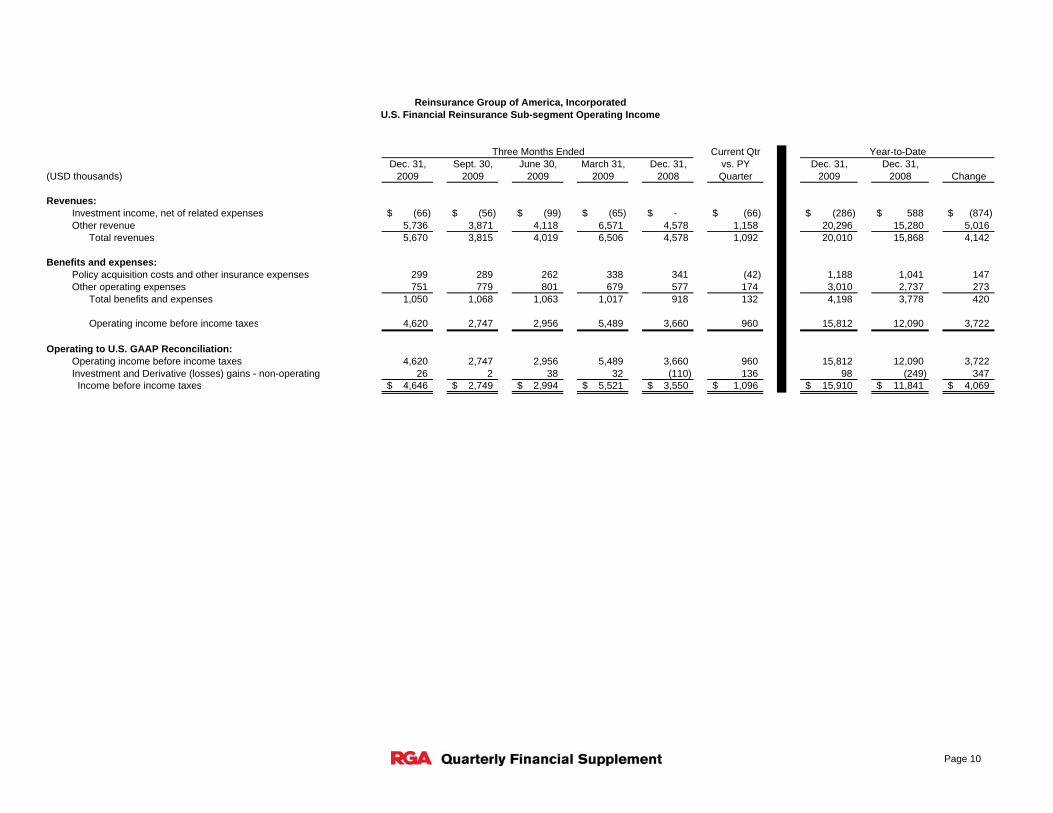
Revenues:Investment income, net of related expenses (66)$ (56)$ (99)$ (65)$ -$ (66)$ (286)$ 588$ (874)$ Other revenue 5,736 3,871 4,118 6,571 4,578 1,158 20,296 15,280 5,016
Total revenues 5,670 3,815 4,019 6,506 4,578 1,092 20,010 15,868 4,142
Benefits and expenses:Policy acquisition costs and other insurance expenses 299 289 262 338 341 (42) 1,188 1,041 147 Other operating expenses 751 779 801 679 577 174 3,010 2,737 273
Total benefits and expenses 1,050 1,068 1,063 1,017 918 132 4,198 3,778 420
Operating income before income taxes 4,620 2,747 2,956 5,489 3,660 960 15,812 12,090 3,722
Operating to U.S. GAAP Reconciliation:Operating income before income taxes 4,620 2,747 2,956 5,489 3,660 960 15,812 12,090 3,722 Investment and Derivative (losses) gains - non-operating 26 2 38 32 (110) 136 98 (249) 347 Income before income taxes 4,646$ 2,749$ 2,994$ 5,521$ 3,550$ 1,096$ 15,910$ 11,841$ 4,069$
Three Months Ended Year-to-Date
Reinsurance Group of America, IncorporatedU.S. Financial Reinsurance Sub-segment Operating Income
Page 10
Current QtrDec. 31, Sept. 30, June 30, March 31, Dec. 31, vs. PY Dec. 31, Dec. 31,
(USD thousands) 2009 2009 2009 2009 2008 Quarter 2009 2008 Change
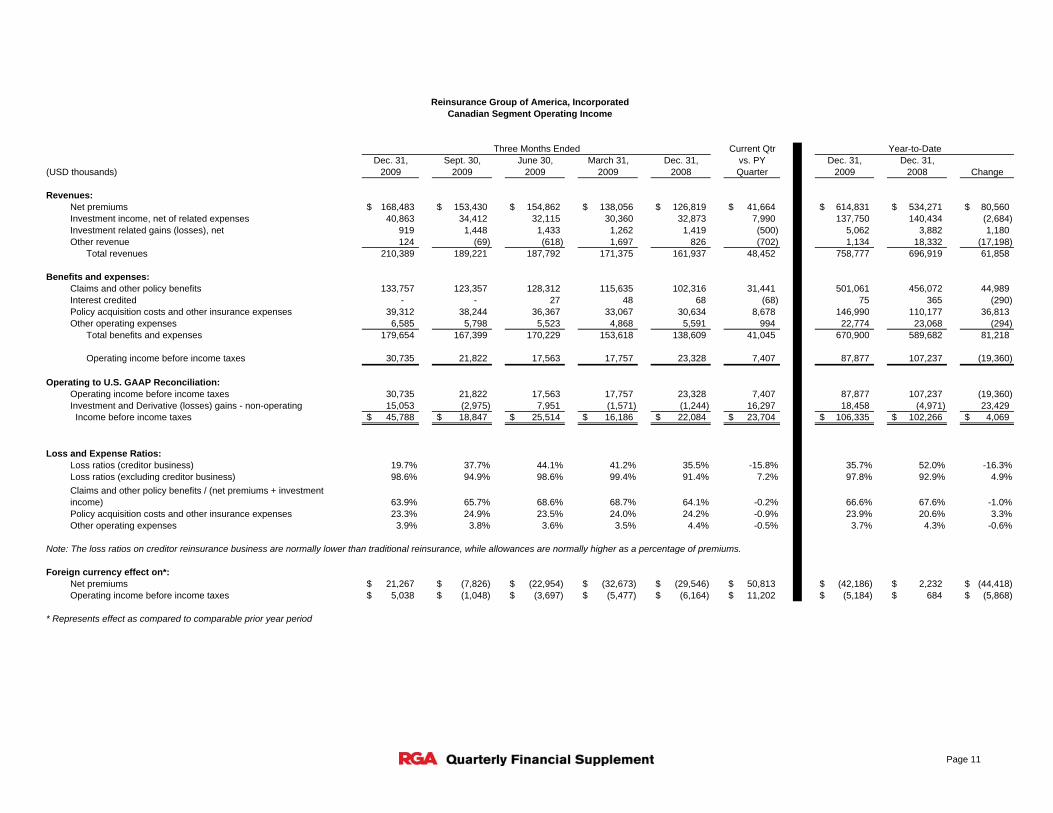
Revenues:Net premiums 168,483$ 153,430$ 154,862$ 138,056$ 126,819$ 41,664$ 614,831$ 534,271$ 80,560$ Investment income, net of related expenses 40,863 34,412 32,115 30,360 32,873 7,990 137,750 140,434 (2,684) Investment related gains (losses), net 919 1,448 1,433 1,262 1,419 (500) 5,062 3,882 1,180 Other revenue 124 (69) (618) 1,697 826 (702) 1,134 18,332 (17,198)
Total revenues 210,389 189,221 187,792 171,375 161,937 48,452 758,777 696,919 61,858
Benefits and expenses:Claims and other policy benefits 133,757 123,357 128,312 115,635 102,316 31,441 501,061 456,072 44,989 Interest credited - - 27 48 68 (68) 75 365 (290) Policy acquisition costs and other insurance expenses 39,312 38,244 36,367 33,067 30,634 8,678 146,990 110,177 36,813 Other operating expenses 6,585 5,798 5,523 4,868 5,591 994 22,774 23,068 (294)
Total benefits and expenses 179,654 167,399 170,229 153,618 138,609 41,045 670,900 589,682 81,218
Operating income before income taxes 30,735 21,822 17,563 17,757 23,328 7,407 87,877 107,237 (19,360)
Operating to U.S. GAAP Reconciliation:Operating income before income taxes 30,735 21,822 17,563 17,757 23,328 7,407 87,877 107,237 (19,360) Investment and Derivative (losses) gains - non-operating 15,053 (2,975) 7,951 (1,571) (1,244) 16,297 18,458 (4,971) 23,429 Income before income taxes 45,788$ 18,847$ 25,514$ 16,186$ 22,084$ 23,704$ 106,335$ 102,266$ 4,069$
Loss and Expense Ratios:Loss ratios (creditor business) 19.7% 37.7% 44.1% 41.2% 35.5% -15.8% 35.7% 52.0% -16.3%Loss ratios (excluding creditor business) 98.6% 94.9% 98.6% 99.4% 91.4% 7.2% 97.8% 92.9% 4.9%
63.9% 65.7% 68.6% 68.7% 64.1% -0.2% 66.6% 67.6% -1.0%Policy acquisition costs and other insurance expenses 23.3% 24.9% 23.5% 24.0% 24.2% -0.9% 23.9% 20.6% 3.3%Other operating expenses 3.9% 3.8% 3.6% 3.5% 4.4% -0.5% 3.7% 4.3% -0.6%
Note: The loss ratios on creditor reinsurance business are normally lower than traditional reinsurance, while allowances are normally higher as a percentage of premiums.
Foreign currency effect on*:Net premiums 21,267$ (7,826)$ (22,954)$ (32,673)$ (29,546)$ 50,813$ (42,186)$ 2,232$ (44,418)$ Operating income before income taxes 5,038$ (1,048)$ (3,697)$ (5,477)$ (6,164)$ 11,202$ (5,184)$ 684$ (5,868)$
* Represents effect as compared to comparable prior year period
Claims and other policy benefits / (net premiums + investment income)
Three Months Ended Year-to-Date
Reinsurance Group of America, IncorporatedCanadian Segment Operating Income
Page 11

Current QtrDec. 31, Sept. 30, June 30, March 31, Dec. 31, vs. PY Dec. 31, Dec. 31,
(USD thousands) 2009 2009 2009 2009 2008 Quarter 2009 2008 Change
Revenues:Net premiums 224,510$ 204,169$ 180,017$ 173,256$ 156,898$ 67,612$ 781,952$ 707,768$ 74,184$ Investment income, net of related expenses 8,869 8,502 8,120 6,749 7,599 1,270 32,240 32,993 (753) Other revenue 10,536 102 538 260 240 10,296 11,436 401 11,035
Total revenues 243,915 212,773 188,675 180,265 164,737 79,178 825,628 741,162 84,466
Benefits and expenses:Claims and other policy benefits 201,131 164,118 147,018 144,218 106,776 94,355 656,485 532,292 124,193 Policy acquisition costs and other insurance expenses (4,710) 21,277 10,369 10,817 14,607 (19,317) 37,753 69,422 (31,669) Other operating expenses 23,608 20,665 18,911 17,117 16,945 6,663 80,301 65,075 15,226
Total benefits and expenses 220,029 206,060 176,298 172,152 138,328 81,701 774,539 666,789 107,750
Operating income before income taxes 23,886 6,713 12,377 8,113 26,409 (2,523) 51,089 74,373 (23,284)
Operating to U.S. GAAP Reconciliation:Operating income before income taxes 23,886 6,713 12,377 8,113 26,409 (2,523) 51,089 74,373 (23,284) Investment and Derivative (losses) gains - non-operating 576 268 (14) 422 (4,598) 5,174 1,252 (8,687) 9,939 Income before income taxes 24,462$ 6,981$ 12,363$ 8,535$ 21,811$ 2,651$ 52,341$ 65,686$ (13,345)$
Loss and Expense Ratios:Claims and other policy benefits 89.6% 80.4% 81.7% 83.2% 68.1% 21.5% 84.0% 75.2% 8.8%Policy acquisition costs and other insurance expenses -2.1% 10.4% 5.8% 6.2% 9.3% -11.4% 4.8% 9.8% -5.0%Other operating expenses 10.5% 10.1% 10.5% 9.9% 10.8% -0.3% 10.3% 9.2% 1.1%
Foreign currency effect on*:Net premiums 15,308$ (24,713)$ (41,195)$ (56,890)$ (43,150)$ 58,458$ (107,490)$ (47,695)$ (59,795)$ Operating income before income taxes 4,672$ (614)$ (1,747)$ (3,991)$ (7,816)$ 12,488$ (1,680)$ (8,554)$ 6,874$
Critical illness net premiums 58,898$ 54,206$ 52,697$ 46,323$ 49,471$ 9,427$ 212,124$ 236,424$ (24,300)$
* Represents effect as compared to comparable prior year period
Three Months Ended Year-to-Date
Reinsurance Group of America, IncorporatedEurope & South Africa Segment Operating Income
Page 12
Current QtrDec. 31, Sept. 30, June 30, March 31, Dec. 31, vs. PY Dec. 31, Dec. 31,
(USD thousands) 2009 2009 2009 2009 2008 Quarter 2009 2008 Change
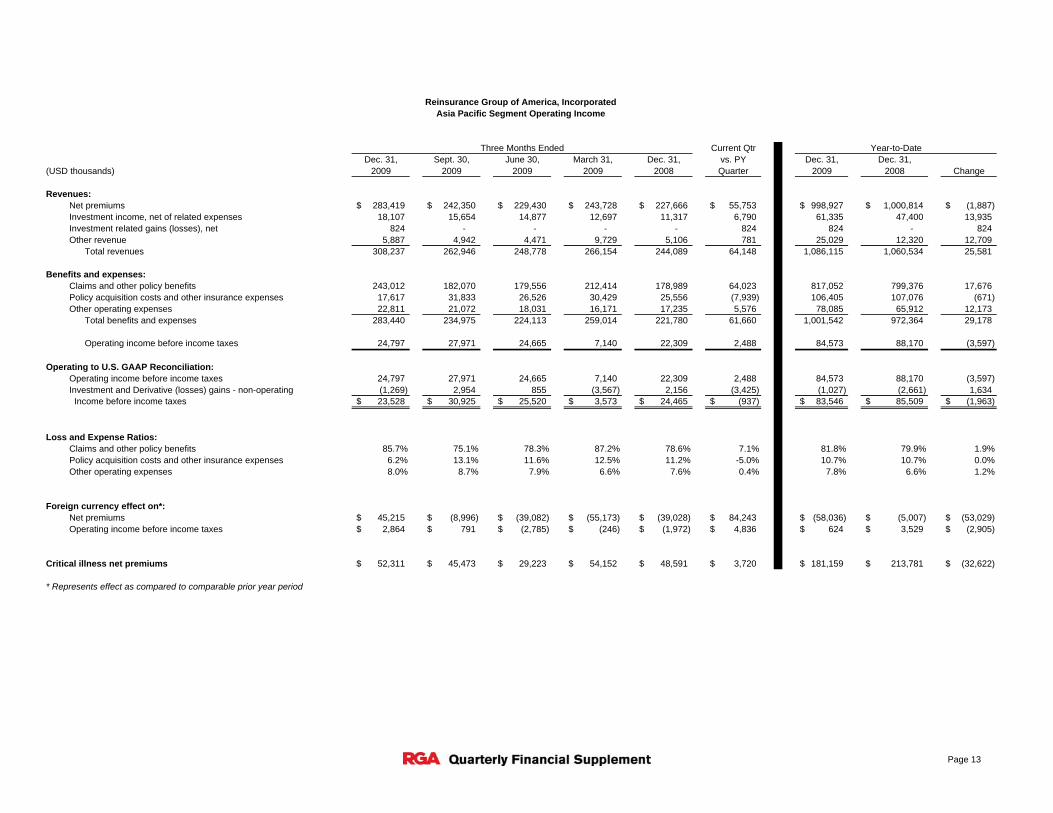
Revenues:Net premiums 283,419$ 242,350$ 229,430$ 243,728$ 227,666$ 55,753$ 998,927$ 1,000,814$ (1,887)$ Investment income, net of related expenses 18,107 15,654 14,877 12,697 11,317 6,790 61,335 47,400 13,935 Investment related gains (losses), net 824 - - - - 824 824 - 824 Other revenue 5,887 4,942 4,471 9,729 5,106 781 25,029 12,320 12,709
Total revenues 308,237 262,946 248,778 266,154 244,089 64,148 1,086,115 1,060,534 25,581
Benefits and expenses:Claims and other policy benefits 243,012 182,070 179,556 212,414 178,989 64,023 817,052 799,376 17,676 Policy acquisition costs and other insurance expenses 17,617 31,833 26,526 30,429 25,556 (7,939) 106,405 107,076 (671) Other operating expenses 22,811 21,072 18,031 16,171 17,235 5,576 78,085 65,912 12,173
Total benefits and expenses 283,440 234,975 224,113 259,014 221,780 61,660 1,001,542 972,364 29,178
Operating income before income taxes 24,797 27,971 24,665 7,140 22,309 2,488 84,573 88,170 (3,597)
Operating to U.S. GAAP Reconciliation:Operating income before income taxes 24,797 27,971 24,665 7,140 22,309 2,488 84,573 88,170 (3,597) Investment and Derivative (losses) gains - non-operating (1,269) 2,954 855 (3,567) 2,156 (3,425) (1,027) (2,661) 1,634 Income before income taxes 23,528$ 30,925$ 25,520$ 3,573$ 24,465$ (937)$ 83,546$ 85,509$ (1,963)$
Loss and Expense Ratios:Claims and other policy benefits 85.7% 75.1% 78.3% 87.2% 78.6% 7.1% 81.8% 79.9% 1.9%Policy acquisition costs and other insurance expenses 6.2% 13.1% 11.6% 12.5% 11.2% -5.0% 10.7% 10.7% 0.0%Other operating expenses 8.0% 8.7% 7.9% 6.6% 7.6% 0.4% 7.8% 6.6% 1.2%
Foreign currency effect on*:Net premiums 45,215$ (8,996)$ (39,082)$ (55,173)$ (39,028)$ 84,243$ (58,036)$ (5,007)$ (53,029)$ Operating income before income taxes 2,864$ 791$ (2,785)$ (246)$ (1,972)$ 4,836$ 624$ 3,529$ (2,905)$
Critical illness net premiums 52,311$ 45,473$ 29,223$ 54,152$ 48,591$ 3,720$ 181,159$ 213,781$ (32,622)$
* Represents effect as compared to comparable prior year period
Three Months Ended Year-to-Date
Reinsurance Group of America, IncorporatedAsia Pacific Segment Operating Income
Page 13
Current QtrDec. 31, Sept. 30, June 30, March 31, Dec. 31, vs. PY Dec. 31, Dec. 31,
(USD thousands) 2009 2009 2009 2009 2008 Quarter 2009 2008 Change
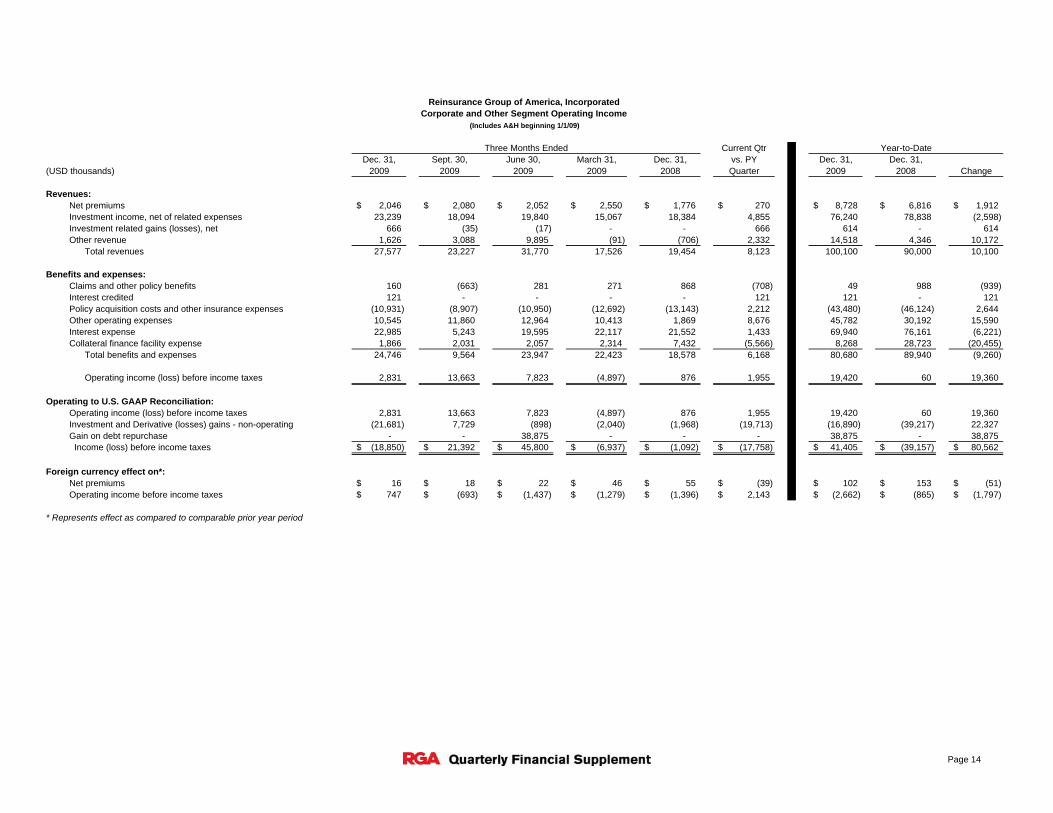
Revenues:Net premiums 2,046$ 2,080$ 2,052$ 2,550$ 1,776$ 270$ 8,728$ 6,816$ 1,912$ Investment income, net of related expenses 23,239 18,094 19,840 15,067 18,384 4,855 76,240 78,838 (2,598) Investment related gains (losses), net 666 (35) (17) - - 666 614 - 614 Other revenue 1,626 3,088 9,895 (91) (706) 2,332 14,518 4,346 10,172
Total revenues 27,577 23,227 31,770 17,526 19,454 8,123 100,100 90,000 10,100
Benefits and expenses:Claims and other policy benefits 160 (663) 281 271 868 (708) 49 988 (939) Interest credited 121 - - - - 121 121 - 121 Policy acquisition costs and other insurance expenses (10,931) (8,907) (10,950) (12,692) (13,143) 2,212 (43,480) (46,124) 2,644 Other operating expenses 10,545 11,860 12,964 10,413 1,869 8,676 45,782 30,192 15,590 Interest expense 22,985 5,243 19,595 22,117 21,552 1,433 69,940 76,161 (6,221) Collateral finance facility expense 1,866 2,031 2,057 2,314 7,432 (5,566) 8,268 28,723 (20,455)
Total benefits and expenses 24,746 9,564 23,947 22,423 18,578 6,168 80,680 89,940 (9,260)
Operating income (loss) before income taxes 2,831 13,663 7,823 (4,897) 876 1,955 19,420 60 19,360
Operating to U.S. GAAP Reconciliation:Operating income (loss) before income taxes 2,831 13,663 7,823 (4,897) 876 1,955 19,420 60 19,360 Investment and Derivative (losses) gains - non-operating (21,681) 7,729 (898) (2,040) (1,968) (19,713) (16,890) (39,217) 22,327 Gain on debt repurchase - - 38,875 - - - 38,875 - 38,875 Income (loss) before income taxes (18,850)$ 21,392$ 45,800$ (6,937)$ (1,092)$ (17,758)$ 41,405$ (39,157)$ 80,562$
Foreign currency effect on*:Net premiums 16$ 18$ 22$ 46$ 55$ (39)$ 102$ 153$ (51)$ Operating income before income taxes 747$ (693)$ (1,437)$ (1,279)$ (1,396)$ 2,143$ (2,662)$ (865)$ (1,797)$
* Represents effect as compared to comparable prior year period
Three Months Ended Year-to-Date
Reinsurance Group of America, IncorporatedCorporate and Other Segment Operating Income
(Includes A&H beginning 1/1/09)
Page 14

Current QtrDec. 31, Sept. 30, June 30, March 31, Dec. 31, vs. PY Dec. 31, Dec. 31,
(USD thousands) 2009 2009 2009 2009 2008 Quarter 2009 2008 Change
U.S. Traditional 82,145$ 84,663$ 100,221$ 72,578$ 76,665$ 5,480$ 339,607$ 302,897$ 36,710$ U.S. Asset Intensive 13,869 19,730 15,985 (3,741) (2,817) 16,686 45,843 20,339 25,504U.S. Financial Reinsurance 4,620 2,747 2,956 5,489 3,660 960 15,812 12,090 3,722
Total U.S. Segment 100,634 107,140 119,162 74,326 77,508 23,126 401,262 335,326 65,936Canadian Segment 30,735 21,822 17,563 17,757 23,328 7,407 87,877 107,237 (19,360)Europe & South Africa Segment 23,886 6,713 12,377 8,113 26,409 (2,523) 51,089 74,373 (23,284)Asia Pacific Segment 24,797 27,971 24,665 7,140 22,309 2,488 84,573 88,170 (3,597)Corporate and Other 2,831 13,663 7,823 (4,897) 876 1,955 19,420 60 19,360Consolidated 182,883$ 177,309$ 181,590$ 102,439$ 150,430$ 32,453$ 644,221$ 605,166$ 39,055$
Three Months Ended Year-to-Date
Reinsurance Group of America, IncorporatedSummary of Pre-tax Segment Operating Income
Page 15
(USD thousands) Dec. 31, Sept. 30, June 30, March 31, Dec. 31,2009 2009 2009 2009 2008
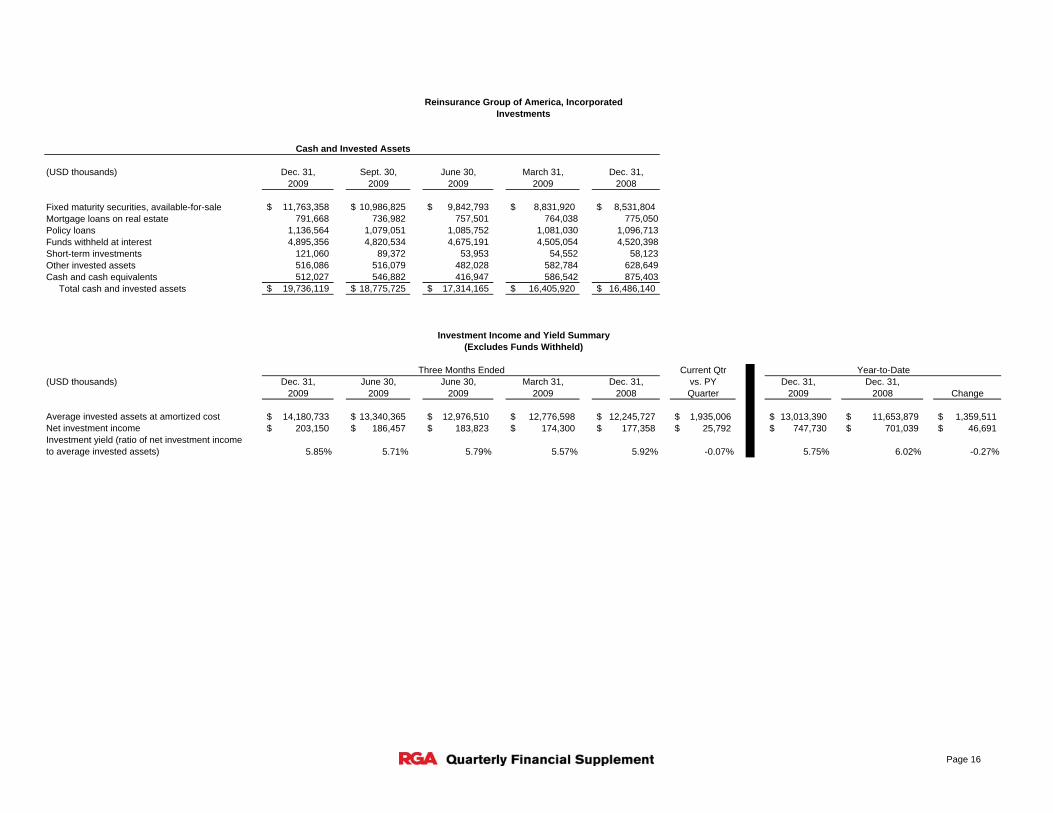
Fixed maturity securities, available-for-sale 11,763,358$ 10,986,825$ 9,842,793$ 8,831,920$ 8,531,804$ Mortgage loans on real estate 791,668 736,982 757,501 764,038 775,050Policy loans 1,136,564 1,079,051 1,085,752 1,081,030 1,096,713Funds withheld at interest 4,895,356 4,820,534 4,675,191 4,505,054 4,520,398Short-term investments 121,060 89,372 53,953 54,552 58,123Other invested assets 516,086 516,079 482,028 582,784 628,649Cash and cash equivalents 512,027 546,882 416,947 586,542 875,403 Total cash and invested assets 19,736,119$ 18,775,725$ 17,314,165$ 16,405,920$ 16,486,140$
Current Qtr(USD thousands) Dec. 31, June 30, June 30, March 31, Dec. 31, vs. PY Dec. 31, Dec. 31,
2009 2009 2009 2009 2008 Quarter 2009 2008 Change
Average invested assets at amortized cost 14,180,733$ 13,340,365$ 12,976,510$ 12,776,598$ 12,245,727$ 1,935,006$ 13,013,390$ 11,653,879$ 1,359,511$ Net investment income 203,150$ 186,457$ 183,823$ 174,300$ 177,358$ 25,792$ 747,730$ 701,039$ 46,691$ Investment yield (ratio of net investment income to average invested assets) 5.85% 5.71% 5.79% 5.57% 5.92% -0.07% 5.75% 6.02% -0.27%
Year-to-Date
Reinsurance Group of America, IncorporatedInvestments
Investment Income and Yield Summary(Excludes Funds Withheld)
Three Months Ended
Cash and Invested Assets
Page 16

Other-than Estimated temporary
(USD thousands) Amortized Unrealized Unrealized Fair % of impairmentCost Gains Losses Value Total in AOCI
Available-for-sale: U.S. corporate securities 3,700,730$ 180,902$ 150,034$ 3,731,598$ 31.7% Canadian and Canadian provincial governments 1,984,475 394,498 25,746 2,353,227 20.0% - Residential mortgage-backed securities 1,494,021 32,538 70,015 1,456,544 12.4% (7,018) Foreign corporate securities 1,627,352 77,128 33,390 1,671,090 14.2% - Asset-backed securities 512,281 9,252 77,489 444,044 3.8% (2,194) Commercial mortgage-backed securities 1,177,621 20,670 169,427 1,028,864 8.7% (13,690) U.S. government and agencies 540,001 1,085 15,027 526,059 4.5% - State and political subdivisions 107,233 273 17,744 89,762 0.8% - Other foreign government securities 473,243 2,198 13,271 462,170 3.9% - Total fixed maturity securities 11,616,957$ 718,544$ 572,143$ 11,763,358$ 100.0% (22,902)$
- Non-redeemable preferred stock 123,648 1,878 12,328 113,198 63.5%Common stock 64,669 760 409 65,020 36.5%Total equity securities 188,317$ 2,638$ 12,737$ 178,218$ 100.0%
Estimated(USD thousands) Amortized Unrealized Unrealized Fair % of
Cost Gains Losses Value TotalAvailable-for-sale: U.S. corporate securities 3,577,116$ 34,262$ 598,745$ 3,012,633$ 35.3% Canadian and Canadian provincial governments 1,500,511 397,899 7,171 1,891,239 22.2% Residential mortgage-backed securities 1,231,123 24,838 106,776 1,149,185 13.5% Foreign corporate securities 1,112,018 14,335 152,920 973,433 11.4% Asset-backed securities 484,577 2,098 147,297 339,378 4.0% Commercial mortgage-backed securities 1,085,062 2,258 326,730 760,590 8.9% U.S. government and agencies 7,555 876 - 8,431 0.1% State and political subdivisions 46,537 - 7,883 38,654 0.4% Other foreign government securities 338,349 20,062 150 358,261 4.2%Total fixed maturity securities 9,382,848$ 496,628$ 1,347,672$ 8,531,804$ 100.0%
- Non-redeemable preferred stock 187,510 49 64,160 123,399 77.4%Common stock 40,582 - 4,607 35,975 22.6%Total equity securities 228,092$ 49$ 68,767$ 159,374$ 100.0%
December 31, 2009
December 31, 2008
Reinsurance Group of America, IncorporatedInvestments
Amortized cost, gross unrealized gains and losses, and estimated fair values of fixed maturity and equity securities
Page 17

(USD thousands)
Amortized CostEstimated Fair
Value % of TotalAverage Credit
Ratings Amortized CostEstimated Fair
Value % of TotalAverage Credit
Ratings
Financial InstitutionsBanking 1,372,940$ 1,334,155$ 23.9% A+ 1,138,663$ 924,098$ 22.2% ABrokerage 87,168 87,747 1.6% A- 104,169 96,516 2.3% AFinance Comp. 239,659 237,719 4.3% A+ 278,132 228,659 5.5% A+Insurance 374,486 366,893 6.6% A- 309,703 222,116 5.4% A-REITs 138,727 139,455 2.5% BBB 153,626 110,172 2.7% BBB+Other Finance 221,449 195,238 3.5% A- 191,650 140,161 3.4% A
Total Financial Institutions 2,434,429 2,361,207 42.4% 2,175,943 1,721,722 41.5%Industrials
Basic 244,242 261,135 4.7% BBB 213,540 173,826 4.2% BBB+Capital Goods 235,090 247,594 4.4% BBB+ 187,041 172,958 4.2% A-Communications 444,939 485,405 8.7% BBB+ 449,334 425,633 10.3% BBB+Consumer Cyclical 242,206 247,077 4.4% BBB 244,476 198,485 4.8% BBB+Consumer Noncyclical 396,739 419,161 7.5% BBB+ 341,126 323,239 7.8% BBB+Energy 330,748 356,716 6.4% BBB+ 248,579 215,634 5.2% BBB+Technology 114,795 119,548 2.1% BBB+ 55,043 43,998 1.1% BBB+Transportation 205,776 209,048 3.8% BBB 217,515 190,303 4.6% BBB+Other Industrial 62,175 39,414 0.7% BBB- 55,898 28,314 0.7% BBB+
Total Industrials 2,276,710 2,385,098 42.7% 2,012,552 1,772,390 42.9%Utilities
Electric 512,898 525,379 9.4% BBB+ 446,048 399,235 9.6% BBB+Natural Gas 246,329 262,064 4.7% BBB+ 200,636 174,308 4.2% BBB+Other Utility 26,830 27,940 0.5% A- 22,320 20,447 0.5% A-
Total Utilities 786,057 815,383 14.6% 669,004 593,990 14.3%Other Sectors 19,203 19,219 0.3% AA 59,728 57,338 1.3% AA Total 5,516,399$ 5,580,907$ 100.0% 4,917,227$ 4,145,440$ 100.0%
December 31, 2008December 31, 2009
Reinsurance Group of America, IncorporatedInvestments
Corporate Securities by Sector (Fixed Maturities and Equities)
Page 18
(USD thousands)
NAIC DesignationRating Agency
Designation Amortized CostEstimated Fair
Value % of TotalAmortized
CostEstimated Fair
Value % of TotalAmortized
CostEstimated Fair
Value % of TotalAmortized
CostEstimated Fair Value % of Total
Amortized Cost
Estimated Fair Value % of Total
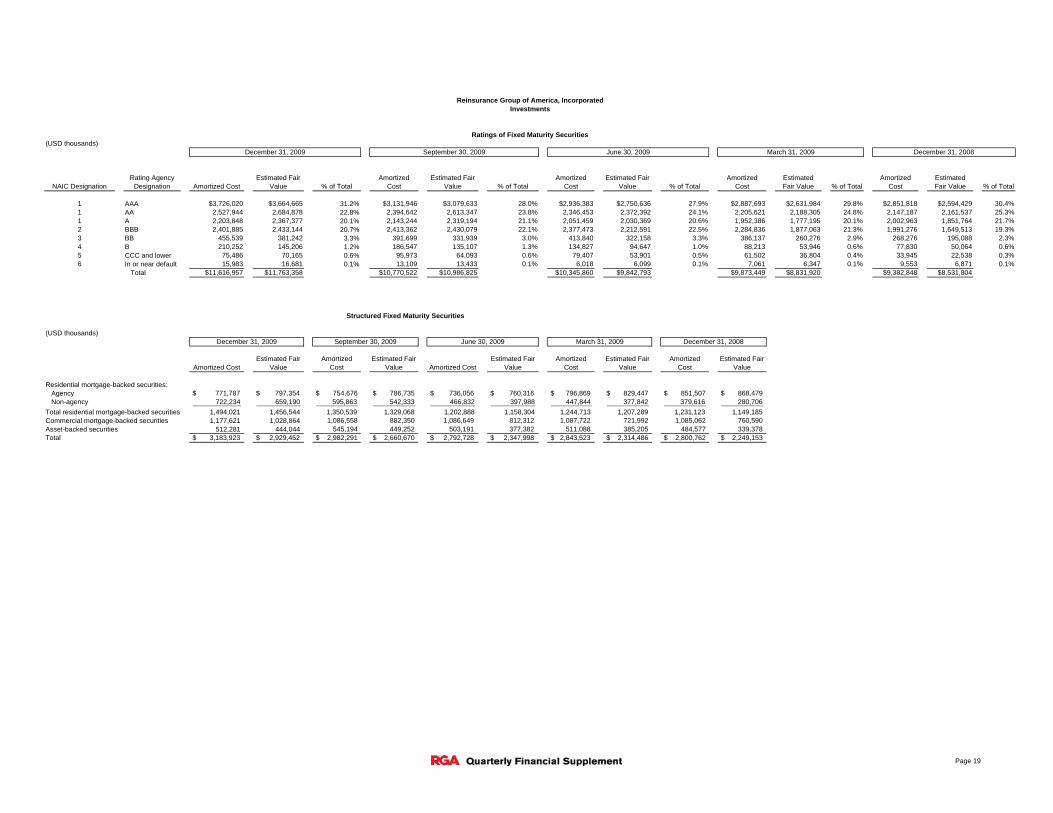
1 AAA $3,726,020 $3,664,665 31.2% $3,131,946 $3,079,633 28.0% $2,936,383 $2,750,636 27.9% $2,887,693 $2,631,984 29.8% $2,851,818 $2,594,429 30.4%1 AA 2,527,944 2,684,878 22.8% 2,394,642 2,613,347 23.8% 2,346,453 2,372,392 24.1% 2,205,621 2,188,305 24.8% 2,147,187 2,161,537 25.3%1 A 2,203,848 2,367,377 20.1% 2,143,244 2,319,194 21.1% 2,051,459 2,030,369 20.6% 1,952,386 1,777,195 20.1% 2,002,963 1,851,764 21.7%2 BBB 2,401,885 2,433,144 20.7% 2,413,362 2,430,079 22.1% 2,377,473 2,212,591 22.5% 2,284,836 1,877,063 21.3% 1,991,276 1,649,513 19.3%3 BB 455,539 381,242 3.3% 391,699 331,939 3.0% 413,840 322,158 3.3% 386,137 260,276 2.9% 268,276 195,088 2.3%4 B 210,252 145,206 1.2% 186,547 135,107 1.3% 134,827 94,647 1.0% 88,213 53,946 0.6% 77,830 50,064 0.6%5 CCC and lower 75,486 70,165 0.6% 95,973 64,093 0.6% 79,407 53,901 0.5% 61,502 36,804 0.4% 33,945 22,538 0.3%6 In or near default 15,983 16,681 0.1% 13,109 13,433 0.1% 6,018 6,099 0.1% 7,061 6,347 0.1% 9,553 6,871 0.1%
Total $11,616,957 $11,763,358 $10,770,522 $10,986,825 $10,345,860 $9,842,793 $9,873,449 $8,831,920 $9,382,848 $8,531,804
(USD thousands)
Amortized CostEstimated Fair
ValueAmortized
CostEstimated Fair
Value Amortized CostEstimated Fair
ValueAmortized
CostEstimated Fair
ValueAmortized
CostEstimated Fair
Value
Residential mortgage-backed securities:Agency $ 771,787 $ 797,354 $ 754,676 $ 786,735 $ 736,056 $ 760,316 $ 796,869 $ 829,447 $ 851,507 $ 868,479 Non-agency 722,234 659,190 595,863 542,333 466,832 397,988 447,844 377,842 379,616 280,706
Total residential mortgage-backed securities 1,494,021 1,456,544 1,350,539 1,329,068 1,202,888 1,158,304 1,244,713 1,207,289 1,231,123 1,149,185 Commercial mortgage-backed securities 1,177,621 1,028,864 1,086,558 882,350 1,086,649 812,312 1,087,722 721,992 1,085,062 760,590 Asset-backed securities 512,281 444,044 545,194 449,252 503,191 377,382 511,088 385,205 484,577 339,378 Total $ 3,183,923 $ 2,929,452 $ 2,982,291 $ 2,660,670 $ 2,792,728 $ 2,347,998 $ 2,843,523 $ 2,314,486 $ 2,800,762 $ 2,249,153
Structured Fixed Maturity Securities
December 31, 2009 September 30, 2009 June 30, 2009 March 31, 2009 December 31, 2008
Reinsurance Group of America, IncorporatedInvestments
Ratings of Fixed Maturity Securities
September 30, 2009 June 30, 2009 March 31, 2009 December 31, 2008December 31, 2009
Page 19
(USD thousands)
Underwriting Year Amortized CostEstimated Fair
Value Amortized CostEstimated Fair Value Amortized Cost
Estimated Fair Value
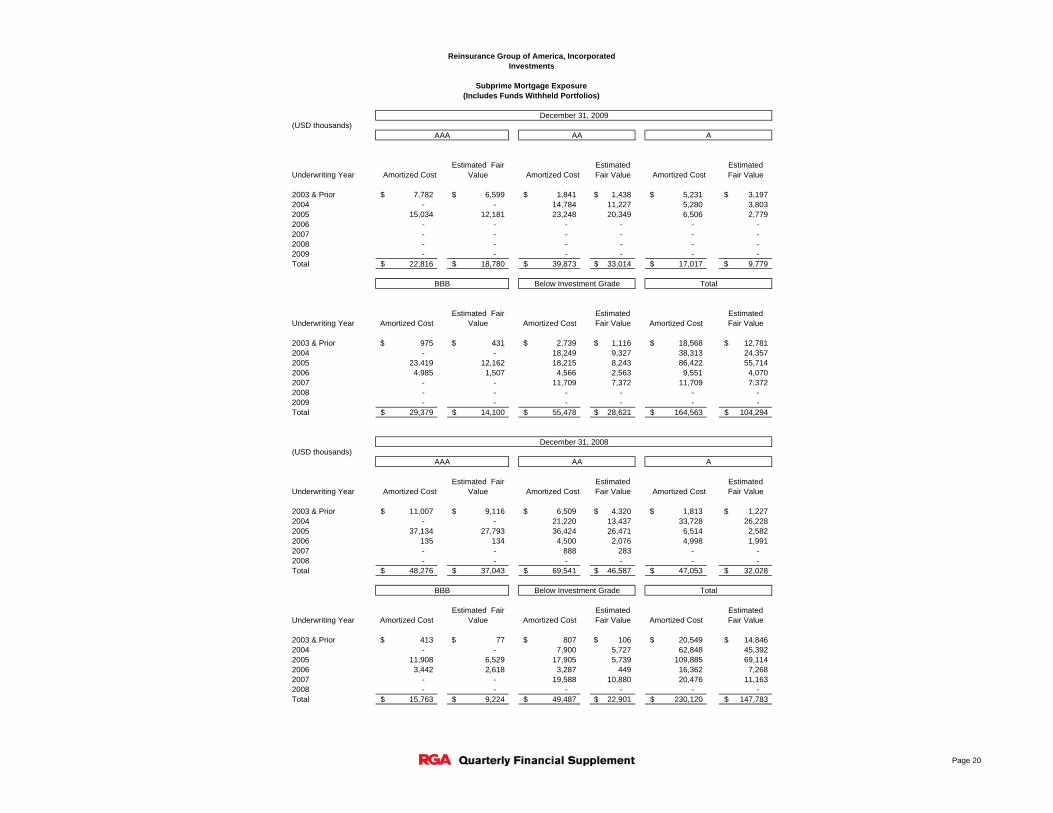
2003 & Prior 7,782$ 6,599$ 1,841$ 1,438$ 5,231$ 3,197$ 2004 - - 14,784 11,227 5,280 3,803 2005 15,034 12,181 23,248 20,349 6,506 2,779 2006 - - - - - - 2007 - - - - - - 2008 - - - - - - 2009 - - - - - - Total 22,816$ 18,780$ 39,873$ 33,014$ 17,017$ 9,779$
Underwriting Year Amortized CostEstimated Fair
Value Amortized CostEstimated Fair Value Amortized Cost
Estimated Fair Value
2003 & Prior 975$ 431$ 2,739$ 1,116$ 18,568$ 12,781$ 2004 - - 18,249 9,327 38,313 24,357 2005 23,419 12,162 18,215 8,243 86,422 55,714 2006 4,985 1,507 4,566 2,563 9,551 4,070 2007 - - 11,709 7,372 11,709 7,372 2008 - - - - - - 2009 - - - - - - Total 29,379$ 14,100$ 55,478$ 28,621$ 164,563$ 104,294$
(USD thousands)
Underwriting Year Amortized CostEstimated Fair
Value Amortized CostEstimated Fair Value Amortized Cost
Estimated Fair Value
2003 & Prior 11,007$ 9,116$ 6,509$ 4,320$ 1,813$ 1,227$ 2004 - - 21,220 13,437 33,728 26,228 2005 37,134 27,793 36,424 26,471 6,514 2,582 2006 135 134 4,500 2,076 4,998 1,991 2007 - - 888 283 - - 2008 - - - - - - Total 48,276$ 37,043$ 69,541$ 46,587$ 47,053$ 32,028$
Underwriting Year Amortized CostEstimated Fair
Value Amortized CostEstimated Fair Value Amortized Cost
Estimated Fair Value
2003 & Prior 413$ 77$ 807$ 106$ 20,549$ 14,846$ 2004 - - 7,900 5,727 62,848 45,392 2005 11,908 6,529 17,905 5,739 109,885 69,114 2006 3,442 2,618 3,287 449 16,362 7,268 2007 - - 19,588 10,880 20,476 11,163 2008 - - - - - - Total 15,763$ 9,224$ 49,487$ 22,901$ 230,120$ 147,783$
(Includes Funds Withheld Portfolios)
Total
December 31, 2009
BBB Below Investment Grade Total
December 31, 2008
AAA AA A
Reinsurance Group of America, IncorporatedInvestments
Subprime Mortgage Exposure
BBB Below Investment Grade
AAA AA A
Page 20
(USD thousands)
Underwriting Year Amortized CostEstimated Fair
Value Amortized CostEstimated Fair Value Amortized Cost
Estimated Fair Value
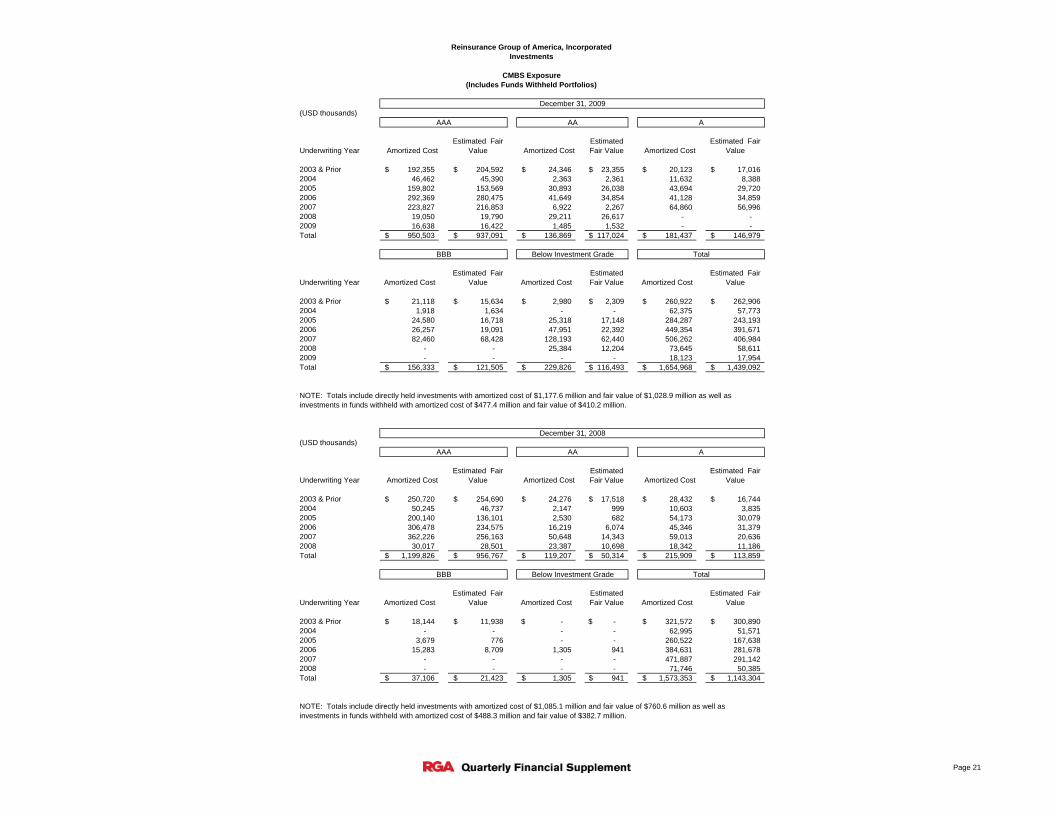
2003 & Prior 192,355$ 204,592$ 24,346$ 23,355$ 20,123$ 17,016$ 2004 46,462 45,390 2,363 2,361 11,632 8,388 2005 159,802 153,569 30,893 26,038 43,694 29,720 2006 292,369 280,475 41,649 34,854 41,128 34,859 2007 223,827 216,853 6,922 2,267 64,860 56,996 2008 19,050 19,790 29,211 26,617 - - 2009 16,638 16,422 1,485 1,532 - - Total 950,503$ 937,091$ 136,869$ 117,024$ 181,437$ 146,979$
Underwriting Year Amortized CostEstimated Fair
Value Amortized CostEstimated Fair Value Amortized Cost
Estimated Fair Value
2003 & Prior 21,118$ 15,634$ 2,980$ 2,309$ 260,922$ 262,906$ 2004 1,918 1,634 - - 62,375 57,773 2005 24,580 16,718 25,318 17,148 284,287 243,193 2006 26,257 19,091 47,951 22,392 449,354 391,671 2007 82,460 68,428 128,193 62,440 506,262 406,984 2008 - - 25,384 12,204 73,645 58,611 2009 - - - - 18,123 17,954 Total 156,333$ 121,505$ 229,826$ 116,493$ 1,654,968$ 1,439,092$
NOTE: Totals include directly held investments with amortized cost of $1,177.6 million and fair value of $1,028.9 million as well asinvestments in funds withheld with amortized cost of $477.4 million and fair value of $410.2 million.
(USD thousands)
Underwriting Year Amortized CostEstimated Fair
Value Amortized CostEstimated Fair Value Amortized Cost
Estimated Fair Value
2003 & Prior 250,720$ 254,690$ 24,276$ 17,518$ 28,432$ 16,744$ 2004 50,245 46,737 2,147 999 10,603 3,835 2005 200,140 136,101 2,530 682 54,173 30,079 2006 306,478 234,575 16,219 6,074 45,346 31,379 2007 362,226 256,163 50,648 14,343 59,013 20,636 2008 30,017 28,501 23,387 10,698 18,342 11,186 Total 1,199,826$ 956,767$ 119,207$ 50,314$ 215,909$ 113,859$
Underwriting Year Amortized CostEstimated Fair
Value Amortized CostEstimated Fair Value Amortized Cost
Estimated Fair Value
2003 & Prior 18,144$ 11,938$ -$ -$ 321,572$ 300,890$ 2004 - - - - 62,995 51,571 2005 3,679 776 - - 260,522 167,638 2006 15,283 8,709 1,305 941 384,631 281,678 2007 - - - - 471,887 291,142 2008 - - - - 71,746 50,385 Total 37,106$ 21,423$ 1,305$ 941$ 1,573,353$ 1,143,304$
NOTE: Totals include directly held investments with amortized cost of $1,085.1 million and fair value of $760.6 million as well asinvestments in funds withheld with amortized cost of $488.3 million and fair value of $382.7 million.
BBB Below Investment Grade Total
December 31, 2008
AAA AA A
TotalBBB Below Investment Grade
AAA AA
Reinsurance Group of America, IncorporatedInvestments
CMBS Exposure
A
(Includes Funds Withheld Portfolios)
December 31, 2009
Page 21

Fixed Maturity Securities
(USD thousands)
Gross Unrealized Losses % of Total
Gross Unrealized Losses % of Total
Gross Unrealized Losses % of Total
Gross Unrealized Losses % of Total
Gross Unrealized Losses % of Total
Less than 20% 248,145$ 42.4% 219,984$ 32.0% 304,595$ 28.6% 320,296$ 20.6% 322,159$ 22.7%20% or more for less than six months 67,435 11.5% 67,306 9.8% 152,606 14.4% 406,885 26.2% 766,789 54.1%20% or more for six months or greater 256,563 43.9% 369,459 53.8% 556,117 52.3% 735,831 47.4% 258,724 18.3%Total 572,143$ 97.8% 656,749$ 95.6% 1,013,318$ 95.3% 1,463,012$ 94.2% 1,347,672$ 95.1%
Equity Securities
(USD thousands)
Gross Unrealized Losses % of Total
Gross Unrealized Losses % of Total
Gross Unrealized Losses % of Total
Gross Unrealized Losses % of Total
Gross Unrealized Losses % of Total
Less than 20% 5,930$ 1.0% 4,748$ 0.7% 5,452$ 0.5% 1,070$ 0.1% 2,231$ 0.2%20% or more for less than six months 1,887 0.3% 1,819 0.2% 3,951 0.4% 10,675 0.7% 29,958 2.1%20% or more for six months or greater 4,920 0.9% 23,898 3.5% 40,910 3.8% 78,062 5.0% 36,578 2.6%Total 12,737$ 2.2% 30,465$ 4.4% 50,313$ 4.7% 89,807$ 5.8% 68,767$ 4.9%
June 30, 2009 March 31, 2009 December 31, 2008December 31, 2009 September 30, 2009
March 31, 2009 December 31, 2008
Reinsurance Group of America, IncorporatedInvestments
Gross Unrealized Losses Aging
December 31, 2009 September 30, 2009 June 30, 2009
Page 22
(USD thousands)
Estimated Fair Value
Gross Unrealized Losses
Estimated Fair Value
Gross Unrealized Losses
Estimated Fair Value
Gross Unrealized Losses
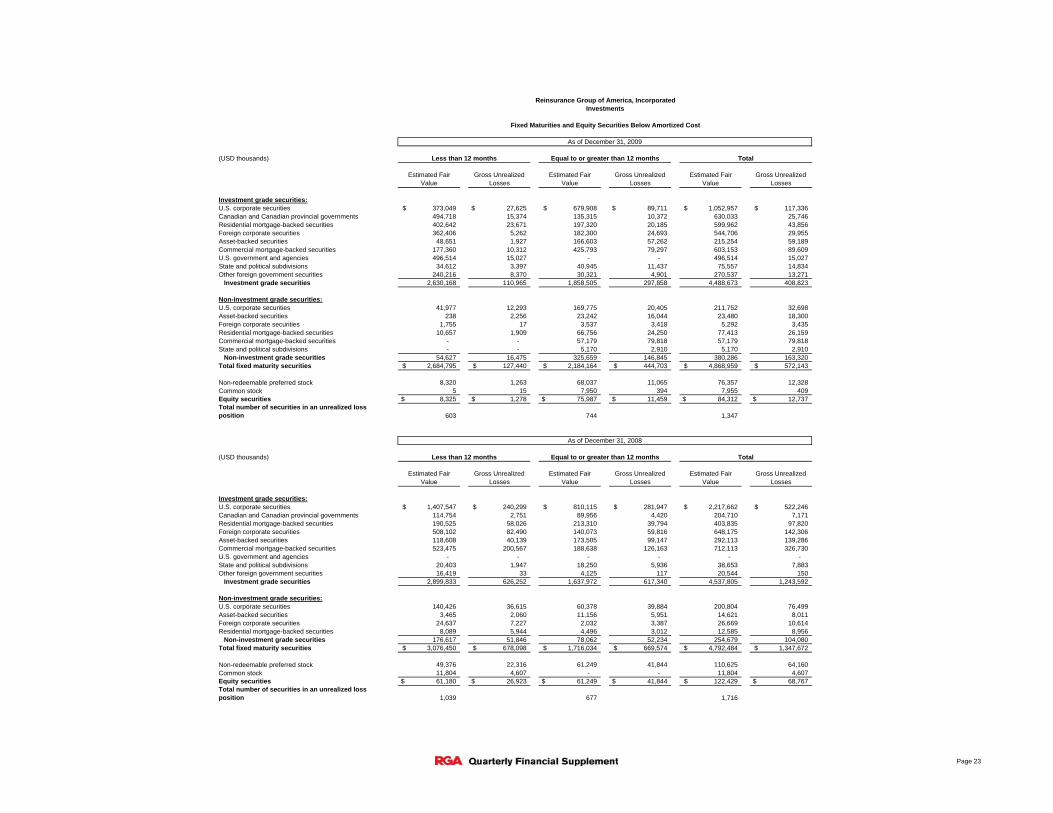
Investment grade securities:U.S. corporate securities 373,049$ 27,625$ 679,908$ 89,711$ 1,052,957$ 117,336$ Canadian and Canadian provincial governments 494,718 15,374 135,315 10,372 630,033 25,746 Residential mortgage-backed securities 402,642 23,671 197,320 20,185 599,962 43,856 Foreign corporate securities 362,406 5,262 182,300 24,693 544,706 29,955 Asset-backed securities 48,651 1,927 166,603 57,262 215,254 59,189 Commercial mortgage-backed securities 177,360 10,312 425,793 79,297 603,153 89,609 U.S. government and agencies 496,514 15,027 - - 496,514 15,027 State and political subdivisions 34,612 3,397 40,945 11,437 75,557 14,834 Other foreign government securities 240,216 8,370 30,321 4,901 270,537 13,271
Investment grade securities 2,630,168 110,965 1,858,505 297,858 4,488,673 408,823
Non-investment grade securities:U.S. corporate securities 41,977 12,293 169,775 20,405 211,752 32,698 Asset-backed securities 238 2,256 23,242 16,044 23,480 18,300 Foreign corporate securities 1,755 17 3,537 3,418 5,292 3,435 Residential mortgage-backed securities 10,657 1,909 66,756 24,250 77,413 26,159 Commercial mortgage-backed securities - - 57,179 79,818 57,179 79,818 State and political subdivisions - - 5,170 2,910 5,170 2,910
Non-investment grade securities 54,627 16,475 325,659 146,845 380,286 163,320 Total fixed maturity securities 2,684,795$ 127,440$ 2,184,164$ 444,703$ 4,868,959$ 572,143$
Non-redeemable preferred stock 8,320 1,263 68,037 11,065 76,357 12,328 Common stock 5 15 7,950 394 7,955 409 Equity securities 8,325$ 1,278$ 75,987$ 11,459$ 84,312$ 12,737$ Total number of securities in an unrealized loss position 603 744 1,347
(USD thousands)
Estimated Fair Value
Gross Unrealized Losses
Estimated Fair Value
Gross Unrealized Losses
Estimated Fair Value
Gross Unrealized Losses
Investment grade securities:U.S. corporate securities 1,407,547$ 240,299$ 810,115$ 281,947$ 2,217,662$ 522,246$ Canadian and Canadian provincial governments 114,754 2,751 89,956 4,420 204,710 7,171 Residential mortgage-backed securities 190,525 58,026 213,310 39,794 403,835 97,820 Foreign corporate securities 508,102 82,490 140,073 59,816 648,175 142,306 Asset-backed securities 118,608 40,139 173,505 99,147 292,113 139,286 Commercial mortgage-backed securities 523,475 200,567 188,638 126,163 712,113 326,730 U.S. government and agencies - - - - - - State and political subdivisions 20,403 1,947 18,250 5,936 38,653 7,883 Other foreign government securities 16,419 33 4,125 117 20,544 150
Investment grade securities 2,899,833 626,252 1,637,972 617,340 4,537,805 1,243,592
Non-investment grade securities:U.S. corporate securities 140,426 36,615 60,378 39,884 200,804 76,499 Asset-backed securities 3,465 2,060 11,156 5,951 14,621 8,011 Foreign corporate securities 24,637 7,227 2,032 3,387 26,669 10,614 Residential mortgage-backed securities 8,089 5,944 4,496 3,012 12,585 8,956
Non-investment grade securities 176,617 51,846 78,062 52,234 254,679 104,080 Total fixed maturity securities 3,076,450$ 678,098$ 1,716,034$ 669,574$ 4,792,484$ 1,347,672$
Non-redeemable preferred stock 49,376 22,316 61,249 41,844 110,625 64,160 Common stock 11,804 4,607 - - 11,804 4,607 Equity securities 61,180$ 26,923$ 61,249$ 41,844$ 122,429$ 68,767$ Total number of securities in an unrealized loss position 1,039 677 1,716
Less than 12 months Equal to or greater than 12 months Total
Less than 12 months Equal to or greater than 12 months Total
As of December 31, 2008
As of December 31, 2009
Reinsurance Group of America, IncorporatedInvestments
Fixed Maturities and Equity Securities Below Amortized Cost
Page 23
(USD thousands) Current QtrDec. 31, Sept. 30, June 30, March 31, Dec. 31, vs. PY Dec. 31, Dec. 31,
2009 2009 2009 2009 2008 Quarter 2009 2008 Change
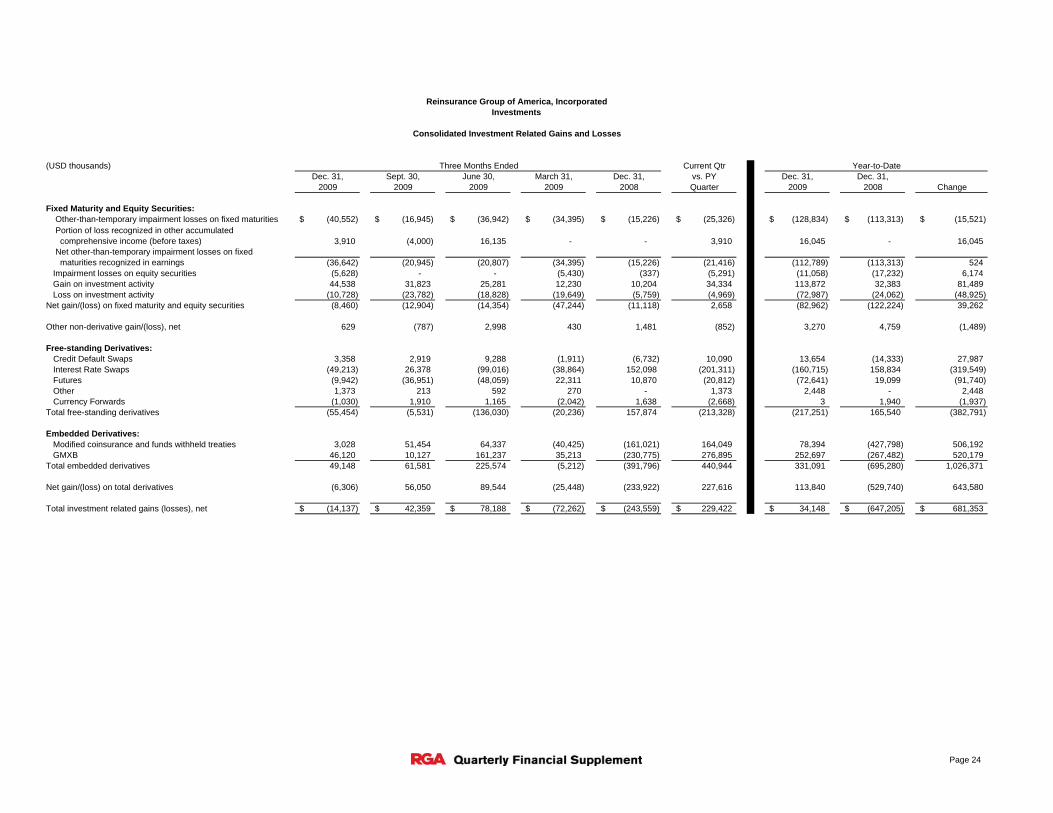
Fixed Maturity and Equity Securities: Other-than-temporary impairment losses on fixed maturities (40,552)$ (16,945)$ (36,942)$ (34,395)$ (15,226)$ (25,326)$ (128,834)$ (113,313)$ (15,521)$ Portion of loss recognized in other accumulated comprehensive income (before taxes) 3,910 (4,000) 16,135 - - 3,910 16,045 - 16,045 Net other-than-temporary impairment losses on fixed maturities recognized in earnings (36,642) (20,945) (20,807) (34,395) (15,226) (21,416) (112,789) (113,313) 524 Impairment losses on equity securities (5,628) - - (5,430) (337) (5,291) (11,058) (17,232) 6,174 Gain on investment activity 44,538 31,823 25,281 12,230 10,204 34,334 113,872 32,383 81,489 Loss on investment activity (10,728) (23,782) (18,828) (19,649) (5,759) (4,969) (72,987) (24,062) (48,925) Net gain/(loss) on fixed maturity and equity securities (8,460) (12,904) (14,354) (47,244) (11,118) 2,658 (82,962) (122,224) 39,262
Other non-derivative gain/(loss), net 629 (787) 2,998 430 1,481 (852) 3,270 4,759 (1,489)
Free-standing Derivatives:Credit Default Swaps 3,358 2,919 9,288 (1,911) (6,732) 10,090 13,654 (14,333) 27,987 Interest Rate Swaps (49,213) 26,378 (99,016) (38,864) 152,098 (201,311) (160,715) 158,834 (319,549) Futures (9,942) (36,951) (48,059) 22,311 10,870 (20,812) (72,641) 19,099 (91,740) Other 1,373 213 592 270 - 1,373 2,448 - 2,448 Currency Forwards (1,030) 1,910 1,165 (2,042) 1,638 (2,668) 3 1,940 (1,937)
Total free-standing derivatives (55,454) (5,531) (136,030) (20,236) 157,874 (213,328) (217,251) 165,540 (382,791)
Embedded Derivatives: Modified coinsurance and funds withheld treaties 3,028 51,454 64,337 (40,425) (161,021) 164,049 78,394 (427,798) 506,192 GMXB 46,120 10,127 161,237 35,213 (230,775) 276,895 252,697 (267,482) 520,179 Total embedded derivatives 49,148 61,581 225,574 (5,212) (391,796) 440,944 331,091 (695,280) 1,026,371
Net gain/(loss) on total derivatives (6,306) 56,050 89,544 (25,448) (233,922) 227,616 113,840 (529,740) 643,580
Total investment related gains (losses), net (14,137)$ 42,359$ 78,188$ (72,262)$ (243,559)$ 229,422$ 34,148$ (647,205)$ 681,353$
Reinsurance Group of America, IncorporatedInvestments
Consolidated Investment Related Gains and Losses
Three Months Ended Year-to-Date
Page 24