financial system report june 2010 - bank of mexico
TRANSCRIPT

Financial System Report
June 2010
November, 2010

BOARD OF GOVERNORS
Governor
AGUSTÍN GUILLERMO CARSTENS CARSTENS
Deputy Governors
ROBERTO DEL CUETO LEGASPI
GUILLERMO GÜÉMEZ GARCÍA
MANUEL SÁNCHEZ GONZÁLEZ
JOSÉ JULIÁN SIDAOUI DIB


NOTICE
Unless otherwise specified, this document has been drafted using
information available as at October 31st, 2010. Figures are preliminary and
may be revised.


TABLE OF CONTENTS
Financial System Report
1. Introduction ............................................................................................................................ 8
2. The international and domestic environment .................................................................. 10
2.1. International environment ............................................................................. 10
2.2. Domestic environment .................................................................................. 16
3. Financial markets ................................................................................................................ 18
3.1. Capital market ............................................................................................... 18
3.2. Foreign exchange market ............................................................................. 25
3.3. Derivative market .......................................................................................... 28
4. Financial Intermediaries ..................................................................................................... 30
4.1. Commercial banks ........................................................................................ 33
4.2. Pension fund managers (afores) .................................................................. 69
4.3. Mutual funds .................................................................................................. 71
4.4. Development banks, Infonavit and Fovissste ................................................... 73
4.5. Insurance companies. ................................................................................... 87
4.6. Non-bank financial institutions (sofomes y sofoles) ..................................... 89
4.7. Social savings and loan institutions (sofipos y socaps)................................ 94
5. Financial position of households, firms and the public sector ...................................... 96
5.1. Households ................................................................................................... 96
5.2. Non-financial private companies ................................................................... 98
5.3. Public sector ................................................................................................ 102
6. Payment Systems .............................................................................................................. 106
6.1. Large value payment systems .................................................................... 106
6.2. Small value payment systems .................................................................... 110
7. Balance of risks and conclusions ................................................................................... 117
Appendix: International agenda for financial regulation reforms ....................................... 120

7
INDEX OF BOXES
1. Syndicated placements and world government bond index, WGBI ........................................ 19
2. Foreign currency carry trading .............................................................................................. 27
3. Relationship between the credit cycle and the economic cycle ............................................ 36
4. Credit card and mortgage borrowers..................................................................................... 47
5. Methodology for generating stress scenarios ....................................................................... 54
6. Extreme events in the distribution of banking system losses ............................................... 59
7. Measurement, tracking and regulation of liquidity risk .......................................................... 68
8. Development bank response to international crisis and public health emergency ............... 75
9. Development bank loan guarantees ...................................................................................... 79
10. Index of tightening in the market for bank credit ................................................................. 100

B A N C O D E M É X I C O
8
1. Introduction
The Law states that one of Banco de México’s tasks is to encourage the healthy development of the financial system and the sound working of payment systems. The importance of the financial system to a central bank derives not only from it being the means by which local currency is put into circulation and monetary policy is implemented, but also the role it plays in efficiently allocating resources within an economy, and ultimately higher and more sustainable rates of economic growth. That is why preserving financial stability is an objective that is closely linked to combating inflation. Price and financial instability constitute obstacles to sustained economic growth
The recent international crisis brought to the fore how prudential regulations in many countries and oversight of them proved insufficient in detecting risks, consequently precluding the adoption of timely measures to prevent or mitigate them. As a result, the international crisis presented central banks with the challenge of procuring the preservation of the country’s financial stability in the broadest possible sense. This has led to some degree of consensus that central banks should become more involved in financial system analysis, regulation and supervision so as to develop a greater warning capacity with regard to potential systemic threats. Ensuring financial stability cannot nor should it be the exclusive domain of the central bank but other financial authorities as well. Specifically, financial stability requires collaboration and cooperation between different local authorities and regulators.
The Financial System Reports published by Banco de México aim to provide an overview of the Mexican financial system’s current situation. In this report, and given that the external crisis prevails, greater emphasis has been placed on an analysis and evaluation of the strengths and risks our financial system faces. Consequently, special emphasis is placed on commercial banks because they are the most important financial intermediary based on both the amount of resources managed and the role they play in granting credit and in payment systems.
This Report essentially covers the period from the second half of 2009 through the first half of 2010 during which time the global economy began recovering from the worst crisis since the Second World War. The main cause of concern shifted partially from the solidity of the international financial system to the capacity of individual countries to meet sovereign debt maturities. Subsequently, in recent months, jitters over weaker global economic growth have moved to the fore following the release of disappointing employment and private consumption figures. At the same time, unease about the sovereign debt situation of some European economies has diminished, albeit hasn’t altogether disappeared. The employment sector’s very slow recovery and soft domestic demand in several industrialized countries, in the United States in particular, has renewed concern about a new negative feedback loop involving lower economic growth and the financial situation of some banks.
Despite the very unfavorable effect of the international financial crisis on the Mexican economy, domestic production rebounded in the second half of 2009.

F I N A N C I A L S Y S T E M R E P O R T
9
Countercyclical policies implemented at the time as well as Banco de México’s monetary policy loosening cycle amid a downtrending inflation environment helped lessen the impact of the crisis on production and employment. During the first three quarters of 2010, manufacturing exports continued to display a positive trend driven by strong US industrial output. However, more recent data on the US economic trend suggests that the rate of Mexico’s economic recovery could ease owing to weaker external demand.
The Mexican financial system was able to tackle the international financial crisis from a position of strength because of efforts made in recent years to improve the regulation and oversight of financial intermediaries. Such efforts contributed to a well-capitalized Mexican banking system with adequate liquidity levels. Those same strengths should enable banks to support the recovery in domestic economic growth.
The second part of the Report describes the international and local environment. In the third section we examine the development of capital, foreign exchange and derivative markets. The fourth analyzes financial intermediaries with a special emphasis on commercial banks. The fifth looks at the financial positions of households, companies and the public sector while the sixth describes some of the main progress made with payment systems. The Report ends with a balance of risks and some concluding remarks. Finally, an annex presents international progress made with financial regulations and oversight in response to the crisis and the implications for Mexico’s financial system.

B A N C O D E M É X I C O
10
2. The international and domestic environment
2.1. International environment
The second half of 2009 and the first half of 2010 saw a stronger-than-expected pick-up in global economic activity driven by extraordinary fiscal and monetary stimulus. However, growth was uneven across regions and sectors. Developed economies experienced modest growth rates while emerging economies experienced relatively stronger growth, especially China, India and Brazil. However, in recent months, the release of diverse indicators pointing to an ongoing slowdown in global trade and in the rate of the recovery in the United States and Japan has fueled fears of a weaker global economic recovery. In European countries the recovery has been irregular, and there are ongoing fears that it could be undermined by the fiscal sustainability efforts of some.
Global financial conditions improved during the second half of 2009. Volatility indexes eased and most financial markets experienced a recovery trend to levels seen prior to the bankruptcy of Lehman Brothers. Nevertheless, during the first half of 2010, both the Euro zone sovereign debt crisis and fears that the economic recovery in developed countries, the US in particular, could lose steam gave rise to new bouts of uncertainty. In response to this the Federal Reserve announced a new asset purchase program (graph 1a). It also announced that prevailing economic conditions justified ongoing exceptionally low federal fund rates for an extended period. This situation weakened the dollar against the world’s hard currencies (graph 2) resulting in historically-low dollar interest rates (graph 1b) and encouraging capital inflows into emerging economies with more favorable spreads. The appeal of many of these economies lies in the fact that growth is potentially higher, their fiscal situation is relatively better than their develop country counterparts’, and their financial systems were not materially impacted by the global crisis.
Authorities in both emerging and developed countries implemented diverse measures and stepped up their intervention in foreign exchange markets in a bid to stem the appreciation of their currencies against the dollar. However, sterilized intervention in currency markets contributed to ongoing favorable interest rate spreads for emerging countries, thus boosting foreign currency flows (graph 1c).

F I N A N C I A L S Y S T E M R E P O R T
11
Graph 1 Federal Reserve Balance, interest rates and capital flows
a) US Federal Reserve assets1/ b) Monetary policy benchmark rate c) Emerging market inflows
Trillion dollars2/ Percentage Billion dollars
0
1
2
3
2005 2006 2007 2008 2009 2010
Other assets
Loans to solvent f inancialinstitutions
Credit market liquidityprovisions
Currency swaps
Support for specif icinstitutions
Securities purchases
Treasury securities
0
2
4
6
8
10
J2007
A J O J2008
A J O J2009
A J O J2010
A J O
EuropeanUnionUnitedKingdomCanada
Mexico
US
35
45
55
65
75
85
95
105
115
125
J2007
A J O J2008
A J O J2009
A J O J2010
A J O
Figures as of October, 2010. Source: Federal Reserve.
Figures as of November, 2010. Source: Bloomberg.
Figures as of November, 2010. Source: Emerging Portfolio.
1/ Include primary liquidity facilities, credit granted through TAF (Term Auction Facility), government securities lent through TSLF (Term Securities Lending Facility) as well as other factors affecting the Federal Reserve’s asset balance.
2/ One billion dollars =1,000,000,000,000 dollars.
Graph 2 Exchange rates of some currencies vs. the US dollar
a) Emerging country currencies 1/ b) Yen c) Euro
January 2007=100 Yens per dollar Dollars per euro
70
80
90
100
110
120
130
140
150
J2007
A J O J2008
A J O J2009
A J O J2010
A J O
Brazil Mexico
Chile Colombia
Poland Turkey
80
85
90
95
100
105
110
115
120
125
130
J2007
A J O J2008
A J O J2009
A J O J2010
A J O
1.20
1.25
1.30
1.35
1.40
1.45
1.50
1.55
1.60
1.65
J2007
A J O J2008
A J O J2009
A J O J2010
A J O
Figures as of November, 2010. Source: Bloomberg.
Figures as of November, 2010. Source: Bloomberg.
Figures as of November, 2010. Source: Bloomberg.
1/ Upward movements reflect currency appreciation against the US dollar.

B A N C O D E M É X I C O
12
Fiscal and monetary stimulus as well as other measures adopted mainly by developed countries to stabilize financial markets played a pivotal role in preventing a collapse of the international financial system and contributing to the economic recovery. Nevertheless, the mobilization of such a large amount of resources (table 1) has inflated fiscal deficits and public debt levels, especially in developed economies.
1 2
Table 1 Public resources used to support the global financial system
As percentage of GDP
Committed Used RecoveredNet
CostGuarantees
Asset swap and
purchase2/
A B C D=B-C E F G=A+E+F
Developed
economies6.2 3.5 0.8 2.7 10.9 7.7 24.8
Canada 9.1 4.4 0.0 4.4 0.0 0.0 9.1
France 1.5 1.1 0.8 0.3 16.9 0.0 18.4
Germany 3.4 4.9 0.0 4.8 17.2 0.0 20.6
Italy 1.3 0.3 0.0 0.3 0.0 2.7 4.0
Japan 6.6 0.1 0.0 0.1 7.2 0.0 13.8
UK 11.9 6.6 1.1 5.4 40.0 28.2 80.1
USA 7.4 4.9 1.3 3.6 7.5 12.1 27.0
Country
Direct support1/ Indirect support
Total committed funds
Source: Fiscal Monitor, Navigating the Fiscal Challenges Ahead, Fiscal Affairs Department, IMF, May, 2010. 1/ Capital contributions, asset purchases, and loans. 2/ Includes government debt purchases by central banks.
Lower fiscal revenues stemming from weaker economic activity is another reason for a higher public deficit as well as bigger outgoings related to unemployment insurance and other social benefit programs (table 2). Thus the size of such economies’ fiscal deficits, public debt as a percentage of GDP, and medium-term debt projections could transform the current financial crisis into a sovereign risk crisis. Doubts about the sustainability of the fiscal positions of some such economies resulted in financial market players increasing the credit risks associated with the sovereign bonds of several Euro member countries, in turn generating fears about the solvency of European banks (graph 3), and even the stability of the euro.
1
In May, the IMF estimated that the amount of public resources committed to supporting the financial system could reach 24.8 percent of GDP in the case of developed countries (with a lot of variance between countries) and 0.8 percent in the case of emerging economies. The figure corresponding to developed countries comprises direct financial sector support amounting to 6.2 percent of GDP (capital contributions 3.8 percent of GDP and asset purchases and loans amounting to 2.4 percent of GDP); guarantees amounting to 10.9 percent of GDP and asset swaps and purchases by central banks amounting to 7.7 percent of GDP. The IMF estimated that the net cost of direct support would be 2.7 percent of GDP, which could come down in the coming years as the recovery figure increases. The estimated net cost of central banks’ financial asset guarantee, swap and purchase programs is not available owing to difficulties encountered obtaining detailed information about the terms and conditions of the programs in order to be able to evaluate counterparty risks and project recovery values for them. Source: Fiscal Monitor, Navigating the Fiscal Challenges Ahead, Fiscal Affairs Department, IMF, May, 2010.
2 More than 670 US financial entities and a further 50 European ones have received public resources.
Iglesias-Sarria Cristina y Fernando Vargas: “Entidades financieras sistémicas: discusión de posibles medidas”. Estabilidad Financiera no.18, Banco de España, May, 2010.

F I N A N C I A L S Y S T E M R E P O R T
13
Table 2 Sovereign risk indicators for selected countries
1/
Percentage of GDP
CountryGovernment deficit
2/
Gross
government debt
Net government
debt
Current
account
balance
France 5.0 84.2 74.5 -1.8
Germany 3.1 75.3 58.7 6.1
Greece 7.4 130.2 109.5 -10.8
Ireland 8.6 93.6 55.2 -2.7
Italy 3.6 118.4 99.0 -2.9
Japan 7.6 225.9 120.7 3.1
Portugal 6.1 83.1 78.9 -10.0
Spain 7.5 63.5 54.1 -5.2
UK 7.9 76.7 68.8 -2.2
USA 8.0 92.7 65.8 -3.2 Source: World Economic Outlook (IMF), October, 2010. 1/ Based on the most recent estimates for 2010. 2/ Fiscal balance adjusted for the effects of the economic cycle and non-structural factors which include
temporary movements in the financial sector and asset prices as well as revenue or spending concepts that are one-time or temporary.
The situation described above has forced the European Central Bank (ECB) to announce a series of commitments and extraordinary measures, including the creation of a European financial stabilization mechanism amounting to 500 billion euros in financial aid for member countries.
3 In addition, the IMF has
pledged as much as 250 billion euros for a total of 750 billion euros in financial support.
Bank balance clean-up processes in the Euro zone have been slower than for other countries affected by the crisis. Default rates are still on the rise in some credit markets and European bank portfolio losses are expected to remain high for the rest of this year as well as in 2011 owing to economic weakness and ongoing pressures in the mortgage market.
4 These factors along with the ongoing
exposure of main European banks to countries with weaker public finances has resulted in a strong increase in counterparty risk and some Euro zone banks facing difficulties refinancing their assets. In an effort to resolve this situation the ECB has provided European banks with more liquidity.
In order to ease tensions in interbank and debt instrument markets, the ECB implemented a series of support measures consisting of the purchase of euro and dollar-denominated sovereign debt and short-term loans. However, these measures were not enough to get markets back to normal in a satisfactory way. Given that doubts about the financial solvency of some banks in the euro region
3
The European financial stabilization mechanism consists of two sources of funding. The first will increase the community facility for providing any of its 27 members with support in the event of balance of payments problems by 60 billion euros. In 2008 the community supported Lithuania, Hungary and Romania in this way. The second will consist of a 440 billion euro trust comprising 16 European country members for the mitigation of individual country sovereign risk through the issuance of Euro bonds. The debt would be guaranteed by all EU member countries in proportion to the resources contributed to the European Central Bank. The trust, which began operating at the beginning of August 2010, will last for three years or else the length of the maturities of the guarantees
4 See European Central Bank (ECB): Financial Stability Review, June, 2010.

B A N C O D E M É X I C O
14
were also raised, in July the Committee of European Banking Supervisors (CEBS) along with the EBC, the European Commission and EU national supervisory authorities, released the results of stress tests applied to 91 European banks representing 65 percent of the regional market in terms of total assets. While the results of these tests partially eased fears about the solvency of European banks, analysts continue to evaluate them and compare the characteristics and assumptions of the European tests with those conducted in the United States. Likewise, doubts about the financial situations of some banks not included in the stress tests have lingered compounded by the bailout of an Irish bank. As a result, European debt markets have not fully returned to normal, and some countries in the region could extend their sovereign debt maturities.
Graph 3 Default hedging cost
1/
a) Euro zone countries b) French and German banks c) Spanish and Italian banks
Basis points Basis points Basis points
0
200
400
600
800
1,000
1,200
J2007
A J O J2008
A J O J2009
A J O J2010
A J O
Greece Ireland
Italy Portugal
Spain
0
100
200
300
J2007
A J O J2008
A J O J2009
A J O J2010
A J O
Deutsche Bank
Commerzbank
Bayerische Landesbank
BNP Paribas
Crédit Agricole
Societé Générale
0
50
100
150
200
250
300
350
J2007
A J O J2008
A J O J2009
A J O J2010
A J O
Santander
BBVA
Intesa Sanpaolo
UniCredit
Figures as of November, 2010. Source: Bloomberg.
Figures as of November, 2010. Source: Bloomberg.
Figures as of November, 2010. Source: Bloomberg.
1/ Refers to the credit default swap spread (CDS).

F I N A N C I A L S Y S T E M R E P O R T
15
European banks have a large presence in Latin America, which is why at one point concern about the impact their deterioration might have on the region was voiced.
5 However, the characteristics of their business models and
organization mean that even in the event of a bigger meltdown in Europe the aftershock would not be as great as when Lehman Brothers collapsed. Recent experience shows that credit granted by subsidiaries of foreign banks has been more stable than credit granted through branches.
6 That is why the countries and
regions in which global banks participate through subsidiaries, which is the case in Mexico, fared relatively better during the crisis than those in which interbank financing and cross-border loans play a bigger role. The size of the decrease in global bank credit to other countries was apparently due to three factors: i) the credit demand conditions of each economy; ii) the peculiar situation of international banks and foreign subsidiaries; and iii) the global banking business model. Thus graph 4a shows how credit granted directly by global banks (cross-border) along with foreign currency-denominated credit
7 granted by foreign
subsidiaries and branches decreased more than local currency-denominated credit granted by them in each country. That is why global bank credit (and credit supplied by subsidiaries) was more stable in Mexico than in Eastern Europe and Asia where banks have more centralized business models or operate through branches (graph 4b).
The trend in credit granted by foreign bank subsidiaries and branches is closely related to the operating model of the financial group they belong to. Generally speaking financial groups that manage their strategic decisions, risks and liquidity in a relatively more centralized way are more likely to redistribute capital and liquidity among the different entities they control more frequently as well as register their operations in other states and countries in order to take advantage of economies of scale and/or fiscal and regulatory incentives. Banks with more centralized models also usually expand their international footprint by granting cross-border loans to residents of other countries or by setting up branches there. Japanese and German banks are among those that undertake most of their international operations directly from their head office.
8 Some experts
in the field refer to this model as international banking.9
In contrast other global banks seek to expand internationally by setting up foreign subsidiaries or buying local banks. Likewise, they try to finance loans granted in each country locally and in the corresponding currency. This operating
5 International banks partly contributed to the crisis spreading to other countries through lending activities,
especially in the months following the collapse of Lehman Brothers. A similar situation occurred at the beginning of the nineteen nineties in the United States when the subsidiaries and branches of Japanese banks reduced credit granted to US borrowers (Joe Peek and Eric S. Rosengren: “The international transmission of financial shocks: the case of Japan”, The American Economic Review, 87 (1997), 495-505).
6 This situation occurred in the United Kingdom where cross-border credit and credit granted by the
branches of foreign banks decreased more than credit granted through the branches of local banks. Bank of England: Financial Stability Report. No. 27, June, 2010, page 17.
7 This concept corresponds to the heading international claims in the Bank for International Settlements’ (BIS) Banking Statistics database and refers to credit granted by an international bank to residents of a country other than the one where the bank is legally incorporated (cross-border credit), as well as credit granted by the foreign subsidiaries and branches of said international bank in currencies other than those of the country where the credit is granted. In the graphs contained in this Report, this concept is called “foreign currency credit”.
8 Robert McCauley, Patrick McGuire and Goetz von Peter: “The architecture of global banking: from
international to multinational?” BIS Quarterly Review, March, 2010, 25-37. BIS Banking Statistics. 9 Jones, G.: Multinational and International Banking, Edward Elgar Publishing Ltd., 1992.

B A N C O D E M É X I C O
16
model is referred to as multinational. Global banks that operate mainly through subsidiaries and local deposits (multinational model) reduced their supply of credit in emerging markets relatively less than banks that channel resources directly from their head office (international model). In Mexico foreign banks are not allowed to operate through branches and this has encouraged recourse to less centralized decision-making models.
Graph 4 Credit granted by the branches and subsidiaries of global banks
1/
a) Credit granted in foreign currency2/ and local
currency3/ to emerging markets
4/
b) Foreign currency credit granted to emerging markets by region
4/
YoY percentage change YoY percentage change
-20
-10
0
10
20
30
40
50
M2007
J S D M2008
J S D M2009
J S D M2010
J
In foreign currency 2/
In local currency 3/
-30
-20
-10
0
10
20
30
40
50
60
M2007
J S D M2008
J S D M2009
J S D M2010
J
Latin America
Eastern Europe
Asia
Figures as of June, 2010.
Source: BIS Banking Statistics and IMF International Financial Statistics.
Figures as of June, 2010. Source: BIS Banking Statistics.
1/ Global bank credit includes credit granted directly by a bank to the banks and non-bank banks of other countries (cross-border credit) and credit granted by the foreign subsidiaries and branches of said global bank in currencies other than those of the country where the credit is granted. This concept corresponds to the heading international claims in the BIS Banking Statistics database.
2/Foreign currency credit refers to credit granted by a global bank to the residents of a country other than the one where the bank is legally incorporated (cross-border credit), as well as the foreign subsidiaries and branches of said global bank in currencies other than those of the country where the credit is granted. This concept corresponds to the international claims heading in the BIS Banking Statistics database.
3/ Refers to credit granted by the subsidiaries and branches of a global bank in local or national currency (exchange rate adjusted). The adjustment was done by indexing the exchange rate to the fourth quarter of 2005.
4/ The data is taken from banks that report to BIS and refers to credit granted by China, South Korea, the Philippines, India, Indonesia, Malaysia, Estonia, Hungary, Poland, The Czech Republic, Argentina, Brazil, Chile, Colombia, Costa Rica, Mexico and Peru.
2.2. Domestic environment
With respect to the Mexican economy, the second half of 2009 saw a strong rebound in manufacturing output, mostly reflected an improvement in US industrial output, which led to a gradual recovery in Mexican manufacturing exports. In contrast, the recovery of other domestic demand headings and thus non-tradable goods sectors was much slower.
The first half of 2010 saw an ongoing positive trend in manufacturing exports and therefore manufacturing sector output. While domestic spending also rose in seasonally-adjusted terms compared to the previous six months, favoring a recovery in the production of some non-tradable goods, growth continued to trail that of goods and services exports (graph 5). Meanwhile construction and investment remained depressed.

F I N A N C I A L S Y S T E M R E P O R T
17
Recent data suggest that the rate of economic growth could slow during the rest of the year, mainly due to more moderate external demand growth. Expectations regarding US industry growth in 2010 and 2011 suggest some slack in the coming months, which could impact Mexican manufacturing export growth.
Graph 5 US manufacturing exports and Mexican industrial output and aggregate demand
Seasonally-adjusted data
a) US manufacturing exports and industrial output
b) Aggregate demand
Index 2008=100 Index third quarter of 2008=100
85
87
89
91
93
95
97
99
101
103
105
66
70
74
78
82
86
90
94
98
102
106
110
J
2007
A J O J
2008
A J O J
2009
A J O J
2010
A
Manufacturing exports
US Industrial output
75
80
85
90
95
100
105
M
2007
J S D M
2008
J S D M
2009
J S D M
2010
J
Total demand
External demand
Total consumption
Total investment
Figures as of June, 2010.
Source: Banco de México and US Federal Reserve.
Figures as of June, 2010.
Source: Sistema de Cuentas Nacionales de México. INEGI.

B A N C O D E M É X I C O
18
3. Financial markets
3.1. Capital market
Fixed Income
The stabilization of local debt market conditions as well as a more stable exchange rate as of the second half of 2009, enabled the Federal Government to gradually resume its pre-crisis debt placement schedule (graph 6a), and there has been a strong increase in bond holdings by foreign investors (graph 6b). The Federal Government took advantage of favorable international conditions to undertake foreign currency-denominated debt issuances, although the placement rate was slower than for state-owned and private companies.
Better local market conditions also enabled the Bank Deposit Insurance Institute (IPAB) to resume global weekly security placements at pre-crisis levels as well as preserve the spread between the yield on IPAB securities and other government securities (graph 6c). Nevertheless, IPAB issuance maturities remain below pre-crisis ones.
Graph 6 Public sector debt placement
a) Federal Government’s quarterly placements in pesos
b) Securities held by foreigners c) Spread between IPAB securities and bondes
Billion pesos Billion pesos Basis points
0
50
100
150
200
250
300
350
400
0
20
40
60
80
100
120
140
M2007
J S D M2008
J S D M2009
J S D M2010
J S
BondesBonos <=5ABonos >5AUdibonosCetes
0
50
100
150
200
250
300
350
400
450
500
D2007
M J2008
S D M J2009
S D M J2010
S
Bonos M Cetes
Udibonos Other 1/
0
10
20
30
40
50
60
J2007
A J O J2008
A J O J2009
A J O J2010
A J O
Figures as of September, 2010. Source: Banco de México.
Figures as of September, 2010. Source: Banco de México.
Figures as of October, 2010. Source: Banco de México.
1/ Includes non-itemized government, private, banking and European securities.
Actions taken by the Mexican financial authorities helped improve market conditions, in particular a syndicated debt placement program for long-term bonds and udibonos implemented during the first quarter of 2010 (Box 1). This program has pumped more liquidity into government debt markets and made them deeper; as a result, long-term yields are more stable. Furthermore, debt policy management, a clear issuance schedule, credit rating levels and bond liquidity resulted in Mexico’s sovereign debt being included in the World Global Bond Index (WGBI).

F I N A N C I A L S Y S T E M R E P O R T
19
Box 1
Syndicated placements and World Goverment Bond Index (WGBI)
Syndicated placement of government securities
In order to accelerate the process of introducing new government securities issuances,
1 this institution decided to
promote placement through a bond syndication mechanism, in initial amounts larger than those of traditional auctions and also with a larger number of investors. This issue mechanism, a complement to traditional auctions, has been widely used in countries of the Euro zone, and has a number of advantages:
It ensures a substantial initial value outstanding for new issues.
It makes the new issues eligible for inclusion in global fixed-income indices from the start.
It encourages broad distribution among local and foreign investors.
It guarantees better liquidity conditions in the secondary market.
The syndication process works as follows: four leading distributors and three secondary distributors are chosen from among existing market makers in order to assess potential interest. Once the potential demand is formed, a definitive amount is established, along with the price at which the issuer is prepared to sell the securities, after which the definitive assignment takes place.
In the year 2010 to date, the federal government has made three successful syndicated placements. The first was a fixed-rate bond with maturity of 10 years expiring in 2020, for 25 billion pesos, with a bid-to-cover ratio of 3.0 times. The second placement was a 30-year Udibono expiring in 2040 for 3.5 billion UDIs (about 15 billion pesos) and the bid-to-cover ratio was 3.5 times. The third was a fixed-rate bond at 5 years, maturing in 2015, for 25 billion pesos; for this issue the bid-to-cover ratio was 2.2 times. In the first two cases, the issues were distributed among 60 institutional, local and foreign investors; the final one was distributed among 48 investors.
Government bond index
The World Government Bond Index (WGBI), created by Citigroup, is part of a series of benchmark indices that track the market for government debt in the currencies of each of the countries included. This type of index serves as a global reference on government bonds that meet the following requirements:
Size: to be eligible, issues must total at least 20 billion dollars, and each issue should have a minimum outstanding value of 1 billion dollars.
Credit grade: the WGBI has a rating equivalent to investment grade, a minimum of BBB- for S&P and Baa3 for Moody's.
Access: The local market must facilitate the involvement of foreign investors, make sure issue policies are followed, and guarantee the free movement of capital.
The WGBI is made up of close to 800 bonds with maturities of longer than a year, issued by countries with developed markets. It currently includes bonds from Germany, Australia Austria, Belgium, Canada, Denmark, Spain, the United States, Finland, France, Greece,
2 Ireland, Italy, Japan, Malaysia,
Mexico, Norway, the Netherlands, Poland, Portugal, Singapore, Sweden, Switzerland and the United Kingdom.
On June 3, 2010, Citigroup announced that Mexico would be included in the index. Thus, on October 1 of this year, Mexico became the first Latin American country to join the WGBI, with fixed-rate federal government bonds totaling a market value of 116.8 billion dollars.
3
1 Normally it takes between four and eight months for a new bond or
Udibono issuance to accumulate an outstanding amount high enough to create a sufficiently liquid secondary market, and the amount outstanding must be at least 15-20 billion pesos. 2 The downgrade of Greek debt will cause it to be removed from the
WGBI Index. Greek bonds account for 1.34 percent of the WGBI. 3 SHCP Press Release 077/2010, October 1, 2010.

B A N C O D E M É X I C O
20
The WGBI index comprises government debt issued in the local markets of the main economies. Its importance lies in the number of investors who use it as a reference for portfolio composition. Mexico’s inclusion should translate into more stable and greater demand for local bonds as well as boost foreign currency-denominated inflows into the country.
Despite better conditions in local debt markets, states and municipalities have recently been resorting more to bank debt. This is because for some states securing short-term bank loans is not subject to authorization from local congresses. Furthermore, changes to CNBV regulations have made it easier for banks to extend such loans, which are not usually backed by federal revenue sharing.
10 State-owned companies, Pemex and the CFE, mainly, have not had any
difficulty securing funding in the local market while Infonavit and Fovissste have managed to maintain their mortgage-backed securities programs.
The amount of stock certificates (certificados bursátiles) placed by private issuers rose by 24.4 percent in the first half of 2010 versus the same year-earlier period (graph 7b). Meanwhile the amount of short-term issuances decreased (36.7 percent in the first half of 2010 versus the same year-earlier period) as well as the number of issuers in this maturity (from 46 to 35 during the first half of 2009 and the same 2010 like period). At the same time a large number of Mexican companies have taken advantage of better conditions for tapping foreign financial markets in order to issue debt as a substitute for development bank loans during periods of tighter liquidity in international markets.
11 Thus
during the second half of 2009 and the first half of 2010, private companies issued around 16.6 billion dollars in euro bonds compared with 834 million placed during the previous twelve months. During the third quarter of 2010 7 billion dollars more was issued. Furthermore, in the local market the value of long-term placements made by private companies rebounded as of that quarter recovering the previous year’s placement rate; between January and October 2010, 74.1 billion has been placed, similar to the total amount placed in 2009 (graph 7c).
With respect to short-term corporate instruments a lower placement rate was accompanied by a strong decrease in the yield spread versus TIIE (graph 8). Nevertheless, the weighted average maturity of these issuances contracted during the first half of 2010 versus the previous six months due to a large placement of debt by big corporations with below 28-day maturities.
10
In November 2009, the CNBV made changes to the portfolio grading and provisioning methodology. Loans with a less than 180 day maturity granted to states, municipalities and decentralized entities would not qualify for the risk adjustment stipulated in CNBV regulations if federal revenue sharing or any other type of federal or municipal revenue were not their payment source and they were not listed in the Register of State and Municipal Debt and Public Loans. Total provisions for loans and account receivables (maturing in less than 180 days) with federal revenue sharing as a payment source can decrease by 15 percent.
11 Between the second half of 2009 and the first half of 2010, 22 non-financial Mexican companies made 35 debt placements in international markets, the most for any similar period in Mexican history.

F I N A N C I A L S Y S T E M R E P O R T
21
Graph 7 Placement of private debt
a) Long-term stock certificates by rating
b) Asset-backed and non-asset backed long-term stock certificates
c) Long-term debt placements of Mexican corporations by currency
Billion pesos Billion pesos Billion pesos
0
5
10
15
20
25
30
35
40
45
M2007
J S D M2008
J S D M2009
J S D M2010
J S
AAA-AA A-C
0
5
10
15
20
25
30
35
40
45
M2007
J S D M2008
J S D M2009
J S D M2010
J S
Non asset backed Asset backed
0
10
20
30
40
50
60
70
80
90
100
M2007
J S D M2008
J S D M2009
J S D M2010
J S
Local currency Foreign currency
Figures as of September, 2010. Source: Banco de México.
Figures as of September, 2010. Source: Banco de México.
Figures as of September, 2010. Source: Banco de México y Bloomberg.
Graph 8 Short-term private issuances
a) Monthly placements of short-term stock certificates
b) Bid-to-cover of short-term corporate bonds
c) Spread versus TIIE of short-term corporate bonds
Billion pesos Times Basis points
0
5
10
15
20
25
30
35
40
45
J2008
A J O J2009
A J O J2010
A J O
AAA-AA A-C
0.0
0.5
1.0
1.5
2.0
2.5
J2008
A J O J2009
A J O J2010
A J O
AAA-AA A-C
-100
0
100
200
300
400
500
J2008
A J O J2009
A J O J2010
A J O
AAA-AA A-C
Figures as of October, 2010. Source: Banco de México.
Figures as of October, 2010. Source: Banco de México.
Figures as of October, 2010. Source: Banco de México.

B A N C O D E M É X I C O
22
Mortgage sofomes (Regulated Multiple Purpose Financial Institutions) were the local financial market intermediary most impacted by the financial crisis because of their strong dependence on wholesale funding with relatively short maturities which makes them especially vulnerable to periods of volatility. Thus it is not surprising that they should be facing relatively greater difficulties in recovering debt placement volumes despite using development bank guarantees for unsecured issuances. Furthermore, in 2009 and the first half of 2010, mortgage sofomes did not undertake any mortgage or bridge-loan backed securities issuances. Factors which explain this include the mortgage portfolio delinquency level with respect to more recent vintages backing some of these maturities as well as deterioration in the collateral underpinning their structures (graph 9).
Graph 9 Credit quality indicators of mortgage-backed issuances
a) Average delinquency of the securitized mortgage portfolios of
different lenders
b) Delinquency level by vintage c) Average guarantee of the securitized mortgage portfolios of
different lenders 1/
Percentage Vertical axis: percentage Horizontal axis: Months following
placement
Percentage
0
5
10
15
20
25
30
35
J2007
A J O J2008
A J O J2009
A J O J2010
A J
Crédito y Casa
GMAC
Su Casita
Metrof inanciera
Fincasa
Patrimonio
ING Hipotecaria
0
2
4
6
8
10
12
14
16
18
20
1 3 5 7 9 11 13 15 17 19 21 23
1999-2004 2005
2006 2007
2008
-35
-30
-25
-20
-15
-10
-5
0
5
10
J2007
A J O J2008
A J O J2009
A J O J2010
A J
Crédito y Casa
GMAC
Su Casita
Metrof inanciera
Fincasa
Patrimonio
ING Hipotecaria
Figures as of August, 2010. Source: Sociedad Hipotecaria Federal (SHF).
Figures as of August, 2010. Source: Sociedad Hipotecaria Federal (SHF).
Figures as of September, 2010. Source: Sociedad Hipotecaria Federal (SHF).
1/ The guarantee is the difference between the securitized mortgage portfolio balance less the unpaid balance of debt issued as a percentage of the securitized mortgage portfolio.
Deterioration in mortgage portfolios backing several security issuances placed in the market as well as in their guarantees and the credit ratings of the banks that backed them, resulted in some issuers not being able to meet principal amortizations and having to enter into debt restructuring negotiations (table 3). As a result, several such guarantors’ credit ratings are close to default levels, as reflected in some of these securities’ ratings. This situation does not however represent a systemic risk, as it accounts for a very small part of the financial system.
Contrary to the lack of sofom mortgage-backed issuances, the conservative stance adopted by both the Infonavit and Fovissste, consisting of giving their mortgage-backed issuances a wide capital margin (average levels of 30 to 40% on the total value of the issuance) meant there was no disruption to the market for such securities.

F I N A N C I A L S Y S T E M R E P O R T
23
Table 3 Mortgage-Backed Securities (borhis)
1/
DI4/
guarantee5/
balance5/
Security
guarantee2/ %
Mortgage
guarantee2/ % (%) (%) (mdp)
Sofomes 22.8 -15.8 24,908
Su Casita 22.3 -17.1 10,860
BRHCCB07U MBIA 100 29.8 -39.5 2,605 AAA BB
BRHCCB08U Genworth/SHF 30 27.6 -37.0 1,685 AAA A
GMAC Financiera 28.6 -28.4 4,519
MXMACCB06U IFC 10.95 SHF 25 25.0 -6.3 328 AAA BBB
MXMACFW06U FGIC 100 41.7 -85.2 565 AAA CCC
MXMACFW07U FGIC 100 24.8 -17.6 741 AAA A
MXMACFW07-3U MBIA 100 29.5 -29.1 1,055 AAA BB
MXMACFW07-5U MBIA 100 32.6 -49.2 610 AAA B
Crédito y Casa 29.9 -19.1 3,436
CREYCB06U SHF 25 30.8 -21.5 3,039 AAA A
Ticker symbol
Security
rating on
issuance
date
Security
rating as at
September
2010
Source: Sociedad Hipotecaria Federal (SHF) and rating agencies Fitch, S&P and Moody’s. 1/ Only issuances with a delinquency rate of more than 20 percent on the date indicated which had also been downgraded from AAA to minus A in the
structure’s preferred segment or from A to CCC in the subordinated segment were considered. 2/ As of July, 2010, the guarantors’ global ratings were: IFC: AAA; FGIC: CC; Genworth: BBB; MBIA: BB- and SHF: BBB+. 3/ Rating agencies’ worst rating are used. 4/ Figures as of August, 2010. 5/ Figures as of September, 2010.
Equities
Capital flows into emerging markets driven by historically low interest rates in dollars have continued to drive investments in equities (graph 10a). Thus the Mexican Stock Exchange Index (Índice de Precios y Cotizaciones, IPC) gained 101.6 percent between March 2009 and its April 15th 2010 high (graph 10b).
Fears about the solvency of some European countries and the strength of the US recovery put a temporary brake on the rise in stock markets in the second half of 2010. However, the Federal Reserve’s announcement of monetary stimulus measures was reflected in stronger capital follows into emerging stock markets.

B A N C O D E M É X I C O
24
Graph 10 Equity market
a) Foreign investment in stock markets
b) Stock indexes: Mexico and other emerging markets
1/
c) Number of companies that placed stock on the BMV
2/
Billions of dollars January 2007 = 100
0.0
0.5
1.0
1.5
2.0
2.5
3.0
3.5
4.0
0
100
200
300
400
500
600
700
800
J2007
A J O J2008
A J O J2009
A J O J2010
A J O
Emerging markets
Mexico
0
20
40
60
80
100
120
140
160
180
200
J2007
A J O J2008
A J O J2009
A J O J2010
A J O
Mexico Brazil
Emerging US
Europe
0
2
4
6
8
10
12
2005 2006 2007 2008 2009 2010
Additional Init ial
Figures as of October, 2010. Source: Emerging portfolio.
Figures as of October, 2010. Source: Banco de México.
Figures as of October, 2010. Source: BMV.
1/ Equity indexes in dollars prepared by MSCI. 2/ Mexican Stock Exchange (Bolsa Mexicana de Valores, BMV)
In 2010, the number and value of stock market placements in Mexico rebounded compared to the previous two years. However, they have not yet returned to levels seen during the period 2005-2007 (graph 10c). For example, in 2005 stock amounting to 110.2 billion pesos was placed while during the first 10 months of 2010 placements amounted to only 5.9 billion. Nevertheless, it is worth noting that four of the stock offerings that took place in 2010 corresponded to initial public offerings, or IPOs.
The development of the equity market has led to the creation or introduction of new financial instruments. Since the placement of the first Stock Indexed Security (TRAC) in 2002 through October, 2010 13 TRAC have been placed, 6 of which were placed in 2010, amounting to 124.9 billion pesos. As of 2003 it is possible in Mexico to invest in stocks of foreign companies and as of 2004 in negotiable funds (Exchange Traded Funds, ETF) through BMVs global stock market. As of October 2010, there were 293 registered foreign stocks and 304 negotiable funds listed on the global market, either directly or through a sponsor. Graph 11 shows the number of listed companies, funds and stock certificates for each year.
In July and August 2009, regulations for issuers and siefores were modified to include Development Capital Certificates, DCC.
12 DCC are similar to
equity instruments in that the trust’s assets generate variable income that is not guaranteed from investments made by the certificates’ trust. This means there is no obligation to pay principal or interest on these securities. Rating agencies do not assign credit ratings to these instruments. DCC were created as a funding
12
DCC are trust certificates granting the right to a share of the returns, goods or rights or the sale of goods or rights forming part of the trust’s assets, even their residual value, in order to channel them to development activities or the projects of one or several companies or else the acquisition of certificates representing the capital stock.

F I N A N C I A L S Y S T E M R E P O R T
25
alternative for investors with a long-term investment environment such as siefores. They also seek to boost funding of long-term investment projects using funds from public investors such as infrastructure projects, start-up companies with high growth expectations or investment in the shares of private companies. These instruments began to be placed on a regular basis in October 2009. As of October 2010, 10 DCC had been placed amounting to 25.8 billion pesos (graph 11c).
Graph 11 Equity market
a) Shares of foreign companies listed on the BMV’S global market
for each year.
b) Negotiable funds listed on the BMV’s global market for each year.
c) Development Capital Certificates (DCC) placed on the
BMV each year.
Number of companies Number of funds Left axis: billions of pesos Right axis: number of DCC
0
5
10
15
20
25
30
35
40
45
50
2005 2006 2007 2008 2009 2010
United States Other countries
0
10
20
30
40
50
60
70
80
90
100
2005 2006 2007 2008 2009 2010
United States Other countries
0
1
2
3
4
0
2
4
6
8
10
12
14
D2009
M J S2010
O
Amount Placed
Number of placements
Figures as of October, 2010. Source: BMV.
Figures as of October, 2010. Source: BMV.
Figures as of October, 2010. Source: BMV.
3.2. Foreign exchange market
Peso exchange rate volatility eased as of the second half of 2009. The foreign exchange market has tended to normalize with a partial recovery in the number of players and an almost complete reversal of the decrease in the trading volume since the middle of 2008. Thus the spot transaction trading volume has recovered, buy/sell spreads have narrowed again (graph 12a) and market liquidity and depth is once again greater than for other emerging market currencies (graph 12b). Graph 12c shows the peso return volatility of these transactions. The recovery of the Mexican economy and international trade and capital flows has also contributed to an improvement in foreign exchange market conditions.

B A N C O D E M É X I C O
26
Graph 12 Foreign exchange market
a) Spreads between the peso spot buy and sell rate
b) Daily spot volume of selected currencies
c) Implied rate in pesos in dollar-peso swaps and benchmark rate
Cents 10-day moving average
Billions of dollars 20-day moving average
Percentage
0.0
0.2
0.4
0.6
0.8
1.0
1.2
1.4
1.6
1.8
J2007
A J O J2008
A J O J2009
A J O J2010
A J O
0
2
4
6
8
10
12
M2007
A N F M2008
A N F M2009
A N F M2010
A
New Zealand
Hungary
Poland
Turkey
South Africa
Mexico
0
1
2
3
4
5
6
7
8
M2009
J S N j2010
M M J S
Same day implied rate
Overnight rate
Figures as of October, 2010. Source: Banco de México.
Figures as of October, 2010. Source: Reuters.
Figures as of October, 2010. Source: Reuters.
Expectations that interest rates in developed countries will remain low for longer along with better economic prospects for some emerging markets has encouraged a strong increase in capital inflows along with carry strategies in such currencies (Box 2). In fact, capital inflows into emerging market economies during the first six months of 2010 were the highest in five years. During the first half of 2010 Mexico witnessed very large inflows in the form of direct foreign investment and non-resident financial savings.
A more stable foreign exchange market enabled the Foreign Exchange Commission to abandon its daily dollar auction mechanism at the end of the third quarter of 2009 and subsequently suspend the dollar sales it undertook whenever the peso depreciated by 2 percent versus the previous day’s close. The Foreign Exchange Commission also decided to resume the Central Bank’s dollar option sales mechanism, which between 1995 and 2001 proved successful at shoring up international reserves. Using this mechanism dollar sale options amounting to 600 million dollars are auctioned to Banco de México each month. These options can be exercised either fully or partially on any day of the month following the one in which the auction was held as long as the reference exchange rate (fix) determined the previous working day is not higher than the average rate corresponding to the twenty working days immediately preceding the strike option date.

F I N A N C I A L S Y S T E M R E P O R T
27
Box 2
Foreign currency carry trading
Amid an easing of risk aversion and steep drop in interest rates in the United States and other developed economies, participants in the international financial markets have sought to take advantage of spreads between interest rates in dollars and in other currencies in order to make a profit. The strategy is to borrow funding in dollars or in the currency of countries where interest rates are low, and then invest in financial instruments denominated in the currencies of countries offering higher yields.1 This type of transaction, known internationally as carry trade, promises a gain from interest rate spreads, but also implies a risk of exposure to exchange-rate fluctuations.
Carry trading in foreign currency can be done in two ways. The first is to obtain funding in a currency where interest rates are low (short position) and invest it in assets denominated in a currency for which interest rates are much higher (long position). The second, which is much simpler, is to take advantage of the spread between the forward and spot exchange rates of the two currencies in question, which is called "forward points”. This spread exists because interest rates in the two currencies are different. So the strategy is to make a future sale of the currency with the low interest rate, which implies a future purchase of the currency with the higher interest rate, the profit being the forward points.
The spot exchange rate indicates the amount of a given currency that must be delivered for each unit of another currency two days after the trade is agreed upon. The forward exchange rate refers to the same foreign-currency transaction when the currencies are exchanged days or months after the trade is agreed upon. Accordingly, the forward exchange rate offers the investor a premium or discount based on the interest rate spread during the period between the date the trade was agreed upon and the date the currencies are exchanged. The forward exchange rate that will result in this benefit is obtained from the parity condition of the interest rates involved, which is mathematically expressed as follows:
tFt
S)i1(*)i1(
where St is the spot Exchange rate in t; Ft is the forward exchange rate in t of the corresponding term, and the variables i e i* represent the interest rates associated with the currencies in the same period.
2 Thus, the relationship between
the spot and forward exchange rates is precisely the result of the interest rate spread between the two currencies.
*)i1(
*)ii(tStStF
Forward exchange rates allow investors to take long positions in currencies that offer higher interest rates, without using funds to acquire debt instruments in that currency. All they have to do is take out a future purchase of the currency in question; the forward exchange rate should incorporate the interest rate spread in their favor. When it comes time to settle the trade, it is common in the forex market that instead of exchanging the currencies on the date the forward expires, investors often simultaneously take out a spot trade that is the reverse of the original forward, and a new forward, so they settle with the counterparty the difference between the forward
exchange rate agreed upon in the initial trade (Ft) and the spot exchange rate on the date the initial transaction expires (St+1).
Economic theory establishes that an investment strategy based on arbitrage in the interest rates of various countries should not be profitable. The hypothesis of the predictability of exchange rates (the Forward Rate Unbiasedness Hypothesis) establishes that the forward exchange rate is equal to the expected value of the spot exchange rate on the delivery date, under conditions of risk neutrality and rational expectations. Thus, the interest rates in question attain parity, and the expected depreciation of the currency is effectively offset by the interest rate spread between the two countries. But many empirical studies have suggested that the forward exchange rate is not a good predictor of future spot exchange rates, in other words, that Ft ≠ E(St+1).
3 Nevertheless, interest rate parity is used in practice by the markets to set forward exchange rates. So borrowing in currencies where interest rates are low and investing in currencies where interest rates are high is equivalent to taking a short position in the currency with a positive forward premium and taking a long position in the currency with a negative forward premium (discount). This transaction effectively produces a positive yield provided the spot exchange rate of the currency to be purchased--in terms of the currency to be sold--does not depreciate by more than the forward points.
Figure 1
Carry trade return
Percentage
Exchange rate
appreciation,
%
Return
0
*
t ti i
Exchange rate
depreciation,
%
As the figure above shows, the risk of this strategy lies in exchange-rate uncertainty (St+1) and does not therefore constitute pure arbitrage. Furthermore, this type of trading is usually conducted with high leverage, so small movements in the exchange rate can lead to heavy losses.
1 This type of trading is also frequently used to obtain foreign-exchange
gains from a possible appreciation of the currency in which interest rates are higher. 2 The formula implies that the spot and forward exchange rates are
defined as the price of the currency in which i* is denominated, in terms
of the currency in which i is denominated. 3 Eugene Fama proved that the spot exchange rate in t is a better
predictor of spot future exchange rates than the forward exchange rate in t corresponding to the horizon in question. The divergence between the value of the forward exchange rate and the expected value of the future spot rate (a conditional expectation given the set of information available in t), is explained by adding a term that is interpreted as a risk premium. See E. F. Fama: “Forward and Spot Exchange Rates”, Journal of Monetary Economics, 14 (1984) 3, 319-338.

B A N C O D E M É X I C O
28
3.3. Derivative market
In the second half of 2009 the total notional value traded in international derivative markets returned to levels similar to or even above those prevailing before the crisis; such was the case of interest rate derivatives (graph 13a). In the Mexican market by contrast, pre-crisis levels have not yet been recovered. The interest rate swaps market (the biggest local derivative market) continues to display an incipient recovery characterized by the low presence of foreign counterparties (graphs 13b and c).
13
Graph 13 Derivatives market trading
a) Current international notional value by underlying asset type
b) Swap trading volume by underlying asset type
2/
c) Mexican banks’ counterparty in swap transactions
Trillions of dollars1/ Billions of pesos Percentage
0
100
200
300
400
500
600
700
800
20
02
20
03
20
04
20
05
20
06
20
07
20
08
20
09
Currencies
Interest rates
Equities
Merchandise
CDS
Other
0
50
100
150
200
250
300
M2007
J S D M2008
J S D M2009
J S D M2010
J S
Interest rate
Exchange rate
0
20
40
60
80
100
120
I2007
II I2008
II I2009
II I2010
II
Parent Foreign entity
Mexican entity Others
Figures as of December, 2009. Source: BIS.
Figures as of October, 2010. Source: Banco de México.
Figures as of October, 2010. Source: Banco de México.
1/ 1 billion dollars =1,000,000,000,000 dollars. 2/ Volume is expressed as the nominal value of the derivative excluding the number of cash flows and including buys and sells. The series are
presented as the 12-week moving average.
During the second half of 2009 and the first half of 2010, around 90% of the interest rate swap trading volume in Mexico was negotiated mostly in OTC markets (graph 14). While the TIIE future is the most traded contract in the MexDer, volume represented only 6.7% of the 2009 total.
At the end of June 2010, interest rate derivative exposure amounted to around 3.5 billion dollars, while currency derivative exposure was around one billion dollars. This exposure is modest compared with September, 2008 levels
13
The tax treatment applicable to foreign counterparty transactions has resulted in their participation remaining at levels below those which prevailed prior to the crisis. In Mexico, derivative transactions are subject to the same tax treatment as their underlying assets. This means that interest rate derivatives that banks undertake with foreign residents are subject to a tax withholding. The banks usually assume the risks associated with derivative transactions with clients through mirror transactions with foreign banks. The aforementioned fiscal withholding makes this expensive as it does not exist in many countries. Banks established in Mexico used to document these transactions at their foreign branches and subsidiaries. However, in 2009 tax authorities decided that in accordance with current legislation such transactions are subject to the same tax withholding. This is why most banks established in Mexico have reduced the amount of such transactions.

F I N A N C I A L S Y S T E M R E P O R T
29
when defaults on interest rate derivative contracts amounted to 22 billion dollars, and defaults on currency derivative contracts 12.7 billion dollars.
14
Graph 14 Interest rate derivative markets in Mexico
1/
a) Weekly turnover by contact type b) Weekly turnover by market type c) Weekly turnover by counterparty type
Trillions of pesos Trillions of pesos Trillions of pesos
0
1
2
3
4
5
6
7
8
9
10
J2007
A J O J2008
A J O J2009
A J O J2010
A J O
Futures
Forwards
Swaps
0
1
2
3
4
5
6
7
8
9
10
J2007
A J O J2008
A J O J2009
A J O J2010
A J O
OTC
MexDer
0
1
2
3
4
5
6
7
J2007
A J O J2008
A J O J2009
A J O J2010
A J O
Bank
Non banking
Foreigners
Figures as of October, 2010. Source: Banco de México.
Figures as of October, 2010. Source: Banco de México.
Figures as of October, 2010. Source: Banco de México.
1/ Turnover is stated as the nominal value for each derivative stream and includes buys and sells. The series are presented as the 12-week moving average.
14
Exposure can significantly vary in a very volatile environment, especially in positions with non-linear behavior.

B A N C O D E M É X I C O
30
4. Financial Intermediaries
Over the last five years financial system assets have grown at a real average annual rate of 7.5 percent.
15 This growth has been mainly driven by
mutual funds (16.9 percent in real terms), Afores (14.7 percent in real terms) and insurance companies (9.5 percent in real terms). Commercial banks are still the main financial intermediary, although they have lost market share (table 4).
Table 4 Financial System’s Structure
Commercial banks1/ 41 50.4
Pension fund managers (afores)2/ 15 13.4
Mutual funds magement companies3/ 61 11.4
Development banks4/ 10 9.6
Insurance companies 98 6.2
Brokerage firms 35 4.1
Special-purpose non-bank financial institutions (sofoles) and
multi-purpose financial institutions (sofomes)5/ 1,704 3.5
Social savings and loans institutions 6/ 93 0.7
Other financial institutions7/ 183 0.6
Number of
entities
Share of total assets
(%)
Figures as of June, 2010.
Source: Banco de México, CNBV, SHCP, Condusef and AMFE. 1/ Commercial bank total assets include those of regulated sofomes which are consolidated with the respective bank. 2/ Afores as a whole manage 87 siefores (pension funds). 3/ This companies manage 524 mutual funds in all. Of the 61 mutual funds management companies, 4 are commercial
banks, 10 are brokerage firms, and 47 are mutual fund management companies. 4/ Includes development banks and development trusts (FIRA, Financiera Rural, FOVI and Fonatur). 5/ Includes unregulated sofoles and sofomes as well as ones that are regulated because they belong to a financial
group. Out of a total of 23 regulated sofomes, 10 consolidate their financial statements with a commercial bank and the table reports their assets as part of commercial banks’.
6/ This figure include SAPs, sofipos and socaps, which as of June 2010 had CNBV authorization to do business. 7/ Includes: bonding companies, deposit warehouses, leasing companies, money exchanges, credit unions and
financial factoring companies.
Most banks, brokerage firms, mutual funds and Afores are part of financial groups that control 49.7 percent of the financial system’s assets.
16 The
country’s seven largest banks are part of financial groups; five of them are incorporated as foreign banks’ subsidiaries
17 as foreign banks are their main
15
The calculation of financial system assets includes the intermediaries shown in table 4 excluding Infonavit and the Fovissste.
16 Banks and non-bank banks belonging to the same shareholder group can organize themselves as a financial group (a corporation holds the shares of the group’s different subsidiaries). The purpose of this is to ensure greater coordination of strategic decisions and resource allocation among the different businesses in order to better reward shareholders. Financial groups are governed by Law Regulating Financial Groups. Controlling companies usually own at least 51 percent of each of the companies comprising the financial group. These companies cannot take out debt unless authorized to do so by Banco de México, their only function being to control stock.
17 The financial group controlling company is supervised by the commission which regulates the group’s main financial entity. However, there is no consolidated supervision of financial groups as an economic whole. Mexico has not enabled foreign banks to operate as branches. The bank branch is an extension of the same legal entity, whereas a subsidiary is an independent legal entity. This difference is very important in terms of the protection a foreign entity’s banking subsidiary’s depositors’ and creditors’ rights in the event of bankruptcy. Legislation in some countries establishes different payment priority for

F I N A N C I A L S Y S T E M R E P O R T
31
shareholders (table 5).18
In recent years, the entry of new banks into the market and the modification of the share ownership stakes of others has somewhat reduced the relative importance of foreign subsidiary banks, which have gone from controlling 79.2 percent of total banking system assets in 2005 to 74.3 percent in June 2010 (tables 5 and 6). As of June 2010, 3.0 percent of bank assets belonged to banks which are controlled by non-financial companies either directly or through a financial group (table 5).
19
In July 2006, diverse financial and mercantile laws were amended to create a new financial entity called Sofome (multi-purpose non-bank bank).
20 As
of 2007, financial groups began to create subsidiaries under the regulated sofome concept and some retail banks spun off their credit card units to create subsidiaries under the aforementioned concept. Several such sofomes are bank subsidiaries while others depend directly on the financial group’s parent company. Likewise, some credit card sofomes have sprung up out of ventures between banks and third parties. This corporate arrangement enables the banks in question to record the financial statements of the credit card business using a different vehicle which is subject to a different tax treatment regarding reserve creation.
21 Below we present an analysis of the main financial intermediaries with
a special focus on commercial banks, as they are the main financial system participants both in terms of the amount of assets and the role they play in granting credit and in payments systems.
creditors of subsidiaries established in the country where the parent company is located and creditors of branches located abroad.
18 A Mexican bank that is a subsidiary of a foreign bank is not characterized by the nationality of its shareholders but by the fact that its controlling shareholder is a bank that is regulated and supervised by the financial authorities of the foreign country where it is established. Shareholders of the foreign bank may have a nationality other than Mexican.
19 In 2001 the Law on Credit Institutions was amended to eliminate restrictions on stock held by individuals and corporations. The Law then stated that no individual or Corporation may acquire, either directly or indirectly, a more than five percent controlling stake in the capital stock of a commercial bank. The Law also provided that the Ministry of Finance and Public Credit (SHCP) could authorize a larger stake as long as it did not exceed 20 percent. The amendment paved the way for companies or commercial groups, including those associated with retail chains to individually control a bank. In order to limit possible conflicts of interest arising out of the association of a bank with a retail company, in 2008 Congress approved amendments to the Law on Credit Institutions in order to regulate the relationship between bank and company in areas such as internal control, operating and physical independence and transfer prices, among others.
20 The decree published in the Official Federal Gazette on July 18th 2006 also reformed regulations related to financial leasing companies and factoring companies in order to standardize the tax and procedural advantages which the Income Tax Law (ISR) and the Value Added Tax Law (VAT) grant sofoles and other financial entities.
21 For tax purposes banks can deduct provisions equivalent to up to 2.5 percent of the loan portfolio in accordance with Article 53 of the ISR; this tax benefit applies only to banks. Sofomes are not subject to this limit, although according to Article 29 paragraph IV of ISRL, sofomes can only deduct uncollectable loans.

B A N C O D E M É X I C O
32
Table 5 Corporate Structure
Number of
banksMarket share
1/ Number of
banksMarket share
1/
Banks affiliated to a foreign financial entity 16 79.2 17 74.3
belonging to a financial group (FG)2/ 11 78.5 11 73.0
not belongoing to a financial group FG3/ 5 0.7 6 1.3
Banks controlled by non financial entities 2 1.6 9 3.0
belonging to a FG4/ 1 0.2 4 1.4
not belonging to a financial group FG5/ 1 1.4 5 1.6
Other banks 11 19.2 15 22.7
belonging to a FG6/ 7 16.7 10 20.5
not belonging to a FG7/ 4 2.5 5 2.2
2005 2010
Figures as of June, 2010. Source: CNBV and Banco de México. 1/ Measured as a percentage of commercial banks’ total assets. 2/ BBVA Bancomer, Banamex, Santander, HSBC, Scotiabank Inverlat, ING Bank, JP Morgan, Credit Suisse, Bank of America, GE Money (becomes a Sofom
NRE in 2009), BBVA Bancomer Servicios (merged with BBVA Bancomer in 2009), Barclays Bank (authorized in 2007), and UBS Bank (authorized in 2006). 3/ American Express Bank, Deutsche Bank, Tokyo-Mitsubishi UFJ, The Royal Bank of Scotland (previously ABN AMRO), Volkswagen Bank, Bank of New
York Mellon and Comerica (in 2007 GF Monex buys Banco Comerica in Mexico). 4/ Bancoppel, Multiva, Invex and Monex. 5/ Banco Autofin, Azteca, Ahorro Famsa, Walmart Adelante and Fácil. 6/ Banorte, Inbursa, Afirme, Banregio, Regional, Mifel, Ixe, Interacciones, Ve por Más and Prudential (bought by Actinver in 2009). 7/ Banco del Bajío, Bansi, Compartamos, CI Banco and Banco Amigo.
Table 6 Foreign Investors’ Equity Share of Financial Groups and
Banks established in Mexico
Foreign investors' share
Percentage of equity Number of banks Market share2/
Above 991/
17 74.3
Between 51 and 99 1 0.0
Between 10 nd 50 3 7.1
Below 10 20 18.6
2010
Figures as of June, 2010. Source: CNBV and Banco de México. 1/ In order to establish a corporation, Article 89 of the General Business Corporation Law (Ley General de
Sociedades Mercantiles) requires a minimum of two partners who must subscribe at least one share each.
2/ Given as a percentage of commercial banks’ total assets. Not all financial groups and banks controlled by foreign investors are incorporated as subsidiaries.
Most of this section is given over to an analysis of the current state of commercial banks. On the one hand banks’ solvency and revenue generation capacity are examined in order to determine their capacity to absorb losses. On the other, the size of potential losses from the credit, market and liquidity risks assumed by banks is examined. Finally, we present a methodology for studying the potential impact of macro shocks and exercises for analyzing the contagion effect. The rest of the section takes a brief look at other financial intermediaries.

F I N A N C I A L S Y S T E M R E P O R T
33
4.1. Commercial banks
As of June 2010 commercial bank assets amounted to 5.1 trillion pesos equivalent to 50.4 percent of the financial sector’s total assets.
22 As of that date
41 commercial banks had been authorized to do business. The seven largest banks managed 83.6 percent of total banking system assets,
23 the 17 medium-
sized and small banks 24
9.3 percent and the five banks associated with commercial chains (BACC) 1.7 percent.
25 Finally, the assets of the 12 small
subsidiaries of foreign banks 26
accounted for 5.4 of the total.
Profitability
Despite a very unfavorable economic environment in 2009 commercial banks’ profits for that year rose 7.5 percent, mainly on the back of higher trading revenues and security position appreciation. That effect more than offset lower interest income and fee revenue (graph 15). The reduction in interest income was due in particular to less credit granted to the non-financial private sector (graph 15a) owing to both softer demand from households and companies and the use of more stringent credit policies by banks (box 3 and graph 16). Consumer credit, credit cards in particular, which are of great relevance to interest income, was impacted the most by the reduction in private sector financing.
27 Lower interest
rates28
during the first half of 2009 had only a modest impact on interest income, as it was not accompanied by a similar reduction in active interest rates. The cost of funding also decreased during the same period. Meanwhile higher trading income was the result of strategies used by some banks to hedge lower revenues stemming from lower interest income. Interest rate debt securities and derivatives were the main components of trading income.
During the first half of 2010 commercial bank revenues were a real 11 percent above those of the year-ago period due to lower reserve creation; however, as a percentage of assets interest income decreased by a real 1.6 percent. At the same time there was a bigger reduction in fee income than for the same 2009 period. Finally, trading income (graph 15b) also decreased compared to 2009 due to interest rate stability and fewer derivative transactions.
22
Commercial banks’ assets decreased during the final quarter of 2009 and the first quarter of 2010 due to a reduction in derivative transactions.
23 The seven largest banks are: BBVA Bancomer, Banamex, Santander, Banorte, HSBC, Inbursa and Scotiabank Inverlat. This edition of the Financial System Report includes Banco Inbursa in the group of the seven largest banks due to the size of its total assets. The figures include information on regulated sofomes that are bank subsidiaries. As of December 2009, Inbursa spun off its credit card portfolio by transferring it to its sofom, Sociedad Financiera Inbursa, S.A. de C.V., sofom, E.R., which is a subsidiary of Grupo Financiero Inbursa’s parent company.
24 The 17 medium-sized and small banks are: Banco Autofin, Banco del Bajío, Ixe, Interacciones, Afirme, Banregio, Mifel, Invex, Bansi, Multiva, Ve Por Más, Monex, Compartamos, Regional, CI Banco, Prudential (Actinver) and Amigo.
25 Banks associated with retail chains (BACC) are: Azteca, Ahorro Famsa, Bancoppel, Walmart Adelante y Fácil.
26 Banks classified as small subsidiaries are: ING Bank, JP Morgan, Credit Suisse, Bank of America, American Express Bank, Deutsche Bank, Barclays Bank, Bank of Tokyo-Mitsubishi UFJ, The Royal Bank of Scotland, UBS Bank, Volkswagen Bank and Bank of New York Mellon.
27 For example, in 2009 revenue generated by consumer credit contributed 52 percent of banks’ interest income from granting credit to the private sector. This was the case despite it accounted for only 22.5 percent of private sector credit.
28 The 28d TIIE, which is used as a reference rate for many loans, decreased by 3.8 percentage points between December 2008 and December 2009.

B A N C O D E M É X I C O
34
Graph 15 Commercial banks’ revenue sources
a) Interest income b) Trading income 1/ c) Net fees
2/
Percentage of assets Percentage of assets Percentage of assets
2.5
3.0
3.5
4.0
4.5
5.0
5.5
6.0
M2007
J S D M2008
J S D M2009
J S D M2010
J S
7 largest
Medium and small
Smallest
-1.5
-1.0
-0.5
0.0
0.5
1.0
1.5
2.0
M2007
J S D M2008
J S D M2009
J S D M2010
J S
7 largest
Medium and small
Smallest
0.0
0.5
1.0
1.5
2.0
2.5
M2007
J S D M2008
J S D M2009
J S D M2010
J S
7 largest
Medium and small
Smallest
Figures as of September, 2010. Source: CNBV.
Figures as of September, 2010. Source: CNBV.
Figures as of September, 2010. Source: CNBV.
1/ Trading income consists of profit and loss from the purchase and sale of securities, currencies, metals and derivatives as well as the revaluation of positions in such instruments.
2/ Net fees is equal to fees charged less fees paid.
The net profit of commercial banks as a percentage of equity averaged 12.8 percent during the first half of 2010 (12.7 percent in 2009). Banks’ profitability has not been heterogeneous. Graph 17 shows net profit as a percentage of equity for different bank groups. The economic slowdown had a relatively bigger impact on banks with loan portfolios that were more concentrated in the hardest hit sectors and therefore experienced a bigger contraction, such as consumer credit (graph16).
Graph 16 Commercial bank credit to the non-financial private sector
a) Retail credit b) Consumer credit c) Mortgage loans
Real YoY percentage change Real YoY percentage change Real YoY percentage change
-10
-5
0
5
10
15
20
25
30
35
40
M2007
J S D M2008
J S D M2009
J S D M2010
J S
7 largest
Medium and small
-50
-30
-10
10
30
50
M2007
J S D M2008
J S D M2009
J S D M2010
J S
7 largest
Medium and small
Smallest
BACC
-20
0
20
40
60
80
100
120
M2007
J S D M2008
J S D M2009
J S D M2010
J S
7 largest
Medium and small
Figures as of September, 2010. Source: CNBV.
Figures as of September, 2010. Source: CNBV.
Figures as of September, 2010. Source: CNBV.

F I N A N C I A L S Y S T E M R E P O R T
35
Graph 17 Return on Equity (ROE)
1/
a) ROE of the seven largest banks b) ROE of medium-sized and small banks
c) ROE of small subsidiaries
Percentage of equity Percentage of equity Percentage of equity
0
5
10
15
20
25
30
2007 2008 2009 2010
Maximum
Average
Minimum
Mean
-20
-10
0
10
20
30
40
2007 2008 2009 2010
Percentile 75Percentile 90
Average
Percentile 10
MeanPercentile 25
-20
-10
0
10
20
30
40
50
2007 2008 2009 2010
40
30
20
10
0
-10
-20
-30
Percentile 75
Percentile 90
Average
Percentile 10
MeanPercentile 25
Figures as of June, 2010. Source: CNBV.
Figures as of June, 2010. Source: CNBV.
Figures as of June, 2010. Source: CNBV.
1/ Last-12-month accumulated net profit as a percentage of last-12 month average equity.

B A N C O D E M É X I C O
36
Box 3
Relationship between the credit cycle and the economic cycle
The expansion and contraction of access to credit is known as the credit cycle. Specialized literature points to various factors that contribute to this cycle. One of them, and perhaps the most significant, is the economic cycle itself, since periods of contraction and expansion in economic activity are directly reflected in lending dynamics. However, other factors also play an important role. For example, when economic prospects improve, some banks are more inclined to use less meticulous credit evaluation processes in order to quickly increase lending and take advantage of the boom. They may also react to a market in which price competition is limited. These factors are considered endogenous, and may exacerbate cyclical fluctuations in credit.
Because the economic cycle plays a central role in the formation of the credit cycle, it is highly useful to verify empirically whether credit is a leading or lagging indicator of production, and if possible, to determine some type of causality.
1 The graph below compares an indicator of the
growth in bank lending against oscillations in production. 2 The
grey bands indicate dramatic declines, and the green bands substantial increases (deviations of more than five percent a year). Note that although in general terms, credit develops in the same way as production, the changes do not always occur at the same time.
Credit growth indicator Percent
-30
-20
-10
0
10
20
30
1980 1985 1990 1995 2000 2005
Retail loan portfolio cyclicalcomponent
Figures as of 2010. Source: Banco de México
The results of the empirical analysis presented below come from an ongoing research project based on the model proposed by Cara Lown and Donald Morgan.
3 The variables
included in the exercise are: percentage real change in GDP, percentage real change in commercial credit, inflation, percentage change in real exchange rate, and percentage change in Cetes rates. Also, as in the cited paper, we used a credit tightening index and broke it down into supply and demand factors.
For this exercise, we reviewed three different specifications: in the first, we included the variables described above with quarterly information from the last quarter of 1980 until the last quarter of 2009. We then used these same variables, but starting the series in the first quarter of 1998, in order to compare the results with those of the third specification, in which we complemented the information with the credit tightening index, data for which is available starting in the first quarter of 1998. We also considered dichotomous variables to
indicate the quarters of the year in order to capture possible seasonal effects and differentiate four periods. The periods of analysis are the 1980s, the credit expansion between the privatization of Mexican banks and the 1995 crisis, the period between that crisis and the early years of this decade, and the credit expansion of recent years.
4
The results obtained are qualitatively similar to those obtained by Lown and Morgan for the United States: the causal relationship goes from output to credit, and not vice versa. However, the results obtained through the first two specifications came out significantly lower. When we included the tightening index, the estimation became more precise and the impact of output on credit was more evident. We could also see that credit has a minimal impact on production, and in the medium term, the relationship even becomes negative.
The results suggest that contrary to what one might expect, in recent history, bank lending has not made a significant contribution to production growth. They also suggest that the impact of production on lending has in fact been greater. Although these results do not confirm a deterministic relationship, they do illustrate the modest role played by bank lending in driving the growth of the Mexican economy in recent years.
They also make it clear that if this analysis is limited to merely aggregate variables, the explanatory power of the model is much weaker. This is relevant because it is likely that other relevant factors are being excluded. When we include the tightening index in the exercise,
5 the estimation improves
considerably, so it is even more important that we find an alternative focus for analyzing the problem.
Perhaps there are structural factors that make the mechanism of bank lending ineffective in driving growth.
6 To the extent
that these factors are not taken into account, it is possible that even a brisk expansion of credit may have only a weak effect on growth. It will therefore be necessary to conduct more detailed studies to identify the factors that have limited the role of bank lending as a driver of economic growth. 1 Causality according to Granger, which is equivalent to saying that if
there is no causality from credit to output, "credit is not linearly informative regarding future realization of product," according to James D. Hamilton: Time Series Analysis, 1994, p. 303. 2 The credit growth indicator is defined as the relative deviation of the
level of credit from its trend. The trend has been calculated using a Hodrick-Prescott filter. 3 Cara Lown and Donald P. Morgan: “The Credit Cycle and the
Business Cycle: New Findings Using the Loan Officer Opinion Survey”, Journal of Money, Credit and Banking, 38-6(2006). 4 In contrast to Lown and Morgan, this analysis used the differences in
logarithms to eliminate trends in data and prevent spurious correlations. 5 Although the tightening index is strictly an aggregate indicator,
because it is a summary of variables that reflect the specific qualities of each credit applicant, its inclusion in the estimation reflects in a stylized manner the effect of using more detailed information. 6 For example, the modest share of bank lending in total credit, a weak
institutional framework, and difficulty exercising guarantees, among others.

F I N A N C I A L S Y S T E M R E P O R T
37
Solvency
As of June 2010 commercial banks’ capital adequacy ratio was 17.6 percent. As shown in graph 18 and table 7, solvency indicators are high in the case of all bank groups based on different measurement parameters. Commercial banks’ total regulatory capital is mostly made up of tier one capital (graph 18b). Since 2001 Mexico’s capitalization rules include a large number of changes proposed by the Basel Committee on Banking Supervision (BCBS) which arose out of the current crisis. Such is the case, for example, of the Committee’s proposal to deduct from regulatory capital assets headings for which value is difficult to realize, and which may not therefore be able to absorb losses.
Graph 18 Solvency measures
a) Capital adequacy ratio 1/
b) Tier 1 and tier 2 capital 2/ c) Asset to equity ratio
Percentage Percentage of risk-weighted assets Number of times
12
14
16
18
20
22
24
26
M2007
J S D M2008
J S D M2009
J S D M2010
J S
7 largestMedium and smallSmallestBACC
0
5
10
15
20
25
7 largest Medium andsmall
Smallest BACC
Tier 1 Tier 2
8
9
10
11
12
13
14
M2007
J S D M2008
J S D M2009
J S D M2010
J S
7 largestMedium and smallSmallestBACC
Figures as of September, 2010. Source: CNBV and Banco de México.
Figures as of September, 2010. Source: CNBV and Banco de México.
Figures as of September, 2010. Source: CNBV and Banco de México.
1/ The capital adequacy ratio is calculated by dividing net capital by risk-weighted assets. According to capitalization rules, the quotient of this division must be at least 8 percent. Net capital is regulatory capital which comprises Tier 1 and Tier 2 capital. To calculate the capital adequacy ratio the sum of the net capital of the group is divided by the sum of the group’s risk-weighted assets.
2/ During 2008 and 2009, several banks issued subordinated debt which is part of Tier 1 and Tier 2 capital.
In Mexico current capital adequacy rules establish that banks must deduct the following concepts from regulatory capital: intangible items, equity investments in financial companies, some equity investments in non-financial companies, investments in subordinated securities, reserves pending creation and deferred taxes exceeding 10 percent of tier 1 capital. Mexican regulations also require that capital charges for market risk be made in the case of both the trading book and the banking book.
29
29
The banking book records assets or liabilities at their historical cost while the trading book records assets and liabilities at their daily market value. Market value refers to the calculation of the present value of the asset or liability in question.

B A N C O D E M É X I C O
38
Table 7 Commercial bank assets, capital and leverage
Assets/
Equity
RWA /
Equity
Percent Percent Percent Times Times
System 5,101.5 17.6 15.3 13.8 9.3 5.9
Large 4,266.4 17.4 15.1 13.5 9.0 5.9
BBVA Bancomer 1,120.2 15.6 11.5 9.3 11.4 9.0
Banamex 1,091.2 20.1 19.5 17.8 7.6 4.2
Santander 639.2 17.7 17.5 16.3 8.1 5.1
Banorte 566.0 16.7 12.0 9.9 13.7 7.3
HSBC 426.9 16.6 12.9 11.6 10.6 6.9
Inbursa 228.9 19.3 19.1 19.0 5.2 4.5
Scotiabank Inverlat 194.0 17.2 16.9 16.8 7.4 5.4
Medium and small 473.7 17.9 15.6 15.2 12.3 6.0
Interacciones 77.4 15.1 10.8 10.8 21.4 9.2
Del Bajío 76.9 16.5 15.9 15.9 7.8 5.5
IXE 72.8 15.7 12.0 10.4 16.8 7.4
Banregio 41.8 13.3 9.4 9.4 18.2 9.3
Afirme 40.8 16.1 14.1 14.1 16.5 6.5
Mifel 36.7 15.1 7.5 6.5 32.1 12.7
Invex 29.5 16.8 16.5 14.9 14.3 6.0
Monex 21.1 23.2 23.0 23.0 12.8 4.2
Multiva 18.6 16.0 15.7 14.0 11.7 5.8
Bansí 16.4 20.0 19.7 19.7 15.1 5.0
Ve por Más 13.8 14.0 13.4 12.9 13.6 7.2
Compartamos 10.0 42.6 42.3 42.1 2.2 2.4
CI Banco 7.7 35.1 35.0 35.0 11.2 2.7
Actinver 3.9 100.3 100.2 100.2 4.6 1.5
Regional 3.5 20.5 20.3 20.3 6.8 4.9
Autofín 2.0 18.3 18.3 18.1 4.3 5.3
Amigo 0.8 55.4 55.4 48.9 1.9 1.5
Other banking subsidiaries 273.6 20.8 20.4 19.3 10.2 4.7
ING Bank 104.8 13.5 13.5 12.0 13.8 8.3
Bank of America 48.3 41.3 41.2 40.9 13.2 2.4
Deutsche Bank 39.6 34.9 34.9 34.9 18.0 2.9
JP Morgan 22.6 26.6 26.5 26.5 5.1 3.6
Barclays Bank 16.0 17.9 17.9 17.6 7.9 5.6
American Express 15.8 19.2 15.3 10.6 5.8 3.8
Credit Suisse 11.4 24.5 24.5 24.1 9.5 4.1
Tokyo-Mitsubishi UFJ 4.8 32.2 31.9 31.4 6.5 3.1
Royal Bank of Scotland 4.4 40.1 39.9 39.9 5.8 2.5
UBS Bank 3.1 277.3 277.3 277.3 8.4 0.4
Volkswagen 1.9 18.5 18.3 17.8 4.0 5.2
New York Mellon 0.7 192.6 192.6 192.6 1.1 0.3
Ventures with retail chains 87.7 15.1 14.1 11.7 10.5 6.2
Azteca 67.0 14.5 13.1 10.1 14.5 7.6
Ahorro Famsa 10.7 13.6 13.3 13.3 6.4 7.1
Bancoppel 7.8 13.2 13.2 11.1 9.2 4.8
Wal-Mart 1.9 197.2 196.8 153.0 1.9 0.2
Fácil 0.3 47.6 47.6 46.4 1.8 1.6
Leverage
BankAssets
Billions of pesos
Net equity
index1/ Tier 1 index
2/
Tangible
capital
index3/
Figures as of June, 2010. Source: CNBV and Banco de México. 1/ The capital adecuacy ratio is equal to total regulatory capital divided by risk-weighted assets (RWA). 2/ The Tier 1 index is equal to Tier 1 capital divided by RWA. 3/The tangible capital index is equal to Tier 1 capital less admissible subordinated debt such as Tier 1 capital less adminissible
deferred assets such as Tier 1 capital all divided by RWA. RWA: Risk-weighted assets

F I N A N C I A L S Y S T E M R E P O R T
39
As of the second half of 2009 bank loan-loss reserves were created at a slower pace, as the loan portfolio stopped deteriorating, banks became fully compliant with provision regulations and also cleaned up past due loan portfolios, mainly through haircuts and write-offs. Thus during the first half of 2010 loan-loss reserves were very stable on balance (graph 19a). This is partly due to the fact that regulations restrict banks’ creation of such provisions, as they must be based on a CNBV authorized model or else on CNBV portfolio grading rules.
30 31
Graph 19 Commercial bank loan-loss reserves and loan-loss coverage ratio
a) Loan-loss reserves 1/ b) Coverage ratio by bank type
2/ c) Coverage ratio by portfolio
type2/
Billions of pesos Percentage Percentage
0
20
40
60
80
100
120
M2007
J S D M2008
J S D M2009
J S D M2010
J S
BACC
Smallest
Medium and small
7 largest
0
50
100
150
200
250
300
M2007
J S D M2008
J S D M2009
J S D M2010
J S
7 largest
Medium and small
Smallest
BACC
0
50
100
150
200
250
300
350
400
M2007
J S D M2008
J S D M2009
J S D M2010
J S
Retail
Consumer
Mortgage
Figures as of September, 2010. Source: CNBV.
Figures as of September, 2010. Source: CNBV.
Figures as of September, 2010. Source: CNBV.
1/ Refers to the balance of loan-loss reserves in relation to general credit risks not including additional ones. 2/ Loan-loss reserves as a percentage of the past due loan portfolio.
The consumer credit coverage ratio increased as of August 2009 following changes to revolving loan portfolio rules stipulating that provisions be calculated on the basis of expected losses. Thus the new rules make them more sensitive to the loan portfolio profile. As of March 2011, non-revolving consumer loan and mortgage loan portfolio provisions will be calculated in accordance with expected losses. This will also eventually be the case for retail loan portfolio provisions (graphs 19b and c).
30
The CNBV’s Circular on Bank Regulations (CUB) establishes criteria for making precautionary estimates of credit risks. When provisions exceed the regulations (and surpass the authorized amount) they must be cancelled the following quarter.
31 The Income Tax Law allows banks to deduct loan-loss provisions for up to the equivalent of 2.5 percent of the annual average loan portfolio balance, and in some cases encourages the creation of excess provisions in order to reduce the tax base.

B A N C O D E M É X I C O
40
Credit Risk32
Different methodologies are used to estimate loan portfolio risk. In this Report we use:
- Value at Risk (VaR),33
34
- Conditional Value at Risk (CVaR)35
and
- The Conditional Value at Risk for the loss distribution conditioned on the loan portfolio losses of one or more banks exceeding their Value at Risk (CoVaR).
36
The default probabilities of retail and consumer loan portfolio continued to increase during the first half of 2010, while for the mortgage loan portfolio default probabilities reversed its rising trend (graph 20a). A pick-up in economic activity and more stringent borrowing criteria have not yet been reflected in the behavior of borrowers as a whole. Credit VaR increased 15.4 percent in June 2010 compared with the previous 12 months’ level owing to greater risk factors. However, measured as a percentage of regulatory capital it rose by only 4.0 percent (graph 20b). Retail credit contributes to bank credit risk relatively more than its share of the total loan portfolio (graph 20c).
37
32
Credit risk refers to the possibility of the value of an asset decreasing owing to unexpected changes in the probability of related payment obligations being honored (counterparty credit quality). The analyses presented in this section refer to credit risk derived from total default on a loan portfolio’s payment obligations. Several factors explain a loan portfolio’s risk level: the portfolio’s size, the likelihood of debtors defaulting, the correlation between defaults of different debtors and the portfolio’s concentration in a single counterparty or counterparties exposed to common risks. The higher the likelihood of default, the higher the projected losses and portfolio risk. Likewise, the greater the correlation between defaults, the greater the probability of several borrowers defaulting at the same time. Finally, the greater the portfolio concentration, the higher the losses in the event of default.
33 VaR is the percentile corresponding to a determined confidence level from a probability loss distribution of a portfolio of assets subject to credit risk. However, this measure does not provide information on the expected level of losses when they exceed VaR.
34 The calculation of credit VaR is based on the Credit Risk and Capital model (CyRCE). The main elements of the CyRCE model are the default probability of each loan, the variance and covariance structure of potential defaults and the structure and level of portfolio loan concentration. An explanation of the CyRCE model can be found in: Banco de México (2007), Financial System Report 2006 and Márquez Diez-Canedo, J. (2006), Una nueva visión del riesgo de crédito, Limusa.
35 Conditional value at risk (CVaR) permits an analysis of distribution tail losses, as it represents the expected value of the loss when it exceeds vaR.
36 The conditional value at risk (CVaR) and the value at risk of a loss distribution dependent on other losses (CoVaR) are different concepts, as there is a conceptual difference between these measures. CVaR represents the expected value of the loss when it has surpassed VaR while CoVaR represents the VaR of a portfolio when another portfolio presents a loss greater than or equal to its VaR and therefore concerns a percentile. Thus while CVaR is a risk measure dependent on a loss materializing in the same portfolio, CoVaR is a risk gauge that depends on another portfolio’s loss.
37 This is the result of the loan portfolio’s concentration in far fewer borrowers (around 300,000 clients compared with the consumer loan portfolio’s 32 million and the mortgage loan portfolio’s 700,000).

F I N A N C I A L S Y S T E M R E P O R T
41
Consumer credit
As of June 2010, commercial banks had a performing loan portfolio consisting of more than 37 million consumer loans
38 granted to more than 32
million borrowers.39
Such borrowers comprise more than 95 percent of bank debtors and their portfolio corresponds to 23 percent of the non-financial private sector loan portfolio. As of the first half of 2010 the bank consumer loan balance had decreased by 21 percent in nominal terms compared with the June 2008 level. The slowdown in consumer credit began before the first effects of the international financial crisis took hold in Mexico (graph 21).
Graph 20 Credit risk measures
a) Probability of default 1/ b) Credit VaR at 99.9 percent
confidence level c) Contribution to total credit VaR
by portfolio type
Percentage Percentage of net capital Percentage
0
2
4
6
8
10
12
14
J2007
A J O J2008
A J O J2009
A J O J2010
A J
Retail
Consumer
Mortgage
0
5
10
15
20
25
30
35
M2007
J S D M2008
J S D M2009
J S D M2010
J A
7 largest
Medium and small
Smallest
BACC
0
10
20
30
40
50
60
70
80
90
100
Share in portfolio Contribution to VaR
Retail Consumer Mortgage
Figures as of August, 2010. Source: Banco de México.
Figures as of August, 2010. Source: Banco de México.
Figures as of June, 2010. Source: Banco de México.
1/ The probability of default was calculated using the method of moments. In the case of consumer loans a sample of loans from the credit bureau was used substituting the regulatory report that does not provide the required degree of granularity as the source. Estimates for retail and mortgage loan portfolios do not include the effect of the severity of the loss and therefore assign a greater weight to portfolio segments with more loans but not necessarily the biggest exposure.
The deterioration in the consumer loan portfolio derived mainly from the relaxation of bank credit granting policies as of 2005,
40 intensified with the
economic slowdown brought on by the international financial crisis. However, since November 2009, there has been a noticeable improvement in the behavior of consumer loans, due both to measures adopted by banks since the middle of 2008 as well as a pick-up in economic growth (graph 22).
38
According to two credit bureaus, Buró de Crédito and Círculo de Crédito. 39
32 million refers to the number of active consumer loan files in both credit bureaus (Buró de Crédito and Círculo de Crédito). There may be duplications as the prevailing information exchange agreement is restricted to only negative information. There are at least 1.6 million persons registered in both bureaus with negative information in at least one of them.
40 The consumer credit expansion that began in 2005 was characterized among other things by individuals being granted several credit cards, bigger credit lines and the use of third parties to identify potential clients. Some banks also implemented programs for granting cards to people with higher risk profiles (i.e. with no credit histories, lower income or no fixed income). Fast growth in credit through credit cards resulted in excessive indebtedness. The deterioration in the situation of borrowers was reflected in a more intensive use of credit lines and a considerable increase in the percentage of cards with payments in arrears.

B A N C O D E M É X I C O
42
Graph 21 Commercial bank consumer credit
a) Performing loan portfolio by bank size
b) Performing loan portfolio by type of credit
c) Performing loan portfolio by type of credit
Billions of pesos Billions of pesos Real YoY percentage change
0
50
100
150
200
250
300
350
400
450
500
J2007
A J O J2008
A J O J2009
A J O J2010
A J
BACCSmallestMedium and small7 largest
0
50
100
150
200
250
300
350
400
450
500
J2007
A J O J2008
A J O J2009
A J O J2010
A J
Other Personal ABCD Credit cards
-100
-80
-60
-40
-20
0
20
40
60
80
M2007
J S D M2008
J S D M2009
J S D M2010
J S
Credit cards
ABCD
Personal
Others
Figures as of September, 2010. Source: CNBV.
Figures as of September, 2010. Source: CNBV.
Figures as of September, 2010. Source: CNBV.
Graph 22 Consumer credit risk indicators
a) Delinquency index b) Adjusted delinquency index1/ c) Probability of default
2/
Percentage Percentage Percentage
0
2
4
6
8
10
M2007
J S D M2008
J S D M2009
J S D M2010
J S
0
5
10
15
20
25
M2007
J S D M2008
J S D M2009
J S D M2010
J S
0
2
4
6
8
10
12
14
E2007
A J O E2008
A J O E2009
A J O E2010
A J
Figures as of September, 2010. Source: CNBV.
Figures as of September, 2010. Source: CNBV and Banco de México.
Figures as of August, 2010. Source: Banco de México and Buró de Crédito.
1/ The adjusted delinquency index is the past due loan portfolio ratio plus write-offs over the previous twelve months divided by the total loan portfolio plus write-offs over the previous twelve months.
2/ Is the probability of the borrower defaulting on the loan payment within the next twelve months. It is obtained by dividing the loan portfolio of each bank into segments so that borrower groups have similar characteristics. A statistical analysis of defaults in each segment enables the probability of a performing loan in arrears for more than 3 months within a year to be determined. This estimate indicates the probability of loan default.
Thus, as of September 2010 this portfolio’s delinquency index was 4.8 percent comparing favorably with a 9.6 percent high in May 2009. Meanwhile the adjusted delinquency index recorded a level of 16.6 percent after hitting 24.5 percent in October 2009. The contraction in consumer credit was due in particular to measures banks took to tackle the deterioration in such credit. Besides the

F I N A N C I A L S Y S T E M R E P O R T
43
implementation of debt restructuring programs in order to address problem loans, banks adopted a series of measures that impacted the performing loan balance, including restrictions on the granting of bigger credit lines, card cancellation and the application of more stringent conditions for granting new credit cards.
41 Credit
for the acquisition of durable goods (ABCD) was the heading that experienced the biggest decrease after credit cards. As of June, 2010 92 percent of ABCD credit corresponded to car loans.
During the second half of 2009 and the first half of 2010, around 3.8 million credit card accounts were cancelled.
42 The number of active cards
(graph 23a) and cardholders (graph 23b) consequently decreased, such that the percentage of borrowers with three or more credit cards came down from 30.0 percent in 2007 to 23.5 percent in June 2007, and the average number of cards per person decreased from 2.5 to 2.0.
Clients who do not settle their total credit card balance every month, have been relatively more affected by reductions in the credit balance, credit line limits and the number of cards available to them (graph 24). A decrease in the number of clients who because of their greater risk profile pay interest rates of above 40.0 percent (table 8) was also observed along with an increase in the number of clients paying interest rates of below 20.0 percent.
43 As of the second
half of 2009, however, the number of cards issued per month began to increase again (graph 23c).
Table 8 Trend in the credit card balance, number of cards and limit
Settlers and non-settlers
BalanceNumber of
cardsCredit limit Balance
Number of
cards
Credit
limitBalance
Number of
cards
Credit
limit
Interest rateBillion
pesosMillions
Billion
pesosPercent Percent Percent Percent Percent Percent
Total 156.7 11.9 421.1 100 100 100 -11.9 -2.5 -4.2
0 - 20 percent 52.3 5.1 225.6 33 43 54 0.3 11.8 7.3
20 - 40 percent 61.7 3.2 113.6 39 27 27 -16.5 -11.4 -11.0
More than 40 percent 42.7 3.6 81.9 27 30 19 -17.8 -10.8 -19.4
Change
June 2010 / June 2009Amount Structure
Figures as of June, 2010. Source: Banco de México.
41
Banks stopped using third parties to identify potential clients. 42
As at June, 2010 there were 25.3 million credit card accounts in the Credit Bureau. Each account represents a credit line granted through a card.
43 The interest rate on a loan should reflect the client’s risk level (see box 4).

B A N C O D E M É X I C O
44
Graph 23
Bank credit card trend
a) Number of files containing at least one consumer loan and number of active credit cards
b) Percentage of files with one or more bank credit cards
c) Credit cards granted to people with and without credit
Left axis: millions of files Right axis: millions of cards
Percentage of total Left axis: percent Right axis: millions
23
24
25
26
27
28
29
30
11.0
11.2
11.4
11.6
11.8
12.0
12.2
12.4
12.6
12.8
13.0
2007 2008 2009 2010
Number of files
Number of active cards
20
30
40
50
60
70
80
90
100
2007 2008 2008 2009 2010
1 card 2 3 4 5 6 or more
0.0
0.5
1.0
1.5
2.0
2.5
3.0
3.5
4.0
0
10
20
30
40
50
60
70
80
90
100
J2007
D J2008
D J2009
D
No credit history
Credit history
Cards issued
Figures as of June, 2010. Source: Buró de Crédito.
Figures as of June, 2010. Source: Buró de Crédito.
Figures as of December, 2009. Source: Buró de Crédito.
Graph 24 Credit card market trend
a) Credit granted through credit cards by client type
b) Bank card credit lines by client type
c) Number of credit cards by client type
Billions of 2002 pesos Billions of 2002 pesos Millions of cards
0
20
40
60
80
100
120
J2009
A O D F2010
A J
Non Settlers Settlers
100
120
140
160
180
200
220
240
J2009
A O D F2010
A J
Non settlers Settlers
3
4
5
6
7
8
9
J2009
A O D F2010
A J
Non settlers Settlers
Figures as of June, 2010. Source: Banco de México.
Figures as of June, 2010. Source: Banco de México.
Figures as of June, 2010. Source: Banco de México.
Mortgage loans
The seven largest banks account for most of the mortgage loans granted by commercial banks (96.1 percent as of June, 2010). Despite the adverse economic environment the mortgage loan balance increased by 4.2 percent in real year-on-year terms during the first half of 2010 compared with the

F I N A N C I A L S Y S T E M R E P O R T
45
same year-ago period (graph 25a). Most of the credit granted by commercial banks to this sector is concentrated in mortgages.
44 This situation has become
more marked in recent years with mortgage credit going from 73.0 percent of total bank mortgage loans in 2007 to 87.8 percent in the first half of 2010 (graph 25b). The mortgage loan portfolio displays the lowest risk (graph 25c).
During 2009 there was a slight increase in mortgage portfolio delinquency. The most impacted banks were medium-sized and small ones, although their share of this market is small (graph 26a). The economic environment began to improve as of June 2009 and this was reflected in a change of trend in the probability of default on mortgage loans (graph 26c). A similar change occurred in the adjusted delinquency index as of the last quarter of 2009 (graph 26b).
Graph 25 Commercial bank mortgage loans
a) Performing mortgage portfolio by bank size
b) Performing mortgages by type of housing
c) Portfolio with payments in arrears
1/
Billions of pesos Percentage of mortgage loans Percentage of portfolio in arrears
150
170
190
210
230
250
270
290
310
330
350
J2007
A J O J2008
A J O J2009
A J O J2010
A J
BACC
Smallest
Medium and small
7 largest
0
10
20
30
40
50
60
70
80
90
100
2007 2008 2009 2010
Low income Middle income Residential
0
1
2
3
4
5
6
7
8
9
10
Low income Middle income Residential
Figures as of September, 2010. Source: CNBV.
Figures as of September, 2010. Source: CNBV and Banco de México.
Figures as of September, 2009. Source: CNBV and Banco de México.
1/ Loan portfolio with payments one or more months in arrears as a percentage of the portfolio for this type of housing.
44
Housing is considered residential when it is worth more than 600 thousand pesos, middle-income when it is worth between 300 and 600 thousand pesos and (low-income)l when it is worth less than 300 thousand pesos.

B A N C O D E M É X I C O
46
Graph 26 Mortgage loan risk indicators
a) Delinquency index b) Adjusted delinquency index 1/ c) Probability of default
2/
Percentage Percentage Percentage
0
2
4
6
8
10
12
M2007
J S D M2008
J S D M2009
J S D M2010
J S
7 largest
Medium and small
0
2
4
6
8
10
12
M2007
J S D M2008
J S D M2009
J S D M2010
J S
7 largest
Medium and small
0
1
2
3
4
5
6
M2007
J S D M2008
J S D M2009
J S D M2010
J A
7 largest
Medium and small
Figures as of September, 2010. Source: Banco de México.
Figures as of September, 2010. Source: Banco de México.
Figures as of August, 2010. Source: Banco de México.
1/ The adjusted delinquency index is the past due loan portfolio ratio plus write-offs over the previous twelve months divided by the total loan portfolio plus write-offs over the previous twelve months.
2/ Is the probability of the borrower defaulting on the loan payment within the next twelve months. It is obtained by dividing the loan portfolio of each bank into segments so that borrower groups have similar characteristics. A statistical analysis of defaults in each segment enables the probability of a performing loan in arrears for more than 3 months within a year to be determined. This estimate indicates the probability of loan default.

F I N A N C I A L S Y S T E M R E P O R T
47
Box 4
Credit card and mortgage borrowers
Banks extend various types of credit to individuals. In terms of balances, the largest groups are home mortgage borrowers and those who obtain credit through credit cards. There is a group of borrowers that have both credit cards and mortgages who differ in several respects from those with only credit cards.
One of the biggest problems a bank faces before granting a loan is determining the creditworthiness of the borrower. This is because it has less information than the applicants about their likelihood of defaulting on their obligations. This situation, which is known as asymmetrical information, gives rise to problems of adverse selection and moral hazard that may translate into suboptimal results in the operation of credit markets.
To determine the likelihood of default, the bank can carry out an analysis based on the characteristics of the borrower. After determining what type of borrower it will serve, the bank will decide on the size of the loan, the interest rate, collateral and type of credit it will extend, depending on his/her characteristics. For example, those with a higher credit grade, and which can offer collateral, will obtain credit under better conditions, because they represent a lower risk.
As a result, one of the most important functions of the credit bureau is to provide information to lenders about the applicants who are requesting credit. This information includes past loans, and outstanding balance and payment history, among others, of the borrowers. The availability of this information helps both the lender and the borrower; the former because it helps evaluate the profile of the applicant, and the latter because it gives them access to better products and financing terms.
Information from the credit bureau Buró de Crédito shows that in February 2010, 81.6 percent of bank borrowers that had taken out some kind of mortgage loan also had credit cards. In the past three years, this group of borrowers has shown less probability of default on their credit card payments than those who have no mortgage loan (see graph 1).
Graph 1 Likelihood of default on a credit
card
Percentage
0
5
10
15
20
E2007
A J O E2008
A J O E2009
A J O E2010
With mortgage loan
Without mortgageloan
Figures as of February, 2010. Source: Buró de Crédito.
Indicators like the delinqency ratio and utilization ratio1 also
show lower risk among borrowers holding both credit cards and mortgages (table 1). They also have a longer record with the Credit Bureau.
2
Table 1 Average credit card indicators
Average indicator Without
mortgage With
mortgage
Balance ($) 11,801 20,026
Credit limit ($) 28,331 51,177
Utilization ratio (%) 41.7 39.1
Delinquency rate (%) 19.3 10.2
Figures as of February, 2010. Source: Buró de Crédito.
Although the group of borrowers that have both types of credit pose a lower risk for lenders, the recent crisis eroded payment capacity. The percentage of individuals in this group that remained prompt in the payment of both types of credit dropped from 80.0 percent in January 2007 to 70.0 percent in December 2009, while the percentage of those that missed payments on both types of loans rose from 0.5 to 3.0 percent in the same period (see graph 2).
Graph 2
Payment timeliness for credit cards and mortgages
Percentage of cases
0
1
2
3
4
60
65
70
75
80
85
E2007
A J O E2008
A J O E2009
A J O
Both punctualBoth in arrearsBoth past due
Figures as of December, 2009. Source: Buró de Crédito.
In conclusion, having more information allows lenders to distinguish between different types of clients in order to assign them products consistent with their risk profile. Even if they do not have access to "hard" information, some variables can supply them with information on that profile. For example, holding a mortgage loan suggests a lower risk of default on credit card debt.
1 Credit card utilization ratio is defined as the ratio between the balance
owed and the credit limit. 2 94.1 percent of borrowers holding both types of credit were registered
in the Bureau before 2004. In contrast, only 65.8 of borrowers without mortgage loans were registered before that year.

B A N C O D E M É X I C O
48
Credit to non-financial private companies
Corporate financing represents the lion’s share of credit granted by banks to the non-financial private sector (57.0 percent as of June, 2010). 85.6 percent of performing bank loans to that sector was granted by the seven largest banks and 12.7 percent by middle-sized and small banks. In September 2009 bank loans to that sector began to recover (graph 27), although it was partly due to the transfer of foreign bank loan portfolios to their Mexican subsidiaries.
Graph 27 Commercial bank credit to non-financial private companies
a) Performing loans b) Performing loans by sectors c) Performing loans by company size
Billions of pesos Billions of pesos Billions of pesos
350
450
550
650
750
850
950
1,050
J2007
A J O J2008
A J O J2009
A J O J2010
A J
BACC
Smallest
Medium and small
7 largest
0
200
400
600
800
1,000
J2007
A J O J2008
A J O J2009
A J O J2010
A J
Agro/cattle RetailConstruction Comm and transIndustry ServicesUnclassified
0
100
200
300
400
500
600
700
800
900
1,000
J2007
A J O J2008
A J O J2009
A J O J2010
A J
Large Medium
Micro and small Unclassified
Figures as of September, 2010. Source: Banco de México.
Figures as of August, 2010. Source: Banco de México.
Figures as of August, 2010. Source: Banco de México.
As of September 2008 commercial loan delinquency indexes began to rise (graph 28a). The trend went into reverse in the final quarter of 2009 coinciding with a recovery in loans to that sector. Nevertheless, the write-off-adjusted delinquency index for medium-sized and small banks continued to rise during the first half of 2010 (graph 28b) which could be attributed to the fact that medium-sized and small banks grant loans to companies representing a higher risk, as reflected in a higher VaR as a percentage of credit granted (graph 28c).
Commercial loans granted by banks have been more dynamic than the rest of the portfolio. Thus, and although there was a strong increase in past due loans in 2009, it was matched by a similar increase in the recovery rate. As a result, the percentage of this portfolio banks write off against provisions (write-off rate)
45 is very low, 0.7 percent, in clear contrast with the consumer loan write-off
rate which reached levels of 18.0 percent in December 2009.
45
The recovery rate is the percentage of the average total portfolio represented by loan recoveries in the previous 12 months while the write-off rate is the percentage of the average total portfolio represented by write-offs in the previous 12 months.

F I N A N C I A L S Y S T E M R E P O R T
49
Graph 28 Commercial loan portfolio risk indicators
a) Delinquency index b) Adjusted delinquency index 1/ c) Commercial credit VaR at a 99.9
percent confidence level
Percentage Percentage Percentage of the portfolio
0.0
0.5
1.0
1.5
2.0
2.5
3.0
3.5
M2007
J S D M2008
J S D M2009
J S D M2010
J S
7 largest
Medium and small
0.0
0.5
1.0
1.5
2.0
2.5
3.0
3.5
4.0
4.5
M2007
J S D M2008
J S D M2009
J S D M2010
J S
7 largest
Medium and small
0
1
2
3
4
5
6
7
8
M2007
J S D M2008
J S D M2009
J S D M2010
J S
7 largest
Medium and small
Figures as of September, 2010. Source: CNBV.
Figures as of September, 2010. Source: CNBV.
Figures as of August, 2010. Source: Banco de México.
1/ The adjusted delinquency index is the past due loan portfolio ratio plus write-offs over the previous twelve months divided by the total loan portfolio plus write-offs over the previous twelve months.
In the first half of 2009, greater risk perception and the substitution of external financing for domestic credit led to an increase in the concentration of banks commercial loan portfolio among fewer companies. This was especially the case of the seven largest banks where most of the loans were already concentrated.
46 The recovery of the capital market has encouraged a decrease in
the concentration of commercial credit. Meanwhile, as of June 2010 credit granted to larger companies accounted for 62.0 percent of commercial loans while funds channeled to medium-sized and small companies accounted for 18.2 and 11.6 percent, respectively.
47 Credit to micro and small companies displays the highest
delinquency index (graph 29b). However, the default risk for such companies began to lessen as of the second half of 2009. This performance stands in contrast to that of large and medium-sized companies whose default risk indicators rose on the back of difficulties faced by large companies related to derivative transactions (graph 29c).
46
Greater concentration makes lenders more vulnerable to a deterioration in borrowers’ credit quality, as any loss would be potentially higher.
47 Classification by company size is defined by the number of employees depending on the sector the company belongs to. In the case of the industrial sector a company is considered micro when the number of employees is fewer than or equal to 10, small when there are between 11 and 50, medium-sized when there are between 51 and 250, and large when there are more than 250. In the case of the retail sector a company is considered micro when the number of employees is less than or equal to 10, small when the number is between 11 and 30, medium-sized when there are between 31 and 100, and large when there are over 100. In the case of the services sector a company is considered micro when there are 10 or less employees, small when there are between 11 and 50, medium-sized when there are between 51 and 100 and large when there are more than 100.

B A N C O D E M É X I C O
50
Graph 29 Commercial bank credit to non-financial private sector companies by company size
a) Loan portfolio concentration (IHH)
b) Delinquency index by company size
c) Probability of default by company size
Index per 10,000 Percentage Percentage
0
5
10
15
20
25
J2007
A J O J2008
A J O J2009
A J O J2010
A J
0
1
2
3
4
5
6
M2007
J S D M2008
J S D M2009
J S D M2010
J A
Large
Medium
Micro and small
0
2
4
6
8
10
12
J2007
A J O J2008
A J O J2009
A J O J2010
A J
Large
Medium
Micro and small
Figures as of August, 2010. Source: Banco de México.
Figures as of August, 2010. Source: Banco de México.
Figures as of August, 2010. Source: Banco de México.
Market risk48
A bank’s market risk is usually measured using the trading book which includes the financial assets the bank does not intend to keep until maturity.
49 The
indicator Value at Risk (VaR)50
was used to estimate Mexican banks’ market risk; the extreme value theory using historical scenarios was applied.
51
There was a strong increase in trading book market risk during the crisis, especially in the case of small subsidiaries (graph 30a). However, an analysis of the trading book by bank overestimates the real risk of intermediaries when the positions registered are used to cover banking book risks. In particular, during the crisis some banks took long positions in foreign currency (banking book) financed in pesos. Banks in this situation undertook currency future sales (trading book) in order to eliminate exchange rate risk and comply with Banco de México regulations. During the months subsequent to October, 2008, the market VaR of large, medium-sized and small banks began to decrease. In the case of small subsidiaries the reduction occurred as of July, 2009 (graph 30a). The fundamental origin of the decrease was trading book re-composition. Thus, as of
48
Market risk is the potential loss in the value of financial assets from adverse changes or movements in the financial variables which determine their price. The more relevant financial variables for valuing financial assets are: interest rates with varying terms, the Mexican Stock Exchange Index (IPC) and the peso/dollar exchange rate.
49 This view can be an incomplete when trading book positions are covering others in the banking book.
50 Market VaR is defined as the maximum loss to a bank stemming from a given position or investment portfolio, assuming no modification to it during the investment period, in the event of a change in risk factors over a defined investment horizon and with a given probability level.
51 The extreme value theory based on historical scenarios consists of valuing the asset and liability portfolio subject to market risk using a series of historical scenarios defined by daily variations in the value of the risk factors. A loss and gain probability distribution for a 28 day time horizon is obtained from the value of the portfolio in each historical scenario. These distributions are adjusted by a Generalized Pareto distribution as of percentile 94. The model is explained in box 28 of the July 2009 Financial System Report.
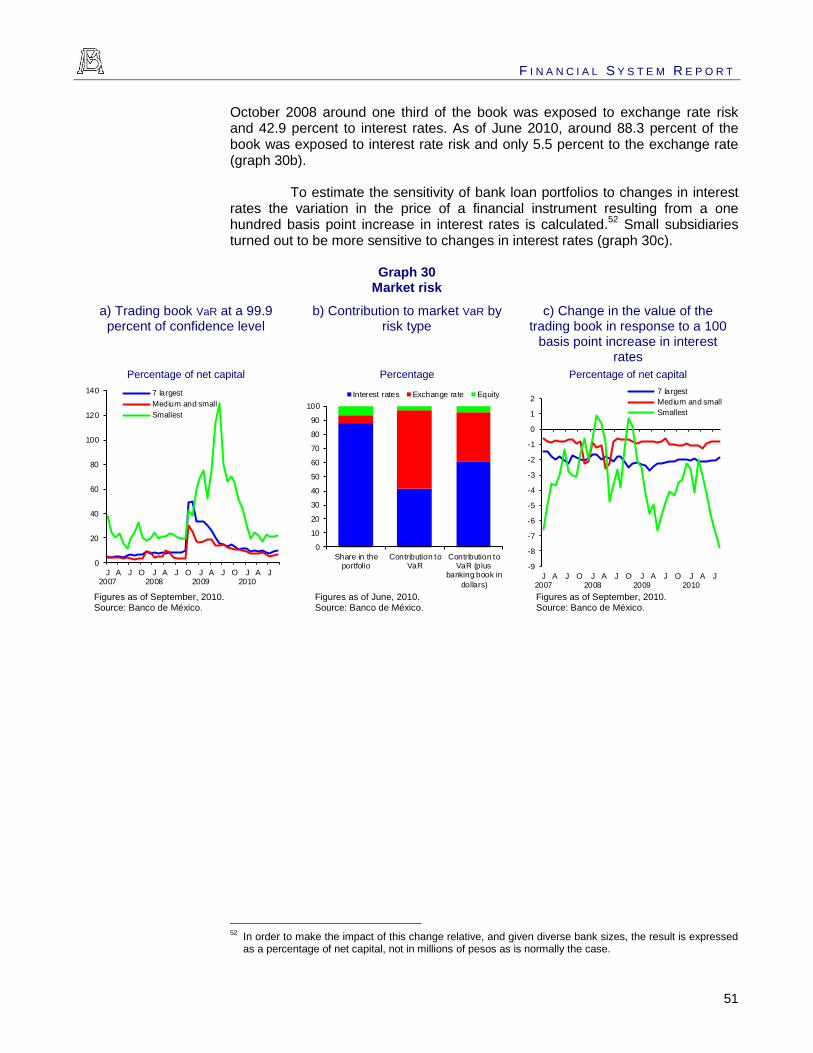
F I N A N C I A L S Y S T E M R E P O R T
51
October 2008 around one third of the book was exposed to exchange rate risk and 42.9 percent to interest rates. As of June 2010, around 88.3 percent of the book was exposed to interest rate risk and only 5.5 percent to the exchange rate (graph 30b).
To estimate the sensitivity of bank loan portfolios to changes in interest rates the variation in the price of a financial instrument resulting from a one hundred basis point increase in interest rates is calculated.
52 Small subsidiaries
turned out to be more sensitive to changes in interest rates (graph 30c).
Graph 30 Market risk
a) Trading book VaR at a 99.9 percent of confidence level
b) Contribution to market VaR by risk type
c) Change in the value of the trading book in response to a 100
basis point increase in interest rates
Percentage of net capital Percentage Percentage of net capital
0
20
40
60
80
100
120
140
J2007
A J O J2008
A J O J2009
A J O J2010
A J
7 largest
Medium and small
Smallest
0
10
20
30
40
50
60
70
80
90
100
Share in theportfolio
Contribution toVaR
Contribution toVaR (plus
banking book in
dollars)
Interest rates Exchange rate Equity
-9
-8
-7
-6
-5
-4
-3
-2
-1
0
1
2
J2007
A J O J2008
A J O J2009
A J O J2010
A J
7 largest
Medium and small
Smallest
Figures as of September, 2010. Source: Banco de México.
Figures as of June, 2010. Source: Banco de México.
Figures as of September, 2010. Source: Banco de México.
52
In order to make the impact of this change relative, and given diverse bank sizes, the result is expressed as a percentage of net capital, not in millions of pesos as is normally the case.

B A N C O D E M É X I C O
52
Market and credit joint risk53
During the second half of 2009 and the first half of 2010, the system’s total VaR decreased by 1.9 percent in nominal terms (graph 31a), while productive assets grew by 8.6 percent (graph 31b). Measured as a percentage of regulatory capital, market and credit VaR decreased for all bank groups (graph 31c) as a result of capital increases relative to risk. CVaR
54 results show that the
increase in risk that occurred in 2009 also translated into a distribution with greater potential losses. This occurred despite banks having more capital to absorb losses with (graph 32).
Macroeconomic scenarios and stress tests
For measurement and risk analysis purposes it is important to have a scenario generation process enabling the analysis of which shocks in economic variables could have a bigger impact on banks to be analyzed, as there has been a historical relationship between movements in the loan portfolio and economic growth.
55 To that end, Banco de México maintains precise information about
financial intermediaries’ risk positions making it possible to estimate the effect of changes in risk factors on banks. Thus, in order to establish the relationship between macroeconomic variables and risk factors, a Vector Autoregressive (VAR)
56 model (box 5) was used.
53
Market and credit VaR jointly estimate losses from these two risks. Box 28 of the 2007 Financial System Report explains the procedure used to obtain joint credit and market losses.
54 Conditional Value at Risk (CVaR) represents the expected value of the loss when it exceeds VaR.
55 There are several ways to generate scenarios using macroeconomic fundamentals. Factors that should be taken into consideration when selecting how to model these interactions are information availability and a model that can be treated analytically and computationally. One option other central banks have resorted to as well as diverse academics, is an economic model within a dynamic framework of general equilibrium with stochastic elements. These models are technically robust. However, in order to be able to use them in practice it is necessary to resort to big simplifications which undermine a realistic interpretation and imply sacrificing relevant information for the financial system.
56 By using the vaR model it is possible to generate scenarios which determine risk factors, including interest rates and the exchange rate for different time horizons. Such a model enables all of the available information to be exploited in a sparing, analytically simple and computationally treatable way while capturing the inter-temporal dynamic of the variables.

F I N A N C I A L S Y S T E M R E P O R T
53
Graph 31 Total value at risk
a) Market and credit VaR b) Combined market and credit VaR for different types of banks
c) Combined market and credit VaR for different types of banks
Billions of pesos Billions of pesos Percentage of net capital
0
10
20
30
40
50
60
70
80
M2007
J S D M2008
J S D M2009
J S D M2010
J A
Credit VaR
Market VaR
Total VaR
0
10
20
30
40
50
60
M2007
J S D M2008
J S D M2009
J S D M2010
J A
7 largest
Medium and small
Smallest
0
5
10
15
20
25
30
M2007
J S D M2008
J S D M2009
J S D M2010
J A
7 largest
Medium and small
Smallest
Figures as of August, 2010. Source: Banco de México.
Figures as of August, 2010. Source: Banco de México.
Figures as of August, 2010. Source: Banco de México.
Graph 32 Total value at risk
a) Market and credit VaR y CVaR b) Comparison of market and credit VaR y CVaR
Billions of pesos Billions of pesos
0
5
10
15
20
25
30
35
40
45
50
55
60
7 largest Medium and small Smallest
CVaR Dec 09
CVaR Dec 08
VaR Dec 08
VaR Dec 09
30
35
40
45
50
55
60
65
70
75
M
2007
J S D M
2008
J S D M
2009
J S D M
2010
J A
VaR
CVaR
Figures as of December, 2009.
Source: Banco de México.
Figures as of August, 2010.
Source: Banco de México.
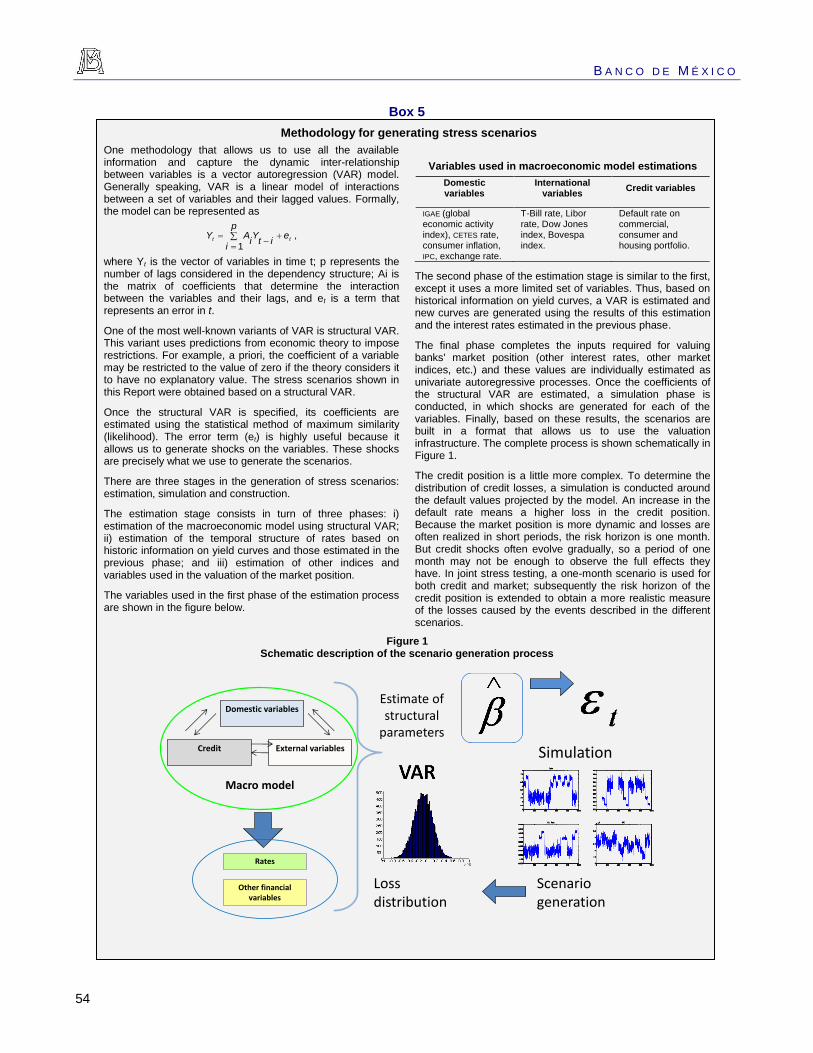
B A N C O D E M É X I C O
54
Box 5
Methodology for generating stress scenarios
One methodology that allows us to use all the available information and capture the dynamic inter-relationship between variables is a vector autoregression (VAR) model. Generally speaking, VAR is a linear model of interactions between a set of variables and their lagged values. Formally, the model can be represented as
,1
tt ep
iit
Yi
AY
where Yt is the vector of variables in time t; p represents the number of lags considered in the dependency structure; Ai is the matrix of coefficients that determine the interaction between the variables and their lags, and et is a term that represents an error in t.
One of the most well-known variants of VAR is structural VAR. This variant uses predictions from economic theory to impose restrictions. For example, a priori, the coefficient of a variable may be restricted to the value of zero if the theory considers it to have no explanatory value. The stress scenarios shown in this Report were obtained based on a structural VAR.
Once the structural VAR is specified, its coefficients are estimated using the statistical method of maximum similarity (likelihood). The error term (et) is highly useful because it allows us to generate shocks on the variables. These shocks are precisely what we use to generate the scenarios.
There are three stages in the generation of stress scenarios: estimation, simulation and construction.
The estimation stage consists in turn of three phases: i) estimation of the macroeconomic model using structural VAR; ii) estimation of the temporal structure of rates based on historic information on yield curves and those estimated in the previous phase; and iii) estimation of other indices and variables used in the valuation of the market position.
The variables used in the first phase of the estimation process are shown in the figure below.
Variables used in macroeconomic model estimations
Domestic variables
International variables
Credit variables
IGAE (global economic activity index), CETES rate, consumer inflation, IPC, exchange rate.
T-Bill rate, Libor rate, Dow Jones index, Bovespa index.
Default rate on commercial, consumer and housing portfolio.
The second phase of the estimation stage is similar to the first, except it uses a more limited set of variables. Thus, based on historical information on yield curves, a VAR is estimated and new curves are generated using the results of this estimation and the interest rates estimated in the previous phase.
The final phase completes the inputs required for valuing banks' market position (other interest rates, other market indices, etc.) and these values are individually estimated as univariate autoregressive processes. Once the coefficients of the structural VAR are estimated, a simulation phase is conducted, in which shocks are generated for each of the variables. Finally, based on these results, the scenarios are built in a format that allows us to use the valuation infrastructure. The complete process is shown schematically in Figure 1.
The credit position is a little more complex. To determine the distribution of credit losses, a simulation is conducted around the default values projected by the model. An increase in the default rate means a higher loss in the credit position. Because the market position is more dynamic and losses are often realized in short periods, the risk horizon is one month. But credit shocks often evolve gradually, so a period of one month may not be enough to observe the full effects they have. In joint stress testing, a one-month scenario is used for both credit and market; subsequently the risk horizon of the credit position is extended to obtain a more realistic measure of the losses caused by the events described in the different scenarios.
Figure 1 Schematic description of the scenario generation process
Domestic variables
External variablesCredit
Macro model
Rates
Other financialvariables
Estimate of structural
parameters
Lossdistribution
Scenariogeneration
Simulation

F I N A N C I A L S Y S T E M R E P O R T
55
The results presented below were generated using a one-month time horizon. For each scenario simultaneous movements of each macroeconomic variable included in the model were considered. Thus, with the financial variables defined for each scenario, the value of the portfolio of loans and the portfolio of financial assets of each bank was determined as their profit and loss distribution.
57
The exercise enables to assess the impact of each scenario on each bank, and hence the possible contagion effect that a failed bank could have on the rest of the system through the interbank market.
58 59
Graph 33a shows the distribution of the rate of change in the values of some financial variables. The generated losses did not generate a distribution with heavy tails neither for banking system nor for different bank groups, as in the simulations, no bank recorded significant losses in its capital adequacy ratio and so no contagion process was triggered (graphs 33b and c).
Graph 33 Value of risk factors under macroeconomic scenarios
a) Distribution of percentage changes in some variables used
b) Loss distributions in macroeconomic scenarios
c) Loss distributions in macroeconomic scenarios
Horizontal axis: percentage change Vertical axis: number of scenarios
Horizontal axis: billions of pesos Vertical axis: number of scenarios
Horizontal axis: billions of pesos Vertical axis: number of scenarios
0
500
1,000
1,500
2,000
2,500
3,000
3,500
4,000
-50 -40 -30 -20 -10 0 10 20 30 40 50
Cete FiX
IPC Bovespa
Retail DI Cons DI
Mortg DI
0
200
400
600
800
1,000
1,200
1,400System
7 largest
0
2,000
4,000
6,000
8,000
10,000
12,000
-3 -2 -1 0 1 2 3 4
Medium and small
Smallest
BACC
Figures as of December, 2009. Source: Banco de México.
Figures as of December, 2009. Source: Banco de México.
Figures as of December, 2009. Source: Banco de México.
Conditional distribution VaR
From the estimate of losses at each scenario, a distribution of losses was built for the banking system as a whole. Based on this distribution it is possible to build risk measures conditional upon the occurrence of an event or series of events. For example, it is possible to know, with a certain level of
57
The time horizon used is not long enough for changes in economic variables to have any major unfavorable impact on the credit portfolio. However, longer time horizons would imply less precise market losses. As the aim of building these scenarios is to measure short-term effects a smaller window was opted for.
58 The exercise assumes that a bank will default on its obligations in the interbank market when its capital adequacy ratio falls below the regulatory minimum of 8 percent. In the risk contagion section we explain the contagion process in more detail; also see the risks sections of the 2006 and 2007 Financial System Reports.
59 Using the procedure described 27,000 macroeconomic scenarios were generated and the impact they could have on bank loan portfolios, including contagion, was calculated.

B A N C O D E M É X I C O
56
confidence, the VaR of a given bank when another bank or group of banks incurs a loss equal to or higher than their VaR. This Value at Risk measure of loss distribution conditional on other losses is known as CoVaR.
60
Table 9 shows the Value at Risk of the loss distribution on conditional other losses (CoVaR) obtained at a 99 confidence level. The first column shows Value at Risk as a percentage of regulatory capital which different bank groups would incur when the losses of the banking system are higher than or equal to their VaR with a 99 percent confidence level. Thus in scenarios in which the system suffer big losses (3.1. percent of its capital) the CoVaR of the seven largest banks would be 5.4 percent, that of medium-sized and small banks 2.4 percent, that of small subsidiaries 7.9 percent, and that of BACC 5.5 percent. The second column shows the CoVaR of different bank groups when the losses of the seven largest banks are greater than their VaR.
Table 9 Value at Risk of the loss distribution of each bank group
contingent on other bank groups registering a loss greater than VaR (CoVaR)
CoVar as percentage of the net capital
System 7 LargestMedium and
smallSmallest BACC
System 3.1 5.0 3.2 5.0 4.5
7 Largest 5.4 3.3 3.2 5.4 4.6
Medium and Small 2.4 2.3 2.5 2.4 2.9
Smallest 7.9 7.9 5.0 4.9 6.4
BACC 5.5 5.5 6.0 5.5 4.3
Group with losses equal to or above their VaR with a 99% confidence level
Co
VaR
Source: Banco de México. Figures as of December, 2009. The diagonal line corresponds to VaR at a 99 percent confidence level for each bank group.
The results can be explained by the characteristics and degree of sensitivity of the financial asset portfolios in each bank group’s trading book to the different financial variables. Graph 34 illustrates the system’s conditional loss distributions when a group of banks registers losses equal to or higher than Value at Risk.
60
CoVaRq j| i
is the VaR of bank j (or a group of banks) contingent on X i = VaRq i of bank i, where X i
is
the variable of the bank (or group) i for which VaRq i is defined. In other words CoVaRq
j| i is implicity
defined by quantile q of the conditional probability distribution: P(Xj ≤ CoVaRq j| i | Xi ≤ VaRq
i ) = q.

F I N A N C I A L S Y S T E M R E P O R T
57
Graph 34 Conditional loss distribution of the system when different bank groups are in difficulties
a) System distribution and system distribution conditional on large
banks recording losses at their VaR
level
b) System distribution and system distribution conditional on which medium-sized and small banks
recording losses at their VaR level
c) System distribution and system distribution conditional on small subsidiaries recording losses at
their VaR level
Horizontal axis: billions of pesos Vertical axis: relative frequency
Horizontal axis: billions of pesos Vertical axis: relative frequency
Horizontal axis: billions of pesos Vertical axis: relative frequency
0.00
0.01
0.02
0.03
0.04
0.05
0.06
0.07
-29 -26 -23 -21 -18 -10 10 29
System Large system
0.00
0.01
0.02
0.03
0.04
0.05
0.06
-29 -16 -8 0 8 15 23 31
System
Medium and small system
0.000
0.005
0.010
0.015
0.020
0.025
0.030
0.035
0.040
-29 -25 -22 -18 -14 -10 10 29
System Small system
Figures as of December, 2009. Source: Banco de México.
Figures as of December, 2009. Source: Banco de México.
Figures as of December, 2009. Source: Banco de México.
It is also possible to obtain the CoVaR of each group of banks conditional on one of the variables used in the model being at one of the extreme levels generated by the simulation. This provides a general overview of the factors each bank group is sensitive to.
61 The system’s CoVaR and that of the seven
largest banks is larger when the Cetes yield is high (4.8 and 5.1 percent of regulatory capital, respectively). In the case of medium-sized and small banks commercial loan delinquency (3.2 percent of regulatory capital) was the most important factor; for subsidiaries it was the Mexican Stock Exchange Index (7.6 percent of the regulatory capital) and for BACC consumer, loan delinquency (7.2 percent of the regulatory capital).
Stress tests
Stress tests are used to evaluate the effects that scenarios containing one-time but feasible events would have on a series of financial assets. Using this procedure it is possible to detect the main areas of vulnerability of such assets to the stressed risk factors. Stress tests should be used to complement other risk estimates, which, like VaR, work well under normal circumstances but underestimate the risks during crises. In terms of loss distribution, the advantage of stress tests is that they permit an assessment of scenarios located in the tail of the distribution as an analysis of the effects of extreme circumstances can be made without necessarily establishing the probability of such events occurring.
62
61
Extreme values for these factors are not very likely; however, they are immersed in a coherent macroeconomic environment and do not therefore move in isolation, and in that sense it is not a marginal impact test.
62 In the exercise shown below it is possible to assign a probability of occurrence to the scenarios considered. This constitutes an additional advantage of the methodology used.

B A N C O D E M É X I C O
58
Basically there are three methodologies for conducting stress tests:63
i) stylized extreme scenarios, ii) historical extreme scenarios
64 and iii) hypothetical extreme
scenarios. The latest include the Monte Carlo simulation. A combination of methodologies can also be used.
Based on the macroeconomic model described in box 5 a shock generating process was created to create the scenarios used to value banks’ financial assets. Scenarios that belong to the systemic or black swan category
65
are not likely to occur under “normal” simulation conditions. This was evident from the results obtained for scenarios with a macroeconomic underpinning in which systemic events never occur and contagion processes are never triggered.
The macroeconomic model also permitted the generation of extreme scenarios such that deriving stress scenarios in the tail of distribution is feasible preserving the economic interpretation. Graph 35a shows the distributions of changes in some of the variables used. The scenarios generated a bimodal distribution in these factors which subsequently was translated into bimodal loss distributions for bank groups (graphs 35b and c).
66
An additional difficulty in generating catastrophic but coherent scenarios is that banks’ vulnerability to such scenarios is uneven. Thus a stress scenario can cause considerable losses for a given bank while due to its market position it simultaneously reports gains to another. Also, a shock could cause losses arising from loan portfolio valuation that are offset by gains from the mark-to-market of the portfolio.
Neither did these scenarios generate losses that triggered contagion processes. Therefore, even under extreme conditions, banks’ capitalization would prevent a fall below the regulatory minimum. This implies that the type of macroeconomic shocks that would be required for banks’ capital adequacy ratios to fall below the regulatory minimum (eight percent) with current risk positions are extreme, and as such very unlikely (box 6).
63
For a more detailed explanation of the taxonomy of stress tests please see box 12 of the 2006 Financial System Report.
64 Examples of results obtained using this methodology were presented in the 2006 and 2007 Financial System Reports.
65 High-impact and unpredictable events that are easy to rationalize after the fact; see box 26 of the 2007 Financial System Report.
66 Stress scenario losses cannot be directly included in the histogram of previously simulated losses as their probability of occurrence is of a different size.

F I N A N C I A L S Y S T E M R E P O R T
59
Box 6
Extreme events in the loss distribution of the banking system
Because capitalization level of Mexican banks is very high, it would require an extremely severe macroeconomic shock to cause a contagion of the banking system. This shock would represent in fact an extreme scenario, and therefore its probability of occurrence is very low. In any case, it is illustrative to present a simulation to analyze how the hypothetical shock could cause successive failures of banks in various rounds of contagion.
For these simulations, we used a VAR model flexible enough to generate extreme scenarios without losing macroeconomic coherence. Thus, after simulating an extreme macroeconomic shock we estimated losses in all the banks of the system.
1
These losses were substantial, and increased the banks' vulnerability to default in the interbank market. Almost all of the banks failed over the course of this process.
Figure 1 Initial state of the system
Figures 1 through 4 represent the Mexican interbank market in a process of contagion. The links between banks are shown by the blue lines. The red nodes represent banks with a capital adequacy ratio below eight percent (the regulatory minimum) after the initial impact. The yellow nodes represent banks exposed to the red nodes, which would be vulnerable to losses resulting from a default by banks whose capital adequacy ratio falls below eight percent. Finally, the green nodes represent banks with no direct exposure to the "red node" banks.
Figure 1 shows that after the initial impact, only one institution would present a capital adequacy ratio to below the regulatory minimum. This bank, which controls less than five percent of the assets in the banking system, would default on its obligations in the interbank market and would trigger a contagion process.
Figure 2
First round of contagion
Next, figure 2 shows the first contagion round: the capital adequacy ratio of one big bank falls below the regulatory minimum. The losses of this bank produced by the initial macroeconomic shock would be so large that its capital adequacy ratio could be barely above the minimum. Under these circumstances, a slight additional loss resulting from its exposure to the bank that initially failed would end up turning it into a red node. Furthermore, with the bankruptcy of two institutions, the number of yellow nodes would double and the risk of other banks failing would increase significantly.
Figure 3
Second round of contagion
Figure 3 shows the second round of contagion. In this stage, three more banks would fail as a result of their exposure to the large bank that failed. The effect would result from the initial impact of the shock, and the impact of the bank that failed in the first round of contagion. Another large bank would figure among banks that had failed. The failure of this institution would set off an additional round of contagion.
In the third round, four more banks would fail. After this, virtually the entire banking system would be vulnerable to banks in financial trouble, except those not involved in the interbank market or which act only as borrowers. Figure 4 shows the state of the banking system at the end of all the possible rounds of contagion.
Figure 4
Final state of the system
1 The scenario entails a 13.5 percent annual decrease in the IGAE (GDP
proxy), a 150 percent rise in the Cetes rate, an exchange-rate depreciation of 22 percent, a 61 percent plunge in the stock market index and a 57 percent rise in default ratios. These levels are more severe than those observed in the 1995 crisis.

B A N C O D E M É X I C O
60
Graph 35 Value of risk factors in stress scenarios
a) Distribution of percentage changes in some variables used
b) Distribution of stress scenario losses
c) Distribution of stress scenario losses
Horizontal axis: percentage change Vertical axis: number of scenarios
Horizontal axis: billions of pesos Vertical axis: number of scenarios
Horizontal axis: billions of pesos Vertical axis: number of scenarios
0
50
100
150
200
250
300
350
-80 -60 -40 -20 0 20 40 60 60 80 100
Cete
Fix
IPC
Bovespa
Retail DI
Cons DI
Mortg DI
0
20
40
60
80
100
120
140
160
180
200System
7 largest
0
100
200
300
400
500
600
700
800
900
-4 -3 -3 -2 -2 -1 -1 0 1 1 2 2
Medium and small
Smallest
BACC
Figures as of December, 2009. Source: Banco de México.
Figures as of December, 2009. Source: Banco de México.
Figures as of December, 2009. Source: Banco de México.
Interbank market and risk contagion
The Interbank market plays a crucial role in the efficient allocation of economic resources by facilitating liquidity among financial intermediaries. That said, this market is a strong source of risk contagion for banks because of the size of credit and debtor positions generated by interbank derivative, currency, security and loan transactions. The risk of contagion can materialize when a bank fails to meet its obligations in turn causing other banks not to honor theirs. Graph 36a shows the trend in the value of banks’ risk positions in the interbank market.
Graph 36b shows average bilateral risk positions measured as a percentage of capital. In 2009 medium-sized and small banks considerably reduced their interbank exposure compared to 2008 levels. In contrast last year BACC increased theirs.

F I N A N C I A L S Y S T E M R E P O R T
61
Graph 36 Interbank risk positions
a) Value of interbank risk positions b) Bilateral interbank risk positions 1/
Billions of pesos Percentage of net capital
0
20
40
60
80
100
120
140
160
180
200
J
2007
A J O J
2008
A J O J
2009
A J O J
2010
A
Securities Derivatives
Deposits and loans Currencies
0
20
40
60
80
100
120
J
2007
A J O J
2008
A J O J
2009
A J O J
2010
A
7 largestMedium and smallSmallestBACC
Figures as of June, 2010. Source: Banco de México.
Figures as of June, 2010. Source: Banco de México.
1/ Bilateral interbank risk positions are defined as exposure to daily unsecured loans between banks in the system.
An analysis conducted to evaluate the size of risk of contagion through the interbank market
67 shows that contagion chains occur every day. However,
such chains involve only a small number of banks (graph 37a). Likewise, on most days banks exposed to contagion represent a relatively small percentage of the system’s total assets (graph 37b). Assets of banks with capital adequacy ratios of below eight percent would account for slightly over five percent of the system’s total assets over a few days. The graph also shows the relative importance of the capital of banks with capital adequacy ratios falling below 4 percent. In this latter case the size of the contagion would be much smaller. The results also suggest a decrease in the risk contagion level in recent months, due both to the number of banks that would be impacted by a contagion chain and the relative importance of their assets.
67
The methodology and assumptions used are explained in the 2006 Financial System Report. The worst possible chain of contagion was obtained for each day of the period. We define the worst possible chain of contagion as that having the biggest impact on the system. The impact was measured using the sum of the value of the assets of banks whose capital adequacy ratio would be between 4 and 8 percent and below 4 percent.

B A N C O D E M É X I C O
62
Graph 37 Main results of the contagion computation
1/ 2/
a) Capital adequacy ratios which would result from the daily triggering of the worst chain of
contagion
b) Assets of banks whose capital would be impacted by a daily triggering of the worst chain
of contagion Number of banks Percentage of total bank assets
0
2
4
6
8
10
12
J
2007
A J O J
2008
A J O J
2009
A J O J
2010
A
41
Number of banks with an ICAP>
Number of banks with 4% < ICAP < 8%
Number of banks with ICAP < 4%
0
2
4
6
8
10
12
14
J
2007
A J O J
2008
A J O J
2009
A J O J
2010
A
ICAP below 4%
ICAP below 8%
Figures as of June, 2010. Source: Banco de México. ICAP: capital adequacy ratio.
Figures as of June, 2010. Source: Banco de México. ICAP: capital adequacy ratio.
1/ Assumptions: Loss caused by a 100 percent default and a capital adequacy ratio of 4 percent. 2/ The number of banks with a capital adequacy ratio below 8 or 4 percent as well as the percentage of assets impacted by the contagion
chain, does not include the bank that generates the initial contagion.
International contagion
Evidently, interbank contagion can stem from defaults by a foreign bank. The recent international crisis has shed light on the importance of this source of contagion which is particularly relevant to Mexico due to the integration of Mexican banks with the international financial system. As is common knowledge, Mexico’s larger banks are subsidiaries of international banks most of which conduct a broad range of foreign transactions. In fact the exposure of Mexican banks to foreign counterparty risk dramatically increased during the early stages of the crisis (graph 38a). This exposure was concentrated in banks located in the main developed countries (graph 38b).
68 Therefore, below we present the results
of a contagion exercise similar to the one explained earlier only taking into account Mexican bank exposure to foreign financial institutions.
69 The exercise
calculated the impact ─measured using the capital adequacy ratio─ that a default
68
Banks considered in this analysis are: Citibank, Wells Fargo, JP Morgan, Bank of America, Bank of New York, American Express, Barclays, Standard Chartered Bank, RBS, HSBC, Santander, BBVA, BNP Paribas, Societé Generale, Credit Suisse, UBS, Deutsche Bank, ING, Svenska Handelsbanke, Royal Bank of Canada, Scotiabank and Bank of Tokyo-Mitsubishi.
69 The risk exposure of Mexican banks to their foreign counterparties can significantly vary from one day to the next. That is why the exercise shown here relied on daily information despite the type of transactions included being limited to interbank loan and deposit transactions. Therefore, unlike the analysis in the previous section, risk positions do not include security, forex and derivative transactions.

F I N A N C I A L S Y S T E M R E P O R T
63
by one of the foreign banks in the sample would have on the financial situation of Mexican banks.
70
The analysis assumes that contagion chains are generated when a default on the part of a foreign bank pushes the capital adequacy ratio of a Mexican bank below 8.0 percent. An additional assumption was that the latter bank fails to honor its obligations with other banks in the country.
71 The exercise is
repeated until there are no further cases of default. It was also assumed that when its counterparty defaults on its payments a bank’s loss is equivalent to 100 percent of its risk position.
The results show that events that could impact the capital adequacy ratios of Mexican banks (graph 39a) are not very frequent. However, over the few days that such events could occur, the severity of the loss reaches levels of around 15 percent of the system’s total assets (graph 39b). The results of this analysis suggest that international contagion is not very likely but the impact could be relatively great.
Graph 38 Exposure of Mexican banks to foreign banks
a) Daily value of the exposure b) Exposure based on the counterparty’s country of origin
Billions of dollars Percentage
0
2
4
6
8
10
12
14
J
2007
A J O J
2008
A J O J
2009
A J O J
2010
A
United States
54%
United Kingdom
16%
Spain12%
France6%
Rest of Europe
6%
Rest of the
world
6%
Figures as of June, 2010. Source: Banco de México.
Average exposure (January 2008 to June 2010). Source: Banco de México.
70
The exercise shown here does not include the impact of a default by an international bank on the solvency of other international banks.
71 Technically referred to as second round effects.

B A N C O D E M É X I C O
64
Graph 39 Main results of the computation of contagion from exposure to foreign banks
a) Capital adequacy ratios resulting from the daily triggering of the worst chain of contagion
b) Assets of banks whose capital would be below 8 percent in the event of a daily triggering
of the worst chain of contagion Number of banks Percentage of total bank assets
0
2
4
6
8
10
12
14
J
2008
A J O J
2009
A J O J
2010
A
40
Number of banks with an ICAP> 8%
Number of banks with 4% < ICAP < 8%
Number of banks with an ICAP < 4%
0
5
10
15
20
25
30
J
2008
A J O J
2009
A J O J
2010
A
ICAP below 4% ICAP below 8%
Figures as of June, 2010. Source: Banco de México.
Average exposure (January 2008 to June 2010). Source: Banco de México.
ICAP: capital adequacy ratio.
The recent crisis has brought to light the importance of risk contagion. The financial authorities of diverse countries bailed out several banks that would have triggered multiple defaults had this not been the case.
Liquidity risk
The average liquidity position of Mexican banks measured as the ratio of liquid assets to liabilities maturing in less than 30 days (a/l30d), registered a slight improvement in the second half of 2009. However, the behavior of this indicator has been very heterogeneous, both between groups of banks and within them. Most of the large banks usually have ample liquidity positions while for the group of medium-sized and small banks and BACC the situation has been more uneven. Several of the banks in this latter category remain vulnerable in terms of liquidity and must work to redress this, especially in the light of the recent crisis which highlighted the importance of adequate liquidity risk management. In order to improve the management of liquidity risk, in September 2008 the BCBS issued Principles for Sound Liquidity Risk Management and Supervision, and in December 2009 proposed two liquidity requirements for banks which are currently under review.
The improvement in the liquidity positions of large banks (graph 40a) in the second half of 2009 was largely due to an increase in stable deposits. In the second half of 2009 there was an increase in the loan portfolio accompanied by a more than proportional increase in deposits (graphs 41a and b). The stable deposits to loan portfolio ratio has remained above 100 percent implying that banks’ loan portfolio comprised of non-liquid assets is being financed with stable liabilities which limits liquidity risk (graph 41c).

F I N A N C I A L S Y S T E M R E P O R T
65
Graph 40 Ratio of assets and liabilities maturing within the next 30 days
Quarterly averages
a) Large banks b) Medium-sized and small banks and BACC
Percentage Percentage
0
50
100
150
200
250
300
350
400
450
500
550
I2007
II III IV I2008
II III IV I2009
II III IV I2010
II
Percentile 75
Percentile 25
Median
Average
0
50
100
150
200
250
300
350
400
450
500
550
I2007
II III IV I2008
II III IV I2009
II III IV I2010
II
Percentile 75
Percentile 25
Median
Avergage
Figures as of June, 2010. Source: Banco de México.
Figures as of June, 2010. Source: Banco de México.
Graph 41 Changes in the seven largest banks’ balance sheet composition
Quarterly moving averages
a) Total loan portfolio net of provisions
b) Stable deposits c) Stable deposits to loan portfolio
Billion pesos Billion pesos Percentage
1,350
1,370
1,390
1,410
1,430
1,450
1,470
1,490
J2009
A J O J2010
A
1,650
1,670
1,690
1,710
1,730
1,750
1,770
1,790
J2009
A J O J2010
A
90
95
100
105
110
115
120
J2009
A J O J2010
A
Figures as of June, 2010. Source: Banco de México and CNBV.
Figures as of June, 2010. Source: Banco de México.
Figures as of June, 2010. Source: Banco de México.

B A N C O D E M É X I C O
66
The liquidity position of medium-sized and small banks and BACC (a/l30d) is below that of larger banks for two reasons: greater dependence on wholesale funding and fewer deposits. The dispersion in this group’s liquidity position has tended to decrease and the average ratio of liquid assets to current liabilities has remained above 100 percent. However, around half of the banks in this group maintain a liquidity ratio of below 100 percent (graph 40b).
Due to the crisis, in December 2009 the Basel Committee proposed establishing liquidity requirements for banks. The first, the Liquidity Coverage Ratio (LCR), consists of a short-term liquidity requirement while the second, the Net Stable Funding Ratio (NSFR), is a structural liquidity requirement (see box 7).
The original proposals are still under review in order to take the comments of banks, international organizations and the authorities into account. A lot of progress has been made with the LCR proposal and the Committee has announced that it will be ready by end 2010, although some details are still being discussed. Regarding NSFR, this indicator has received greater criticism and is subject to a more thorough review. A proposal for this requirement is expected by end 2010 at the latest when it will be subject to an extensive period of observation.
A preliminary analysis for Mexican banks using parameters announced by BCBS in July leads to the conclusion that large banks, medium-sized and small banks and BACC will on average comply with the first BCBS requirement as LCR is greater than 100 percent (graphs 42a and b). However, the individual situation of banks with respect to this requirement is very uneven. While some more than cover it, others will have to make adjustments in order to comply. With respect to the second requirement, banks in general face greater difficulty to meet it. On average large banks have a Net Stable Funding Ratio of around 90 percent and the rest have an average level of around 105 percent. As with the Liquidity Coverage Ratio, the individual situation of banks measured by the NSFR is also very uneven. However, as previously mentioned, this requirement will be subject to a long observation period.
With respect to the foreign currency liquidity position, commercial banks amply comply with the liquidity requirement established in Banco de México regulations. During the crisis, commercial bank foreign-currency-denominated liquidity increased more than proportionally than the liquidity requirement (graph 43). Part of the increase in dollar holdings was due to a strategy by banks to create liquidity in dollars by obtaining funding in pesos.

F I N A N C I A L S Y S T E M R E P O R T
67
Graph 42 BCBS liquidity requirements
Quarterly moving averages
a) BCBS liquidity coverage ratio
Large banks
b) BCBS liquidity coverage ratio
Medium-sized and small banks and BACC
Percentage Percentage
0
50
100
150
200
250
300
350
I
2009
II III IV I
2010
II
Percentile 75
Percentile 25
Median
Average
0
50
100
150
200
250
300
350
I
2009
II III IV I
2010
II
Percentile 75
Percentile 25
Median
Average
Figures as of June, 2010. Source: Banco de México.
Figures as of June, 2010. Source: Banco de México.
Graph 43 Trend in foreign currency liquidity
a) Liquidity requirement and holdings of liquid assets
b) Foreign-currency-denominated assets and liabilities considered in the calculation of the
liquidity requirement
Billions of dollars Billions of dollars
0
4
8
12
16
20
J
2008
A J O J
2009
A J O J
2010
A
Other
Deposits in foreign banks
Deposits in Banco de México
Requirement
0
10
20
30
40
50
60
70
October
2008
March
2009
October March
2010
Assets Liabilities
31-60 day s
9-30 day s
2-8 day s1 day
31-60 day s
9-30 day s
2-8 day s
1 day
Figures as of June, 2010. Source: Banco de México.
Figures as of March, 2010. Source: Banco de México.

B A N C O D E M É X I C O
68
Box 7
Measurement, tracking and regulation of liquidity risk
In September 2008, the Basel Committee issued the Principles for Sound Liquidity Risk Management and Supervision. These principles state that all banks should:
Align incentives in all their business areas to take into account their exposure to liquidity risk.
Actively manage their intraday liquidity positions and risks to meet payment and settlement obligations on a timely basis under both normal and stressed conditions.
Identify possible exposure to liquidity risk.
Maintain a reserve of liquid assets to be held as insurance against various stress scenarios.
Apply liquidity stress testing and establish contingency funding plans.
These principles also establish that supervisors should evaluate the banks' liquidity risk management plans and liquidity positions, determine whether those plans are appropriate, and maintain communications with other local and international supervisors.
As a complement to these principles, however, the Basel Committee considered it necessary to establish a general framework for tracking liquidity risk in banking institutions. The framework would provide generally applicable requirements and indicators for measuring liquidity risk and establishing significant comparisons with international peers. Thus, in order to create that framework, the Committee published an consultative document in December 2009. In that text it proposes a couple of liquidity requirements as well as a series of monitoring tools.
1 The following briefly summarizes the
proposed requirements:
1. Liquidity Coverage Ratio (LCR)
1.net cash outflows over 30 days under a stress scenario
high quality liquid assets
Banks would be required to maintain enough liquid assets to guarantee a survival horizon of 30 days under highly adverse scenarios such as a run on banks and a reduction of other liabilities. This buffer would give stockholders and authorities time to apply other solutions.
Net cash outflow over thirty days under stressed conditions assumes different run-off rates for demand and time deposits (from 5 to 100 percent) and takes into account:
Deposit insurance coverage
The source of each deposit (wholesale or retail)
Additional services between the bank and the depositor (credit cards, payroll accounts, loans, etc.).
Additionally, the stress scenario assumes an intensive use of committed credit lines and an inability to use credit lines extended to the bank; an increase in haircuts on the securities used as collateral, and a rise in margin calls on derivative trading or other contingent obligations as the result of a three-notch reduction in the bank’s credit rating.
2. Net Stable Funding Ratio (NSFR)
1.non liquid assets
stable funding
The objective of this requirement is to improve the liquidity structure of the balance sheet; that is, to ensure that banks maintain a maturity profile on their liabilities which is consistent with their asset structure. As a general strategy, it seeks to promote medium- and long-term funding of assets and business activities considered non-liquid.
For the purposes of this requirement, "stable funding" refers to the following: capital, deposits with more than 12 months to maturity, and the stable portion of deposits with less than 12 months to maturity (e.g., a certain percentage of demand deposits).
To measure the amount of non-liquid assets, all the assets are classified and weighted by a factor that depends on maturity and degree of liquidity. Once weighted, assets are added together to determine the amount that must be funded with stable liabilities.
In addition to the requirement, the Committee proposed four groups of indicators or monitoring tools:
A. Contractual maturity mismatch. This group of indicators seeks to identify net cash flow for different time bands taking into account contractual terms (e.g. making no assumptions about the stability of time deposits or the possibility of liquidating certain assets). Instruments that have no contractual term, like sight deposits, should be reported separately, without applying any assumption. These indicators show the amount of liquidity each bank would need to raise, assuming the liabilities are paid on the closest possible contractual date and assets are liquidated on the most distant contractual date.
B. Concentration of funding. These indicators identify the significant sources of wholesale funding, the run-off of which could have serious repercussions on the liquidity of the bank in question. The concentrations that should be monitored are:
i. Concentration in significant counterparties. ii. Concentration in funding instruments. iii. Concentration in currencies.
These concentrations should be reported for time bands at 1 month, from 1 to 3 months, from 3 to 6 months, from 6 to 12 months, and more than 12 months.
C. Available unencumbered assets. This indicator identifies the main characteristics of assets that may be used as a collateral to raise liquidity, for example, location and currency denomination. In listing these assets, banks should include the expected discount factor (haircut) for using them as collateral.
D. Market-related indicators. To identify possible liquidity problems, authorities may also use general market information, information specific to the financial sector, or even on a specific bank. The timeliness of this information makes it especially valuable in creating early warning indicators.
1 Basel Committee on Banking Supervision: International framework for
liquidity risk measurement, standards and monitoring, Consultative Document, BIS, 2009.

F I N A N C I A L S Y S T E M R E P O R T
69
4.2. Pension fund managers (afores)
As of June 2010 the balance of funds managed by the afores, including Pensionissste accounts, totaled 1.3 trillion pesos, equivalent to 10.3 percent of GDP and 21.2 percent higher in real terms than the level twelve months prior (graph 44a). Within the siefore básica pension funds, number 3 managed the most assets (30.0 percent of the total as of June, 2010) followed by fund number 4 (29.1 percent of funds) (graph 44b).
72
Graph 44 Assets managed by the afores
a) Assets managed by afores b) Assets by siefore type
Real YoY percentage change Billions of pesos
-10
-5
0
5
10
15
20
25
30
35
J
2007
A J O J
2008
A J O J
2009
A J O J
2010
A J
0
200
400
600
800
1,000
1,200
1,400
1,600
J
2007
A J O J
2008
A J O J
2009
A J O J
2010
A J
SB1 SB2 SB3 SB4 SB5
Figures as of September, 2010. Source: Consar.
Figures as of September, 2010. Source: Consar.
The 2008 international crisis had an adverse impact on pension fund returns in most countries, Mexico included, owing to investment portfolio losses derived from higher interest rates and stock market losses. However, as of the second half of 2009, debt instrument gains resulting from a decline in medium and long-term interest rates enabled funds to recover. As of the end of 2009, Siefores’ real year-on-year average yield was 3.02 percent after hitting a low at the beginning of the year. As of the end of 2009, siefore básica number one offered the best yield, or a real 3.89 percent year-on-year.
73
Of note is the increase in siefore equity positions in 2009, which by the end of the first half of 2010 accounted on average for 12.7 percent of total assets
74 (graph 45a). This percentage is nevertheless below the average of OECD
countries (22.5 percent in October, 2009).
72
Siefore 3 manages the funds of workers aged between 37 and 45. The funds of workers aged between 27 and 36 are managed by siefore 4.
73 Internal calculation obtained from last-36-month yields published by Consar.
74 Investment in these instruments is subject to a cap depending on the type of investment regime.

B A N C O D E M É X I C O
70
Graph 45 Return indicators and asset composition
a) Asset structure b) Value at Risk (VaR) c) VaR and profitability
Percentage Percentage of net assets Horizontal axis: VaR as a percentage of the portfolio
Vertical axis: real percentage yield
50
60
70
80
90
100
j-0
9
j-1
0
j-0
9
j-1
0
j-0
9
j-1
0
j-0
9
j-1
0
j-0
9
j-1
0
SB1 SB2 SB3 SB4 SB5
Other
International an d European debt
Local and structured private debt
Equity
Gove rnment
0.00
0.50
1.00
1.50
2.00
2.50
SB1 SB2 SB3 SB4 SB5
Minimun
Average
Maximun
VaR Limit
-2
-1
0
1
2
3
4
5
6
0.0 0.5 1.0 1.5
SB1 SB2
SB3 SB4
SB5 SB1
SB2 SB3
SB4 SB5
Real
retu
rn
January 2009
June2010
VaR Figures as of June, 2010. Source: Consar.
Figures as of June, 2010. Source: Consar.
Figures as of June, 2010. Source: Consar.
As of June 2010, the siefores’ real year-on-year average yield showed a significant improvement at 3.98 percent. Siefore básica number one was again the best performing fund with a real annual yield of 4.86 percent. By that month siefores’ risk-return relationship (graph 45c) had returned to its theoretical condition (positive slope), in contrast to the situation at the beginning of 2009; this can be attributed to a recovery in the value of the portfolios and a decrease in VaR
75 for all siefores.
In 2010 new afore commissions came into effect. Most pension fund managers lowered them, and so the average for the system decreased by 6.0 percent compared to 2009 (box 10).
75
Siefores’ market risk is measured using the “value at risk” indicator (VaR). Consar has established limits for this value taking into account each siefore’s investment regime. For example, siefore básica 5, whose investment regime enables it to invest more of its funds in assets that are more sensitive to volatility such as equities, has a VaR limit equal to 2 percent of total net assets while siefore básica 1, which has a more conservative regime (excluding stocks and private capital) has a VaR limit of 0.6 percent of total net assets. Changes in the value of the fund at the retirement date affect the worker’s future pension.

F I N A N C I A L S Y S T E M R E P O R T
71
Table 10 Fee structure
Percentage
Siefore Básica 2008 2009 2010
Afirme Bajío 1.70 1.70 1.51
Ahorra Ahora 3.00 N/A N/A
Argos 1.17 N/A N/A
Azteca 1.96 1.96 1.96
Banamex 1.84 1.75 1.58
Bancomer 1.47 1.47 1.45
Banorte Generali 1.71 1.71 1.58
Coppel 3.3 1.94 1.81
HSBC 1.77 1.77 1.61
Inbursa 1.18 1.18 1.18
ING 1.74 1.74 1.61
Invercap 2.48 1.93 1.73
Ixe 1.83 N/A N/A
Metlife 2.26 1.89 1.74
Principal 2.05 1.94 1.79
Profuturo GNP 1.96 1.92 1.70
Scotia 1.98 1.88 N/A
XXI 1.45 1.45 1.42
Average1/
1.75 1.66 1.56 Figures as of the end of 2008 and 2009, and as of September 2010. Source: Consar. N/A: Does not apply as the afore did not operate during that period either owing to a
merger with another fund manager or because it was a new one. 1/ Weighted average of net assets.
4.3. Mutual funds
The improvement in financial market conditions for most of 2009 meant that by July of that year the value of mutual funds had recovered to pre-crisis levels. Favorable conditions have prevailed in 2010. It should be recalled that the value of mutual fund assets declined by around 12 percent in real terms between September and December 2008. These movements were due both to the withdrawal of funds by investors and reductions in asset prices caused by market volatility.
Prevailing volatility in the period mentioned caused some mutual funds to suffer liquidity problems. As a result such companies prioritized liquidity by getting rid of positions in long-term instruments such as fixed-rate bonds. Despite the withdrawal of funds by mutual fund investors and lower financial market liquidity, Mexico was the only member of the IOSCO
76 that did not order the
suspension of mutual fund redemptions during periods of greater market volatility. However, it was necessary to push through some emergency changes to the regulations:
76
IOSCO (International Organization of Securities Commissions) is the international association that regulates securities and has 17 countries as members.

B A N C O D E M É X I C O
72
- The maximum two percent cap investment funds could charge clients who decided to withdraw their money was eliminated and replaced by methodologies determined by each mutual fund’s board. This measure prevented more informed investors from taking advantage of the price formation lag, to the detriment of the less informed.
77
- Under certain conditions, mutual funds were allowed to temporarily trade Federal Government and IPAB debt securities directly with related financial firms.
- An additional classification called “money market mutual funds” was included to create a very low risk investment vehicle and high liquidity. These have an investment regime limiting them to securities of the highest credit quality as well as a portfolio with an average weighted duration of less than one month.
78
Mutual fund assets increased by 20.3 percent in real terms as of June 2010 vs. the same year earlier period. As a result liquidity pressures on mutual funds lessened and longer-term instruments’ share of investment portfolios has been increasing along with profitability. In June 2010, the value of mutual fund assets reached more than one billion pesos, or 11.4 percent of financial system assets placing these intermediaries, for their relative size, after commercial banks and siefores (graph 46).
Graph 46 Mutual funds
a) Total assets managed by investment funds
b) Mutual fund securities portfolio c) Debt securities held by mutual funds
Billions of pesos Percentage Percentage
0
200
400
600
800
1,000
1,200
1,400
J2007
A J O J2008
A J O J2009
A J O J2010
A J
Equities Debt
System
0
20
40
60
80
100
M2007
J S D M2008
J S D M2009
J S D M2010
J S
Company stock Mutual fund stockStructured notes BankGovernment IPABPrivate
0
20
40
60
80
100
D2007
M J2008
S D M J2009
S D M J2010
S
Bank IPABGov zero coupon Gov variable rateGov fixed rate Gov real ratePrivate State and state-ownedEuropean
Figures as of September, 2010. Source: CNBV.
Figures as of September, 2010. Source: Banco de México.
Figures as of September, 2010. Source: Banco de México.
77
October 10th and 30th, 2008 amendments to general provisions applicable to mutual funds and related parties with a final resolution date of March 25th, 2009.
78 Resolution modifying general provisions applicable to mutual funds and related parties as at September 17th, 2009.

F I N A N C I A L S Y S T E M R E P O R T
73
4.4. Development banks, Infonavit and Fovissste
Institutions that make up the development banking system, which includes development banks,
79 Agriculture Trusts (FIRA) and Rural Funding Trusts (FR), provide
first and second tier financing, guarantees, and undertake loan portfolio sales and special development programs besides other administrative functions, such as technical assistance and training. Likewise, in times of economic hardship such intermediaries have become an important vehicle for implementing counter-cyclical policies aimed at mitigating the adverse effects of the crisis on credit market workings and economic activity.
As of 2009 development banks, FIRA and FR began to reduce credit to government entities in order to focus on private sector funding.
80 They have also tried
to migrate from direct or first tier credit to second tier schemes and the granting of credit guarantees to encourage funding and the more efficient use of capital.
81
Lending
As of June 2010, the total portfolio of development banks, FIRA and Financiera Rural was a nominal 422 billion pesos, equivalent to 17 percent of total loans granted by commercial and development banks. Of that balance, which rose by a real 4% year on year, 48 percent corresponded to first tier loans, 46 percent to second tier loans and the remaining 6 percent to loans granted as a Federal Government agent
82 (graph 47).
Given the reduction in Mexican financial market liquidity derived from the international financial crisis and in response to the April 2009 public health contingency, as of the third quarter of 2008, development banks, FIRA and FA participated more actively in first tier lending as part of diverse economic activity support programs. (box 8).
As of June 2009, the first tier loan portfolio registered real growth of 27 year on year while as of June 2010 growth was 14 percent year on year (graph 47a). Lower growth is due to the fact that between 2008 and 2009 loan placements reached historical levels on the back of support programs implemented to stave off the international financial crisis, and the payment of loans granted at the start of the crisis began to be reflected as of 2009.
79
The term development banking is used to refer to Banco Nacional de Obras y Servicios Públicos (Banobras), Nacional Financiera (Nafin), el Banco Nacional de Comercio Exterior (Bancomext), el Banco Nacional del Ejército, Fuerza Aérea y Armada (Banjército), el Banco del Ahorro Nacional y Servicios Financieros (Bansefi) and la Sociedad Hipotecaria Federal (SHF).
80 These changes were more marked at development banks, which between 2003 and 2007 reduced government sector financing and loans granted as the Federal Government’s financial agent by 66 percent overall. During the same period, development bank private sector financing increased from 31 to 50 percent of the total.
81 For example, between 2003 and 2007 second tier financing increased from 17 to 33 percent of development banks’ total portfolio.
82 Some modifications to provisions applicable to development banks issued by the CNBV concern the structure of the financial statements of such intermediaries. One of the more relevant ones was excluding from such accounting records loans granted as Federal Government agent as of 2007. Thus financial statements currently reflect only outstanding balances of loans granted before the provision came into effect while new loans are recorded in suspense accounts.

B A N C O D E M É X I C O
74
As of June 2010, Banobras and Bancomext accounted for 83 percent of first tier loans (graph 47b). Banobras’s portfolio grew a real 18 percent year on year while Bancomext’s decreased by 4 percent year on year. Banobras loans were mainly channeled to projects with their own funding source as well as to states and municipalities. The reduction in Bancomext credit was due to the fact that placements decreased by 20 percent year on year.
Regarding the second tier portfolio, Nafin, FIRA and SHF accounted for 95 percent as of June 2010 (graph 47c). As of that month this portfolio had grown by around a real 3 percent year on year, although the trend among institutions was uneven. For Nafin, second tier credit grew 28 percent. This was mainly due to the Production Chains program which supports domestic suppliers of large companies and the Federal Government.

F I N A N C I A L S Y S T E M R E P O R T
75
Box 8
Development bank response to international crisis and public health emergency1/
Program Sector Objective and Description Bank Period
Funding of financial intermediaries
Business/ retail
Provide liquidity to small and mid-sized businesses through immediately available lines of funding. Increase in eligible amount of credit.
Nafin Ongoing
Guarantees Business/
retail
Promote loans to small and mid-sized businesses and microcredit with guarantees of up to 8 percent of first losses on loans of up to 3.26 million UDIs.
Nafin Ongoing
Emergency support due to FX volatility
Business/ retail
Support big job-generating companies with credit lines and extra time to negotiate dollar debt. 50 billion pesos made available with the backing of a one-billion-peso counter-guarantee fund from the SHCP.
Nafin-Bancomext
4Q08
Rollover of market debt
Business/ retail
Restore confidence in the securities markets by guaranteeing up to 50 percent of issues (issuers float paper with minimum guarantee of 1.5 to 1 by Nafin)
Nafin-Bancomext
Jun-09
Automotive industry support
Business/ retail
Authorized resources of 6 billion pesos to open credit lines for auto loan firms, 2.8 billion pesos in market guarantees for structured issues, and 2.8 billion pesos for guaranteeing first losses by banks that finance distributors.
Nafin-Bancomext
Nov-09
Funding for auto parts exporters
Business Program based on loan guarantees to commercial banks to cover political risk and buyer risk in operations: US$120mn as of June 2010
Bancomext Jul-11
Market guarantee (unsecured debt)
Financial/ housing
Support to mortgage Sofoles and Sofomes, guaranteeing 65 percent of securities certificate issues in order to replace unsecured paper. SHF, banks, and mortgage Sofoles-Sofomes signed an agreement on May 11, 2009, that covered all unsecured debt expiring in 2009-2010, and guaranteeing their funding until May 11, 2012. Banks commit to roll over the paper with SHF guarantee.
SHF May-09
Liquidity lines Financial/ housing
Support for mortgage Sofoles-Sofomes through collateralized credit lines that allow them to meet liquidity requirements. Collateral included individual and bridge loans.
SHF 4Q08-1Q09
Liquidity support for work in progress
Financial/ housing
Opening of funding lines to provide liquidity for unfinished products due to lack of funding by the financial intermediary or funding structure. Projects had to be viable, and additional funding from SHF has payment preference over credit drawn to date.
SHF 4Q08 - present
Market support for mortgage-backed securities (RMBS)
Financial/ housing
SHF continued to support the market for mortgage-backed securities, buying up certificates in primary issues (public-private certificates identical to RMBS) and existing issues on the secondary market.
SHF Ongoing
Bridge loan reactivation
Financial/ housing
Accelerated reactivation of bridge loans by SHF in order to avoid interrupting stream of housing production. Funding mainly for Infonavit- and Fovissste-type housing loans.
SHF Ongoing
Liquidity support for work in progress
Infrastructure Provide liquidity to works in progress, distributed through financial brokers and direct company loans.
Banobras 2S09
State revenue stabilization fund
Infrastructure
Create a general scheme for setting up private trusts in order to empower the resources of the State Revenue Stabilization Fund so that state governments could deal with the reduction in federal tax income allocated to states
Banobras Ongoing
Support for agribusiness lending
market
Agribusiness/ rural
Meet extraordinary demand for loans to companies and producers, who found traditional credit channels closed
FIRA Ongoing
New loans Business/
retail
7.5 billion pesos in new loans to small and mid-sized businesses with new loans of up to 2 million pesos at a rate of 12 percent, with grace period for principal and no real guarantees. At the close of 2009, 23,039 companies had received support totaling 10.37 billion pesos.
Nafin Nov-09
Restructuring Tourism Support to small and mid-sized companies through restructuring of existing loans with Nafin guarantee, maintaining rates and extending terms
Nafin Nov-09
Flu Emergency Support
Tourism / air travel
Loans and guarantees of up to 7.7 billion pesos; loans and guarantees to tourism industry of up to 5 billion pesos; loans to airline industry of up to 2.7 billion pesos.
Bancomext Nov-09
1 The portfolio of loans from development banks, FIRA and Financiera Rural rose by 28 percent in the last quarter of 2008, and in 2009 it rose
7 percent. By the first half of 2010, almost none of the loan portfolio flows were related to bailout programs. Source: Banco de México, Nafin, Bancomext, Banobras, SHF and FIRA.
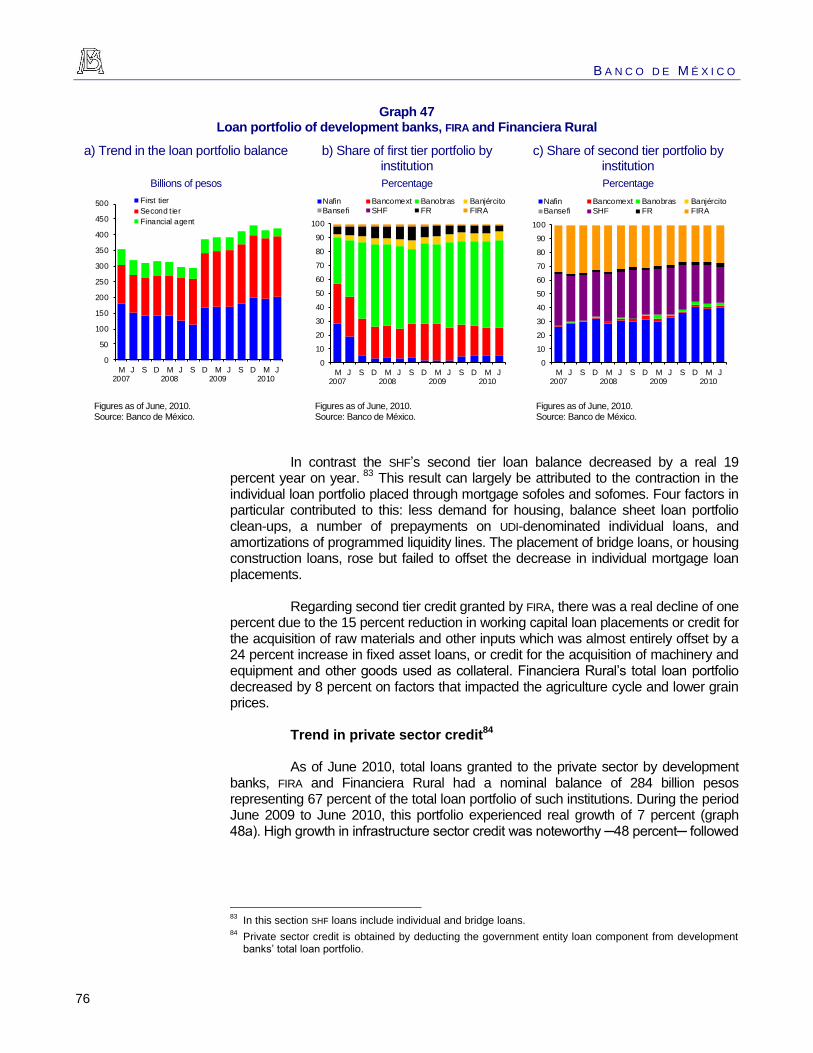
B A N C O D E M É X I C O
76
Graph 47 Loan portfolio of development banks, FIRA and Financiera Rural
a) Trend in the loan portfolio balance b) Share of first tier portfolio by institution
c) Share of second tier portfolio by institution
Billions of pesos Percentage Percentage
0
50
100
150
200
250
300
350
400
450
500
M2007
J S D M2008
J S D M2009
J S D M2010
J
First tier
Second t ier
Financial agent
0
10
20
30
40
50
60
70
80
90
100
M2007
J S D M2008
J S D M2009
J S D M2010
J
Nafin Bancomext Banobras Banjército
Bansefi SHF FR FIRA
0
10
20
30
40
50
60
70
80
90
100
M2007
J S D M2008
J S D M2009
J S D M2010
J
Nafin Bancomext Banobras Banjército
Bansefi SHF FR FIRA
Figures as of June, 2010. Source: Banco de México.
Figures as of June, 2010. Source: Banco de México.
Figures as of June, 2010. Source: Banco de México.
In contrast the SHF’s second tier loan balance decreased by a real 19 percent year on year.
83 This result can largely be attributed to the contraction in the
individual loan portfolio placed through mortgage sofoles and sofomes. Four factors in particular contributed to this: less demand for housing, balance sheet loan portfolio clean-ups, a number of prepayments on UDI-denominated individual loans, and amortizations of programmed liquidity lines. The placement of bridge loans, or housing construction loans, rose but failed to offset the decrease in individual mortgage loan placements.
Regarding second tier credit granted by FIRA, there was a real decline of one percent due to the 15 percent reduction in working capital loan placements or credit for the acquisition of raw materials and other inputs which was almost entirely offset by a 24 percent increase in fixed asset loans, or credit for the acquisition of machinery and equipment and other goods used as collateral. Financiera Rural’s total loan portfolio decreased by 8 percent on factors that impacted the agriculture cycle and lower grain prices.
Trend in private sector credit84
As of June 2010, total loans granted to the private sector by development banks, FIRA and Financiera Rural had a nominal balance of 284 billion pesos representing 67 percent of the total loan portfolio of such institutions. During the period June 2009 to June 2010, this portfolio experienced real growth of 7 percent (graph 48a). High growth in infrastructure sector credit was noteworthy ─48 percent─ followed
83
In this section SHF loans include individual and bridge loans. 84
Private sector credit is obtained by deducting the government entity loan component from development banks’ total loan portfolio.

F I N A N C I A L S Y S T E M R E P O R T
77
by the business sector with 20 percent. Housing sector credit shrank by 16 percent over the same period.
85
Graph 48 Development bank, FIRA and Financiera Rural loan portfolio
a) Trend in the total loan portfolio and share by institution
b) Trend in private sector lending by activity 1/
Left axis: billions of 2002 pesos Right axis: percent
Billions of 2002 pesos
-20
-10
0
10
20
30
40
0
50
100
150
200
250
300
350
M
2007
J S D M
2008
J S D M
2009
J S D M
2010
J
Nafin BancomextBanobras BanjércitoBansefi SHFFR FIRAYoY Change QoQ Change
0
50
100
150
200
250
M
2007
J S D M
2008
J S D M
2009
J S D M
2010
J
Business or commercial
Housing
Infrastructure
Agrobusinesses
Consumption
Figures as of June, 2010. Source: CNBV and Banco de México.
Figures as of June, 2010. Source: CNBV and Banco de México.
1/ When comparing with other sections of the Report it should be taken into account that private sector lending by activity includes first and second tier loans.
Between June 2009 and June 2010 Banobras’ role as an infrastructure funding supplier strengthened such that credit granted in 2009 was 2.9 times the average of the previous six years. The institution granted loans for around 34 billion pesos, 23.0 percent of which was allocated to highway credit and 11.3 percent to water treatment plant, electricity and other construction projects and loans.
Nafin and Bancomext have provided financial support to companies in specific production sectors that have experienced less access to private funding. Thus the private sector credit balance of both institutions increased by a real 20 percent year-on-year as of June 2010. 80 percent of the amount placed by Nafin was channeled through the Production Chains program. Energy savings and vehicle renewal programs (taxis, fleets, cargo and urban) which had operated 1,000 and 40 million pesos as of the first half of 2010 stood out. Likewise, in order to confront the financial and public health crisis SME support programs were strengthened and companies in the air tourism industry were targeted for funding. Around 95 percent of the credit placed by Bancomext consisted of first tier loans; recipients included tourism, the in-bond export industry, and the auto and autoparts sectors. Furthermore, the institution plans to resume a vocation similar to Eximbank’s
86 offering products such as
85
Loans granted to the housing sector consist almost entirely of second tier loans granted by the SHF (they include individual and bridge loans) plus first tier mortgages granted by development banks, FIRA and Financiera Rural.
86 Export-Import Bank of the United States. The United State’s official export credit agency which supports the exports of US goods abroad by extending guarantees, insurance and loans.

B A N C O D E M É X I C O
78
letters of credits, international factoring and financial support for ecologically sustainable projects.
The balance of credit granted to the housing sector as of June 2010 decreased by 16 percent in real annual terms contrasting with a 30 percent annual increase as of June 2009 due to a let-up in credit placement and clean-up of the loan portfolio due to foreclosures implemented through the trust concept. The withdrawal of support granted by the SHF during the crisis has been gradual, as loans with longer terms were granted and market confidence has not fully returned to this sector. As explained in the sofoles and sofomes section, these intermediaries have run into difficulties with access to wholesale funding. As long as such problems continue, development banks will remain their main source of funding.
Between June 2009 and June 2010 credit granted by FIRA and Financiera Rural to the agribusiness sector decreased by 3 percent in real terms due to a recovery in private funding sources for agrifood and higher income producers, a lower cultivated surface area and lower grain prices, among other factors.
Loans guarantees
Loan guarantees have accounted for a large percentage of development bank, FIRA and Financiera Rural transactions (box 9). While such transactions are not usually counted as part of the credit flow or the total loan portfolio of development banks, they have a major impact on the credit supply.
87 The nominal balance of
guarantees extended by such institutions totaled 97 billion pesos as of June 2010, or 23 percent of the total loan portfolio balance (graph 49b).
88 As of the same month 38
percent of loans were secured on average (graph 49c). The credit is ultimately granted by commercial banks, non-bank banks and loan portfolio sale structures.
87
In some cases guarantees granted by development banks, FIRA and Financiera Rural are managed through trusts and so they are not necessarily reflected in the financial statements of these institutions.
88 The guarantee amount refers to the contingent balance defined as the maximum exposure the guarantor is subject to if the guarantee is exercised.

F I N A N C I A L S Y S T E M R E P O R T
79
Box 9
Development bank loan guarantees
A loan guarantee is a payment security instrument, the issue of which irrevocably obliges a bank (the guarantor) to pay a sum of money to a third party (the beneficiary) in the event the party taking out the guarantee (the principal) defaults on its obligations. Upon issuing the guarantee, the guarantor acquires an obligation that is independent and separate from the contractual obligation between the creditor and the primary borrower.
Development banks use this type of instrument to encourage retail banks to offer credit. Through a loan guarantee program, development banks share the risk of default with the retail bank and thus increase the universe of eligible borrowers.
Development banks currently have various loan guarantee programs each focused on a sector served by the individual institutions. Within each of these programs, there are products aimed at various sectors with specific characteristics.
Nafin offers guarantees to facilitate companies' access to long-term funding from retail banks, through a trust (FISO 1148-0):
Automatic guarantee. Provided to support portfolios of individual loans of up to 3.26 million UDIs to micro, small and mid-sized businesses, authorized through similar credit processes and characteristics. Case-by-case authorization from Nafin is not necessary to guarantee transactions, which are governed by the principle of non-discretional integration of the portfolio. May be negotiated on a pari passu, shared-risk, or first-loss basis.
Selective guarantee and market guarantee. The purpose is to provide public and private sector companies and individuals engaged in business activities who have eligible investment projects and coincide with the area that Nafin promotes with access to bank loans or market credit through the financial system. This may be negotiated on a first-loss, last-loss, or pari passu basis.
Use of credit Percentage guaranteed
Fixed assets Up to 70 percent of the bank loan.
Working capital
Up to 50 percent of the bank loan.
Acquisition of machinery
and equipment
Up to 80 percent of the bank loan.
Technological development
Up to 80 percent of the loan for micro and small businesses; up to 75 percent for mid-sized companies; and up to 70 percent for large companies.
Source: Nafin.
Bancomext covers Mexico's export and banking community against the risks of failure to pay credit extended, from the productive cycle phase to the retailing of the exported good or service:
Liquid guarantee for promotion of export companies (GLIEX). Guarantees, through financial intermediaries, loans of one to two million dollars, automatically, with preset ratings. Coverage is determined on the basis of the loan
guarantees: 70 percent if the loan has real guarantees at 2 for 1; and 50 percent in other cases.
Automatic guarantee. Guarantees ongoing credit to financial intermediaries for amounts of up to one million dollars or their equivalent in pesos, with a coverage of up to 75 percent. Designed to support export companies and foreign revenue generators as well as small and mid-sized businesses.
Selective guarantee. Designed to support investment projects smaller than 30 million pesos. Authorized on a case by case basis through a credit study by Bancomext; coverage is up to 50 percent.
Versatile selective guarantee. Designed to back investment projects for up to 30 million pesos or their equivalent in dollars. Authorized on a case-by-case basis through a credit study by the financial intermediary, and analyzed by Bancomext; coverage of up to 50 percent.
For the Federal Mortgage Society SHF: 1
Default guarantee (DG): Provides security to financial brokers in the recovery of home mortgages granted to end borrowers. SHF guarantees first losses to the financial intermediary for up to 25 percent of the outstanding balance of the loan and up to 100 percent for federally-subsidized programs. Negotiation can be on a pari passu or first-loss basis.
Timely payment guarantee (TPG). This instrument backs prompt payment to lenders among financial firms for an established percentage of the loans they obtain for building homes (in general, TPGS guarantee payment by a Sofol to a bank). These include both first-loss and pari passu guarantees.
Mortgage loan insurance. Its purpose is to provide a credit tool that facilitates the development of the secondary market, allowing for the transference of credit risk and providing capital to financial institutions. Has the same characteristics as the DG, but is operated by SHF's insurance arm, so it is known as the DPI.
Minimum wage-UDI swap. This type of guarantee covers the risk of possible extraordinary or permanent decreases in the minimum wage in real terms, to allow borrowers to repay an UDI-denominated home mortgage in minimum wage terms.
Finally, for Banobras, timely payment guarantees are a partial credit guarantee that guarantees the lender prompt repayment of principal and/or interest on a loan it has granted. It may also cover timely repayment of a PPS contract payment obligation, or the repayment of principal and/or interest of a debt market securities issue. This product is aimed at state and municipal governments and projects with their own payment source in infrastructure-related operations.
1 As of March 5th, 2009 SHF's insurance arm began operations, taking
over the existing default guarantees (dg).

B A N C O D E M É X I C O
80
Graph 49 Guaranteed loan balances of development banks, FIRA and Financiera Rural
a) Trend in the guaranteed loan balance of each institution
b) Guaranteed loan balance as a percentage of each institution’s loan
portfolio
c) Average percentage guaranteed by institution
Billlions of 2002 pesos Percentage Percentage
0
10
20
30
40
50
60
70
80
J2009
S D M2010
J
Nafin Bancomext Banobras BanjércitoBansefi SHF FR FIRA
0
10
20
30
40
50
60
J2009
S D M2010
J
Nafin Bancomext
Banobras SHF
FIRA
0
10
20
30
40
50
60
70
80
J2009
S D M2010
J
Nafin Bancomext
Banobras SHF
FIRA
Figures as of June, 2010. Source: Banco de México.
Figures as of June, 2010. Source: Banco de México.
Figures as of June, 2010. Source: Banco de México.
At the end of the first half of 2010 the balance of collateral granted by development banks had decreased by 5 percent year on year in real terms due mainly to a 27 percent reduction in the balance of collateral granted by the SHF.
89
As of June 2010 Nafin and FIRA collateral balances displayed real year on year increases of 9 and 6 percent, respectively. At Bancomext the collateral portfolio rose by 40 percent year on year due to strong growth in letters of credit and collateral size. Ninety percent of collateral corresponded to letters of credit and guarantees, and 87 of guarantees granted by Nafin were channeled through its automatic guarantees program to small and medium-sized businesses, or pymes. The rest were divided between bond issue guarantees (5 percent) and a guarantee extended for the construction of Terminal II of the Mexico City International Airport (7 percent), half of which corresponds to Banobras. Likewise, Banobras’s collateral balance decreased by a real 9 percent year on year due to secured loan amortizations, and all of the guarantees granted were for federal, state and municipal infrastructure projects.
The guaranteed loan balances of development banks are partially backed by counter-guarantee funds for up to 7 billion pesos granted by various Federal Government entities such as the Ministry of the Economy, the Ministry of Finance and Public Credit (SHCP) and the Agriculture Ministry (SAGARPA), among others. The corresponding funds partially cover the losses development banks would incur in the event of a default by borrowers. Finally, credit inducement generated by guarantees
89
This decrease is because the insurance company Seguros de Crédito a la Vivienda, which is an SHF subsidiary that began operating in March 2009, assumed some of the loan default guarantees the SHF
had granted. As at June 2010 the transfer of SHF default guarantees to its insurance company amounted to 5.222 billion pesos. This transfers represents 20 percent of the guarantee amount granted on the same date by the SHF, 72 percent of which corresponded to loan default guarantees and the other 28 percent to timely payment guarantees.

F I N A N C I A L S Y S T E M R E P O R T
81
totals 256 million pesos, representing an average 2.6 pesos of credit granted for each peso guaranteed (graph 50a).
90
Graph 50 Trend in guarantees extended by development banks, FIRA and Financiera Rural
a) Pesos of final credit for each peso guaranteed (credit induction by institution)
b) Performance of credit induced by institution as of June 2010
Times Percentage
2.25 2.05
3.05
4.11
1.60
0.0
0.5
1.0
1.5
2.0
2.5
3.0
3.5
4.0
4.5
Nafin Bancomext Banobras SHF FIRA
0
10
20
30
40
50
60
70
80
90
100
Nafin BancomextBanobras SHF FIRA
Guaranteed Empowered
Figures as of June, 2010. Source: Banco de México.
Figures as of June, 2010. Source: Banco de México.
Development bank loans and guarantees were granted at rates and premiums in accordance with risks associated with the financial crisis and the swine flu contingency. As a result, as different borrowers’ access to private funding sources has normalized, most loans granted as part of support programs are being repaid on time. Likewise many borrowers have managed to refinance their debt with development banks, in some cases by making prepayments. Therefore the increase in such institutions’ interest income should also gradually decrease (graph 51a).
Meanwhile development banks’ capital adequacy ratio has been 16.0 percent on average over the last three years. As of June 2010 this index was 17.5 percent.
91 As of the same date 80.0 percent of the portfolio comprised minimum and
low-risk loans, 4.0 percent high-risk loans while the other 16 percent did not have to be graded as the loans were granted to public sector entities.
92
90
The guarantees induced balance refers to the total amount of credit granted and includes the guaranteed portion (Banco de México estimates).
91 FIRA and Financiera Rural are not banks, so they do not calculate a capital adequacy ratio.
92 “A” and “B” graded portfolios are considered minimum and low risk, while “C”, “D” and “E” are considered high risk.

B A N C O D E M É X I C O
82
Graph 51 Development bank, FIRA and Financiera Rural financial ratios
a) YoY interest income b) YoY reserve creation by loan risk c) Development banks’ YoY net profit
Billion pesos Billion pesos Billion pesos
11.5
12.0
12.5
13.0
13.5
14.0
14.5
15.0
15.5
16.0
J2008
S D M2009
J S D M2010
J
0
1
2
3
4
5
6
7
8
J2008
S D M2009
J S D M2010
J
0
2
4
6
8
10
12
J2008
S D M2009
J S D M2010
J
Figures as of June, 2010. Source: CNBV and FIRA.
Figures as of June, 2010. Source: CNBV and FIRA.
Figures as of June, 2010. Source: CNBV and FIRA.
As of the end of the first half of 2010 there was a 48.4 percent increase in the past due loan portfolio of development banks, FIRA and Financiera Rural compared with the same period in 2009, due mainly to an increase in SHF past due loans which grew 101.0 percent. 90.0 percent of the past due loans are concentrated in SHF, FIRA, Financiera Rural and Bancomext (graph 52a).
Between June 2009 and June 2010 the coverage ratio decreased from 323 percent to 208 percent (graph 52b). Meanwhile the delinquency index remained below 3.5 percent. The adjusted delinquency index behaved similarly to the latter, as neither Nafin nor SHF apply write-offs. The average adjusted delinquency index for the period was 2.8 percent (graph 52c).

F I N A N C I A L S Y S T E M R E P O R T
83
Graph 52 Development banks, FIRA and Financiera Rural: risk and coverage ratios
a) Past due loans b) Coverage ratio 1/ c) Delinquency index and adjusted
delinquency index 2/
Billion pesos Percentage Percentage
0
2
4
6
8
10
12
14
16
M2007
J S D M2008
J S D M2009
J S D M2010
J
Nafin Banobras Bancomext
SHF Banjército FR
FIRA
0
500
1,000
1,500
2,000
M2007
J S D M2008
J S D M2009
J S D M2010
J
Nafin Banobras
Bancomext SHF
Banjército FR
FIRA Total
0.0
0.5
1.0
1.5
2.0
2.5
3.0
3.5
4.0
M2007
J S D M2008
J S D M2009
J S D M2010
J
Delinquency index
Adjusted delinquency index
Figures as of June, 2010. Source: CNBV and FIRA.
Figures as of June, 2010. Source: CNBV and FIRA.
Figures as of June, 2010. Source: CNBV and FIRA.
1/ Preventive estimates for loan risks as a percentage of past due loans. 2/ The adjusted delinquency index is the past due loan ratio plus loans written off during the previous twelve months divided by the total loan portfolio
plus the portfolio written off during the previous twelve months.
Infonavit and Fovissste
The National Workers’ Fund (Instituto del Fondo Nacional de la Vivienda para los Trabajadores, Infonavit)
93 is the main provider of mortgages in Mexico
focusing mainly on the lower-income segment. As of June 2010, the institution had a loan portfolio 1.5 times the combined mortgage portfolios of commercial banks and mortgage sofomes (graph 53). Meanwhile, in the first half of 2010, the Public Sector Workers’ Fund (Fondo de Vivienda del ISSSTE, Fovissste)
94 had a
mortgage portfolio amounting to 151 billion pesos; the 2007 reforms undertaken by this institute enabled it to grant between then and June 2010 more loans (300,000 totaling 122 billion pesos) than all those granted throughout its 25-year history.
93
Infonavit manages employer contributions to a housing fund which grants mortgage loans to workers affiliated to the Mexican Social Security Institute, or IMSS, as well as yields on workers’ housing fund sub accounts. Infonavit manages the funds in conjunction with the worker, business and Federal Government.
94 Fovissste grants mortgage loans to workers affiliated with the State’s Employees Social Security and Social Services Institute (Instituto de Seguridad y Servicios Sociales de los Trabajadores del Estado, ISSSTE). Federal state-owned companies, administrative entities, decentralized entities, public autonomous entities and companies in which the government has a majority stake located within the Federal District, states and municipalities can become affiliates of ISSSTE (article 6 of the ISSSTE law).

B A N C O D E M É X I C O
84
Graph 53 Market development indicators
a) Mortgage loans by intermediary b) Mortgage loans by originator (January-June, 2010)
c) Mortgage portfolio delinquency
Billion pesos Thousand loans Percentage
0
100
200
300
400
500
600
700
800
M2007
J S D M2008
J S D M2009
J S D M2010
J
Infonavit Fovissste
Banks Sofomes
217
56 42
33
148 133
0
50
100
150
200
250
Info
navit
Fin
in
st
Fon
ha
po
Fovis
sste
Go
v o
rg.
1/
Oth
er
entitie
s
0
5
10
15
20
25
2007 2008 2009 2010
InfonavitFovisssteBanksSofomes
Figures as of June, 2010. Source: Banco de México and AMFE.
Figures as of June, 2010. Source: Conafovi.
Figures as of June, 2010. Source: Infonavit, Fovissste, AMFE and CNBV.
1/ Government entities include: SHF, Banjército, Conavi, Fonhapo and state housing entities (orevis).
During 2009 there was a strong increase in Infonavit loans with payment extensions
95 due to a rise in unemployment. However, better economic conditions
in 2010 reduced that loan portfolio. Thus, as of June 2010 the past due loan portfolio accounted for 7 percent of the total loan portfolio and 12 percent including the loan portfolio with payment extensions. Although Infonavit funding covers income brackets that are more sensitive to economic conditions, loan delinquency levels are comparable with those of commercial banks and below those of other financial intermediaries such as mortgage sofomes. This is because mortgage loan payment amortizations are deducted directly from the payroll. Fovissste loan delinquency is less sensitive to economic conditions because the institute serves government workers (graph 53c).
Infonavit draws its funding mainly from employer contributions 96
and the amortization of previously granted loans. Thus the drop-off in economic activity in 2009 had a strong impact on the institute’s revenues. In order to meet its loan granting targets, which were not scaled back despite the crisis, Infonavit resorted to alternative funding sources, such as the issuance of mortgaged-backed securities. As a result, revenues from the placement of Certificados de Vivienda (Housing Certificates or cedevis
97) increased from 11 percent of total revenues in
December 2009 to 14 percent in June 2010 (graph 54a). At the same time, in order to narrow the country’s housing gap,
98 Infonavit has created several
95
Unlike other intermediaries that grant mortgage loans when Infonavit affiliated workers lose their job they have the legal right to request a payment extension of up to twelve months on their mortgage loan (during two discontinuous periods with a 24 month limit). At the end of the extension period the loan is considered past due after 90 days in arrears, unlike other intermediaries like banks or sofomes which do not manage extensions.
96 The rest of the funds come from mortgage loan portfolio-backed securities.
97 These certificates are secured so there is no specific guarantee.
98 Four variables are usually used to measure the housing gap: households without a home, over-occupied homes, homes built using precarious materials and homes built using regular materials. The most precise source regarding the housing gap are consistent surveys over time, such as ENIGH conducted by

F I N A N C I A L S Y S T E M R E P O R T
85
mortgage programs under which lower income workers can obtain mortgages at a subsidized interest rate.
99 It has also raised credit limits, come up with mortgage
financing options and developed loan schemes in conjunction with commercial banks and mortgage sofomes.
Like Infonavit, Fovissste’s main source of revenue is loan contributions and amortizations as well as interest on investments, which as of the end of 2009 accounted for 8 percent (graph 54b). During 2009 this institution began to issue mortgage-backed securities. Thus, as of August 2010, Infonavit had floated 33 cedevis issuances amounting to 57.3 billion pesos in all. Meanwhile Fovissste has placed 7 issuances amounting to 28.6 billion pesos.
100 The amounts of the
Infonavit and Fovissste issuances represent 8 and 20 percent of their respective total loan portfolios (graph 55a).
INEGI. Based on this survey, the housing gap in its broadest sense was 9.6 million homes in 2008, although it came down from 43 percent of homes in 2000 to 36 percent in 2008. Counting only households without a home, in 2008 the housing gap was 500,000 homes.
99 In addition to traditional mortgage loan programs Infonavit offers financing programs aimed at expanding the financing of homes to unaffiliated sectors of the workforce, such as Cofinavit Ingresos Adicionales (Additional Income Cofinavit), a program aimed at workers who supplement their payroll wages with additional income which increases their financing capacity; this program is cofinanced by other banks; Infonavit para Todos (Infonavit for Everyone), a pilot program to grant financing to workers with no social security in terms of housing and savings but the capacity to make recurring contributions; it mostly focuses on the domestic workforce and aims to cover businessmen registered with the Mexican Tax Office (SAT) under the Small Taxpayers Regime (repecos); and Infonavit Total (Total Infonavit) a program under which commercial banks grant loans to workers earning more than six times the minimum wage. The financing is granted jointly by the institute and a bank and Infonavit’s infrastructure is used to generate and manage the mortgage loans.
100 Infonavit securitized part of its loan portfolio (2,513 million pesos) through Hito, a Sofom, by using the Danish securitization model for mortgage backed securities. Similarly, Fovissste securitized 5,516 million pesos of its total loan portfolio.

B A N C O D E M É X I C O
86
Graph 54 Source and use of funds
a) Source of Infonavit funds b) Source of Fovissste funds c) Use of Infonavit and Fovissste funds
Billions of pesos Percentage Thousands of loans
0
20
40
60
80
100
120
140
2007 2008 2009 2010
Contributions 35%
Recoveries 49%
Cedevis 14%
Other income 2%
Contributions60%
Recoveries15%
Portfolio clean-up
9%
Other income
8%
Investment income
8%
0
500
1,000
1,500
2,000
2,500
3,000
3,500
4,000
Infonavit Fovissste
Before 2000 After 2000
Figures as of June, 2010. Source: Infonavit.
Figures as of December, 2009. Source: Fovissste.
Figures as of June, 2010. Source: Infonavit and Fovissste.
Graph 55 Mortgage-backed securities
a) Outstanding mortgage-backed securities
b) Holders of mortgage-backed securities
c) Securitized portfolio as a percentage of the amount
Billions of pesos Billions of pesos Percentage
0
10
20
30
40
50
60
70
80
90
J2007
A J O J2008
A J O J2009
A J O J2010
A J
CedevisBorhis sofomesBorhis banksFovissste
0
10
20
30
40
50
60
M2008
J S D M2009
J S D M2010
J A
Siefores
Local companies
Development banks
Other
0.7
0.8
0.9
1.0
1.1
1.2
1.3
1.4
1.5
E2007
A J O E2008
A J O E2009
A J O E2010
A J
BorhisCedevisFovissste
Figures as of August, 2010. Source: Banco de México.
Figures as of August, 2010. Source: Banco de México.
Figures as of June, 2010. Source: BMV.

F I N A N C I A L S Y S T E M R E P O R T
87
4.5. Insurance companies.
The insurance sector accounts for 6.2 percent of the financial system’s assets. In contrast to other countries, the sector was not directly affected by the international financial crisis. However, it did not go completely unscathed by an adverse macroeconomic environment. In recent years direct premiums
101 have
registered increasingly lower growth with a modest recovery as of March 2009 (graph 56c). Thus at the end of the second quarter of 2009 direct premiums had increased 6.1 percent in real terms compared with the same year-ago period while for the second quarter of 2010 real growth was 3.0 percent.
102
The insurance segment that registered the strongest growth in the second quarter of 2010 was pensions as a result of the Social Security Laws (82.6 percent in real terms compared with the same year-ago period), although its market share remains low at just 6.4 percent of the insurance sector portfolio (graph 56a). Growth within the pension insurance segment can be largely traced to measures related to operating and marketing schemes, which has resulted in greater transparency when deciding which insurance company will pay the pension.
103 Life insurance remains the largest segment, contributing 39.6 percent
of insurance sector premiums. At the end of the first half of 2010 insurance premiums accounted for 1.9 percent of annual GDP (graph 56b), with such financial services showing a trend toward a greater penetration of the Mexican economy.
Claims grew 3.0 percent in nominal terms in the first half of 2010 compared with the same period in 2009 (life and auto insurance account for 69.8 percent of the average cost of claims). But claims decreased as a percentage of direct premiums, so the sector as a whole has managed to improve the premiums/claims ratio.
In 2008 insurance sector operating losses grew in relation to previous years. This situation arose out of a net increase in life and pension insurance technical reserves under the Social Security Laws. This increase is due to the fact that both pensions and reserves grow each year based on inflation as well as the effect of diverse amendments to the Social Security Act. In recent years such amendments have generated average increases of 11 percent in pensions when pensioners meet certain requirements.
104 While this liability is covered by IMSS
transfers to insurance companies, for accounting purposes the increase in reserves is recorded as an operating loss.
101
The premium is the amount the insurance company charges the policyholder for the coverage granted. The premiums issued are the policies underwritten by an insurance company. Direct premiums are the total amount of net premiums corresponding to policies and endorsements issued to policyholders for a given period of time and do not consider the acquisition of premiums generated by another insurance company or the transfer of premiums to another insurance company.
102 The growth rates presented were adjusted in order to annually apportion the effect of the premium corresponding to the multi-annual policy of Petróleos Mexicanos (PEMEX) insurance in order to offer a more precise analysis of sector dynamics.
103 The main factors considered in the new scheme facilitate policyholders’ comparison of the amount of pension different companies are offering while encouraging sector competition by enabling insurance companies to use different discount rates and biometric bases for projecting the pension.
104 See the January 5th 2004 Decree that amends and adds to provisional articles fourteen and twenty of the Decree which reforms and adds diverse provisions of the Social Security Act of December 20th, 2001.

B A N C O D E M É X I C O
88
Graph 56 Market development indicators
a) Premium structure b) Direct premiums 1/ 2/ 3/
c) Direct premiums3/
Percentage Percentage of GDP Real year-on-year percentage change
Pensions 6.4%
Life39.6%
Auto20.2%
Damage w/o autos
18.6%
Accidents and sickness15.2%
0.00
0.50
1.00
1.50
2.00
2.50
2005 2006 2007 2008 2009 2010
-2
0
2
4
6
8
10
12
14
16
18
M2007
J S D M2008
J S D M2009
J S D M2010
J
Figures as of June, 2010. Source: CNSF.
Figures as of June, 2010. Source: CNSF and INEGI.
Figures as of June, 2010. Source: CNSF and Banco de México.
1/ 2010 figures are annualized for comparison purposes. 2/Direct premiums are the total amount of net premiums corresponding to policies and endorsements issued to policyholders over a given period and do
not take into account the acquisition of premiums generated by another insurance company or transfer of premiums to another insurance company. 3/ The series were adjusted in order to annually apportion the effect of the premium corresponding to the multi-annual policy of Petróleos Mexicanos
(PEMEX).
An analysis of returns in this sector shows that retained premiums have been enough to cover main balance sheet debt. In particular, over the last four years premiums have supported claims, higher reserves and acquisition costs and have partially covered operating expenses. Likewise, the sector has managed to increase returns on the back of revenue from investments. Profit derived from financial product income grew a real 2.2 percent year on year in June, 2010 compared with the same year earlier month (graph 57%). There has been a marginal improvement in overall sector efficiency.
The combined index,105
which reflects premium generation and management capacity, remained stable between June 2009 and June 2010 at around 97.7 percent. Thus at the end of that period premium adequacy was 2.3 percent compared with -0.7 percent at the end of 2009.
105
The combined index measures the technical return of an insurance company and assesses the capacity of revenues generated by premiums to cover the company’s insurance costs. The index is the sum of three indicators: a) net acquisition cost as a percentage of retained premiums: this indicator shows the direct cost for each peso of retained premium (premium issued less premiums assigned in reassurance); in other words, direct costs generated by policy sales; b) claim cost as a percentage of premiums paid: this indicator measures whether the level of claims the insurance company has paid out has been covered by revenues generated by policy sales once expenses generated by the increase in reserves (premiums paid) are deducted, and, finally; c) management cost as a percentage of premiums issued: this measures premium placement efficiency by evaluating the insurance company’s total expense for each peso of premium placed.

F I N A N C I A L S Y S T E M R E P O R T
89
Graph 57 Profitability
a) Net Profit b) Business year profit and financial products
1/
c) Combined index 2/
Percentage of assets Billion pesos Percentage
3734 33 33
4.25.8 6.0 5.4
6.7 7.7 7.0 7.8
6.3 5.8 5.5 5.3
22 2020 19
3.02.9
2.7 2.5
0
5
10
15
20
25
30
35
40
45
2007 2008 2009 2010
Otherexpenses
Operatingexpenses
Claims
Acquisitioncost
Inc. Reserves
Otherexpenses
Financialliabilities
Retainedpremium
-20
-15
-10
-5
0
5
10
15
20
25
2005 2006 2007 2008 2009 2010
Financial products
Operating profit
Net profit
0
20
40
60
80
100
120
M2007
J S D M2008
J S D M2009
J S D M2010
J
Avg acquisition cost Avg claims cost
Avg operat ing cost
Figures as of June, 2010. Source: CNSF.
Figures as of June, 2010. Source: CNSF.
Figures as of June, 2010. Source: CNSF and AMIS.
1/ 2010 figures are annualized for comparison purposes. 2/A combined index of below 100 percent implies that the value assigned to the premium is sufficient to cover premium generation and management
costs as well as claims that occurred during the life of the insurance.
4.6. Non-bank financial institutions (sofomes y sofoles)106
As of June 2010 there were 1,704 multiple purpose financial institutions (sofomes) 23 regulated and 1,681 unregulated. 71 of them corresponded to institutions originally incorporated as limited purpose financial institutions (sofoles), financial leasing companies or financial factoring companies that opted to become sofomes; the other 1,633 were only recently created. Since 2007 there has been strong growth in the number of unregulated sofomes, although it is estimated that 70 percent of those authorized do not yet operate because they have not managed to obtain funding (graph 58a).
107
Unregulated sofomes are not required to disclose information to the financial authorities. However, those that tap the debt market for funding are subject to CNBV regulations and oversight like any other listed company. The Mexican Association of Specialized Financial Entities (AMFE) gathers and publishes information on its members. The information included in this section corresponds to financial companies that are members of AMFE (graph 58b).
108 109
106
Sofoles and sofomes are financial entities whose main objective is to grant credit to specific market niches. They can only obtain funding by issuing securities or through discounts with other banks, as they cannot obtain funding from deposits.
107 Source: Condusef, SHCP y Grupo Financiero Ixe.
108 Of the sofomes affiliated with AMFE, 19 grant loans to the mortgage sector, 17 to companies, 15 to the agro industrial sector, 7 to the auto sector, 14 to consumers and 2 grant micro loans. According to Condusef numbers, in June 2009 the assets of unregulated sofomes accounted for six percent of the private sector’s total loan portfolio. Sofoles and sofomes affiliated with AMFE have the most assets.
109 Hereinafter the term sofom(es) will be used to refer to unregulated sofomes, regulated sofomes and sofoles that are members of AMFE. This section will only use information from sofomes that are members of that association.

B A N C O D E M É X I C O
90
Graph 58 Sofomes y sofoles
a) Number of unregulated sofomes in operation b) Number of entities
30
12
11
1
0
200
400
600
800
1000
1200
1400
1600
1800
2007 2008 2009 2010
Transformed Sofomes NRE 1/
Newly created Sofomes NRE
Unregulated
sofomes(1681)
Sofoles
(20) Regulated
sofomes
(23)
Financial
companies that are
members of AMFE
Unregulated
sofomes (54)
Regulated
sofomes(5)
Sofoles
(15)
Figures as of June, 2010. Source: Condusef.
Figures as of June, 2010. Source: AMFE, CNBV and Condusef.
1/ The numbers over the top of each bar represent the number of sofomes that changed in each period.
As of June 2010 most of the portfolio of these intermediaries was concentrated in the mortgage and auto sectors (graph 59a). As of the second half of 2009 sofomes’ credit to these sectors began to ease so that by June 2010 it had declined by a real 21.4 and 4.4 percent, respectively. As graph 59b shows, there was a sharp decrease in the mortgage loan portfolio originated by sofomes while the mortgage loan portfolio originated by Banks and Infonavit was relatively stable.
The contraction sofomes lending was the result of problems with their business model, which depends both on their capacity to tap capital markets and securitize loans granted. Problems derived from the securitization of so-called US subprime mortgage loans and increase in the delinquency indexes of mortgage loans backing securities issued by some sofomes
110 in Mexico, led to demand for
securities issued by sofomes and sofoles virtually drying up (graph 60c). This, together with difficulties such intermediaries encountered obtaining funding in capital markets meant they had difficulty granting new loans.
110
The strong increase in the delinquency of borhis portfolios containing more recent loan vintages can be attributed to: i) less stringent loan granting criteria for recent issuances;; ii) the portfolio’s concentration in low-income borrowers; iii) a large part of the portfolio backing the issuances was originated in northern states which were severely impacted by the economic crisis; and iv) partial guarantees proved insufficient to absorb the losses. However, as at June 2010 no borhis issuance has defaulted.
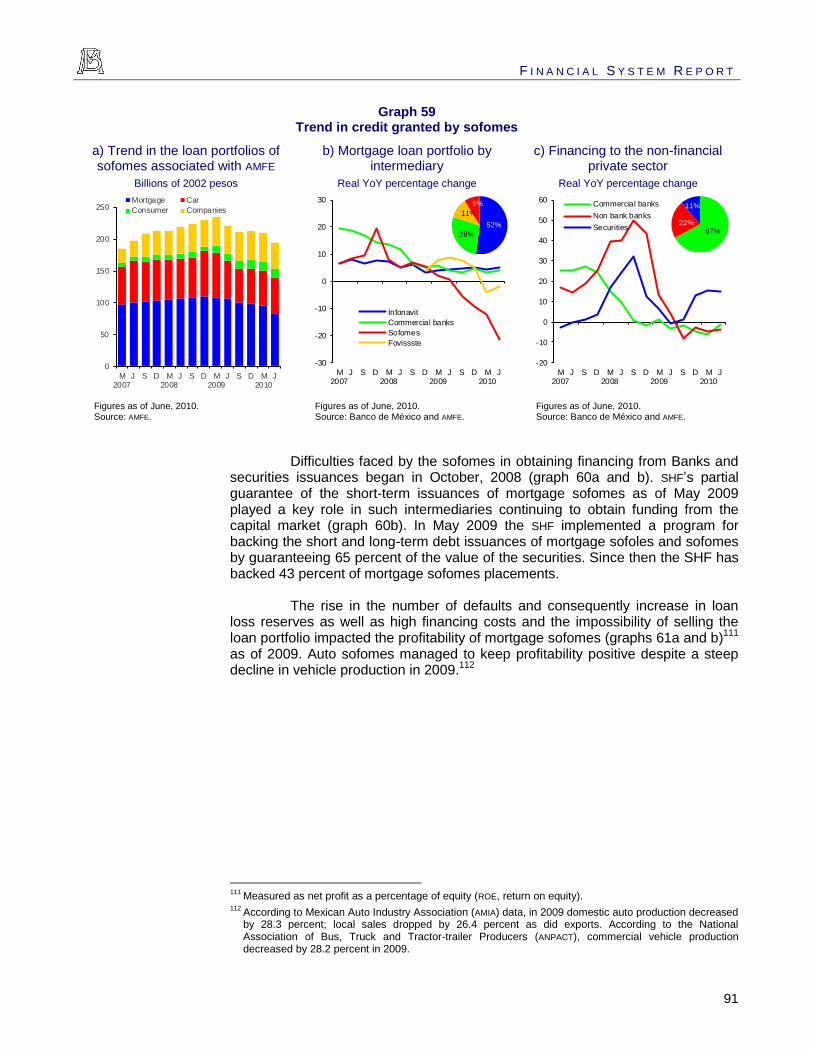
F I N A N C I A L S Y S T E M R E P O R T
91
Graph 59 Trend in credit granted by sofomes
a) Trend in the loan portfolios of sofomes associated with AMFE
b) Mortgage loan portfolio by intermediary
c) Financing to the non-financial private sector
Billions of 2002 pesos Real YoY percentage change Real YoY percentage change
0
50
100
150
200
250
M2007
J S D M2008
J S D M2009
J S D M2010
J
Mortgage Car
Consumer Companies
-30
-20
-10
0
10
20
30
M2007
J S D M2008
J S D M2009
J S D M2010
J
Infonavit
Commercial banks
Sofomes
Fovissste
52%
28%
11%
9%
-20
-10
0
10
20
30
40
50
60
M2007
J S D M2008
J S D M2009
J S D M2010
J
Commercial banks
Non bank banks
Securities 67%22%
11%
Figures as of June, 2010. Source: AMFE.
Figures as of June, 2010. Source: Banco de México and AMFE.
Figures as of June, 2010. Source: Banco de México and AMFE.
Difficulties faced by the sofomes in obtaining financing from Banks and securities issuances began in October, 2008 (graph 60a and b). SHF’s partial guarantee of the short-term issuances of mortgage sofomes as of May 2009 played a key role in such intermediaries continuing to obtain funding from the capital market (graph 60b). In May 2009 the SHF implemented a program for backing the short and long-term debt issuances of mortgage sofoles and sofomes by guaranteeing 65 percent of the value of the securities. Since then the SHF has backed 43 percent of mortgage sofomes placements.
The rise in the number of defaults and consequently increase in loan loss reserves as well as high financing costs and the impossibility of selling the loan portfolio impacted the profitability of mortgage sofomes (graphs 61a and b)
111
as of 2009. Auto sofomes managed to keep profitability positive despite a steep decline in vehicle production in 2009.
112
111
Measured as net profit as a percentage of equity (ROE, return on equity). 112
According to Mexican Auto Industry Association (AMIA) data, in 2009 domestic auto production decreased by 28.3 percent; local sales dropped by 26.4 percent as did exports. According to the National Association of Bus, Truck and Tractor-trailer Producers (ANPACT), commercial vehicle production decreased by 28.2 percent in 2009.

B A N C O D E M É X I C O
92
Graph 60 Sofomes’ funding sources
a) Credit granted by commercial banks to sofomes
b) Securities issuances by sofomes
c) Issuance of mortgage-backed bonds originated by sofomes
Billions of pesos Billions of pesos Billions of pesos
0
5
10
15
20
25
30
35
M2007
J S D M2008
J S D M2009
J S D M2010
J
0
10
20
30
40
50
60
M2007
J S D M2008
J S D M2009
J S D M2010
J
Mortgage sofom
Auto sofom
Financial sofom
0
1
2
3
4
5
6
7
M2007
J S D M2008
J S D M2009
J S D M2010
J
Figures as of June, 2010. Source: Banco de México.
Figures as of June, 2010. Source: Banco de México.
Figures as of June, 2010. Source: Banco de México.
Graph 61 Sofomes’ profitability
a) Net profit b) Return on equity (ROE) c) Fee income as a percentage of the total performing loan portfolio
Billions of 2002 pesos Percentage Percentage
-6
-5
-4
-3
-2
-1
0
1
2
3
4
M2007
J S D M2008
J S D M2009
J S D M2010
J
Mortgage
Auto
Personal loans
Corporate
-150
-100
-50
0
50
M2007
J S D M2008
J S D M2009
J S D M2010
J
Mortgage
Auto
Personal loans
Corporate
0
2
4
6
8
10
12
M2007
J S D M2008
J S D M2009
J S D M2010
J
Mortgage
Auto
Personal loans
Corporate
Figures as of June, 2010. Source: AMFE.
Figures as of June, 2010. Source: AMFE.
Figures as of June, 2010. Source: AMFE.

F I N A N C I A L S Y S T E M R E P O R T
93
Other auto loan companies have displayed profitability indicators similar to those of car sofomes.
113 Furthermore, fee income has become less relevant, as
since 2009 there has been a decrease in the number of loans granted.114
The mortgage sector has seen deterioration in interest income, while for the auto and business loan sectors this factor has helped generate profits (graph 62).
Graph 62 Sofomes’ revenue and expense structure
a) Mortgage sector b) Auto sector c) Business sector and microloans
Billions of 2002 pesos Billions of 2002 pesos Billions of 2002 pesos
-10
-5
0
5
10
2007 2008 2009 2010
Administrative expensesProvisionsTrading incomeNet feesFinancial marginOperating profit
-4
-2
0
2
4
6
8
2007 2008 2009 2010
Administrative expensesProvisionsTrading incomeNet feesFinancial marginOperating profit
-2
-1
0
1
2
3
2007 2008 2009 2010
Administrative expensesProvisionsTrading incomeNet feesFinancial marginOperating profit
Figures as of June, 2010. Source: AMFE.
Figures as of June, 2010. Source: AMFE.
Figures as of June, 2010. Source: AMFE.
Sofomes’ main solvency indicators have deteriorated over the past two years. At the same time these entities have increased their leverage (graph 63a) and past due loans have increased as a percentage of the total loan portfolio (graph 63b). Loan-loss reserves created by unregulated mortgage sofomes cover less than the past due amount. This is because they do not have to comply with regulations like commercial banks and regulated sofomes do (graph 63c). However, in June 2009, the SHF decided to modify the requirements sofomes must meet in order to renew their credit lines.
115
The international crisis tested the viability of the mortgage sofomes’ business model. Although there have been cases of default by sofomes with a large market share, they have not posed a threat to the financial system as a whole given the low exposure of commercial banks and other private financial intermediaries to troubled sofoles and sofomes.
113
Net profit as a percentage of equity for four auto assemblers (Daimler México, Volkswagen Leasing, Paccar México and Toyota Financial Services) for the years 2007, 2008 and 2009 was 15.7, 18.4, and 14.3 percent, respectively.
114 According to the Mexican Mortgage Association, the market share of individual loans granted by mortgage sofoles and sofomes decreased by more than half in 2009 contributing 8.6 percent compared to 8.9 percent in 2008.
115 One of the conditions is the past due loan coverage index. If sofomes’ delinquency index exceeds 10 percent they must cover 60 percent of their loan portfolios with provisions or the SHF can suspend the authorization of new credit lines and withdraw credit lines it has already granted (June 30
th, 2009 SHF
circular).

B A N C O D E M É X I C O
94
Graph 63 Solvency measures
a) Assets to equity ratio b) Delinquency index c) Coverage index 1/
Number of times Percentage Percentage
2.0
3.0
4.0
5.0
6.0
7.0
8.0
9.0
10.0
11.0
12.0
M2007
J S D M2008
J S D M2009
J S D M2010
J
0
2
4
6
8
10
12
14
16
18
20
M2007
J S D M2008
J S D M2009
J S D M2010
J
Mortgages
Auto
Consumer
Corporate
20
40
60
80
100
120
140
160
180
M2007
J S D M2008
J S D M2009
J S D M2010
J
Mortgage
Non mortgage
Figures as of June, 2010. Source: AMFE.
Figures as of June, 2010. Source: AMFE.
Figures as of June, 2010. Source: AMFE.
1/ Loan-loss reserves as a percentage of past due loans.
4.7. Social savings and loan institutions (sofipos y socaps)116
The June 2001 Popular Savings and Credit Law (LACP) established the bases for the regulation and supervision of financial entities that serve low-income segments of the population and which are not regulated or supervised by any authority. With that purpose in mind the LACP defined two legal concepts so that diverse entities of the so-called popular savings and credit sector could carry on their activities: popular savings and credit societies (socaps) for those seeking to organize as cooperatives, and popular financial societies (sofipos) for those that will operate as corporations. The LACP gave both concepts the generic name of Popular Savings and Credit Entities (EACP) and orders them to be grouped into federations, and in turn confederations. The LACP further stipulated that in order to act as socaps or sofipos, a firm must first obtain authorization from the National Banking and Securities Commission (CNBV), and so it conceded an ample transition period. Thus by August 2009 the now regulated sector already consisted of one confederation, 13 federations and 78 EACP (44 socaps and 34 sofipos).
In order to address the concerns of a large number of cooperatives, in April 2009 the Law to Regulate Activities of Cooperative Societies, Savings and Loan (LRASCAP) was approved, which was published on August 13th the same year with the objective of regulating only savings and loans cooperative societies. This measure amended the LACP by eliminating the cooperatives regime and regulating only the sofipos. A new legal concept was also created for corporations
116
According to Article 2 of the CNBV Law “The Commission’s objective will be oversee and regulate financial entities within the Mexican financial system that fall within its competence in order to procure its stability and correct functioning as well as maintain and encourage the healthy and balanced development of the system as a whole in the interests of the general public”. Article 3, section IV of the same law states what shall be understood by “Entity or entities belonging to the Mexican Financial System: a) Popular Financial Societies,…, b) Savings and Loan Cooperative Societies subject to the Commission’s supervision as set forth in Law to Regulate Activities of Cooperative Societies, Savings and Loan, belonging to the social sector”.

F I N A N C I A L S Y S T E M R E P O R T
95
that engage in the same activities as sofipos whose main purpose will be to support the development of agriculture activities: community financial societies (sofincos); these new concepts will be supported by Rural Finance Entities that will promote the operating integration of these sofincos which will be regulated and supervised and are also provided for in LACP.
Thus, as of June 2010, the popular savings and credit sector was comprised of 654 firms (595 cooperatives and 59 sofipos) managing assets totaling 90.706 billion pesos (74,771 corresponded to cooperatives and the rest to sofipos). As of the same date there were 93 firms authorized by the CNBV to operate based on the LRASCAP and LACP which together managed 64.060 billion pesos (49,157 corresponding to socaps and the rest to sofipos
117) serving around
5.2 million people (3.3 million in the case of socaps and 2.0 million in the case of sofipos).
Note that the LRASCAP establishes that as long as the assets of cooperative societies do not surpass 2.5 million UDI, they do not need CNBV authorization to continue operating, while those with assets above that level are given a period of transition to adjust their operations to the applicable laws while continuing to operate as long as they comply with the established legal requirements. The transition period ends on December 21st, 2012.
117
14.237 billion pesos correspond to 33 societies that are up and running and 666 to 5 that are in the process of beginning operations.

B A N C O D E M É X I C O
96
5. Financial position of households, firms and the public sector
5.1. Households
Household savings slowed in 2009 and the first few months of 2010 but recovered as of the second quarter of 2010 on a pick-up in economic activity. Meanwhile the compulsory savings growth rate has continued on the back of both an improvement in the valuation of siefore portfolios, employment, and ultimately, worker contributions. Thus, at the end of the first half of 2010 household savings recorded real year-on-year growth of 4.5 percent (graph 64a).
Graph 64 Household savings and financing by destination and type of consumer loan
a) Voluntary and obligatory household savings
1/
b) Total household financing by destination
3/
c) Consumer credit6/
Real YoY percentage change Real YoY percentage change Real YoY percentage change
-5
0
5
10
15
20
J2007
A J O J2008
A J O J2009
A J O J2010
A J
Total 2/
Voluntary
Obligatory 2/
-20
-10
0
10
20
30
M2007
J S D M2008
J S D M2009
J S D M2010
J S
Consumer
Housing 4/ 5/
Total 4/ 5/
-40
-30
-20
-10
0
10
20
30
40
50
M2007
J S D M2008
J S D M2009
J S D M2010
J S
Credit cards
Rest 7/
Total
Figures as of September, 2010. Source: Banco de México.
Figures as of September, 2010. Source: Banco de México.
Figures as of September, 2010. Source: Banco de México.
1/ Defined as monetary aggregate M2 in the power of households. Voluntary savings is the difference between savings in household financial instruments (M2 households) and obligatory savings. Obligatory savings include retirement funds (IMSS and ISSSTE) invested in monetary aggregate instruments, housing funds (Infonavit and Fovissste) and Pensionissste bonds.
2/ Excludes the impact of the reform to the ISSSTE Law which came into force in 2008. 3/ Includes total loans granted by the banks, leasing companies, sofoles and sofomes and popular savings and loan societies as well as Infonavit and
Fovissste financing. These figures are impacted by the conversion of some non-bank banks into unregulated sofomes (NRE). 4/Figures between January and December 2007 have been adjusted so they are not distorted by the reclassification of corporate sector bridge loans for
homebuilding. 5/ Between December 2007 and November 2008, growth rates are adjusted so they are not distorted by Fovissste’s inclusion in the statistics. 6/ Includes the direct bank loan portfolio, the loan portfolio associated with bank restructuring programs, sofome credit card credit and the total credit of
non-bank banks. 7/ Includes loans for the purchase of consumer durables and other consumer loans from banks and other non-bank banks.
Total loans granted to households decreased by a real 3.3 percent year-on-year as of December 2009 due to a 13.7 percent drop in consumer credit and marginal growth of 1.6 percent in mortgage loans. Weakness in household loans continued in the first half of 2010.
The decrease in household financing can be explained both by demand and supply factors. On the one hand low consumer confidence levels, greater unemployment and a weak payroll in 2009 stymied demand for credit. On the

F I N A N C I A L S Y S T E M R E P O R T
97
other, a high consumer loan delinquency rate and change in the revolving loan provisions regulation, which came into effect in August 2009, have led to banks limiting the supply of credit. Nevertheless, since September 2009, the slowdown in credit has eased.
As a result, at the end of the first half of 2010 households’ financial position, or net savings, improved by 26.4 percent of GDP (24.5 percent excluding the impact of the ISSSTE Law), more than the figure observed in the like 2008 and 2009 periods (figure 1).
118
Figure 1 Households’ financial position: balances as of June, 2010
Percentage of GDP1/
Obligatory
savings
15.2
Savings
(M2 households)
40.2
Voluntary
savings
25.0
Households’
Financial position
26.4
Indebtedness
13.8
Consumption
3.8
Retail banks2/
3.2
Rest3/
0.7
Housing
9.9
Retail
banks
2.9
Rest4/
7.0
Source: Banco de México. 1/ The sum of the parts may not coincide with the total due to rounding. Figures correspond to the balance as of June 2010
expressed as a percentage of average nominal GDP for the last four quarters. 2/ Includes credit granted by retail banks and their sofomes RE subsidiaries. 3/ Includes credit granted by development banks, sofoles, sofomes RE and popular savings and loans societies. 4/ Includes credit granted by development banks, sofoles and sofomes RE, Infonavit and Fovissste.
118
The financial position of households with respect to the domestic financial system is defined as the difference between the monetary aggregate financial instrument savings balance (M2 households) and the balance of their debt with financial intermediaries.

B A N C O D E M É X I C O
98
In 2009, the servicing of household debt as a percentage of disposable income decreased due to lower indebtedness (graph 65c).
119 120
Thus, at the end of 2009 consumer credit debt servicing accounted for around 1.4 percent of disposable income and mortgage debt servicing around one percent (graph 65b). During the first half of 2010, consumer credit debt servicing remained at levels similar to the previous year while mortgage debt service increased slightly.
Graph 65 Household debt service
a) Consumer credit debt service 1/ b) Mortgage loan debt service
2/ c) Household debt service
Percentage of household disposable income
3/
Percentage of household disposable income
3/
Percentage of household disposable income
3/
0.0
0.5
1.0
1.5
2.0
M2007
J S D M2008
J S D M2009
J S D M2010
J
0.0
0.5
1.0
M2007
J S D M2008
J S D M2009
J S D M2010
J
Banks Infonavit
0.0
0.5
1.0
1.5
2.0
2.5
3.0
M2007
J S D M2008
J S D M2009
J S D M2010
J
Consumer Mortgage
Figures as of June, 2010. Source: Banco de México.
Figures as of June, 2010. Source: Banco de México.
Figures as of June, 2010. Source: Banco de México.
1/ Consumer credit debt service is the payment of interest and commissions on consumer loans granted by retail banks to households. Source: CNBV. 2/ Mortgage loan debt service is defined as the payment of interest and commissions on mortgage loans granted by retail banks and Infonavit to
households. 3/ Households’ disposable income was calculated using INEGI data.
5.2. Non-financial private companies
At the end of the first half of 2010, total financing granted to non-financial private companies represented 17.9 percent of GDP (figure 2),
121 with
financing granted by the banking system representing the largest source of funds with a 43.2 percentage share of the total and equivalent to 7.8 percent of GDP.
119
Debt service is defined as the payment of interest and commissions by households on consumer loans granted by retail banks as well as in relation to mortgages granted by retail banks and Infonavit.
120 Household disposable income was calculated using INEGI data. 2009 and 2010 figures are preliminary.
121Data related to financing granted by non-financial private companies is published every quarter and is available through the second quarter of 2010. Domestic financing to this sector comprises bank and non-financial private companies as well as private debt issuances. External financing includes direct debt (foreign retail bank loans and other creditors) and financing via private debt issuances abroad.
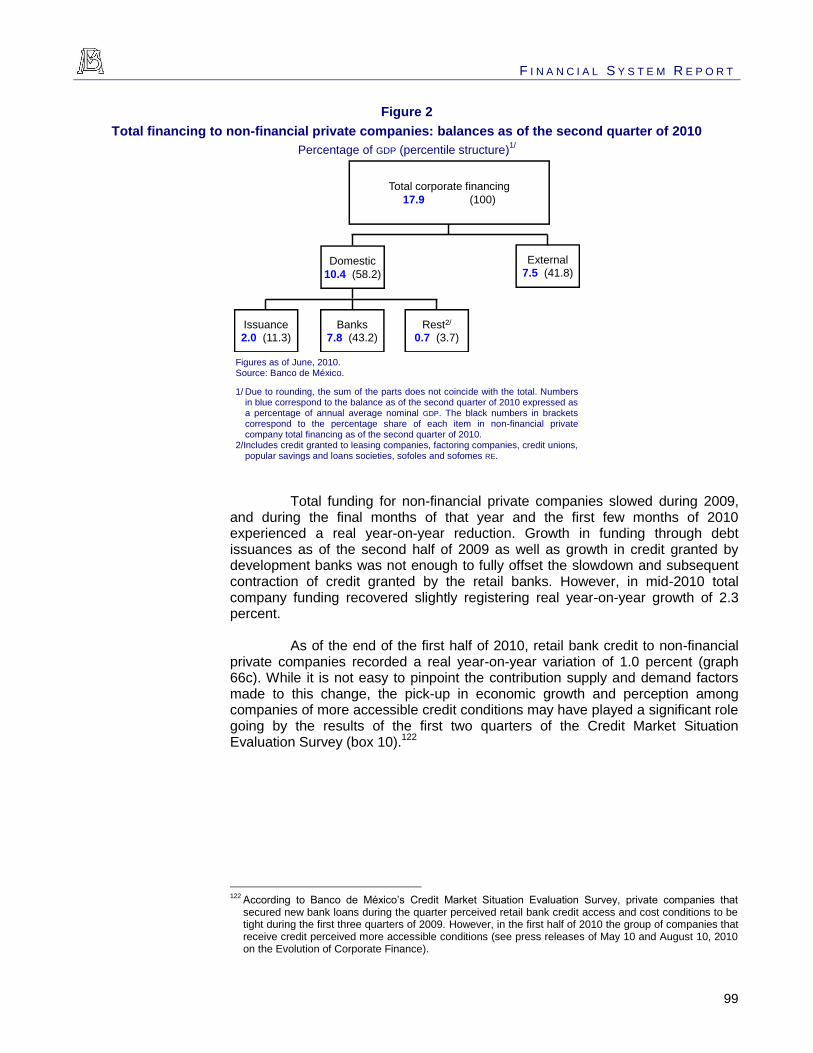
F I N A N C I A L S Y S T E M R E P O R T
99
Figure 2
Total financing to non-financial private companies: balances as of the second quarter of 2010
Percentage of GDP (percentile structure)1/
Total corporate financing
17.9 (100)
Domestic
10.4 (58.2)
External7.5 (41.8)
Banks7.8 (43.2)
Rest2/
0.7 (3.7)Issuance2.0 (11.3)
Figures as of June, 2010. Source: Banco de México.
1/ Due to rounding, the sum of the parts does not coincide with the total. Numbers in blue correspond to the balance as of the second quarter of 2010 expressed as a percentage of annual average nominal GDP. The black numbers in brackets correspond to the percentage share of each item in non-financial private company total financing as of the second quarter of 2010.
2/Includes credit granted to leasing companies, factoring companies, credit unions, popular savings and loans societies, sofoles and sofomes RE.
Total funding for non-financial private companies slowed during 2009, and during the final months of that year and the first few months of 2010 experienced a real year-on-year reduction. Growth in funding through debt issuances as of the second half of 2009 as well as growth in credit granted by development banks was not enough to fully offset the slowdown and subsequent contraction of credit granted by the retail banks. However, in mid-2010 total company funding recovered slightly registering real year-on-year growth of 2.3 percent.
As of the end of the first half of 2010, retail bank credit to non-financial private companies recorded a real year-on-year variation of 1.0 percent (graph 66c). While it is not easy to pinpoint the contribution supply and demand factors made to this change, the pick-up in economic growth and perception among companies of more accessible credit conditions may have played a significant role going by the results of the first two quarters of the Credit Market Situation Evaluation Survey (box 10).
122
122
According to Banco de México’s Credit Market Situation Evaluation Survey, private companies that secured new bank loans during the quarter perceived retail bank credit access and cost conditions to be tight during the first three quarters of 2009. However, in the first half of 2010 the group of companies that receive credit perceived more accessible conditions (see press releases of May 10 and August 10, 2010 on the Evolution of Corporate Finance).

B A N C O D E M É X I C O
100
Box 10
Index of tightening in the market for bank credit
Loans from retail banks are one of the most important options for funding Mexico's productive activities and can provide domestic investment with significant support. For this reason, it is very interesting to analyze the performance of companies and retail banks with regard to the loan application and granting process using the credit tightening index described below.
To construct this index, ten indicators were established to represent factors that prevent companies from applying for or receiving a loan from retail banks in this country. The information was obtained from the Credit Market Situation Evaluation Survey, applied on a quarterly basis by Banco de México to a sample of companies.
1
Companies that indicated they had not taken out any loans during the period in question were asked their reasons for not doing so,
2 and had to choose from a number of factors that
may have limited their access to credit. Some of them pointed to a toughening of lending standards by retail banks; the remainder indicated the state of the economy and future expectations.
Once the appropriate indicators were chosen, we proceeded to analyze the principal components and synthesize the information using statistical techniques, downscaling the data in order to minimize the amount of lost information.
Through this analysis, we were able to transform a set of variables or indicators into a new set of principal components or factors which create a linear combination of original variables that are mutually independent on each other. We were thus able to prepare a summary method to facilitate analysis of lending conditions in the credit market.
The results provide an index value for each quarter of the period between 1998 and the second quarter of 2010.
Graph 1
Tightening index
a) Index and portfolio growth b) Index by factors
Portfolio growth percentage
-4
-2
0
2
4
19
98
19
99
20
00
20
01
20
02
20
03
20
04
20
05
20
06
20
07
20
08
20
09
20
10
Index
Performing loans 1/
-2
-1
0
1
2
3
4
19
98
19
99
20
00
20
01
20
02
20
03
20
04
20
05
20
06
20
07
20
08
20
09
20
10
Index-supply
Index-demand
Figures as of June, 2010. Figures as of June, 2010.
Source: Banco de México. Source: Banco de México.
1/ Performing loans to the private sector.
The results suggest that a higher reading for the index is associated with a higher level of tightness in the bank lending market. This may be attributed to a toughening of general banking industry loan conditions, or an erosion of economic conditions and the economic outlook in each period of analysis, or both.
With these results in mind, we would expect slower growth of performing loans in the banking industry, since the growth of the credit market would be limited by factors of supply or demand, a situation in which more companies would be unable to obtain credit.
When the index is lower, on the other hand, it would imply less tightening in the bank credit market, because lending standards have been relaxed or because companies perceive an improvement in economic conditions, or both. In the latter case, we would expect companies to have more possibilities of accessing the credit market and thus stronger growth in bank lending.
In the most recent periods of analysis, which encompass the effects of the current financial and economic crisis, the results show a substantial rise in credit tightening for the business sector. This is consistent with a decline in the growth of performing loans to the Mexican private sector
3 during these
periods (see graph 1a).
Additionally, based on the results of the survey we can distinguish between factors that indicate a supply-side limitation on credit, and those which come from the demand side. We also prepared an index based on credit supply factors, which is related to bank lending standards, and a demand-side credit index, which measures the impact of companies themselves on the expansion or contraction of credit, in light of current and expected economic conditions.
This analysis leads us to the conclusion that as a result of the recent crisis, lower credit levels in the Mexican economy are the result of demand factors rather than supply factors. Furthermore, as the economic recovery progresses, supply factors have had an increasingly modest impact on the tightening of credit conditions. (see graph 1).
1 Beginning in the third quarter of 2008, the survey was redefined to
modify the possible responses to the question about why each company did not take out a bank loan. A correspondence was sought between the responses from before and after the redesign in order to maintain data continuity and still have ten credit-limiting factors for the period of analysis. 2 The results of this question are presented as the percentage of
companies surveyed who did not receive bank credit in the period. The sum of the responses may be more than one hundred percent because more than one response was allowed. 3 Performing loans to the private sector includes loans to companies
and individuals, a line that covers primary, secondary and tertiary economic activities, in addition to consumer credit, home mortgages and a statistical adjustment factor that takes into account differences between the source of accounting information and the detailed loan portfolio report.

F I N A N C I A L S Y S T E M R E P O R T
101
Graph 66 Domestic financing to non-financial private companies
a) Domestic financing for companies by instrument
b) Domestic financing for companies by type of intermediary
c) Retail bank loans 4/
Real YoY percentage change Real YoY percentage change Real YoY percentage change
-10
0
10
20
30
40
M J2007
S D M J2008
S D M J2009
S D M J2010
S
TotalBank and non bank creditDebt instrument issuances
-60
-40
-20
0
20
40
60
80
M2007
J S D M2008
J S D M2009
J S D M2010
J S
Total 1/Retail banks 2/Development banks 2/Debt marketRest 1/ 3/
-20
0
20
40
60
80
100
120
140
160
M2007
J S D M2008
J S D M2009
J S D M2010
J S
Total
Manufacturing
Construction
Services
Figures as of September, 2010. Source: Banco de México.
Figures as of September, 2010. Source: Banco de México.
Figures as of September, 2010. Source: Banco de México.
1/ These figures are affected by the conversion of some non-financial private companies into unregulated sofomes (NRE). 2/ Includes the direct loan portfolio and portfolio associated with restructuring programs. 3/Includes total credit granted by leasing companies, factoring, credit unions, sofoles, regulated sofomes (RE), and popular savings and loans societies. 4/ Considers the performing loan portfolio.
As of the end of 2009, external financing to non-bank banks decreased 4.6% year on year in dollars (graph 67a). Although tight conditions in international credit markets during the first half of 2009 limited financing through securities issuances, the second half of that year saw an improvement in access and cost conditions in such markets and lower risk perception. In this environment there was a spike in the number of companies that issued foreign debt. Besides an increase in amounts placed the average term was longer and the cost of financing decreased (graphs 67b and c). Private debt issuances abroad as well as tight foreign direct financing, mainly from banks, continued to record a positive trend in the first half of 2010.

B A N C O D E M É X I C O
102
Graph 67 External financing to non-financial private companies and external debt issuances
a) External financing to non- financial private companies
b) Term and cost of external issuances of non-financial private
companies
c) External debt placements of non-financial private companies
Annual percentage variation in the dollar balance
Maturity in years and YoY percentile rate Quarterly balance in billions of dollars
-20
-10
0
10
20
30
40
50
60
70
M2007
J S D M2008
J S D M2009
J S D M2010
J A
Total
Direct financing
Debt instrument issuance 1/
0
2
4
6
8
10
12
14
16
18
I2007
II III IV I2008
II III IV I2009
II III IV I2010
II III
Average maturity 2/
Interest rate 3/
4
/
0
1
2
3
4
5
6
I2007
II III IV I2008
II III IV I2009
II III IV I2010
II III4/
Figures as of June, 2010. Source: Banco de México.
Figures as of September, 2010. Source: Banco de México.
Figures as of September, 2010. Source: Banco de México.
1/ Figures as of August, 2010 for the issuance of debt instruments. 2/ Weighted average maturity of placements in the quarter. 3/ Average interest rate on issuances greater than or equal to 300 million dollars of Mexican non-financial private sector companies. 4/ Preliminary figures as of September, 2010.
5.3. Public sector
At the end of 2009 the public sector deficit was equivalent to 2.3 percent of GDP (274.5 billion pesos). Excluding investment in Pemex, the deficit accounted for 0.2 percentage points of GDP, which is congruent with the set target.
123 This
was despite the fact that during the first half of 2009 the adverse impact of the financial crisis on tax collection increased due to a slower economy along with ongoing uncertainty in the oil market resulting in a bigger-than-planned reduction in the budget. A smaller number of drilling and oil export platforms only worsened the situation.
In response to certain concerns in markets about the capacity of public finances to maintain the fiscal stimulus programs derived from the crisis, in July 2009, the SHCP presented an estimate of one-time revenues for that year and decreed a cut in the authorized budget. The exercise of 2009 oil revenue hedges acquired by the Federal Government in 2008 and other sources of one-time income offset the decrease in tax and oil revenues, thus preserving the goal of balance public finances.
Unlike other economies that have recently encountered fiscal sustainability problems owing to crisis-induced stimuli, Mexico implemented a public finances strengthening strategy, specifically the 2010 fiscal package, which included a tax reform aimed at bolstering permanent sources of public revenue. It is estimated that in 2010 this reform contributed 2010 additional tax revenues
123
This level is on the boundaries envisaged in the LFPRH regulations which establish a one percent deviation from the annual budget (equivalent to 30.5 billion pesos for 2009).

F I N A N C I A L S Y S T E M R E P O R T
103
amounting to around one percent of GDP.124
Recent 2010 macroeconomic projections are an improvement on those considered in the approved fiscal package. In particular, growth is expected to be higher as well as the Mexican mix oil price. Together, these factors imply an improvement in public finances in 2010.
As of June 2010, the Net Broad Economic Debt (NBED) balance was 28.4 percent of GDP, 10.1 percent of GDP above the December 2008 balance.
125
This increase is due to two factors: the cancellation of the Pemex Long-Term Productive Infrastructure Projects (pidiregas) scheme as of 2009, which resulted in a reclassification of extant non-budgetary debt amounting to 6.8 percent of GDP to NBED, or a net indebtedness of 3.3 percent of GDP. With respect to consolidated public sector debt with Banco de México, the balance represented 29.4 percent of GDP as of the end of June 2010 (17.2 percent in 2008).
126 Regarding the
characteristics of indebtedness through securities, the average weighted maturity of government securities decreased during the previous year from 2,349 days at the end of 2008 to 2,299 days at the end of 2009 (graph 69b). In 2010 the placement of fixed-rate long-term instruments was stepped up while short-term placement levels remained constant resulting in increases in the weighted average maturity (2,332 days at as June, 2010) and more stable government security refinancing needs (graph 68a).
127
128 The financial cost to the Federal
Government rose from 1.6 percent of GDP in 2008 to 1.8 percent in June 2010 due to a more indebted federal public administration. Between these periods the financial cost measured as a percentage of Federal Government revenues increased from 9.8 percent to 10.7 percent of GDP (graph 69c).
124
The Federal Revenue Law of 2010 contemplates the following changes: i) the rate of Value Added Tax increased from 15 percent to 16 percent and in border cities from 10 percent to 11 percent; ii) the Special Production and Services Tax increased for diverse goods and services (in the case of beer the tax temporarily rose from 25 to 26.5 percent (the rate comes down to 26 percent again in 2012 and returns to 25 percent in 2013); in the case of alcoholic beverages of more than 20°GL, the rate increases from 50 to 53 percentage and for tobacco there is a fixed quota on top of the extant tax of 4 cents per cigarette or the equivalent in weight); iii) the maximum rate of Income Tax was temporarily increased from 28 percent to 30 percent for individuals, the same as the single tax corresponding to corporations (in 2013 it will come back down to 29 percent and in 2014 to 28 percent); and iv) the Tax on Cash Deposits rose from two to three percent and the exempt amount decreased from 25 to 15 thousand pesos a month. Changes were also made to the fiscal consolidation scheme and a new three percent tax was levied on some telecommunication services. Regarding the Single Business Tax, the rate rose to 17.5 percent as envisaged when it was introduced in 2007.
125 NBED includes Federal Government, state sector, development bank and development trust liabilities.
126 Consolidated public debt with Banco de México includes DEAN (without additional liabilities) central bank assets and liabilities with the private, foreign and retail banking sectors.
127 The implementation of a fixed-rate and udibono syndicated bond placements mechanism played a key role in the extension of the maturity of government securities in 2010 (see financial markets section).
128 The weighted average maturity is defined as the weighted sum (with respect to the nominal value of the outstanding amount) of the remaining maturity of each of the current values.

B A N C O D E M É X I C O
104
Graph 68 Public debt
a) Net broad economic debt 1/ b) Net consolidated debt with
Banco de México 3/
c) Federal Government securities portfolio by maturity
4/
Percentage of GDP Percentage del GDP Percentage
0
5
10
15
20
25
30
35
40
45
50
2006 2007 2008 2009 2010
External NBED
Domestic NBED
Total NBED
NBED + addit ional liabilities 2/
-10
-5
0
5
10
15
20
25
30
35
2006 2007 2008 2009 2010
Domestic
External
20
25
30
35
40
45
50
55
60
65
2006 2007 2008 2009 2010
Below 3Y maturity
Greater than 3Y maturity
Figures as of June, 2010. Source: Banco de México.
Figures as of June, 2010. Source: Banco de México.
Figures as of September, 2010. Source: Banco de México.
1/ The net broad economic debt includes net liabilities of the federal government, the state sector, and official financial intermediaries (development banks and development trust funds).
2/ Additional liabilities correspond to Pidiregas, FARAC, IPAB and the Debtor Support Program. 3/ Public sector net debt consolidated with Banco de México includes assets and liabilities of the central bank with the private sector, and the
commercial banking sector and the external sector. This concept does not include additional items. 4/ Residual maturity or term to maturity.
In 2009 and the first half of 2010, state and municipal governments stepped up their recourse to financing (graph 70a) partly due to a big reduction in federal revenue sharing due to lower tax revenues owing to the crisis. Specifically, during that year their share decreased by 15.7 percent in real terms. Resources from the State Revenue Stabilization Fund (FEIEF)
129 played an important role in
financing. In addition to these resources, state governments took out other loans, mainly with retail banks. The stock market did not make a significant contribution during this period (see financial markets section). Thus between the end of 2008 and June 2010 total financial obligations considered in the SHCP Register of State and Municipality Bonds and Loans, increased from 50.7 to 61.0 percent of total federal revenue sharing (graph 70b).
130
129
The channeling of this Fund’s resources implied both the direct delivery of funds to states as well as an empowerment model. The scheme was created using bank loans secured by existing FEIEF funds in 2009 and future revenues (See SHCP 048/2009 press release).
130 Article nine of the Fiscal Coordination Law states the terms under which states and municipalities enter direct and contingent obligations in the Register when the shares corresponding to each are impacted.

F I N A N C I A L S Y S T E M R E P O R T
105
Graph 69 Public debt service
a) Domestic Government Securities Borrowing
Requirements
b) Weighted Average Maturity c) Federal Government Debt Interest Payments as a
Percentage of Revenues
Number of times 1/ Number of days Percentage
2/
0.5
0.6
0.7
0.8
0.9
2006 2007 2008 2009 2010
800
1,000
1,200
1,400
1,600
1,800
2,000
2,200
2,400
2,600
2006 2007 2008 2009 2010
5
7
9
11
13
15
17
19
21
23
25
2006 2007 2008 2009 2010
On total outgoings
On non oil revenues
Figures as of September, 2010. Source: Banco de México.
Figures as of September, 2010. Source: Banco de México.
Figures as of September, 2010. Source: Banco de México.
1/ Refers to the number of times per year the average balance of Federal Government domestic securities is refinanced. Monthly observations. Found by dividing the sum of last 12 month maturities by the average last 12 month balance.
2/ Monthly observations. Sum of last 12 month flows..
Graph 70 Debt of States and Municipalities
1/
a) State and municipality debt b) State and municipality debt by instrument
c) Weighted average maturity of state and municipality debt in
securities
Real YoY percentage change Percentage shares Years
0
5
10
15
20
25
30
II2007
IV II2008
IV II2009
IV II2010
0
10
20
30
40
50
60
70
II2007
IV II2008
IV II2009
IV II2010
Retail banks 2/
Development banks
Securities issuances
10
11
12
13
14
15
16
17
18
19
20
2005 2006 2007 2008 2009 2010
Figures as of June, 2010. Source: SHCP.
Figures as of June, 2010. Source: SHCP.
Figures as of June, 2010. Source: SHCP.
1/ Debt recorded in the SHCP Register of State and Municipality Bonds and Loans. Does not include financing associated with FEIEF empowerment. 2/ Includes bank credit and trusts.

B A N C O D E M É X I C O
106
6. Payment Systems
6.1. Large value payment systems131
The events that caused turmoil in international markets recently caused no problems in Mexico's payment systems. In recent years, Banco de México has introduced operating and regulatory improvements to these systems to make them safer and more reliable. One of the purposes of these improvements was to guarantee that large value payment systems operate normally in conditions of financial turbulence and do not add further risk to financial system participants.
Between July 2009 and June 2010, there were a little over 306,000 daily transactions on average in the large value payment system, 46.5 percent more than in the same period of the previous year (table 11 and graph 71a).
Table 11 Daily average traded in large value payment systems
Annual
change2010 Share
Annual
change2010 Share
Percentage Percentage Percentage Percentage
SIAC 756 503 -33.5 0.2 117 97 -17.3 3.3
SPEI 200,043 297,457 48.7 97.0 742 910 22.7 31.1
DALI 3/
8,508 8,775 3.1 2.8 1,977 1,916 -3.1 65.6
TOTAL 209,307 306,735 46.5 100 2,836 2,923 3.1 100
Transactions Billions of pesos
20091/
20102/
20091/
20102/
Source: Banco de México. 1/ Data from second half of 2008 to first half of 2009. 2/ Data from second half of 2009 to first half of 2010. 3/ DALÍ replaced SIDV in November 2008.
Accountholders Service System (SIAC)
Banco de México operates a system for managing the current accounts that banks, brokerage firms and government agencies maintain with the central bank. SIAC was Banco de México's first electronic payment system, but these functions have since been taken over by SPEI, which has more special features to address them. Between July 2009 and June 2010, the number of payments through SIAC declined 33.5 percent from the preceding year, and the amount of payments dropped by 17.3 percent (table 11). This was primarily because many payments formerly made by the federal government through SIAC had been migrated to SPEI.
131
The Law on Payment Systems regulates three systems: The Banco de México Account Holders Service System (SIAC), the Electronic Interbank Payment System (SPEI) and Securities Deposit, Administration and Settlement System (DALÍ). These systems, hereinafter referred to as high-value payment systems, are considered systemically important, because a failure in any one of them could affect the stability of the entire financial system.
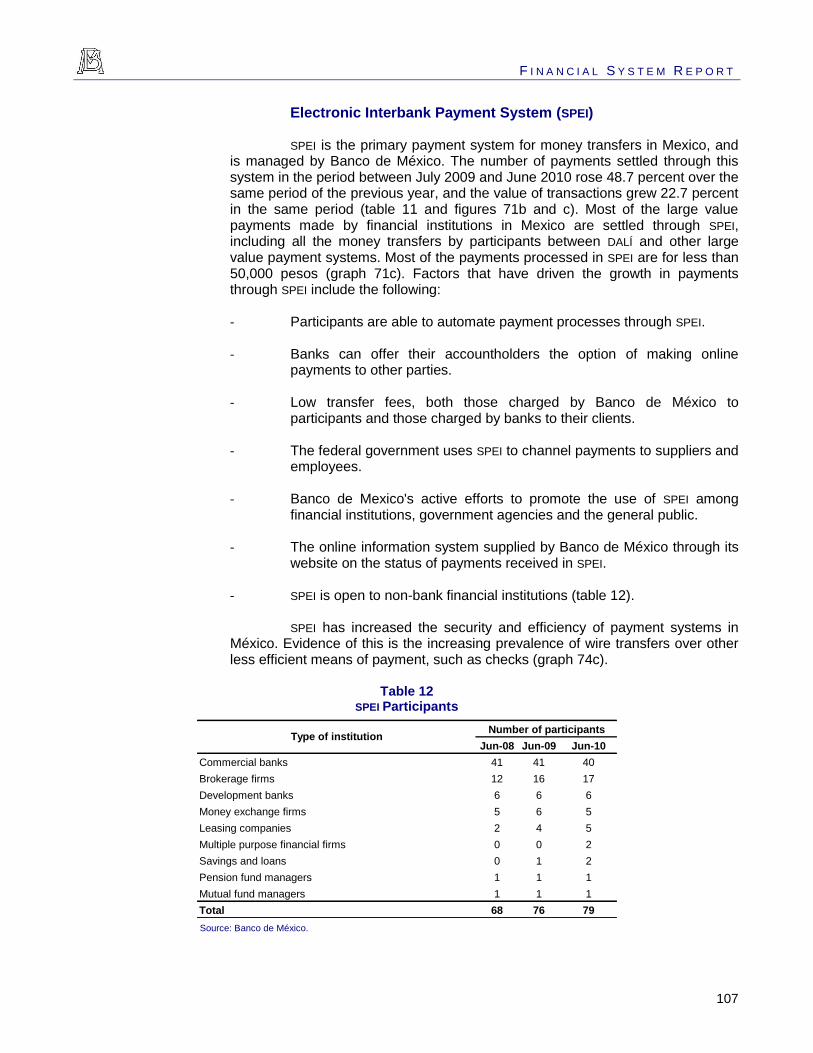
F I N A N C I A L S Y S T E M R E P O R T
107
Electronic Interbank Payment System (SPEI)
SPEI is the primary payment system for money transfers in Mexico, and is managed by Banco de México. The number of payments settled through this system in the period between July 2009 and June 2010 rose 48.7 percent over the same period of the previous year, and the value of transactions grew 22.7 percent in the same period (table 11 and figures 71b and c). Most of the large value payments made by financial institutions in Mexico are settled through SPEI, including all the money transfers by participants between DALÍ and other large value payment systems. Most of the payments processed in SPEI are for less than 50,000 pesos (graph 71c). Factors that have driven the growth in payments through SPEI include the following:
- Participants are able to automate payment processes through SPEI.
- Banks can offer their accountholders the option of making online payments to other parties.
- Low transfer fees, both those charged by Banco de México to participants and those charged by banks to their clients.
- The federal government uses SPEI to channel payments to suppliers and employees.
- Banco de Mexico's active efforts to promote the use of SPEI among financial institutions, government agencies and the general public.
- The online information system supplied by Banco de México through its website on the status of payments received in SPEI.
- SPEI is open to non-bank financial institutions (table 12).
SPEI has increased the security and efficiency of payment systems in México. Evidence of this is the increasing prevalence of wire transfers over other less efficient means of payment, such as checks (graph 74c).
Table 12 SPEI Participants
Jun-08 Jun-09 Jun-10
Commercial banks 41 41 40
Brokerage firms 12 16 17
Development banks 6 6 6
Money exchange firms 5 6 5
Leasing companies 2 4 5
Multiple purpose financial firms 0 0 2
Savings and loans 0 1 2
Pension fund managers 1 1 1
Mutual fund managers 1 1 1
Total 68 76 79
Type of institutionNumber of participants
Source: Banco de México.

B A N C O D E M É X I C O
108
Securities Deposit, Administration and Settlement System (DALÍ)
DALÍ is operated by S.D. Indeval, Institución para el Depósito de Valores, S.A. de C.V. This system handles the settlement of securities transactions which take place in debt and equity markets. All banks and brokerage firms authorized to trade in Mexican markets participate in DALÍ. Transactions are settled under a "delivery versus payment”
132 system. Between July 2009 and July 2010, 81.6
percent of the amount settled through DALÍ involved transactions in government securities, 17.9 percent bank securities and 0.5 percent equity market transactions (graph 72b).
In 2009, Banco de México encouraged Indeval depositors to automate their trading processes through DALÍ. Among other measures, it asked Indeval to process more messages so that depositors would be able to automate all their transactions without having to follow processes that required them to go through what was called the DALÍ Portal. The central bank also asked Indeval to lower rates charged to depositors for instructions sent through automated mechanisms, and it encouraged the development of manuals explaining the DALÍ rules more clearly and precisely. Finally, it urged Indeval to adopt a Business Continuity Plan to ensure that, under certain failure scenarios, cash would continue flowing between Banco de Mexico systems and DALÍ. DALÍ is much closer to complying with international standards than the old system, which was clear from the results of its evaluation under Recommendations for Securities Settlement Systems published by Banco de México in December 2009.
Graph 71 Large value payment systems
a) Daily average number of transactions
b) Daily average value of transactions
c) Daily average number of SPEI transactions
Thousands Billions of pesos Thousands
0
5
10
15
20
25
30
35
40
0
50
100
150
200
250
300
350
400
J2008
A J O J2009
A J O J2010
A
Total SPEI
DALÍ 1/ SIAC
0
500
1,000
1,500
2,000
2,500
3,000
3,500
J2008
A J O J2009
A J O J2010
A
Total DALÍ 1/SPEI SIAC
0
50
100
150
200
250
300
350
400
J2008
A J O J2009
A J O J2010
A
Total
Below 50,000 MXN
50 - 500,000 MXN
Above 50,000 MXN
Figures as of June, 2010. Source: Banco de México.
Figures as of June, 2010. Source: Banco de México.
Figures as of June, 2010. Source: Banco de México.
1/ DALÍ replaced SIDV in November 2008.
132
Delivery Versus Payment, or DVP. This system ensures that settlement of transactions in SIDV ensures that participants will not be charged the amount of a transaction to their cash account unless the corresponding certificates are credited and vice versa.

F I N A N C I A L S Y S T E M R E P O R T
109
Graph 72 Securities settlement systems
a) Average number of daily transactions b) Daily average value transacted
Thousands Billions of pesos
0
2
4
6
8
10
12
J
2008
A J O J
2009
A J O J
2010
A
Tota lGovernmentBankCapital
0
10
20
30
40
50
60
70
80
90
100
0
500
1,000
1,500
2,000
2,500
J
2008
A J O J
2009
A J O J
2010
A
Total
Government
Bank
Capital
Figures as of June, 2010. Source: Banco de México.
Figures as of June, 2010. Source: Banco de México.
Foreign-exchange transaction settlement system 133
A daily average of around four trillion dollars is traded through the CLS.
134 But for the system as a whole, the ratio of net amount settled to gross
amount traded is only one percent. For the Mexican peso, this ratio is three percent (figures 73a and b). The net results in Mexican pesos calculated by CLS are settled in SPEI overnight. As in all countries whose currencies participate in the system, the CLS bank has an account with Banco de México and has access to the local payment system. Banks that operate in Mexico can settle their transactions in CLS in a number of ways: 1) for foreign bank affiliates, through their parent banks, when these are direct members; ii) becoming members and participating directly; or iii) using the services of a direct member or its affiliate. So far, no Mexican bank is a direct member of CLS, but five banks are correspondents of CLS members and can settle the net amount of their peso transactions in CLS through these members.
133
On May 26, 2008, the peso was included in the group of currencies that participate in the Continuous Linked Settlement (CLS) system, which is a global system for settling foreign currency transactions. It currently processes transactions in 17 currencies, one of them being the Mexican peso. This system has been operating since 2002 through a bank created for this purpose in New York, the CLS Bank, and uses a "payment vs. payment" mechanism to eliminate settlement risk.
134 1 trillion dollars = $1,000,000,000,000.

B A N C O D E M É X I C O
110
Graph 73 Settlement of foreign exchange transactions in CLS
a) Daily average amount settled in all currencies through CLS system
b) Daily average amount settled in pesos through CLS system
Billions of dollars Billions of dollars
0
10
20
30
40
50
60
0
500
1,000
1,500
2,000
2,500
3,000
3,500
4,000
4,500
5,000
M
2008
A N F M
2009
A N F
2010
Gross settlement 1/
Net settlement 2/
0.0
0.2
0.4
0.6
0.8
1.0
1.2
0
5
10
15
20
25
M
2008
A N F M
2009
A N F
2010
Gross settlement 3/
Net settlement 2/
Figures as of April, 2010. Source: CLS Bank.
Figures as of April, 2010. Source: CLS Bank.
1/ Gross settlement: value of transactions settled in CLS. 2/ Net settlement. Total amount necessary to settle gross transactions. 3/ Gross settlement: total value of transactions including the peso that are settled in CLS.
6.2. Small value payment systems
Small value or retail payments are used to settle obligations such as the purchase of goods or services between individuals, or between an individual and a company. There are paper-based small value payment systems (cash and checks) and others based on electronic media, like bank cards and electronic transfer systems.
Checks and small-value electronic transfers
Banco de México has promoted the use of small value electronic transfers, both in real time (through SPEI) and on a next-day basis (TEF).
135 It has
also encouraged the use of interbank transfers for paying credit card balances. The number of interbank electronic transfers (SPEI, TEF and Interbank credit card payments) between July 2009 and June 2010 was 26 percent higher than the number recorded between July 2008 and June 2009, while the value of these transfers rose 2 percent in real terms during that period of time.
136 Similarly, there
were more than nine million interbank transfers to pay credit card balances between July 2009 and June 2010 (graph 74b). In automatic bill payment
135
The distinction between small and large value payments has been blurred because there is now no restriction on the amount of money that can be transferred in SPEI and in the TEF system. In contrast to payments through SPEI, TEF takes between one and two days to reflect the credit to the destination account (see box 43 of the 2007 Financial System Report).
136 The number of online banking customers has risen 35 percent since July 2009 and reached more than thirteen million in June 2010.

F I N A N C I A L S Y S T E M R E P O R T
111
service,137
the number and real value of successful interbank transactions rose by 15 and 6.8 percent, respectively, in the periods mentioned, while the number of interbank checks sank 8 percent during the same timeframe.
Graph 74 Use of different means of payment
a) Number of electronic interbank payments
b) Number of interbank transfers to pay credit cards
c) Breakdown of interbank transactions
Millions per quarter Millions per quarter Percentage
0
5
10
15
20
25
M2007
J S D M2008
J S D M2009
J S D M2010
J
TEFDomiciliat ionSPEI
0.0
0.5
1.0
1.5
2.0
2.5
3.0
3.5
M2007
J S D M2008
J S D M2009
J S D M2010
J
0
10
20
30
40
50
60
70
80
90
100
2006 2010
Domiciliat ions TEF SPEI Checks
1/ 2/
Figures as of June, 2010. Source: Banco de México.
Figures as of June, 2010. Source: Banco de México.
Figures as of June, 2010. Source: Banco de México.
1/ Figures from second half of 2005 to first half of 2006. 2/ Figures from second half of 2009 to first half of 2010.
When we look at the total amount of interbank payments that are to some degree interchangeable (SPEI, TEF, automatic charges and checks), we see that the percentage of payments made by check dropped from 83 percent between July 2005 and June 2006 to 55 percent from July 2009 to June 2010. In contrast, the percentage of payments made through SPEI in the same period rose from 6 to 32 percent (graph 74c).
Credit and debit cards
In June 2010, the number of debit cards issued was 13.2 percent higher than in the same month of 2009, while the number of credit cards in use shrank by around 5 percent in the same period (graph 74a). The point-of-sale (POS) terminal network grew by around 8 percent between June 2009 and June 2010, following a rapid increase in previous years. These trends can be attributed to the end of the "terminalization”
138 program that offered banks incentives to install terminals, as
well as to the economic downturn (graph 75b).
137
Automatic bill payment refers to electronic payments in which the client authorizes recurring charges to their deposit account in advance.
138 The "terminalization" program was financed with funding from the Electronic Means of Payment Infrastructure Fund, created to promote and extend access to the electronic payment media network and to encourage the use of such payment media both between businesses and among consumers.

B A N C O D E M É X I C O
112
Graph 75 Credit and debit cards
a) Number of credit and debit cards issued
b) Number of ATMs and POS terminals
c) Number of transactions at POS terminals
Millions Thousands Millions per quarter
0
10
20
30
40
50
60
70
80
M2007
J S D M2008
J S D M2009
J S D M2010
J
Credit cards
Debit cards
15
20
25
30
35
40
150
200
250
300
350
400
450
500
M2007
J S D M2008
J S D M2009
J S D M2010
J
POS ATMs
40
50
60
70
80
90
100
110
120
130
140
M2007
J S D M2008
J S D M2009
J S D M2010
J
Credit cards
Debit cards
Figures as of June, 2010. Source: Banco de México.
Figures as of June, 2010. Source: Banco de México.
Figures as of June, 2010. Source: Banco de México.
Between July 2009 and June 2010, the number of credit card transactions through POS terminals was 0.8 higher than between July 2008 and June 2009 (graph 75c). Similarly, during the same time period, the real value of the transactions rose by 0.38 percent.
The number of debit card transactions through POS terminals between July 2009 and June 2010 was 17.9 percent greater than between July 2008 and June 2009, while the value of the transactions rose 11 percent in real terms during the same time period. In this period, debit card transactions with POS terminals won ground from credit card transactions, accounting for 58.0 percent and 42.0 percent, respectively, of total transactions. This trend correlates with an increase in the number of debit cards and a simultaneous reduction in the number of credit cards.
Automatic teller machines
The number of automatic teller machines in Mexico's ATM network grew 43 percent from June 2006 to June 2010, reaching a total of 34,900. In the same period, out-of-branch ATMs grew more rapidly than in-branch ATMs, at a rate of 52 percent (compared to 29 percent for in-branch ATMs). This is due to the involvement of some banks that are specializing in this market. Since Banco de México provisions on withdrawals at ATMs came into effect, the number of transactions by clients at other banks' ATMs has declined (graph 76), due, among other factors, to the fact users are now better informed.

F I N A N C I A L S Y S T E M R E P O R T
113
Graph 76 ATM Trends
a) Number of ATM installed b) Number of ATM transactions c) Number of ATM transactions
Thousands Millions per quarter Millions per quarter
0
5
10
15
20
25
30
35
40
M2007
J S D M2008
J S D M2009
J S D M2010
J
Total
Outside branch
Inside branch
0
5
10
15
20
25
30
35
40
200
220
240
260
280
300
320
M2007
J S D M2008
J S D M2009
J S D M2010
J
Internal
Interbank
0
2
4
6
8
10
12
14
16
200
220
240
260
280
300
320
340
M2007
J S D M2008
J S D M2009
J S D M2010
J
Debit cards
Credit cards
Figures as of June, 2010. Source: Banco de México.
Figures as of June, 2010. Source: Banco de México.
Figures as of June, 2010. Source: Banco de México.
Between July 2009 and June 2010, more than 98 percent of transactions made with cards at ATM machines involved debit cards; the rest were credit card transactions.
Regulation of ATM fees
Despite the growing number of ATMs in Mexico, their overall coverage remains lower than in other counties with a similar level of development. On average, the ATM network handles more transactions than in other countries (see graph 77). In addition, five banks own 79 percent of the ATMs (Table 13). These banks also account for the lion's share of debit cards (87 percent). Banks consider ATMs part of the service they offer to accountholders, rather than an independent business unit, so they often offer their clients preferential conditions in the use of their ATMs over clients of other banks. This is why cardholders conduct around 90 percent of their transactions at the ATMs of their own bank, and competition to attract clients from other banks to ATM services has not been particularly intense.
Table 13 Concentration indicators
20061/
20102/
20061/
20102/
Herfindahl Index 1,672 1,380 1,947 1,835
Two largest (%) 44 37 52 52
Five largest (%) 88 79 92 87
Number of banks 18 25 18 24
ATMs Debit cards used
Figures as of June, 2010. Source: Banco de México. Note: 2010 data are under revision and subject to change. 1/ Figures from second half of 2005 to the first half of 2006. 2/ Figures from second half of 2009 to the first half of 2010.

B A N C O D E M É X I C O
114
Under the traditional scheme (chart 3a), in effect as of May 2010, a person who used the ATM of a bank that was not their own had two pay two commissions: one to their bank and another to the bank that operated the machine. The first, called "fee for use of outside ATM" varied from 17 to 20 pesos for clients of the five banks with the most extensive ATM networks. This commission included the interbank fee that the client's bank had to pay to the bank that operated the ATM where the transaction took place. This fee was 7.25 pesos and was standard for all ATMs and banks.
139
The second fee, known as the "surcharge," was charged by some ATM operating banks. This commission varied between 8.7 and 26 pesos.
140 The ATM
could not inform users from other banks of the total amount of fees they would have to pay, because the "fee for use of outside ATM" was not the same for all banks. For this reason, ATM users did not know in advance how much they would have to pay in fees for using the ATM of another bank. But the traditional scheme had the advantage that all ATM operator banks charged the same interbank fee (7.25 pesos) to the cardholders' bank every time one of their clients withdrew cash. This arrangement made it easier for banks that lacked an extended ATM network to offer their clients access to the competition's ATM network at a relatively low cost, or at no charge when they chose to subsidize clients' withdrawals at other banks' ATMs. It had other limitations, however, such as the lack of incentives to expand the ATM network.
139
This fee was reached by common agreement among all ATM operators (multilateral). In some countries these commissions are determined bilaterally.
140 The surcharge was collected in 18.4 percent of ATMs.

F I N A N C I A L S Y S T E M R E P O R T
115
Graph 77 International comparisons
a) Number of ATM withdrawals annually b) Number of ATMs in proportion to population
Thousands ATMs per ten thousand inhabitants
0
20
40
60
80
100
120
Sw
ed
en
Ho
llan
d
Bra
zil
UK
Me
xic
o
Ch
ile US
Fra
nc
e
Ge
rma
ny
Belg
ium
Sw
itze
rla
nd
Ca
na
da
Sp
ain
Ita
ly
Sin
ga
po
re
Au
str
alia
Ja
pa
n
0
2
4
6
8
10
12
14
16
18
Ca
na
da
Belg
ium
US
Sp
ain
Au
str
alia
Ja
pa
n
UK
Ge
rma
ny
Ita
ly
Fra
nc
e
Bra
zil
Sw
itze
rla
nd
Ho
llan
d
Ch
ile
Sin
ga
po
re
Sw
ed
en
Me
xic
o
Figures as of December, 2008. Source: Banco de México, BIS, Australian Reserve, Superintendencia de Bancos e Instituciones Financieras de Chile, Banco de España, Banco Central de Brasil, CONAPO, OECD, Instituto Nacional de Estadísticas de Chile y España, Instituto Brasileño de Geografía y Estadística.
Figures as of December, 2008. Source: Banco de México, BIS, Australian Reserve, Superintendencia de Bancos e Instituciones Financieras de Chile, Banco de España, Banco Central de Brasil, CONAPO, OECD, Instituto Nacional de Estadísticas de Chile y España, Instituto Brasileño de Geografía y Estadística.
To encourage greater competition in the ATM business, promote the expansion of the network and make fee collection more transparent, Banco de México ruled that only ATM operators could charge fees for the interbank transactions at ATMs. It also established that card issuing banks could not charge their clients a fee for using an ATM owned by the competition.
ATM operator banks pay a fee (reverse interbank fee) to issuer banks every time one of their clients uses an ATM.
141 This commission compensates the
issuer bank for the costs incurred when their clients use an ATM owned by the competition (figure 3b).
141
Banks call this a reverse interbank fee; this fee amounts to 2.92 pesos for cash withdrawals.
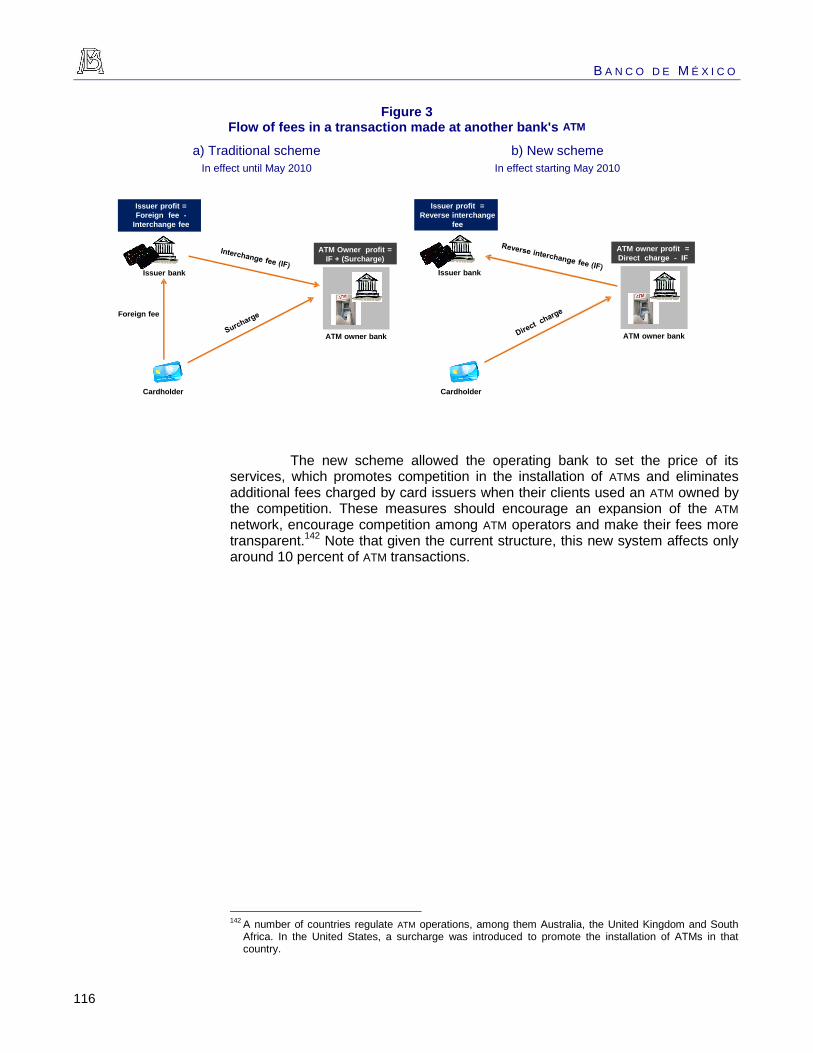
B A N C O D E M É X I C O
116
Figure 3 Flow of fees in a transaction made at another bank's ATM
a) Traditional scheme b) New scheme
In effect until May 2010 In effect starting May 2010
Issuer profit =
Foreign fee -
Interchange fee
Cardholder
ATM owner bank
Issuer bank
Foreign fee
ATM Owner profit =
IF + (Surcharge)
Issuer profit =
Reverse interchange
fee
Cardholder
ATM owner bank
Issuer bank
ATM owner profit =
Direct charge - IF
The new scheme allowed the operating bank to set the price of its services, which promotes competition in the installation of ATMs and eliminates additional fees charged by card issuers when their clients used an ATM owned by the competition. These measures should encourage an expansion of the ATM network, encourage competition among ATM operators and make their fees more transparent.
142 Note that given the current structure, this new system affects only
around 10 percent of ATM transactions.
142
A number of countries regulate ATM operations, among them Australia, the United Kingdom and South Africa. In the United States, a surcharge was introduced to promote the installation of ATMs in that country.

F I N A N C I A L S Y S T E M R E P O R T
117
7. Balance of risks and conclusions
The international economy and financial system are recovering from their most severe crisis in 80 years. Fears of a financial system collapse have eased, and the economic recovery continues, although its pace varies between countries and regions. But the magnitude of the resources committed by advanced economies to support the financial sector and economic activity could turn the current financial crisis into a sovereign debt crisis. In effect, an increase in various countries' funding needs has generated periods of marked uncertainty about the capacity of some governments, particularly in the Euro zone, to meet their debt maturities. The situation has forced a large number of countries, particularly in Europe, as well as local and municipal authorities, to take extraordinary measures to improve their fiscal positions. Although these measures have enabled them to continue rolling over debt as it comes due, they have not completely eliminated concerns about the sustainability of their fiscal position.
The increase in credit risk associated with sovereign debt has been reflected in rising concerns about the situation of banks that are heavily invested in European bonds. Although stress testing by the European financial authorities served to partially dispel these fears, there is a persistent risk of new episodes of volatility that may once again make it harder for banks in this region to refinance their maturing debt. Furthermore, low interest rates and different extraordinary support mechanisms have not provided the right incentives for financial institutions to quickly clean up their balance sheets or improve their funding sources.
Fears of weaker global economic activity intensified with the publication of some indicators showing a less vigorous US economy. Ongoing signs of global economic weakness and the presence of extraordinary monetary accommodation measures in advanced countries, combined with the need to strengthen public finances in those countries, has created a climate of unusual uncertainty, which could be prolonged in the short term.
Inflows into emerging economies have significantly increased, drawn in by interest rate spreads and expectations that interest rates in developed countries will remain low for a prolonged period of time. But growth in these flows constitutes a major risk factor in the medium term. A shift in the risk-yield ratio could prompt a sudden reversal of flows to these economies, and possibly spread to other channels and markets. Capital flows to emerging economies could also change dramatically when advanced economies begin to dismantle their monetary stimulus measures.
Expectations that advanced economies will keep their lax monetary policies in effect for an extended period of time, and particularly that the Federal Reserve will intensify its monetary stimulus, have weakened the dollar against other currencies. To keep their currencies from appreciating further against the dollar, a large number of countries have increased their intervention in forex markets and have even introduced measures like capital controls or taxes on incoming flows to slow their arrival.
B A N C O D E M É X I C O
118
Increasing tensions in foreign exchange markets may be associated with various risks to the international monetary system and the global economic recovery. Interventions in these markets have resulted in a substantial accumulation of reserves by various central banks. The investment of these reserves in dollars helps keep interest rates in this currency low, and thus encourages growth in capital flows toward economies with higher interest rates. Growth in flows and less-than-effective forex intervention has tempted some countries to adopt protectionist measures toward international trade, thereby jeopardizing the global economic recovery. Finally, the intensification of disequilibria stemming from the dollar's depreciation and increased flow of capital toward emerging economies could generate sizeable financial bubbles in those countries. Under these circumstances, it is very likely that we will see significant short-term fluctuations in variables like exchange rates, interest rates, and the prices of other financial assets, creating a climate of marked volatility and uncertainty for financial market participants.
The Mexican financial system has for its part proven its capacity to absorb both the direct effects of the crisis in its financial markets and losses caused by the slowing of economic activity. This robustness is the product of efforts made in recent years to improve the quality and quantity of financial institutions' capital, improve their regulation and strengthen supervision processes, as well as the business models prevailing in Mexico's largest banks, which prioritize lending using funding from deposits stemming from the retail market in domestic currency.
The climate of macroeconomic stability resulting from the fiscal and monetary discipline of recent years, along with the maturity and depth of the country’s financial markets, the fruit of measures to promote development, also helped mitigate the effects of the crisis in Mexico. In effect, the country’s financial markets were not as heavily impacted as those of other countries. So despite a highly unfavorable economic climate, Mexican commercial banks reported profits, and their aggregate capital adequacy ratio was 17.6 percent as of June 2010. Furthermore, as mentioned earlier, bank capital was made up primarily of Tier 1 capital.
At the same time, the first half of 2010 saw a turnaround in the rising trend in default rates on mortgage and consumer loan portfolios among Mexican banks. Nevertheless default ratios in general continued to rise, particularly with respect to retail credit, due to slower economic growth in 2009. Meanwhile, VaR in the market and credit measured in proportion to net capital declined as a result of an increase in the capital-to-risk ratio in the period studied. In the stress testing that was carried out, losses did not generate heavy-tail distributions and no bank presented significant losses in its capital adequacy, so no process of contagion was unleashed.
An analysis of potential risk of spillover through the interbank market showed a reduction in the level of risk in recent months, both in the number of banks that would be affected by the chain of contagion, and by the relative size of their assets. With regard to spillover from sources outside Mexico, the exposure of commercial banks to foreign counterparties significantly decreased starting in June 2009. The average liquidity position of Mexican banks improved slightly in the second half of 2009. However, the performance of this indicator has varied both between groups of banks and within each group. Most of the large banks

F I N A N C I A L S Y S T E M R E P O R T
119
tend to have comfortable liquidity positions, while the situation of medium-sized and small banks and banks associated with commercial chains (BACC) differs. The reduction in long-term rates enabled mutual funds and retirement funds (SIEFORES) to recover their asset value.
Although the crisis did not affect the financial system's solvency, its impact on the real sector of the economy triggered a sharp reduction in funding. The supply of funding shrank as risk aversion rose and default ratios climbed. Demand for credit waned as a result of the decline in demand for goods and services and erosion of household financial positions associated with job losses. The timely introduction of support and guarantee programs by development banks helped ease these episodes of credit tightness, but the reactivation of certain areas of private domestic demand, particularly investment, is still incipient and has not yet translated into increased borrowing.
The Mexican financial system is well capitalized, and therefore has the potential to contribute positively to the recovery of economic activity. Under these circumstances, structural reforms are increasingly important in order to increase the productivity and competitiveness of the Mexican economy. They include amendments to the Anti-Trust Law, labor reform, improvements to the justice system, and in general reforms that would lower regulatory and non-regulatory costs and provide greater certainty to the various economic agents.
The crisis showed how important it is to have effective mechanisms for identifying, measuring and evaluating potential risks to the financial system's stability, and to coordinate policies that could mitigate these. Effective supervision of financial institutions on an individual basis is not sufficient for identifying risk factors that could pose a threat to that stability. That is why institutional arrangements are necessary to facilitate the introduction of macro-prudential policies which should help mitigate any risks that might arise, for example, from the exposure of various institutions to a common risk factor, from bilateral exposures between financial intermediaries, or from the impact of the insolvency of one financial intermediary on other institutions. Macro-prudential policy would also seek to establish measures to prevent and offset the effects of pro-cyclical trends in the regulation itself, or the emergence of imbalances in different markets.
A fundamental element for achieving these goals is the promotion of greater cooperation, coordination and exchange of information among the regulatory agencies in charge of financial stability in Mexico. In response to this need, in July 2010 the Financial System Stability Council (or CESF, according to its initials in Spanish) was created.
143 The purpose of the CESF is to assist in
identifying situations that could jeopardize the proper working of the Mexican financial system and the country's economic development, and to propose policies and solutions for dealing with such situations.
143
The Council is made up of the Secretary and Under Secretary of Finance and Public Credit, the Governor and two Deputy Governors of Banco de México and the heads of the CNBV, CNSF, CONSAR and IPAB.

B A N C O D E M É X I C O
120
Appendix: International agenda for financial regulation reforms
G20 member countries agreed to conduct a thorough review of the financial principles and regulations issued by various international organizations
144
in order to reduce the likelihood of another situation similar to what was experienced during the recent international crisis occurring. Among the most important of these proposals are capital regulation reforms presented by the Basel Committee on Banking Supervision (BCBS); the new liquidity requirements proposed by that Committee; the treatment of "systemically important" banks; proposed regulations on over-the-counter derivative trading and work on converging accounting standards. G20 authorities are committed to the goal of forging agreements for all member countries. On the issues of capitalization and liquidity, these agreements are being reached through the BCBS. But on other issues, initiatives toward reform on the national level are progressing more rapidly than the international agenda. This means regulations may differ from country to country, which could have major repercussions in an increasingly global financial system.
Basel Committee Capitalization and Liquidity Rules
The Basel Committee has come to some significant agreements on modifying capitalization rules, which were announced by the Committee in September 2010. They entail relatively long implementation periods, so the impact of these proposals will be gradual. The most important changes contained in the proposal are presented below.
Raising the quality, consistency and transparency of capital
The international crisis made it clear that when computing their capital, many institutions included assets that did not have the capacity to absorb losses as they materialized. The Basel Committee has proposed measures for strengthening capital's capacity to absorb losses.
145 The first consists of limiting
the composition of Tier 1 capital to common stock, retained earnings and bank capitalization instruments with specific characteristics that guarantee their capacity for absorbing losses. The Committee is analyzing the possibility of creating clauses enabling subordinated debentures included in capital to be converted into common stock when the regulatory authorities so decide, when the bank's capitalization index falls below a certain limit, or when it is determined that the bank is no longer viable without government support.
146 The second measure
involves limiting the inclusion in Tier 1 capital of balance sheet items that cannot
144
The Financial Stability Board (FSB), the Basel Committee on Banking Supervision (BCBS), the International Organization of Securities Commissions (IOSCO), the International Association of Insurance Supervisors (IAIS), the International Accounting Standards Board (IASB), and the United States Financial Accounting Standards Board (FASB).
145 Basel Committee on Banking Supervision, Strengthening the Resilience of the banking sector, consultative document, BIS, 2009.
146 On August 19, 2010, the Basel Committee published a consultative document called Proposal to ensure the loss absorbency of regulatory capital at the point of non-viability, with a concrete proposal on this matter.

F I N A N C I A L S Y S T E M R E P O R T
121
be easily liquidated in the event the bank enters a situation of crisis or insolvency, and therefore do not have the capacity to absorb losses (see table 14).
147
Table 14 Regulatory capital adjustments proposed by Basel Committee
Current regulation in
Mexico
Items that must be deducted from calculation of Tier 1 capital
1 Minority interest P
2 Goodwill and other intangible assets P
3 Deferred taxes P
4 Investment in own stock P
5 Investment in equity in banks, financial firms and
insurance companies outside of regulatory sphere of
consolidationP
6 Shortfall of reserves for expected losses P
Basel Committee Proposal
Source: Banco de México y BCBS, Strengthening the resilience of the banking sector, consultative document, 2009.
These reforms to raise the quality, consistency and transparency of the capital base will have limited implications and impact on Mexican banks, because most of the improvements are already contained in current Mexican regulations. Following the 1995 crisis, the Mexican financial authorities conducted an exhaustive review of the regulations. As part of this effort, bank capitalization rules were overhauled to strengthen regulatory capital, adjust it to international principles and deduct balance sheet items with little or no capacity to absorb losses in crisis situations. Accordingly, Mexican banks must deduct the following from their Tier 1 capital: items accountable as intangible, including goodwill, investments in the capital of financial firms, some investments in the capital of non-financial firms, reserves pending creation, and deferred taxes that exceed 10 percent of Tier 1 capital. Because of these regulations, the levels and quality of capital in Mexican banks compare very well against those of other countries' banks.
One of the aspects that may have an impact on Mexico and on other emerging economies is the requirement that subordinated debt be permanent or perpetual in order to be counted as Tier 1 capital. Established banks in emerging economies may find it difficult to issue subordinated debt of this kind in international financial markets. Extant capital regulations in Mexico require that subordinated debt have the capacity to absorb losses but not that it be perpetual. This regulation establishes that in order to count subordinated debt within Tier 1 capital, it must be possible to defer the principal payment if the bank enters an early warning situation (article 134 Bis 1 of the Law on Credit Institutions). Additionally, and based on Basel Committee guidelines, the subordinated debt gradually loses its eligibility to be counted as Tier 1 capital as its expiration date approaches (see table 15).
147
Among the items that would not be completely eliminated are deferred taxes, investment in financial institutions, and rights from the issue of mortgage-backed securities. Only 10 percent of each of these three lines may be counted on an individual basis, and together they may not make up more than 15 percent of Tier 1 capital.

B A N C O D E M É X I C O
122
Table 15 Weight of subordinated debt in regulatory capital
Term to maturityPercent of current
amount
More than 2 years 100
More than 1 and up to 2 years 50
Up to 1 year 0
Source: CNBV.
Capital requirements for the trading book, asset-backed securities and counterparty risk
The recent crisis also brought to light weaknesses in the calculation of capital requirements due to exposure in the trading book, asset-backed securities (which played a major role in the emergence and spread of the crisis) and counterparty risk. In particular, it was agreed that capital requirements associated with asset-backed securities and transactions with complex derivatives associated with banks' trading book, would be calculated under scenarios that include a stress period to ensure a more effective coverage of risk factor volatility. The proposal also establishes a requirement for losses associated with the deterioration in counterparty credit risk. This requirement must also be calculated under stressed conditions, and complements the requirement for default risk included in current rules. The increase in the counterparty risk requirements seeks to create an incentive to use central counterparties for transactions in derivatives. Central counterparties that meet the guidelines established in the proposals will receive preferential treatment, meaning the counterparty risk requirement will be lower for transactions with them.
Capital reserves and provisions for expected losses
The international financial crisis revealed the strong cyclical component of banks' performance, and pro-cyclicality of current capital requirements. To address these issues, the Committee proposed that banks create two types of capital reserve. The first would be made up of conservation reserves, which must be sufficient to keep bank capital levels higher than the regulatory minimum, even during phases of stress. The objective would be to gradually reach a level of 1.5 percent of risk weighted assets by the start of 2019. The second would be made up of counter-cyclical reserves which would be an extension of the conservation reserves and would be created only during the expansion and boom phases of the economic cycle, and used during the downward phase. The purpose of the counter-cyclical reserves would be to protect the banking sector from the risk associated with excessive lending in boom periods. The level of counter-cyclical reserves would be within a range established by the authorities of each country. Banks have also been encouraged to create reserves based on models of expected loss, instead of on the basis of realized losses.
In Mexico, regulation is already progressing in this direction. In September 2009 the methodology for rating the revolving consumer credit portfolio (including credit cards) was changed in order to apply a model based on expected losses, in which the institution calculates the level of reserves necessary to cover the losses that may occur in the next year. Additionally, in early 2011 a
F I N A N C I A L S Y S T E M R E P O R T
123
similar regulation will be adopted for non-revolving consumer credit and mortgage loans.
Leverage Index
Because capital is the costliest funding component for banks, these try to finance their assets using deposits and debt. Mindful of this practice, and of the excessive buildup of debt levels during the crisis, the Basel Committee proposes setting a limit on leverage. The idea is to develop an indicator that is not affected by accounting differences between countries, minimizes exemptions and includes off-balance sheet items. Between January 2013 and January 2017, a preliminary proposal will be vetted to maintain a leverage ratio of at least 3 percent of Tier 1 capital to assets. Based on the results of the observation period, the Committee will make adjustments to the proposal in the first half of 2017, before including it in January 2018 as a Tier 1 requirement. This new regulation is not expected to affect the Mexican banking system, since leverage levels in recent years have been below those reported by the world's largest banks.
Liquidity requirements
The crisis illustrated the severity and speed with which liquidity risk can materialize. Some institutions with insufficient liquidity management were forced into failure or bankruptcy.
148 To encourage institutions to keep liquidity risk within
prudent limits, in December 2009 the Basel Committee issued a proposal with two regulatory liquidity requirements for banking institutions: the Liquidity Coverage Ratio (LCR) and the Net Stable Funding Ratio (NSFR).
149
The purpose of the LCR is to ensure that at all times banks have high quality liquid assets to cover their cash flow needs for the next 30 days under adverse financial scenarios and reduce liabilities. By meeting this requirement, bank shareholders and authorities would have a month to take the measures necessary to tackle the problem. The purpose of the NSFR, on the other hand, is to improve the liquidity structure of banks' balance sheets over horizons of more than a year. Banks must maintain a maturity profile appropriate to the structure of their assets. Specifically, they must have capital and stable funding levels (liabilities at terms of more than a year and a high proportion of demand and time deposits) sufficient to cover the non-liquid portion of their assets at terms of more than a year.
The Committee has reviewed these proposals in light of the results obtained in impact studies and from the remarks of the authorities of various countries, international organizations and the banking industry. The NSFR proposal has been met with strong criticism and is undergoing an in-depth review. The Committee is expected to present a proposal at the end of 2010, which will be submitted for a long period of observation. As with the reforms on the matter of capitalization, the Basel Committee proposes relatively long implementation periods. Institutions in the Mexican banking system generally have adequate liquidity levels, although some institutions must take measures to improve the structure of their balance sheets.
148
See Box 31 of the July 2009 Financial System Report. 149
The Basel Committee had already issued Principles for Sound Liquidity Risk Management and Supervision (BIS, 2008).

B A N C O D E M É X I C O
124
Treatment of systemically important banks
Particularly important among the list of regulatory proposals are those whose purpose is to reduce the likelihood and impact of the failure of institutions that may generate systemic risks. In this section we present an analysis of the possible impact on emerging economies of the regulatory proposals being discussed in this regard. Note that while major regulatory reforms are being considered, the committee is also re-evaluating the methods and scope of the process for supervising institutions considered systemically important.
Capital and liquidity surcharges150
Measures that have been proposed include levying additional capital and liquidity charges on financial institutions whose failure could have systemically significant effects, in an attempt to force such institutions to internalize some of the costs they impose on society when they run into trouble. However, these measures have stirred up heated debate over the impact they could have on market discipline and the cost of financial intermediation.
Furthermore, forcing institutions to internalize the costs they could impose on society depends on the creation of an indicator that would allow them to apply different fees for different levels of systemic importance. Although there have been efforts to create such an indicator, so far none has been developed that appropriately captures institutions' degree of systemic importance.
151 In the
absence of an indicator like this that would be sensitive to the institution's risk, the application of capital and liquidity surcharges would only increase the incentives for the institutions on which they were imposed to increase the risk of their activities in order to offset the higher costs. Furthermore, capital and liquidity surcharges would translate into higher intermediation costs, which the institutions would probably transfer to users via higher lending rates, lower deposit rates or higher fees. This is particularly important in emerging economies with financial systems characterized by the strong presence of global banks. Also, the costs and benefits of a measure of this nature would be distributed unevenly between the country where the parent bank is established and the country where it has affiliates. The additional capital imposed by the regulation would be at the disposal of the parent company, because it consolidates the accounting balances of the affiliates. But there is no legal obligation for the parent company to support an affiliate in trouble by using this capital, even though the affiliate would also be running up costs resulting from the imposition of capital and liquidity surcharges.
Contingent capital and conversions to equity
The purpose of this proposal is to facilitate the expansion of capital stock by a troubled institution so that it can continue functioning, and to reduce the exposure of capital contributors to an imminent government intervention. This
150
The application of special quotas to systemic banks has also been proposed with a view to reducing the moral risk associated with them and to create a fund for their orderly clean-up, which also brings down the fiscal costs of such processes.
151 The IMF, the BIS and the FSB have worked on the preparation of a systemic importance indicator based on three characteristics: the institution's size, its degree of interconnection with other institutions and the ease with which other institutions can substitute for its activities in the markets. However, the development of such an indicator has come up against some obstacles, including the lack of information. This project has been taken up by the BCBS.

F I N A N C I A L S Y S T E M R E P O R T
125
could be achieved by issuing subordinated debentures and other liabilities convertible to capital stock. Thus, when the capital stock falls below a certain limit or certain preset conditions are met, the subordinated debentures would automatically be converted into capital stock in the bank in question. Another possibility is to give the authorities the ability to convert any capital instrument, or even some unsecured liabilities that are not covered by deposit insurance, into capital stock or reduce its nominal value.
This is a reasonable option for quickly restoring a troubled institution's capital levels, and also encouraging market discipline. But its implementation poses some problems. To avoid uncertainty and facilitate the placement of these instruments, the convertibility conditions must be clearly stipulated, making every attempt to avoid subjective appreciation. One of the potential benefits of a contingent capital issue is the increase in market discipline. This depends largely on the existence of a secondary market for these instruments, in which the excessive assumption of risk would be reflected in the yield on the debentures. But these markets must have sufficient depth, which is often not the case in many countries. The inability to place new issues would also be a useful signal to mitigate this risk.
Handling of cross-border crises
One proposal for mitigating the impact of the failure of a systemically important institution has been to bolster international cooperation for handling cross-border crises. One of the biggest obstacles to the orderly resolution of a systemically important institution is the confluence of different jurisdictions and financial authorities operating under different legal frameworks and supervisory practices. The financial markets and institutions have become highly globalized, but the laws, regulations and supervisory practices are still organized around national jurisdictions. For this reason, in the absence of a supranational financial authority with the power to supervise and apply international regulations for cross-border institutions, the best option is to work on harmonizing supervision and regulatory practices in each of the countries that may be involved in the resolution of a multi-national bank.
Regulation of OTC derivatives
The financial reform agenda includes a series of measures agreed upon by the G20 with a view to identifying, controlling and reducing risk associated with over-the-counter derivative trading. Standardized over-the-counter derivatives should be traded through electronic platforms or organized markets. The aim is for all standardized over-the-counter derivatives to be settled through centralized counterparties by the end of 2012. It was also agreed that all over-the-counter derivative contracts be reported in central registries, and that any derivative transaction that cannot be settled by a central counterparty be subject to greater capital requirements.
A work group created in April 2010 by the FSB will issue recommendations on implementing the measures proposed by the G20. This group recognized that there are three elements that must be present in an over-the-counter derivative transaction in order for it to be able to be settled through a central counterparty and thus guarantee proper risk management: transparent
B A N C O D E M É X I C O
126
pricing; appropriate risk characteristics that facilitate effective management of risk exposure;
152 and trading volume with sufficient liquidity.
The FSB work group will also discuss the convenience of exempting non-financial firms who are the end users of over-the-counter derivatives from the centralized settlement requirements.
153 This would be important, for example, for
companies that produce energy or other merchandise whose products are difficult to standardize. For this type of company that can only meet hedging requirements with customized derivatives, centralized settlement and standardization measures will force them to alter their hedging schemes, and may possibly generate additional costs or liquidity requirements (for example, margin requirements and margin calls, among others).
The proposed measures would also require mandatory and detailed reporting in central registries of transactions involving over-the-counter derivatives that could not be settled through a central counterparty. The advantage of having centralized records is that it would guarantee the transparency of these transactions and facilitate the handling of information. These measures should be applied consistently across the globe in order to avoid regulatory arbitrage. It is also recommendable that the measures be introduced gradually to avoid adversely impacting the liquidity and depth of still-incipient over-the-counter derivative markets.
Promoting the convergence of international accounting standards
The two organizations that define accounting standards--the International Accounting Standards Board (IASB), in the international sphere, and the Financial Accounting Standards Board (FASB), in the United States, do not concur on the treatment and registry of various types of transactions. The difference between the standards of these two organizations makes it difficult to compare financial statements of institutions established in different countries. It also forces banks that are affiliates of a foreign bank to report on their operations using two different sets of standards. Thus, the affiliate of an international bank must comply with the accounting standards of the country where it is domiciled, and consolidate its financial statements in keeping with accounting standards applicable in the country where its parent company is located, which may be different.
To address these difficulties, the FSB promotes the adoption and convergence of accounting standards by 2012 at the latest. One of the biggest challenges to this convergence process is the harmonization of the differing focuses of the two accounting bodies on matters such as the classification and valuation of financial instruments, loan-loss reserves based on expected losses, and the accounting treatment of hedges.
152
In this case, the complexity and diversity of risk associated with some over-the-counter derivatives will pose a challenge to the central counterparty, which must address the risks contained in the derivatives to be settled by applying measures that are most efficient for mitigating those risks, including even stressed conditions under which risk exposures can change dramatically.
153 The recently approved Dodd-Frank Wall Street Reform and Consumer Protection Act exempts non-financial end users from the centralized settlement requirement provided they notify the Commodity Futures Trading Commission of their habitual use of over-the-counter derivatives for risk hedging purposes.