financial system review - june 2017 - bank of canada · in july 2016 the office of the...
TRANSCRIPT

Financial System ReviewJune 2017
Financial System Review
—June 2017
Revue du système fi nancier —
Juin 2017

Canada’s Financial SystemThe Financial System and the Economy� A stable and effi cient fi nancial system is essential for
sustained economic growth and rising living standards.
� The ability of households and fi rms to channel savingsinto productive investments and manage the associatedrisks with confi dence is one of the fundamental buildingblocks of our economy.
Systemic Risk� Financial system vulnerabilities are pre-existing condi-
tions that can amplify or propagate shocks. Examplesinclude high leverage and asset price misalignments,as well as maturity and funding mismatches. The inter-action between vulnerabilities and triggers can leadto the realization of risks that can impair the fi nancialsystem and harm the economy.
� Actions to reduce vulnerabilities and increase the resili-ence of the fi nancial system help reduce systemic riskand support fi nancial stability.
The Role of the Bank of Canada � As part of its commitment to promote the economic and
fi nancial welfare of Canada, the Bank of Canada activelyfosters a stable and effi cient fi nancial system.
� The Bank does this by providing central banking services,including various liquidity and lender-of-last-resortfacilities, overseeing key Canadian fi nancial marketinfrastructures, conducting and publishing analyses andresearch, and helping to develop and implement policy.
� The Bank collaborates with international, federaland provincial authorities to achieve its fi nancialsystem goals.
The Financial System Review� In the Financial System Review (FSR), the Bank analyzes
the resilience of the Canadian fi nancial system. Thefi rst section of the FSR summarizes the judgment ofthe Bank of Canada’s Governing Council on the mainvulnerabilities and risks to fi nancial stability. It also high-lights the efforts of authorities to mitigate those risks.
� Financial and macroeconomic stability are interrelated.The FSR’s assessment of fi nancial risks is thereforepresented in the context of the Bank’s assessment ofmacroeconomic conditions, as given in its MonetaryPolicy Report.
� The FSR also presents staff analysis of the fi nancialsystem and policies to support its resilience. Moregenerally, the FSR promotes informed discussion on allaspects of the fi nancial system. The Financial SystemReview is available on the Bank of Canada’s website atbankofcanada.ca.
For further information, contact:
Public InformationCommunications DepartmentBank of Canada234 Wellington StreetOttawa, Ontario K1A 0G9
Telephone: 613-782-8111; 1-800-303-1282 (toll-free in North America)Email: [email protected]; Website: bankofcanada.ca
ISSN 1705-1290 (Print)ISSN 1705-1304 (Online)© Bank of Canada 2017
Financial System ReviewJune 2017
The Assessment of Vulnerabilities and Risks section is a product of the Governing Council of the Bank of Canada: Stephen S. Poloz, Carolyn A. Wilkins, Timothy Lane, Lawrence Schembri, Lynn Patterson and Sylvain Leduc.
This report includes data received up to 1 June 2017.
Contents
Assessment of Vulnerabilities and Risks . . . . . . . . . . . . . . . . . . . . . . . . . . . 1
Macrofinancial Conditions . . . . . . . . . . . . . . . . . . . . . . . . . . . . . . . . . . . . . . . . . . . . . . . . 1
Key Vulnerabilities in the Canadian Financial System . . . . . . . . . . . . . . . . . . . 3
Policy Changes Affecting Canada’s Housing Sector . . . . . . . . . . . . . . . . . . . . . . 3
Vulnerability 1: Elevated Level of Canadian Household Indebtedness . . . . 4
Vulnerability 2: Imbalances in the Canadian Housing Market . . . . . . . . . . . 10
Vulnerability 3: Fragile Fixed-Income Market Liquidity . . . . . . . . . . . . . . . . . . 16
Vulnerability 4: Cyber Threats and Financial Interconnections . . . . . . . . . . 17
Key Risks . . . . . . . . . . . . . . . . . . . . . . . . . . . . . . . . . . . . . . . . . . . . . . . . . . . . . . . . . . . . . . . . . . . 18
Risk 1: A Severe Nationwide Recession Leading to a Rise in Financial Stress . . . . . . . . . . . . . . . . . . . . . . . . . . . . . . . . . . . . . . . . . . . . . . . . 19
Risk 2: A House Price Correction in Overheated Markets . . . . . . . . . . . . . . .20
Risk 3: A Sharp Increase in Long-Term Interest Rates Driven by Higher Global Risk Premiums . . . . . . . . . . . . . . . . . . . . . . . . . . . . . . . . 21
Risk 4: Stress Emanating from China or Other Emerging-Market Economies . . . . . . . . . . . . . . . . . . . . . . . . . . . . . . . . . . . .22
Assessing the Resilience of the Canadian Financial System . . . . . . . . . . .22
Appendix: Mortgage Finance Policy Changes in Canada . . . . . . . . . . . . . .24
Reports . . . . . . . . . . . . . . . . . . . . . . . . . . . . . . . . . . . . . . . . . . . . . . . . . . . . . . . . . . . . . . . . . . . .27
Using Market-Based Indicators to Assess Banking System Resilience . . . . . . . . . . . . . . . . . . . . . . . . . . . . . . . . . . . . . . .29
Cameron MacDonald and Maarten R. C. van Oordt
Canada’s International Investment Position: Benefits and Potential Vulnerabilities . . . . . . . . . . . . . . . . . . . . . . . . . . . . . . . . . . . .43
Gabriel Bruneau, Maxime Leboeuf and Guillaume Nolin
Project Jasper: Are Distributed Wholesale Payment Systems Feasible Yet? . . . . . . . . . .59
James Chapman, Rodney Garratt, Scott Hendry, Andrew McCormack and Wade McMahon

Assessment of Vulnerabilities and RisksMacrofinancial ConditionsGlobal economic growth is strengtheningThe global economy continues to gain traction, and growth is expected to gradually strengthen and broaden. While temporary factors weighed on US economic activity in the first quarter, the fundamental drivers of growth remain solid. The Chinese economy’s transition to a more sustainable growth path is under way, but concerns remain about high leverage, particu-larly in corporate and state-owned enterprises.
Recent economic data suggest that the Canadian economy has evolved largely as expected, posting a robust start to 2017. The economy has shown tentative signs of the desired broadening, including growth in business investment. However, Canadian exports remain weak amid ongoing geo-political and economic policy uncertainties that continue to cloud both the global and Canadian outlooks.
Equity prices have increased while government bond yields have declined modestlyGlobal equity markets have continued to rise, supported by improving global growth and stronger corporate earnings. At the same time, the price-to-earnings ratio for the S&P 500 marked its highest level since the early 2000s, and the equity risk premium remains at low levels. Credit spreads have continued to decline, and capital flows into emerging-market econ-omies (EMEs) have resumed after turning negative in late 2016.
Yields of long-term government bonds have declined modestly in recent months and remain low by historical standards, supported by continued accommodative monetary policy in the major advanced economies.
Despite increased geopolitical risk and high economic policy uncertainty, short-term measures of implied market volatility, such as the Chicago Board Options Exchange Volatility Index (VIX), remain near record lows (Chart 1). Other metrics, however, suggest market participants are pricing in the potential for greater risk over the medium term. For example, the relative steepness of the VIX futures curve suggests that market participants may be expecting volatility to return to average historical levels over the next year.
ASSeSSment oF VulneRAbilitieS And RiSkS 1 BANK OF CANADA • FINANCIAL SySTEM REVIEw • JuNE 2017

Canadian lending conditions remain stableBusiness-lending conditions in Canada are unchanged over recent months. Consumer-lending conditions have also been stable, but an increased dif-ferentiation between mortgage types in response to the recent changes in housing finance policy (discussed below) is becoming evident. Lenders are charging a small premium of around 10 to 20 basis points on some mort-gages that are no longer eligible for mortgage insurance.
In late May, Moody’s downgraded the credit ratings of the Big Six Canadian banks, citing increased private sector debt and elevated house prices.1 Overall, the market reaction to the downgrade was modest, with little impact on long-term funding costs and mortgage rates. The credit ratings of the Big Six Canadian banks remain broadly equal to or higher than those of most global banks, including those in the United States, the euro area and Australia.
Recently, financial markets have focused on the mortgage lender Home Capital Group in the wake of its funding and liquidity issues (Box 1). The first steps of a market-based solution have emerged, and market participants have evaluated the situation as largely isolated to this lender. Mortgage rates more broadly have not been affected, but there is some evidence that borrowers who do not meet all the criteria of traditional lenders have experi-enced increased rates.2
1 The Big Six Canadian banks are the Bank of Montreal, Canadian Imperial Bank of Commerce, National Bank of Canada, Bank of Nova Scotia, Royal Bank of Canada and Toronto Dominion Bank.
2 R. McLister, “The Home Capital Effect: Mortgage Rates Spike for Riskier Borrowers,” The Globe and Mail, 4 June 2017.
File information (for internal use only): Chart 1 - VIX_EN.indd
Last output: 06/05/17 - 03:57PM
Chart 1: US economic policy uncertainty has been elevated while the VIX remains at low levels
US policy uncertainty index (30-day moving average, left scale)
VIX index (right scale)
Note: The VIX is a volatility index derived from options on the S&P 500 index.
Sources: Economic Policy Uncertainty and Bloomberg Finance L.P. Last observation: 1 June 2017
5
10
15
20
25
30
35
40
45
Jan Apr Jul Oct Jan Apr Jul Oct Jan Apr
Index
40
60
80
100
120
140
160
Index
2015 2016 2017
December FSR
2 ASSeSSment oF VulneRAbilitieS And RiSkS BANK OF CANADA • FINANCIAL SySTEM REVIEw • JuNE 2017
Key Vulnerabilities in the Canadian Financial SystemThe most important vulnerabilities for the Canadian financial system in the judgment of Governing Council are interrelated:
� elevated level of Canadian household indebtedness
� imbalances in the Canadian housing market
The Financial System Review (FSR) also discusses two vulnerabilities related to the structure of the financial system:
� fragile fixed-income market liquidity
� cyber threats and financial interconnections
Because these structural vulnerabilities are slower to change, the Bank monitors them closely but will not necessarily update them in every issue of the FSR.
Policy Changes Affecting Canada’s Housing SectorAs background information to the discussion of the first two vulnerabilities, the following is a description of recent policy changes and forthcoming announcements that are expected to influence household and housing vulnerabilities. A review of post-crisis reforms to mortgage finance policy, including changes made last autumn, is presented in the Appendix on page 24.
Residential mortgage underwriting standards will be clarifiedIn July 2016 the Office of the Superintendent of Financial Institutions (OSFI) communicated its intention to increase supervisory scrutiny on underwriting practices of federally regulated lenders and broadly review Guideline B-20,
Box 1
Recent Funding Stress at Home Capital GroupIn April 2017, Home Trust, a federally regulated mortgage lender that is part of the Home Capital Group (HCG), experienced a rapid withdrawal of certain deposits . The withdrawal coincided with allegations made by the staff of the Ontario Securities Commission that the fi rm failed to adequately disclose a 2014–15 review of mortgage ori-gination business partners and underwriting processes, remediation actions and the associated eff ects on business operations .
Against a backdrop of increasing household indebtedness and housing market imbalances (vulnerabilities 1 and 2 in this issue), depositors were sensitive to information about the business prospects of mortgage lenders . This focus was particularly acute for HCG because its main business is mortgage lending to borrowers who do not meet all the lending criteria of traditional fi nancial institutions .
Despite the fact that mortgage arrears rates remained low, deposits were withdrawn from HCG . The resulting funding
and liquidity strain highlighted the vulnerability associated with overreliance on less-stable funding sources .1 To date, HCG has been able to fi nd a market-based solution to this liquidity stress by securing a collateralized line of credit against a portion of its mortgage portfolio . On 30 May 2017, HCG stated that it continues to work on developing longer-term liquidity solutions .
The market largely viewed this situation as idiosyncratic to HCG, which accounts for about 1 .5 per cent of Canadian mortgage lending . Market participants have remained confi -dent in the capital and liquidity position of other Canadian lenders .2 Federal fi nancial sector authorities are working collaboratively to monitor the situation at HCG .3
1 See Box 2 in the June 2014 Bank of Canada Financial System Review .
2 There was little impact on the funding costs for the Big Six Canadian banks, and their average funding cost has decreased by about 20 basis points since the December FSR .
3 See “Assessing the Resilience of the Canadian Financial System” on page 22 .
ASSeSSment oF VulneRAbilitieS And RiSkS 3BANK OF CANADA • FINANCIAL SySTEM REVIEw • JuNE 2017

Residential Mortgage Underwriting Practices and Procedures.3 According to OSFI, proposed changes to B-20 will be published for public consultation in the coming weeks.4
New housing measures were introduced by the Ontario governmentWith the objectives of improving affordability, bringing stability to the real estate market and protecting the investment of homeowners, the Province of Ontario unveiled its Fair Housing Plan in April 2017.5 The Plan introduces a number of demand- and supply-side measures, including the following:
� the non-resident speculation tax, a 15 per cent tax on the purchase or acquisition of an interest in residential property located in the Greater Golden Horseshoe area by individuals who are not Canadian citizens or permanent residents or by foreign corporations and taxable trustees6
� the expansion of rent controls to all rental properties, including those built after 1991
� measures designed to increase housing supply, including
� freeing surplus provincial land for residential construction
� empowering municipalities to introduce a vacant homes property tax (subject to legislative approval)
� providing a rebate for a portion of the development charges related to the construction of new rental units
Vulnerability 1: Elevated Level of Canadian Household IndebtednessHighly indebted households have less flexibility to deal with sudden changes in their income. As the number of these households grows, it is more likely that adverse economic shocks to households would significantly affect the economy and the financial system.
The vulnerability associated with household indebtedness has increased. The overall level of mortgage debt relative to income continues to rise. The housing finance policy measures introduced by the federal government last autumn were aimed primarily at improving the quality of new mortgage debt and have been effective in achieving this goal in the insured sector (Box 2). At the same time, the share of uninsured mortgages is increasing, especially in markets with high house prices, and there is some evidence of increased risk in these mortgages. The greater use of home equity lines of credit (HELOCs) could also be contributing to this vulnerability.
Household indebtedness has continued to riseThe ratio of household debt to disposable income is nearing 170 per cent. Household credit growth has been strong, exceeding disposable income gains for the past several years (Chart 2). The bulk of this growth, about 90 per cent, comes from mortgage credit and HELOCs.
3 See “OSFI Tightens Supervisory Expectations for Mortgage Underwriting,” 7 July 2016.
4 Statement by OSFI Assistant Superintendent Carolyn Rogers to the Standing Senate Committee on National Finance, 17 May 2017.
5 See “Backgrounder: Ontario’s Fair Housing Plan,” 20 April 2017.
6 A rebate would be available for those who subsequently attain citizenship or permanent resident status within four years of their home purchase, as well as for international students. The property transfer tax for foreign buyers implemented in Vancouver in August 2016 exempts those who become residents or citizens within one year of their home purchase.
4 ASSeSSment oF VulneRAbilitieS And RiSkS BANK OF CANADA • FINANCIAL SySTEM REVIEw • JuNE 2017

Box 2
The Three Segments of the Canadian Mortgage MarketThe existing stock of outstanding mortgages in Canada can be roughly divided into three segments (Chart 2-A):
(i) mortgages originated with a loan-to-value ratio greater than 80 per cent (high-ratio mortgages), which are insured at origination;1
(ii) mortgages with a loan-to-value ratio of 80 per cent or lower (low-ratio mortgages) that are not required to have mortgage insurance but are insured after origination through portfolio insurance; and
(iii) low-ratio mortgages that are not insured .
Portfolio insurance is used primarily by lenders so that low-ratio mortgages can be included in government- sponsored National Housing Act Mortgage-Backed Securities, which are sold as a source of funding or retained for liquidity reasons .
1 Federally regulated lenders and most other lenders are required to insure high-ratio mortgages . Around 6 per cent (by value) of mortgages insured at origination are voluntarily insured low-ratio mortgages . These mortgages are combined with high-ratio mortgages in the statistics presented here .
Chart 2-A: Nearly half of outstanding mortgages are uninsured Total mortgage credit: $1,459 billion
High-ratio mortgages (i) Insured at origination
Low-ratio mortgages (ii) Portfolio insured (iii) Uninsured
Uninsured mortgage credit: $666 billion
Big Six Canadian banks Credit unions and caisses populaires
Small and medium-sized banks Others
Notes: The category “Insured at origination” includes a small percentage of low-ratio mortgages. Small and medium-sized banks include federally regulated trust and mortgage loan companies. Some private lenders may not be included. Percentages for the components of uninsured mortgage credit do not add up to 46 because of rounding.
Sources: Regulatory fi lings of Canadian banks, Department of Finance Canada and Bank of Canada calculations Last observation: 2017Q1
(ii) 22%(i) 32%
32%8%4%
1%
(iii) 46%
File information (for internal use only): Chart 2 - mortgagecredit_EN.indd
Last output: 06/05/17 - 03:36PM
Chart 2: Mortgage credit has been growing faster than disposable incomeYear-over-year growth
Residential mortgage credit and home equity lines of credit Consumer credit, excluding home equity lines of credit Disposable income
Sources: Statistics Canada and Bank of Canada calculations
Last observations: Credit series, April 2017; disposable income, 2017Q1
1
2
3
4
5
6
7%
2013 2014 2015 2016 2017
ASSeSSment oF VulneRAbilitieS And RiSkS 5 BANK OF CANADA • FINANCIAL SySTEM REVIEw • JuNE 2017

Growth in mortgage credit and HELOCs has picked up from about 4 per cent on a year-over-year basis in mid-2014 to reach about 6 per cent in recent months. Over the past two years, credit growth has exceeded the rate that would be expected based on income growth and interest rates by roughly one-third, or approximately $55 billion. Much of this amount is likely concentrated in the Toronto and Vancouver regions, where growth in house prices has been exceptionally strong.
The quality of credit is improving in the high-ratio mortgage marketIn autumn 2016, the federal government introduced changes to housing finance policies designed to improve the quality of insured mortgage lending (Appendix). The December FSR noted that these rule changes would miti-gate the rise in the number of highly indebted households.
The share of highly indebted borrowers among newly originated high-ratio mortgages has fallen nationally and is lower in all regions (Chart 3). Across the country, the proportion of highly indebted borrowers (with a loan-to-income ratio greater than 450 per cent) climbed to 17 per cent in the first quarter of 2016 and has since declined to about 10 per cent. This indicates that the quality of credit has improved significantly for high-ratio mortgages. The quality of new mortgages will likely continue to improve over the next quarter because the data received to date include some mortgages approved under the previous rules.
In addition to improved quality, the volume of insured mortgages has decreased. The overall number of insurance approvals for high-ratio mort-gages has declined sharply. As discussed in the December FSR, some potential borrowers have likely chosen to purchase less expensive homes, some have chosen to delay their purchases, and others may have increased their down payments and taken out low-ratio mortgages.7
7 A recent survey documents the responses of potential home purchasers to the new rules. See Canada Mortgage and Housing Corporation, “2017 Mortgage Consumer Survey,” 6 June 2017.
File information (for internal use only): Chart 3 - Highratemortgages_EN.indd
Last output: 06/07/17 - 03:08PM
Chart 3: The quality of high-ratio mortgage lending has improved across major marketsPercentage of new mortgages (used to purchase) that have a loan-to-income ratio greater than 450 per cent, fi rst quarter of each year
2014 2015 2016 2017
Note: Cities are census metropolitan areas as defi ned by Statistics Canada.
Source: Department of Finance Canada Last observation: 2017Q1
0
5
10
15
20
25
30
35
40
HalifaxQuébec Ottawa–Gatineau
Montréal Winnipeg Hamilton Edmonton Victoria Calgary Vancouver Toronto TotalCanada
%
6 ASSeSSment oF VulneRAbilitieS And RiSkS BANK OF CANADA • FINANCIAL SySTEM REVIEw • JuNE 2017

Low-ratio mortgage lending is growing, especially in markets with high house pricesAn increasing share of new mortgage lending is for low-ratio mortgages. This growth has been strongest in the housing markets with rapid price growth: more than 80 per cent of new lending by the Big Six Canadian banks in the Toronto and Vancouver areas is for low-ratio mortgages, while in Edmonton and Halifax it is around half (Chart 4). One important reason is that price increases have led to a substantial share of homes priced higher than $1 million, especially in Toronto and Vancouver (Chart 5). These homes are not eligible for mortgage insurance.
File information (for internal use only): Chart 4 - Low-ratio mortgages_EN.indd
Last output: 06/06/17 - 01:53PM
Chart 4: Low-ratio mortgage originations in the hottest markets are trending upPercentage of new mortgages (used to purchase) that are low-ratio
2014 2015 2016
Note: Cities are census metropolitan areas as defi ned by Statistics Canada.
Source: Regulatory fi lings of Canadian banks Last observation: 2016
0
20
40
60
80
100%
HalifaxEdmonton Winnipeg Calgary Québec Ottawa–Gatineau
Montréal Hamilton Victoria Toronto Vancouver TotalCanada
File information (for internal use only): Chart 5 - Share of 1M_EN.indd
Last output: 06/07/17 - 03:08PM
Chart 5: Home resales priced higher than $1 million in the Toronto and Vancouver areas are upThe share of resales valued at $1 million or more
Greater Vancouver Area Greater Toronto Area
Sources: Canadian Real Estate Association and Bank of Canada calculations Last observation: April 2017
0
5
10
15
20
25
30
35
40
2000 2002 2004 2006 2008 2010 2012 2014 2016
%
ASSeSSment oF VulneRAbilitieS And RiSkS 7 BANK OF CANADA • FINANCIAL SySTEM REVIEw • JuNE 2017

In addition, the changes to mortgage insurance rules in autumn 2016 and an increase in mortgage insurance premiums may have encouraged some borrowers to increase their down payment to access a low-ratio mortgage. A financial stability concern could arise if a significant proportion of the funding for down payments comes from other forms of borrowing, rather than from personal savings or friends and family.8 Co-lending arrangements occur when a mortgage is bundled with a second loan secured against the property that is used to finance part of the down payment. While it is relatively rare for a federally regulated lender to participate in formal co-lending arrangements, some smaller ones do offer mortgages for which a portion of the down payment is borrowed. According to regulatory filings of Canadian banks, however, this activity has not increased since the recent rule changes. Down payments can also be borrowed through less formal arrangements, including through the use of unsecured personal loans or where the primary lender is not a federally regulated financial institution. Data are not available to assess how frequently these other types of bor-rowing are used to fund part of the down payment.
A large portion of funding for low-ratio mortgages has typically come from portfolio insurance and government-backed securitization. The recent mort-gage finance policy changes have reduced access to portfolio insurance. The Canada Mortgage and Housing Corporation (CMHC) reported a large decline in new portfolio insurance in the first quarter of 2017.9 This decline is due to a number of factors, and further data are needed to assess the effects of the new measures.
The combination of these policy changes has led some lenders to consider alternative funding sources (Box 3). There may also be some growth from private lenders who operate outside the regulated market, such as mortgage investment corporations, which are currently estimated to make up less than 1 per cent of mortgages outstanding.10 Nonetheless, a large portion of uninsured mortgage credit is financed from the diversified balance sheets of large lenders (Box 2).
Some changing characteristics of low-ratio mortgages suggest increased riskThe homeowner’s equity in low-ratio mortgages is a minimum of 20 per cent and averages more than 30 per cent at the time of purchase or refinancing. This provides some cushion for lenders if home prices decrease. But if a significant portion of the price gains in the hottest markets unwinds, the housing equity buffer for some recently issued mortgages could erode rapidly. For this reason, it is important to consider other characteristics of these mortgages to have a full understanding of their contribution to the vulnerability concerning household indebtedness.
Partly because of their larger equity cushion, low-ratio mortgages are not subject to the same underwriting criteria as high-ratio mortgages. For example, lenders do not necessarily subject low-ratio mortgages to mort-gage interest stress tests as stringent as those for high-ratio mortgages. In addition, lenders have typically not required the same degree of income documentation for mortgages that have large down payments—for example, where the loan-to-value ratio is lower than 65 per cent.
8 About 18 per cent of mortgage down payments for first-time homebuyers are gifts and loans from family members, according to Mortgage Professional Canada’s Annual State of the Residential Mortgage Market in Canada, December 2016.
9 Canada Mortgage and Housing Corporation, “Mortgage Loan Insurance Business Supplement,” 31 March 2017.
10 See B. Y. Chang, M. Januska, G. Kumar and A. Usche, “Monitoring Shadow Banking in Canada: A Hybrid Approach,” Bank of Canada Financial System Review (December 2016): 23–37.
8 ASSeSSment oF VulneRAbilitieS And RiSkS BANK OF CANADA • FINANCIAL SySTEM REVIEw • JuNE 2017

These more flexible requirements are playing an important role in mortgage choices. Around 15 per cent of mortgage originations are clustered just below a 65 per cent loan-to-value ratio, suggesting that borrowers are choosing down payments or loan size to qualify under less stringent require-ments. Furthermore, about half of mortgage originations are clustered just below an 80 per cent loan-to-value ratio. This can be explained by a variety of factors, including borrowers seeking to avoid the more stringent quali-fying requirements for high-ratio mortgages and the extra costs associated with insured mortgages.
Some riskier characteristics are increasingly evident in low-ratio mortgage lending. The proportion of low-ratio borrowers with a loan-to-income ratio more than 450 per cent has risen, reaching 17 per cent of borrowers and 27 per cent of the value of mortgages originated in 2016 (Table 1). The share of low-ratio mortgages with amortization periods longer than 25 years is also increasing, reaching more than half of all borrowers.11 Borrowers with long amortization periods can pay down their mortgage principal more slowly and therefore have higher ongoing indebtedness compared with bor-rowers with shorter amortization periods. Long-amortization borrowers also have less flexibility to further extend amortization to reduce payments if they are faced with an income shock.
11 The Big Six Canadian banks do not originate new mortgages with amortizations longer than 30 years.
Box 3
The Canadian Private Mortgage Securitization MarketIn Canada, residential mortgage lenders rely heavily on public (government-backed) securitization, such as Canada Mortgage Bonds and National Housing Act Mortgage-Backed Securities; at the end of 2016, about 32 per cent of outstanding mortgage credit was publicly securitized . Public securitizations are limited to insured mortgages, and the amount of annual issuance is capped by the government .1 Nevertheless, the public securitization market is a large and liquid market, which may be one of the reasons why there has been little development of an active private securitiza-tion market to date . Private securitization represents 2 per cent of outstanding mortgage credit .
The recent changes to federal government housing fi nance policies have meant that fewer mortgages are insurable under government-backed programs . This has had an impact on mortgage lenders that relied on these securitizations as a source of funding . The robust growth of outstanding uninsured mortgage credit has led to a growing pool of mortgages that may be suitable for private residential mortgage-backed securities as well as for cov-ered bonds .2 These may be driving renewed interest in the
1 See A . Mordel and N . Stephens, “Residential Mortgage Securitizations in Canada: A Review,” Bank of Canada Financial System Review (December 2015): 39–48 .
2 However, under Offi ce of the Superintendent of Financial Institutions regulations, covered bonds cannot make up more than 4 per cent of a lender’s total assets .
development of private mortgage securitization products from potential issuers .
Properly structured, private securitization would benefi t the fi nancial system by helping lenders fund loans, diversify funding sources and meet regulatory requirements . It would also provide a new securitized investment product and could act as a source of collateral to support market functioning .
The experience of the global fi nancial crisis demonstrated that, unless properly designed, securitization can create important fi nancial system vulnerabilities . As securitization markets develop, features that could mitigate vulnerabilities include the following:
• standardization of the underlying collateral and trans-action structure
• meaningful disclosure requirements
• risk retention
Given the changes in the landscape, it is likely that there will be further innovations in the private mortgage securitization market .
ASSeSSment oF VulneRAbilitieS And RiSkS 9BANK OF CANADA • FINANCIAL SySTEM REVIEw • JuNE 2017
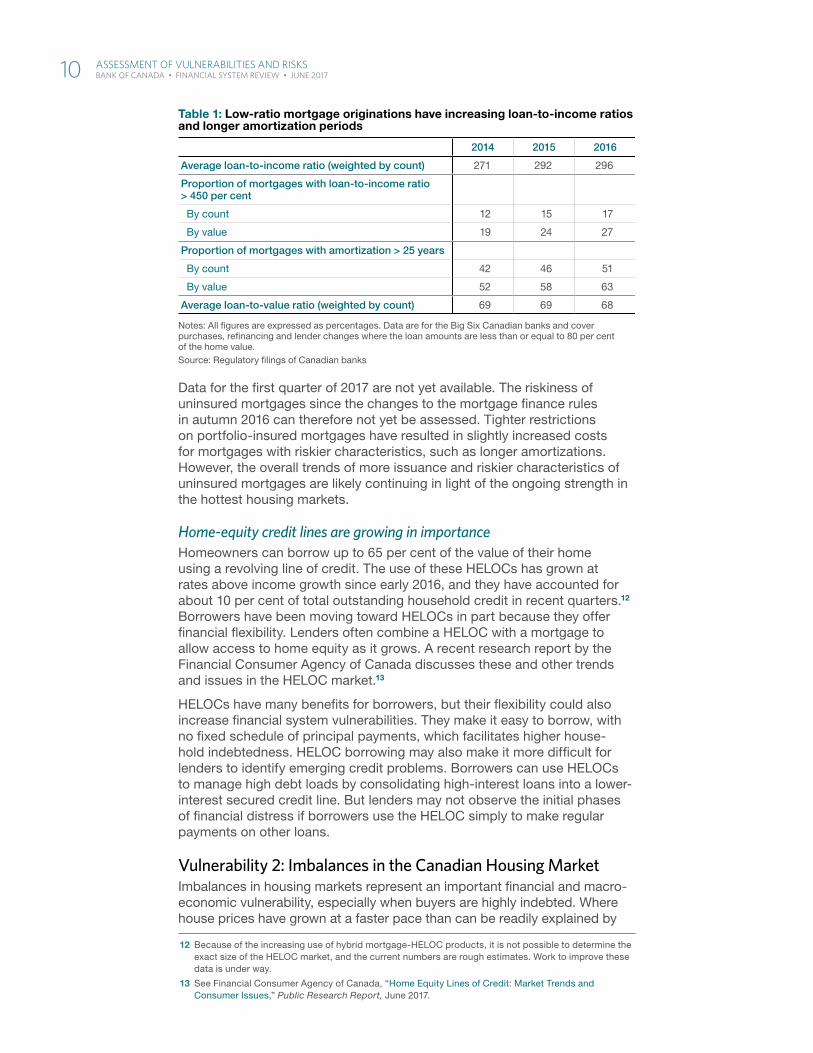
Data for the first quarter of 2017 are not yet available. The riskiness of uninsured mortgages since the changes to the mortgage finance rules in autumn 2016 can therefore not yet be assessed. Tighter restrictions on portfolio-insured mortgages have resulted in slightly increased costs for mortgages with riskier characteristics, such as longer amortizations. However, the overall trends of more issuance and riskier characteristics of uninsured mortgages are likely continuing in light of the ongoing strength in the hottest housing markets.
Home-equity credit lines are growing in importanceHomeowners can borrow up to 65 per cent of the value of their home using a revolving line of credit. The use of these HELOCs has grown at rates above income growth since early 2016, and they have accounted for about 10 per cent of total outstanding household credit in recent quarters.12 Borrowers have been moving toward HELOCs in part because they offer financial flexibility. Lenders often combine a HELOC with a mortgage to allow access to home equity as it grows. A recent research report by the Financial Consumer Agency of Canada discusses these and other trends and issues in the HELOC market.13
HELOCs have many benefits for borrowers, but their flexibility could also increase financial system vulnerabilities. They make it easy to borrow, with no fixed schedule of principal payments, which facilitates higher house-hold indebtedness. HELOC borrowing may also make it more difficult for lenders to identify emerging credit problems. Borrowers can use HELOCs to manage high debt loads by consolidating high-interest loans into a lower-interest secured credit line. But lenders may not observe the initial phases of financial distress if borrowers use the HELOC simply to make regular payments on other loans.
Vulnerability 2: Imbalances in the Canadian Housing MarketImbalances in housing markets represent an important financial and macro-economic vulnerability, especially when buyers are highly indebted. Where house prices have grown at a faster pace than can be readily explained by
12 Because of the increasing use of hybrid mortgage-HELOC products, it is not possible to determine the exact size of the HELOC market, and the current numbers are rough estimates. Work to improve these data is under way.
13 See Financial Consumer Agency of Canada, “Home Equity Lines of Credit: Market Trends and Consumer Issues,” Public Research Report, June 2017.
Table 1: Low-ratio mortgage originations have increasing loan-to-income ratios and longer amortization periods
2014 2015 2016
Average loan-to-income ratio (weighted by count) 271 292 296
Proportion of mortgages with loan-to-income ratio > 450 per cent
By count 12 15 17
By value 19 24 27
Proportion of mortgages with amortization > 25 years
By count 42 46 51
By value 52 58 63
Average loan-to-value ratio (weighted by count) 69 69 68
Notes: All fi gures are expressed as percentages. Data are for the Big Six Canadian banks and cover purchases, refi nancing and lender changes where the loan amounts are less than or equal to 80 per cent of the home value. Source: Regulatory fi lings of Canadian banks
10 ASSeSSment oF VulneRAbilitieS And RiSkS BANK OF CANADA • FINANCIAL SySTEM REVIEw • JuNE 2017
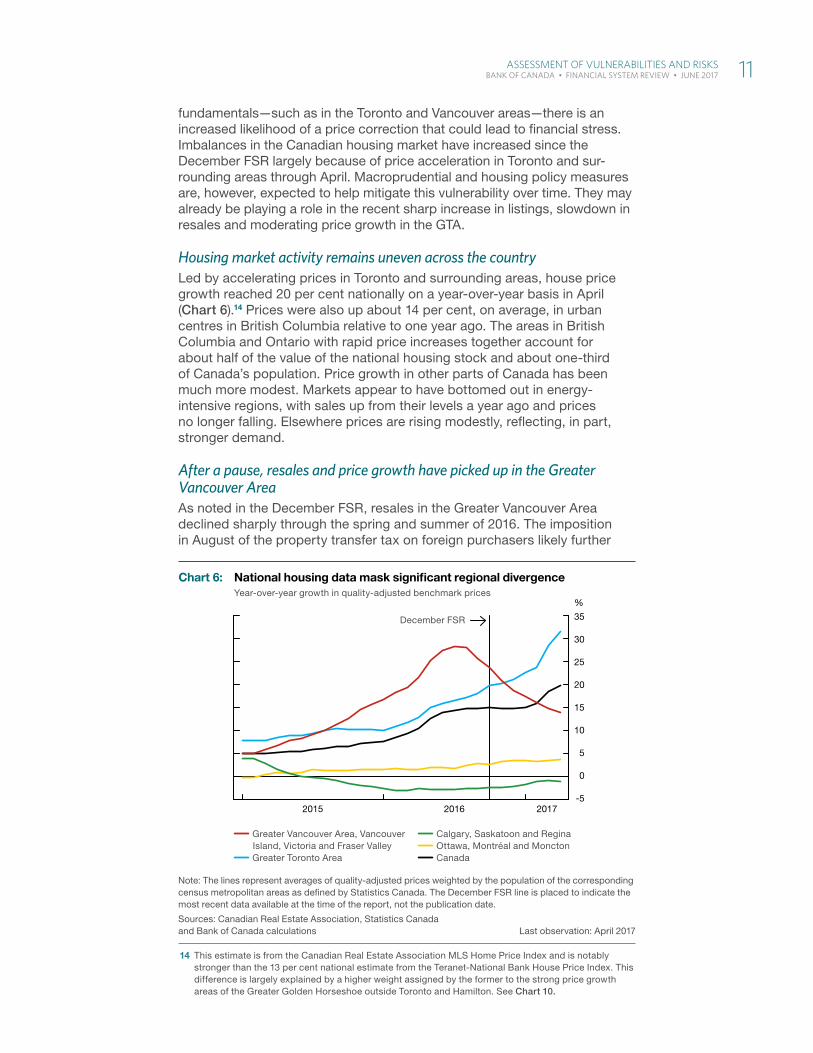
fundamentals—such as in the Toronto and Vancouver areas—there is an increased likelihood of a price correction that could lead to financial stress. Imbalances in the Canadian housing market have increased since the December FSR largely because of price acceleration in Toronto and sur-rounding areas through April. Macroprudential and housing policy measures are, however, expected to help mitigate this vulnerability over time. They may already be playing a role in the recent sharp increase in listings, slowdown in resales and moderating price growth in the GTA.
Housing market activity remains uneven across the countryLed by accelerating prices in Toronto and surrounding areas, house price growth reached 20 per cent nationally on a year-over-year basis in April (Chart 6).14 Prices were also up about 14 per cent, on average, in urban centres in British Columbia relative to one year ago. The areas in British Columbia and Ontario with rapid price increases together account for about half of the value of the national housing stock and about one-third of Canada’s population. Price growth in other parts of Canada has been much more modest. Markets appear to have bottomed out in energy-intensive regions, with sales up from their levels a year ago and prices no longer falling. Elsewhere prices are rising modestly, reflecting, in part, stronger demand.
After a pause, resales and price growth have picked up in the Greater Vancouver AreaAs noted in the December FSR, resales in the Greater Vancouver Area declined sharply through the spring and summer of 2016. The imposition in August of the property transfer tax on foreign purchasers likely further
14 This estimate is from the Canadian Real Estate Association MLS Home Price Index and is notably stronger than the 13 per cent national estimate from the Teranet-National Bank House Price Index. This difference is largely explained by a higher weight assigned by the former to the strong price growth areas of the Greater Golden Horseshoe outside Toronto and Hamilton. See Chart 10.
File information (for internal use only): Chart 6 - HousepriceGrowth_EN.indd
Last output: 06/05/17 - 11:00AM
Chart 6: National housing data mask signifi cant regional divergenceYear-over-year growth in quality-adjusted benchmark prices
Greater Vancouver Area, Vancouver Island, Victoria and Fraser Valley
Greater Toronto Area
Calgary, Saskatoon and Regina Ottawa, Montréal and Moncton Canada
Note: The lines represent averages of quality-adjusted prices weighted by the population of the corresponding census metropolitan areas as defi ned by Statistics Canada. The December FSR line is placed to indicate the most recent data available at the time of the report, not the publication date.
Sources: Canadian Real Estate Association, Statistics Canada and Bank of Canada calculations Last observation: April 2017
December FSR
-5
0
5
10
15
20
25
30
35
2015 2016 2017
%
ASSeSSment oF VulneRAbilitieS And RiSkS 11 BANK OF CANADA • FINANCIAL SySTEM REVIEw • JuNE 2017

contributed to this trend (Chart 7). Following the drop in resales, month-over-month price growth stalled in the second half of the year. With the share of non-resident purchases stabilizing at a lower level, both resales and price growth have picked up once again in recent months. As discussed in the December FSR, other parts of the world that implemented a similar tax on purchases by non-residents also experienced a temporary slowdown in house price growth.
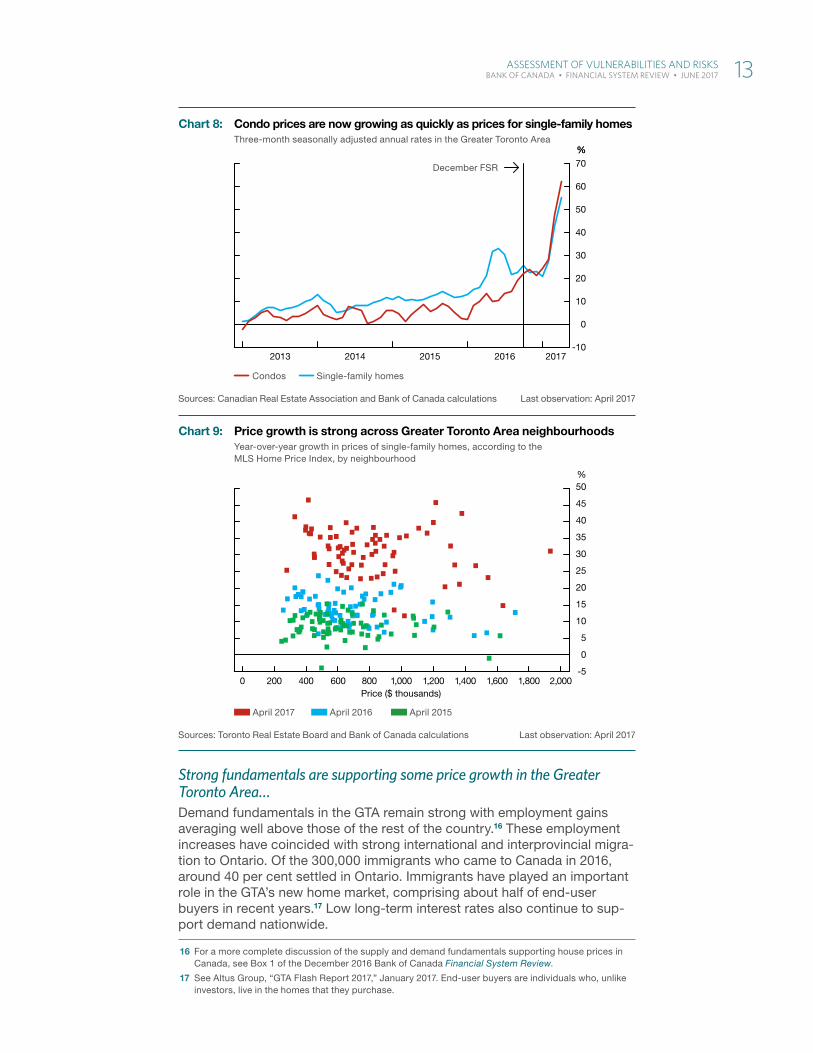
Housing vulnerabilities have increased in and around the Greater Toronto AreaIn an environment of both strong demand and relatively low supply, housing inventories in the Greater Toronto Area (GTA) have remained lean for some time. House prices are up 58 per cent on a seasonally adjusted three-month annualized basis and 32 per cent relative to levels one year ago as of April.
Very strong price growth has been widespread throughout the GTA—across property types (Chart 8) and across neighbourhoods and price levels (Chart 9). Of particular note is the acceleration in the price of condos, which was roughly on par with that for single-family homes in the first four months of this year. This contrasts with previous years when the price of singles outpaced the price of condos by a factor of two to three.15
Prospective homeowners priced out of the GTA have looked increasingly farther in search of more affordable housing, bidding up prices throughout much of the Greater Golden Horseshoe area (Chart 10). As a result, prices in the areas surrounding the GTA have increased at an even faster pace than they have within the GTA.
15 L. Schembri, “The Long-Term Evolution of House Prices: An International Perspective” (remarks to the Canadian Association of Business Economists, Kingston, 25 August 2015).
File information (for internal use only): Chart 7 - GVA_EN.indd
Last output: 06/07/17 - 10:40AM
Chart 7: Resales and price growth in the Greater Vancouver Area have picked up in recent months
Annualized resales (left scale)
Three-month annualized growth rate in quality-adjusted house prices (right scale)
Note: Series are seasonally adjusted.
Sources: Canadian Real Estate Association and Bank of Canada calculations Last observation: April 2017
20172016
-10
0
10
20
30
40
50%
10
20
30
40
50
60
Jan Apr Jul Oct Jan Apr
%Thousands of units
12 ASSeSSment oF VulneRAbilitieS And RiSkS BANK OF CANADA • FINANCIAL SySTEM REVIEw • JuNE 2017
Strong fundamentals are supporting some price growth in the Greater Toronto Area…Demand fundamentals in the GTA remain strong with employment gains averaging well above those of the rest of the country.16 These employment increases have coincided with strong international and interprovincial migra-tion to Ontario. Of the 300,000 immigrants who came to Canada in 2016, around 40 per cent settled in Ontario. Immigrants have played an important role in the GTA’s new home market, comprising about half of end-user buyers in recent years.17 Low long-term interest rates also continue to sup-port demand nationwide.
16 For a more complete discussion of the supply and demand fundamentals supporting house prices in Canada, see Box 1 of the December 2016 Bank of Canada Financial System Review.
17 See Altus Group, “GTA Flash Report 2017,” January 2017. End-user buyers are individuals who, unlike investors, live in the homes that they purchase.
File information (for internal use only): Chart 8 - CondoPrices_EN.indd
Last output: 06/07/17 - 02:18PM
Chart 8: Condo prices are now growing as quickly as prices for single-family homesThree-month seasonally adjusted annual rates in the Greater Toronto Area
Condos Single-family homes
Sources: Canadian Real Estate Association and Bank of Canada calculations Last observation: April 2017
-10
0
10
20
30
40
50
60
70
2013 2014 2015 2016 2017
%%
Decembe r FSR
File information (for internal use only): Chart 9 - GTAPriceGrowth_EN.indd
Last output: 06/05/17 - 03:54PM
Chart 9: Price growth is strong across Greater Toronto Area neighbourhoodsYear-over-year growth in prices of single-family homes, according to the MLS Home Price Index, by neighbourhood
April 2017 April 2016 April 2015
Sources: Toronto Real Estate Board and Bank of Canada calculations Last observation: April 2017
-5
0
5
10
15
20
25
30
35
40
45
50%
0 200 400 600 800Price ($ thousands)
1,000 1,200 1,400 1,600 1,800 2,000
ASSeSSment oF VulneRAbilitieS And RiSkS 13 BANK OF CANADA • FINANCIAL SySTEM REVIEw • JuNE 2017

Non-resident demand is contributing to price gains in the GTA as well, although uncertainty about the magnitude remains.18 As a result, the non-resident speculation tax introduced by the Ontario government in late April will likely temporarily dampen price growth. This potential impact includes a moderation in price expectations, which may have played a role in the recent sharp increase in listings and the slowdown in resales in the GTA.
On the supply side, geography and land-use regulations continue to constrain the supply of new homes. Starts for apartments and condos in Toronto have risen in recent months, consistent with strengthening demand, including robust investor activity.
…but extrapolative expectations are playing an important roleAlthough solid growth in demand fundamentals in an environment of rela-tively inelastic housing supply can generate strong price gains, these fun-damentals cannot readily explain the pace of the price increases seen in the GTA over the past 18 months. Analysis by CMHC also suggests that price growth in the GTA has been too fast for normal market activities.19
18 For example, CMHC estimates that in 2016 the share of condos owned by foreigners in buildings completed since 2010 was about 4 per cent in Toronto. See CMHC, Housing Market Insight: Canada—Foreign Ownership, November 2016. The Toronto Real Estate Board recently estimated the proportion of foreign buyers in the Greater Golden Horseshoe housing market at 2.5 per cent in the first four months of 2017. It also noted that most of these foreign buyers intend to become future residents, which would make them eligible for a refund of the recently imposed foreign buyers’ tax.
19 See, for example, CMHC’s Housing Market Assessment—Canada, for the second quarter of 2017.
File information (for internal use only): Chart 10 - Map_EN.indd
Last output: 06/05/17 - 03:28PM
Chart 10: In the Greater Golden Horseshoe area, price growth is highest outside the Greater Toronto AreaYear-over-year price growth of average prices, April 2016 to April 2017
20–30% 30–40% 40–50% No data available
Note: The defi nition of the Greater Toronto Area is from the Canadian Real Estate Association.
Sources: Canadian Real Estate Association, Toronto Real Estate Board, Niagara Association of REALTORS, Kitchener–Waterloo Association of REALTORS, Google and Bank of Canada calculations
Simcoe
Dufferin
Wellington
Waterloo
Hamilton
Brant
Halton
Peel
York
Toronto
Durham
PeterboroughKawarthaLakes
Northumberland
Niagara
Haldimand
Brantford
Guelph
BarriePeterborough
Greater Toronto Area
Orillia
14 ASSeSSment oF VulneRAbilitieS And RiSkS BANK OF CANADA • FINANCIAL SySTEM REVIEw • JuNE 2017

Solid price growth supported by fundamentals can create an environment in which some prospective homebuyers come to expect strong and persistent future price gains based only on recent trends. Observations of recent housing market behaviours suggest that these extrapolative expectations are becoming more pervasive, with price expectations based more on past trends rather than a careful examination of market fundamentals:
(i) There has been a notable rise in purchases of single-family homes forinvestment purposes despite low to negative net rental yields (Box 4).
(ii) Some end-user buyers have chosen to accelerate house purchases toavoid being priced out of the market in the future.20
(iii) Until very recently, new listings in the GTA were held back, suggestingthat sellers had strongly held beliefs that prices would continue toincrease.
20 See “Big City House Hunters Suffer from FOMO (Fear of Missing Out),” TD Canada Trust Survey, 18 April 2016.
Box 4
Extrapolative Expectations May Be Driving Investment ActivityPurchases for investment purposes play an important role in well-functioning housing markets . This type of activity helps to fi nance construction projects, make rental housing avail-able and improve market liquidity . However, when fuelled by high leverage and extrapolative expectations, this activity can be destabilizing .1 Prices that are infl ated because of extrapolative expectations tend to be more sensitive to adverse demand shocks . when expectations reverse and prices recede, investors may quickly sell their assets, pos-sibly leading to fi re sales with adverse consequences for the rest of the market .
Capturing this type of destabilizing speculation in real-time data is diffi cult, so economists must rely on indirect evidence . For example, house price growth in the Greater Toronto Area (GTA) has been much faster than growth in rents in recent years . As a result, net rental yields declined and have been negative after fully accounting for costs (even before adjusting for risk) . yet purchases for invest-ment purposes increased . This behaviour suggests that, despite a sharp rise in prices relative to rents and other proxies for economic fundamentals, investors held a fi rm belief that prices would continue to rise . This type of behav-iour is consistent with extrapolative expectations .
1 See A . Haughwout, D . Lee, J . Tracy and w . van der Klaauw, “Real Estate Investors, the Leverage Cycle, and the Housing Market Crisis,” Federal Reserve Bank of New york Staff Report no . 514 (2011), and A . Chinco and C . Mayer, “Misinformed Speculators and Mispricing in the Housing Market,” The Review of Financial Studies 29, no . 2 (2016): 486–522 .
One study by Realosophy Realty Inc . off ered an interesting perspective .2 Realosophy documented that, despite nega-tive net rental yields, a notable rise in investment in freehold homes was observed in the GTA between 2012 and 2016 (Table 4-A) .
2 See J . Pasalis, “How Investor Demand for Houses Is Driving up Prices in the Greater Toronto Area,” Realosophy Realty Inc . Special Report (March 2017) . The share of investors is calculated as the percentage of homes sold through the Multiple Listing Service that were immediately listed for rent through the same system . The measure does not capture investors who rented out through third-party websites or left their properties vacant, which means that this estimated share of investors is likely to be a lower bound .
Table 4-A: Freehold investment properties have generated modest and declining rental returns in the Greater Toronto Area
2012 2016
Average home price (dollars) 669,564 949,175
Average rent (dollars) 2,124 2,283
Annual rental yield (per cent) 3.8 2.9
Five-year fi xed mortgage rate (per cent) 3.1 2.5
Home sales associated with investment (per cent) 4 10
Note: Home sales associated with investment are those that were immediately listed for rent. Sources: Realosophy Realty Inc. Brokerage and Bank of Canada calculations
ASSeSSment oF VulneRAbilitieS And RiSkS 15BANK OF CANADA • FINANCIAL SySTEM REVIEw • JuNE 2017
Overall, the acceleration in house prices in the GTA suggests that the market has likely entered a phase in which extrapolative expectations and speculative buying play an important role.21 Under these circumstances, prices and price expectations can adjust rapidly to adverse demand shocks, suggesting that end-user buyers, investors, lenders and insurers face an increased likelihood of a rapid price correction and a rise in financial stress. This is particularly important when the holders of the underlying mortgages are highly leveraged.
Vulnerability 3: Fragile Fixed-Income Market LiquidityIn liquid markets, participants can rapidly trade large volumes of assets without having a large impact on prices. When market liquidity is fragile, an unexpected shock can cause illiquid conditions to materialize rapidly and last for an extended period, with spillovers to the broader financial system.
Evidence suggests that market participants are adapting to changing market conditions by accepting less immediacy to minimize trading costs. The importance of this structural vulnerability continues to evolve. The changing regulatory environment, and the growing role of certain market participants, such as exchange-traded funds, will affect liquidity supply and demand during periods of stress, but the net impact is unclear at this time.
Price-based empirical measures of liquidity may mask less immediacyEmpirical measures of market liquidity based on transaction prices show that the level of liquidity has been stable or has slightly improved in recent years.22 However, price measures cannot necessarily capture a decline in liquidity from reduced immediacy—the time it takes to trade large volumes at a fixed cost.23
Market intelligence indicates that market participants are adapting to changing trading conditions—for example, by accepting longer holding periods and reducing the size of trades.24 Essentially, market participants have accepted less immediacy in order to minimize execution costs. These adaptations, however, have not been fully tested by a large and unexpected shock.
The reaction of liquidity supply and demand is changing with the financial system structureRegulatory reforms have made major liquidity suppliers—including bank-owned broker-dealers—more resilient and less prone to dramatically reducing their supply of liquidity during stress. Nonetheless, during a stress event, dealers will naturally manage their overall balance sheet risk by lowering their supply of market liquidity. The increased use of agency trading, in part driven by regulatory constraints, may exacerbate the reduc-tion in supply of liquidity in times of stress, since it may become even more difficult to directly match clients after a shock.
21 In theory, even if a relatively small proportion of investors behave in this manner, prices can significantly deviate from their fundamentals for an extended period, further reinforcing existing perceptions. See M. Piazzesi and M. Schneider, “Momentum Traders in the Housing Market: Survey Evidence and a Search Model,” American Economic Review 99, no. 2 (May 2009): 406–411.
22 T. Adrian, M. Fleming, O. Shachar and E. Vogt, “Has U.S. Corporate Bond Market Liquidity Deteriorated?” Federal Reserve Bank of New York Liberty Street Economics (5 October 2015), and F. Trebbi and K. Xiao, “Regulation and Market Liquidity,” NBER Working Paper No. 21739.
23 J. Dick-Nielsen and M. Rossi, “The Cost of Immediacy for Corporate Bonds,” SSRN Working Paper (7 February 2017).
24 See “Bank of Canada Publishes the Results of the Canadian Fixed-Income Forum Survey on Market Liquidity, Transparency and Market Access,” 4 November 2016.
16 ASSeSSment oF VulneRAbilitieS And RiSkS BANK OF CANADA • FINANCIAL SySTEM REVIEw • JuNE 2017

Bank of Canada staff developed a model that helps explain the seemingly inconsistent effects of new financial regulations, where liquidity supply decreases but bid-ask spreads remain constant or improve.25 In the model, dealers respond to regulatory constraints on their balance sheets by limiting the amount of bond inventory they are willing to hold to facilitate client trades. They attempt to match buyer and seller clients directly (“agency” trading), which requires less inventory than taking positions with clients (“principal” trading). The model predicts that competition from new liquidity suppliers will maintain a stable or even decreasing bid-ask spread. However, market makers intermediate less, thus reducing the supply of liquidity, making asset prices more sensitive to sudden demands to trade.
An important area of future analysis relates to the increasing size and market participation of asset managers.26 For example, mutual fund and exchange-traded fund holdings of domestic corporate debt have grown at a faster pace than total bonds outstanding in Canada. If asset managers are trading with similar strategies, this may increase liquidity demand in times of stress. But asset managers also tend to have low leverage or hold buffers of cash and liquid assets, making them resilient to shocks, such as a sharp increase in redemption requests.27 These types of structural factors take time to evolve, and their net impact on financial system stability will continue to be the focus of analysis.
Vulnerability 4: Cyber Threats and Financial InterconnectionsThe financial system’s cyber defences must have the capacity to withstand both internal and external threats, particularly as they relate to the Internet. The increasing incidence and severity of cyber attacks highlight a particular threat to financial institutions. The interconnectedness of the financial system could lead to rapid transmission of stress from a cyber attack. This is a structural vulnerability that is unlikely to go away. And because of the interconnections in the system, the public sector has a role in coordinating cyber defences.
Increased reliance on information technology infrastructure makes the financial system vulnerable to cyber threatsComplex, interconnected information technology platforms have allowed the financial sector to deliver services to clients more efficiently. However, they have also created increased opportunities for a successful cyber attack on a single institution to spread throughout the broader financial system. Contagion could occur through financial interconnections or common critical infrastructures in non-financial sectors, such as telecommunications, energy and utilities. A prolonged interruption in financial services, compro-mised data integrity or a loss of confidence could harm the financial system with knock-on effects to the real economy.
25 D. A. Cimon and C. Garriott, “Banking Regulation and Market Making,” Bank of Canada Staff Working Paper No. 2017-7 (February 2017).
26 Addressing the structural vulnerabilities associated with asset managers is a key feature of the G20 reform agenda implemented by the Financial Stability Board. See, for example, “Policy Recommendations to Address Structural Vulnerabilities from Asset Management Activities,” 12 January 2017.
27 S. Ramirez, J. Sierra Jimenez and J. Witmer, “Canadian Open-End Mutual Funds: An Assessment of Potential Vulnerabilities,” Bank of Canada Financial System Review (June 2015): 47–55.
ASSeSSment oF VulneRAbilitieS And RiSkS 17 BANK OF CANADA • FINANCIAL SySTEM REVIEw • JuNE 2017
Cyber threats are evolving rapidly and require adaptable defencesThe level of sophistication and frequency of cyber attacks have been growing over the past several years as the tools and skills needed to launch an attack have become more widely available. Financial institutions, including central banks, are frequent targets of high-profile cyber attacks.28 For example, in 2016 alone, at least eight monetary authorities in various jurisdictions were victims of a cyber attack;29 the most notable incident was the Bangladesh Bank heist, where hackers stole US$81 million.30
The public sector has an important role to playA successful cyber attack could have broad spillovers and could damage confidence in the financial system, affecting far more than the original target. Protecting against an attack, therefore, has benefits beyond an individual institution and can be considered a public good.31 Cyber security investments should consequently take into account the benefits for the financial system as a whole. And while the emerging market for cyber security insurance can provide some protection to individual firms, it cannot fully insure against an attack with systemic effects. Thus, the public sector has a role in coordinating cyber defences to help ensure adequate system-wide protection.
In Canada, a network of public and private sector partners, including critical non-financial infrastructure providers, enables the sharing of meaningful intelligence on cyber risks and threats.32 Supervisors of financial institu-tions have high expectations for cyber security posture. OSFI has self-assessment guidance in place, and the Bank of Canada requires designated financial market infrastructures to comply with international standards.33
Key RisksThis section examines risk scenarios for the Canadian financial system in which trigger events (or shocks) are transmitted and amplified by vulnerabil-ities, resulting in adverse effects on the financial system and the economy. The purpose is to identify the most important downside risks rather than all possible negative scenarios. Each risk includes an overall risk rating based on Governing Council’s judgment regarding the probability of the risk occurring and the expected severity of the impact on the Canadian financial system if it were to materialize (Table 2).
Since the December 2016 report, there have been two changes in the identi-fied risks. The Bank now assesses two separate risk scenarios related to household vulnerabilities in place of the first risk from the December FSR. Risk 1 focuses on the financial stability implications of a negative foreign demand shock that causes a severe recession affecting businesses across
28 Verizon’s 2017 Data Breach Investigations Report noted that the finance sector was the third most likely sector to experience a cyber attack and accounted for 24 per cent of the 1,935 reported breaches involving disclosure of data to an unauthorized party.
29 C. Albanese, D. Lepido and G. Turner, “‘Anonymous’ Joins Hacker Army Targeting Central Banks for Cash,” Bloomberg, 17 March 2017.
30 J. Slater, “After Bangladesh: How a Massive Hack Shook the Banking World,” The Globe and Mail, 12 June 2016.
31 T. Cowen, “Public Goods,” The Concise Encyclopedia of Economics, 2007.
32 See H. Gallagher, W. McMahon and R. Morrow, “Cyber Security: Protecting the Resilience of Canada’s Financial System,” Bank of Canada Financial System Review (December 2014): 47–53.
33 See OSFI, “Cyber Security Self-Assessment Guidance,” Memorandum, 28 October 2013, and Committee on Payment and Market Infrastructures and Board of the International Organization of Securities Commissions, “Guidance on Cyber Resilience for Financial Market Infrastructures,” June 2016.
18 ASSeSSment oF VulneRAbilitieS And RiSkS BANK OF CANADA • FINANCIAL SySTEM REVIEw • JuNE 2017

the economy and households nationwide. In this scenario, a correction in house prices across the country is only one of the channels through which the economy and the financial system are affected. In contrast, Risk 2 focuses on the narrower scenario in which a regional house price correction is the only source of economic and financial stress.
The second change in the identified risks is that the risk of “prolonged weakness in commodity prices,” which was rated as “low” in the December FSR, has been removed. The economy’s adjustment to lower oil prices is largely complete, and the financial system has been able to manage the negative effects on households and businesses in commodity-producing regions.
Risk 1: A Severe Nationwide Recession Leading to a Rise in Financial StressIn this scenario, a large, persistent negative foreign demand shock leads to a severe recession. Weaker aggregate demand causes firms to cut back on their planned investments and reduces their demand for labour, creating a sharp rise in unemployment nationwide. Declining profitability and incomes severely impair the ability of businesses and households to service their debt. For households, this results in a significant cutback in consumption spending, particularly for those that are highly indebted. A correction in house prices ensues, further exacerbating the adverse impact of the reces-sion. The decline in house prices is assumed to be more pronounced in areas that have experienced strong run-ups, such as Toronto, Vancouver and their surrounding areas.
The resulting defaults on loans and declines in collateral values exert stress on lenders, with most losses likely coming from unsecured consumer lending and corporate credit. Mortgage insurers also suffer large losses, but their obligations to lenders are largely backstopped by a government
Impact: Less severe More severe
Probability:Higher
Risk 2 Risk 4
Lower
Risk 3 Risk 1
Low Moderate Elevated High Very high
Table 2: Key risks to the stability of the Canadian fi nancial system
Risk 1: A severe nationwide recession leading to a rise in fi nancial stress
Risk 2: A house price correction in overheated markets
Risk 3: A sharp increase in long-term interest rates driven by higher global risk premiums
Risk 4: Stress emanating from China or other emerging-market economies
ASSeSSment oF VulneRAbilitieS And RiSkS 19 BANK OF CANADA • FINANCIAL SySTEM REVIEw • JuNE 2017
guarantee. This stress leads to lower credit supply and higher borrowing costs for businesses and households, which amplify the negative feedback to the macroeconomy. Furthermore, a sudden large reversal of funding inflows from offshore investors could further intensify the impact of the risk.34
As in the December 2016 FSR, the risk rating is “elevated” with a low prob-ability of occurrence but a severe impact if it were to materialize. Improving macroeconomic conditions reduce the probability that an adverse and widespread shock will lead to financial stress. But continuing increases in household vulnerabilities imply that the severity of this risk, should it materi-alize, has increased.
Risk 2: A House Price Correction in Overheated MarketsRisk 2 is triggered by a significant regional house price correction in Toronto, Vancouver and their surrounding areas with modest direct spill-overs to housing markets in the rest of the country.35
The house price correction assumed in Risk 2 has its largest effects on the British Columbia and Ontario economies, with important direct effects on residential investment, related consumption spending such as on fur-niture and appliances, and real estate services. The fall in house prices also leads to negative wealth and collateral effects, which further weigh on consumption spending. These impacts are amplified in the affected prov-inces by the elevated share of highly indebted households, as discussed in Vulnerability 1, as well as by the resulting decline in consumer confidence. There are macroeconomic spillovers to other provincial economies through lower interprovincial trade and declining confidence nationwide.
This could lead to a deterioration in lender balance sheets and tighter lending conditions across the country. Smaller lenders concentrated in Ontario and British Columbia would see a greater portion of their assets affected than large Canadian financial institutions would.
A regional decline in house prices, on its own, would be unlikely to generate the kind of widespread rise in unemployment and fall in business profit-ability that underpin the significant increase in financial stress featured in Risk 1. Not only does Risk 2 have a more limited sectoral impact, but the geographic concentration of this risk and the lack of significant overbuilding of housing in Toronto and Vancouver also serve to limit its relative effect.
The financial system weaknesses and exposures that helped transform a house price correction into a large and persistent rise in unemployment in the United States during the 2007–09 global financial crisis are not present in Canada.36 In particular, Canadian mortgage underwriting standards are high and effectively enforced. Lenders have recourse to other household assets for most mortgages, improving incentive for borrowers to continue to
34 See the report “Canada’s International Investment Position: Benefits and Potential Vulnerabilities” in this issue.
35 As noted in the December 2014 Financial System Review, truly localized Canadian house price cycles, both in terms of the factors behind the boom as well as the correction, have typically not spilled over to other regions. For example, the 1991–97 Vancouver house price cycle, which was closely tied to developments in Asia, showed no sign of spilling over into other regional housing markets. Canadian historical experience suggests that a national correction in house prices would be more likely to occur if there were a significant adverse national macroeconomic shock, such as sharply higher interest rates or a broad-based recession, as in 1982 and 1991.
36 See A. Crawford, C. Meh and J. Zhou, “The Residential Mortgage Market in Canada: A Primer,” Bank of Canada Financial System Review (December 2013): 53–63; and L. Schembri, “Housing Finance in Canada: Looking Back to Move Forward,” National Institute Economic Review no. 230 (November 2014): R45–R57.
20 ASSeSSment oF VulneRAbilitieS And RiSkS BANK OF CANADA • FINANCIAL SySTEM REVIEw • JuNE 2017

service debt. Further, high-ratio mortgages are protected by insurance and government guarantees. Indebted households in Canada are less vulnerable than their US counterparts were during the lead-up to the crisis.37 Mortgage loans in Canada are not financed by complex and opaque securitization vehicles; large banks use stable deposit bases to fund mortgage lending. And unlike in the United States before the crisis, the portfolios and business lines of large banks are well diversified, and stress tests suggest that banks have adequate capital and liquidity buffers to weather a large house price correction.
Overall, Risk 2 is rated as “moderate.” There are imbalances in the Toronto and Vancouver regional housing markets, as discussed in Vulnerability 2. Under these circumstances, prices and price expectations can move rapidly in response to small shocks. As a result, the probability of this risk material-izing is higher than that of Risk 1, which is triggered by a severe economy-wide recession. Strong underlying housing market fundamentals, however, support the idea that a downturn in prices would be limited. Although less severe than Risk 1, the regional correction in house prices, should it occur, would negatively affect the macroeconomy and the financial system.
Risk 3: A Sharp Increase in Long-Term Interest Rates Driven by Higher Global Risk PremiumsAs in the December FSR, this risk continues to be rated as “moderate.” A large and persistent increase in interest rates driven by a rise in global risk premiums and exacerbated by reduced availability of liquidity would tighten financial conditions. This in turn would lead to an increase in debt-servicing requirements for businesses and households and, more generally, weaker growth both globally and in Canada.
Potential triggers for this risk include a market overreaction to an unexpected change in monetary policy in advanced economies, including a faster-than-expected reduction in asset purchases in the euro area or Japan, or a faster-than-expected balance sheet reduction by the US Federal Reserve. Another potential trigger is a reassessment of credit risk by market participants in response to worsening economic conditions or a rise in geo-political tensions.
Global economic growth continues to strengthen and the rise in the US federal funds rate in late December 2016 and early 2017 went smoothly, suggesting that the probability of this risk materializing has declined. In fact, the most likely scenario is that stronger global growth will lead to gradually increasing policy rates and a sustainable rise in long-term interest rates.
At the same time, term premiums and credit spreads have declined and are near historical lows while already-elevated equity valuations have continued to rise. These movements reflect evidence of an ongoing search for yield that would strengthen the impact of this risk should it occur.
37 G. Cateau, T. Roberts and J. Zhou, “Indebted Households and Potential Vulnerabilities for the Canadian Financial System: A Microdata Analysis,” Bank of Canada Financial System Review (December 2015): 49–58, compare Canadian households in the 2012–14 period against US households in 2007. The financial condition of Canadian households has somewhat worsened since this period but remains better than the US comparators.
ASSeSSment oF VulneRAbilitieS And RiSkS 21 BANK OF CANADA • FINANCIAL SySTEM REVIEw • JuNE 2017
Risk 4: Stress Emanating from China or Other Emerging-Market EconomiesThe risk that Canada could be exposed to stress from China or other EMEs continues to be rated as “elevated.” The probability of this risk occurring and its impact are largely unchanged since December. Potential triggers for the rise in stress include a severe financial disruption or economic downturn in China, a disorderly depreciation of EME currencies or greater trade pro-tectionism in advanced economies. This increased stress would spill over to the Canadian financial system through weaker global growth, lower com-modity prices and a rise in financial market volatility.
In China, there remain risks surrounding the ongoing transition toward more consumption-led growth as well as regulatory measures being taken to address financial stability concerns. Activity continues to be supported by high leverage in the economy; in late May, Moody’s downgraded China’s long-term credit ratings based on expectations of further increases in leverage. Concerns about the housing market and shadow banking system continue to raise questions about the quality of loans. Corporate leverage also remains high in other EMEs despite recent improvements, with a signifi-cant amount denominated in US dollars.
Assessing the Resilience of the Canadian Financial SystemFinancial system resilience refers to the system’s capacity to withstand and quickly recover from a wide array of shocks. The Bank of Canada is well placed to conduct an overall assessment of this resilience because of its system-wide perspective and the link between this analysis and its other mandates.38 The Bank provides liquidity to the financial system,39 oversees payment clearing and settlement systems, and develops and implements monetary policy. This section discusses how the Bank assesses financial system resilience.
The Bank works with other Canadian federal financial sector authorities, each with distinct responsibilities for the stability of the financial system. The Minister of Finance is ultimately responsible for the stability of the Canadian financial system.40 OSFI is responsible for prudentially regulating and overseeing federally regulated financial institutions. The Canadian Deposit Insurance Corporation (CDIC) is the federal deposit insurer and the resolution authority for federally regulated deposit-taking institutions. The Bank works together with OSFI, CDIC, the Department of Finance Canada and the Financial Consumer Agency of Canada on an ongoing basis through the Financial Institutions Supervisory Committee and the Senior Advisory Committee.
System-wide assessments of resilience extend beyond the prudentially regulated sector. For example, the Bank publishes a regular review of developments in shadow banking. In December 2016 it concluded that no large vulnerabilities are evident in the sector but that significant data gaps need to be addressed. The Bank also regularly publishes assessments of the systemic implications of activities in different parts of the financial
38 See D. Lombardi and L. Schembri, “Reinventing the Role of Central Banks in Financial Stability,” Bank of Canada Review (Autumn 2016): 1–11.
39 This includes the Bank’s role as the lender of last resort to the Canadian financial system. For more information, see “Framework for Market Operations and Liquidity Provision” on the Bank’s website.
40 See Department of Finance Canada, “Minister of Finance Highlights Importance of Financial Stability for a Strong, Confident Middle Class,” 28 October 2016.
22 ASSeSSment oF VulneRAbilitieS And RiSkS BANK OF CANADA • FINANCIAL SySTEM REVIEw • JuNE 2017
system. In June 2016, for example, the Bank concluded that the largest public pension funds have risk management frameworks that minimize potential vulnerabilities for the financial system.
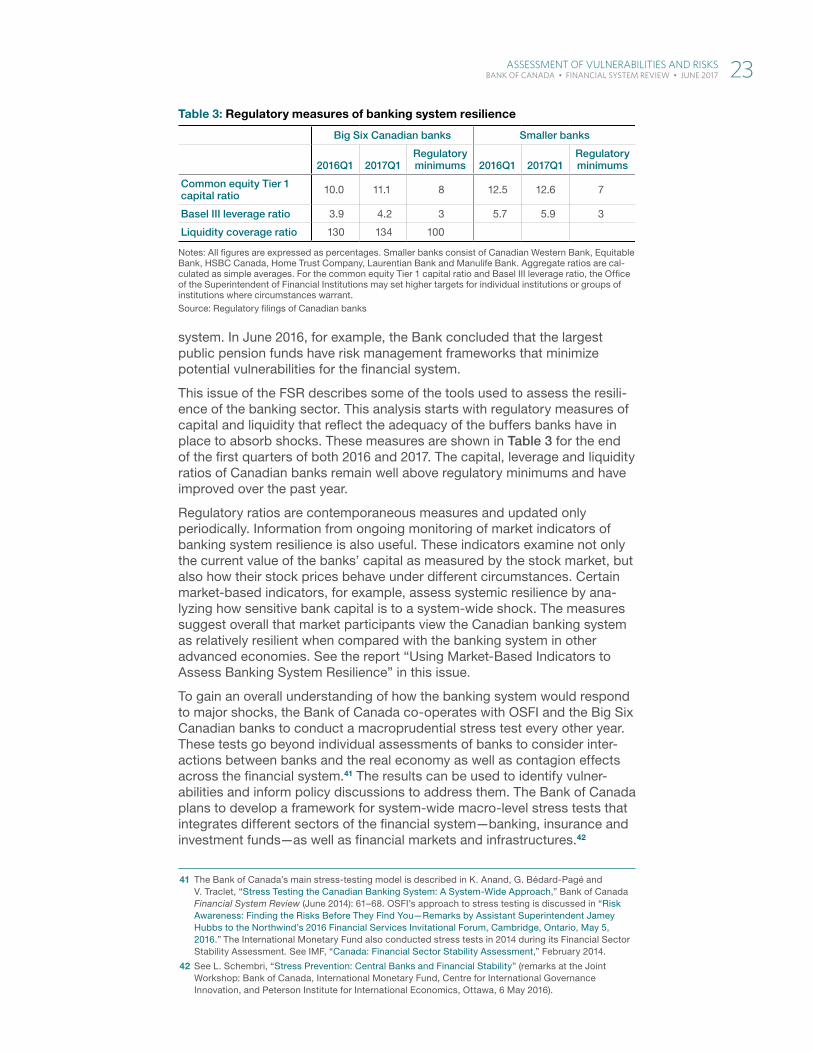
This issue of the FSR describes some of the tools used to assess the resili-ence of the banking sector. This analysis starts with regulatory measures of capital and liquidity that reflect the adequacy of the buffers banks have in place to absorb shocks. These measures are shown in Table 3 for the end of the first quarters of both 2016 and 2017. The capital, leverage and liquidity ratios of Canadian banks remain well above regulatory minimums and have improved over the past year.
Regulatory ratios are contemporaneous measures and updated only periodically. Information from ongoing monitoring of market indicators of banking system resilience is also useful. These indicators examine not only the current value of the banks’ capital as measured by the stock market, but also how their stock prices behave under different circumstances. Certain market-based indicators, for example, assess systemic resilience by ana-lyzing how sensitive bank capital is to a system-wide shock. The measures suggest overall that market participants view the Canadian banking system as relatively resilient when compared with the banking system in other advanced economies. See the report “Using Market-Based Indicators to Assess Banking System Resilience” in this issue.
To gain an overall understanding of how the banking system would respond to major shocks, the Bank of Canada co-operates with OSFI and the Big Six Canadian banks to conduct a macroprudential stress test every other year. These tests go beyond individual assessments of banks to consider inter-actions between banks and the real economy as well as contagion effects across the financial system.41 The results can be used to identify vulner-abilities and inform policy discussions to address them. The Bank of Canada plans to develop a framework for system-wide macro-level stress tests that integrates different sectors of the financial system—banking, insurance and investment funds—as well as financial markets and infrastructures.42
41 The Bank of Canada’s main stress-testing model is described in K. Anand, G. Bédard-Pagé and V. Traclet, “Stress Testing the Canadian Banking System: A System-Wide Approach,” Bank of Canada Financial System Review (June 2014): 61–68. OSFI’s approach to stress testing is discussed in “Risk Awareness: Finding the Risks Before They Find You—Remarks by Assistant Superintendent Jamey Hubbs to the Northwind’s 2016 Financial Services Invitational Forum, Cambridge, Ontario, May 5, 2016.” The International Monetary Fund also conducted stress tests in 2014 during its Financial Sector Stability Assessment. See IMF, “Canada: Financial Sector Stability Assessment,” February 2014.
42 See L. Schembri, “Stress Prevention: Central Banks and Financial Stability” (remarks at the Joint Workshop: Bank of Canada, International Monetary Fund, Centre for International Governance Innovation, and Peterson Institute for International Economics, Ottawa, 6 May 2016).
Table 3: Regulatory measures of banking system resilience
Big Six Canadian banks Smaller banks
2016Q1 2017Q1
Regulatory minimums 2016Q1 2017Q1
Regulatory minimums
Common equity Tier 1 capital ratio 10.0 11.1 8 12.5 12.6 7
Basel III leverage ratio 3.9 4.2 3 5.7 5.9 3
Liquidity coverage ratio 130 134 100
Notes: All fi gures are expressed as percentages. Smaller banks consist of Canadian Western Bank, Equitable Bank, HSBC Canada, Home Trust Company, Laurentian Bank and Manulife Bank. Aggregate ratios are cal-culated as simple averages. For the common equity Tier 1 capital ratio and Basel III leverage ratio, the Offi ce of the Superintendent of Financial Institutions may set higher targets for individual institutions or groups of institutions where circumstances warrant.Source: Regulatory fi lings of Canadian banks
ASSeSSment oF VulneRAbilitieS And RiSkS 23 BANK OF CANADA • FINANCIAL SySTEM REVIEw • JuNE 2017
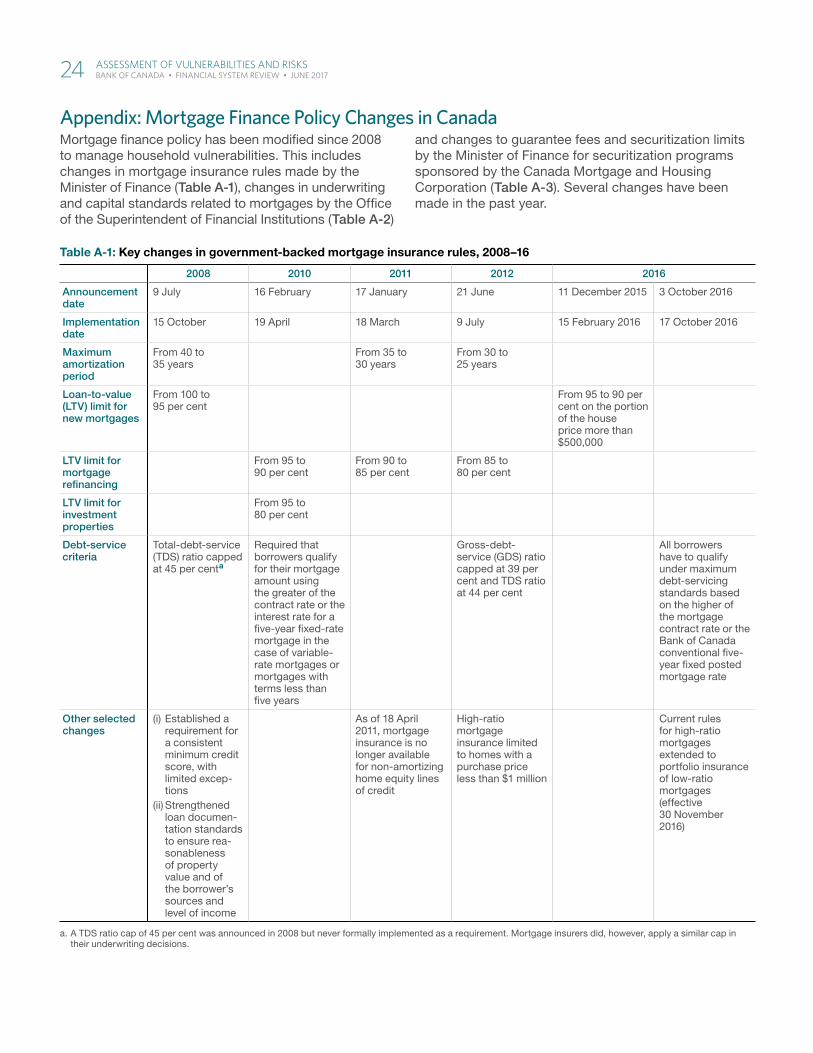
Appendix: Mortgage Finance Policy Changes in CanadaMortgage finance policy has been modified since 2008 to manage household vulnerabilities. This includes changes in mortgage insurance rules made by the Minister of Finance (Table A-1), changes in underwriting and capital standards related to mortgages by the Office of the Superintendent of Financial Institutions (Table A-2)
and changes to guarantee fees and securitization limits by the Minister of Finance for securitization programs sponsored by the Canada Mortgage and Housing Corporation (Table A-3). Several changes have been made in the past year.
Table A-1: Key changes in government-backed mortgage insurance rules, 2008–16
2008 2010 2011 2012 2016
Announcement date
9 July 16 February 17 January 21 June 11 December 2015 3 October 2016
Implementation date
15 October 19 April 18 March 9 July 15 February 2016 17 October 2016
Maximum amortization period
From 40 to 35 years
From 35 to 30 years
From 30 to 25 years
Loan-to-value (LTV) limit for new mortgages
From 100 to 95 per cent
From 95 to 90 per cent on the portion of the house price more than $500,000
LTV limit for mortgage refinancing
From 95 to 90 per cent
From 90 to 85 per cent
From 85 to 80 per cent
LTV limit for investment properties
From 95 to 80 per cent
Debt-service criteria
Total-debt-service (TDS) ratio capped at 45 per centa
Required that borrowers qualify for their mortgage amount using the greater of the contract rate or the interest rate for a five-year fixed-rate mortgage in the case of variable-rate mortgages or mortgages with terms less than five years
Gross-debt-service (GDS) ratio capped at 39 per cent and TDS ratio at 44 per cent
All borrowers have to qualify under maximum debt-servicing standards based on the higher of the mortgage contract rate or the Bank of Canada conventional five-year fixed posted mortgage rate
Other selected changes
(i) Established a requirement for a consistent minimum credit score, with limited excep-tions
(ii) Strengthened loan documen-tation standards to ensure rea-sonableness of property value and of the borrower’s sources and level of income
As of 18 April 2011, mortgage insurance is no longer available for non-amortizing home equity lines of credit
High-ratio mortgage insurance limited to homes with a purchase price less than $1 million
Current rules for high-ratio mortgages extended to portfolio insurance of low-ratio mortgages (effective 30 November 2016)
a. A TDS ratio cap of 45 per cent was announced in 2008 but never formally implemented as a requirement. Mortgage insurers did, however, apply a similar cap in their underwriting decisions.
24 ASSeSSment oF VulneRAbilitieS And RiSkS BANK OF CANADA • FINANCIAL SySTEM REVIEw • JuNE 2017

Table A-2: Key changes in guidance of the Office of the Superintendent of Financial Institutions, 2012–17
2012 2014 2016 2017
Announcement date
21 June 6 November 11 December 2015 7 July 2016 7 July 2016
Implementation date
21 June 6 November 1 November 2016 7 July 2016 1 January 2017
Changes Introduction of Guideline B-20, Residential Mortgage Underwriting Practices and Procedures
Introduction of Guideline B-21, Residential Mortgage Insurance Underwriting Practices and Procedures
Implementation of a downturn-loss-given-default (DLGD) floor to ensure capital requirements remain prudent in periods when house prices are high relative to household income and/or house prices are increasing rapidly
Publication of letter, “Reinforcing Prudent Residential Mortgage Risk Management,” which updated the industry on OSFI’s expectations for residential mortgage underwriting and of its review of Guideline B-20
Implementation of a new risk-sensitive capital framework for mortgage insurers, including a supplementary capital requirement for mortgages originated in housing markets where the house-price-to-income ratio is high relative to historical norms
Table A-3: Key changes in Canada Mortgage and Housing Corporation guarantee fees and securitization limits, 2016
Guarantee fees Before 2016 As of 1 July 2016
Five-year NHA MBS: 30 bps (annual guarantees ≤ $6.0 billion) Five-year NHA MBS: 60 bps (annual guarantees > $6.0 billion) Five-year CMB: 40 bps
Five-year NHA MBS: 30 bps (annual guarantees ≤ $7.5 billion) Five-year NHA MBS: 80 bps (annual guarantees > $7.5 billion) Five-year CMB: 30 bps + NHA MBS fee
Annual securitization limits
2015 2016
Guarantees of market NHA MBS: up to $80 billion Guarantees for CMB: up to $40 billion
Guarantees of NHA MBS: up to $105 billion Guarantees for CMB: up to $40 billion
Note: NHA MBS is National Housing Act Mortgage-Backed Securities, CMB is Canada Mortgage Bonds, bps is basis points.
ASSeSSment oF VulneRAbilitieS And RiSkS 25 BANK OF CANADA • FINANCIAL SySTEM REVIEw • JuNE 2017

ReportsReports present work by Bank of Canada staff on specific financial sector policies and on facets of the financial system’s structure and functioning. They are written with the goal of promoting informed public discussion on all aspects of the financial system.
IntroductionThis issue of the Financial System Review features three reports.
Using Market-Based Indicators to Assess Banking System Resilience, by Cameron MacDonald and Maarten van Oordt, reviews the use of quantita-tive tools to gauge market participants’ assessment of banking system resilience. The authors show that these measures complement traditional balance-sheet metrics and suggest that markets consider large Canadian banks to be better placed to weather adverse shocks than banks in other advanced economies.
In Canada’s International Investment Position: Benefits and Potential Vulnerabilities, Gabriel Bruneau, Maxime Leboeuf and Guillaume Nolin dis-cuss how, even though global financial integration is beneficial for Canada, foreign capital inflows can also facilitate an increase in domestic financial vulnerabilities and potentially lead to destabilizing reversals. Canada’s cur-rent international investment position is typical of advanced economies and will likely continue to act as an economic stabilizer. However, the growth and composition of Canada’s international investment position warrant continued monitoring.
In Project Jasper: Are Distributed Wholesale Payment Systems Feasible Yet?, James Chapman, Rodney Garratt, Scott Hendry, Andrew McCormack and Wade McMahon describe a joint endeavour between public and private sectors to explore a wholesale payment system based on distributed ledger technology (DLT). They find that a stand-alone DLT system is unlikely to be as beneficial as a centralized payment system in terms of core operating costs; however, it could increase financial system efficiency as a result of greater integration with the broader financial market infrastructure.
RepoRtS 27 BANK OF CANADA • FINANCIAL SySTEM REVIEw • JuNE 2017

using market-based indicators to Assess banking System ResilienceCameron MacDonald and Maarten R. C. van Oordt
� Market-based indicators are quantitative tools that can be used to gauge the market’s assessment of the resilience of the banking system. These indicators are based on information from financial markets and are thus timely, reflect expectations of future performance and offer good compa-rability across regions and through time.
� However, since they reflect the beliefs of market participants who could incorrectly assess banking system risks, market-based indicators could overstate or understate banking system resilience. For this reason, market-based indicators complement, rather than replace, other mea-sures of resilience based on regulatory and accounting information.
� Market-based indicators suggest that markets perceive major Canadian banks to be currently better placed to handle adverse shocks than their counterparts in other advanced economies. Compared with regulatory capital ratios, however, market-based indicators suggest less improve-ment in banking system resilience since the pre-crisis period. This report discusses several explanations for this divergence.
� When compared with banking systems in other advanced economies at the onset of banking crises since the 1990s, the Canadian banking system is seen by market participants as relatively resilient. Moreover, a market-based measure of the expected capital shortfall in the banking system under stressed conditions suggests that markets view Canadian banks as able to withstand a severe system-wide shock.
IntroductionThe Bank of Canada regularly assesses vulnerabilities in the Canadian financial system using the approach set out by Christensen et al. (2015). The assessment incorporates a variety of quantitative and qualitative sources of information that span the entire financial system. This report, in contrast, focuses exclusively on the information contained in market data as it pertains to the banking system. The data are processed into indicators to ensure a more structured interpretation of market information. These indica-tors are referred to as “market-based” because of their reliance on market
uSing mARket-bASed indiCAtoRS to ASSeSS bAnking SyStem ReSilienCe 29 BANK OF CANADA • FINANCIAL SySTEM REVIEw • JuNE 2017
data such as stock prices. The market-based indicators shed light on how market participants evaluate the resilience of the banking system, which can complement analysis based on accounting and regulatory information.
In the sections that follow, the advantages and disadvantages of market-based indicators are discussed. An index of market-based indicators is then constructed and used to infer market perceptions of the resilience of the Canadian banking system over time and in comparison with banking systems in other advanced economies. Furthermore, we examine potential explanations for why market-based indicators show less improvement since the pre-crisis period than the generally positive trend observed in regulatory capital ratios. Lastly, historical comparisons and a “market-based stress test” are used to provide some insight into the market’s assessment of the current level of resilience of the Canadian banking system.
Advantages and DisadvantagesMarket-based indicators are one of the tools that the Bank uses to analyze the resilience of the banking system. Compared with other indicators, such as accounting-based measures, market-based indicators have the advan-tage of providing a near-real-time outlook because market prices are quick to reflect changing expectations of market participants. These indicators are also forward-looking in the sense that market prices incorporate expecta-tions about future earnings. For these reasons, market-based indicators tend to be more responsive to changes in banking system resilience than balance-sheet metrics such as regulatory capital ratios. Furthermore, market-based indicators are less sensitive to differences in accounting regimes, which makes them especially suitable for cross-country compari-sons. Finally, by reflecting the views of market participants, these indicators help us understand market funding and investment decisions such as willingness to roll over bank funding in times of stress. Since a worsening in market perceptions could potentially cause trouble for banks in the form of funding and market liquidity issues, monitoring these indicators is important even if markets incorrectly assess banking system risks.
Because market participants could be wrong about banking system risks, market-based indicators complement, rather than replace, other meas-ures of resilience. Moreover, market-based indicators have several other limitations. First, they can reflect the noise present in market data as well as uncertainty inherent in the methodologies used to estimate them. As a result, small changes in these indicators may not be very meaningful. In addition, these indicators embed market expectations of the effects of potential government interventions to support distressed banks and therefore do not assess the stand-alone risk profile of the banking system. Confidential regulatory data may also provide a more accurate or granular view than public data available to market participants. Finally, challenges can arise in the interpretation of indicators: for example, when relying solely on market data it may be difficult to disentangle whether high correlations are due to common exposures or direct interlinkages between banks.
An Index of Market-Based IndicatorsA banking system can be considered more resilient if it has a higher cap-acity to withstand and quickly recover from a wide array of shocks. All else being equal, a banking system is better able to withstand and quickly recover from shocks if (i) it has larger initial capital and liquidity buffers to
30 uSing mARket-bASed indiCAtoRS to ASSeSS bAnking SyStem ReSilienCe BANK OF CANADA • FINANCIAL SySTEM REVIEw • JuNE 2017

absorb shocks, (ii) the system-wide impact of shocks is smaller, and (iii) the banks in the system are able to quickly rebuild their capital from retained earnings after a shock occurs.
To monitor the market’s perception of the current state of banking system resilience and facilitate comparisons across regions and time, we construct a composite index that broadly measures these aspects of banking system resilience.1 The index incorporates five widely implemented market-based indicators: a market-based capital ratio (MBCR), distance to default (DD), exposure ΔCoVaR (difference in conditional value-at-risk), marginal expected shortfall (MES) and long-run marginal expected shortfall (LRMES). Box 1 provides a brief explanation of each of these indicators.
The indicators can be roughly categorized into two types. The first is based on the market valuations of banks (MBCR and DD), which in turn depend on the level of the banks’ capital buffers and expectations of their future profitability. These aspects are relevant to the resilience of individual banks regardless of whether shocks are bank-specific or system-wide. In comparison, the second type of indicator mainly considers resilience related to the system-wide impact of severe shocks (exposure ΔCoVaR, MES and LRMES). These indicators account for the degree of interlinkages and common exposures within a banking system as perceived by market participants,2 which can increase the system-wide impact of shocks. Moreover, they are also sensitive to vulnerabilities associated with unstable funding profiles, which can threaten the continuity of banks and thus future earnings (López-Espinosa et al. 2012, 2013).
We construct a banking system resilience index for different countries and regions by averaging the individual indicators using weights based on their standard deviations.3 This ensures a roughly equal contribution of each indicator to changes in the index. The level of the index for Canada in 2004, which covers the Big Six banks (see the Appendix), is taken as the base value of zero, and all other values are expressed relative to that. With this base year, the long-term average for Canada since 1990 is close to an index value of zero. An increase in the level of the index corresponds to a higher level of banking system resilience based on market perceptions. In particular, every 100-point increase in the index is equivalent to a doubling of the indicators related to the banks’ capital buffers and their future profit-ability (MBCR and DD), and a halving of indicators related to the system-wide impact of shocks (exposure ΔCoVaR, MES and LRMES).
The level of the index is comparable across regions and time.4 However, in terms of resilience, the comparability over time is affected by variation in market valuations on an aggregate level that is related to discount rates and not to expected future dividends. Discount rates are affected by changes in the yield curve and risk premiums over time (Cochrane 2011), which depend on saving behaviour and global risk appetite, among other factors, but they
1 There may be other aspects of resilience that are not completely captured by these indicators. Including indicators that better capture these other aspects would result in a broader index but could also affect the historical and geographical availability of the index because of additional data requirements.
2 Market-based measures for the degree of interlinkages and common exposures tend to be highly correlated to broad regulatory measures of interconnectedness used to classify systemically important banks (Van Oordt and Zhou 2015).
3 These are Australia, Canada, the euro area, the United Kingdom and the United States.
4 To ensure greater comparability between the MBCRs of banks reporting under International Financial Reporting Standards (IFRS) and US Generally Accepted Accounting Principles (US GAAP), we adjust the amount of total assets of US banks for differences in derivatives netting following the procedure described by the IFRS Foundation (2015).
uSing mARket-bASed indiCAtoRS to ASSeSS bAnking SyStem ReSilienCe 31 BANK OF CANADA • FINANCIAL SySTEM REVIEw • JuNE 2017

are also influenced by the unconventional monetary policies of some central banks over the past few years. Cross-country comparisons at the same point in time are less affected by the changes in the yield curve and risk premiums over time.
The Evolution in Global Banking System Resilience Since the Financial CrisisChart 1 provides a summary view of how the resilience of the banking systems of Canada, the United States, the United Kingdom, Australia and the euro area has evolved over the past decade. The overall pattern of movements in the index is broadly similar across countries and regions, which suggests that market perceptions of banking system resilience at the
Box 1
Market-Based Indicators in the Index of Banking System ResilienceThis box briefl y explains the fi ve indicators used in calcu-lating the banking system resilience index . Each indicator is calculated for individual banks and then aggregated for the banking system by calculating a weighted average . Details on the methodology to estimate each of these indi-cators and other background information is provided in MacDonald, Van Oordt and Scott (2016) .
The market-based capital ratio (MBCR) is a measure of a bank’s capital buff er based on market valuations . More pre-cisely, the MBCR is defi ned as the market value of common equity as a percentage of the market value of total assets, where the market value of total assets is calculated as the sum of the market value of common equity and the book value of total debt . The MBCR is somewhat analogous to the Basel III leverage ratio in the sense that assets are not risk-weighted .
The distance to default (DD) is a proxy for the number of standard deviations of a shock to the market value of a bank’s assets that would erase its equity capital . A smaller DD indicates that a less extreme shock could potentially eliminate the institution’s capital, suggesting a higher prob-ability of default . Its level is calculated as roughly the diff er-ence between the market value of assets and the face value of debt, expressed as a ratio of the annualized volatility of the asset value .1 Since the DD includes a correction for asset risk, it is somewhat analogous to risk-weighted regulatory capital ratios such as the common equity Tier 1 ratio .
The marginal expected shortfall (MES) and the long-run marginal expected shortfall (LRMES) measure the expected loss of an institution if the banking system suff ers a sudden adverse shock . while the MES measures one-day losses of a bank conditional upon a system-wide shock, the LRMES
1 The measure is estimated based on the Merton model (Merton 1974) .
provides an expected cumulative loss of market value over a longer period (typically six months) .2 The higher the MES (or LRMES), the greater the impact of a system-wide shock . The MES is estimated as the average of a bank’s equity returns during the worst 5 per cent of days for the banking system in that country or region over the past two years (Acharya, Engle and Richardson 2012) . Our procedure to estimate the LRMES of a bank involves modelling the relationship between an individual bank’s equity returns and the returns on an index with all other institutions in the banking system, while allowing for volatility and correlations to vary over time (Acharya et al . 2017; Brownlees and Engle 2017) . This relationship is used to simulate a large number of potential paths for the bank’s and the system’s equity returns over the next six months . The LRMES is then calculated as the median return of the bank in the simulations with the worst 1 per cent of outcomes for the system .
The MES and LRMES both focus on the expected loss in a hypothetical stress scenario . In contrast, exposure ∆CoVaR (diff erence in conditional value-at-risk) focuses on the increase in downside tail risk of a bank, conditional upon a system-wide shock (Adrian and Brunnermeier 2016) . Its level depends not only on the level of expected losses but also on how risk evolves in a potential stress scenario . A larger exposure ∆CoVaR therefore indicates a higher degree of sensitivity of a bank’s individual distress to shocks in the banking system . The exposure ∆CoVaR is computed as the increase in an institution’s daily value-at-risk with a 95 per cent confi dence level conditional upon the system suff ering a loss equal to the system’s own value-at-risk . The level of the exposure ∆CoVaR is calculated using quantile regres-sion techniques .
2 Historical experience shows that banking crises have the potential to last much longer than six months (Laeven and Valencia 2013) .
32 uSing mARket-bASed indiCAtoRS to ASSeSS bAnking SyStem ReSilienCe BANK OF CANADA • FINANCIAL SySTEM REVIEw • JuNE 2017

regional level are strongly influenced by global events. However, the magni-tude of changes in the index in response to these events has varied across countries and regions.
The evolution of the resilience index levels for the Canadian and Australian banking systems during the 2008–09 financial crisis supports the view that these countries were relatively less affected than other advanced econ-omies (see also Sarin and Summers 2016, 101). At the beginning of 2008, the resilience index for the US, UK and euro area banking systems had reached levels between -70 and -90. At the trough in March 2009, the index for these regions had fallen to levels around -190 in the euro area and the United Kingdom and -210 in the United States. In comparison, the resilience index for Canada had fallen to a value of -120. The nearly 100-point differ-ence implies that, at the deepest point in the crisis, the US banking system was substantially worse off in measures of resilience compared with the Canadian banking system.
Another example of the differences across regions is observed in the recovery phase after their index levels had reached their lowest point in the crisis. In particular, the improvement in the index was much slower for the euro area than for other regions once the European sovereign debt crisis began escalating in 2010. In contrast, the resilience index for Canada reached into positive territory for the first time since the crisis in September 2012.
In the second half of 2014, the generally positive trend reversed following rising concerns about the global growth outlook that coincided with a sig-nificant decline in oil and other commodity prices. The initial reversal was more pronounced for Canada, suggesting that market participants viewed the weakened outlook and the exposure of Canadian banks to the resource
File information (for internal use only): Chart 1 - Chart 1 - evolution in market - EN.indd
Last output: 05/09/17 - 01:03PM
Chart 1:
Lehman bankruptcy
Concerns about global growth and declining oil prices
Evolution in market perceptions of banking system resilience, by regionIndex: Canada in January 2004 = 0, higher values imply greater perceived resilience
Canada United Statesa Euro area Australia United Kingdom
Notes: The resilience index is constructed as a weighted average of fi ve sub-indexes based on the following indicators: MBCR, DD, MES, LRMES and exposure ΔCoVaR (see Box 1). The sub-index weights function to normalize for differences in volatility across indicators. See MacDonald, Van Oordt and Scott (2016) and the Appendix for more details on the calculations behind the index.
a. When calculating the MBCR of US banks, total assets are adjusted to account for differences in derivatives n etting across accounting regimes.
Sources: Thomson Reuters Datastream and Bank of Canada calculations Last observation: April 2017
US house prices begin to decline
-300
-200
-100
0
100
2005 2007 2009 2011 2013 2015 2017
Index
uSing mARket-bASed indiCAtoRS to ASSeSS bAnking SyStem ReSilienCe 33 BANK OF CANADA • FINANCIAL SySTEM REVIEw • JuNE 2017

sector as limiting their ability to quickly recover from additional setbacks in the future, although not to the same extent as in 2008–09. Since early 2016, the index for Canada has once again been improving along with the outlook for global growth and a partial recovery in commodity prices, while the euro area and UK banking systems have faced additional setbacks from uncer-tainty surrounding the Brexit referendum and non-performing loans at Italian banks.
The current level of the resilience index for Canada remains above that of all other regions examined. This is consistent with the typically narrower credit spreads of Canadian banks compared with many of their global peers (see, e.g., Bank of Canada 2016, 23). Moreover, the ranking of regions was fairly similar across the different index components in April 2017 (Chart 2), suggesting that the relative resilience of the Canadian banking system is independent of the weights used to construct the index from the individual market-based indicators.
Banking System Resilience and Regulatory Capital RatiosMarket-based indicators suggest less improvement in banking system resilience than regulatory capital ratios do. The previous section shows that market-based indicators suggest markets do not regard banks as substan-tially more resilient than they were in the pre-crisis period. This is particularly true for banks in the euro area, which market-based indicators suggest are less resilient than before the crisis. This is a different picture than that pro-vided by regulatory capital ratios, which have improved substantially in all jurisdictions since the pre-crisis period (Chart 3). There are several possible explanations for this divergence.5
First, market-based indicators of banking system resilience reflect the expectation that banks have a reduced ability to replenish capital buffers as a consequence of weaker profitability, while regulatory capital ratios omit this information. Regulatory and accounting-based capital ratios provide a backward-looking measure of bank resilience and are unaffected by changes in expected future profits. In contrast, a reduction in expected
5 See also Calomiris and Nissim (2014) and Sarin and Summers (2016).
File information (for internal use only): Chart 1 - Chart 2 - comparison of index - EN.indd
Last output: 05/09/17 - 03:47PM
-150
-100
-50
0
50Index
Chart 2: Comparison of index components across regions as of April 2017Index: Canada in January 2004 = 0, higher values imply greater perceived resilience
Canada United States Euro area Australia United Kingdom
Sour ces: Thomson Reuters Datastream and Bank of Canada calculations Last observation: April 2017
MBCR DD MES LRMES Exposure ΔCoVaR
Individual resilience System-wide impact of shocks
34 uSing mARket-bASed indiCAtoRS to ASSeSS bAnking SyStem ReSilienCe BANK OF CANADA • FINANCIAL SySTEM REVIEw • JuNE 2017
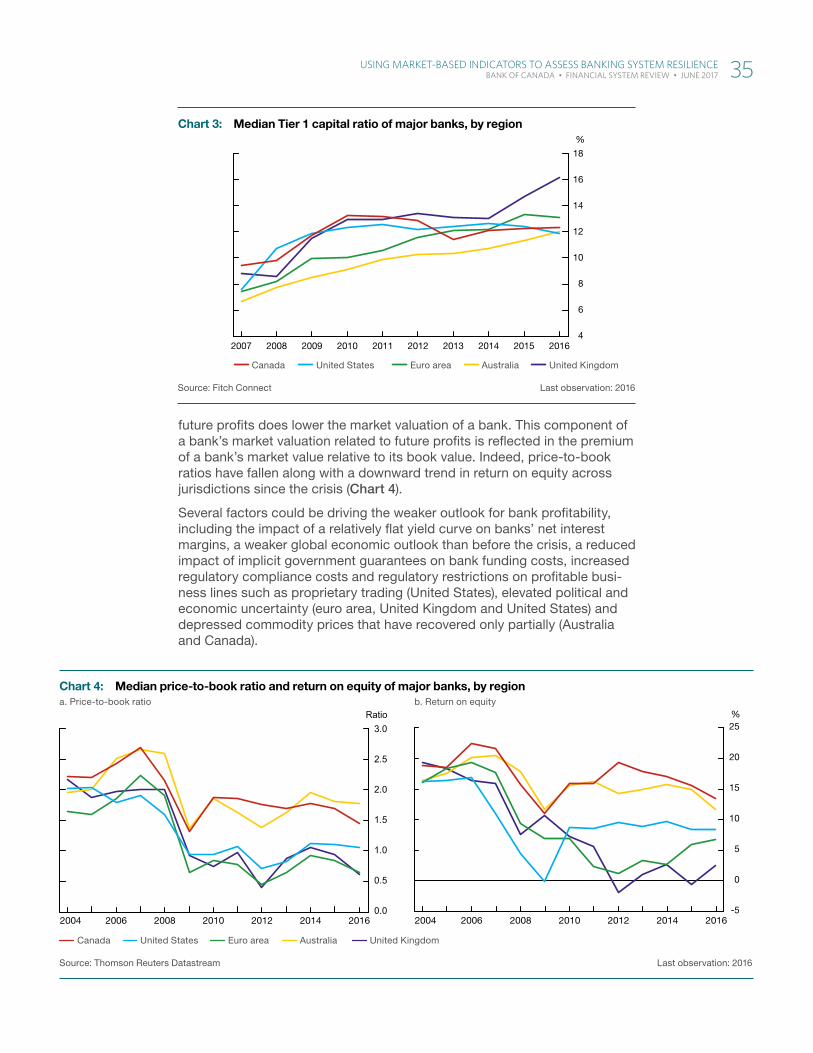
future profits does lower the market valuation of a bank. This component of a bank’s market valuation related to future profits is reflected in the premium of a bank’s market value relative to its book value. Indeed, price-to-book ratios have fallen along with a downward trend in return on equity across jurisdictions since the crisis (Chart 4).
Several factors could be driving the weaker outlook for bank profitability, including the impact of a relatively flat yield curve on banks’ net interest margins, a weaker global economic outlook than before the crisis, a reduced impact of implicit government guarantees on bank funding costs, increased regulatory compliance costs and regulatory restrictions on profitable busi-ness lines such as proprietary trading (United States), elevated political and economic uncertainty (euro area, United Kingdom and United States) and depressed commodity prices that have recovered only partially (Australia and Canada).
File information (for internal use only): Chart 1 - Chart 3 - median tier - EN.indd
Last output: 05/09/17 - 04:17PM
Chart 3: Median Tier 1 capital ratio of major banks, by region
Canada United States Euro area Australia United Kingdom
Source: Fitch Connect Last observation: 2016
4
6
8
10
12
14
16
18
2007 2008 2009 2010 2011 2012 2013 2014 2015 2016
%
Chart 4: Median price-to-book ratio and return on equity of major banks, by regiona. Price-to-book ratio b. Return on equity
Canada United States Euro area Australia United Kingdom
Source: Thomson Reuters Datastream Last observation: 2016
2004 2006 2008 2010 2012 2014 20160.0
0.5
1.0
1.5
2.0
2.5
3.0Ratio
-5
0
5
10
15
20
25
2004 2006 2008 2010 2012 2014 2016
%
uSing mARket-bASed indiCAtoRS to ASSeSS bAnking SyStem ReSilienCe 35 BANK OF CANADA • FINANCIAL SySTEM REVIEw • JuNE 2017

Second, market-based indicators of banking system resilience suggest that the system-wide impact of shocks has remained relatively high since the financial crisis, which could be due to a remaining high level of interconnect-edness, common exposures and complexity within banking systems as well as banking system consolidation and elevated global uncertainty in the post-crisis period. The Tier 1 capital ratios shown in Chart 3 do not account for these aspects of resilience.6
Third, the improvements in banking sector resilience relative to the pre-crisis period might not be fully captured by market-based indicators if market participants underestimated banking system risks before the financial crisis. This explanation assumes markets have become more aware of, or better at internalizing, the risks associated with unstable funding profiles and interconnected banking systems since the financial crisis, resulting in an overly optimistic base case and therefore an underestimation of the actual improvement in resilience. Moreover, international efforts to implement bail-in regimes that allow authorities to recapitalize banks by converting eligible debt of a failing bank into common shares could have contributed to markets better internalizing risks since the crisis.
Fourth, markets may discount the improvements in regulatory capital ratios because of variation across banks arising from diversity in regulatory defin-itions and banks’ methodological choices. For example, a significant amount of variation in average risk weights has been attributed to differences in bank and supervisory practices (Basel Committee on Banking Supervision 2013; Plosser and Santos 2014).
Market-Based Indicators During Banking System StressThe analysis so far does not address whether the market perceives the Canadian banking system as able to withstand a severe system-wide shock. This section applies two approaches to provide further insight into this question, with each approach having its own caveats.
The first approach is to compare the current level of the Canadian index of banking system resilience with the levels of other banking systems at the onset of historical episodes of severe banking distress. The index levels for the banking systems in these regions can provide reference points for when banking system resilience was insufficient to withstand a severe system-wide shock. The idea behind this approach is that a banking system that does not have an index value above these levels is unlikely to be sufficiently resilient.
Table 1 shows the results of this first approach, noting the levels of the banking system resilience index and each of the market-based indicators for a sample of major banks in countries at the onset of historical stress episodes.7 For each indicator, higher values are associated with more resili-ence. The last row of the table reports the current levels for Canada for comparative purposes. The current level of the banking system resilience index for Canada in Table 1 is substantially higher than that of other econ-omies at the onset of episodes of banking system distress, except for the Asian crisis, for which the difference is smaller. This suggests that, based on
6 These factors are, to some extent, accounted for in the Basel Committee on Banking Supervision’s assessment frameworks to determine the additional loss absorbency requirement for systemically important banks.
7 Except for the US and euro area crises, the level of the resilience index is not substantially higher in the 12 months before the selected dates, but it is generally much lower in the 12 months that follow.
36 uSing mARket-bASed indiCAtoRS to ASSeSS bAnking SyStem ReSilienCe BANK OF CANADA • FINANCIAL SySTEM REVIEw • JuNE 2017
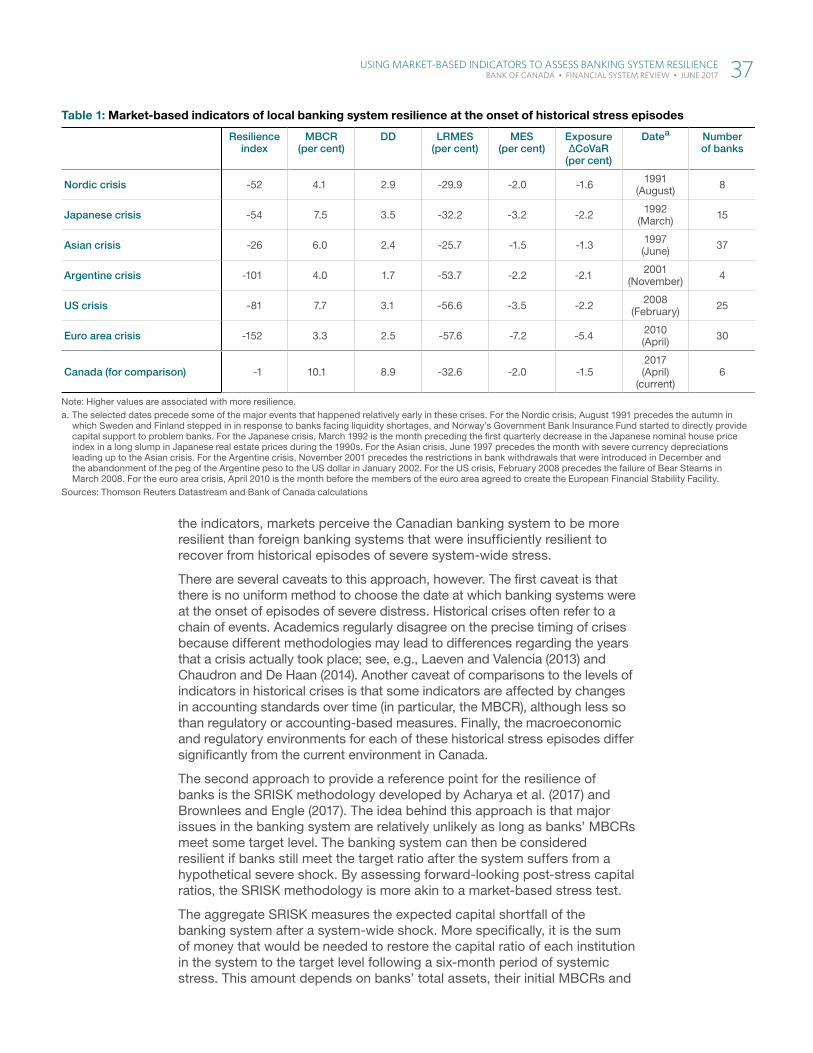
the indicators, markets perceive the Canadian banking system to be more resilient than foreign banking systems that were insufficiently resilient to recover from historical episodes of severe system-wide stress.
There are several caveats to this approach, however. The first caveat is that there is no uniform method to choose the date at which banking systems were at the onset of episodes of severe distress. Historical crises often refer to a chain of events. Academics regularly disagree on the precise timing of crises because different methodologies may lead to differences regarding the years that a crisis actually took place; see, e.g., Laeven and Valencia (2013) and Chaudron and De Haan (2014). Another caveat of comparisons to the levels of indicators in historical crises is that some indicators are affected by changes in accounting standards over time (in particular, the MBCR), although less so than regulatory or accounting-based measures. Finally, the macroeconomic and regulatory environments for each of these historical stress episodes differ significantly from the current environment in Canada.
The second approach to provide a reference point for the resilience of banks is the SRISK methodology developed by Acharya et al. (2017) and Brownlees and Engle (2017). The idea behind this approach is that major issues in the banking system are relatively unlikely as long as banks’ MBCRs meet some target level. The banking system can then be considered resilient if banks still meet the target ratio after the system suffers from a hypothetical severe shock. By assessing forward-looking post-stress capital ratios, the SRISK methodology is more akin to a market-based stress test.
The aggregate SRISK measures the expected capital shortfall of the banking system after a system-wide shock. More specifically, it is the sum of money that would be needed to restore the capital ratio of each institution in the system to the target level following a six-month period of systemic stress. This amount depends on banks’ total assets, their initial MBCRs and
Table 1: Market-based indicators of local banking system resilience at the onset of historical stress episodes
Resilienceindex
MBCR(per cent)
DD LRMES(per cent)
MES(per cent)
Exposure∆CoVaR
(per cent)
Datea Number of banks
Nordic crisis -52 4.1 2.9 -29.9 -2.0 -1.6 1991 (August) 8
Japanese crisis -54 7.5 3.5 -32.2 -3.2 -2.2 1992 (March) 15
Asian crisis -26 6.0 2.4 -25.7 -1.5 -1.3 1997 (June) 37
Argentine crisis -101 4.0 1.7 -53.7 -2.2 -2.1 2001 (November) 4
US crisis -81 7.7 3.1 -56.6 -3.5 -2.2 2008 (February) 25
Euro area crisis -152 3.3 2.5 -57.6 -7.2 -5.4 2010 (April) 30
Canada (for comparison) -1 10.1 8.9 -32.6 -2.0 -1.52017 (April)
(current)6
Note: Higher values are associated with more resilience. a. The selected dates precede some of the major events that happened relatively early in these crises. For the Nordic crisis, August 1991 precedes the autumn in
which Sweden and Finland stepped in in response to banks facing liquidity shortages, and Norway’s Government Bank Insurance Fund started to directly provide capital support to problem banks. For the Japanese crisis, March 1992 is the month preceding the fi rst quarterly decrease in the Japanese nominal house price index in a long slump in Japanese real estate prices during the 1990s. For the Asian crisis, June 1997 precedes the month with severe currency depreciations leading up to the Asian crisis. For the Argen tine crisis, November 2001 precedes the restrictions in bank withdrawals that were introduced in December and the abandonment of the peg of the Argentine peso to the US dollar in January 2002. For the US crisis, February 2008 precedes the failure of Bear Stearns in March 2008. For the euro area crisis, April 2010 is the month before the members of the euro area agreed to create the European Financial Stability Facility.
Sources: Thomson Reuters Datastream and Bank of Canada calculations
uSing mARket-bASed indiCAtoRS to ASSeSS bAnking SyStem ReSilienCe 37 BANK OF CANADA • FINANCIAL SySTEM REVIEw • JuNE 2017
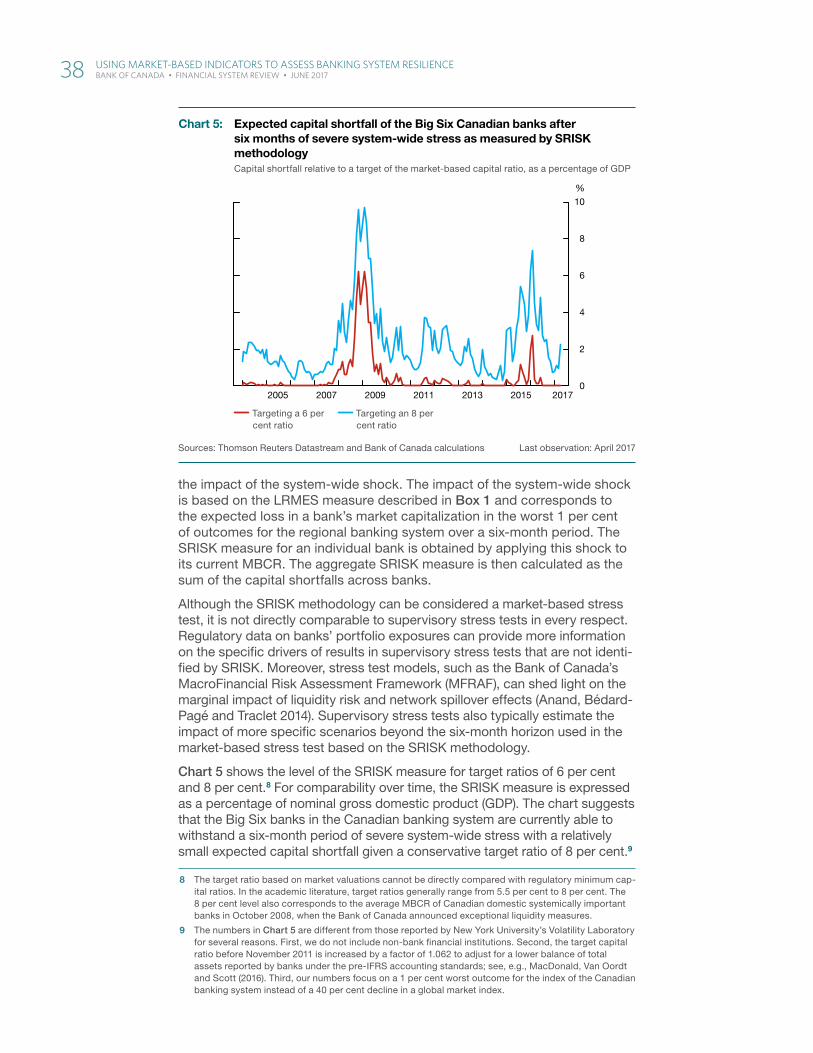
the impact of the system-wide shock. The impact of the system-wide shock is based on the LRMES measure described in Box 1 and corresponds to the expected loss in a bank’s market capitalization in the worst 1 per cent of outcomes for the regional banking system over a six-month period. The SRISK measure for an individual bank is obtained by applying this shock to its current MBCR. The aggregate SRISK measure is then calculated as the sum of the capital shortfalls across banks.
Although the SRISK methodology can be considered a market-based stress test, it is not directly comparable to supervisory stress tests in every respect. Regulatory data on banks’ portfolio exposures can provide more information on the specific drivers of results in supervisory stress tests that are not identi-fied by SRISK. Moreover, stress test models, such as the Bank of Canada’s MacroFinancial Risk Assessment Framework (MFRAF), can shed light on the marginal impact of liquidity risk and network spillover effects (Anand, Bédard-Pagé and Traclet 2014). Supervisory stress tests also typically estimate the impact of more specific scenarios beyond the six-month horizon used in the market-based stress test based on the SRISK methodology.
Chart 5 shows the level of the SRISK measure for target ratios of 6 per cent and 8 per cent.8 For comparability over time, the SRISK measure is expressed as a percentage of nominal gross domestic product (GDP). The chart suggests that the Big Six banks in the Canadian banking system are currently able to withstand a six-month period of severe system-wide stress with a relatively small expected capital shortfall given a conservative target ratio of 8 per cent.9
8 The target ratio based on market valuations cannot be directly compared with regulatory minimum cap-ital ratios. In the academic literature, target ratios generally range from 5.5 per cent to 8 per cent. The 8 per cent level also corresponds to the average MBCR of Canadian domestic systemically important banks in October 2008, when the Bank of Canada announced exceptional liquidity measures.
9 The numbers in Chart 5 are different from those reported by New York University’s Volatility Laboratory for several reasons. First, we do not include non-bank financial institutions. Second, the target capital ratio before November 2011 is increased by a factor of 1.062 to adjust for a lower balance of total assets reported by banks under the pre-IFRS accounting standards; see, e.g., MacDonald, Van Oordt and Scott (2016). Third, our numbers focus on a 1 per cent worst outcome for the index of the Canadian banking system instead of a 40 per cent decline in a global market index.
File information (for internal use only): Chart 1 - Chart 5 - expected capital - EN.indd
Last output: 01/06/16 - 02:21PM
Chart 5: Expected capital shortfall of the Big Six Canadian banks after six months of severe syste m-wide stress as measured by SRISK methodologyCapital shortfall relative to a target of the market-based capital ratio, as a percentage of GDP
Targeting a 6 per cent ratio
Targeting an 8 per cent ratio
Sources: Thomson Reuters Datastream and Bank of Canada calculations Last observation: April 2017
0
2
4
6
8
10
%
2005 2007 2009 2011 2013 2015 2017
38 uSing mARket-bASed indiCAtoRS to ASSeSS bAnking SyStem ReSilienCe BANK OF CANADA • FINANCIAL SySTEM REVIEw • JuNE 2017
From mid-2014 until early 2016, however, the level of the SRISK measure increased as commodity prices slid and global uncertainty grew. The initial low level around the summer of 2014 indicates that Canadian banks, at that time, were considered more resilient than after the fall in oil prices. The higher level in early 2016 suggests that an additional six-month period of severe system-wide stress in an environment of depressed commodity prices could have resulted in an MBCR significantly below the target of 8 per cent. As such, market participants deemed the banking system to have a lower capacity to recover from additional setbacks during that period. The relatively high level of the peak in early 2016 is also due in part to the growth in the Canadian banking system, which has outpaced the growth in nominal GDP. As a result, the economic and fiscal consequences of instability in the banking system would be larger.
ConclusionMarket-based indicators are one of many tools used to assess banking system resilience. They are complementary to regulatory measures such as capital and leverage ratios as well as stress tests. These indicators help monitor the market’s current perception of the banking system’s capacity to withstand and quickly recover from a wide array of shocks. They reflect market information regarding the level of buffers in the banking system, the possible system-wide impact of shocks and the system’s ability to rebuild buffers from retained earnings after a shock.
Overall, the indicators suggest that market participants perceive the Canadian banking system to be relatively resilient when compared with both the current situation in other advanced economies and with histor-ical episodes at the onset of banking crises. This is consistent with the stress test conducted in the context of the International Monetary Fund’s Financial Sector Assessment Program, which demonstrated the resilience of the major financial institutions in Canada to risks arising from a severe stress scenario (IMF 2014). However, market-based indicators do not show a meaningful increase in resilience compared with the pre-crisis period, despite improvements in the levels of regulatory capital ratios. This can be partly explained by the additional aspects of banking system resilience cap-tured by market-based indicators, including expectations regarding future earnings and the system-wide impact of shocks, but it may also reflect the market’s inability to detect the lack of resilience in the pre-crisis period. Market-based indicators should therefore be used as a part of a larger tool kit that takes into account other sources of information.
ReferencesAcharya, V. V., R. F. Engle and M. Richardson. 2012. “Capital Shortfall: A
New Approach to Ranking and Regulating Systemic Risks.” American Economic Review: Papers & Proceedings 102 (3): 59–64.
Acharya, V. V., L. H. Pedersen, T. Philippon and M. Richardson. 2017. “Measuring Systemic Risk.” Review of Financial Studies 30 (1): 2–47.
Adrian, T. and M. K. Brunnermeier. 2016. “CoVaR.” American Economic Review 106 (7): 1705–1741.
uSing mARket-bASed indiCAtoRS to ASSeSS bAnking SyStem ReSilienCe 39 BANK OF CANADA • FINANCIAL SySTEM REVIEw • JuNE 2017

Anand, K., G. Bédard-Pagé and V. Traclet. 2014. “Stress Testing the Canadian Banking System: A System-Wide Approach.” Bank of Canada Financial System Review (June): 61–68.
Bank of Canada. 2016. Financial System Review (June).
Basel Committee on Banking Supervision (BCBS). 2013. Regulatory Consistency Assessment Programme (RCAP)—Analysis of Risk-Weighted Assets for Credit Risk in the Banking Book.
Brownlees, C. and R. F. Engle. 2017. “SRISK: A Conditional Capital Shortfall Measure of Systemic Risk.” Review of Financial Studies 30 (1): 48–79.
Calomiris, C. W. and D. Nissim. 2014. “Crisis-Related Shifts in the Market Valuation of Banking Activities.” Journal of Financial Intermediation 23 (3): 400–435.
Chaudron, R. and J. de Haan. 2014. “Dating Banking Crises Using Incidence and Size of Bank Failures: Four Crises Reconsidered.” Journal of Financial Stability 15 (December): 63–75.
Christensen, I., G. Kumar, C. Meh and L. Zorn. 2015. “Assessing Vulnerabilities in the Canadian Financial System.” Bank of Canada Financial System Review (June): 37–46.
Cochrane, J. H. 2011. “Presidential Address: Discount Rates.” Journal of Finance 66 (4): 1047–1108.
IFRS Foundation. 2015. “Sizing Up the Balance Sheet.” The Essentials, Issue 3 (May).
International Monetary Fund (IMF). 2014. “Canada: Financial Sector Stability Assessment.” IMF Country Report No. 14/29.
Laeven, L. and F. Valencia. 2013. “Systemic Banking Crises Database.” IMF Economic Review 61 (2): 225–270.
López-Espinosa, G., A. Moreno, A. Rubia and L. Valderrama. 2012. “Short-Term Wholesale Funding and Systemic Risk: A Global CoVaR Approach.” Journal of Banking & Finance 36 (12): 3150–3162.
López-Espinosa, G., A. Rubia, L. Valderrama and M. Antón. 2013. “Good for One, Bad for All: Determinants of Individual Versus Systemic Risk.” Journal of Financial Stability 9 (3): 287–299.
MacDonald, C., M. van Oordt and R. Scott. 2016. “Implementing Market-Based Indicators to Monitor Vulnerabilities of Financial Institutions.” Bank of Canada Staff Analytical Note No. 2016-5.
Merton, R. C. 1974. “On the Pricing of Corporate Debt: The Risk Structure of Interest Rates.” Journal of Finance 29 (2): 449–470.
Plosser, M. C. and J. A. C. Santos. 2014. “Banks’ Incentives and the Quality of Internal Risk Models.” Federal Reserve Bank of New York Staff Report No. 704.
40 uSing mARket-bASed indiCAtoRS to ASSeSS bAnking SyStem ReSilienCe BANK OF CANADA • FINANCIAL SySTEM REVIEw • JuNE 2017

Sarin, N. and L. H. Summers. 2016. “Have Big Banks Gotten Safer?” Brookings Papers on Economic Activity (Fall): 57–109.
Van Oordt, M. and C. Zhou. 2015. “Systemic Risk of European Banks: Regulators and Markets.” DNB Working Paper No. 478.
Appendix: Technical Details and List of InstitutionsThe index values in this report are calculated using the following formula:
Ic,t=100
ln (2)×
⎣⎢⎢⎢⎡0.192 ln
MBCRc,t10.1%
+0.168 lnmax DDc,t,1
6.92+0.168 ln
{ } -2.05%MESc,t
+0.291 ln-27.2%
LRMESc,t+0.180 ln
-1.42%c,t ⎦
⎥⎥⎥⎤
� � �� � �
� �� � exposure ΔCoVaR ,
where 𝐼𝑐,𝑡 refers to the level of the indicator and where, for example, 𝑀𝐵𝐶𝑅𝑐,𝑡 corresponds to the weighted average of the market-based capital ratio in region 𝑐 at time 𝑡. Bank-specific market-based indicators are calculated for each of the financial institutions listed in Table A-1 following the method-ology in MacDonald, Van Oordt and Scott (2016). The weights to calculate the average 𝑀𝐵𝐶𝑅𝑐,𝑡 in region 𝑐 at time 𝑡 are based on the book values of total assets at time 𝑡; the weights to calculate the average 𝐷𝐷𝑐,𝑡 are based on the book values of total debt; and the weights to calculate the average 𝑀𝐸𝑆𝑐,𝑡, 𝐿𝑅𝑀𝐸𝑆𝑐,𝑡 and exposure ΔCoVaR𝑐,𝑡 are based on the market capital-izations at time 𝑡. The numbers in the formula are the indicator weights as well as the indicator values for Canada in January 2004.
Table A-1: List of institutions
Region Institutions
Canada Big Six Canadian banks: Bank of Montreal, Canadian Imperial Bank of Commerce, National Bank of Canada, Royal Bank of Canada, Ba nk of Nova Scotia, Toronto-Dominion Bank
Australia Australia and New Zealand Banking Group, Commonwealth Bank of Australia, National Australia Bank, Westpac Banking Corporation
Euro area ABN AMRO Bank (the Netherlands), Allied Irish Banks (Ireland), Alpha Bank (Greece), Banco Bilbao Vizcaya Argentaria (Spain), Banco BPI (Portugal), Banco Comercial Português (Portugal), Banco Popular Español (Spain), Banco de Sabadell (Spain), Bank of Ireland (Ireland), Bank of Valletta (Malta), BNP Paribas (France), Caixa Economica Montepio Geral (Portugal), Commerzbank (Germany), Criteria CaixaHolding (Spain), Deutsche Bank (Germany), Erste Group Bank (Austria), Eurobank Ergasias (Greece), Groupe Crédit Agricole (France), ING Group (the Netherlands), Intesa Sanpaolo (Italy), KBC Groep (Belgium), Monte de Paschi di Siena (Italy), National Bank of Greece (Greece), Piraeus Bank (Greece), Raiffeisen Bank International (Austria), Santander (Spain), Šiaulių Bankas (Lithuania), Société Générale (France), Tatra banka (Slovakia), UniCredit (Italy)
United Kingdom Barclays Group, HSBC Holdings, Lloyds Banking Group, Royal Bank of Scotland Group, Standard Chartered
United States Ally Financial Inc., American Express Company, Bank of America Corporation, The Bank of New York Mellon Corporation, BB&T Corporation, Capital One Financial Corporation, Citigroup Inc., Citizens Financial Group, Comerica Inc., Discover Financial Services, Fifth Third Bancorp, Goldman Sachs Group Inc., Huntington Bancshares Inc., JPMorgan Chase & Co., KeyCorp, M&T Bank Corporation, Morgan Stanley, Northern Trust Corporation, PNC Financial Services Group, Regions Financial Corporation, State Street Corporation, SunTrust Banks Inc., U.S. Bancorp, Wells Fargo & Company, Zions Bancorporation
Note: Institutions are selected with the intention to capture the major listed banks in each country.
uSing mARket-bASed indiCAtoRS to ASSeSS bAnking SyStem ReSilienCe 41 BANK OF CANADA • FINANCIAL SySTEM REVIEw • JuNE 2017
Canada’s international investment position: benefits and potential VulnerabilitiesGabriel Bruneau, Maxime Leboeuf and Guillaume Nolin
� In recent decades, international investment positions have increased faster than gross domestic product in Canada and internationally. This increase is the result of the significant growth of gross capital flows between countries.
� Greater global financial integration is beneficial and important for Canada, partly because access to global financial markets can help mitigate the impact of adverse economic shocks. Valuation effects were instrumental in softening the impact of the 2014–15 oil price shock on the Canadian economy.
� In certain circumstances, however, foreign capital inflows can also faci-litate the buildup of domestic vulnerabilities, such as high indebtedness. Shocks that heighten uncertainty or risk aversion have the potential to trigger a destabilizing reversal of these foreign inflows.
� Canada’s current international investment position is typical of advanced economies and will likely continue to act as an economic stabilizer. However, the strong growth of external portfolio debt liabilities since the 2008–09 global financial crisis warrants ongoing monitoring and analysis.
IntroductionInternational economic and financial linkages are important determinants of an economy’s level of activity and income, as well as its financial stability. These linkages are particularly important for the Canadian economy and other open economies that are dependent on international trade and access to international capital markets.
A country’s international financial linkages are reflected in its international investment position (IIP) statement. The IIP provides the value and compos-ition of the foreign assets owned by a country’s residents (external assets) as well as ownership of domestic assets by foreigners (external liabilities), which can be in the form of foreign direct investment (FDI), portfolio equity, portfolio debt securities and other types of assets, such as loans and deposits. Monitoring the IIP over time allows both gross and net financial flows to be tracked (Box 1).
CAnAdA’S inteRnAtionAl inVeStment poSition: beneFitS And potentiAl VulneRAbilitieS 43 BANK OF CANADA • FINANCIAL SySTEM REVIEw • JuNE 2017
In the face of most adverse domestic economic shocks, the IIP acts as a stabilizer as foreign financial flows and valuation effects help dampen the impact on consumption and investment. However, foreign financial inflows may also help facilitate a buildup of financial system vulnerabilities, for example, by fuelling an increase in leverage. Further, shocks that heighten uncertainty or risk aversion may lead to a reversal of these inflows, which could amplify the impact of the initial shocks. We analyze developments in Canada’s IIP since the 2008–09 global financial crisis and find that, while its stabilization role is still prominent, there are some potential emerging vulnerabilities.
International Investment Positions Have Grown SubstantiallyIIPs have grown rapidly in recent decades and are at historically high levels in many advanced economies, as measured by the ratio of external assets and liabilities to gross domestic product (GDP) (Chart 1). Increased trade openness, financial liberalization and a reduction in the cost of international investments have contributed to the growth in the IIPs of advanced econ-omies. This greater financial integration has brought important benefits to the global economy, notably a much greater ability to diversify risk.1
1 See Lane (2016) for a further discussion of trends, benefits and challenges of financial globalization.
Box 1
Key Defi nitionsThe net international investment position (𝑁𝐼𝐼𝑃)A country’s net international investment position (𝑁𝐼𝐼𝑃) is the diff erence between the value of a country’s external assets (𝐴) and external liabilities (𝐿):
𝑁𝐼𝐼𝑃 = 𝐴 − 𝐿
A country with a positive (negative) 𝑁𝐼𝐼𝑃 is a net creditor (debtor) to the rest of the world .
The current account balance (𝐶𝐴) consists of the trade balance (i .e ., net exports of goods and services), which is usually its biggest component, as well as net primary and net secondary investment income (𝑁𝐼𝐼𝑁𝐶), which includes interest payments, dividends, salaries and taxes:
𝐶𝐴 = Exports − Imports + 𝑁𝐼𝐼𝑁𝐶
The current account is fi nanced using the fi nancial account (𝐹𝐴), which is the net change in foreig n ownership of domestic assets and in domestic ownership of foreign assets .
𝐶𝐴 = −𝐹𝐴
The fi nancial account consists of foreign direct investment (𝐹𝐷𝐼), the acquisition of equity and debt, and changes in offi cial reserves . In other words, it is the measure of net
capital fl ows . The current account and the fi nancial account are the two largest components of the balance of payments .
Changes in the 𝑁𝐼𝐼𝑃 can be attributed to the country’s fi nancial account, to valuation eff ects (∆𝑉𝐴𝐿) and to some other negligible adjustments:
∆𝑁𝐼𝐼𝑃 = 𝐹𝐴 + ∆𝑉𝐴𝐿 + other
Valuation changes can be due to exchange rate movements, which aff ect the value of external assets and liabilities in domestic currency, or movements in asset prices (Box 2) .
Net and gross fl owsChanges in external assets and liabilities over time can be partly tied to gross and net fi nancial fl ows . Gross fi nancial fl ows are the purchases and sales of external assets and lia-bilities, while the net fi nancial fl ows represent the diff erence between the purchases and sales, i .e ., the fi nancial account balance . To make an analogy with trade, gross fl ows are to the net fl ows what total exports and imports are to the trade balance . For example, if Canadians purchase $1 of for-eign assets while foreigners acquire $1 of Canadian assets, external assets and liabilities increase by $1 each (gross fl ows) but the net fl ow is zero .
44 CAnAdA’S inteRnAtionAl inVeStment poSition: beneFitS And potentiAl VulneRAbilitieS BANK OF CANADA • FINANCIAL SySTEM REVIEw • JuNE 2017
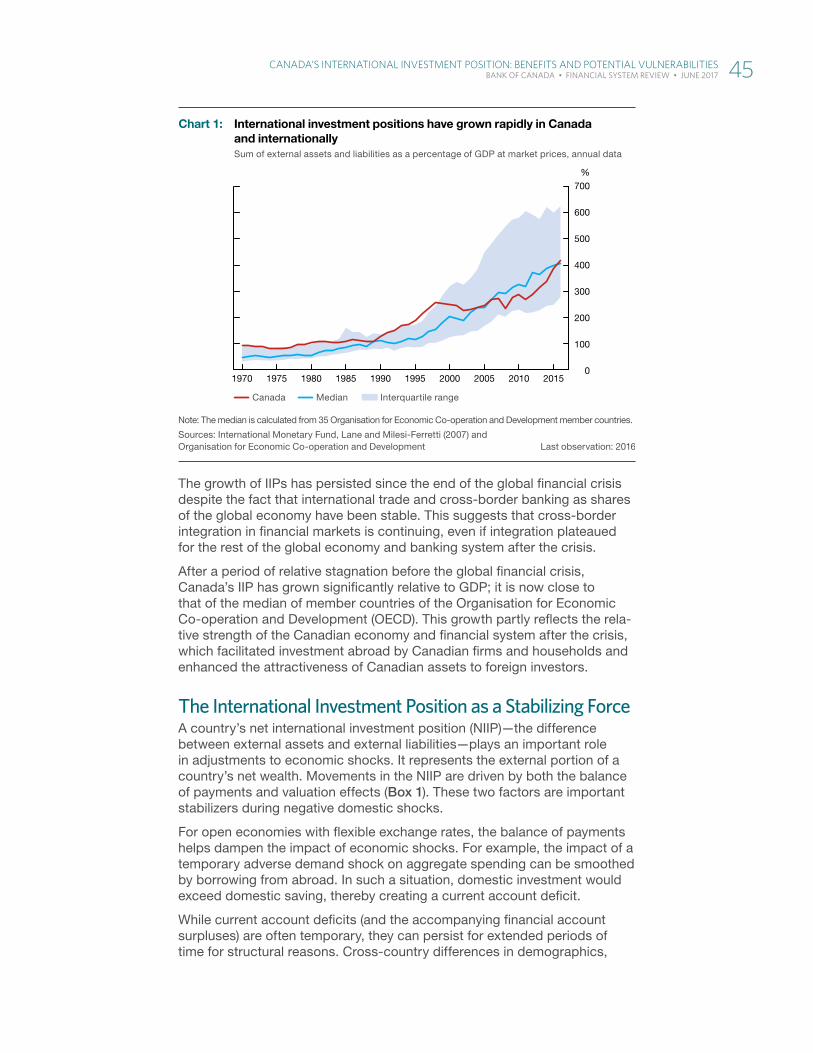
The growth of IIPs has persisted since the end of the global financial crisis despite the fact that international trade and cross-border banking as shares of the global economy have been stable. This suggests that cross-border integration in financial markets is continuing, even if integration plateaued for the rest of the global economy and banking system after the crisis.
After a period of relative stagnation before the global financial crisis, Canada’s IIP has grown significantly relative to GDP; it is now close to that of the median of member countries of the Organisation for Economic Co-operation and Development (OECD). This growth partly reflects the rela-tive strength of the Canadian economy and financial system after the crisis, which facilitated investment abroad by Canadian firms and households and enhanced the attractiveness of Canadian assets to foreign investors.
The International Investment Position as a Stabilizing ForceA country’s net international investment position (NIIP)—the difference between external assets and external liabilities—plays an important role in adjustments to economic shocks. It represents the external portion of a country’s net wealth. Movements in the NIIP are driven by both the balance of payments and valuation effects (Box 1). These two factors are important stabilizers during negative domestic shocks.
For open economies with flexible exchange rates, the balance of payments helps dampen the impact of economic shocks. For example, the impact of a temporary adverse demand shock on aggregate spending can be smoothed by borrowing from abroad. In such a situation, domestic investment would exceed domestic saving, thereby creating a current account deficit.
While current account deficits (and the accompanying financial account surpluses) are often temporary, they can persist for extended periods of time for structural reasons. Cross-country differences in demographics,
File information (for internal use only): Chart 1 - Chart 1 - international investment - EN.indd
Last output: 01/06/16 - 02:21PM
Chart 1: International investment positions have grown rapidly in Canada and internationallySum of external assets and liabilities as a percentage of GDP at market prices, annual data
Canada Median Interquartile range
Note: The median is calculated from 35 Organisation for Economic Co-operation and Development member countries.
Sources: International Monetary Fund, Lane and Milesi-Ferretti (2007) an d Organisation for Economic Co-operation and Development Last observation: 2016
0
100
200
300
400
500
600
700
%
1970 1980 1990 2000 20101975 1985 1995 2005 2015
CAnAdA’S inteRnAtionAl inVeStment poSition: beneFitS And potentiAl VulneRAbilitieS 45 BANK OF CANADA • FINANCIAL SySTEM REVIEw • JuNE 2017

productivity growth and time preference (the level of patience of investors), for example, can explain cross-country differences in current account balances.
All else being equal, persistent current account deficits tend to be more sustainable if they coincide with productive investment. In other words, current account deficits can enhance the country’s capacity to generate future income. To illustrate, consider the period from Confederation until the First World War: during that time, Canada ran large and persistent current account deficits that helped finance rapid industrialization.
When the IIP is small, the cumulative sum of current account balances tracks the NIIP very closely. However, when external assets and liabil-ities are large, as is currently the case, valuation effects can also play an important role in the evolution of the NIIP. During the global financial crisis, sharp changes to the valuation of external assets and liabilities of different countries led to large and rapid wealth effects between countries.2 For this reason, the size and composition of gross financial flows have received increasing attention in recent years.3
Like the balance of payments, valuation effects can act as a stabilizing mechanism. Valuation effects can be divided into two categories: capital gains (losses) and exchange rate movements (see Box 2 for definitions).
First, external liabilities allow the sharing of capital losses after a shock, one of the benefits of international portfolio diversification. When a significant negative demand shock hits an economy, the value of domestic assets declines and their owners endure capital losses. As a result, residents of the country suffer from a negative wealth effect. However, foreign owners of domestic assets effectively share the capital losses on domestic assets with the country’s residents. This translates into a decline in the value of external liabilities. If the value of residents’ external assets is unaffected or less affected by the shock, the NIIP improves and the initial shock on wealth is dampened.
Second, valuation effects explained by exchange rate movements will gen-erally improve the NIIP of advanced economies after a shock that leads to a depreciation of their domestic currencies. This is because most advanced economies have a large portion of their external liabilities denominated in their domestic currency, while their external assets are denominated in foreign currencies. A depreciation of the domestic currency will therefore increase the value in domestic currency of external assets by more than that of liabilities, resulting in an increase in the NIIP and dampening the impact on the domestic economy.
The Canadian experience reveals the importance of valuation effects as a driver of the NIIP. For most of its recent history, except in the years preceding the global financial crisis, Canada’s current account was in per-sistent deficit (Chart 2). However, current account surpluses explain little of the dramatic improvement of the NIIP in the late 1990s and since 2013. Both improvements coincided with large shocks to the Canadian economy and
2 Gourinchas, Rey and Truempler (2012) estimate valuation effects on bilateral external positions in equity, direct investment and portfolio debt at the height of the crisis to determine which countries benefited from and which lost on their external exposure.
3 See, for example, Forbes, Hjortsoe and Nenova (2016) and Obstfeld (2012) for more information. In particular, Obstfeld (2012) argues that large current account imbalances, while welcome and very possibly warranted by fundamentals, can also signal elevated macroeconomic and financial stresses.
46 CAnAdA’S inteRnAtionAl inVeStment poSition: beneFitS And potentiAl VulneRAbilitieS BANK OF CANADA • FINANCIAL SySTEM REVIEw • JuNE 2017

Box 2
Valuation Eff ects During the Recent Oil Price Shock Valuation eff ects acted as a stabilizer following the oil price decline in 2014–15, helping dampen the impact of the adverse wealth eff ect of the shock on the Canadian economy and fi nancial system . To illustrate, we decompose c hanges in Canada’s external assets and liabilities into net capital fl ows and valuation eff ects . In turn, the latter can be decomposed into capital gains (or losses) and exchange rate movements:1
• Net capital fl ows capture changes in the international investment position (IIP) resulting from acquisitions or sales of external assets and liabilities . It is equal to the fi nancial account balance .
• Capital gains (or losses) refl ect changes in the value of fi nancial assets excluding the impact of exchange rate movements .
• Exchange rate movements refl ect changes in the value of Canada’s IIP that are strictly due to currency fl uctuations .
1 Changes are calculated from an accounting perspective . The contribution from exchange rate movements is approximated using the currency denomination of the main categories of foreign assets and liabilities obtained from Bénétrix, Lane and Shambaugh (2015) . Capital gains are calculated as the residual component after accounting for changes due to net capital fl ows and exchange rate move-ments . Dynamic eff ects (e .g ., the dynamic infl uence of the exchange rate on capital fl ows) are not considered .
Canada’s net international investment position (NIIP) has increased by more than 10 per cent of gross domestic product (GDP) since the second quarter of 2014, refl ecting the stabilizing impact of exchange rate movements and capital gains (Chart 2-A) . Following the oil price shock, the value of Canada’s external liabilities increased less than the value of its external assets, resulting in a net increase of the NIIP .
First, net capital infl ows were a drag on the NIIP, refl ecting in part a fall in oil exports and the associated worsening of Canada’s trade balance .
However, capital gains were responsible for a signifi cant share of the improvement in the NIIP . The value of external liabilities fell because the oil price shock had a sizable negative impact on Canadian assets . At the same time, the value of external assets rose slightly, highlighting the fact that investments abroad appeared to be largely unaff ected by the shock . This dynamic highlights the benefi ts of inter-national capital fl ows and fi nancial integration .
A weaker Canadian dollar also helped support the NIIP . All else being equal, the lower Canadian dollar increased the value of Canada’s external assets by more than its external liabilities . This is because most of Canada’s external assets were denominated in foreign currencies while the majority of external liabilities were denominated in Canadian dollars .
Chart 2-A: Capital gains and exchange rate movements boosted Canada’s NIIP during the oil price shockCumulative change from 2014Q2 to present as a percentage of GDP at market prices, quarterly data
a. Assets b. Liabilities c. Net
Capital fl ows Exchange rate Capital gains and other adjustments Total
Note: FDI stands for foreign direct investment and NIIP stands for net international investment position.Sources: Benetrix, Lane and Shambaugh (2015), International Monetary Fund, Statistics Canada and Bank of Canada calculations Last observation: 2016Q2
-10
0
10
20
30
40
50%
Total changein assets
FDI Portfolioequity
Portfoliodebt
-10
0
10
20
30
40
50%
Total changein liabilities
FDI Portfolioequity
Portfoliodebt
-10
0
10
20
30%
Total change inCanada’s NIIP
CAnAdA’S inteRnAtionAl inVeStment poSition: beneFitS And potentiAl VulneRAbilitieS 47 BANK OF CANADA • FINANCIAL SySTEM REVIEw • JuNE 2017

a depreciation of the Canadian dollar. This depreciation resulted in benefi-cial valuation effects. Box 2 analyzes in more detail how valuation effects helped dampen the impact of the 2014–15 oil price shock on the Canadian economy.
This discussion of valuation effects has so far focused on the behaviour of the IIP at the aggregate level in the event of a domestic shock. It is important to remember that the IIP is an aggregate of the external balance sheets of many different sectors and individual firms.4 The impact of valuation effects on the balance sheet of individual agents or sectors can vary greatly in both direction and magnitude, which can also have implications for financial stability.5 Unfortunately, a thorough sectoral analysis of the IIP is difficult because of significant data gaps, in Canada and internationally.
Vulnerabilities Related to the International Investment PositionWhile the current account and the valuation effects often act as shock absorbers, history reveals that, in certain circumstances, they can also act as shock amplifiers. The capital flows they measure can contribute to a buildup of financial system vulnerabilities. Moreover, shocks that heighten uncertainty or risk aversion can trigger a reversal of financial flows that could amplify those shocks.
Recent research finds that focusing on aggregate flows and levels can obscure important information.6 In what follows, we examine disaggregated data on the level and composition of capital flows, which are key to under-standing the associated financial system vulnerabilities.
4 The aggregation of countries, currency areas and decision-making units (firms and households) can be misleading, as discussed by Avdjiev, McCauley and Shin (2016).
5 See Forbes, Hjortsoe and Nenova (2016) for a comprehensive analysis of the role of valuation effects during global shocks.
6 See, for example, Olaberría (2012) and Jara and Olaberría (2013).
File information (for internal use only): Chart 1 - Chart 2 - changes in investment - EN.indd
Last output: 01/06/16 - 02:21PM
Chart 2: Changes in the Canadian net international investment position are not explained by the current account balanceAs a percentage of GDP at market prices
Current account (annualized quarterly data, left scale)
Net international investment position (quarterly data, right scale)
Note: Shaded areas represent recessions in Canada.
Source: Statistics Canada Last observation: 2016Q4
-60
-40
-20
0
20
40
-15
-10
-5
0
5
10%%
1961 1971 1981 1991 2001 20111966 1976 1986 1996 2006 2016
48 CAnAdA’S inteRnAtionAl inVeStment poSition: beneFitS And potentiAl VulneRAbilitieS BANK OF CANADA • FINANCIAL SySTEM REVIEw • JuNE 2017
Buildup of vulnerabilitiesThis historical experience from advanced economies shows there have been circumstances under which current account deficits have been associated with a buildup of financial system vulnerabilities. In particular, empirical evidence shows a link between capital inflows and booms in asset prices (e.g., real estate and stock prices).7 Indeed, large capital inflows, in conjunc-tion with financial market imperfections (i.e., asymmetric information, which can yield adverse selection or extrapolative expectation), can create a self-reinforcing increase in credit and asset prices. These inflows would there-fore result in a misallocation of resources and macroeconomic imbalances.
Conceptually, one way to understand the link between asset price booms and large capital inflows is to start with the idea that an economy’s bor-rowing capacity is a function of the value of its assets.8 Large capital inflows increase the demand for domestic assets; if the supply of these assets were fixed in the short term, inflows would raise their price. This, in turn, would augment the economy’s credit limit by increasing the value of collateral. Capital inflows would also lead to local currency appreciation, which is associated with greater credit growth.9 Relaxing the credit limits that con-strain domestic borrowing can then lead to an asset price boom through a self-reinforcing process: higher asset prices promote more borrowing and additional rounds of capital inflows, pushing prices even higher.
However, the strength of this link varies across countries. It depends on the depth of domestic financial markets, the degree of financial regulation and supervision, the quality of institutions and the type of exchange rate regime.10 These are potential explanations for why emerging-market econ-omies (EMEs) are more likely than advanced economies to experience a buildup of vulnerabilities associated with large capital inflows.
In addition to the size of capital inflows, their composition is important. Capital inflows can exacerbate liquidity and maturity mismatches in the financial system. The type of financial instrument also matters: for example, portfolio debt inflows are more likely to exacerbate movements in asset prices and to encourage risky lending.11 Large foreign inflows into debt may significantly increase the chance of an asset price boom compared with a situation where the inflows are concentrated in FDI.12 FDI is defined as a large equity stake; acquiring and divesting from large stakes, rather than small amounts of securities, are typically associated with significantly higher transaction costs. This higher cost increases investors’ incentives to accurately assess the value of their asset and thus reduces the potential for misallocation of resources.13
7 See, for example, Kim and Yang (2009) for Korea and Jara and Olaberría (2013) for Denmark.
8 This is related to the notion of financial accelerator (see Bernanke, Gertler and Gilchrist 1999 and Iacoviello 2005).
9 For a further discussion of the risk-taking channel of currency appreciation, see Bruno and Shin (2015).
10 Magud and Vesperoni (2014) find that countries with flexible exchange rates are less affected by the effects of a rapid reversal of flows than those with fixed exchange rates. However, they are not fully shielded: the fall in credit growth after a reversal is more modest but more persistent.
11 See Aoki, Benigno and Kiyotaki (2009).
12 See, among others, Krugman (2000a, 2000b), Reinhart and Reinhart (2009), Reinhart and Rogoff (2009), Olaberría (2012) and Avdjiev, Binder and Sousa (2017).
13 Korinek (2010) provides support for the idea that the composition matters by showing the different magnitudes of externalities created by different types of capital inflows. In particular, he suggests that FDI does not impose an externality since it often stays in the country when a financial crisis hits.
CAnAdA’S inteRnAtionAl inVeStment poSition: beneFitS And potentiAl VulneRAbilitieS 49 BANK OF CANADA • FINANCIAL SySTEM REVIEw • JuNE 2017

Finally, all else being equal, large foreign inflows into debt drive down domestic interest rates (Warnock and Warnock 2009; Ahmed and Zlate 2014).14 As a result of portfolio rebalancing, large inflows would likely affect other domestic interest rates. This mechanism can exacerbate movements in asset prices and encourage lending. In contrast, a rapid reversal of these flows would increase the cost of borrowing through higher risk premiums.15
Composition of the international investment position and reversalsForeign investors may suffer from an informational disadvantage relative to domestic investors and can therefore be more prone to rapidly withdraw from the market when uncertainty and risk aversion increase.16 For example, a country that receives large inflows based on its perceived financial sta-bility could be vulnerable to rapid outflows if the creditworthiness of its government, financial institutions or private firms subsequently comes into question. The vulnerability of the financial system to a large increase in uncertainty or risk aversion depends on a number of factors.
First, the larger the share of total liabilities held by foreigners in an economy, the more likely a rapid reversal of foreign inflows leads to an increase in risk premiums. This tightening of financial conditions would amplify the impact of the initial shock. A rapid reversal of foreign inflows is an extreme case for advanced economies, but slower reversals or a reduction in the pace of inflows can have similar but smaller effects.
Second, the greater the proportion of liabilities that take the form of port-folio debt, the more vulnerable the financial system will be, all else being equal. Portfolio debt liabilities have contractually predetermined payments, whereas equity and FDI are residual claims on profits and thus vary more in value. As a result, if there is a negative demand shock in the domestic economy, the value of external debt liabilities falls by less than that of equity or FDI. Furthermore, since the stock of debt is largely fixed in the short term, a rapid reversal of foreign flows would result in higher domestic risk premiums and tighter credit conditions, inducing a jump in the cost of refinancing debt.
Third, the vulnerabilities created by debt can be further magnified by the presence of maturity mismatches. Rollover risk, which is the risk of a sharp increase in the cost of refinancing existing debt when it matures, arises in the presence of maturity mismatches between assets and liabilities. Although this risk also exists at the level of individual balance sheets (e.g., private firms in the corporate sector), it becomes a risk to the financial system when it arises at the aggregate level. Long-term external or domestic assets financed by short-term foreign liabilities can generate funding stress in the event of large and rapid outflows because short-term debt matures more quickly and therefore generates greater rollover risk.
For example, in the years leading up to the global financial crisis, European banks accumulated large amounts of US assets through purchases of private-label mortgage-backed securities (i.e., external assets for European countries). These purchases by European banks were financed in part by
14 In particular, Ahmed and Zlate (2014) find that net inflows became more sensitive to interest rate differentials after the global financial crisis. For Canada, Feunou et al. (2015) find that foreign flows of $150 billion in federal debt lowered the Government of Canada 10-year bond yield by 100 basis points between 2009 and 2012.
15 Bank of Canada Financial System Review, December 2016.
16 See Broner et al. (2013) for a more extensive discussion.
50 CAnAdA’S inteRnAtionAl inVeStment poSition: beneFitS And potentiAl VulneRAbilitieS BANK OF CANADA • FINANCIAL SySTEM REVIEw • JuNE 2017
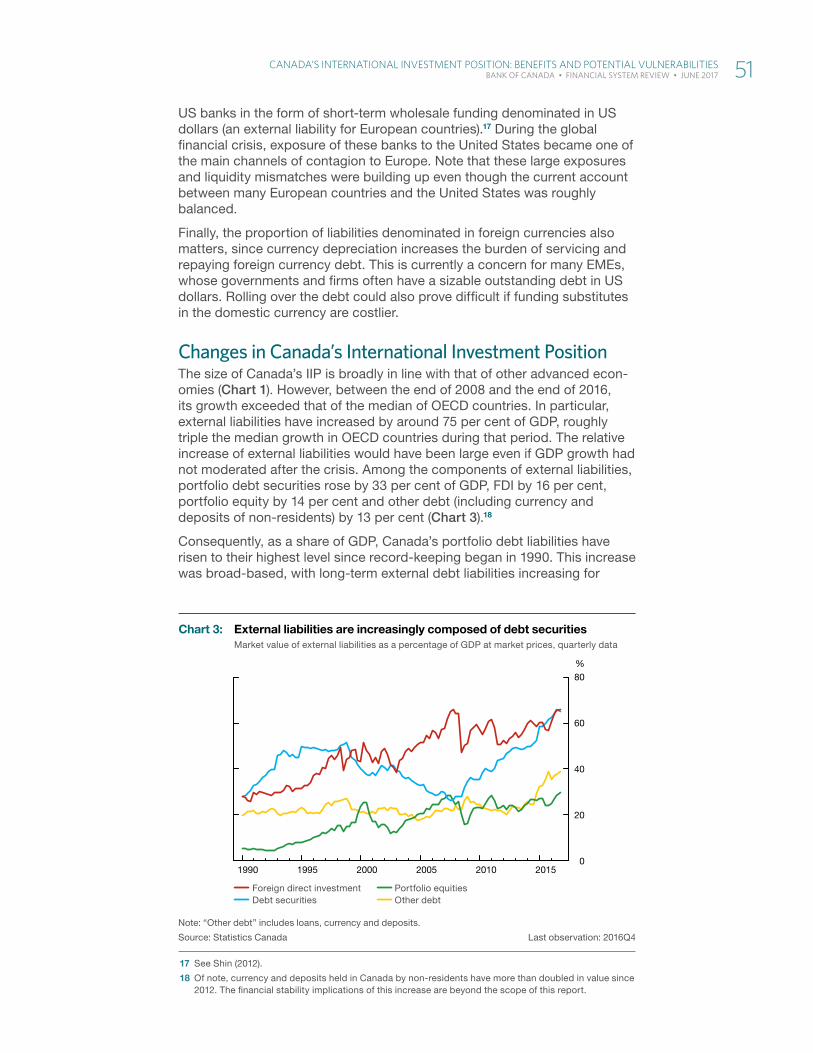
US banks in the form of short-term wholesale funding denominated in US dollars (an external liability for European countries).17 During the global financial crisis, exposure of these banks to the United States became one of the main channels of contagion to Europe. Note that these large exposures and liquidity mismatches were building up even though the current account between many European countries and the United States was roughly balanced.
Finally, the proportion of liabilities denominated in foreign currencies also matters, since currency depreciation increases the burden of servicing and repaying foreign currency debt. This is currently a concern for many EMEs, whose governments and firms often have a sizable outstanding debt in US dollars. Rolling over the debt could also prove difficult if funding substitutes in the domestic currency are costlier.
Changes in Canada’s International Investment PositionThe size of Canada’s IIP is broadly in line with that of other advanced econ-omies (Chart 1). However, between the end of 2008 and the end of 2016, its growth exceeded that of the median of OECD countries. In particular, external liabilities have increased by around 75 per cent of GDP, roughly triple the median growth in OECD countries during that period. The relative increase of external liabilities would have been large even if GDP growth had not moderated after the crisis. Among the components of external liabilities, portfolio debt securities rose by 33 per cent of GDP, FDI by 16 per cent, portfolio equity by 14 per cent and other debt (including currency and deposits of non-residents) by 13 per cent (Chart 3).18
Consequently, as a share of GDP, Canada’s portfolio debt liabilities have risen to their highest level since record-keeping began in 1990. This increase was broad-based, with long-term external debt liabilities increasing for
17 See Shin (2012).
18 Of note, currency and deposits held in Canada by non-residents have more than doubled in value since 2012. The financial stability implications of this increase are beyond the scope of this report.
File information (for internal use only): Chart 1 - Chart 3 - external liabilities - EN.indd
Last output: 01/06/16 - 02:21PM
Chart 3: External liabilities are increasingly composed of debt securitiesMarket value of external liabilities as a percentage of GDP at market prices, quarterly data
Foreign direct investment Debt securities
Portfolio equities Other debt
Note: “Other debt” includes loans, currency and deposits.
Source: Statistics Canada Last observation: 2016Q4
0
20
40
60
80%
1990 1995 2000 2005 2010 2015
CAnAdA’S inteRnAtionAl inVeStment poSition: beneFitS And potentiAl VulneRAbilitieS 51 BANK OF CANADA • FINANCIAL SySTEM REVIEw • JuNE 2017

governments, banks and non-bank corporations (Chart 4).19, 20 As a result, the share of the outstanding debt held by foreigners has risen for the federal government and corporate (financial and non-financial) sectors, surpassing previous highs observed in the 1990s (Chart 5).
19 We exclude short-term debt for two reasons: (i) short-term debt is a small component of total debt in government and non-financial corporate sectors, and (ii) short-term debt in the banking sector includes all currency and deposits held in Canada by non-residents.
20 The largest bonds issued by Canadian firms in US dollars during that period were from the financial, transportation, and mining and manufacturing industries. It is likely that the rise in external corporate debt liabilities was also concentrated in these sectors.
File information (for internal use only): Chart 1 - Chart 4 - long term gross - EN.indd
Last output: 01/06/16 - 02:21PM
Chart 4: Long-term gross external debt has increased across all sectorsMarket value, as a percentage of GDP at market prices
2008Q4 2016Q4
Note: Long-term investments are primarily composed of bonds and notes with a maturity of more than one year. Loans are a smaller portion and increased only marginally from 2009 to 2016. Non-bank corporations refer to Statistics Canada’s defi nition of “Other Sectors,” which includes all sectors except banks, monetary authorities, general government and direct investment liabilities. Banks include chartered banks and other deposit-taking institutions.
Source: Statistics Canada Last observation: 2016Q4
0
10
20
30
40%
Government Non-bank Banks
File information (for internal use only): Chart 1 - Chart 5 - foreign ownership - EN.indd
Last output: 01/06/16 - 02:21PM
Chart 5: The share of foreign ownership of federal and corporate debt has increasedShare of foreign ownership out of the total outstanding, market value, quarterly data
Federal Corporate Provincial
Note: “Corporate ” excludes government business enterprises.
Source: Statistics Canada Last observation: 2016Q4
0
10
20
30
40
50%
1990 1995 2000 2005 2010 2015
52 CAnAdA’S inteRnAtionAl inVeStment poSition: beneFitS And potentiAl VulneRAbilitieS BANK OF CANADA • FINANCIAL SySTEM REVIEw • JuNE 2017
This increase in external portfolio debt liabilities was mainly driven by three factors. First, accommodative monetary policy in a significant number of other advanced economies, including the use of unconventional monetary policies, created spillovers to Canadian assets, which generally offered higher yields. Second, Canada’s perceived financial stability increased the attractiveness of its debt after the crisis, notably for Canadian banks and Government of Canada debt. This happened in a context where the outstanding amount of sovereign and financial debt considered safe was declining globally because of credit downgrades. This attractiveness was notably apparent in the demand from official reserve managers, among others.21 Finally, the amount of debt outstanding in Canada grew robustly during that period because of high investment in the resources sector, strong residential mortgage demand and federal and provincial government fiscal deficits.
Since the crisis, large foreign inflows into debt may have contributed to drive down borrowing costs for Canadian households, financial institutions, firms and governments and may have facilitated a buildup of domestic imbalances. First, lower long-term mortgage rates encouraged household borrowing and increased housing demand. Moreover, housing demand was financed, in part, by foreign purchases of covered bonds issued by financial institutions,22 which are collateralized by uninsured mortgages, and Canada Mortgage Bonds, which are collateralized by insured mortgages.23 The increase in foreign deposits may have also facilitated the growth of mort-gage financing. Second, Canada’s external corporate debt liabilities have nearly doubled as a percentage of GDP since the crisis.24 As a result, lower corporate bond yields have helped stimulate demand for credit (Chart 6).
In the event of a shock large enough to undermine Canada’s perceived financial stability, foreign investors might significantly reduce their holdings of Canadian debt. This would translate into higher risk premiums, which would amplify the effect of the initial shock. The effect of these outflows on domestic interest rates might be substantial if they are large enough to reverse the effect of inflows observed since the crisis. These outflows could also affect market liquidity, especially if there are rapid sales of fixed-income securities.
In addition, changes in Canada’s IIP since the global financial crisis may have lessened its potential for stabilization. First, the larger relative size of external portfolio debt, as a share of both total domestic credit and total external liabilities, increases the potential impact of a reversal of these inflows. Even if the maturity of external debt has been extended in recent years, the amount of debt maturing every year is larger, thus increasing rollover risk. Further, given the increased share of portfolio debt, the value of total external debt liabilities is likely to decrease less during a shock to aggregate demand than before the crisis.
21 Pomorski, Rivadeneyra and Wolfe (2014).
22 Most covered bonds issued by Canadian banks are denominated in currencies other than the Canadian dollar. As at 28 February 2017, there were Can$140 billion worth of covered bonds outstanding, 50 per cent of which was denominated in euros and 32 per cent in US dollars. The National Housing Act became the legal framework for covered bond programs in Canada in 2012; it contains various pro-visions to limit their size and the risk. Notably, the Office of the Superintendent of Financial Institutions covered bond limit states that covered bonds must not, at the time of issuance, make up more than 4 per cent of total assets of the deposit-taking institution. See DBRS (2017).
23 In 2016, 35 per cent of Canada Mortgage Bonds were sold to foreign investors. See Canada Mortgage and Housing Corporation “Canada Mortgage Bond Fact Sheet,” 15 March 2017.
24 Note that external corporate debt liabilities include financial debt, which in turn includes bank whole-sale financing. This could have contributed indirectly to the growth in household credit. Bank of Canada analysis suggests that non-financial corporate leverage remains below its long-run average.
CAnAdA’S inteRnAtionAl inVeStment poSition: beneFitS And potentiAl VulneRAbilitieS 53 BANK OF CANADA • FINANCIAL SySTEM REVIEw • JuNE 2017

Second, the increase in the share of corporate debt in external liabilities makes the currency composition of Canada’s IIP slightly less favourable. Around 90 per cent of all foreign-owned Canadian corporate debt is denominated in foreign currencies, most of which is in US dollars (Chart 7).25 The majority of external provincial government debt is also denominated in foreign currencies, but most federal government debt is denominated in Canadian dollars. As a result of the increased share of US-dollar corporate debt in external liabilities, a depreciation of the Canadian dollar would make this increase in the debt burden larger than before the global financial crisis.
25 The global attractiveness of the US-dollar corporate debt market is partly due to its scale, breadth of products offered and depth of the pool of potential investors.
File information (for internal use only): Chart 1 - Chart 6 - foreign investors - EN.indd
Last output: 01/06/16 - 02:21PM
Chart 6: The amount of corporate debt securities outstanding has increased, a large portion of which was purchased by foreign investorsMarket value of corporate debt liabilities as a percentage of GDP, quarterly data
Held by foreign investors Held by domestic investors
Note: Corporate debt securities exclude those of government business enterprises.
Source: Statistics Canada Last observation: 2016Q4
0
20
40
60
80
100%
1990 1995 2000 2005 2010 2015
File information (for internal use only): Chart 1 - Chart 7 - currency composition - EN.indd
Last output: 01/06/16 - 02:21PM
Chart 7: The currency composition of foreign holdings of Canadian bonds varies across sectorsMarket value by issuer sector, as of February 2017
Canadian dollars US dollars Other
Note: “Agency” consists of bonds issued by federal and provincial government enterprises.
Sources: Statistics Canada and Bank of Canada calculations Last observation: February 2017
0
200
400
600
800
Federal Agency Provincial Corporate
Can$ billions
54 CAnAdA’S inteRnAtionAl inVeStment poSition: beneFitS And potentiAl VulneRAbilitieS BANK OF CANADA • FINANCIAL SySTEM REVIEw • JuNE 2017

However, this risk is mitigated when the increase in debt denominated in foreign currencies reflects increased foreign activity by Canadian firms, which would generate foreign currency revenues to service that debt, rather than Canadian activities being funded abroad.26 The value of assets of the foreign affiliates of Canadian firms has indeed grown significantly in recent years, although it is difficult to assess whether firms expanding their foreign presence are the same as those borrowing in foreign currencies.
ConclusionInternational capital flows are generally stabilizing since they allow for dif-ferences between savings and investment within countries and thus help smooth the impact of economic shocks. Several features of Canada’s IIP would play a stabilizing role. For example, roughly half of Canada’s external liabilities are in equities and FDI, suggesting that foreign investors will absorb some of the shocks to the Canadian economy. Further, the majority of Canada’s external liabilities are denominated in Canadian dollars, whereas its assets are mostly in foreign currencies. In addition to its benefits for the trade balance, this composition means that a depreciation of the Canadian dollar improves the NIIP.
The large foreign inflows into Canadian portfolio debt in recent years are, however, a potential cause for concern. These inflows may have facilitated the buildup of financial system vulnerabilities and may amplify economic shocks in a period of heightened uncertainty or risk aversion. While the levels of Canadian external debt are not particularly concerning, the pace at which it has been increasing recently warrants monitoring by policy-makers. This monitoring is necessary even if the NIIP is positive and the current account reverts to a surplus.
Our report analyzes financial flows at the aggregate country level. This is an important simplification. The saving and investment decisions that matter for financial stability are ultimately made by households, firms and different levels of government, not countries themselves. The attention to gross rather than net flows, the analysis of the currency composition of the IIP and the various sectoral decompositions contained in this report were meant to address the main pitfalls of this type of analysis. Fully analyzing the financial stability impli-cations of growth of Canada’s IIP will require a more granular investigation of external assets and liabilities.
26 Firms funding their domestic activities with foreign currencies could hedge using cross-currency swaps. However, a rapid reversal of capital flows could lead to a deterioration of the cost or availability of this hedging mechanism.
ReferencesAhmed, S. and A. Zlate. 2014. “Capital Flows to Emerging Market
Economies: A Brave New World?” Journal of International Money and Finance 48 (Part B): 221–248.
Aoki, K., G. Benigno and N. Kiyotaki. 2009. “Capital Flows and Asset Prices.” NBER International Seminar on Macroeconomics 2007: 175–216.
Avdjiev, S., S. Binder and R. Sousa. 2017. “External Debt Composition and Domestic Credit Cycles.” Bank for International Settlements Working Paper No 627.
CAnAdA’S inteRnAtionAl inVeStment poSition: beneFitS And potentiAl VulneRAbilitieS 55 BANK OF CANADA • FINANCIAL SySTEM REVIEw • JuNE 2017

Avdjiev, S., R. N. McCauley and H. S. Shin. 2016. “Breaking Free of the Triple Coincidence in International Finance.” Economic Policy 31 (87): 409–451.
Bénétrix, A. S., P. R. Lane and J. C. Shambaugh. 2015. “International Currency Exposures, Valuation Effects and the Global Financial Crisis.” Journal of International Economics 96 (Supplement 1): 98–109.
Bernanke, B. S., M. Gertler and S. Gilchrist. 1999. “The Financial Accelerator in a Quantitative Business Cycle Framework.” In Handbook of Macroeconomics, Edition 1, Volume 1, Chapter 21, edited by J. B. Taylor and M. Woodford, 1341–1393. North Holland.
Broner, F., T. Didier, A. Erce and S. L. Schmukler. 2013. “Gross Capital Flows: Dynamics and Crises.” Journal of Monetary Economics 60 (1): 113–133.
Bruno, V. and H. S. Shin. 2015. “Cross-Border Banking and Global Liquidity.” The Review of Economic Studies 82 (2): 535–564.
DBRS. 2017. Monthly Canadian Covered Bond Report (February).
Feunou, B., J.-S. Fontaine, J. Kyeong and J. Sierra. 2015. “Foreign Flows and Their Effect on Government of Canada Yields.” Bank of Canada Staff Analytical Note No. 2015-1.
Forbes, K., I. Hjortsoe and T. Nenova. 2016. “Current Account Deficits During Heightened Risk: Menacing or Mitigating?” Bank of England External MPC Unit Discussion Paper No. 46.
Gourinchas, P. O., H. Rey and K. Truempler. 2012. “The Financial Crisis and the Geography of Wealth Transfers.” Journal of International Economics 88 (2): 266–283.
Iacoviello, M. 2005. “House Prices, Borrowing Constraints, and Monetary Policy in the Business Cycle.” American Economic Review 95 (3): 739–764.
Jara, A. and E. Olaberría. 2013. “Are All Capital Inflows Associated with Booms in House Prices? An Empirical Evaluation.” Central Bank of Chile Working Paper No. 696.
Kim, S. and D. Y. Yang. 2009. “Do Capital Inflows Matter to Asset Prices? The Case of Korea.” Asian Economic Journal 23 (3): 323–348.
Korinek, A. 2010. “Regulating Capital Flows to Emerging Markets: An Externality View.” University of Maryland working paper.
Krugman, P. 2000a. “Fire-Sale FDI.” In Capital Flows and the Emerging Economies: Theory, Evidence and Controversies, edited by S. Edwards, 43–58. Chicago: University of Chicago Press.
—. 2000b. “Crises: The Price of Globalization?” In Global Economic Integration: Opportunities and Challenges, 75–106. Proceedings of the Economic Policy Symposium, 24–26 August. Jackson Hole, Wyoming: Federal Reserve Bank of Kansas City.
Lane, P. R. and G. M. Milesi-Ferretti. 2007. “The External Wealth of Nations Mark II: Revised and Extended Estimates of Foreign Assets and Liabilities, 1970–2004.” Journal of International Economics 73 (2): 223–250.
56 CAnAdA’S inteRnAtionAl inVeStment poSition: beneFitS And potentiAl VulneRAbilitieS BANK OF CANADA • FINANCIAL SySTEM REVIEw • JuNE 2017

Lane, T. 2016. “Follow the Money: A Canadian Perspective on Financial Globalization.” Remarks at the Centre for International Governance Innovation, 16 November 2016.
Magud, N. and E. R. Vesperoni. 2014. “Exchange Rate Flexibility and Credit During Capital Inflow Reversals: Purgatory…Not Paradise.” IMF Working Paper No. 14/61.
Obstfeld, M. 2012. “Does the Current Account Still Matter?” American Economic Review 102 (3): 1–23.
Olaberría, E. 2012. “Capital Inflows and Booms in Assets Prices: Evidence from a Panel of Countries.” Central Bank of Chile Working Paper No. 675.
Pomorski, L., F. Rivadeneyra and E. Wolfe. 2014. “The Canadian Dollar as a Reserve Currency.” Bank of Canada Review (Spring): 1–11.
Reinhart, C. M. and V. Reinhart. 2009. “Capital Flow Bonanzas: An Encompassing View of the Past and Present.” In NBER International Seminar on Macroeconomics 2008, 9–62. Chicago: University of Chicago Press.
Reinhart, C. M. and K. S. Rogoff. 2009. “The Aftermath of Financial Crises.” American Economic Review 99 (2): 466–472.
Shin, H. S. 2012. “Global Banking Glut and Loan Risk Premium.” IMF Economic Review 60 (2): 155–192.
Warnock, F. E. and V. C. Warnock. 2009. “International Capital Flows and U.S. Interest Rates.” Journal of International Money and Finance 28 (6): 903–919.
CAnAdA’S inteRnAtionAl inVeStment poSition: beneFitS And potentiAl VulneRAbilitieS 57 BANK OF CANADA • FINANCIAL SySTEM REVIEw • JuNE 2017
project Jasper: Are distributed Wholesale payment Systems Feasible yet?James Chapman, Rodney Garratt,1 Scott Hendry, Andrew McCormack2 and Wade McMahon
� Distributed ledger technology (DLT)—most commonly known as the foun-dation of Bitcoin—offers a fundamentally different way to conduct and track financial transactions. Researchers are investigating its usefulness in all corners of the financial system.
� Project Jasper is a proof of concept of a DLT-based wholesale pay-ment system. The experiment provided significant insights into the relative strengths and weaknesses of using DLT for financial market infrastructures.
� For critical financial market infrastructures, such as wholesale payment systems, current versions of DLT may not provide an overall net benefit relative to current centralized systems. Recent versions of DLT have, however, made advances compared with initial cryptocurrency applica-tions of DLT.
� Benefits for the financial system of a DLT-based wholesale payment system could likely arise from its interaction with a larger DLT ecosystem of finan-cial market infrastructures, potentially including cross-border transactions.
IntroductionFinancial technology (fintech) is defined as financial innovation enabled by technology that could result in new business models, applications, pro-cesses or products and that has an associated material effect on financial markets and institutions or the provision of financial services.3
One such innovation with significant potential is distributed ledger tech-nology (DLT), or blockchain, as a common variant of it is known (Box 1). DLT, introduced with the cryptocurrency Bitcoin in 2008 (Nakamoto 2008), enables the secure validation and recording of transactions. A distributed ledger is a database shared between multiple parties. It allows those parties
1 University of California Santa Barbara and R3.
2 Payments Canada.
3 See Schindler (forthcoming) for a discussion of the drivers of fintech.
pRoJeCt JASpeR: ARe diStRibuted WholeSAle pAyment SyStemS FeASible yet? 59 BANK OF CANADA • FINANCIAL SySTEM REVIEw • JuNE 2017

to execute mutually agreed-upon transactions and achieve consensus on changes to the database. In this way, it ensures consistency between parties. The key feature of a distributed ledger is that authorized parties, through the use of a consensus mechanism, share identical versions of the data without the need for a central database or central administrator.4
A more general-purpose DLT platform called Ethereum was launched in 2013. It allows any type of digital asset to be defined, created and traded. It also enables smart contracts, which allow a DLT to execute the terms of a contract automatically, providing more functionality than simply transfer-ring one specific type of asset (Buterin 2013). These developments sparked tremendous interest from the financial sector. The shared nature of the underlying ledger can offer a number of potential benefits, including process and cost efficiencies, resilience and interoperability. However, there are also a number of challenges in adapting DLT to financial sector applications, including the speed of transacting, achieving finality of the transactions, and privacy. Recent fintech companies have developed more general DLT sys-tems, such as Corda5 by R3, to meet the needs of the financial sector.
4 For an overview of DLT and the policy issues surrounding it, refer to CPMI (2017). For a technical but accessible introduction to some of the concepts in this article, refer to Narayanan et al. (2016).
5 Corda is an open-source distributed ledger platform designed to record, manage and automate legal agreements between businesses.
Box 1
What Is a Distributed Ledger System?
Distributed ledger technology became popular following the introduction of the cryptocurrency Bitcoin in 2009 . A bitcoin (lower case b) is a digital token that represents a digital money . Bitcoin (upper case B) is a system to transfer bitcoins between people . This is done via a ledger of trans-actions that is visible to all and maintained by a distributed system of “miners” who operate computers that are nodes on the system . These nodes update the ledger with new transactions as they are made . The ledger is designed as a series of blocks of transactions linked together using cryp-tography . This ledger is known as a blockchain .
This system was a breakthrough because it demonstrated a way to maintain a ledger of information between parties in such a way that (i) no one oversees the system and (ii) the ledger can be credibly updated and agreed upon by mem-bers of the Bitcoin system even though no one trusts any other member to act honestly .
This “trustless” updating of a distributed ledger is achieved by having miners compete to win the right to validate blocks of transactions by solving a diffi cult mathematical puzzle . The fi rst miner who completes a new puzzle broadcasts the block and solution to all the other miners and in return “mines” new bitcoins created with that block . Although the problem miners work on is diffi cult to solve, it is easy to verify . Once the other nodes have seen and verifi ed a new solution, the new block is added to the chain, the trans-actions in the block are considered settled and miners begin
mining a new set of transactions . The way nodes come to agreement about the new block is called a consensus mech-anism, and the puzzle is the proof of work (Pow) .
while the Bitcoin system has proven to be quite resilient, a number of aspects undermine its suitability for fi nancial market infrastructures: (i) all transactions are visible to everyone, which may, for example, violate banking laws and put certain parties involved in transactions at a disadvan-tage; (ii) Pow is very costly in terms of time and energy and its benefi ts are not typically needed in trusted environ-ments; and (iii) the system is open to anyone who would like to join and participants are anonymous .
To address these issues, fi nancial technology companies have been developing alternatives to the Bitcoin system . These new distributed ledger systems allow access only to a restricted set of trusted counterparties . In some systems the consensus mechanism is replaced by other methods to reach agreement . In the Corda platform used in Phase 2 of Project Jasper, this is done via a notary node that is tr usted by everyone and replaces the Pow function . Finally, these systems dispense with the concept of a blockchain and replace it with a ledger that is still distributed among the nodes, but where each node has access only to neces-sary data . This aff ords less transparency across the system and allows more privacy for participants .
60 pRoJeCt JASpeR: ARe diStRibuted WholeSAle pAyment SyStemS FeASible yet? BANK OF CANADA • FINANCIAL SySTEM REVIEw • JuNE 2017

Financial sector participants are interested in this distributed ledger tech-nology for several reasons. It has the potential to reduce back-office costs by automating various settlement processes. It can increase the reliability and traceability of information stored in the ledger, since the consensus mechanism puts limits on who can change records and how they can change them. Finally, with decentralized processes, settlement of trans-actions could be faster—reduced to hours or minutes instead of days.
One area of interest has been the potential implications of DLT for financial market infrastructures (FMIs). FMIs act as the trusted third party between financial institutions, tracking and recording transactions in centralized ledgers. Operators of FMIs, participants and central banks are all interested in the efficiencies and opportunities that a DLT-based system could pro-vide relative to current centralized systems. As a result, many recent DLT advancements have focused on ways for traditional operators of centralized systems to realize the benefits of DLT while mitigating its disadvantages. For example, a common trend has been toward creating DLT systems that restrict access to a group of trusted entities. This contrasts with open arrangements like Bitcoin, where any entity can participate. To date, central banks have implemented DLT only in proofs of concept, and further exam-ination of potential DLT applications can be expected.
One of the areas being investigated is the possible application of DLT to wholesale payment systems. Canada’s existing wholesale payment system is the Large Value Transfer System (LVTS), operated by Payments Canada. The LVTS processes an average of $175 billion in payments each business day. It has been designated a systemically important FMI and is overseen by the Bank of Canada in accordance with the Principles for Financial Market Infrastructure (PFMIs).6
Wholesale payment systems make sense as an early potential application of DLT because they are relatively simple. They are also critical for financial stability. It is therefore important that overseers, like the Bank of Canada, understand how the use of DLT could change the way centralized systems are structured and operate, whether a DLT system could meet existing international standards, and any potential implications for payment system policy.
In 2016, Payments Canada, along with the Bank of Canada, R3 and Canadian commercial banks that are members of the R3 consortium, initi-ated an experimental project, code-named Project Jasper, to explore a DLT-based wholesale payment system.7 The immediate goal of Project Jasper was to build a proof-of-concept system (with no intention of advancing to a production-level system) that leveraged a settlement asset issued and controlled by a central bank. In the first phase (Phase 1), participants built a settlement capability on an Ethereum platform and demonstrated its ability to exchange a settlement asset between participants. The second phase (Phase 2), built on a Corda platform, incorporated a liquidity-saving mech-anism (LSM) that allows participants to coordinate their payments to reduce liquidity needs. As part of Phase 2, the participants are preparing a longer white paper, to be published by the end of June 2017, outlining the detailed technical and policy implications of the work.
6 The PFMIs are a set of international standards for systemically important payment systems established by the Bank for International Settlements (CPSS-IOSCO 2012).
7 R3 is an international consortium of large banks with the goal of investigating and developing applica-tions of DLT for the financial sector. Participating Canadian members are BMO Bank of Montreal, Canadian Imperial Bank of Commerce, HSBC, National Bank of Canada, Royal Bank of Canada, Scotiabank and TD Canada Trust. These seven institutions are also members of Payments Canada, and they are all participants in the LVTS.
pRoJeCt JASpeR: ARe diStRibuted WholeSAle pAyment SyStemS FeASible yet? 61 BANK OF CANADA • FINANCIAL SySTEM REVIEw • JuNE 2017

One of the main lessons from this experiment is that the versions of distrib-uted ledger currently available may not provide an overall net benefit when compared with existing centralized systems for interbank payments. Core wholesale payment systems function quite efficiently. There may, however, be net benefits for the broader group of payment system participants and the entire financial system from a DLT-based wholesale payment system in terms of savings from reduced back-office reconciliation and improved interaction with a larger DLT ecosystem of financial market infrastructures. Below is a high-level overview of the project and the preliminary findings.
Key Features of Project JasperProject Jasper provided vital insights into how a central bank and partici-pating financial institutions can complete interbank payments on a distrib-uted ledger.8 The project also offered an understanding of the functioning of a wholesale payment system using different DLT platforms and how modern payment system features, such as queues, could be incorporated to increase efficiency by reducing collateral needs. Finally, developing a working prototype improved awareness of potential risks associated with DLT-based systems and how they can be mitigated.
The first key challenge in developing Project Jasper was establishing how to transfer value. The PFMIs require that an FMI settle in central bank money whenever practical and available. This usually means settling using accounts at the central bank. To do this, the concept of a digital depository receipt (DDR) was used to represent Bank of Canada deposits. A DDR is a digital representation of currency that is issued by the Bank of Canada; it could be one approach for a wider use of central bank money in the future (Garratt 2017). DDRs are issued in the system by the Bank of Canada and are backed one for one by cash pledged to the Bank by participants. The exchange of DDRs for central bank money means there is no increase in money circulating in the banking system.
The DDRs are used by participants in the system to exchange and settle interbank payments. The processing cycle of Project Jasper achieved ultimate settlement finality on the books of the Bank of Canada after exchanging DDRs with the Bank of Canada for Canadian dollars transferred into their respective settlement accounts. For all intents and purposes, these DDRs functioned as cash in the system.
The second key challenge was how to most efficiently settle payments with the minimum amount of DDRs or liquidity. Historically, interbank payments were settled using systems that conduct end-of-day netting between par-ticipants. But as volumes and values increased in these systems, central banks became concerned about the risks inherent in netting. In response, most central banks have opted for the implementation of real-time gross settlement (RTGS) systems (see Bech and Hobijn 2007). With RTGS, pay-ments are processed individually, immediately and with finality throughout the day. Phase 1 of Project Jasper was implemented as a pure RTGS system with every individual payment on the ledger being prefunded by DDRs in the participant’s wallet.
RTGS systems eliminate settlement risk at the cost of an increased need for liquidity. Liquidity demands on RTGS systems can be enormous, given the large values that are settled in these systems—typically up to one-fifth of a
8 Further information about work on e-money at the Bank of Canada can be found on the Bank’s e-money page.
62 pRoJeCt JASpeR: ARe diStRibuted WholeSAle pAyment SyStemS FeASible yet? BANK OF CANADA • FINANCIAL SySTEM REVIEw • JuNE 2017
country’s gross domestic product on a daily basis. To make RTGS systems less liquidity-demanding, operators around the world have implemented LSMs.9 The most effective LSMs are those that support settlement by peri-odically matching offsetting payments that have been submitted to a central payments queue and settling only the net obligations.10 However, offsetting algorithms cause delay in settlement, which is unacceptable for some types of payment. Banks therefore need a way to make these time-critical pay-ments. Phase 2 of Project Jasper explored the possibility of giving banks the choice of entering payments for immediate settlement or into a queue for netting and deferred settlement. Project Jasper appears to be the first public instance of implementing an LSM algorithm on a distributed ledger platform.
Technical Aspects of Project JasperThe rise of Bitcoin spurred the interest of FMI developers in DLT. Bitcoin uses a proof-of-work (PoW) protocol that provides decentralized valida-tion of transactions. PoW protocols are designed to deter a participant from taking over an open DLT system and double-spending or rewriting the ledger. This is done by requiring costly work from each node verifying transactions. This protocol can be very computationally expensive, however, and requires some level of transparency of all transactions. On the Bitcoin blockchain, for example, all the identities of participants are masked, but all transactions are visible to everybody. This expense and transparency stem from the anonymous and open nature of DLTs such as Bitcoin.
In Phase 1 of Project Jasper, the system was built on the Ethereum platform, which uses a PoW consensus protocol. The public version of Ethereum is an unrestricted system that shares a full copy of the ledger with all participants; Jasper used a version that shared the ledger among R3 members only. In a closed, private network, like a wholesale payment system, PoW protocols are neither necessary nor desired. Restricting access to trusted counter-parties enables developers of DLT protocols to use alternative efficient protocols to perform the validation and recording functions.
The Corda platform on which Phase 2 of Project Jasper is built uses a notary function instead of PoW. A key feature of Corda is that updates to the ledger are achieved through two functions: a validation function and a uniqueness function.11 The validation function, performed by the parties involved in the transaction, ensures that all details of the transaction are correct and that the sender has the required funds. The uniqueness function is performed by a notary. For the Project Jasper system, this is the Bank of Canada. In this role as notary the Bank has access to the entire ledger so that it can verify that the funds involved in a transaction are available.
Liquidity-saving mechanisms in Project JasperThe Jasper LSM is a payment queue with periodic multilateral payment netting. Conceptually, the way it works is quite simple. If a bank has a non-urgent payment, the payment can be put in a holding queue. After the bank
9 In the early 1990s approximately 3 per cent of the largest payment systems in the world used liquidity-saving features; by 2005 this proportion had risen to 32 per cent (Bech, Preisig and Soramäki 2008). This trend has continued, and nearly all major payment systems now use some form of LSM.
10 The liquidity savings from offsetting algorithms arise from the fact that liquidity is needed only for the net difference between payments to allow settlement. Suppose Bank A needs to make a payment to Bank B for a value of $100, and Bank B needs to make a payment to Bank A for a value of $90. The amount of liquidity required to settle these two payments, if they were entered into a queue operating an offsetting algorithm, would be $10. In contrast, without an LSM, the liquidity requirement to settle these two payments would be at least $100.
11 See the non-technical Corda white paper.
pRoJeCt JASpeR: ARe diStRibuted WholeSAle pAyment SyStemS FeASible yet? 63 BANK OF CANADA • FINANCIAL SySTEM REVIEw • JuNE 2017

submits a notification of the payment to the queue, the submitted payment waits with other queued payments until the beginning of a matching cycle. The queue is then locked temporarily while an algorithm combines all the submitted payments, determines each bank’s net obligations and assesses each bank’s liquidity position.12
A payment queue is inherently centralized. A key challenge was imple-menting it in a DLT system, rather than using traditional account-based centralized ledger systems. These technical issues introduced significant complexity and served to highlight the challenges inherent in building decentralized systems that rely on some level of centralized control or cen-tralized information.
The innovative solution developed in Project Jasper was the incorporation of an “inhale/exhale” routine onto the Corda platform. Before the matching cycle begins, banks may submit payments to the queue. However, these payments do not immediately go through the two-stage validation and uniqueness process necessary to add a transaction to the ledger in the Corda system. Instead, the payment instructions sit in the queue until the matching cycle begins. At that point, a sequence of events occurs. First, during the “inhale” phase, a notification is sent to all banks participating in the matching cycle requesting that they send DDR to the Bank of Canada. Each of these individual payments is then validated and added to the ledger. Then, in the “exhale” phase, the matching algorithm determines a subset of payments to clear, on a net basis, given available funds. The Bank of Canada sends DDR payments back to all participating banks equal to the amounts they contributed, plus or minus any money they are owed or owe following the completion of the matching algorithm.
To illustrate, suppose that only two banks, A and B, place payments to each other in the queue with values equal to $100 and $90, respectively. In addition, each bank sent $15 to the queue as part of the inhale phase. After netting the two payments, the algorithm would charge $10 to Bank A and credit $10 to Bank B. Given their initial contributions from the inhale phase, this would mean the exhale phase payments are $5 to Bank A and $25 to Bank B.
These transactions are then validated and added to the ledger. Payments not matched by the algorithm remain in the queue. At this point a new matching cycle begins. Banks are free to enter or remove payments from the queue until the end of the next matching cycle, and the process continues to repeat.
Efficiency and Financial Stability Risks of Project JasperThe efficiency and financial stability risks of Project Jasper were evaluated through the lens of the PFMIs that apply to the operation of a wholesale payment system. Of these, only those relevant to a proof-of-concept system were considered. Principles that would apply only to a production-level FMI—such as those relating primarily to governance and legal aspects—were excluded.13 Thus, the examined principles can be grouped in terms of the risks they address: credit and liquidity risk, settlement risk and oper-ational risk.
12 The design is similar to the LSM added to the United Kingdom’s wholesale payment system, the Clearing House Automated Payment System (CHAPS), in April 2013. In CHAPS, the time between each matching cycle is two minutes and payments are frozen for 20 seconds during each matching cycle while the matching algorithm runs. The United Kingdom reports liquidity savings of around 20 per cent (Davey and Gray 2014).
13 Other legal questions outside of the PFMIs, such as anti-money laundering requirements, were also excluded.
64 pRoJeCt JASpeR: ARe diStRibuted WholeSAle pAyment SyStemS FeASible yet? BANK OF CANADA • FINANCIAL SySTEM REVIEw • JuNE 2017
Credit and liquidity riskThe Jasper platforms were designed without credit risk because all pay-ments represent a claim on deposits at the central bank—a riskless asset. Participants transfer cash to the Bank of Canada, through the LVTS, which then creates DDRs that can be exchanged on the distributed ledger plat-form. Overall, nothing in the proof-of-concept design was identified to be fundamentally incompatible with the credit-risk principle.
As outlined above, Project Jasper incorporated an LSM that imitated the functionality of existing RTGS systems to mitigate liquidity risk, the risk that a participant would have insufficient DDRs to make a payment. The performance of Jasper’s LSM is currently being tested using simulated data. While it is too early to predict the results of these simulations, we can report that to date we see no evidence that implementing the LSM on a distributed ledger would change its use or performance relative to a centralized system. The LSM would likely generate liquidity savings similar to existing LSMs.
Settlement riskSettlement is defined as the irrevocable and unconditional transfer of an asset. Defining the conditions under which settlement is final is foundational to financial stability.
Two aspects related to settlement finality are relevant to the application of DLTs like Project Jasper: operational settlement—or the certainty of the process by which a decentralized ledger is updated—and legal settlement, which is how settlement finality is defined in relevant system rules and asso-ciated laws.
To ensure legal settlement finality, Project Jasper was structured so that a transfer of DDR was equivalent to a full and irrevocable transfer of the underlying claim on central bank deposits. This design feature relates to the issuance of DDR and is therefore independent of the platforms upon which Jasper was built.
In contrast, to ensure operational settlement finality, issues related to the underlying technology of the DLT platforms used would need to be resolved. In the case of Ethereum, a PoW consensus mechanism is used to validate payments. But PoW settlement is probabilistic. The payment is therefore never fully settled because there is always a small probability that the payment could be reversed. Settlement becomes increasingly certain as the recorded transaction becomes more immutable over time, but it never reaches the point of being irrevocable. In the Corda platform, the role of a trusted notary would, in theory, eliminate this uncertainty because trans-actions could not be revoked once completed. However, this system has not been stress tested, and thus some risk may still be associated with settle-ment finality.
Overall, the move from Ethereum to Corda reduces settlement risk and improves the likelihood that a production system would comply with the settlement-risk principle. However, a final assessment requires further testing.
Operational riskResilience, security and scalability are the core operational risk considera-tions in wholesale payment systems. Given that Project Jasper is not a production-level platform, a detailed assessment of all of these operational risks was not possible. That said, the focus of Jasper was on resilience and scalability.
pRoJeCt JASpeR: ARe diStRibuted WholeSAle pAyment SyStemS FeASible yet? 65 BANK OF CANADA • FINANCIAL SySTEM REVIEw • JuNE 2017

In terms of resilience, a key question was whether a DLT-based wholesale payment platform could provide more cost-effective resilience by having no single point of failure. Phase 1 of Project Jasper demonstrated a lower cost for high availability14 because the nodes operated by all of the participants essentially served to back each other up insofar as their shared data were concerned. This guaranteed high availability without extra risk-proofing of each node. However, once additional functionality, such as an LSM, is added to the system, the susceptibility to a single point of failure can return. Resilience must therefore be carefully considered in the implementation design, for three reasons.
First, additional technology components—such as key, identity and system access management—are currently based on centralized models and the assumption of single trusted operators (there are early-stage attempts to devise distributed versions of these). Thus, these important components suffer from the same typical challenges associated with a single point of failure that existing centralized systems face. For example, the digital keys are bound to individual participants and are used to prove these partici-pants’ right to perform transactions on specific assets; any operator of a blockchain node needs to have system components to store its digital keys securely and not share them with others in the network. Thus, system components that store digital keys should be made highly available to avoid single point-of-failure risk and backed up for disaster recovery since this information cannot be recovered from another participant’s node.
Second, the single-point-of-failure comparison of DLT systems with existing systems can be taken a step further with a notary system, such as Corda. Unlike PoW, participants’ individual nodes must be operational to send or receive payments, reducing the resilience of the system. The Corda DLT platform examined in Project Jasper partitions data so that each partici-pant’s node has access to and maintains only a subset of that data. While this approach resolves data privacy issues, it introduces significant chal-lenges for data replication across the network.15 Unlike public blockchain schemes, where all nodes have a copy of the exact same database (e.g., Jasper Phase 1), these restricted systems have a point of failure at every node; that is, each node requires data replication and archiving to ensure business continuity, rather than each node providing resilience to the system, as in the case with the Ethereum blockchain.
Third, a single point of failure is more likely in a notary system, where nodes are relatively more specialized than they are in a PoW system. In Phase 2 of Project Jasper, the role of notary in Corda is performed by the Bank of Canada, so an outage at the Bank would prevent any processing of pay-ments. This is important because it highlights that operational resilience is related to the function being performed by each node.
An overall evaluation suggests that, when compared with both centralized platforms and an open DLT platform, restricted distributed ledger schemes may decrease operational resilience if they are not carefully designed. This need for operational resilience may make Jasper Phase 2, based on Corda, more expensive than the current centralized system in terms of meeting the PFMIs. In Jasper Phase 2, it is therefore likely that each participant would have to invest in a high-availability node to reduce the chance of an outage.
14 A payment system is said to be highly available if it operates a very high percentage of the time it is supposed to, for example, 99.99 per cent of the time.
15 It is important to note that Corda queues pending requests to nodes as part of the design, so that when a participant with an outage is back, online transactions may still be processed.
66 pRoJeCt JASpeR: ARe diStRibuted WholeSAle pAyment SyStemS FeASible yet? BANK OF CANADA • FINANCIAL SySTEM REVIEw • JuNE 2017

Another key aspect of operational risk in the PFMIs is scalability. Currently, the LVTS processes 32,000 transactions daily, with a peak throughput of roughly 10 transactions per second. In DLT arrangements, there is a com-putational cost to distributing functionality. In PoW platforms like Ethereum, there is limited capacity to scale. In Phase 1 this was approximately 14 transactions per second because Ethereum was designed for the public Internet, where speed limitations would challenge information flow between nodes. While this speed is sufficient to process current daily LVTS volumes, it could create future peak volume constraints, such as in times of market stress or volatility. In contrast, scalability would not be a constraint in the Corda platform because Corda does not have a consensus method based on a fixed time and requires only nodes of the involved parties and a notary to verify transactions.
Transparency and PrivacyA fundamental requirement for a wholesale payment system is the need for participants to keep their transactions private from parties not involved in the transaction. This is necessary to prevent other participants from being able to take advantage of this information. A participant’s clients may also prefer or require this privacy. By implication, PoW systems are ill-suited for these types of large-value systems because they operate under the assumption that all transactions in the system are, at a certain level, publicly observable.
In contrast, notary-based DLT systems, such as Corda, permit increased privacy because a trusted third party (e.g., the Bank of Canada) helps validate all transactions. But the lack of transparency in the Corda system implies that no node in the system, with the possible exception of the notary, has all the information. Therefore, if the information at one or more nodes is corrupted, it may not be possible to reconstruct the entire network since even the notary does not have a full copy of the ledger. This creates the need for backups of individual nodes and a loss of the economies of scale associated with centralized systems. Further, it raises the question of whether the proposed operational-resilience benefits of DLT are possible under the constraint that transactions remain private.
ConclusionProject Jasper enabled a better understanding of the roles and responsibil-ities of the operator of a DLT wholesale payment system, its participants and the central bank. In a DLT framework, the operator’s role would likely be closer to that of a rule maker or standard setter rather than a traditional IT infrastructure operator. DLT has implications for the roles of operators as well as for how the PFMIs should be applied or revised. It may be necessary at some point to update the PFMIs to include principles outlining regulatory authorities’ requirements for structuring a DLT for a market infrastructure.
In addition, the work on Project Jasper has allowed the stakeholders of the wholesale payment system to jointly develop the platform. Both private and public sector partners learned a great deal about the technical aspects of DLT from the project. They found this improved their mutual recognition of the complexity of the processes involved and cultivated collaboration to overcome technical obstacles. It also allowed for a comprehensive com-parison of different DLT technologies from all perspectives (i.e., overseer, operator and participant).
pRoJeCt JASpeR: ARe diStRibuted WholeSAle pAyment SyStemS FeASible yet? 67 BANK OF CANADA • FINANCIAL SySTEM REVIEw • JuNE 2017

A pure stand-alone DLT wholesale payment system is unlikely to match the net benefits of a centralized wholesale payment system. This is because some parts of a viable wholesale payment system are inherently centralized, such as the LSM discussed above. This added complexity could lead to further operational risk when compared with current centralized systems.
Instead, the benefits of a DLT-based wholesale payment system likely lie in its interaction with the broader FMI ecosystem. Such benefits may be obtained by integrating other assets on the same ledger as payments—which could greatly simplify collateral pledging and asset sales—reaping economies of scope and reducing costs to participants by integrating back-office systems.
Cost savings or efficiency gains may also be possible sector-wide. This could occur if a DLT-based core interbank payment system can serve as the basis for other DLT systems to improve clearing and settlement across a range of financial assets. For example, exchange-traded assets already clear and settle through safe and efficient systems. But gains would be possible if these systems could be integrated by having cash on the same ledger as payments to settle the cash leg of each transaction. Over-the-counter markets (for stocks, bonds and derivatives), syndicated loans and trade finance are much more decentralized systems with long settlement times. These could be significantly improved using a DLT-based platform if they could be integrated with a core wholesale payment system, resulting in the transfer of cash payments using central bank money.
Distributed ledger platforms offer potential cost savings by lowering the costs of reconciliation. If a DLT-based system allows banks to validate their transactions at the very beginning, it could reduce back-office reconcilia-tion work and potentially achieve major cost savings for the financial sector. These cost savings depend on the nature of the DLTs: a PoW system like Ethereum, for example, would be relatively more expensive to operate because of the computational cost of the consensus mechanism.
Project Jasper has provided valuable insights to all the parties involved. Several paths could be explored further. One possible future extension could be to think about how to pledge general collateral instead of cash collateral to the Bank of Canada. Another would be to explore the potential integration between Project Jasper and other types of DLTs, either domes-tically or internationally. This could help determine potential efficiency increases from better connections, improved automation of cross-border payments or the ability to settle multiple assets (e.g., bonds or money market instruments) on the same ledger.
ReferencesBech, M. L. and B. Hobijn. 2007. “Technology Diffusion Within Central
Banking: The Case of Real-Time Gross Settlement.” International Journal of Central Banking 3 (3): 147–181.
Bech, M. L., C. Preisig and K. Soramäki. 2008. “Global Trends in Large-Value Payments.” Federal Reserve Bank of New York Economic Policy Review (September): 59–81.
68 pRoJeCt JASpeR: ARe diStRibuted WholeSAle pAyment SyStemS FeASible yet? BANK OF CANADA • FINANCIAL SySTEM REVIEw • JuNE 2017

Buterin, V. 2013. “A Next-Generation Smart Contract and Decentralized Application Platform.” Ethereum White Paper. Available at https://github.com/ethereum/wiki/wiki/White-Paper.
Committee on Payments and Market Infrastructures (CPMI). 2017. “Distributed Ledger Technology in Payment, Clearing and Settlement: An Analytical Framework.” Bank for International Settlements (February).
Committee on Payment and Settlement Systems and Technical Committee of the International Organization of Securities Commissions (CPSS-IOSCO). 2012. “Principles for Financial Market Infrastructures.” Bank for International Settlements (16 April).
Davey, N. and D. Gray. 2014. “How Has the Liquidity Saving Mechanism Reduced Banks’ Intraday Liquidity Costs in CHAPS?” Bank of England Quarterly Bulletin (Q2): 180–189.
Garratt, R. 2017. “CAD-Coin versus Fedcoin.” R3 Report (5 April).
Nakamoto, S. 2008. “Bitcoin: A Peer-to-Peer Electronic Cash System.” Available at https://bitcoin.org/bitcoin.pdf.
Narayanan, A., J. Bonneau, E. Felten, A. Miller and S. Goldfeder. 2016. Bitcoin and Cryptocurrency Technologies: A Comprehensive Introduction. Princeton: Princeton University Press.
Schindler, J. Forthcoming. “FinTech and Financial Innovation: Drivers and Depth.” Washington: Board of Governors of the Federal Reserve System.
pRoJeCt JASpeR: ARe diStRibuted WholeSAle pAyment SyStemS FeASible yet? 69 BANK OF CANADA • FINANCIAL SySTEM REVIEw • JuNE 2017