financing epa: the fiscal impact of epa on ecowas
TRANSCRIPT

Financing EPA: The fiscal impact of EPA on ECOWAS
Sofie Selin Lund University School of Economics and Management Department of Economics Supervisors: Master Thesis Joakim Gullstrand August 2011 Yves Bourdet

2
ABSTRACT The European Union (EU) and the Africa, Caribbean and Pacific (ACP) countries have been
negotiating Economic Partnership Agreements (EPAs) since 2002. The EPAs are intend to
replace present agreements which due to its discriminatory element against other developing
countries, not are compatible with the WTO regulations. The liberalisation of the EPAs has
triggered some concerns regarding the risk of large decline in tariff revenues and the
negotiations proved to be more complicated than predicted.
The purpose of this study is to determine the Economic Community of West African States
(ECOWAS) countries reliance on tariff revenues in order to evaluate the EPA negotiations.
An examination on whether the ECOWAS countries’ present level of tariff revenues impacts
their willingness to sign the EPAs and thus affecting the negotiations.
Observations show a significant reliance on tariff revenues for ECOWAS countries, with total
revenues accounted for 53 percent on average. Tariff revenues from the EU play a significant
role and are observed to contribute with 18 percent out of the total government revenue. The
main concerns for ECOWAS countries are their lack of institutional capabilities to mitigate
the loss in tariff revenues. This will most likely make the ECOWAS a bit reluctant to sign an
EPA, since their significant reliance on tariff revenues can lead to a substantial decline in
government revenues. Further, other characteristics are also likely to affect the ECOWAS
willingness to sign the EPAs due to their concerns of losing tariff revenues. These concerns
are the possible trade diversion effect, undiversified economical structure as well as the
possibility to trade under the EBA. The significant reliance on tariff revenues is most likely to
affect the members of ECOWAS’ willingness to sign the EPA and thus also the negotiations.
Keywords: Economic Partnership Agreements (EPA), Economic Community of West
African States (ECOWAS), EPA negotiations, Reliance on tariff revenue, Trade
liberalisation.

3
ABBREVIATIONS ACP African Caribbean and Pacific
CARIFORUM The Caribbean Forum of the ACP Countries
EBA Everything But Arms
ECOWAS Economic Community of West African States
EEC European Economic Community
EPA Economic Partnership Agreement
EU European Union
ESA Eastern and Southern Africa
FDI Foreign Direct Investment
GATT General Agreement on Tariffs and Trade
GDP Gross Domestic Product
GSP General System of Preferences
HS Harmonized System
IMF International Monetary Fund
LDC Least Developed Country
MFN Most Favoured Nation
MNE Multinational Enterprise
PTA Preferential Trade Agreement
ROO Rules of Origin
ROW Rest of the World
SADC Southern African Development Community
TRAINS Trade Analysis and Information System
VAT Value Added Tax
WAEMU West African Economic and Monetary Union
WITS World Integrated Trade Solution
WTO World Trade Organisation

4
TABLE OF CONTENT
1. INTRODUCTION 6
2. EPA – ECONOMIC PARTNERSHIP AGREEMENT 9
2.1 The Most Favoured Nation (MFN) 9
2.2 The Lomé Convention 9
2.3 The Cotonou Agreement 10
2.4 The EPA 11
2.5 EPA negotiations 12 2.5.1 Interims 14 2.5.2 Negotiation process for ECOWAS countries 14
3. TARIFF REVENUES -‐ IN DEVELOPING COUNTRIES 16
3.1 Tariffs 16
3. 2 Trade theory 17
3.3 Reliance on tariff revenues in developing countries 19 3.3.1 A narrow domestic tax base 19 3.3.2 Institutional constraints 20
4. FISCAL EFFECTS OF THE EPAS 22
4.1. Tariff revenue loss 22
4. 2. Fiscal effects of the liberalisation of the EPAs 23 4.2.1 Economic growth 23 4.2.2 Increased volume of imports 23 4.2.4 Possible negative effects 24
4.3 Measures to avoid a fiscal shock due to lost tariff revenues. 25 4.3.1 The VAT 26 4.3.2 Complementary measures 26 4.3.3 Opening up markets -‐ Exclude products 27
4.4 A fiscal shock or not? 27
5. AN EMPIRICAL ASSESSMENT OF THE FISCAL EFFECTS 29
5.1 Data 29
5.2 ECOWAS 29
5.3 Trade pattern 30 5.3.1 Export -‐ Economical structure 30 5.3.2 Import 31
5.4 Tariffs 32

5
5.4.1 Tariff levels 33 5.4.2 Tariff revenues 36
5.4 Impact on negotiations 44
6. CONCLUSION 46
APPENDIX 1 Breakdown of total export 2009 in percent 52
APPENDIX 2 Breakdown of total import by main origin, 2010 53
APPENDIX 3 Breakdown of imports by sector in percent, 2010 55
APPENDIX 4 Breakdown of weighted average tariff by sector in percent 57
APPENDIX 5 Development of weighted average tariffs in percent, 2001-2010 59
APPENDIX 6 Weighted average tariffs in percent, 2001-2010 61 LIST OF TABLES Table 1 Regional groups negotiating EPA ________________________________________________________________________ 12 Table 2 ECOWAS countries concluded and not concluded interim agreement _________________________________ 15 Table 3 Average ECOWAS import by sector in percent, 2010____________________________________________________ 32 Table 4 Tariff revenue indicators - EU import in percent, 2009 _________________________________________________ 36 Table 5 Tariff revenues in % of government revenue, from EU imports 2009 __________________________________ 38 Table 6 Tariff revenue in % of government revenue from EU imports 2009____________________________________ 38 Table 7 Average tariff revenue in % of government revenues for all ECOWAS countries, 2009 _______________ 39 Table 8 Breakdown of tariff revenues in percent of government revenues by sector and import origin ______ 40 Table 9 Breakdown of tariff revenue in percent of government revenue by sector and import origin ________ 41 LIST OF FIGURES Figure 1 Trade and welfare effects of an EPA ................................................................................................................................ 18 Figure 2 Weighted average tariff levels in percent, 2010 ......................................................................................................... 34 Figure 3 Weighted average tariff levels in percent, 2010 ......................................................................................................... 34

6
1. Introduction The African, Caribbean and Pacific (ACP) countries have enjoyed a non-reciprocal
preferential access to the European Union market since 1975. Due to its discriminatory
element against other developing countries, the agreements were not compatible with the
WTO regulations, which is why the EU began searching for new trading agreements. The
ACP countries and the EU are currently negotiating reciprocal Economic Partnership
Agreements (EPAs). For ACP countries implementing an EPA “substantially all trade” need
to be liberalized over a “reasonable length of time”, which is expected to be a challenge for
numerous countries. (Karingi, Lang, Oulmane, Perez, Sadni Jallab & Hammouda, 2005). This
requires gradually reducing or eliminating trade taxes levied on imports from the EU.
The main objectives with the EPAs are to provide the ACP countries with possibilities to
enhance economic growth and development through increased trade, technological and
investment progress opportunities. However, the gains are accompanied by fiscal challenges,
in temrs of handling the loss of tariff revenues. On average, the ACP countries highly rely on
the benefits received from the tariff revenues, in particular the ones received from EU imports
that represent a substantial part of the total government revenue. For these countries,
liberalising the trade with EU could lead to a large decline in government revenue. Some
studies estimate that the revenue losses may exceed the gains from trade and thus reduce the
overall welfare (Khatty & Rao, 2002).
The negotiations have proved to be more complicated to conclude than expected and they
have not been friendly or easy (Bilal, 2008). The negotiations were due to be concluded at the
end of 2007. However, at the time of writing, Caribbean are the only region that has yet
signed a comprehensive EPA. In reaction to this, interim agreements were established. The
interim EPAs are partial bilateral agreement covering trade in goods but not the additional
issues covered in the comprehensive EPA. In the West African region – the Economic
Community of West African States (ECOWAS), one of the six ACP regions negotiating
EPAs with the EU, only two countries have concluded interim agreements; Cote d’Ivoire and
Ghana. The rest of the fourteen countries in the region are still today negotiating.
The purpose of this study is to determine the ECOWAS countries reliance on tariff revenues
in order to evaluate the EPA negotiations. An examination on whether the ECOWAS

7
countries’ present level of tariff revenues impacts their willingness to sign the EPAs and thus
affecting the negotiations.
To determine the level of reliance on tariff revenues the study will present observations on
trade patterns, tariff levels as well as accounted shares of tariff revenues. The tariff revenues
will be examined as a percentage of GDP as well as of the government revenue for the
thirteen member countries of ECOWAS. The members are Benin, Burkina-Faso, Cape Verde,
Cote d’Ivoire, Gambia, Ghana, Guinea, Guinea-Bissau, Mali, Niger, Nigeria, Senegal and
Togo. To get a more comprehensive picture of the countries’ level of reliance on tariff
revenues, seven sectors have been observed. The factors consist of; capital goods, consumer
goods, intermediate goods, raw materials, agricultural, industrial and petroleum. Imports from
EU, ECOWAS and rest of the world (ROW) are examined. However, the study does not
attempt to quantitatively estimate the future impact of the fiscal transition on government
revenue.
Previous research has been conducted regards to the ECOWAS countries’ reliance on tariff
revenue. They do, however, all differ in terms of values AS well as variables, e.g. some
studies use custom duties and other use trade taxes which includes significantly more
variables than solely tariffs. To coherent determine the reliance on tariff revenue for the
ECOWAS countries, primary data was collected for this study. The West African region was
chosen since it is one of the poorest regions in the world. Additionally, the majority of their
imports originate from the EU hence they should expect to get greatly affected by potential
negative fiscal impacts of the EPA.
Due to the purpose of this paper and the relatively large number of countries and variables to
be examined, the choice of using a descriptive method was natural. A descriptive method
deals with the acquisition of factual, accurate and systematic data from the selection that can
be used in averages, frequencies and similar statistical calculations. The aim of a descriptive
study is to describe the nature of situations of the time of the study and to explore the causes
of particular incidents (Befring, 1992).
As with all methods, there are advantages and disadvantages with using descriptive methods.
The main advantages regards to using a descriptive method are firstly, the fact that the data
used in the study is validated and proves it reliability. Secondly, it is also a very useful way of

8
investigating and observing a large number of countries, which allows for a comparison and
evaluation of them relative to a large number of observations. For most studies, one should
not be too detailed nor should one cover every single detail of the sample, hence there is often
a need to cluster variables or observations. By doing so there is always a risk of
misinterpretation. That risk does not, however, exceed the advantages of using descriptive
method.
The remainder of this paper is structured as follow. Chapter 2 reviews the ACP-EU
partnership over the time, the design and the WTO compatibility of the EPAs as well as the
progress in the negotiations. Chapter 3 presents theoretical aspects regarding tariffs in
developing countries. Chapter 4 presents and discusses the fiscal effects of the EPAs,
focusing on the liberalisation effect, as well as measures to avoid a fiscal shock. Chapter 5
present the collected data over the ECOWAS countries’ trade patterns, tariff levels as well as
their reliance on tariff revenues from the EU, ECOWAS as well as the ROW. The section is
followed by a discussion whether the collected observations have any impact on the
negotiation process for ECOWAS countries. Finally, chapter 6 concludes the paper.

9
2. EPA – Economic Partnership Agreement
This section will present the EPAs, what they entails, how they have been developed and why
they have evolved. Further, the negotiation process will be presented as well as the state of
play for the ECOWAS countries in the negotiations.
2.1 The Most Favoured Nation (MFN) As a member of the WTO, one needs to follow The Most Favoured Nation (MFN) treatment,
which is one of the major WTO principle. The treatment specifies that a trade concession
granted by a member state to another should automatically be extended to all other WTO
members. There are two exceptions for which the MFN principle can be disregarded; (i) the
enabling clause (ii) the Article XXIV of the GATT (Karingi et al. 2005).
The enabling clause allows preferential treatment when based on development concerns.
Preferences can be granted to developing countries as long as they are offered to all
developing countries or strictly to least developed countries (LDC). Generalised System of
Preferences (GSP) and Everything but Arms (EBA) are example of schemes utilized under
the enabling clause. Under the GSP, the EU offers developing countries lower tariffs and
duty-free access on certain products. The EBA provides LDC countries duty- and quota free
access to the EU market with the exception for arms and ammunition (Karingi et al. 2005)
The Article XXIV of the GATT, allows for derogation of the MFN principle when engaged in
a free trade agreement. Free trade agreements are thought to benefit, not only the members,
but also the whole world through trade creation and its welfare engaging. This belief justifies
the derogation. The free trade area needs to be reciprocal to be allowed for derogation
(Karingi et al. 2005).
2.2 The Lomé Convention In February 1975, the first Lomé Convetion was signed that proposed a non-reciprocal
agreement between the European Economic Community (EEC) and ACP countries. The
agreement granted the ACP countries a favourable access to the EU market without being
committed to grant equivalent concessions to European exporters (Karingi et al. 2005). The
primary objective of the Convention was “ to promote economic and social development and

10
to establish close economic relationship with foremost former African colonies and the EU”
(Treaty of Rome Article 131).
Initially the Convention was seen as an exemplary form of North-South partnership and
hailed for its innovativeness. At the time, the unilateral preferential access that was granted
for ACP countries to the EU market was recognised as a great possibility for developing
countries. Their protected borders provided them with the opportunity to base industrial
development whilst the preferential market access offered expansion for exporters (Karingi et
al. 2005). However, the Lomé partnership had a very limited positive impact on Africa both in
terms of its integration in world trade as well as in terms of poverty reduction and socio-
economic development (Karingi et al. 2005). The ACP export showed few signs of
diversification and the ACP exporters share of the EU market had diminished from 8 percent
in 1975 to 2,8 percent in 2000. The Convention failed to meet its objective development, as it
did not get the expected response from the ACP economies (Karingi et al. 2005).
2.3 The Cotonou Agreement In addition to the unsuccessful achievements of the Lomé Convention, the preferential
treatment was not compatible with one of the most basic GATT/WTO principles - The Most
Favoured Nation (MFN) treatment, thus, following the pressure from the WTO, EU began the
search for new trading agreements in the mid 90’s leading to the signing of the Cotonou
Agreement in 2000 (Karlsson, Tangnäs & Wolpher, 2009).
The main objective of the Cotonou agreements is to focus on poverty reduction as well as to
strengthening the political development such as respect for human rights and good
governance. Furthermore it aims to further integrate the ACP countries with the world market
as well as promote a deeper regional integration. The Cotonou agreement is forecasted to run
for twenty years (until year 2020) with the possibility to revision every fifth year (Fontagné,
Laborde & Mitaritonna, 2010).
In 2001, EU was granted a waiver to its obligation under the GATT/WTO that allowed them
to maintain the preferential treatment during a transitory period under the condition that new
WTO-compatible agreements were being negotiated. The goal was to negotiate and reach an
agreement on the Economic Partnership Agreements (EPA) by the end of 2007 that had to be
11
compatible with WTO (Kommerskollegium, 2004) The rationale behind the name, Economic
Partnership Agreements, is to reflect the agreement’s objectives of strong development
concerns. The main objectives of the EPA are to provide the ACP countries with possibilities
to enhance economic growth and development through increased trade, investment and
technological progress opportunities (Bilal & Ramdoo, 2010).
2.4 The EPA An EPA between the EU and the ACP countries would fall under the Article XXIV. For the
EPAs to comply with Article XXIV, “substantially all trade” need to be liberalised
(Art.XXIV, 8-b). The exact meaning of “substantially” is open for interpretation and has been
strongly debated. According to the European Commission, at least 90 percent of all bilateral
trade flows need to be liberalized. That is, eliminating trade barriers on at least 90 percent of
the value of its imports from the EU. However, EU will provide duty- and quota-free access
to all ACP exports which means that, most ACP countries need to liberalise at least 80
percent of their imports from the EU so that the total bilateral trade flow is liberalised with 90
percent (Hallaert, 2010). ACP regions experiencing a bilateral trade deficit with the EU will
have to liberalise more than 80 percent of their imports, whereas other regions experiencing a
trade surplus can liberalise less than 80 percent of imports (Bilal & Roza, 2007). Liberalising
up to 90 percent allows ACP countries to protect sectors vulnerable to import competition by
excluding so-called sensitive products from liberalisation. The importance of how to choose
these products will be discussed in chapter 4.3.2.
Furthermore, Article XXIV also maintains some ambiguity on the given time frame to
accomplish liberalisation. The article stipulates that the implementation should take place
over a “reasonable length of time” (Art.XXIV, 5c). Here again it is open for interpreting the
meaning of the term “reasonable”, but it is conventionally thought to be no longer than 10
years (Karingi et al. 2005). However, most of the interims EPAs that has been signed up to
date exceed the ten year time frame (Hallaert, 2010).
The only area that EPAs need to cover in order to be compatible with the WTO is the trade in
goods section. In addition, EU wanted the EPAs to be more comprehensive as to why the
agreements also cover trade in service and other trade related issues (such as custom issues
and trade facilitation, competition, innovation, capital movements and public procurement
and intellectual property) (Karlsson et al. 2005).

12
2.5 EPA negotiations For negotiating the EPAs, the 78 ACP countries were divided into six regional configurations
that were established just for negotiations.
Table 1 Regional groups negotiating EPA Caribbean – The Caribbean Forum (CARIFORUM) Central Africa West Africa – Economic Community of West African States (ECOWAS) Eastern and Southern Africa (ESA) Pacific Southern African Development Community (SADC)
The intention of dividing the countries into groups was to strengthen the regional integration,
something that is seen as an important step towards further integrating the countries into the
world economy (Hinkle, Hoppe & Newfarmer, 2006). Further the forming of larger groups
was considered a potential way to enhance growth. Many of the countries are too small to
produce competitive goods and services individually or to provide necessary government
regulatory services compared to larger groups of countries. The purpose was to create a
North-South-South agreement, linking EU with aspiring custom unions in the South (Hinkle
et al, 2006). The six groups all consist of overlapping free trade areas, custom unions and
non-associated countries, which further complicates the negotiation process. There are many
voices to be heard and many voices to please.
The negotiations of the EPA have not been easy or friendly, but extremely challenging both
in terms of process as well as substance (Bilal & Braun-Munzinger, 2008). As a result, only a
limited substantive progress had been achieved by end 2007. The lack of progress were partly
due to the European Commission and ACP countries difficulties to reach a common
understanding and approach on the cornerstone of the EPAs –the regionalism and
development component (Bilal & Braun-Munzinger, 2008). The two parties have a
fundamental divergence between them in terms of their approaches towards development.
The EU’s approach is to focus on attracting investments, which is seen as a necessary
condition for sustainable development (Bilal & Braun-Munzinger, 2008). The EPAs are
thought to foster development through trade liberalisation and thus attract investment. By
deeper ACP regional integration and establishment of effective regional markets, the EPAs

13
will attract and stimulate domestic as well as foreign investment. The ACP countries agrees
on that trade liberalisation and regional integration is necessary, but consider it to be far from
sufficient, to foster development and alleviate poverty (Bilal & Braun-Munzinger, 2008).
Due to supply-side constraints and the need of measures to mitigate the adjustment costs, is
the ACP’s approach to include appropriately financial support with the EPAs. The support
should be binding, predictable and made available in addition to the existing EDF (Bilal &
Braun-Munzinger, 2008).
The EC was at first reluctant to ACP’s demand but conceded on the inclusion of development
chapters in the scope of the negotiated agreements in October 2007 when the EU Strategy on
Aid for Trade was adopted. However, the financial commitments are not binding (Bilal &
Braun-Munzinger, 2008).
Further explanations to why the negotiations have been difficult are the lack of institutional
and technical capacity for the ACP countries (Bilal & Braun-Munzinger, 2008). There is a
wide gap between the two groups of countries negotiating EPA, in terms of negotiating
powers. This was formally recognised in the Cotonou Agreements, and the preparatory
period was agreed on to be used to build ACP countries capacity. Capacities, thought to be
helpful during the negotiations and future implementation of the EPAs. However, the ACP
countries have repeatedly, since 2002, expressed their concerns about continuous capacity
constraints, thus affecting their abilities to negotiate effectively and implement the EPAs
(Bilal & Braun-Munzinger, 2008). The civil society in both ACP countries as well as in EU
have been strongly reluctant to the agreements and their great resistance have been a major
cause to why only a limited substantive progress had been achieved so far.
Moreover, the deadline, often regarded to work as a stimuli for negotiating parties to move
ahead and put the issue higher up on the political agenda. However, for the EPA negotiations
characterized by the asymmetric relationship between the EU and the ACP, it has showed
that too much pressure can lead to a lot of suspicion and lack of ownership of the final result
(Bilal & Braun-Munzinger, 2008). The pressure and the threat of EU imposing tariffs from
2008 have therefore left many ACP stakeholders with the feeling that the agreements have
been externally imposed. This may lead to less willingness to bring forward the process and
related reforms (Bilal & Braun-Munzinger, 2008). A final explanation to the failure of
concluding regional EPAs is the weak regional cohesion clearly exposed in most ACP

14
regions. National interests still prevail over regional integration agendas in most regions
(Bilal & Braun-Munzinger, 2008).
2.5.1 Interims By the end of 2007 when the negotiating parties were suppose to have reached agreements
about the EPAs, only the Caribbean group (CARIFORUM) had signed a comprehensive EPA.
In reaction to this, interim agreements were established. The interim EPAs are partial bilateral
agreements that cover trade in goods but not the additional issues covered in the
comprehensive EPA (www.acp-eu.org). However, by signing an interim agreement the ACP
countries commit to continue negotiations toward a comprehensive EPA. The liberalisation
commitments of the interim agreements are compatible with the WTO agreements. The
countries that signed an interim benefit from January 1st, 2008, benefits a fully duty- and
quota- free access to the European market (with transition period for sugar and rice) by
liberalising imports of goods from EU according to different liberalisation schedules
(www.acp-eu.org). The fate of the countries not signing either of the agreements depends on
whether or not they are a LDC. LDCs benefits from the EBA preferences and non-LDCs will
export to EU under the GSP scheme. The GSP scheme offers lower tariffs or duty-free access
but these preferences are less favourable than the EPA preferences. The EBA provides duty-
and quota- free access and there are therefore no differences between the EPA and the EBA in
terms of gaining access to the European market. However, the rules of origin (ROO) are
stricter under both GSP and EBA compared to the EPA. Further, the EBA are only
unilaterally granted and can be withdrawn at any moment. This means the countries that do
not sign the interim or the EPA will experience less favourable treatment compared to the
countries that sign them (Karlsson et al. 2009). Of the seventy-eight ACP countries
negotiating EPAs, thirty-six have signed an interim or EPA with the EU whereby ten are
LDCs and twenty-six non-LDCs.
2.5.2 Negotiation process for ECOWAS countries The West African group, negotiating the EPAs with EU, consists of sixteen countries. Fifth
teen of which are currently members of the ECOWAS; Benin, Burkina Faso, Cape Verde,
Cote d’Ivoire, The Gambia, Ghana, Guinea, Guina-Bissau, Liberia, Mali, Niger, Nigeria,
Senegal, Sierra Leone and Togo. Mauritania has, in addition to these countries, decided to
join the group for the EPA negotiations, despite its withdrawn from the ECOWAS community
in 2002. Twelve of the countries are LDCs, (in bold in table 2) and only four are non-LDCs.

15
The negotiations are being conducted by the Regional Negotiation Committee on the West
African side and by the European Commission on behalf of the EU (ECDPM, 2006).
By the end of 2007, the negotiations of the EPA between the West African Region and the EU
were still in progress and no agreements had been initialled nor signed. In December 2007
Ghana initialled an interim agreement and Cote d’Ivoire signed an interim agreement on 26
November 2008. Ghana has indicated they have intentions to sign the Interim EPA.
Negotiations towards a comprehensive EPA, which will replace the interim agreements, will
continue in 2011. The latest offer from the West African region is a 70 % liberalisation during
a time period of 25 years (ACP-EU.ORG).
Table 2 ECOWAS countries concluded and not concluded interim agreement
Concluded interim agreement Not concluded interim agreement Cote d’Ivoire Ghana Nigeria Cape Verde
Benin Gambia Guinea Guinea Bissau Burkina Faso Liberia
Mali Mauritania Niger Senegal Sierra Leone Togo
Source: (ECDPM, 2006)
The two remaining non –LDCs, Nigeria and Cape Verde, did not initial an interim agreement.
Nigeria applied to be included in the GSP + scheme offering additional preferences to
developing countries. The application was refused since they had not ratified the United
Nations Convention on Prevention and Punishment of the Crime of Genocide, which is one of
the requirements to benefit from GSP+ preferences. Nigeria has, therefore, been exporting to
the EU under the GSP scheme since 1 January 2008. Cape Verde is permitted to export to EU
under the EBA regime for a transition period of at least three years, which has been extended
until 1 of January 2012. The rest of the countries in the West African region1 are all LDCs,
hence they export under the EBA regime since 1 January 2008 (ECDPM, 2006).

16
3. Tariff revenues -‐ in developing countries
This chapter will present theoretical aspects regarding tariffs in developing countries. The
concluded section of this chapter discusses the reliance on tariff revenues in developing
countries.
3.1 Tariffs
There are several different types of trade barriers that governments may use to restrict the
country’s level of trade. Taxes levied on imported goods are the most commonly used trade
barrier, commonly referred to as tariffs – a form of commodity taxation. Tariffs can be levied
in two basic ways - specific tariffs or ad valorem tariffs. A specific tariff is levied as a fixed
charge per imported unit (Markusen, Melvin, Kaempfer & Maskus, 1995). A government
could, for instance, levy a one dollar specific tariff on every imported hat. Thus, if 1000 hats
are imported, the government collects 1000 dollars in tariff revenue. The collected revenue
will stay the same regardless of the value of the imported hats. An ad valorem tariff is levied
as a fixed percentage of the value of the imported good. In this case, a government levies a 10
percent ad valorem tariff on imported boats. Thus, imported boats worth of 100 000 dollar
will result in 10 000 dollar in tariff revenue. The collected revenue is dependent of the value
of the imported commodities. Tariffs can be levied on exports as well as on imports. There are
also other forms of barriers to restrict trade, like quantitative restrictions and technical or
administrative rules (Markusen et al., 1995). However this paper will focus on tariffs levied
on imports.
There are several essential reasons for why a government would choose to levy taxes on
trade; (i) To provide protection for local industry and employment. Emerging national
industries may need time to become competitive and thereby in need of temporary protection.
(ii) To raise revenue for the government. (iii) To provide an instrument for correcting market
distortion and (iv) to act as an instrument of macroeconomic stabilization (Blejer &
Chu,1989).

17
3. 2 Trade theory
As for traditional trade theory, trade taxes are seen to be preventing efficient resource
allocation. A tariff encourages domestic producers to produce more of a commodity in which
the country lacks comparative advantages. Thus, tariffs divert resources away from the true
pattern of comparative advantages, as to why gains from specialization are reduced. Increased
domestic prices, for both consumers and producers, in combination with reduced quantity of
imports reduce the gains of trade and welfare. Tariffs are simply seen to move the country
back towards autarky (Markusen et al 1995). With the Heckscher –Ohlin framework, trade
taxes are disrupting the free flow of commodities between countries. Furthermore, traditional
trade theory argues that liberalisation enhances welfare and economic growth. As trade
barriers are removed, domestic producers face increased competition from international
suppliers. Only the producers with a comparative advantage survive the increased level of
competitiveness through their ability to produce with lower costs compared to foreign
producers to raise their productivity level. Production factors will be reallocated to other
industries with domestic comparative advantages, the so-called structural adjustment (Busse,
Borrmann & Großmann, 2004). Further, as trade is liberalised, domestic consumers face
lower prices of both imported and domestically produced goods that create an increased
consumer surplus. Hence, households benefit from increased real incomes. Purchasing cheap
investment and intermediate goods increase firms and producers international competiveness
and sales rise domestically as well as internationally (Busse et al, 2004). Increased
competition, according to the theory, is predicted to lead to increased production, employment
and consumer surplus and thereby raise countries’ overall welfare.
Trade theory, initiated by Viner (1950) further predicts free trade agreements to lead to trade
creation and/or trade diversion. Milner, Morrissey & McKay (2005) extend Pangariya’s
(1998) partial equilibrium model for examining the impact welfare has on a small country to
initial a preferential trade agreement (PTA). Figure 1 illustrates the import demand curve of a
small country, home (DH), and the upward sloping supply curve of a partner country, (SP).
The supply of exports for two (initial) outside suppliers, the EU and the ROW, is assumed to
be infinitely elastic, (SEU, SROW). Further assumptions of the model are (i) that the markets are
perfectly competitive and (ii) that there is perfect substitutability between imports from
alternative sources and imported and domestically produced import substitutes.

18
Figure 1 Trade and welfare effects of an EPA
Source: (Milner et al. 2005)
Let’s start with a PTA, between H and P, and a non-discriminatory, ad valorem, tariff (t) on
extra-regional imports, where PtROW=PROW (1+t). The home country imports OM2 in total, at
point B, with OM1 from the partner country and the rest M1M2 coming from the ROW. If an
EPA is concluded between the PTA and EU, the home country will continue to impose tariff t
on imports from the ROW but allow imports from the EU in duty free. The relevant supply
price is now PEU and the total amount of imports expands to OM3 where all imports come
from the EU. M2M3 represents a consumption expansion effect, M1M2 a trade diversion effect
and OM1 a trade creation effect (Milner et al, 2005).
Trade diversion is usually related to as diverting trade from more efficient extra-regional
suppliers to less efficient intra-regional suppliers. In this model, however, the EPAs are
diverting imports from extra-regional suppliers where M1M2 is imported from the less
efficient EU rather than the more efficient ROW. The resource cost of this is illustrated by the
area b. Area (a+b) illustrates the total tariff revenue loss by the home country.
Trade creation is defined as the change in import from less efficient home or intra-regional
production to more efficient extra-regional production, in this case, the replacement of intra-
regional imports by more efficient (but not the most efficient) extra-regional imports from the
19
EU, (illustrated by area c). The consumer surplus increases with area (c+d). The welfare
implications for the home country of shifting to the EPA from the PTA are ambiguous. The
consumption and trade-creation effects increase welfare and the trade diverting effect as well
as the reduced tariff revenues (a+b) reduce welfare. Thus, the more efficient the EU suppliers
are the smaller the costs of trade diversion hence the greater chance of the EPAs to be welfare
improving (Milner et al, 2005).
3.3 Reliance on tariff revenues in developing countries The traditional trade theory is, however, based upon the condition of non-increasing returns to
scale and perfect competition. In the absence of perfect competition and if imperfect
competition is introduced, trade taxes can be justified as part of the “optimal tariff argument”.
The aim with an optimal taxation is to raise government revenue with minimum distortion.
According to optimal taxation theory, trade taxes should not be included in an optimal
taxation for small open economies (Blejer & Chu, 1989). Although, trade taxes have
historically been, and still are, a major source of government revenue during the early stages
of economic development. This is still the case as many developing countries rely heavily on
revenue from import taxes to finance their budgets, in some cases for more than 50 percent
(Hallaert, 2010).
Several features in low-income countries limit the countries possibilities to develop a
sustainable domestic tax system as to why low-income countries tend to rely more heavily on
trade taxes. The two main reasons for this are (i) a narrow domestic tax base and (ii) a
rudimentary tax administration/ institutional constraints.
3.3.1 A narrow domestic tax base Unlike urban activities, rural economic activities are more difficult to tax. Urbanization
increases the need for tax revenues as well as the capacity to tax. Along with a greater
urbanization arise a greater need for public services. At the same time as the urbanization
leads to an increased taxable base, as economic activity tends to be high in urban areas
(Khattry & Rao, 2002). In developing countries, the conditions are different as most of the
population lives in rural areas where workers often are employed in agriculture or in small-
scale, informal enterprises. Workers are seldom paid a regular fixed wage, their incomes

20
fluctuate and many are paid in cash, “off the books”. The informal sector is often three or four
times larger in developing countries compared to developed countries (Tanzi & Zee, 2001).
These features make the income base very difficult to assess, which makes it very difficult to
calculate an effective income tax. Moreover, rural economic activities are mostly conducted
to subsistence consumption and workers most often spend their earnings in smaller stores.
The stores do not tend to keep accurate records of sales and inventories, which makes it hard
to calculate and administrate consumers’ taxes (Tanzi & Zee, 2001). Finally, the high age-
dependency ratio, common in developing countries, also decreases the income tax base. The
active population working in the formal sector (the ones able to pay tax) is relatively small
and narrow (Khattry & Rao, 2002). Due to this limited domestic tax base, modern means of
raising revenue, such as income- and consumer taxes, only plays a diminished role for low-
income’s economies.
3.3.2 Institutional constraints Another important factor in collecting tax revenues are the institutional constraints.
Rudimentary tax administration, which is often the case in most developing countries, make
the assessment of tax liabilities difficult to accomplish. It is difficult to establish an efficient
tax administration without a well-educated and well-trained staff, especially when there is a
lack of money to pay good wages to tax officials or to authorize the operation (Tanzi & Zee,
2001). This, together with, the trend of underpaid tax administrators to be corrupt and the
tendency of tax payers not paying their taxes, makes domestic taxes a suboptimal way of
collecting revenues. Trade taxes, however, normally requires only a small administration
stationed at the boarder and, unless taxes are so high as to encourage smuggling, trade taxes
are relatively easy to administer (Khattry & Rao, 2002). The administration of domestic
taxation has proved to be more costly than the administration of customs and excise duties.
The collection cost (i.e. the direct labour needed to administer and guarantee compliance) as
well as the resource cost incurred by taxpayers in their efforts to minimize tax payments, are
lower for trade taxation than for domestic taxation (Khattry & Rao, 2002). Trade taxes are
thus a much more effective way for low-income countries to collect revenues. Due to these
conditions, governments often choose less efficient tax systems that allow them to exploit
whatever options available for collecting revenues rather than create sustainable tax systems
(Tanzi & Zee, 2001).

21
A further implication of weak institutions is that it allows rich powerful taxpayers to prevent
the establishment of an efficient tax system (Tanzi and Zee, 2001). A desirable feature of tax
systems is to stress on redistribution of income and wealth. In developing countries where
income tends to be unevenly distributed, an effective tax system would be a very effective
way to achieve equity. Ideally, the rich would be taxed more heavily than the poor with high
rates on luxuries and low rates on necessities. Mounting need for resources and weak
institutions are two reasons to why that is not the case in most developing countries, where
the poor face a disproportionate tax burden. Weak institutions allow rich taxpayers with
political power to prevent such a system to avoid their tax burden to increase. This explains in
part why most developing countries have not fully established personal income and property
taxes with a satisfactory progressivity, where poor should pay proportionally less taxes (Tanzi
and Zee, 2001).

22
4. Fiscal effects of the EPAs
This chapter will present the direct and indirect fiscal effects of implementing EPA. The
effects of EPAs that are being examined are foremost the effects of the trade liberalisation;
referred to as the reduction of taxes on trade, i.e. tariffs and other custom duties.
4.1. Tariff revenue loss Implementing EPA and liberalizing at least 80 percent of the imports from EU will lead to a
decrease in fiscal revenues for the ACP countries. The scale of the decrease will depend on
two aspects. Firstly, the direct effect of eliminating taxation on “substantially all” the EU
imports as they enter the ACP markets will lead to reduced tariff revenues. The severity of the
revenue shortfalls depends on the initial trade value and tariff level as well as the size and
mode of the tariff cut. The more liberal a trade regime is prior to an EPA, the lower the
decrease in revenue as a result of an EPA (Bilal & Roza, 2007).
Secondly, the indirect effect of revenue losses relates to the effect of trade diversion. As
discussed previous, the EPAs, can lead to trade diversion. As the gap between the MFN tariff
and the tariff on EU imports will increase through the implementation of EPA, duty-free EU
products will, to some extent, replace taxed imports from other suppliers. The trade diversion
implies a loss in tariff revenues for the ACP countries. Each replaced commodity is a loss in
tariff revenues (Bilal & Roza, 2007). The severity of the losses depends on the domestic
consumers’ elasticity of substitution. The elasticity determines how likely it is for the import
to be substituted. The elasticity varies between countries and commodities. Homogenous
products are more likely to be substituted, e.g. raw materials, compared to less homogenous
products such as manufactured or agricultural goods (Busse et al. 2004). The exact level of
elasticity is difficult to estimate hence the effect on tariff revenues due to trade diversion is
hard to predict.

23
4. 2. Fiscal effects of the liberalisation of the EPAs
4.2.1 Economic growth As discussed earlier in chapter 3.2, liberalisation is, according to the trade theory, predicted to
enhance economic growth. This potential economic growth would broaden the domestic fiscal
base as income rates and national income increase. A broader domestic fiscal base will
generate fiscal revenues, notably in form of income and consumption tax or other domestic
taxation. These revenues could compensate for the tariff revenue loss and thus, mitigate (or
cover, depending on the scale of it) the possible negative effect of liberalisation (Bilal &
Roza, 2007).
In addition to the direct effect of trade after a liberalisation, there are more effects of the EPAs
that can boost the ECOWAS countries’ growth rates. Firstly, due to the favourable access to
the EU markets, the ECOWAS countries may attract higher inflows of foreign direct
investment (FDI) that will increase the countries’ capital stock. This creates incentives for
multinational enterprises (MNEs) to use the ECOWAS countries as an export location to
serve EU markets as well as other African markets (Busse et al. 2004). Secondly, as a
consequence of increased trade volumes, the EPA as well as FDI has the potential to create
technological spillovers between the EU and the ECOWAS countries. Specific policies to
foster scientific interchange may also be in place to promote spillover-effects (Busse et.al.
2004). Finally, the increased competition and decreased protection levels may force domestic
firms to become more innovative in order to increase their competitiveness. It creates
incentives to innovate, which leads to a more efficient resource allocation regarding research
and development activities (Busse et al. 2004). All these possible effects will increase growth
rates in ECOWAS countries, that is, if the effects occur.
4.2.2 Increased volume of imports Another possible positive fiscal effect that may arise as a result of trade liberalisation is the
possible increased volume of imports. The EPA stipulates tariffs to be removed during a
“reasonable length of time”, meaning they do not have to be removed overnight but during a
transition period. As tariffs are being phased down during the transition period, a temporary
increase in imports and thus a temporary increase in tariff revenues may occur. Lower prices
on import could increase the import demand. If the increase in imports (including the extra
tariff revenues it gains) is greater than the tariff cut (and therefore also the loss on tariff

24
revenue) then the total sum of tariff revenues could be greater than before the cut. This
possible temporary increase in revenues depends on the elasticity of substitution on the
imports and will only be possible if consumers are willing to buy more of the imported
commodity that is now offered at a lower price (Bilal & Roza, 2007). Moreover, the
temporary increase also depends on the initial tariff rate level. Countries with relatively open
markets will not experience such an increase in trade tax revenues (Karingi et al. 2005).
However, there is a point at which lowering of tariffs will make revenues to fall. The
temporary increase stagnates when the loss in tariff revenues (due to tariff cuts) exceeds the
increased tariff revenues from the increased volumes of import. The temporary increase in
revenues plays a significant role by financing the complementary domestic reforms, crucial
for avoiding a fiscal shock. This shows the importance of a transition period during
liberalisation in order to be able to obtain this temporary increase (Bilal & Roza, 2007).
Due to the possibility of attaining higher growth rate as an effect of EPAs, some of the
increased tariff revenues are not temporary. Higher growth rates lead to increased volumes of
imports from EU as well from the ROW. The long run positive effect on tariff revenues
depends mostly on the size and growth rate on the latter, since “substantially all” European
products will be duty free in the end on the transition period (Busse et al. 2004).
A final example of a possible positive fiscal effect of the EPAs, as discussed by Bilal and
Roza (2007), the high pressure on fiscal revenues. Due to the reduction of tariffs may force
ACP governments to undertake substantive administrative and fiscal reforms in order to
improve the, often deficient, efficiency of the taxation and administration. These actions will,
if successful, generate higher domestic tax revenues.
4.2.3 Possible negative effects The EPA has also triggered many fears and concerns. Hallaert (2010) raises concerns related
to the possible social and development repercussion. He argues that EPAs, due to the
significant loss in tariff revenues, may lead to social repercussion and can have a negative
impact on human rights and poverty. Moreover, development repercussion can arise if local
farmers and producer will not be able to face the increased competition from EU and are
therefore forced to reduce their output. If so happens, ACP countries risks to remain in old

25
patterns with farming as their main source of income since the EPAs will not give room for
other infant industries to develop (Karlsson et al. 2009).
Further, a third type of concern regards the fiscal and macroeconomic stability for some ACP
countries, which could be jeopardize by a sharp fall in government revenues due to the losses
in tariff revenue (Hallaert, 2010). The effect will be most severe for countries whose
government revenue is highly reliant on tariff revenue and with few means to compensate the
loss with domestic taxation. A considerable decline could affect the ACP government’s
abilities to provide public goods and their abilities to meet the large development and social
need (Busse et al, 2004). This could actually hinder them from achieving the millennium
development goals.
The possible positive welfare effects, discussed above, that arise from lower prices on imports
commodities in line with the elimination of trade taxes, will only occur if the EU exporters
decide not to rise their export prices. If the EU exporters decide to increase their export prices,
i.e. are “pricing to market”, the market price would be left unchanged hence increasing their
own profit (Busse et al, 2004). As a result, the gains from liberalisation will not be passed
down to the ACP firms that import inputs nor to the ACP consumers and the competition
impact will not be as extensive. Since competitiveness is one major source of potential
economic growth from liberalisation, exporters price setting could limit the additional
revenues associated with economic growth (Hallaert, 2010). This outcome is generally more
likely to take place in less competitive markets where the degree of competition is less severe
hence suppliers can set their prices regardless of others (Busse et al, 2004).
4.3 Measures to avoid a fiscal shock due to lost tariff revenues. Even if economists have different opinions to which extent the EPAs will affect the ACP’s
economies, they all agree that the implementation of EPAS will lead to fiscal challenges for
the ACP governments. To avoid a fiscal shock and for the trade reform to be successful it
needs to be supported by complementary policies. Trade liberalisation should therefore be
implemented in combination with other reforms (Busse et al, 2004).

26
4.3.1 The VAT It is widely accepted that there is a need for a broader shift of taxation toward domestic taxes
(Elborgh-Woytek, Hallaert, Lankes, Sadikov & Smith, 2006:21). The most effective and
favourable way for developing countries to do this is by introducing a value-added tax (VAT).
A VAT is commonly defined as “a broad-based tax levied at multiple stages of production
(and distribution) with – crucially – taxes on inputs credited against taxes on output” (Bird &
Gendron, 2007:10). The VAT requires sellers to charge the tax on all their sales and it lets
them claim a credit for the taxes they paid on their inputs. This has made the VAT the most
important single tax in many developing countries since it ensures tax collection throughout
the production process without distorting production decisions (Bird et al, 2007).
Unlike custom duties which are only levied on imports, VAT is levied on both domestically
produced and imported goods. In principle, this makes it possible to generate more income
from VAT than the revenue lost as a result of the elimination of tariffs. If the VAT rate is set
identical to the import duty rate, consumers will face the same price, hence, no decrease in the
total welfare (Bilal & Roza, 2007). The potential higher revenues could be used by
governments to ease the transition costs on those segments of the population that stand to lose
the most from the elimination of tariffs (Bilal & Roza, 2007).
However, there are major concerns about the administrative challenges countries need to
conquer if they are to implement a successful VAT system. As mentioned before, domestic
VAT collection requires more administrative capacity than collection of trade taxes (Bilal &
Roza, 2007). It has been shown that most developing countries do not manage to collect their
VAT efficiently, leading to levels of VAT income beyond expectations (Karingi et al. 2005).
4.3.2 Complementary measures Busse et al (2004) writes about further complementary measures required to ease the inter-
sectoral adjustment process and elimination of trade barriers. One typical adjustment policy
involves inter alia labour market reforms that improve the mobility of the labour force both
within and between industries. Education- and training programmes are also implemented to
provide qualified employees for export-oriented businesses. Moreover, there will probably be
a need of establishing social safety nets to compensate displaced workers and to provide a
minimal standard of living to the poor. Busse et al’s (2004) final advise is that the ACP
countries explicitly should ask the EU to provide grant-financing support for tax and fiscal

27
reforms until the reforms are completed. Nielsen et al (2007) argues that the length of the
implementation periods give the countries time to introduce these complementary measures.
4.3.3 Opening up markets -‐ Exclude products The trade barriers will be eliminated gradually over approximately a 10-year period which
will give the ACP countries time to establish a timetable for a progressive removal. The
timetable helps the countries to adjust and introduce compensatory measures to handle
increased competition from the EU to minimize the economic and social turbulence (Busse et
al, 2004). The transition period could significantly mitigate the negative fiscal effect of an
EPA (Nielsen et al, 2007).
A further method to limit the fiscal impact of an EPA is to select the products that generate
the most revenues. The products that have been assigned as the ones generating most revenue
are to be marked as so-called sensitive products. (Only 80 percent of the value of its import
from EU needs to be liberalised under the EPA, leaving 20 percent to be excluded and marked
as sensitive products). By excluding the top 20 percent of the imports with the highest tariff
lines, ACP governments can continue to levy tariffs on these most sensitive products. In doing
so, the governments will maximize the tariff revenues while complying with WTO and EPAs
and limit the fiscal shock (Bilal & Roza, 2007).
However, the method entails severe shortcomings and weaknesses. Firstly, countries negotiate
the EPAs in groups, they all need to agree what product to include and exclude on the list,
which means that they cannot please everyone’s wills. Secondly, the calculations are difficult
to do and may prove to be incorrect and thus ineffective in minimizing the negative fiscal
effects of an EPA, Finally, it leaves out trade and industrial policy consideration. There may
be other considerations than safeguarding fiscal revenues when excluding products, such as
keeping tariffs for sheltering infant industries and so on (Hallaert, 2010).
4.4 A fiscal shock or not? Weather the possible positive effects on fiscal revenues will counterbalance the possible
negative effects on fiscal revenues by implementing EPA and the liberalisation following it,
have been heavily debated. There are those who are more optimistic and there are those who
are not as optimistic. Elborgh-Woytek et al. (2006) belong to the first group, their study

28
simulate multilateral trade liberalization measures on a group of low-and middle-income
countries. Their results show that most countries will face only minor fiscal pressure, likely to
be mitigated by second-round effects. By second-round effects they mean positive effects of
reducing tariffs, such as higher import volumes, shift of demand to products with higher tariff
rates due to an income effect and increased revenues as a result of higher economic growth. A
few countries may have to consider complementary reforms, such as a shift of taxation
towards domestic taxes. Ebrill, Stotsky and Gropp (1999) study on the impact of trade
liberalization on trade revenue using panel data also find that tariff reforms have not resulted
in declining trade revenue, also belong to the more optimistic group. However they put more
emphasize on the importance of strengthen the domestic tax system when liberalizing, to
avoid “difficult fiscal issues”.
Among the less optimistic studies, one finds Khatty and Rao’s study from 2002. They use a
panel of 80 developing and industrialized countries over 1970-98 and their results show that
liberalization has imposed substantial fiscal costs for developing countries. They argue that
the transition from trade taxes to domestic taxes is not always possible for many developing
countries due to structural and institutional constraints that hinder them. They emphasize the
need for internal structure policies rather than external integration policies for the
development process in low-income countries. Baunsgaard and Keen’s (2005) results
strengthen Khatty and Rao’s results. Baunsgaard and Keen uses panel data for 111 countries
over 25 years to investigate if countries faced with revenue loss due to liberalization have
recovered from other sources. The results show that revenue recovery for low-income
countries has been extremely weak. There is no evidence that the presence of a VAT makes
any significant difference to the degree of recovery in short-term.

29
5. An empirical assessment of the fiscal effects
This chapter presents and analyzes collected data of current trade patterns, tariff levels and
tariff revenue figures specific to the EU, the ECOWAS and the ROW, with the purpose to
determine the reliance on tariff revenues for ECOWAS countries. The concluded section of
this chapter analyzes whether the present level of tariff revenues for ECOWAS countries is
affecting their willingness to sign and thus the negotiations.
5.1 Data The data on tariff levels and import values has been collected from the World Integrated
Trade Solution (WITS) system which utilizes the Trade Analysis and Information System
(TRAINS) database of the United Nations Conference on Trade and Development. Data on
GDP and government revenues has been collected from the World Bank database.
In addition to current trade patterns, the study also presents tariff levels and tariff revenue
figures specific to the EU, the ECOWAS and the ROW. The ROW group consists of the
nations that are not members of the EU or the ECOWAS. It is a large group of countries but
the purpose of the ROW group is having something to compare the EU group with. The size
of the ROW group is not an issue considering that the focus of this paper is the ECOWAS
countries’ relation to the EU.
For a comprehensive picture of the level of reliance, seven sectors will be observed based on
the HS-combined standard product groups; Capital goods, consumer goods, intermediate
goods, raw materials, agricultural, industrial and petroleum. Due to lack of data on tariff
levels and tariff revenues for Burkina Faso, Liberia and Mauritiania, these countries will not
be observed.
5.2 ECOWAS Regional economic integration is not easy even in the best of circumstances, and for countries
in West Africa, integration has been pursued in extraordinarily difficult conditions. The West
African countries have weak public institutions and are among the poorest countries in the
world. Out of the fifteen members only four are non-LDCs – Cape Verde, Cote d’Ivoire,

30
Ghana and Nigeria. Moreover, the region has suffered from a disproportionate number of
devastating civil conflicts, affecting Cote d’Ivoire, Guinea-Bissau, Liberia and Sierra Leone
amongst others. These conflicts together with poor conditions made it very difficult to achieve
economic integration in the region (Nielsen et al, 2007).
ECOWAS was established by the Treaty of Lagos in 1975, with the objective of promoting
economic integration in all fields of economic activity (Busse et al, 2004). The community
also serves as a peacekeeping force, assigned with the responsibility of preventing and solving
regional conflicts. The ECOWAS has had greater results on the political field compared to
that of economic integration, where results have been slower in coming. One example of this
is that free trade has been very limited (Nielsen et al, 2007).
In 1994, a subgroup of seven member countries, Benin, Burkina Faso, Cote d’Ivoire, Mali,
Niger, Senegal and Togo, established the West African Economic and Monetary Union
(WAEMU). Guinea-Bissau later joined in 1997. Through sharing the same currency, the CFA
franc, these countries were expected to obtain a faster and deeper sub-regional integration
than the broader ECOWAS membership. In 2000, a customs union was established among the
WAEMU countries. Tariffs on intra-WAEMU trade were eliminated and a common external
tariff (CET) on imports from outside the WAEMU area was established (Nielsen et al, 2007).
5.3 Trade pattern
5.3.1 Export -‐ Economical structure The members of the ECOWAS form a diverse group in terms of political and economical
characteristics. Most Western African countries have specialised and undiversified economies
(see Appendix 1), which often is the case for ACPs. Almost all of the member countries are
highly specialised in one of the three sectors presented in Appendix 1, agricultural products,
fuels and mining products and manufactures. Senegal is the only country that has a somewhat
diversified production, with manufactures as their most important export product. Most of the
countries, except for Guinea, Niger, Nigeria and Togo, are specialised in agricultural
products. Senegal and Togo are the only countries that have manufactures as their most
important export product. A fairly large share of the exports of Cape Verde and Gambia’s are
manufactured products but it is neither country’s main export goods. Only Guinea, Niger and
Nigeria have fuels and mining products as their main export. The diversity of specialisation

31
among the member countries shows how diverse a group the ECOWAS countries form in
terms of economical structure.
Because of undiversified economies, the region is highly dependent on exogenous factors
such as price fluctuations, changes in importing countries’ policies and climate changes
(ECDPM, 2006). To be highly dependent on exogenous factors always involves a risk. Not
being able to affect exogenous factors puts the government and the economy in a vulnerable
position. Imports from the EU play a significant role for the ECOWAS countries. The EU is the main
exporter to all the ECOWAS countries. An average of 37 percent of the ECOWAS total
import originates in the EU, Mali accounts for the lowest rate with 24 percent and Cape Verde
has the highest with 79 percent.
5.3.2 Import Looking at the breakdown of imports by sector for the ECOWAS countries, as illustrated in
table 3, the largest share of imports is made up of industrial goods (36,9 percent), followed by
consumer goods, intermediate goods and capital goods on second, third and fourth place
respectively. Considering that most of the ECOWAS countries are specialised in agriculture,
these figures come as no great surprise. The least important import sector, by size, of the
ECOWAS is raw materials (3,8 percent). Moreover, the majority of the ECOWAS’s imports
(47,4 percent) originates in countries in the ROW, 37,7 percent originates in the EU and 15,5
percent is imported from other ECOWAS members. Looking at each sector, the ROW is the
main exporter in all cases except for petroleum products where the EU is the main exporter.
However, the EU’s share of the ECOWAS total import is the largest in relation to size. The
EU plays a significant role for ECOWAS as their main source of imports.

32
Table 3 Average ECOWAS import by sector in percent, 2010
TOTAL import
Import from EU in % of
total import
Import from ECOWAS in
% of total import
Import from ROW in % of total import
Capital goods 9,7 4,4 0,1 5,1 Consumer goods 22,6 8,6 3,2 10,8 Intermediate good 10,0 2,8 1,2 5,9 Raw materials 3,8 1,0 1,5 1,3 Agricultural 9,2 2,9 0,8 5,5 Industrial 36,9 14,0 5,3 17,6 Petroleum 7,9 3,3 3,3 1,2 Total 100,00 37,1 15,5 47,4 Source: Own calculations based on data from WITS on import values
Considering the diversity of economical structure among the ECOWAS countries, average
rates of import patterns can be somewhat misleading which makes it interesting to look at
each country’s individual import patterns as in appendix 3. However, the rates from appendix
3 shows that the import patterns between the ECOWAS countries are rather homogenous, in
contrast to their diverse economical structures. All countries have industrialised goods as their
main import goods. They all, except for three countries, Cote d’Ivoire, Ghana and Nigeria,
also share consumer goods as the second largest import category. Differences between the
countries are first starting to show at the third most important import, but they still stay quite
homogenous.
The EU’s share of imports originated in the ACP region, accounts only for 2,5 percent, with
West Africa accounting for half of these imports (Fontagné, 2010). When examining the trade
relations between the EU and the ECOWAS it is clear that, in these negotiations, the stakes
are far higher for the ACP than for the EU.
5.4 Tariffs For determining the present tariff levels in ECOWAS countries, trade-weighted average
tariffs have been used. The definition of a trade-weighted average tariff is the average of a
country’s tariffs, weighted by the value of imports. This is calculated as the ratio of the total
tariff revenue to total value of imports (Suranovic, 2010).

33
To measure a country’s level of protection, trade-weighted average tariffs are thought to be
more effective than a simple average tariff. Simple average tariffs are calculated as the sum of
all the tariff rates divided by the number of import categories. The problem with using simple
average tariffs arises when a country has most of its trade in a few categories with low tariffs
and a high level of tariffs in many categories were the level of trade is low or non existing. In
this scenario, the average tariff would overestimate the level of protection in the country,
since it does not take into account the level of imports in each category. By using a trade-
weighted average tariff this problem can be avoided, since it weights each tariff by the import
value. Thus, in the scenario described above, the trade-weighted average tariff would indicate
a low degree of protection. However, this rate may be too low, as trade-weighted tariff is
neither a faultless method but rather one with a tendency to underestimate high tariffs since
high tariffs lead to lower import values (Suranovic, 2010). However, for calculations on tariff
revenues, carried out later on in this chapter, trade-weighted average tariff is the ideal tariff to
use. To get the levels of tariff revenues, simply multiply the weighted average tariff with the
import value.
5.4.1 Tariff levels The tariff levels towards the EU and the ROW are fairly even for all of the ECOWAS
members; there is no gap greater than two percentage units between the two tariff levels. For
seven of the countries, the tariff level towards the ROW is higher than the level towards the
EU. For the rest of the members, the tariffs toward the EU are greater then those toward the
ROW. The rates on tariffs towards other ECOWAS members accounts for the lowest tariff
rates in all ECOWAS countries except for in the Gambia and Nigeria, where they constitute
the highest rates. This means that in average, the tariffs in ECOWAS countries facing the
ROW are higher than the ones facing the EU.

34
Figure 2 Weighted average tariff levels in percent, 20102
Source: WITS Figure 3 Weighted average tariff levels in percent, 2010
Source: WITS
In appendix 3 with the breakdown of tariff levels by sectors, looking at the average tariffs in
bold one can see that the ECOWAS countries’ highest tariff rates targets consumer and
intermediate goods and the agricultural and industrial sectors. This is true for the tariff
settings towards all three entities. However, there are some differences between the entities
2 Tariffs for Gambia, Ghana and Guinea presented in this chapter, are from 2009 due to lack of data.

35
regarding the tariff settings on other sectors. Tariffs on capital and petroleum goods tend to be
higher towards other ECOWAS members than towards the EU and the ROW. Further, tariffs
on raw material are significantly higher towards the EU and the ROW than between the
ECOWAS countries.
Considering that the three most important import industries for ECOWAS countries in
average is industrial, consumer and intermediate goods, illustrated in appendix 3, the high
tariffs targeting these sectors are most likely be set with the purpose of raising revenue.
For all members of the ECOWAS, except for the Gambia and Nigeria, the agricultural sector
accounts for the highest tariff levels facing the EU (second highest for Cote d’Ivoire and
Mali). Considering the economic structure of most ECOWAS countries, with a high reliance
on agricultural production and the primary import being manufacturing goods, one could
argue that the high tariff levels most likely are set with the purpose of providing protection for
the domestic markets from cheaper imports from the EU. As illustrated in table 3, agricultural
imports originating in the EU does not account for a large share of the total import of most
ECOWAS countries. Most likely, the high tariffs on agricultural products are keeping the
agricultural import from the EU down.
Regarding the development of the tariff levels for ECOWAS countries, illustrated in appendix
5 and 6, the tariff levels towards the EU and the ROW have been constant on a 10 to 15
percentage level and have not changed much over the last decade. Ghana and Nigeria are the
only two countries that have made any significant changes by decreasing their tariff levels
towards both the EU and the ROW. The development of the tariffs between the ECOWAS
members themselves has been more varied. In 2005, there was a significant decline in tariff
levels in almost all of the ECOWAS countries. In average, the countries’ tariff levels
decreased with 5 percentage units and landed on approximately a 2 to 7 percentage level.
Considering the steady level of tariffs facing the EU and the ROW for the last decade, the
ECOWAS countries seem to have found a tariff level that pleases them and if it wasn’t for the
EPAs one can see no sign of the ECOWAS countries thinking of liberalising the trade
towards the EU and the ROW. The liberalisation towards the EU, following the EPA, will
therefore be a new experience for the ECOWAS countries.

36
5.4.2 Tariff revenues The reliance on tariff revenue is significant for ECOWAS countries, in average tariff revenues
accounts for 53 percent of total government revenue (see table 8). Tariff revenues from EU
represent an important source of government revenue; the average rate of tariff revenues
generated from EU imports is 3,76 percent of GDP and 18,13 of total government revenue is
(see table 5). The most significant levels of reliance can be observed for Togo (with the
highest rate on 40,9 percent) Benin (28,4 percent), Cape Verde (28,0 percent) and Guinea-
Bissau (25,7 percent). The midlevel, regarding the level of reliance, constitutes of Cote
d’Ivoire (17,8 percent) and Senegal (17,5 percent). Countries with the lowest rates, but still
with a significant reliance on tariff revenues are Ghana (10,9 percent) Mali (9,7 percent),
Burkina Faso (7,3 percent), Nigeria (7,1 percent) and Niger (6,3 percent).
Table 4 Tariff revenue indicators - EU import in percent, 20093
Tariff revenues in % of
GDP Tariff revenues in % of total government
revenue
Benin 5,0 28,4
Burkina Faso 1,4 7,3
Cape Verde 7,5 28,0
Cote d'Ivoire 3,4 17,8
Gambia 6,3 -
Ghana 1,7 10,9
Guinea 7,5 -
Guinea-Bissau 3,3 25,7
Mali 1,7 9,7
Niger 1,4 6,3
Nigeria 0,8 7,1
Senegal 3,3 17,5
Togo 5,8 40,9
Average 3,8 18,1 Source: Own calculations based on data from WITS and World Bank database
3 Due to lack of data are following country values not from year 2009. Guinea-Bissau 2005, Niger 2007, Nigeria 2008, Senegal 2003.

37
As can be seen in table 4, the top three most significant sectors, in terms of generating the
most tariff revenues from EU imports, are consumer goods (5,77 percent), the industrial
sector (4, 67 percent) and the agricultural sector (2,13 percent). These figures are average
rates and are therefore not true for all of the West African countries. However, all countries
generate most tariff revenues from the same sectors; consumer and industrial goods. As their
third most important sector in terms of generating tariff revenues, two sectors are observed (i)
the agricultural sector for Benin, Cape Verde, Cote d’Iovire, Guinea-Bissau, Senegal and
Togo, and (ii) capital goods for Burkina, Faso, Ghana, Mali and Niger. Nigeria is the only
country that has intermediate goods as part of their top three most important sectors, in terms
of generating revenues. Regarding the rest of the sectors, capital, intermediate, petroleum and
raw materials, their average rates are ranging between 1,20 percent and 0,59 percent.
The industrial sector and consumer goods have been observed, earlier in chapter 6.3.2, to be
two of the main import categories from the EU and they also account for the two highest
levels of tariffs facing the EU. The fact that these sectors generate the most tariff revenues is
therefore no great surprise, and it strengthens the earlier argument that the high tariff rates on
industrial and consumer goods facing the EU are set with the purpose of raising government
revenue.
Furthermore, observing the low levels of revenues generated from the raw material sector.
These figures are, just like the high reliance on industrial and consumer goods, also logical,
due to the small share of the total import that raw materials constitute (see table 3) combined
with its low tariff rates (see appendix 4).

38
Table 5 Tariff revenues in % of government revenue, from EU imports 2009
Good Benin Burkina
Faso Cape Verde Cote
d'Ivoire Ghana Total
average Capital 1,62 1,15 1,58 1,21 1,41 1,20
Consumer 8,15 1,77 10,36 2,85 2,24 4,67
Intermediate 1,48 0,55 1,02 1,96 1,41 1,18
Raw materials 2,41 0,12 0,67 1,44 0,33 0,59
Agricultural 3,92 1,00 5,02 2,57 1,06 2,13
Industrial 9,76 2,60 8,60 7,66 4,35 5,77
Petroleum 1,09 0,04 0,73 0,07 0,10 1,02
SUM 28,42 7,25 27,98 17,76 10,90 16,56
Average 4,06 1,04 4,00 2,54 1,56 2,37 Source: Own calculations based on data from WITS and World Bank database Table 6 Tariff revenue in % of government revenue from EU imports 2009
Good Guinea-Bissau Mali Niger Nigeria Senegal Togo
Total average
Capital 0,83 1,49 0,97 0,79 1,71 2,12 1,20
Consumer 8,72 2,11 1,33 1,16 4,41 12,61 4,67
Intermediate 1,08 1,13 0,76 1,34 1,41 2,24 1,18
Raw materials 0,29 0,11 0,07 0,22 0,98 0,81 0,59
Agricultural 4,07 0,73 0,83 0,70 2,37 3,47 2,13
Industrial 6,86 4,14 2,31 2,81 6,17 14,30 5,77
Petroleum 3,81 0,02 0,00 0,11 0,45 5,30 1,02 SUM 25,66 9,74 6,27 7,13 17,51 40,85 16,56 Average 3,67 1,39 0,90 1,02 2,50 5,84 2,37
Source: Own calculations based on data from WITS and World Bank database
Comparing tariff revenues generated from the EU, the ROW and the ECOWAS, in table 7,
industrial and consumer goods are observed to be the most important sectors in terms of
generating the most tariff revenues from all three entities. Regarding the other sectors, the
relevance of the sectors is depending on the origin of the imports. E.g. looking at the tariff
revenues from ECOWAS imports, petroleum contributes the third most important sector
whereas in relation to imports from the EU and the ROW it contributes the second least and
least important sector, in terms of generating tariff revenues.

39
Observing the ratios in the end of table 7, one can see that from the total amount of revenues
generated from tariffs, revenues generated from trade with the EU accounts for 34 percent,
whereas revenues from the EU and the ECOWAS accounts for 60 percent respectively 7
percent. Looking at table 8 and 9 one can see that for four countries; Burkina Faso, Cape
Verde, Guinea-Bissau and Senegal, is it revenues from EU imports that account for the largest
share.
Considering the great difference in terms of number of countries in the EU compared to the
ROW, 34 percent is a significant share of the total amount of tariff revenue, hence tariff
revenues from the EU play a significant role for the ECOWAS countries.
Table 7 Average tariff revenue in % of government revenues for all ECOWAS countries, 2009 EU ROW ECOWAS Capital goods 1,35 (4) 1,78 (5) 0,05 (7) Consumer goods 5,07 (2) 7,23 (2) 1,23 (2) Intermediate good 1,31 (5) 5,60 (3) 0,22 (4) Raw materials 0,68 (7) 0,53 (6) 0,08 (6) Agricultural 2,34 (3) 2,63 (4) 0,25 (5) Industrial 6,32 (1) 12,86 (1) 1,34 (1) Petroleum 1,06 (6) 0,40 (7) 0,63 (3) Sum 18,13 31,02 3,80 Sum in percent 0,34 0,60 0,07 Source: Own calculations based on data from WITS and World Bank database

40
Table 8 Breakdown of tariff revenues in percent of government revenues by sector and import origin
Capital goods
Consumer goods
Intermediate good
Raw materials Agricultural Industrial Petroleum Sum
BENIN EU 1,62 8,15 1,48 2,41 3,92 9,76 1,09 28,42 ECOWAS 0,00 0,51 0,02 0,00 0,00 0,53 0,44 1,50 ROW 4,19 27,57 26,10 0,83 7,15 51,63 2,69 120,17 total 5,82 36,23 27,60 3,24 11,07 61,92 4,21
BURKINA-FASO
EU 1,15 1,77 0,55 0,12 1,00 2,60 0,04 7,25 ECOWAS 0,02 1,47 0,05 0,01 0,00 1,55 1,14 4,25 ROW 0,73 0,84 0,26 0,03 0,28 1,57 0,00 3,71 total 1,91 4,08 0,87 0,16 1,28 5,73 1,19
CAPE VERDE
EU 1,58 10,36 1,02 0,67 5,02 8,60 0,73 27,98 ECOWAS 0,01 0,22 0,01 0,00 0,12 0,12 0,01 0,50 ROW 0,55 2,44 0,08 0,64 1,48 2,24 0,01 7,45 total 2,14 13,02 1,11 1,31 6,63 10,97 0,74
COTE D'IVOIRE
EU 1,21 2,85 1,96 1,44 2,57 7,66 0,07 17,76 ECOWAS 0,00 0,12 0,06 0,36 0,05 0,55 0,04 1,18 ROW 1,18 4,61 2,70 1,91 3,56 10,59 0,11 24,65 total 2,39 7,58 4,71 3,71 6,18 18,80 0,22
GHANA
EU 1,41 2,24 1,41 0,33 1,06 4,35 0,10 10,90 ECOWAS 0,02 0,17 0,29 0,02 0,07 0,41 0,05 1,02 ROW 1,59 6,55 4,07 1,28 4,07 9,43 0,04 27,02 total 3,02 8,95 5,76 1,64 5,20 14,19 0,18
Source: Own calculations based on data from WITS and World Bank database

41
Table 9 Breakdown of tariff revenue in percent of government revenue by sector and import origin
Capital goods
Consumer goods
Intermediate good
Raw materials Agricultural Industrial Petroleum Average
GUNIEA-BISSAU
EU 0,83 8,72 1,08 0,29 4,07 6,86 3,81 25,66 ECOWAS 0,13 5,33 1,11 0,14 2,05 4,66 1,12 14,54 ROW 0,29 2,19 0,55 0,07 1,28 1,83 0,42 6,63 Total 1,25 16,25 2,73 0,51 7,40 13,35 5,35
MALI
EU 1,49 2,11 1,13 0,11 0,73 4,14 0,02 9,74 ECOWAS 0,04 3,40 0,15 0,03 0,02 3,59 3,08 10,30 ROW 2,32 5,43 2,09 0,05 1,81 8,11 0,03 19,85 Total 3,85 10,94 3,38 0,19 2,56 15,84 3,13
NIGER
EU 0,97 1,33 0,76 0,07 0,83 2,31 0,00 6,27 ECOWAS 0,25 0,85 0,61 0,16 0,29 1,57 0,00 3,73 ROW 1,17 4,90 0,82 0,06 3,31 3,66 0,00 13,92 Total 2,40 7,08 2,19 0,30 4,43 7,53 0,00
NIGERIA
EU 0,79 1,16 1,34 0,22 0,70 2,81 0,11 7,13 ECOWAS 0,00 0,10 0,06 0,01 0,03 0,15 0,02 0,38 ROW 1,52 2,21 2,31 0,52 0,94 5,48 0,10 13,09 Total 2,32 3,47 3,72 0,76 1,68 8,44 0,23
SENEGAL
EU 1,72 4,41 1,41 0,98 2,37 6,17 0,45 17,51 ECOWAS 0,01 0,68 0,36 0,15 0,57 0,63 0,08 2,48 ROW 0,65 3,97 1,55 0,56 3,09 3,64 0,18 13,64 Total 2,38 9,07 3,32 1,69 6,03 10,44 0,70
TOGO
EU 2,12 12,61 2,24 0,81 3,47 14,30 5,30 40,85 ECOWAS 0,09 1,43 0,03 0,11 0,11 1,56 1,07 4,40 ROW 5,97 22,77 22,58 0,37 5,04 46,88 1,03 104,63 Total 8,18 36,80 24,85 1,29 8,62 62,75 7,40
Source: Own calculations based on data from WITS and World Bank database

42
Possibility of trade diversion
It is relevant to discuss the possibility of a trade diversion effect once EPA is implemented.
Just by looking at observed values, without doing an estimation, a few sectors and countries
are observed to face a higher risk of reduced tariff revenues, due to trade diversion.
Starting by looking at the tariff levels in appendix 4, one find that for each country there are a
few sectors where the tariff level toward the EU is higher than the tariff level toward the
ROW. Once an EPA is implemented, liberalising “substantially all trade”, EU tariffs will no
longer be higher than the ROW tariffs, as long as the tariffs toward the ROW stays
unchanged. Due to this, some commodities previously imported from the ROW will be
replaced with cheaper imports from the EU, how many is depending on the domestic
consumers elasticity of substitution. The greater the gap is between the tariff rates facing the
EU and the ROW when trade is being liberalised, the harder the effects are to predict. The
liberalisation toward the EU will not happen over a night, the tariff levels will in most cases
be phased down during a transformation period. This means that sectors where the gap
between the EU and the ROW tariff rates are large will not be faced with trade diversion in a
nearby future, since it might take time for the EU tariffs to be reduced to the ROW level. At
the time when the EU tariffs have reached the level of current ROW tariffs, the conditions
may have changed and the ROW tariffs may no longer be at the same level and trade
diversion may occur. Or the tariffs towards the EU might be drastically decreased to below
the ROW tariff, thereby creating trade diversion. A great gap between the tariff rates facing
the EU and the ROW, makes it therefore harder to predict the effects of a possible trade
diversion. However, if the tariff rates facing EU and ROW are on the same level today, the
possibility of trade diversion effects are much more likely to occur. Products earlier imported
from the ROW are likely to be substituted when facing lower tariffs toward imports
originating in the EU, leading to a loss in tariff revenue from the substituted ROW import.
To be able to say which countries and sectors that will face the highest risk of having their
tariff revenues reduced due to trade diversion effects, one must also look at the import
sectors’ relevance regarding the level of tariff revenues generated from trade. After looking at
appendix 4 and comparing the observations with the observations from table 8 and 9, some
sectors and countries stand out by facing the highest risk of loosing tariff revenues due to
trade diversion.

43
The sector facing the highest risk in most of the countries is the agricultural sector. The tariffs
toward the EU exceeds the tariffs toward the ROW in eight of the ECOWAS countries, hence
a trade diversion effect is possible. Cote d’Ivoire, Ghana, Niger, Senegal and Togo all observe
high rates on agricultural imports from both the EU and the ROW, in terms of tariff revenue
in percent of government revenue (see Table 8 and 9). In addition these five countries also
observe equal tariffs rates towards the EU and the ROW (see Appendix 4). Losses in tariff
revenue from the agricultural sector, due to trade diversion effect are therefore likely to be
quite extensive in these five countries. Regarding the elasticity of substitution, homogenous
products like agricultural products are less likely to be substituted (Busse et al, 2004). This
could hamper the possible loss in tariff revenues. However, the elasticity of substitution is
thought to be increased when it comes to substituting between imported goods. Domestically
produced goods and imports from other countries are less likely to be substituted compared to
imports from the EU and the ROW.
Country wise, Cote d’Ivoire is the West African country exposed to the highest risk of losing
severe amounts of tariff revenue due to a possible trade diversion effect. First off, the tariff
rates for the EU imports are higher than the ones facing the ROW in six out of seven sectors
(see appendix 4). Second, four of these tariffs, facing consumer, intermediate, agricultural and
industrial goods hardly differ at all towards the EU and the ROW (see appendix 4). Third, the
tariff reliance on these four sectors is high both regarding imports from the EU and from the
ROW (see table 8). These three features make Cote d’Ivoire highly exposed to trade diversion
and thus to possibly losing a fairly high share of tariff revenues.
Guinea-Bissau has, similarly to Cote d’Ivoire, also set their tariffs towards the EU with the
highest tariff rates in six of seven import sectors (see appendix 4). But Guinea-Bissau is
different from Cote d’Ivoire regarding the gap between the tariffs facing the EU and the
ROW, the greatest gaps are to be found in the sectors generating the most revenue (see table
9). Due to these great gaps, a possible trade diversion is harder to predict, hence the risk of
loosing tariff revenues is not as high for Guinea-Bissau as for Cote d’Ivoire.
Also worth mentioning is the petroleum sector. Facing almost perfectly even tariffs towards
the EU and the ROW (see appendix 4). It could have been a sector with a significant effect on
the possible tariff revenue loss, if it wasn’t for the sectors low level of significance regarding

44
tariff revenues (see table 8 and 9). Hence, the petroleum sector is not in the risk zone in terms
of losing high rates of tariff revenues.
These observations means that for ECOWAS countries, implementing EPAs can lead to that
the losses in tariff revenues can be more comprehensive than the ones predicted to be lost
from EU if the trade diversion effect occur.
5.4 Impact on negotiations
Our results show a significant reliance on tariff revenues for ECOWAS countries, with total
revenues accounted for 53 percent on average. Tariff revenues from the EU plays a significant
role and are observed to contribute with 18 percent out of the total government revenue (see
table 8). It is, however, questionable whether these results could have any impact on the
ECOWAS membership countries willingness to sign the EPAs and thus, affect the negotiation
process.
To mitigate the loss of tariff revenues that will occur by implementing EPA, the liberalisation
needs to be supported by complementary policies. There is a lot on stake for the ECOWAS
countries, their significant reliance on tariff revenues puts them in a vulnerable position The
complementary measures are, therefore, of greatest significance in order to avoid the revenue
losses to exceed the gains of EPA.
A certain level of institutional capacity is essential for the ECOWAS countries in the process
of implementing the complementary policies. High levels of reliance on tariff revenues are
often explained by weak and rudimentary institutions, which are characteristics common in
most developing countries. The easiest way for governments to raise revenue is therefore
through trade taxes since other domestic tax instruments have higher collection costs (Adam,
2009). Assuming that this is also true for ECOWAS countries, weak institutions will hamper
the ECOWAS countries possibilities’ to mitigate the fiscal negative effects that arise when
implementing an EPA. This is seen as the ECOWAS countries’ main concern regarding their
willingness to sign, since not being able to mitigate the loss of tariff revenues can lead to a
substantial decline in government revenue. Hence the ECOWAS countries must be concerned
and perhaps even feel a bit reluctant to sign an EPA. These concerns have been repeatedly
expressed by ACP countries, as mentioned in section 2.5, both regarding their lack of

45
institutional capacities as well as their need of financial support for adjustment costs (Bilal et
al, 2008).
The ECOWAS countries also possess other characteristics that would most likely affect their
willingness to sign the EPAs due their concerns of losing tariff revenues. Firstly,
undiversified economical structure (a characteristic for most ECOWAS countries) gives little
room for governments to control their economies and makes them highly dependent on
exogenous factor. Hence, they are very protective about the resources available in the country,
and the risk of experience decreases in revenues should make the ECOWAS countries more
reluctant to EPAs. A second impact on the ECOWAS countries’ willingness to sign the EPAs
relates to the possibility of the trade diversion effect and thus the risk of making the tariff
revenue loss more comprehensive than the one risked to be lost from EU imports. Thirdly, as
an alternative to signing the EPAs, the LDC countries of the ECOWAS can choose to
continue to trade under the EBA preferences, which offer them virtually the same access to
the EU market as under an EPA. However, the EBA are only unilaterally granted and can be
withdrawn at any moment. Further, the EBAs is currently an alternative that does not includes
any risk of reducing tariffs revenues, hence the ECOWAS countries tend to prefer these
agreements before signing an EPA. Finally, the asymmetric relationship between the EU and
the ECOWAS, in terms of the share of imports, originated from each other. Imports from EU
play a much more significant role for the ECOWAS countries than vice versa. There is a lot
more on stake for the ECOWAS countries than there is for the EU, which is most likely to
affect the members of the ECOWAS countries’ willingness to sign, especially compared to
the EU.
There are of course many reasons to why only a limited substantive negotiation progress has
been achieved so far in the EPA negotiations, e.g. various political reasons and issues
regarding the comprehensive EPAs not regarding the elimination of tariffs etc. It is therefore a
need for further research to be conducted in the area before one can give a definite answer.
The significant reliance on tariff revenues is, however, most likely to affect the members of
ECOWAS’ willingness to sign the EPA and thus also the negotiations.

46
6. Conclusion The negotiations of the EPAs have proved to be more difficult than expected. The
negotiations, planned to be concluded at the end of 2007, are still being negotiated for five out
of six regions negotiating the EPAs with EU. The purpose with this study was to determine
the level of reliance on tariff revenues for member countries of ECOWAS to analyse if the
present levels of tariff revenues in ECOWAS countries are affecting their willingness to sign
the EPAs and thus affecting the negotiations.
The observations show the significant role EU imports plays for ECOWAS countries, on
average 37 percent of ECOWAS total import originates from EU, were goods imported from
the industrial sector accounts for the largest share. Further, observation shows that tariffs
represent a significant source of government revenue for all the ECOWAS countries. In
average tariff revenues are observed to contribute with 53 percent of the total government
revenue, were tariff revenues from EU are accounted for 18 percent. In 2009 the highest rate
on imports from EU was observed for Togo on 41 percent and the lowest rate was observed
for Niger on 6,3 percent. Tariffs on consumer goods contribute with the highest amount of
revenues for/in all ECOWAS countries.
Considering the analysis on the significant reliance on tariff revenues potential affect on
ECOWAS countries’ willingness to sign the EPAs, a few issues are discussed. There is a lot
on stake for the ECOWAS countries, their significant reliance on tariff revenues puts them in
a vulnerable position. To mitigate the loss of tariff revenues, liberalisation needs to be
supported by complementary policies. The main concern regards to the ECOWAS countries
are their assumed lack of institutional capacities which will hamper their possibilities’ to
mitigate the losses in revenues by not being able to implement crucial complementary
policies. This is seen as the ECOWAS countries’ main concern regarding their willingness to
sign, since not being able to mitigate the tariff revenues loss can lead to a substantial decline
in government revenue. Further, other characteristics are likely to affect the ECOWAS
willingness to sign the EPAs due to their concerns of losing tariff revenues. These concerns
are the possible trade diversion effect, undiversified economical structure as well as the
possibility to trade under the EBA.

47
There are of course many reasons to why only a limited substantive negotiation progress has
been achieved so far in the EPA negotiations. More research is therefore needed to be
conducted before one can give a definite answer (to why only a few countries have signed the
contracts?). The significant reliance on tariff revenues is, however, most likely to affect the
members of ECOWAS’ willingness to sign the EPA and thus also the negotiations.

48
REFERENCES
Adam, A. (2009), Fiscal Reliance on Tariff Revenues: In Search of a Political Economy
Explanation? Review of Development Economics, 13(4), pp. 610-625.
Baunsgaard, T. and Keen, M. (2005), Tax Revenue and (or?) Trade Liberalization,
WP/05/112, IMF, Washington, D.C, Retrieved 2011-08-18,
http://www.imf.org/external/pubs/ft/wp/2005/wp05112.pdf
Befring, E. (1992), Forskningsmetodik och statistik. Studentlitteratur.
Bilal, S. and Braun-Munzinger, C. (2008), EPA negotiations and regional integration in
Africa: Building or stumbling blocs, European Centre for Development Policy Management,
Retrieved 2011-08-18,
http://www.ecdpm.org/Web_ECDPM/Web/Content/Download.nsf/0/1E716849203844ABC1
2574FF005657AD/$FILE/Bilal%2020-11-
08%20EPA%20negotiations%20and%20RI%20in%20Africa_final.pdf
Bilal, S. and Ramdoo, S. (2010), Which way forward in EPA Negotiations? Seeking Political
Leadership to Address Bottlenecks. European Centre for Development Policy Management,
Discussion Paper, No.100, Retrieved 2011-08-18,
http://www.ecdpm.org/Web_ECDPM/Web/Content/Download.nsf/0/A7C0619293070ECEC1
2577D5005A40D8/$FILE/DP100_Which%20way%20forward_final_15.11.10_incl.cover.pdf
Bilal, S. and Roza, V. (2007), Addressing the fiscal effects of an EPA, European Centre for
Development Policy Management. Retrieved 2011-08-18,
http://www.ecdpm.org/Web_ECDPM/Web/Content/Download.nsf/0/F3937B124FC36B09C1
25731B0032AC6E/$FILE/Bilal_Roza_ECDPM_08_05_07_Addressing_fiscal_effects_of_EP
As.pdf
Bird, R.M. Gendron, P.P. (2007), The VAT in Development and Transitional Countries.
Cambridge University Press, New York.

49
Blejer, M.I and Chu, K. (Eds) (1989). Fiscal Policy, Stabilisation and Growth in Developing
Countries, International Monetary Fund, Washinton, DC
Busse, M. Borrmann, A. Großmann, H. (2004), The Impact of ACP/EU Economic
Partnership Agreements on ECOWAS Countries: An Empirical Analysis of the Trade and
Budget Effects. HWWA - Hamburg Institute of International Economics, Hamburg.
Ebrill, L. Stotsky, J. & Gropp, R. (1999). Revenue implications of trade liberalization. Occasional Paper No. 180. Washington, DC: International Monetary Fund. ECDPM. (2006), Overview of the regional EPA negotiations: West Africa-EU Economic
Partnership Agreement, ECDPM InBrief 14B, Maastricht.
Retrieved 2011-08-18, www.ecdpm.org/inbrief14b
Elborgh-Woytek, K., Hallaert, J.J., Lankes, H.P., Sadikov, A. and Smith, D. (2006). Fiscal
Implications of Multilateral Tariff Cuts, WP/06/203: IMF. Washington, D.C, Retrieved 2011-
08-18, http://www.imf.org/external/pubs/ft/wp/2006/wp06203.pdf
Fontagné, L., Laborde, D., and Mitaritonna, C. (2010), An Impact Study of the Economic
Partnership Agreements in the Six ACP Regions, Journal of African Economies, 20(2),
pp.179-216.
Friedrich Ebert Stiftung. (2009), The cotonou scenarios: Negotiations on the economic
partnership agreement (EPA) between the European union and West Africa. Edition June
2009, Friedrich Ebert Stiftung, Benin, Retrieved 2011-08-18, http://library.fes.de/pdf-
files/bueros/benin/06493.pdf
Greenway, D. and Milner, C. (1991), Fiscal dependence on trade taxes and trade policy
reform, Journal of development studies, 27(3), 95-132
Hallaert, J.J. (2010), Economic Partnership Agreements: Tariff Cuts, Revenue Losses and
Trade Diversion in Sub-Saharan Africa. Journal of World Trade, 44(1), 223-250.
Hinkle, L., Hoppe, M. and Newfarmer, R. (2006), Beyond Cotonou: Economic

50
Partnership Agreements in Africa, in Trade, Doha, and Development - A Window into
the Issues, Chapter 22,: World Bank, Trade Department, Washington D.C
IMF (2008), Senegal: Selected Issues, IMF Country Report No. 08/221, IMF, Washington,
D.C, Retrieved 2011-08-18, http://www.imf.org/external/pubs/ft/scr/2008/cr08221.pdf
Karingi, S., Lang, R., Oulmane, N., Perez, R., Sadni Jallab, M. and Ben Hammouda, H.
(2005), Economic and Welfare Impacts of the EU-Africa Economic Partnership
Agreements, ATPC Work in Progress No. 10, United Nations Development Program,
New York. Retrieved 2011-08-18,
http://www.uneca.org/atpc/Work%20in%20progress/10.pdf
Karlsson, L.O., Tangnäs, J. and Wolpher, M. (2009), EPA Ekonomiska Partneravtal, en
rapport om EU:s handelsavtal med lander I Afrika, Västindien och Stilla havet,
Afrikagrupperna, Stockholm
Khattry, B. and Rao, J.M. (2002), Fiscal Faux Pas?: An Analysis of the Revenue Implications
of Trade Liberalization, World Development 30(8), pp.1431-1444.
Kommerskollegium (2004), WTO-avtalens konsekvenser för u-länder, Kommerskollegium,
Stockholm, Retrieved 2011-08-18,
http://www.kommers.se/upload/Analysarkiv/Publikationer/Rapport%20WTO%20avtalens%2
0konsekvenser.pdf
Kowalski, P. (2005), Impact of Changes in Tariffs on Developing Countries' Government
Revenue, OECD Trade Policy Working Papers, No. 18, OECD Publishing, Retrieved 2011-
08-18, http://www.acp-eu-trade.org/library/files/Kowalski_EN_0405_OECD_Impact-of-
Changes-in-Tariffs-on-Developing-Countries-Government-Revenue.pdf
Machemedze, R. and Chizarura, L. (2011), Impact of Economic Partnership Agreements
on livelihoods in Southern Africa, Africa Groups of Sweden, Stockholm, Retrieved 2011-08-
18,
http://www.seatini.org/publications/Research%20papers/2011/impact_of_epas_on_livelihood.

51
Markusen, J.R., Melvin, J.R., Kaempfer, W.H. and Maskus, K.E. (1995) International trade:
theory and evidence. McGraw-Hill, New York
Milner, C., Morrissey, O. and McKay, A. (2005), Some Simple Analytics of the Trade and
Welfare Effects of Economic partnership Agreements, Journal of African Economies, 14(3):
327-358.
Nielsen, L. and Zouhon-Bi, S. G. (2007), ECOWAS – Fiscal Revenue Implications of the
Prospective Economic Partnership, Africa Regional Working Paper Series No. 103,
Retrieved 2011-08-18, http://www.worldbank.org/afr/wps/wp103.pdf
Suranovic, S. (2010) International Trade : Theory and Policy. Retrieved 2011-08,
http://www.flatworldknowledge.com/pub/international-trade-theory-and/200062
Tanzi, V. and Zee, H. (2001) Tax Policy for Developing Countries. IMF, Washington D.C.
Preface available at: http://www.imf.org/external/pubs/ft/issues/issues27/index.htm
United Nations. (2004), Fiscal Implications of Trade Liberalization, in Economic Report on
Africa, unlocking Africa’s trade potential, Chapter. 6, Economic Commission for Africa,
Addis Ababa.
www.acp-eu-trade.org The ACP-EU Trade Website, Retrieved 2011-08-25, http://www.acp-
eu-trade.org/index.php?loc=epa/background.php
WITS - World Integrated Trade Solution: http://wits.worldbank.org/wits/
The World Bank database : http://data.worldbank.org/
WTO - World Trade Organization. (2009). Statistics Database - Trade profiles ECOWAS and
the EU. Available online:
http://stat.wto.org/CountryProfile/WSDBCountryPFHome.aspx?Language=E 2009-07-26.
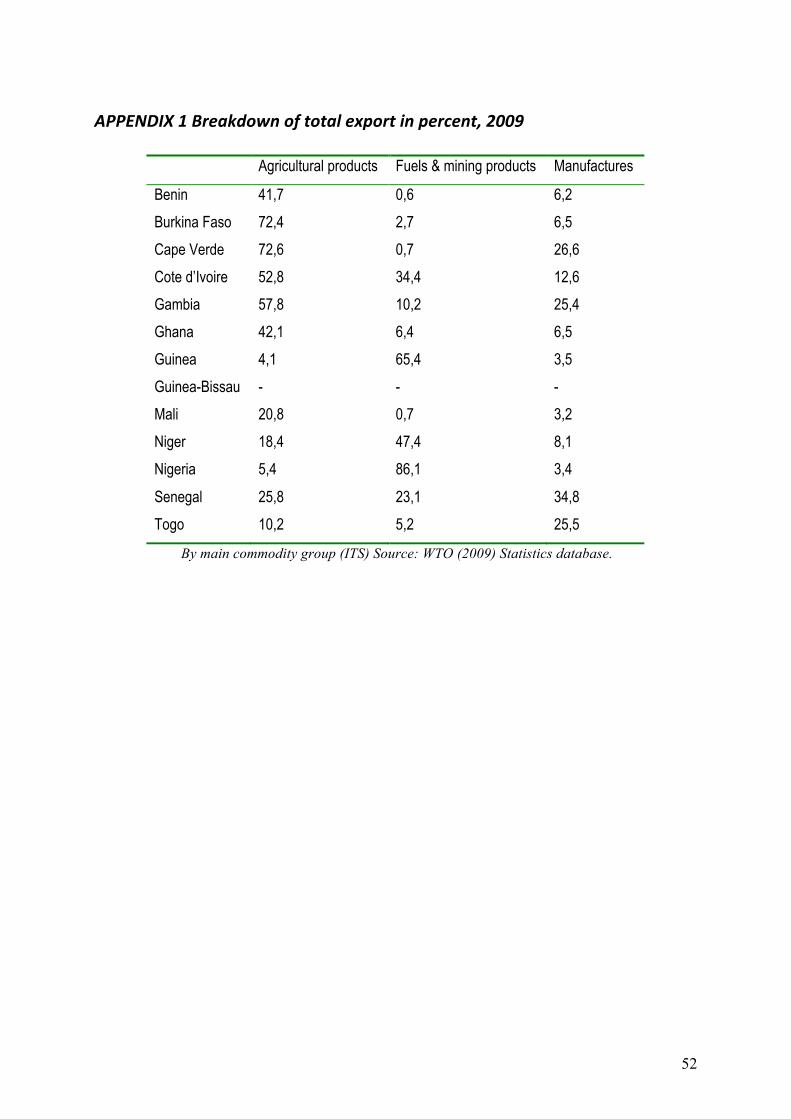
52
APPENDIX 1 Breakdown of total export in percent, 2009
Agricultural products Fuels & mining products Manufactures
Benin 41,7 0,6 6,2
Burkina Faso 72,4 2,7 6,5
Cape Verde 72,6 0,7 26,6
Cote d’Ivoire 52,8 34,4 12,6
Gambia 57,8 10,2 25,4
Ghana 42,1 6,4 6,5
Guinea 4,1 65,4 3,5
Guinea-Bissau - - -
Mali 20,8 0,7 3,2
Niger 18,4 47,4 8,1
Nigeria 5,4 86,1 3,4
Senegal 25,8 23,1 34,8
Togo 10,2 5,2 25,5
By main commodity group (ITS) Source: WTO (2009) Statistics database.

53
APPENDIX 2 Breakdown of total import by main origin, 2010

54
Source: WITS, value of imports

55
APPENDIX 3 Breakdown of imports by sector in percent, 2010
Capital goods
Consumer goods
Intermediate good
Raw materials Agricultural Industrial Petroleum TOTAL
BENIN ECOWAS 0,0 0,8 0,2 0,5 0,3 1,3 0,8 3,9 ROW 3,0 18,0 12,7 0,7 8,6 25,8 0,8 69,6 EU 2,2 6,8 1,3 1,3 2,0 9,6 3,2 26,5 total 5,2 25,6 14,2 2,5 10,9 36,7 4,8
BURKINA-FASO
ECOWAS 0,1 7,6 3,6 0,3 2,0 9,4 4,0 27,0 ROW 4,9 9,1 4,3 0,4 3,2 15,6 1,9 39,4 EU 4,0 8,2 1,9 0,6 1,7 12,9 4,2 33,6 total 9,0 24,9 9,8 1,2 6,9 38,0 10,2
CAPE VERDE
ECOWAS 0,1 0,7 0,0 0,0 0,3 0,7 0,0 1,9 ROW 2,4 5,4 0,9 1,1 4,4 5,3 0,0 19,4 EU 7,3 19,9 7,3 2,5 9,2 27,7 4,8 78,7 total 9,8 25,9 8,2 3,6 13,9 33,7 4,9
COTE D'IVOIRE
ECOWAS 0,1 0,5 0,1 9,5 0,1 10,1 9,1 29,6 ROW 4,4 7,9 5,3 3,7 5,2 16,1 1,6 44,3 EU 3,7 3,8 3,3 2,1 2,8 10,2 0,2 26,2 total 8,3 12,2 8,7 15,3 8,2 36,4 10,9
GAMBIA
ECOWAS 0,1 5,9 0,4 0,0 0,3 6,1 5,3 18,1 ROW 1,2 12,6 4,7 1,3 8,3 11,9 1,0 40,9 EU 3,3 12,1 2,5 1,2 5,1 14,2 2,6 41,0 total 4,5 30,6 7,6 2,6 13,6 32,2 9,0
GHANA
ECOWAS 0,1 0,3 0,6 4,6 0,1 5,5 4,7 15,8 ROW 7,5 9,5 7,5 3,7 5,1 23,2 1,5 58,0 EU 6,0 3,7 2,7 0,6 1,3 11,7 0,2 26,2 total 13,7 13,5 10,8 8,8 6,5 40,3 6,3
Source: WITS (2011)
Capital goods
Consumer goods
Intermediate good
Raw materials Agricultural Industrial Petroleum TOTAL
GUINEA ECOWAS 0,1 1,1 0,1 0,1 0,4 1,0 0,7 3,6 ROW 5,4 8,4 4,6 0,2 4,0 14,7 1,3 38,6 EU 5,5 14,5 2,5 0,3 1,4 21,4 12,2 57,8 Total 11,0 24,1 7,1 0,7 5,7 37,2 14,2
GUNIEA-BISSAU
ECOWAS 0,7 6,8 3,0 0,0 2,4 8,2 2,8 23,9 ROW 3,3 12,0 0,8 0,2 5,9 10,5 5,3 38,0

56
EU 4,3 10,0 2,2 0,6 4,2 12,9 4,0 38,1 Total 8,3 28,8 6,0 0,8 12,4 31,5 12,1
MALI
ECOWAS 0,1 11,5 3,2 0,2 1,5 13,6 9,3 39,6 ROW 5,8 7,4 5,0 0,2 2,6 15,8 0,1 36,9 EU 4,2 3,8 3,4 0,3 1,5 10,3 0,0 23,6 Total 10,1 22,8 11,6 0,7 5,6 39,7 9,5
NIGER
ECOWAS 0,1 3,7 4,1 0,2 2,0 6,1 1,4 17,6 ROW 4,9 14,8 3,4 0,8 8,2 15,7 1,9 49,8 EU 3,5 8,7 1,7 0,6 1,4 13,1 3,6 32,6 Total 8,5 27,2 9,1 1,6 11,6 35,0 7,0
NIGERIA
ECOWAS 0,0 0,0 0,0 0,0 0,0 0,1 0,0 0,2 ROW 13,7 12,2 10,1 2,2 3,7 34,6 0,2 76,8 EU 4,8 3,3 2,3 1,0 1,4 10,0 0,2 23,0 Total 18,5 15,6 12,5 3,2 5,1 44,8 0,4
SENEGAL
ECOWAS 0,1 1,6 0,4 3,9 0,7 5,3 4,4 16,4 ROW 3,9 8,8 5,1 1,7 6,7 12,8 0,5 39,4 EU 5,1 9,7 3,4 1,7 3,6 16,3 4,3 44,2 Total 9,1 20,1 8,9 7,2 11,1 34,3 9,2
TOGO
ECOWAS 0,0 1,3 0,2 0,1 0,4 1,3 0,5 3,9 ROW 6,0 13,5 12,6 0,4 5,6 27,1 0,2 65,5 EU 4,0 7,5 1,9 0,5 1,8 11,9 3,1 30,6 Total 10,0 22,3 14,7 1,0 7,8 40,3 3,8
Source: WITS (2011)

57
APPENDIX 4 Breakdown of weighted average tariff by sector in percent
Benin Burkina
Faso Cape
Verde Cote
d'Ivoire Gambia Ghana Guinea CAPITAL GOODS
ECOWAS 4,9 9,7 2,4 5,7 10,9 3,3 6,5 ROW 14,5 9,7 7,2 9,6 17,9 4,4 7,8 EU 7,6 8,1 5,9 8,0 16,5 4,9 7,3 average 9,0 9,2 5,2 7,7 15,1 4,2 7,2
CONSUMER GOODS
ECOWAS 5,8 5,9 9,6 5,9 19,7 13,1 15,1 ROW 15,6 11,8 14,6 11,7 13,6 14,2 15,5 EU 12,3 9,6 16,4 13,1 16,0 12,7 13,3 average 11,2 9,1 13,5 10,2 16,4 13,3 14,6
INTERMEDIATE GOODS
ECOWAS 0,9 5,0 6,4 10,1 16,4 10,1 11,7 ROW 19,1 9,6 3,1 7,8 11,5 11,2 11,0 EU 12,2 8,4 4,7 8,2 13,4 10,7 11,7 average 10,7 7,6 4,8 8,7 13,8 10,7 11,5
RAW MATERIAL
ECOWAS 0,0 1,5 6,7 0,3 17,4 0,1 6,4 ROW 14,7 7,7 19,5 6,1 4,5 7,3 9,7 EU 19,1 5,7 9,1 9,0 8,7 12,5 13,8 average 11,3 5,0 11,8 5,1 10,2 6,6 10,0
AGRICULTURAL
ECOWAS 0,0 0,8 13,9 6,3 14,7 12,9 14,8 ROW 13,3 12,6 10,9 10,7 6,9 16,5 15,1 EU 18,7 10,8 17,9 11,2 9,7 16,7 16,8 average 10,7 8,0 14,2 9,4 10,4 15,4 15,6
INDUSTRIAL
ECOWAS 3,9 6,6 5,9 0,7 19,6 1,6 13,0 ROW 17,9 10,3 13,4 8,9 16,8 8,4 11,3 EU 10,8 8,6 9,4 9,3 17,3 7,7 11,4 average 10,9 8,5 9,6 6,3 17,9 5,9 11,9
PETROLEUM
ECOWAS 3,8 7,0 4,6 0,1 20,0 0,2 13,3 ROW 8,1 8,0 4,8 0,7 20,0 0,5 13,3 EU 8,1 8,0 4,9 8,1 20,0 10,0 13,2 average 6,6 7,7 4,8 3,0 20,0 3,6 13,3
AVERAGE
ECOWAS 2,7 5,2 7,1 4,2 17,0 5,9 11,6 ROW 14,7 10,0 10,5 7,9 13,0 8,9 11,9 EU 12,7 8,4 9,8 9,5 14,5 10,7 12,5
Source: WITS

58
Guinea-Bissau Mali Niger Nigeria Senegal Togo
CAPITAL GOODS ECOWAS 8,2 5,2 8,1 5,4 4,7 6,6 6,4 ROW 6,3 8,3 8,0 7,9 8,5 12,6 8,6 EU 7,7 7,5 7,5 7,6 7,8 7,6 7,6 average 7,4 7,0 7,9 7,0 7,0 8,9 7,5
CONSUMER GOODS
ECOWAS 4,9 6,1 8,3 17,7 3,9 4,0 7,5 ROW 10,9 15,3 11,6 16,0 13,5 17,1 14,1 EU 14,1 11,4 9,3 15,2 10,8 11,3 12,0 average 10,0 10,9 9,7 16,3 9,4 10,8 11,2
INTERMEDIATE GOODS
ECOWAS 2,5 1,0 3,4 13,6 9,5 2,7 5,4 ROW 12,4 8,6 9,6 9,0 8,7 16,6 10,8 EU 16,0 6,9 9,5 8,2 8,6 13,3 10,4 average 10,3 5,5 7,5 10,2 8,9 10,8 8,9
RAW MATERIAL
ECOWAS 1,0 2,2 8,4 8,9 0,0 1,8 3,7 ROW 14,6 7,0 7,1 7,2 7,8 7,9 8,6 EU 16,5 6,6 5,9 6,1 8,7 13,9 9,6 average 10,7 5,3 7,2 7,4 5,5 7,9 7,3
AGRICULTURAL
ECOWAS 0,0 0,3 7,7 15,8 2,1 0,3 4,4 ROW 12,9 14,2 12,1 9,1 10,7 15,0 12,3 EU 18,1 10,4 12,8 7,8 11,4 16,3 12,8 average 10,3 8,3 10,9 10,9 8,1 10,5 9,8
INDUSTRIAL
ECOWAS 5,7 5,5 5,2 10,5 1,8 4,9 5,6 ROW 8,5 10,7 9,5 10,9 10,8 16,2 11,1 EU 11,1 8,3 8,3 10,1 9,0 9,7 9,4 average 8,4 8,2 7,7 10,5 7,2 10,3 8,7
PETROLEUM
ECOWAS 7,0 6,9 7,7 7,9 0,9 6,9 6,2 ROW 8,1 8,0 8,0 8,3 8,1 7,9 8,1 EU 7,9 8,1 8,0 8,8 8,1 7,9 8,1 average 7,7 7,7 7,9 8,3 5,7 7,6 7,5
AVERAGE
ECOWAS 4,2 3,9 7,0 11,4 3,3 3,9 ROW 10,5 10,3 9,4 9,8 9,7 13,3 EU 13,1 8,5 8,8 9,1 9,2 11,4
Source: WITS

59
APPENDIX 5 Development of weighted average tariffs in percent, 2001-‐2010
Tariffs toward EU, 2001-2010
Source: Own calculations on data from WITS
Tariffs toward EU, 2001-2010
Source: Own calculations on data from WITS
Tariffs toward ROW, 2001-2010
Source: Own calculations on data from WITS

60
Tariffs toward ROW, 2001-2010
Source: Own calculations on data from WITS
Tariffs toward ECOWAS, 2001-2010
Source: Own calculations on data from WITS
Tariff toward ECOWAS, 2001-2010
Source: Own calculations on data from WITS

61
APPENDIX 6 Weighted average tariffs in percent, 2001-‐2010
EU Benin Burkina Faso Cape Verde Cote d'Ivoire Gambia Ghana Guinea 2001 12,30 9,25 8,87 2002 12,50 9,63 8,86 2003 12,30 10,20 10,53 2004 12,36 10,25 10,57 26,65 2005 12,19 10,21 11,93 10,34 11,53 2006 12,14 10,25 10,10 2007 10,95 9,20 10,51 8,98 14,39 10,37 2008 13,40 8,12 10,06 9,61 14,50 10,35 11,03 2009 13,44 8,43 9,90 9,61 14,51 10,72 12,49 2010 12,69 8,44 9,77 9,54
Source:WITS
EU Guinea-Bissau Mali Niger Nigeria Senegal Togo
2001 13,86 9,10 11,11 22,36 9,93 10,32 2002 13,47 9,29 10,43 21,73 9,96 9,67 2003 13,55 9,40 10,10 9,64 9,37 2004 13,98 9,60 10,19 9,56 9,38 2005 12,30 8,00 9,86 10,20 9,32 8,65 2006 12,36 9,00 9,36 9,38 9,30 8,70 2007 13,21 8,47 8,87 8,36 7,80 2008 13,25 8,47 8,76 9,35 8,96 11,39 2009 13,26 8,47 8,76 10,21 8,96 11,36 2010 13,06 8,47 8,76 9,10 9,19 11,43
Source:WITS
ROW Benin Burkina Faso
Cape Verde
Cote d'Ivoire
Gambia Ghana Guinea
2001 12,61 9,87 7,75 2002 12,60 10,56 7,73 2003 12,16 9,80 7,96 2004 11,95 10,24 7,99 24,40 2005 11,91 10,24 11,28 7,60 12,60 2006 11,91 10,36 8,29 2007 10,62 9,81 9,61 8,34 14,64 11,05 2008 14,90 10,88 11,97 7,88 13,17 11,02 12,45 2009 14,92 10,44 10,59 7,88 13,03 8,94 11,94 2010 14,74 9,95 10,52 7,93
Source:WITS
ROW Guinea-Bissau Mali Niger Nigeria Senegal Togo
2001 12,23 10,79 11,50 24,49 9,28 10,02 2002 11,43 10,27 10,81 20,83 8,61 9,10

62
2003 10,14 10,57 9,75 9,33 10,79 2004 12,96 10,57 9,76 9,77 10,79 2005 11,84 10,27 10,36 13,37 9,18 10,29 2006 11,88 9,83 9,50 11,13 8,86 10,16 2007 13,81 9,23 8,72 9,06 9,53 2008 13,02 10,29 9,43 9,42 9,32 13,38 2009 12,12 10,29 9,43 9,48 9,32 13,32 2010 10,53 10,29 9,43 9,76 9,73 13,33
Source:WITS
ECOWAS Benin Burkina Faso
Cape Verde
Cote d'Ivoire
Gambia Ghana Guinea
2001 10,56 13,66 5,21 2002 10,29 13,47 5,21 2003 10,60 11,84 7,59 2004 10,55 12,52 7,59 26,61 2005 11,27 12,52 8,77 6,88 12,16 2006 5,96 5,98 4,04 2007 4,29 5,10 3,88 18,80 8,20 2008 3,55 3,56 8,23 3,45 18,55 8,19 11,78 2009 3,55 3,56 7,16 3,45 16,97 5,89 11,56 2010 2,74 5,23 7,08 4,15
Source:WITS
ECOWAS Guinea-Bissau
Mali Niger Nigeria Senegal Togo
2001 9,64 12,04 12,98 20,02 7,90 11,52 2002 9,24 11,52 13,22 23,45 7,68 11,18 2003 11,21 11,86 8,21 11,07 2004 10,70 11,22 11,87 8,70 11,08 2005 9,87 11,34 11,99 14,01 8,91 10,96 2006 3,54 4,63 6,28 10,57 3,80 5,73 2007 2,96 5,02 3,05 4,46 2008 4,05 3,86 6,97 11,50 2,99 4,67 2009 4,05 3,86 6,97 10,78 2,99 4,67 2010 4,17 3,86 6,97 11,41 3,27 3,90
Source:WITS

63