financing health and long-term care
TRANSCRIPT

freas.
H0.53
F49
FINANCING HEALTHAND LONG-TERM CARE
Report to the President and to the Congress
March 1990


i: FINANCING HEALTHAND LONG-TERM CARE
Report to the President and to the Congress
Department of the Treasuiy*^
Library
NOV 4 2005
March 1990

For s&le by the Superintendent of Documents, U.S. Government Printing OfficeWashington, D.C. 20402

ASSISTANT SECRETARY
DEPARTMENT OF THE TREASURYWASHINGTON
March 1990
The PresidentThe White HouseWashington, D.C. 20500
Dear Mr. President:
I am pleased to submit to you our report. FinancingHealth and Long-Term Care . President Reagan mandated this reportwhen he sent to Congress proposals to provide catastrophic healthcare coverage for the elderly. In his directive, he requiredspecifically that the Department of the Treasury present to thePresident a study of various tax incentives related tocatastrophic illness for the nonelderly, personal savings forlong-term care, and development of the private long-term careinsurance market for the elderly.
SectionCatastrophic CovSecretary of theto promote the prequired the stuTreasury and thewhether the incethe population r
the Medicare Cat101-234, specifi( section 102 )
.
113 of Public Law 100-360, the Medicareerage Act of 1988, also provided that theTreasury conduct a study of Federal tax policiesrivate financing of long-term care. The lawdy to consider the cost to the United Statespotential benefits to consumers, including
ntives would benefit all or most ofequiring protection. The legislation repealingastrophic Coverage Act of 1988, Public Lawcally retained the mandate for this study
Pursuant to both these directives, I hereby submitandFinancing Health and Long-Term Care; Report to the President an
to the CongresTI This Report will be submitted concurrently tothe Domestic Policy Council, consistent with your mandate to theCouncil that it conduct an overall assessment of the quality,accessibility, and cost of our nation's health care system.
The Report contains no specific recommendations, butinstead presents for further consideration and analysis databearing on these issues and tax options for financing long-termcare for the elderly and health insurance for the nonelderly.
Respectfully,
_^(0,Kenneth W. GideonAssistant Secretary
(Tax Policy)

DEPARTMENT OF THE TREASURYWASHINGTON
March 1990
ASSISTANT SECRETARY
The Honorable Thomas S. FoleySpeaker of the HouseHouse of RepresentativesWashington, D.C. 20515
Dear Mr. Speaker
Catasof thto prrequiTreaswhethpopulMedicspeci
Sectrophice Treasomote t
red theury ander theation r
are Catf ically
tion 113Coverage
ury conduhe privatstudy tothe pote
incentiveequi ringastrophicretained
of Public Law 100-360, the MedicareAct of 1988, provided that the Secretary
ct a study of Federal tax policiese financing of long-term care. The lawconsider the cost to the United States
ntial benefits to consumers, includings would benefit all or most of theprotection. The legislation repealing theCoverage Act of 1988, Public Law 101-234,the mandate for this study (section 102).
In proposing catastrophic health care for the elderly.President Reagan also directed the Department of the Treasury topresent to the President a study of various tax incentivesrelated to catastrophic illness for the nonelderly, personalsavings for long-term care, and development of the privatelong-term care insurance market for the elderly.
andPursuant to both these directives, I hereby submit
Financing Health and Long-Term Care; Report to the Presidentto the Congress^ This Report will be submitted concurrently tothe President's Domestic Policy Council, consistent withPresident Bush's mandate to the Council that it conduct anoverall assessment of the quality, accessibility, and cost of ournation's health care system.
The Report contains no specific recommendations, butinstead presents for further consideration and analysis databearing on these issues and tax options for financing long-termcare for the elderly and health insurance for the nonelderly.
Robert HI am sending aMichel
.
similar letter to Representative
Sinperely
,
Kehneth W. GideonAssistant Secretary
(Tax Policy)

DEPARTMENT OF THE TREASURYWASHINGTON
March 1990ASSISTANT SECRETARY
The Honorable J. Danforth QuaylePresident of the SenateUnited States SenateWashington, D.C. 20510
Dear Mr. President:
SeCatastrophiof the Treato promoterequired thTreasury anwhether thepopulationMedicare Caspecif icall
ction 11c Coverasury conthe prive studyd the poincenti
requi rintastrophy retain
3 of Publige Act ofduct a stuate financto considetential beves wouldg protectiic Coveraged the man
c Law 100-360, the Medicare1988, provided that the Secretarydy of Federal tax policiesing of long-term care. The lawr the cost to the United Statesnefits to consumers, includingbenefit all or most of theon. The legislation repealing thee Act of 1988, Public Law 101-234,date for this study (section 102).
In proposing catastrophic health care for the elderly,President Reagan also directed the Department of the Treasury topresent to the President a study of various tax incentivesrelated to catastrophic illness for the nonelderly, personalsavings for long-term care, and development of the privatelong-term care insurance market for the elderly.
Pursuant to both these directives, I hereby submitFinancing Health and Long-Term Care; Report to the President andto the Congress . This Report will be submitted concurrently tothe President's Domestic Policy Council, consistent withPresident Bush's mandate to the Council that it conduct anoverall assessment of the quality, accessibility, and cost of ournation's health care system.
The Report contains no specific recommendations, butinstead presents for further consideration and analysis databearing on these issues and tax options for financing long-termcare for the elderly and health insurance for the nonelderly.
Sincerely,
ilLU}.%LKenneth W. GideonAssistant Secretary
(Tax Policy)


TABLE OF CONTENTS
PART ONE: EXECUTIVE SUMMARY
Page
CHAPTER 1: EXECUTIVE SUMMARY 1
I. BACKGROUND OF THE REPORT 1
II. FINANCING LONG-TERM CARE FOR THE ELDERLY 1
A. Definition of Long-Term Care 1
B. Current Financing of Long-Term Care I
C. Projected Needs and Financing 1
III. FINANCING HEALTH INSURANCE FOR THE NONELDERLY 2
A. Expenditures on Health Care 2
B. Comparison with Other Countries 2
C. Health Insurance Coverage of the Nonelderly Population 3
D. The Exclusion for Employer-Provided Health Insurance 3
IV. SUMMARY OF OPTIONS 3
A. Options for Financing Long-Term Care for the Elderly 3
B. Options for Financing Health Insurance for the Nonelderly 4
PART TWO: FINANCING LONG-TERM CARE FOR THE ELDERLY
CHAPTER 2: INTRODUCTION AND SUMMARY 5
I. INTRODUCTION 5
A. Long-Term Care Defined 5
B. Current and Future Needs for Long-Term Care 5
C. The Financial Weil-Being of the Elderly 7
D. Financing Long-Term Care of the Elderly 9
II. SUMMARY 10
-VII-

Table of Contents-Continued Page
CHAPTER 3: CURRENT LONG-TERM CARE NEEDS, PROVISION,AND FINANCING 11
I. FACTORS INFLUENCING LONG-TERM CARE NEEDS 1
1
A. IvOnger Life Expectancies 1
1
B. An Aging Population and Changes in Disability Status 1
1
C. Economic and Other Factors 15
II. CURRENT PROVISION AND FINANCING OF LONG-TERM CARE 16
A. Provision of Long-Term Care 16
B. Financing Long-Term Care 16
CHAPTER 4: PRIVATE FINANCING OF LONG-TERM CARE 21
I. TRENDS IN THE INCOME AND WEALTH OF THE ELDERLY 2 1
A. Measures of Financial Weil-Being 21
B. Present Sources of Income 27
C. Future Income Sources 33
D. Conclusions: 1 he Financial Well-Being of the Elderly and
Long-Term Care Financing 34
II. DEVELOPMENT OF THE PRIVATE LONG-TERM CAREINSURANCE MARKET 35
A. Possible Market Failure?'
36
B. An Unattractive Product? 39
CHAPTER 5: TAX PROVISIONS AFFECTING LONG-TERM CAREFINANCING 43
I. FEDERAL TAX POLICY TOWARD PRIVATE PENSION ANDHEALTH PLANS 43
A. The Basic Pension. Health Insurance, and Annuity Models 43
B. The Itemized Deduction for Medical Expenses 45
C. Qualifications and Limits on Tax Benefits Under The Models 45
D. Level Benefit Payments from Pension Plans 47
E. Prefunding for Retiree Health Benefits 47
F. Individual Retirements Accounts 50
-vni-

Table of Contents-Continued Page
II. INDIVIDUAL MEDICAL ACCOUNTS: AN ANALYSIS OFPROPOSALS 5
1
A. Description of IMA Proposals 51
B. Analysis of Proposed I M As 52
C. Tax-Free IRA Withdrawals for Long-Term Care 53
D. An IRA Option for Further Consideration 53
E. Conclusions 53
CHAPTER 6: OPTIONS FOR FINANCING LONG-TERM CAREFOR THE ELDERLY 55
I. BASIC OPTIONS 55
A. Adjust Pension Payments for lx)ng-Term Care 55
B. Adjust Annuities. IRAs. and Life Insiuance for Long-Term Care 56
C. Clarify Tax Treatment of Distributions from Long-Term Care
Policies 56
D. Analysis of Options 57
II. VARIATIONS ON BASIC OPTIONS 58
A. Alternative Triggers to Long-Temi Care Payments 58
B. Alternative Limits to Long-Term Care Option in Pensions 58
C. Alternative Limits on Maximum Pension Contributions 59
III. REVENUE EFFECTS 59
PART THREE: FINANCING HEALTH INSURANCE FOR THE NONELDERLY
CHAPTER 7: INTRODUCTION AND SUMMARY 61
I. CURRENT FINANCING OF HEALTH INSURANCE FOR THENONELDERLY 61
II. EXISTING TAX INCENTIVES FOR HEALTH INSURANCE 62
III. SUMMARY 63

Table of Contents-Continued Page
CHAPTER 8: HEALTH INSURANCE FOR THE NONELDERLY: THECURRENT SYSTEM 65
I. EXPENDITURES ON HEALTH CARE 65
II. SCOPE OF CURRENT HEALTH INSURANCE COVERAGE 65
III. HEALTH INSURANCE COVERAGE 72
A. The Employed 72
B. The Unemployed and Nonworkers 75
C. Tfie Self-Employed 76
CHAPTER 9: CURRENT INCENTIVES FOR PRIVATE HEALTH INSURANCE 79
I. THE EXCLUSION FOR EMPLOYER-PROVIDED INSURANCE 79
A. Resource Allocation 79B. The Price of Medical Care 80
II. EFFECT ON COVERAGE 80
CHAPTER 10: OPTIONS FOR FINANCING HEALTH INSURANCEOF THE NONELDERLY 81
I. OPTIONS RELATING TO EMPLOYER-PROVIDEDHEALTH INSURANCE 81
A. Limit Employee Exclusion 81
B. Allow Exclusion Only for Policies with Specific Provisions 82
C. Limit Employer Deduction for Health Insurance 83
II. CREDIT FOR HEALTH INSURANCE 83
-X-

Table of Contents—Continued Page
HI. ADDITIONAL OPTIONS 85
A. Groups of Special Concern 85
B. Design Considerations 86
IV. REVENUE EFFECTS 86
APPENDIX A: SYNOPSIS OF FEDERAL INCOME TAX RULES RELATING TOHEALTH, PENSION, AND LONG-TERM CARE BENEFITS 89
I. HEALTH BENEFITS 89
A. Current Health Benefits 89
B. Post-Retirement Health Benefits 90
If. PENSION BENEFITS 91
A. Limits on Contributions and Benefits 91
B. Deductions and Funding 92
C. Distribution Rules 93
III. LONG-TERM CARE BENEFITS 94
APPENDIX B: DETAILED TABLES FOR CHAPTERS 2, 3, 4, and 8 95
FOOTNOTES 107
BIBLIOGRAPHY I I I
-XI-

LIST OF TABLES
CHAPTER 2: Page
2.
1
Current and Projected Long-Term Care Needs of the
U.S. Population Age 65 and Over 6
2.2 Actual and Projected Nursing Home Care Expenditures. All Ages1965-2000 8
CHAPTER 3:
3.
1
Life Expectancy at Birth and at Age 65, for Males and Females,
1935-2040 12
3.2 Life Expectancy at Age of Retirement by Sex. 1940-1985 13
CHAPTER 4:
4.1 Estimated Number of Federal Individual Income Tax Return
Filers and Nonlllers in 1990 by Age of Primary Filer 23
4.2 Illustralion of Federal Income and Social Security Payroll Taxes
in 1990 lor Taxpayers Under and Over Age 65 25
4.3 Percent of Households With Heads Age 65 and Over Receiving
Income From Various Sources in 1967. 1976. and 1984 28
4.4 Percent of Total Income From Various Sources for Households
With Heads Age 65 and Over in 1967, 1976, and 1984 29
4.5 Percent of Total Income From Various Sources for HouseholdsWith Heads Age 65 and Over by Income Group. 1984 31
4.6 Percent of Total Income By Source, Age, and Income Quarlile, 1984 32
-XII-
List of Tables—Continued Page
CHAPTER 8:
8. 1 Percentage Distribution of Funding for Personal Health Care,
Selected Calendar Years 1965 to 1987 66
8.2 Percentage Distribution of Health Care Expenditures by
Channels of Payment for Hospital Care. Physicians" Services
and All Other Health Care Services. Calendar Year 1977 67
8.3 Nonelderly. Noninstitutionalized Population by Selected Sources
of Health Insurance Coverage, Own Work Status, and Poverty Status,
1985 68
8.4 Group Health Insurance Coverage of Wage-and-Salary Workers
by Employment Size of Firm, 1979 and 1983 73
CHAPTER 10:
10. 1 Illustrative Revenue Estimates for Selected Options 88
APPENDIX B:
B-l Average Real Income of Families. Adjusted for Family Size,
by Age of Head, 1967. 1979. and 1984 95
B-2 Median Real Income of Families. Adjusted for Family Size,
by Age of Head. 1967. 1979. and 1984 96
B-3 Percent of Total Income by Source, Age, and Income Quartile, 1984 97
B-4 Average Real Wealth of Households by Age of Head. 1962 and 1983 98
B-5 Median Real Wealth of Households by Age of Head. 1962 and 1983 99
-Xlll-
List of Tables—Continued Page
B-6 Annual IntliviJual Expenses and Sources of Payment for Personal
Health SeiAices: Average Expense Per Person With Expense and
Percent Paid by Source of Payment. 1977 100
B-7 Annual Health Care Expenses. Health Status, and Income:
Percent of Population in Good or Poor Health and Average
Expense Per Person, by Age and Income, 1977 101
B-8 Annual Out-of-Pocket Expense for Personal Health Services
and Private Health Insurance Premiums as a Share of Family
Income for Families With Positive Family Incomes, by Selected
Population Characteristics. 1977 102
B-9 Children Age 18 or Under Without Health Insurance Coverage
by Selected Sources of Health Insurance Coverage of the
Family Head and Family Income as a Percent of Poverty. 1985 103
B-IO Benefits for Hospital Room and Board: Percent Distribution
of the Privately Insured Population Under 65 With Coverage,
by Type of Insurance. Sex. and Employment Characteristics
of the Primary Insured. 1977 105
LIST OF FIGURES
CHAPTER 3:
3.1 Percent of U.S. Population by Age Group. 1985-2040 14
3.2 Current Provision and Financing of Long-Term Care for the Elderly 17
CHAPTER 4:
4.1 Average Real Income of Families by Age of Head. 1967. 1979. and 1984 22
4.2 Median Real Wealth of Households by Age of Head. 1962 and 1983 26
CHAPTER 5:
5.1 Decline in Value of a Level Pension Benefit 48
-XIV-

PART ONE
EXECUTIVE SUMMARY


CHAPTER 1: EXECUTIVE SUMMARY
I. BACKGROUND OF THE REPORT
The report was prepared in response to both a Presidential directive and a congressional mandate.
When President Reagan sent Congress his proposals for catastrophic health care coverage for the
elderly in February 1987, he directed the Department of the Treasury to study and report back to him
on a variety of tax measures to help finance catastrophic illnesses for the nonelderly and long-term
care for the elderly. The Medicare Catastrophic Coverage Act of 1988 added a legal requirement that
Treasury study Federal tax policies to help finance long-term care, a requirement that was
specifically retained when the Act was repealed in 1989.
II. FINANCING LONG-TERM CARE FOR THE ELDERLY
A. Definition of Long-Term Care
Long-term care covers the support of individuals with chronic physical or mental disabilities
that make it difficult for them to care for themselves over an extended period of time. Long-term
care often involves custodial skills that many adults are able to provide, such as bathing, cooking,
and shopping, rather than medical skills. Although nonelderty individuals also have long-term care
needs, this Report focuses on financing long-term care for the elderly.
B. Current Financing of Long-Term Care
Over three-quarters of the elderly who require long-term care receive that care in the community.
Of those cared for in (he community, more than three-quarters are cared for informally by family and
friends. Formal care in the community, about half of which is paid for by the elderly and their
families and the other half by government, is provided to the rest. Ihe remaining quarter of the
elderly needing long-term care receive it in nursing homes, with slightly more than half of the cost
borne by Ihe elderly and their families, and most of the remainder paid by Medicaid; only 1 percent
is currently paid by private insurance.
C. Projected Needs and Financing
Needs for long-term care are expected to grow in the future due to longer life expectancies,
aging of (he population generally, and economic factors such as rising incomes. Financing of these
needs must come from one of the following sources: the income and wealth of the elderly and their
families, time contributed by members of their families and communities, private long-term care
insurance. Federal and state tax subsidies, or other Federal, state, and local programs. This
Report examines each financing source, with the following findings:
° The income and wealth of the elderty have grown rapidly over the past two decades, both in
absolute terms and relative to the income and wealth of the nonelderly. Further, there

-2-
should be a continued improvement in the economic well-being of the elderly. However, most
pensions pay the same amount in early retirement years as in later retirement years, when
the need for long-term care is greatest.
° The private long-term care insurance market is still developing. Clarification of the
Federal tax treatment of employers" contributions to prefund this insurance and of
distributions from policies might be helpful.
° Federal tax law already provides very generous treatment for employer pension contributions
and reserve earnings, which are not taxed to employees until received as pension benefits.
Ihis tax treatment appears to be the appropriate model for long-term care, because a
significant portion of long-term care expenses are for ordinary living costs and custodial
care rather than medical care. (Expenses for medical care, over an income floor, are
effectively untaxed because they are deductible.)
III. FINANCING HEALTH INSURANCE FOR THE NONELDERLY
A. Expenditures on Health Care
In 1987 total expenditures on health care in the United States were estimated to be $500 billion,
or I 1.1 percent of GNP. compared to less than 6 percent of GNP in 1965. just over two decades ago.
Federal outlays related to health were estimated to be about $145 billion in 1987. or more than one
out of every eight Federal outlay dollars. Tax subsidies related to health care also reduced
Federal revenues by nearly $50 billion annually. State and local governments in turn expended an
estimated $63 billion on health care in 1987. exclusive of tax expenditures. Counting all sources
of funds, governments directly or indirectly cover almost half of all health care expenditures,
spending about 1/4 of $1 trillion on health care in 1987. For the future, increased demand for
health care and continued infiation of prices for medial services are expected to cause expenditures
on health care to rise at a much faster rate than the growth rate of gross national product.
B. Comparison with Other Countries
Private and public expenditures on health care comprise a larger percentage of gross national
product in the United States than in any other major industrial country. Indeed, only France and
Sweden approach the share of GNP allocated to health in the United States. Other nations, such as
Canada, that were on a par with the United States 20 years ago allocate about 3 percentage points
less than the United States to health care.
This is not to argue that the United States share of total resources spent for health care is
"too high" or should equal what other countries distribute to their health systems. In some cases,
lower spending levels in other countries refiect more restricted access to care. Moreover, if
properly targeted, resources allocated to health care can lead to improved productivity and higher
rates of economic growth. What is troubling is evidence that other countries may be equaling-or,
in some cases, surpassing-our performance in health care, and achieving at least as good an outcome

-3-
wi(h less resources. Measures of life expectancy and infant mortality, for example, do not seem to
reflect the extra outlays for health care in the United States.
C. Health Insurance Coveiage of the Nonelderly Population
The Federal government influences the availability of health insurance to the nonelderly in two
ways. It directly provides insurance to 12 percent of the nonelderly population through Medicaid
and other public programs. Two-thirds of the nonelderly receive an indirect government subsidy
through the exclusion ofemployer-provided health insurance premiuins from employees' income subject
to income and Social Security taxes. For a typical employee, this tax subsidy reduces the cost of
health insurance by over 30 percent.
In 1985, nearly 35 million individuals under age 65. or over 17 percent of the nonelderly
population, did not have health insurance coverage. Of the nonelderly uninsured, over half were
eiriployed. and an additional 32 percent were children. Among the insured nonelderly population,
coverage of the insurance varied.
D. The Exclusion for Employer-Provided Health Insurance
This Report examines the tax exclusion for employer-provided health insurance, and finds the
following:
° The current exclusion is unlimited and untargeted. providing a subsidy to purchase large
amounts of health insurance coverage, such as fnst-dollar coverage and coverage of routine
care.
° The exclusion increases demand for health care services, putting upward pressure on prices
for the services.
° The exclusion benefits most those who work for employers that provide large amounts of
health insurance for employees, but provides no benefit to employees whose employers
provide no health insurance.
° The exclusion provides a larger benefit to those in higher tax brackets.
VI. SUMMARY OF OPTIONS
The ft>llowing options are presented for further consideration and analysis. The more detailed
discussion of these options in Chapters 6 and 10 include a number of important design considerations
that are not summarized here.
A. Options for Financing Long-Term Care for the Elderly
° Adjust Pension, Annuity, and Individual Retirement Account Payments for Long-Term
Care. This option would allow payments from pensions, annuities, and IRAs to be adjusted
for certain contingencies associated with the need for long-term care, such as the

-4-
inability to perform certain Activities of Daily Living (ADLs). Payments could also be
adjusted to pay for private long-term care insurance. The tax law would be clarified to
cover these adjustments.
° Clarify the Tax Law. The tax treatment of employers' contributions to prefund long-tenn
care insurance, and of the distributions from these policies, could be clarified. In
particular, to avoid large future revenue losses, distributions from long-term care
policies would continue to be subject to tax, but with a continued allowance of a deduction
for medical expenses.
B. Options for Financing Health Insnrance for the Nonelderly
Some of the options presented below would increase Federal revenues while other options
would reduce them, making it possible to form a revenue-neutral proposal for financing
health insurance for the nonelderly.
° Limit the Employee Exclusion. The exclusion could be capped at a specified dollar amount
per month. The cap could be set sufficiently high that it would apply to relatively few
employees.
° Allow Exclusion Only for Policies with Specified Provisions. The employee exclusion could
be limited to employer-provided health insurance policies that contained specific
provisions, such as a minimum deductible and coinsurance rate.
° Limit Employer Deduction for Health Insnrance. Rather than limit the employee exclusion,
the amount deductible by employers could be limited to a specified amount per employee.
° Tax Credit for Health Insurance. A tax credit could be provided to families who do not
have employer-provided or public health insurance. If the credit were refundable, it could
be paid through insurance companies for families who do not file income tax returns.
° Deduction for the Self-Employed. The current 25 percent deduction for health insurance
purchased by the self-employed, which expires October 1 . 1 990. could be made permanent, and
could be expanded.

PART TWO
FINANCING LONG-TERM CARE FOR THE ELDERLY


CHAPTER 2: INTRODUCTION AND SUMMARY
I. INTRODUCTION
A. Long-Term Care Defined
Long-term care is support for persons whose chronic physical or mental disabilities make it
difficult for them to care for themselves over an extended period of time. Many elderly people, but
also many nonelderly, require long-term care. This Report, in accordance with its mandate, focuses
on financing long-term care for the elderly.
Long-term care often involves custodial skills that many adults are able to provide, such as
bathing, cooking, and shopping, rather than medical skills. Most individuals needing long-term
care therefore receive it in their own home or that of a family member and are cared for informally
by family and friends. Although concern about access to long-term care often focuses on whether
those who need care can afford nursing home costs, current estimates suggest that for each elderly
nursing home resident, there are two persons with long-term care needs who are cared for within the
community. Most of the elderly who both require long-term care and live in the community (76
percent) receive all their care informally. Thus, for nearly two-thirds of the elderly who receive
long-term care, the direct costs are borne as much or more by family and friends as by the elderly
themselves.
For the elderly in nursing homes and those in the community who pay for care, however, long-term
care expenses are large. With a year of nursing home care costing approximately $22,000 in 1985,
uninsured persons of moderate means may be unable to pay for more than a short stay. As a result,
Medicaid is a major provider of funds for nursing home care. For the future, the number of elderly
persons requiring long-term care and the amount of care they will need are expected to increase as
life expectancies lengthen and economic and social factors, such as support from extended families,
change.
B. Current and Future Needs for Long-Term Care
Nearly a quarter of persons now over 65 require long-term care. Most receive care outside of
nursing homes. In 1980. 4.6 percent of the elderly received long-term care in nursing homes, while
18. 1 percent of the elderly received long-term care while living in the community (see Table 2. 1).
The elderly themselves will become a larger proportion of the U.S. population in the future.
Defining the "elderly" as those aged 65 and older. Table 2. 1 shows that the proportion of the U.S.
population that is elderly is expected to grow from 1 1 .3 to 2 1 .7 percent between 1980 and 2040. Asignificant part of this increase is due to demographic changes such as the aging of the post-World
War II baby boom generation and the decline in the birth rate. Another part, however, is directly
related to the longer life spans of individuals.
Life expectancy for females at age 65. for instance, has risen over 40 percent since 1935 and is
now close to 19 years. At the same time, longer life spans, along with other changes in
-5-

-6-
Tablc 2.1 Current and Projected Long-Term Care Needs of the U.S. Population Age 65
and Over
Year
U.S. Population
Age 65
Total and Over
Persons Age 65 and Over Needing Long-Term Care
Total
In
Nursing
Homes
In the Community
Total
Limited
Needs
Severe
Needs
A. Total Population (Thousands)
1980

well-being, require further adjustments in society. Private suppliers of goods will produce fewer
toys and more travel services, for example, as the population ages. The public provision of goods
also will change, such as by increasing Social Security payments to an increasing number of aged
persons.
While the elderly are increasingly better off in terms of health, as well as income and wealth,
the increase in the number of the elderly over age 85—the age group most likely to need long-term
care—may lead to a significant increase in the demand for long-term care. Thus, as shown in Table
2.1. the Department of Health and Human Services estimates that the proportion of the elderly
requiring long-term care will increase by 23 percent (from 22.8 percent of the elderly to 28.0
percent of the elderly) between 1980 and 2040.
Total expenditures on one component of long-term care, nursing home care, have grown steadily
over the last 25 years in the aggregate, on a per capita basis, and as a share of GNP. Table 2.2
shows the growth of expenditures over this period and the projections of the Health Care Financing
Administration on future growth to the year 2000. Nursing home expenditures increased as a
percentage of GNP, from 0.3 in 1965 to just under I percent in the mid-1980"s. These expenses
include nursing home care for the noneklerly. as well as the elderly. The increase in nursing homeexpenditures reflects growing numbers of elderly who require care as well as changes in the nature
ol that care. Such shifts in spending patterns are common as the income of a society increases over
time, the relative prices of goods change, and the society ages. In addition, government subsidies
for long-term care are tied rather closely to institutional care, fostering use of nursing homes.
Expenditures for nursing home care are currently paid about one-half by private parties and one-half
by government, primarily through Medicaid (although the percentage paid by Medicaid has declined
somewhat since 1980). Long-term care insurance covers only a liny fraction of persons. Medicare,
which is believed by many to cover long-term care, was not meant to provide long-term care.
Medicare coverage is a small fraction of total long-term care costs.
Although future projections such as those in Tables 2.1 and 2.2 are quite tentative, it is likely
that long-term care needs of the elderly and expenditures on their care will continue to grow over
the coming decades for the following reasons: changes in birth rates and the aging of the baby-boom
population mean an increase in the proportion of the population in more advanced years; the
increased economic well-being of the elderly and their children appears to be accompanied by an
increase in demand for a variety of forms of care; changes in family and social structures imply an
increase in demand for formal caretaking, e.g. because of a possible decline in the number of
informal caretakers; and the increased life spans of individuals, while implying increased
well being, have not yet been accompanied by a decrease in health care expenditures by persons at
each age. It is unlikely that nursing homes will be the most efficient form of formal provision
in all cases. Increased needs for caretaking, therefore, should be met in a variety of ways.
C. The Financial Weil-Being of the Elderly
There have been many recent improvements in the financial well-being of the elderly. The income
of the elderly is now approximately the same as that of the noneklerly. Moreover, the youngest
elderly-those between the ages of 65 and 70-on average have higher after-tax incomes, lower
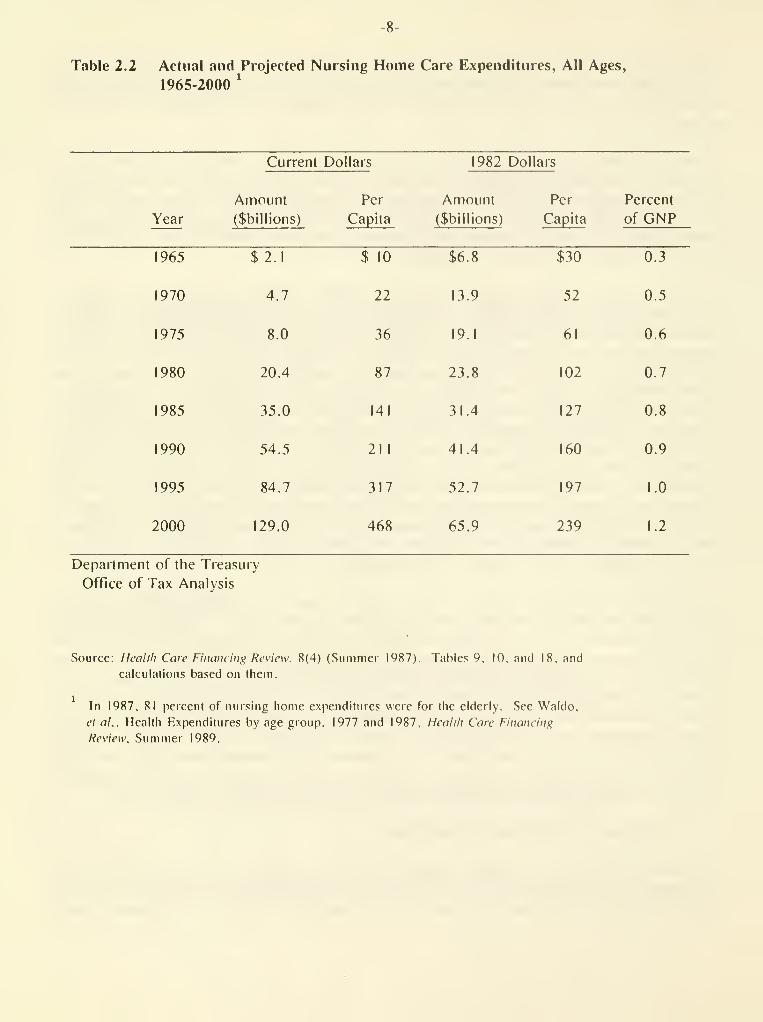
Table 2,2 Actual and Projected Nursing Home Care Expenditures, All Ages,
1965-2000'

-9-
pcwerty rates, and greater net worth than both the older elderly and the nonelderly. While there is
little evidence that the elderly dissave rapidly, some of the elderly face declining incomes because
most private pensions pay the same amount in early retirement years as in later retirement years,
when the need for long-temi care is greatest.
Each generation of the elderly has generally fared better financially than the previous
generation. Thus, it should not be surprising that the youngest elderly have greater resources than
the older elderly. Moreover, this trend is expected to continue: private pensions and Social
Security are expected to grow in real terms, reflecting the higher real earnings of today's workers
over workers a generation ago. providing tomorrow's elderly greater resources than today's elderly.
Any change in the public provision or tax subsidization of long-term care must take these factors
into account.
D. Financing Long-Term Care of tlie Elderly
Responsibility for long-term care of the eldeily is shared by their families and friends, their
community, state, local, and Federal governments, and the elderly themselves. The United Stales"
long-term care system is an aggregation of diverse arrangements rather than a single, coordinated
national program. Reviews of the effectiveness of our current long-term care system, as well as of
proposals to change Federal financing programs and policies, must take into account bcih the
diversity of these arrangements and the diversity of the elderly themselves.
The current long-term care system depends on informal family and community resources to meet the
long-term care needs of most of the elderly. The proportion of the population that is elderly and
needs long-teiTn caie is increasing. Those elderly who have few family or friends to care lor them,
and those who need but cannot afford skilled or constant care, may find informal care difficult to
secure. Services available to the elderly may depend more on where they live than on what they
need
.
It is important to recognize that individuals requiring long-term care have expenses for health
and custodial care, but also expenses of ordinary living such as food and shelter. Simiiaily.
long-term care financing involves the issue of retirement income as much as it does insurance. A
person with $25,000 of retirement income and no spouse or other dependents could spend almost all of
that income on nursing home care if the nursing home provided for all needs including shelter and
food. One with $15,000 of retirement income, on the other hand, would probably have a shortfall of
income by which to afford a nursing home. A couple with $15,000 would have an even greater
shortfall. Government policy relating to retirement plans. Social Security, and Medicare, affect
the resources individuals have available to finance their long-term care needs.
Lx)ng-teiTn care financing is also an issue of insurance. Disability requiring custodial care is
an uncommon event of potentially very high cost. For example, the likelihood of using a nursing
home in one's lifetime is approximately one in eight, with the cost for a year of nursing home care
approximately $22,000 in 1985. A significant fraction of the elderly in nursing homes have quite
short stays--52 percent of persons admitted to nursing homes in 1977 stayed 90 days or less, and
14 percent incurred costs below $1,000 in 1980. But for those who remain for extended peiiods.
costs are quite high.

-10-
The need for long-term care is a risk Ihat is at least partially insurable in the private market.
A well-develdpecl private long-term care insurance market hinges on getting people to buy some
insurance before they approach the very high-risk years. Group coverage would enhance access and
provide coverage with lower premium payments. If group insurance for long-term care, for example,
can be marketed to older workers or early retirees—or to their children whose policy covers their
parents—there is a good chance of avoiding the serious problems of adverse risk selection. By
contrast, tiding to market individual policies to 75-year old people runs the risk of loading up the
insurance pool with people who already know they are at high risk of needing long-term care.
The risk-pooling aspects of insurance eliminate the need for each individual to save enough to
cover the costs of long-term care that relatively few will bear. The market for long-term care
insurance is small but growing. Nonetheless, this Report finds that there are a number of charac-
teristics of current long-term care insurance and of current tax rules that may inhibit the market's
development. While the tax rules should be clarified, any public action in this area should still
proceed cautiously. Many elderly clearly would not find certain types of long-term care insurance
worth the cost, such as insurance that covers only institutional care. Institutional arrangements
might vary widely in the future, and public policy should not foreclose future options to provide
long-term care in the most efficient fashion.
II. SUMMARY
The following four chapters provide a detailed description and analysis of current and possible
future financing sources for long-term care. Chapter 3 provides an ovei"\'iew of current long-term
care needs, provision, and financing. Chapter 4 covers the private financing of long-term care,
including trends in the income and wealth of the elderly and development of the private long-term
care insurance market. Government financing of long-term care is discussed in Chapter 5. The
discussion includes a review of Federal tax policy and long-teim care financing, and analysis of
options for a new Federal lax incentive for long-term care financing. Individual Medical Accounts.
Chapter 6 describes options for further consideration and analysis for meeting the changing needs of
the elderly population.

CHAPTER 3: CURRENT LONG-TERM CARE NEEDS, PROVISION, AND FINANCING
I. FACTORS INFLUENCING LONG-TERM CARE NEEDS
This section examines the demographic, economic, and other factors that influence the need for
long-term care.
A. Longer Life Expectancies
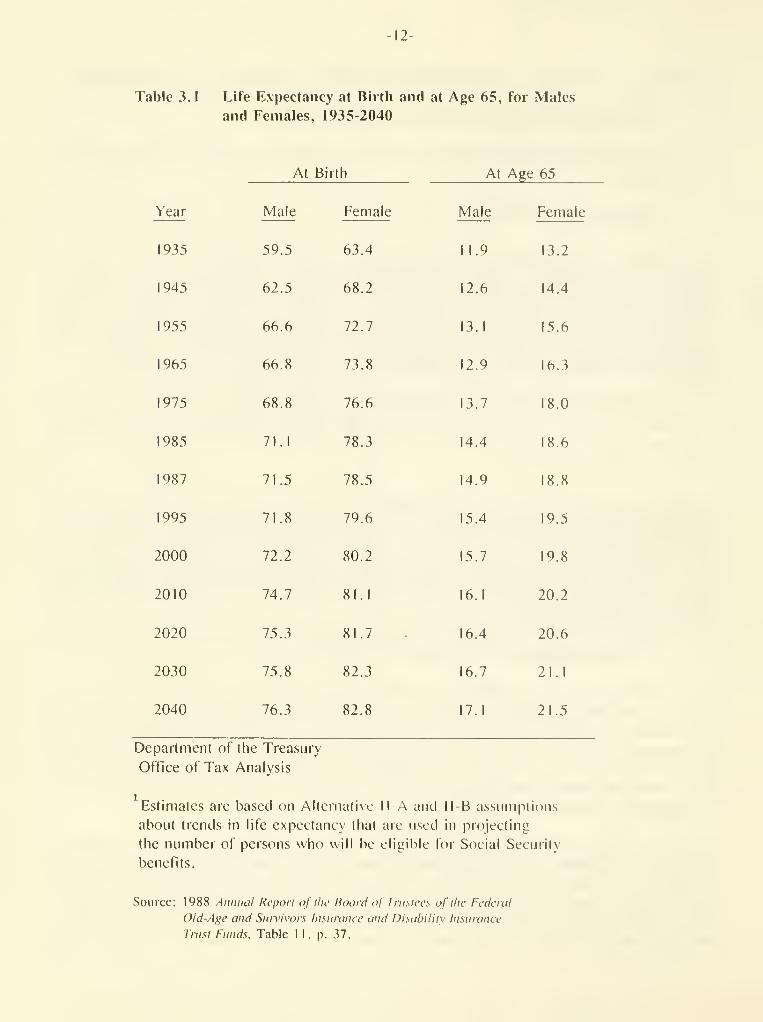
Individuals are living longer today than at any time in the past. Table 3.1 shows actual and
projected life expectancies at birth and at age 65 from 1935 through 2040. For males, life
expectancy at birth increased by 12 years, to 71.5. between 1935 and 1987. Life expectancy at birth
for females increased even more, by over 15 years to 78.5 years in 1987. Life expectancies at age
65 for both males and females also have shown significant increases. Males aged 65 had a life
expectancy of 11.9 years in 1935; in 1987, that expectancy increased to 14.9: for females, the
corresponding increase was from 13.2 years to 18.8 years-an increase of over 40 percent.
These trends are expected to continue, and the projections in Table 3. 1 show (hat those aged 65
are expected to continue to have increased years of life. Male and female life spans are expected
to increase by about 4 and 5 years by 2040, while life expectancy at age 65 will increase by an
average of close to 2-1/2 years.
People are also retiring earlier. The average age at retirement for both men and women fell
dramatically between 1940 and 1985 (Table 3.2). The combined effect of these two trends-longer
lives and earlier retirement-is that the elderly today are spending many more years in retirement
than they did in the past. Table 3.2 indicates that life expectancy at retirement has increased by
over 5 years for men and 8 years for women since 1940. In addition to more years of retirement for
those who retire, earlier retirement means that a larger portion of the population spends some
portion of its life in retirement.
B. An Aging Population and Changes in Disability Status
One result of longer expected life spans is that the average age of the population will increase.
Figure 3.1 indicates the expected changes in the age distribution of the population as a percent of
total population. Increasing average age, however, results not simply from increasing longevity in
the population as a whole, but also from the entry of the large "baby boom" cohort into old age. and
the lower birth rates of recent years. The proportion of elderly in the population will continue to
grow. Among the elderly, the proportion over 85 will grow more rapidly than the population of the
"young elderly," those between 65 and 85.
Aging of the population alone, however, does not necessarily imply that the population is
becoming more disabled, or that the demand for health and long-term care will increase. Imagine,
for instance, a society with no change in birth rates, but a pattern of improving health due to
control or elimination of conditions and illnesses particularly affecting the elderly. Growth in
the proportion of the population over 85 in this society might not lead to any increase in
disability, health care needs, or long-term care needs; in fact, there might be a decline. On the
-12-
Table 3.1 Life Expectancy at Birth and at Age 65, for Males
and Females, 1935-2040
At Birth At Age 65
Year

13-
Table 3.2 Life Expectancy at Age of Retirement by Sex, 1940-1985
Year
Average
Retirement Age
Male Female
Life Expectancy
at Retirement Age
Male Female
1940 68.8 68.1 10. .8
1950 68.7 68.0 10.8 13.0
I960 66.8 65.2 12.0 15.7
1970 64.4 63.9 13.4 17.7
1980 63.9 63.5 14.9 19.6
1985 63.7 63.4 15.4 19.8
Department of the Treasury
Office of Tax Analysis
Notes: The average retirement age represents the average age
at which men and women began receiving Social Security
retirement benefits in the given year.
The life expectancy at retirement is a weighted average
of the life expectancies at ages 60. 65, and 70 for white
and nonwhite men and women.
Sources: Data on retirement age are from Department of Health and Human
Services, Social Security Administration. Social Security Ikillciin.
Annual Statistical Supplcniciu. 1987. Table 53.
Data on life expectancies are from Department of Health and Human
Services, National Center for Health Statistics. Vital Statistics
of the United States. 1985. Vol. II, Sec. b. Table 6-4. and
Department of Commerce. Bureau of the Census. Statistical .'Wstiact
of the United States, 1988. Table 17.

-14-
Q.3OoG)<

-15-
other hand, certain types of health improvements lead to increases in health and long-term care
expenses. One result of improved health care is that some individuals who in the past would have
died at earlier ages now live to 65 and beyond. Some of these individuals are more likely to need
long-term care than the average elderly individual.
There is little consensus in the literature on whether past improvements in health have increased
or decreased the total demand for long-term care. In recent years, expenditures on long-term care
have increased faster than the elderly population. Such data might be thought to be proof that
age-specific needs have not declined with increased longevity. However, too many other factors are
at play to draw such a conclusion.
C. Economic and Other Factors
Increased income and wealth of the elderly are likely to be associated with increases in demand
for a variety of goods. Spending for long-term care may rise with increased well-being, just as
spending for higher quality housing or additional travel rises. Moreover, the availability of
Medicaid and Medicare may increase the demand for care both directly and indirectly. First,
individuals can avail themselves of public services with less cost to themselves. Second, the
presence of public insurance may increase the amount of residual long-term care services that
individuals are willing to pay for or to insure privately.
In addition, the demand for formal long-term care may be driven by economic and demographic
changes in the nonelderly population. The increased financial well-being of the nonelderly implies
a change in demand for a variety of goods and sei"\'ices, and one change may be an increase in the
demand for formal provision of long-term care for parents. The decline in the birth rate and the
decline in the proportion of adults who work in the home are also associated with an increased
demand for paid caretaking. In that sense, it is not surprising an increased demand for
non-parental child care and for formal long-term care have occurred over the same period.
The pattern of demand will also depend not only on the number of elderly and the incidence of
disability, but also on the availability of support sei-vices in the community, as well as of
insurance coverage. It seems likely, for example, that the widespread availability of insurance
would lead to "induced demand" for long-tenn care. The increased demand for personal long-term care
seiA'ices would substitute for some of the considerable care now provided by family members. The
phenomenon of induced demand has been demonstrated in the response ofdemand for acute medical care
to the spread of insurance, and there is even more reason to expect it in long-term care where
services have substantial social and custodial aspects. The extent of such extra demand, however,
may depend on the extent to which third-party payors exercise cost discipline over the providers of
services.
In summary, if past trends continue it is likely that the demand for long-term care will continue
to increase in the future. This may occur both because society has a changing expectation of what
constitutes appropriate care and because improvements in health and longevity are not accompanied by
offsetting declines in age-specific needs.

-16-
II. CURRENT PROVISION AND FINANCING OF LONG-TERM CARE
A. Provision of Long-Term Care
Most long-term care that the elderly receive is provided in the community and not in institutions
(see Figure 3.2). Over three-quarters of the elderly who require long-term care receive that care
in the coinmunity. Of those cared for in the community, over three-quarters are cared for by family
and friends, with the remaining quarter receiving formal care. The number of elderly receiving
f(nmal care in the community (care other than that from family and friends) thus is about equal to
the number receiving formal care in institutions. About half of those receiving formal care in the
community pay for such care.
While long-term care by friends and family may involve no direct expenditures by the elderly or
even their care givers, this care is not costless. Family caregivers may give up (he opportunity to
earn greater wages or enjoy leisure hours, and. of course, there may be varying degrees of stress
associated with caring for a disabled relative.
By the same token, the needs of the elderly, like those of persons of all ages, cannot be defined
solely by their needs for physical goods and services. Many elderly are cared for in the community
because of the importance of the social relationships established there. Psychological and
emotional needs to belong, to be comfortable with one's environment, to avoid disruptive change, to
see and care for loved ones, and to live with one's spouse, are extraordinarily strong. The desire
for community care, as opposed to institutional care, is influenced by these factors as well as by
cost and other considerations.
B. Financing Long-Term Care
In 1987. approximately $41 billion was spent on nursing home care for individuals of all ages.
There are three basic sources of financing formal long-term care (including that provided in
nursing homes) for the elderly: the income and assets of the elderly themselves, including financial
and other support from family and friends; private insurance coverage; and government programs.
Income and Assets . Out-of-pocket expenditures on nursing homes constitute the greatest portion
of long-term care expenditures, accounting for half of such spending in 1987. Again, however,
counting only out-of-pocket expenditures understates total costs. The foregone earnings and leisure
of informal caregivers represent a cost. If caregivers were to exchange their services with each
other rather than provide them within their own households, income and financial accounts would
reflect significantly greater amounts spent on long-term care.
Private Insurance . Private insurance is extremely limited at present, accounting for only I
percent of nursing home expenditures. Insurance covers such a small proportion of costs in part
because until recently there was only a limited amount of private long-term care insurance offered.
There is considerable evidence, however, that the private market for long-term care insurance is
growing. Over 100 companies currently offer long-tenn care policies, and the number of
policyholders is estimated to have grown from 200.000 in mid- 1 986 to over I million by the end of
1988.

17-

-18-
Government Programs: Medicaid . In 1984, almost 90 percent of Medicaid long-term care
expenditures were for nursing home care, in-home services accounted for slightly less than five
percent and psychiatric hospitals accounted for the remainder. Medicaid expenditures for the
tnenlally retarded and for other disabled among the nonelderly account for a significant fraction of
Medicaid nursing home expenditures. Only about 60 percent of Medicaid nursing home expenditures are
for the elderly.
Medicaid benefits are available to those who qualify by meeting categories of eligibility, for
example, income and asset tests. Individuals may become eligible for Medicaid even though income is
too high if they would be eligible for Medicaid but for failure to meet the income test and if
medical spending reduces available income sufficiently (referred to as "spending down"). Thus, manyof the individuals who receive Medicaid nursing home benefits do so after a period as a private pay
patient. Medicaid reimbursement rates in many states are below the rates for private patients.
This may act as an inhibiting factor to nursing home placement if facilities are not accessible at
the Medicaid reimbursement rate.
The rules for determining the eligibility of married couples take into account the support needs
for the noninstilutionalized spouse (referred to as the "community spouse"). Single individuals
could retain assets of $1,900 in 1988. and had to apply their income, except for a small personal
needs allowance, to nursing home care. Married couples with a community spouse were allowed to
retain income for the community spouse up to the Supplemental Security Income (SSI) needs level
($350 per month in 1 988). Assets were limited to $ 1 .900 for the community spouse, but the value of
the couples" home was excluded from the asset computation. The rate at which individuals and
couples spend down their assets is not clear and probably depends on slate policy and other factors.
Ihe 1985 National Nursing Home Discharge Survey indicates that about 44 percent of discharged
persons had received Medicaid while in the nursing home.
The Medicare Catastrophic Coverage Act of 1988 made important changes to the determination of
eligibility for married couples in which one spouse lives in the community. Although mostprovisions of this Act have been repealed, the community spouse changes were retained. Under the
new law, the community spouse is allowed to retain liquid assets of at least $12,000 and as much as
$60,000 depending on the circumstances and the state. The community spouse may also retain an
allowable income of between $800 and $1,500 per month. Thus, these new provisions appear to makeMedicaid available to most institutionalized individuals with a community spouse. However, the
majority of current nursing home residents do not have a community spouse.
Other Government Programs . Long-term care is also financed by Federal and local programs. Someof the Federal programs and provisions supporting long-term care are listed below.
Medicare. Medicare generally does not cover long-term care expenses, nor was it designed to doso. Medicare Part A does provide for reimbursement for up to 100 days of post-hospital skilled
nursing care and unlimited visits of primary skilled home health care. However, the care
requirement provisions do not include reimbursement for custodial or intermediate long-term care
facilities, and so Medicare currently pays for about 2 percent of nursing home expenditures. Themedically-related skilled nursing facility provisions of the Medicare Catastrophic Coverage Act of
1988 were repealed in 1989.

-19-
Older Americans Act Programs . The Administration on Aging provides financial assistance to
states to provide services to the elderly. Allocations are made for supportive sei"vices, including
transportalion. housekeeping, senior centers and sei"vices to individuals in long-term care institu-
tions, and for group nutrition services and home-delivered meals. Slates are required to match
these funds by at least 15 percent.
Social Services Block Grants . The Social Ser\'ices Block Grant program provides grants to states
to use at their discretion, and funding under this program provides some home-based services.
Veterans Adm i nistration Programs . VA programs finance both nursing home and home health care.
Nursing home benefits to elderly veterans who do not have service-related disabililies are limited
to 6 months of care. In Fiscal Year 1985, VA nursing homes sei^ved 20.442 veterans (elderly and non-
elderly) at a total cost of $395 million, while the VA contracted with private nursing homes to
serve an additional 38.907 veterans at a cost of $265 million and with state-run homes to serve an
additional 13.540 veterans at a cost of $48 million. This figure is expected to grow in the future
as World War II veterans age.
Income Tax Provision s. The Internal Revenue Code contains a wide variety of provisions that
affect the ability of households to cover long-term expenses. The most important of these
provisions relate to health and pension benefits and are discussed more thoroughly in Chapter 5.
Section I. below. Two other tax provisions that may be available in certain cases of long-term care
are the child and dependent care credit and the exclusion for employer-provided dependent care.
A child and dependent care credit for the care of an elderly person may be claimed if certain
conditions are met. The credit is for expenses incurred to permit the taxpayer or. if married,
taxpayer and spouse, to obtain earned income. In general, a child and dependent care credit may be
claimed against such earnings if: (I) the elderly person is physically or mentally unable to care
for himself or herself: (2) the elderly person is the dependent of the taxpayer or meets all of the
requirements for being a dependent except that the elderly person has gross income of at least
$2,050 (for 1990); (3) the person resides in the taxpayer's household (that is. regularly spends at
least eight hours per day in the taxpayer's home): and (4) the taxpayer or, if married, both the
taxpayer and spouse, are employed or are actively seeking work. (For purposes of this credit, a
spouse who is a student or who is disabled is deemed to be employed.) If these conditions are
fulfilled, dependent care expenses of up to $2,400 for one person or up to $4,800 for two or more
persons are eligible for the credit. The credit rate ranges from 30 percent for taxpayers with
incomes up to $10,000 to 20 percent for those with incomes exceeding $28,000. Thus, the maximumcredit ranges from $480 to $720 for one person and $960 to $1 .440 for two or more persons.
Employees may exclude from income subject to tax certain employer-provided dependent care. The
exclusion is limited to $5,000 a year ($2,500 in the case of a separate return by a married
individual). The amount of expenses eligible for the dependent care credit is reduced, dollar for
dollar, by the amount excluded from income under an employer-dependent care assistance program . Thedefinition of dependent care eligible for the exclusion is the same as the definition of expenses
eligible for the dependent care credit.


CHAPTER 4: PRIVATE FINANCING OF LONG-TERM CARE
I. TRENDS IN THE INCOME AND WEALTH OF THE ELDERLY
The economic well-being of the elderly has improved in recent years, both in absolute terms and
relalive to that of the nonelderly. In addition, it appears likely that those who will become
elderly in the near future will have higher standards of living than those who are elderly now.
These increases in present and future well-being are due to a variety of factors, in particular
increases in government transfers to the elderly and increases in lifetime earnings and private
pensions. Despite improvements in the well-being of the elderly in general, some have below average
incomes, and some of those with the lowest incomes, particularly single elderly women, are at
greatest risk of needing nursing home care. A small proportion of the elderly, as with the general
population, are likely to be poor in the future.
A. Measures of Financial Well-Being
Income. The relative well-being of the elderly can be assessed in part by comparing their
average income with that of other groups. Figure 4.1 presents a comparison of the average real
income of family units by the age of the head for 1967, 1979. and 1984. adjusted for size of family
unit. In all three years, average income rises with age until age 50-54 or 55-59 (depending on
the year examined) and then falls. The decline as age 60 is approached is due partly to an increase
in the proportion of the population that has moved into permanent or semi-retirement. Median income
follows a similar pattern, although the ratio of median to average income is greater at younger
ages, implying a more even distribution of income in younger years.
By 1984 the average income of families with heads aged 65-69. adjusted for family size, was
higher (han the average income of all families taken together. Families with heads over 65
typically have lower incomes than those headed by persons between the ages of 35 and 65. but they
typically have higher incomes than young families, those with heads less than 35 years old.
Available data on the incidence of poverty over approximately the same period show a similar
improvement in the relative well-being of the elderly. In 1966. the poverty rate for the elderly
was 28.5 percent, nearly double the rate for the population as a whole of 14.7 percent. By 1987.
the poverty rate for the elderly had fallen by over half, to 12.2 percent, a lower rate than the
13.5 percent experienced by the population as a whole.
There are several reasons why the data presented here underestimate the income of the elderly
relative to that of the nonelderly. First, the data presented are for before-tax income. However,
since the elderly typically face lower average income tax rates than the nonelderly. net-of-tax
income data would indicate that the economic position of older Americans, relative to the
nonelderly. is better than suggested by the figures above. Table 4.1 shows that the elderty are far
less likely than the nonelderly to have sufficient income subject to Federal income tax to be
required to file a Federal income tax return. Over 38 percent of those over 65 are not tax
filers, and so pay no Federal income tax. whereas only 5 percent of the nonelderly are nonfilers.
-21-

-22-

-23-
Table 4.1 Estimated Number of Federal Individual Income
Tax Return Filers and Nonfilers in 1990 by Age
of Primaij Filer
(1990 Levels of Income)
Number (000) Percent
Age Filers Nonfilers Total Nonfilers
Under 65 88.405 4.723 93.128 5.1
65 and Over 13.391 8.236 21.627 38.1
Department of the Treasury
Office of Tax Analysis
Note: Figures exclude dependents whether or not they are filers.
Source: Treasury Individual Tax Model runs.

-24-
Because of Ihe partial tax exemption of Social Security income, as well as other tax provisions
that favor those over age 65. the average tax rate of the nonelclerly is significantly higher than
the average lax rate on the elderly. Wage and salary income, moreover, is subject to Social
Security payroll tax. while most forms of retirement income are not subject to Social Security tax.
This differential income and Social Security tax treatment is illustrated in the examples in Table
4.2.
In addition, other noncash components of income, such as Medicare, veterans" benefits, and public
housing, are not included in these income comparisons. There is evidence both that the elderly
receive a larger share of their total income in noncash forms than the nonelderly. and that noncash
income has grown in relative importance over time. Thus, after taking into account tax payments
and noncash sources of income, the position of the elderly is further improved relative to that of
the nonelderly.
Finally, the results are based on survey data in which the elderly may underreport to a far
greater extent than do (he nonelderly. Wages are reported much more accurately than other sources
of income, but make up a much smaller propoition of the income of the elderly.
The best evidence suggests that after adjusting for all these factors, elderly househqlds--in
particular, the younger elderly-have greater financial resources than nonelderly households.15
Wealth. In addition to income, the accumulated wealth of individuals, which is ultimately
available to purchase long-term care or other goods, is an important measure of economic well-
being.
Individuals' wealth is the result of some combination of inheritances, gifts, saving over time,
and the rate of return earned on investments. While individuals' incomes fiuctuate over their
liletimes-typically starting low. peaking at middle age and then declining slightly toward
retirement years-individuals may prefer consumption to be relatively stable over time. So. one
might expect to see individuals borrow in their early years of low earnings, save in the middle,
high-earning years, and draw down wealth in their later years. However, the elderly do not appear
to reduce their wealth holdings significantly as they age.
Figure 4.2 presents Ihe distribution of median real wealth of households by age of head for the
years 1962 and 1983. Wealth is defined here as the difference between total household assets and. ... 17liabilities. The typical household with a head aged 65 or over has greater wealth than the
typical household with a nonelderly head. In terms of age distribution, the typical elderly
household has less wealth, on average, than those with a head aged between 45 and 64, but is
wealthier than households with a head aged under 45. Further, the 1983 data indicate that
households with heads aged 65-69 have the highest median wealth of any age group. These data do not
indicate that individuals rapidly draw down their savings in old age.
The economic well-being of the elderly may be understated. The wealth data are not adjusted for
the size of the household. Since households headed by the elderly tend to be small, such households
may be even better off. relative to the nonelderly. than indicated in Figure 4.2. In 1980. for
example, the average elderly household size was 1.7 persons, while the average nonelderly household
consisted of 3.0 persons.

-25-
Table 4.2 Illiistralion of Federal Income and Social Security Payroll Taxes In 1990
for Taxpayers Under and Over Age 65
Married Couple With No Dependents Filing Jointly

-26-
(O

-27-
B. Present Sources of Income
The proportion of the ekieily who receive income from different sources has changed over time,
reflecting changes in demographic characteristics of the elderly, age at retirement, eligibility
for benefits and transfers, the characteristics of benefit and transfer programs, and macroeconomic
circumstances during working lives and retirement. Fewer of the elderly receive income from
earnings now than previously. reOecting. in part, the earlier retirement age of the average worker.
On the other hand, more elderly receive some income from pensions. Social Security, and public
assistance. Income from assets is also received by more elderly now than in the 1960s or 1970s.
Pensions. Pension income is received by a minority of existing retired households,
although the proportion of households receiving pensions has been increasing rapidly. Between
1967 and 1984. the proportion of households receiving private pensions increased from 12 percent
to 24 percent, while the proportion of households receiving public pensions also grew, from 10
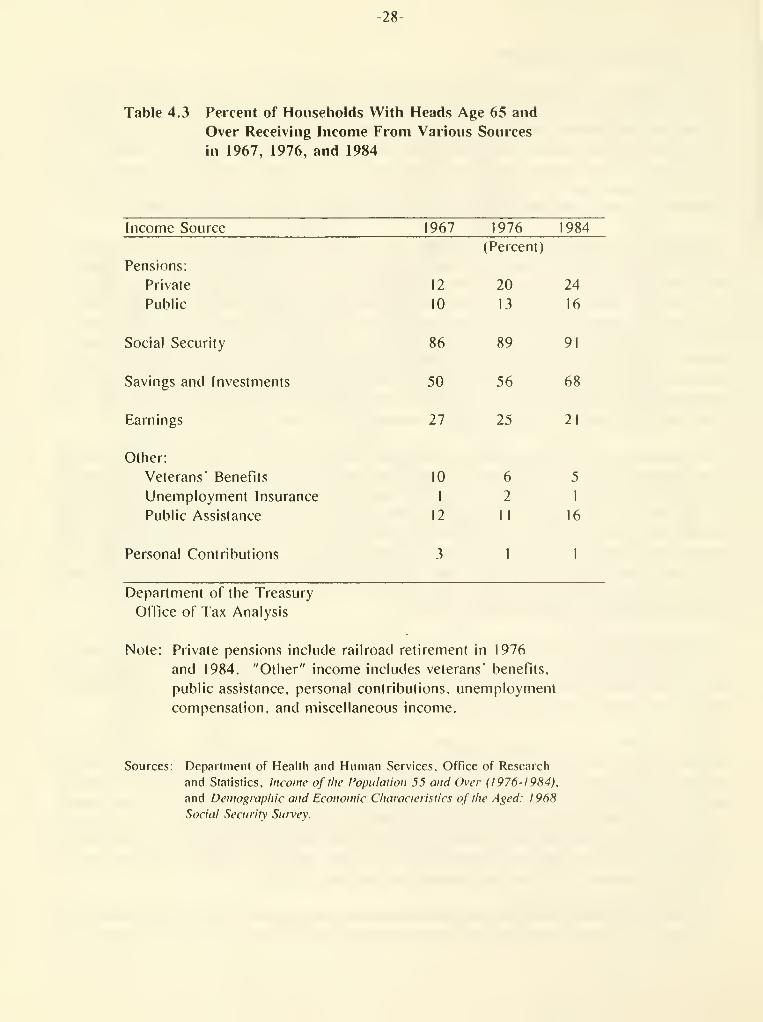
percent to 16 percent.. Table 4.3 shows the percent of elderly households that report receiving
income from various sources, including pensions, in 1967. 1976. and 1984. Table 4.4 shows the
percent of income received by households with heads aged 65 or over from various sources, including
pensions, in 1967. 1976. and 1984. Private pensions contributed 5 percent of the total income of
households with heads aged 65 or over in 1967. and 7 percent of this group's total income in 1984.
Public pensions constituted 7 percent of the income of these households in both years.
The importance of public and private pensions as sources of income to the elderly varies among
income groups. Table 4.5 shows that for households with income under $5,000. pensions accounted
for 3 percent of income in 1984. compared to 15 percent for households with income over $20,000.
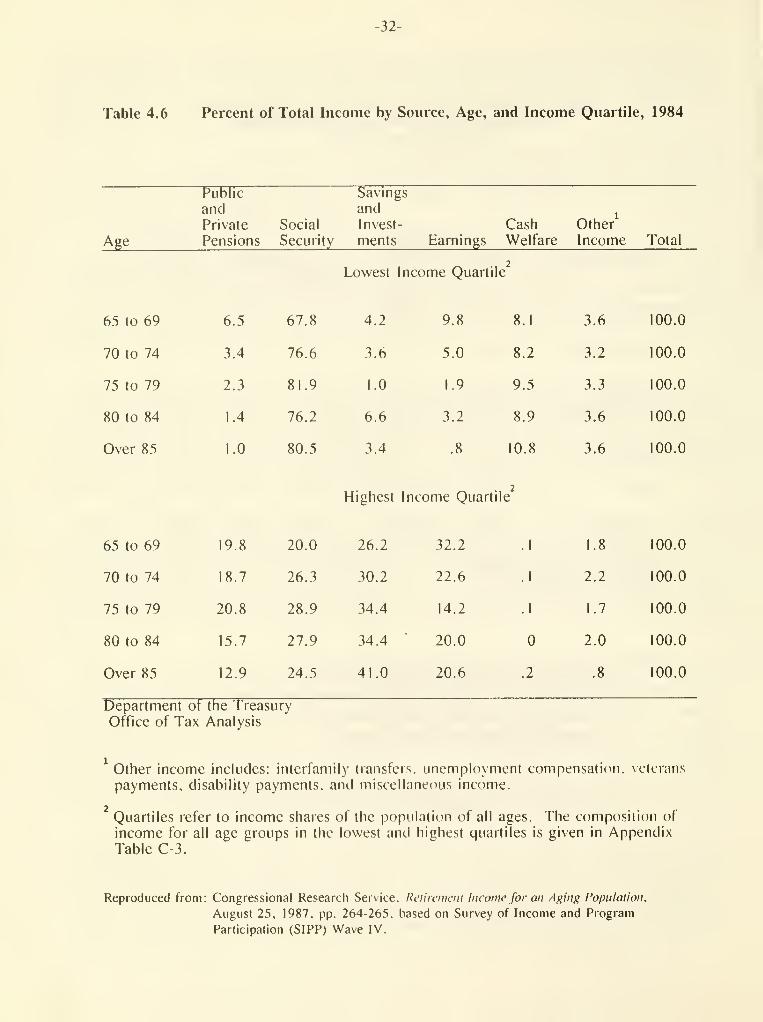
The proportion of income of the elderly accounted for by pensions varies by age as well as by
income class. For individuals in the lowest income quartile in 1984. the relative contribution of
pensions was greatest. 6.5 percent, for the youngest elderly, those aged 65 to 69 (Table 4.6).
1 his relative contribution declined with age. reaching 1 percent of income for those over 85 years
of age. By contrast, pension income accounted for 12.9 percent to 20.8 percent of income for
elderly individuals in the highest income quartile.
Social Secuilty. Social Security income is received by most households with heads over age 65,
and is the single largest source of income for these households. Recipiency grew slightly, from
86 percent of elderly households in 1967 to 91 percent in 1984 (Table 4.3), and the Social Security
share of income also grew from 34 percent to 38 percent (Table 4.4).
Most workers currently become eligible for full Social Security benefits at age 65, and for
reduced benefits at age 62. The average age at which workers begin receiving Social Security
benefits is now between 63 and 64 years old. as Table 3.2 shows. The age of eligibility for full
benefits is scheduled to increase gradually from age 65 to age 67 over a period of over two decades,
beginning with those who turn 62 in the year 2000. For persons under 70 who are eligible for
benefits, prior to 1990 the Social Security benefit was reduced by $1 for every $2 of earnings if
the earnings exceeded a statutory amount ($8,880 in 1989). The rate of offset was reduced to $1 for
every $3 of earnings in 1990 and the earnings limit increased to $9,360.
The importance of Social Security income varies among income groups, with the poor relying on it
most heavily. In 1984. Social Security benefits accounted for 77 percent of income in households
-28-
Table 4.3 Percent of Households With Heads Age 65 and
Over Receiving Income From Various Sources
in 1967, 1976, and 1984
Income Source 1967 1976 1984
(Percent)
Pensions:
Private 12 20 24
Public 10 13 16
Social Security 86 89 9!
Savings and Investments 50 56 68
Earnings 27 25 21
Other:
Veterans' Benefits 10 6 5
Unemployment Insurance I 2 1
Public Assistance 12 II 16
Personal Contributions 3 1 I
Department of the Treasury
Office of Tax Analysis
Note: Private pensions include railroad retirement in 1976
and 1984. "Other" income includes veterans' benefits,
public assistance, personal contributions, unemployment
compensation, and miscellaneous income.
Sources: Deparlment of Health and Human Services. Office of Research
and Statistics. Income of the Population 55 and Over (I976-I9H4).
and Demo^iaphic and Economic Chat acleristies of the Aged: 1 968
Social Seciiritv Snivev.

-29-
Table 4,4 Percent of Total Income from Various Sources
for Households With Heads Age 65 and Over
in 1967, 1976, and 1984
Income Source 1967 1976 1984
(Percent)
Pensions:
Private
Public
Social Security
Savings and Investments
Earnings
Other
Total
12

-30-
with less Ihan $5,000 in income, but only 20 percent of income for households with income over
$20,000 (Table 4.5). This difference in importance reflects both the design of the Social Security
program, with higher income replacement rates for lower income workers, and the greater amount of
income from other sources for higher income households.
The share of income contributed by Social Security also varies by age group. For instance.
Social Security accounted for 67.8 percent of the income of individuals aged 65 to 69 in the lowest
income quarlile. but between 76.2 percent and 81 .9 percent of income for older groups in the same
quartile (Table 4.6).
Income from Savings and Investments . Income from savings and investments was received by over
two-thirds of households with heads over age 65 in 1984. and was their second largest income
source. The proportion of these households receiving income from savings and investments grew
from 50 percent in 1967 to 68 percent in 1984. Savings and investments income became increasingly
important to the elderly, rising from 15 percent of income in 1967 to 28 percent of income in
1984.
Again, there is a great deal of variation among the elderly. Income from savings and investments
wasaminor source of income (4 percent) for households with under $5,000 of income in 1984. but was
a inajor source of income (39 percent) for households with incomes over $20,000. Among individuals
over age 65 who were in the lowest income quartile in 1984. the share of income that came from
investments and savings showed no clear pattern. For individuals in the highest income quartile.
however, the share of income from savings and investments rose with age.
Earnings. Earnings continue to play a less important role for the elderly over time. Fewer
households with heads over age 65 reported earnings income in 1984 than in 1967. and the share of
earnings in total income for this group fell as well. These data are closely related to the
tendency toward earlier retirement reported earlier. In 1967. 27 percent of these households
received income from earnings, and earnings were 29 percent of their income. By 1984. only
21 percent of them received earnings income, and earnings accounted for just 16 percent of their
income.
The importance of earnings to elderly households depends on both income and age. Earnings were
too small a component of income to measure for elderly households with total income under $5,000.
and only 10 peicent of income for households with incomes between $5,000 and $ 10,000. However,
earnings are an important component of income for these individuals in the upper-income quartile,
accounting for 23 percent of their income in 1984. Among individuals age 65 and over in both the
lowest and highest income quartiles. earnings are a larger proportion of income for younger
individuals (those between 65 and 69) than for older individuals. However, some of the oldest
individuals in both quartiles (those over 85) report earnings.
Other Income Sources . Pensions. Social Security, savings and investments, and earnings are the
primary sources of retirement income. They accounted for nearly all (96 percent) money income of
households headed by persons age 65 and over in 1984. The distribution of the remaining sources
of income, primarily Social Security disability and welfare payments, varies with income level.
These income sources are more important for lower-income households and constitute approximately
15 percent of their income. The importance of these income sources rises with age.

-31-
Table 4.5 Percent of Total Income from Various Sources
for Households With Heads Age 65 and Over
by Income Group, 1984
-32-
Table 4.6 Percent of Total Income by Source, Age, and Income Quartile, 1984
Public Savings
and and^
Private Social Invest- Cash Other
Age Pensions Security ments Earnings Welfare Income Total
Lowest Income Quartile2
65 to 69

-33-
C. Future Income Sources
The coniposilion of letireinent income is likely to continue to change in tlie future in response to
economic, institutional, ancldemographic changes. Concerns about income adequacy for tiiosewiio will
retire in the early decades of the next century need to take account of these changes. While it is
not possible to predict precisely the magnitudes of most changes, the general directions often are
clear. For some income sources, such as Social Security, where program rules are embedded in
legislation, somewhat firmer predictions can be made, if the legislation is assumed to remain
unchanged.
Pensions . As noted above, pensions currently provide 14 percent of total retirement income,
and are a significant share of income for upper-income retiree households but only a small share
for lower-income households. The proportion of households receiving pension income is likely to
continue to grow, for several reasons. First, the proportion of workers covered by a private
pension plan increased dramatically from 22.5 percent in 1950 to 47.2 percent in 1980. Employ-
ment by stale, local, and Federal governments has also grown over this period, and public employers
typically offer pension plans. Thus, future retirees are more likely to be covered by pensions.
In addition, provisions of the Employee Retirement Income Security Act of 1974 (ERISA) increase
the piobability that workers covered by employer pension plans will actually receive retirement
benefits. Important provisions include shorter vesting requirements for pension lights and
establishment of Individual Retirement Accounts (IRAs) for workers whose employers do not provide
pension plans. It is therefore increasingly likely that workers who reach retirement age will be
eligible for an employer-provided pension. ERISA also established the Pension Benefit Guarantee
Corporation (PBGC) to insure the retirement benefits of employees in defined benefit plans, and
subsequent legislation has strengthened PBGC's financial status.
Provisions of the Retirement Equity Act (REA) of 1984 make it more likely that spouses of retired
workers will receive pension benefits through joint and survivor annuities. REA also lowered the
latest age of participation to 21 years and permitted longer breaks in service. In fact, most of
the major tax acts of (he last decade contained provisions that broadened pension coverage and
vesting and strengthened funding.
Changing labor force participation patterns also are likely to increase pension recipiency by
households. Since the 1950s, the proportion of women who participate in the labor force has been
growing, primarily because women are remaining in the labor force as they age, rather than working
only in their early years. Thus, women are accumulating both labor force experience and pension
rights. Future retiree households are therefore more likely to receive pension income from both
spouses.
Employer-provided retiree health benefits can be an important component of noncash income for
retirees who receive them, and receipt often is lied to pension recipiency. A study in 1986 by the
Department of Labor found that employer-provided retiree health benefits paid 23 percent of the 1977
total health care costs of retirees over age 65 who were covered. By comparison, retirees over age
65 who purchased individual health insurance had only 12 percent of their health costs paid for by
the insurance. In 1986, 72 percent of employees in medium and large firms were covered by health

-34-
insLirance plans that provide retiree coverage. Over three-quarters of employees whose firms offer
retiree health benefits work for firms that offer their retirees the same coverage as when employed
(although benefits may be reduced to the extent that expenses are reimbursed by Medicare). Half of
the employees whose firms offer retiree benefits work for firms that offer the benefits at no
cost. The financial liability associated with these benefits has been highlighted recently by the
Financial Accounting Standards Board proposal to include the unfunded liabilities on corporate
balance sheets. Whether this component of retirement income will grow in the future is unclear.
Social Security. Social Security will continue to remain an important component of retirement
income well into the next century. The 1983 amendments to the Social Security Act are expected to
place the system on sound financial fooling, with revenues exceeding outlays until about 2030.
Technical insolvency of the system would be reached about 2050. Real Social Security benefits will
continue to grow over time under relatively modest assumptions about economic growth over the
period. As with pension income, increases in female labor force participation and in total years
worked should provide a greater number of future retirees with Social Security benefits.
Income from Savings and Investments . The marked increase of savings and investments income as
a source of retirement income is generally attributed to the relatively robust real growth in the
economy during the time when current retirees were in their prime earning years, together with
relatively high real interest rales earned by those assets in recent years. Whether the growth in
savings and investments income refiects a continuing trend or simply the particular macroeconomic
circumstances of the last 20 years is unclear. The future of the aggregate savings rate and the
degree of offsets caused by pension and Social Security savings are themselves the subjects of
debate.
Earnings . 1 he future role of earnings in the income of persons over 65 is also unclear. The
labor force participation rate of both men and women in this age group has been dropping over time.
In addition, the participation rates of somewhat younger persons aged 55 to 64 also have been
falling, in part because of early retirement incentives in private pensions. Obviously, if these
two trends continue, the share of earnings in income would continue to drop.
Two provisions in current Social Security law could, however, counteract this trend. First,
Social Security benefits received by persons between the ages of 65 and 70 were offset at a rate of
$1 for every .$2 of annual earnings above $8,880 prior to 1990. In 1990. the offset rate dropped to
$1 for every $3 of earnings above $9,360. making income from earnings more attractive to this age
group of Social Security beneficiaries. Second, (he minimum age at which unreduced Social Security
benefits will be paid will slowly rise from the current age 65 to age 67 over a period of about two
decades beginning with persons aged 62 in the year 2000. Persons between the ages of 65 and 67
will have less incentive to retire and. accordingly, a greater incentive to continue to earn than
under current rules. The net effect of labor force participation trends and changes in Social
Security rules on the proportion of income from earnings is unclear.
D. Conclusions: The Financial Weil-Being of the Elderly and Long-Term Care Financing
Exact and unambiguous measures of the economic well-being of the elderly are impossible to
construct. Nevertheless, the data presented here support several conclusions. First, the after-tax
income of the elderly is approximately the same as that of the noneklerly, while the elderly have

-35-
greater wealth and a lower poverty rate. In addition, the elderly between the ages of 65 and 70 are
better off than both the older elderly and the nonelderly in ternis of income, poverty rates, and
wealth. Moreover, they have more leisure time, in terms of years of retirement, as the typical age
of retirement has fallen. There is little evidence that the elderly dissave rapidly. Further, it
appears likely that future retirees will be better off than the current elderly. In particular,
private pensions and Social Security should continue to grow in real tenns.
The problem of financing long-term care is not so much a problem of the financial resources of
the elderly relative to the financial resources of other age groups, but a problem of long-term care
costs relative to the financial resources of the elderly and the match between an individual elderly
person's financial resources and long-tenn care requirements. Retirement income of various types
provides one of the sources of paying for long-term care even for those who cannot pay all costs.
But the cost of an extended period of formal long-term care is significant. Therefore, risk-pooling
or insurance represents one alternative to financing long-term care. Several of the options
presented in this Report attempt to incorporate a risk-pooling element into the current system of
retirement income as a means of increasing resources available should an individual require
long-term care.
The level of resources of the elderly and the virtual absence of long-term care insurance within
the broad public and private retirement system raise the issue of whether existing private pensions
and public programs are well adapted to current and future needs. The existing retirement system
is not well-designed to deal with increased longevity, the improved well-being of the younger
elderly, the greater likelihood of need for long-term care by the older elderly, or the lower income
of the older elderly than of generations that succeed them.
Finally, the analysis suggests that there are large numbers of elderly that could afford
long-term insurance, in the sense that premiums would not constitute a prohibitively large portion
of their resources. Younger elderly, in particular, may be able to afford to finance their own
long-term care over their entire retirement period, but not necessarily if they wait until later
years of retirement to begin insurance premium payments.
II. DEVELOPMENT OF THE PRIVATE LONG-TERM CARE INSURANCE MARKET
The scarcity of private insurance for long-term care is frequently said to be the primary problem
with the current long-term care system. 1 here may be identifiable and correctable reasons why the
private market for long-term care insurance has only come into existence recently and remains small.
The presence of certain market conditions that limit a market is temied market failure. If there is
market failure in the long-term care insurance market, it is important to identify its sources and
to consider whether failure of the market to provide long-term care insurance should be corrected.
The lack of a significant market is not necessarily an indication of market failure in itself,
however. There are many products that conceivably could be produced, but are not simply because
there is insufficient demand for them at a price that would cover producers" costs.

-36-
Before proceeding, it is useful to recall that under current law nursing home care is financed
about equally by private citizens and by governments. Further, most of the long-term care the
elderly receive is provided in the homes of the elderly or their relatives, not in nursing homes.
The costs of long-term care, therefore, are borne in large part not by taxpayers generally through
government programs, nor even by those in need of the assistance, but rather by those who currently
provide for such care in the home. Nursing home care, which is generally the only type of long-term
care covered by current insurance policies, is most likely to be required when one or more of the
following events occur: there are no spouses or children who can help the person in need of
assistance; for a variety of reasons, the person in need of care and the potential caregivers in the
family prefer alternative arrangements to care in the home: or the need for assistance has reached
the point where it can no longer be handled adequately outside of an institutional setting. Thus,
even for those with equal risk of functional impairment or disability, the value of long-term care
insurance may vary widely depending upon the relative desire for the particular type of care that
may be made available under the insurance package.
This section concludes that the problems facing long-term care insurers are similar to those
facing providers of other types of insurance, although several problems may be somewhat more severe
for long-term care insurance. Characteristics specific to long-term care also make current
insurance products relatively unattractive to consumers. Thus, the lack of a substantial market for
long-term care insurance -at least as currently marketed -may be rational. The analysis suggests
that any policy changes should proceed on a modest basis. There is much to be learned about
long-term care insurance as a product— its potential utilization, its value to individuals, the
ability to measure eligibility and needs accurately and fairly, and the ways in which the product
might optimally be designed. To assume the answers to all these questions could result in the
development of a product with high cost relative to value to the consumer.
A. Possible Market Failure?
Consumer Misinformation . One reason given for consumers' failure to purchase private long-term
care insurance is that they have incomplete or incorrect information about the product and their
need for it. Individuals are said to systematically underestimate the probability of requiring
long-term care in the future and the cost of such care should they require it. There is also
evidence that many people mistakenly believe that Medicare or their Medigap policies will cover
their long-term care costs.
Consumers clearly need correct information about their probable long-term care needs and the
noninsurance alternatives available to pay for it. Private insurance companies have an incentive to
provide such information in order to stimulate demand for their policies. In fact, a comparison of
two recent surveys by AARP shows a sharp rise in the awareness of consumers regarding long-term care
insurance and needs.
Adverse Selection. Insurance markets often suffer when providers lack information on the
riskiness of individuals they insure. When the purchasers of insurance policies know more about
their own riskiness than do the insurance providers, adverse selection may result. Adverse
selection implies that when insurance is offered against some event, individuals who know they are
likely to experience that event find insurance more attractive than individuals who know they are
-37-
unlikely to experience that event. Adverse selection may prevent a private insurance market from
developing because premium levels must rise high enough to allow insurers to earn a market rate of
return, but thereby may become too high to make policies attractive to low-risk individuals. Thus,
an insurance market that includes low-risk individuals may fail to develop even though these
individuals would be willing to pay a premium that the insurance company would set if the insurer
could be certain that the individual was a good risk.
The problem of adverse selection can be somewhat offset by underwriting procedures that take
account of some, but not all, risk factors. Adverse selection provides a rationale for group
insurance or mandatory insurance since, in either case, the low-risk individuals cannot opt out
because the premium is too high. Why adverse selection would be a greater problem for long-term
care insurance than for acute health care or life insurance is not clear. Both of these insurance
markets have become well-developed over the years despite potential adverse selection. Lx)ng-term
care insurance would face greater barriers only if consumers have a larger informational advantage
regarding their probability of requiring long-term care in the future than of their probabilities of
needing acute health care or of dying.
Induced Demand . All insurance shares the problem of induced demand. The act of insuring against
an event that is. at least to some extent, under the control of the insured, such as long-term care,
makes that event more likely because its costs are then covered by insurance. Insurance coverage
effectively lowers the cost of the event, and makes preventive actions less valuable. Lower costs
generally raise the demand for a product. This induced demand raises the cost of insurance because
more claims are paid, and it generally leads to insurance coverage that is limited by deductibles
and copayments.
Induced demand may pose a significant problem for long-term care. Most long-term care is
provided informally, in the home, and a significant portion of such care is custodial, rather than
medical. The site of long-term care is under the control of the insured to a greater extent than is
acute medical care. Moreover, those with equal needs or equal risks of needing care in the home may
nonetheless have very different demands for institutional care depending upon the adequacy of
current arrangements. Current long-term care insurance policies generally only insure against care
in nursing homes, although a growing proportion cover adult day-care services. Significant amounts
of ordinary living expenses, such as food and shelter, are often provided simultaneously with
long-term care in nursing homes. Long-term care insurance is likely to create induced demand for
nursing home care as covered individuals switch from receiving informal care at home to receiving
formal care. Insurance for home care could also create induced demand for the covered semces,
were such insurance offered, because people generally prefer home care to nursing home care.
To take account of induced demand, long-term care insurance policies may need significant
copayments. and perhaps deductibles. Such policies may also need to establish some clear
eligibility criteria related to the degree of disability. Unlike acute care, disability is rarely a
"yes" or "no" matter. It is more of a continuum of need, with the actual need dependent upon both
the degree of disability-which is hard to define-and the support system a person has to fall back
on. Under these circumstances, there may be a need to screen a very large population and limit
coverage to some specified subgroup that is both clearly disabled and unable to cope without social
support sei-vices. These features keep induced demand and price increases to a minimum, and prevent
long-term care insurance from covering ordinary living expenses.

-38-
Institutions as "Tollgates" . Since insurance is likely to induce increases in demand, such
insurance may tend to provide institutional care rather than home care. Because most people view
institutional care as less desirable than care in their own home, limiting coverage to nursing homes
can create a "tollgate." Only those with serious disabilities will demand long-term institutional
care. If there were low cost ways for insurers to determine an individual's true "need" for
long-term care, tollgates would not be necessary.
Limiting coverage to institutional care does limit costs to the insurer, but at the cost of
increased inefficiency in the long-term care market. The reason for this is that $1 spent by the
insurer on institutional long-term care may be worth less than $1 to many elderly individuals
receiving that care because they would prefer to be cared for at home. Despite the disparity
between expenditures and the recipient's valuation of them, it may be a rational choice for that
individual to enter a nursing home if all or part of the cost is borne by a third party.
Predictab ility. Related to the problems of adverse selection and induced demand are the
difficulties that insurers may have predicting long-term care costs and determining premiums that
will cover those costs. Insurers may be unwilling to take the risk that costs will be much higher
than expected and may choose not to enter the long-term care insurance market. Insurers that do
enter the market may charge premiums too high to stimulate consumer interest, or may initially write
policies that offer fiat dollar coverage rather than covering long-teim care ser\'ices.
The costs to insurers are always uncertain, whether the insurance covers long-term care, acute
care or some other event unrelated to health. However, the problem may be somewhat more severe for
long-term care coverage than for many other types of insurance. Less is known about the response of
long-term care usage to third-party payments than is known about the response of acute care usage or
other currently covered risks. In addition, because long-term care often is not used until manyyears alter a policy is purchased, insurers may not have sufficient opportunity to adjust premiums.
Uncertainty regarding future costs leads to long-term care policies that limit insurer risk
through characteristics such as providing a maximum benefit, high coinsurance rates, or multiple
condifions for receipt of benefits. Some recent criticisms of existing long-term care insurance
probably relate directly to clauses that insurance companies may have inserted to reduce risk, but
which simultanecMisly decrease the extent to which policies will cover various types of needs.
Reduced risk for the insurance company generally means increased risk for the insured.
Capital Market Imperfections . Much of the wealth of older individuals is in their homes. This
wealth is illiquid, and so cannot typically be used to purchase long-term care insurance or other
goods and sei"vices. This illiquidity would not. in and of itself, hold back the development of a
market for long-term care insurance. Possible market solutions to this problem, such as home equity
conversions, exist, although they have not been extensively employed. The U.S. Department of
Housing and Urban Development has initialed a "Home Equity Conversion Mortgage Insurance
Demonstration" program. In addition, purchase of long-term care insurance at an earlier age would
avoid the necessity of large payments late in life.

-39-
B. An Unattractive Product?
Discussidn in tlie preceding section suggests liiat the market for long term care insurance faces
the same problems faced by other sorts of insurance, although certain problems may be exacerbated
for long-term care coverage, resulting in a small market for long-term care insurance. It may be
features of the product itself that consumeis find objectionable, rather than market failure. If
this is the case, government policy should aim at providing or encouraging a type of financing for
long-term care that avoids these features.
Many policies currently and recently offered or contemplated have significant limitations.
They generally pay only limited indemnity benefits of between $10 and $120 per day, only apply to
care in a nursing home, and do not adjust benefits over time for infiation. Policies bought many
years in advance of requiring long-term care, when premiums tend to be lower, will likely cover
only a small portion of the actual cost of such care when needed.
These policies generally also have a number of important exclusions. Virtually all policies sold
before 1989 required that the patient be admitted to a nursing home within 14 to 30 days of a
hospital stay of at least 3 days and that the admission be for the same or related condition as the
hospital stay. However, many elderly individuals with chronic debilitating conditions may require
assistance with daily functions such as eating and bathing, rather than medical care, and those
needs do not necessarily develop following a period of acute illness. Benefits also generally do
not begin for between 20 and 100 days in the nursing home, and policies typically pay benefits for
a maximum of 1 to 4 years. Premiums, which depend largely on age. vary from $200 to $1 .500 per
year, and insurance is generally unavailable for those over 80. although the need for long-term care
rises with age.
A growing proportion of new policies do cover long-term care provided at home, such as
convalescent care, homemaker or companion services, or skilled nursing care. The home care benefit,
lor those that offer it. is typically one-half the benefit paid for skilled nursing home care,
although there is wide variation in eligibility.
Limits on Choice. The appeal of current long-term care insurance policies may be limited by the
fact that individuals tend to view institutionalization as unattractive. Most people would prefer
to be cared for at home and. so. may prefer insurance policies that covered care at home. Other
consumers may well prefer to choose the form of long-term care they receive at the time the need
arises, rather than at the time they purchase a long-teim care insurance policy. One.way to do this
would be through policies that provide increased income, to be spent as the insured decides.
Private insurance could, in theory, cover long-teiTn care at home in a much less restrictive
manner than current policies. However, problems of defining covered services and induced demand
would likely be greatly increased. The same problems would confront any public insurance that
covered home care.
Another unattractive feature of long-term care insurance is that it meets only one of many
possible needs of old age. Consumers prefer to buy acute health care policies that meet many needs,
rather than policies for specific health needs such as cancer or cataracts. Similarly, long-term

-40-
care insurance offered as part of a package dealing with (he broader retirement needs of the elderly
would likely be more attractive than a long-term care policy alone.
Long-Term Care Insurance and Pensions . One way of overcoming many of these limits on
choice would be to allow pension payments to be adjusted so that they have tiie same actuarial value,
but would be adjusted for certain events requiring long-term care. Such adjustments would offer
consumers greater choice, and would provide more individuals with access to funds for long-term care
than would long-term care insurance alone. Consumers likely view the problem of saving for
long-term care needs as part of a more general problem of saving for retirement. Therefore,
long-tenn care insurance may be viewed more favorably if it is incorporated into a pension
structure.
Medicaid as the Payor of Last Resort . The development of a broad private market for long-term
care insurance may well be affected by the existence of Medicaid as the payor of last resort. The
existence of Medicaid will, in addition, have important implications for the design of policies to
encourage long-term care insurance.
Medicaid effectively covers each individual with a public long-term care policy. The policy
deductible equals current income plus wealth not excluded from the "spend down" provisions, which
for a community couple includes their home as well as up to $60,000 of liquid assets under the 1988
Medicare Act. Thus, any additional insurance coverage-private or public—can be seen, at least in
part, as asset or bequest protection rather than long-term care insurance.
Individuals with little wealth are not likely to demand much, if any. private long-term care
insurance. Medicaid already provides fairly complete coverage, at low cost, for nursing home care.
Even persons of moderate means may find their demand for private insurance significantly decreased
by the existence of Medicaid, since it represents at least partial coverage. The revised asset and
income levels that (he Medicare Catastrophic Coverage Act permits may make Medicaid more appealing
to moderate-income elderly married couples. Although the existence of Medicaid may affect the
development of a broad market for long-term care insurance to some groups, some Medicaid features
may make insurance attractive. Individuals, particularly single individuals, may be concerned with
the possibility of spending down their assets. A significant number of nursing home entrants
recover from their disability and leave the institution, often after making large out-of-pocket
expenditures or spending down. The current system may provide an incentive for individuals to
remain institutionalized even when that is no longer necessary or desired. The high costs of
spending down to Medicaid eligibility under the current system may offset some of (he disincentives
facing (hose with moderate wealth in their decision to purchase long-term care insurance. The
desire to leave bequests may also be a strong motivation for purchasing long-term care insurance,
for those with sufficient wealth to contemplate bequests.
For individuals with somewhat higher levels of wealth the demand for long-term care insurance
will decline the easier it is to divest oneself of assets, for instance, by distributing them to
children or spouses, before requiring long-term care. As the law currently stands, Medicaid mayinclude asset transfers made up to two years before entering a nursing home as part of the
patient's wealth, although not all states check this far back. In any case, it is possible for
many elderly to begin asset transfers more than two years before requiring long-term care, thus

-41-
avoicling significant costs. When such transfers occur. Medicaid becomes a system which protects
bequests, by shifting the costs of long-temi care to the government, hence taxpayers in general.
Protecting bequests is not the role Medicaid was intended to play.
The existence of Medicaid as the payor of last resort has several potential implications for
public policy toward long-term care. First, policies that liberalize Medicaid spend-down and
asset rules will inhibit to some extent the development of the market for private long-term care
insurance. Conversely, public programs that encourage purchasing private long-term care insurance
will reduce Medicaid costs somewhat, offsetting in part costs of the programs themselves. Further,
Medicaid cost reductions will be larger (he greater the number of purchases of private insurance by
lower-income taxpayers. It seems unlikely, however, that incentives to purchase insurance will be
very effective for lower-income households in part because of the coverage Medicaid provides them.
Lower-income households also are less likely to purchase insurance to the extent that incentives to
purchase operate through the tax system and confer the greatest benefits on those facing high tax
rales. Long-term care insurance may be more attractive to middle- and higher-income individuals whocan afford to insure for care they regard as more attractive than Medicaid.
Individual and Group Insu rance . Virtually all long-term care insurance policies have been
offered on an individual, rather than group, basis until recently. Individual policies make
long-term care insurance more expensive, both because the enrollment of groups can mitigate the
problem of adverse selection, and because marketing and sales costs per purchaser may be
significantly lower for group insurance, due to economies of scale. The cost difference between
group and individual policies may make the difference between a small and a substantial private
market
.
The availability of group insurance might also encourage the purchase of insurance at younger
ages. Insurance companies state that premiums for long-term care insurance are low if the insurance
is purcha.sed at a relatively young age. but become prohibitively expensive for many at sufficiently
advanced ages.
The question is why long-term care policies are rarely offered on a group basis. One possibility
is that the group market has been simply slow to develop, but will do so over time. Another is that
employees have preferred other fringe benefits to long-term care insurance. Employers' uncertainty
about the tax treatment of long-term care insurance may also have inhibited their offering such
policies. Clarification of the tax law may be of some use in encouraging employers or other
affinity groups to offer long-term care insurance.


CHAPTER 5: TAX PROVISIONS AFFECTING LONG-TERM CARE FINANCING
I. FEDERAL TAX POLICY TOWARD PRIVATE PENSION AND HEALTH PLANS
In addition to financing and providing long-term care directly, the Federal government
indirectly supports those with long-term care needs through a variety of tax provisions. By
encouraging private pension and health insurance coverage of employees, the Federal government aims
to reduce the number of individuals who have inadequate means for retirement years or insurance to
cover catastrophic health needs. This section examines these policies. Other government programs
and policies affecting long-term care are outside the scope of this Report.
A. The Basic Pension, Health Insurance, and Annuity Models
Tax incentives for retirement, disability and health benefits fall generally into one of three
models. Although there are exceptions, an understanding of these three models is crucial in
understanding incentives that might be applied to long-term care benefits. Part of the debate over
private provision of long-term care relates to the model into which long-term care benefits might be
put. Long-term care benefits do not (It easily into any of the three models. They are not
primarily health benefits because they may cover many expenses of ordinary living, as do typical
retirement plans. But neither are they identical to a pension nor to an annuity. Long-term care
insurance might be prefunded. as are employer-provided pension plans, or paid for on an annual
basis, as are most employer-provided health insurance plans. It might be paid for out of after-tax
dollars, as in the case of many private annuities, or out of before-tax dollars, as in the case of
many employer-provided pension plans. Distributions might be taxable, as are pension and some
disability payments, or they might be nontaxable, as are payments from most health insurance
plans.
The Basic Pension Model. Under the basic pension model, an employee is not subject to tax at
the time payments are made by an employer into a pension plan on behalf of the employee. Instead,
taxation of such payments is deferred until the employee retires or otherwise receives distributions
from the pension plan. There is also deferral of taxation of income earned on deposits in the
pension plan until distributions from the plan are made. If a taxpayer is in the same tax bracket
at the time of receipt of pension benefits as at the time that payments were made into the pension
plan, then the value of deferral of taxation is equal (in present value terms) to current taxation
of payments into the pension plan as if they were wages, but nontaxation of the income earned on
pension fund deposits. The basic pension model, therefore, provides the equivalent of consumption
tax treatment: taxation of income when consumed, not when earned.
The basic pension model applies to all tax-qualified retirement plans. Thus, the basic pension
model applies to employer contributions to retirement plans, to deductible contributions to
Individual Retirement Accounts (IRAs). and to employee contributions to so-called section 40l(k)
plans. On a current cash flow basis, the tax expenditure budget indicates that annual outlays in
excess of $70 billion would be required to provide a similar subsidy through direct expenditures to
pensions. Keogh plans, and IRAs.
-43-

-44-
The Employer-Provided Health Insurance Model . The major tax provision favoring health insurance
is (he exclusion from an employee's income of the value of employer-provided health insurance.
Most health insurance is paid for and provided on an annual basis. Further, welfare benefit fund
rules require that a tax be paid on the interest earned on deposits in prefunded health benefit
plans. There is. therefore, generally no tax subsidy for savings in health plans (the exception is
the prefunding of health benefits on a tax-favored basis through pension plans, discussed below).
As a consequence, the employer-provided health model is equivalent to nontaxation of a wage payment
when received in the fonn of health insurance. The tax expenditure budget for the U.S. Government
lists this as among the largest of all income tax expenditures-outlays in excess of $37 billion per
year would be required to provide a similar subsidy directly through the Department of Health and
Human Services. Another $19 billion would be required to match the loss in Social Security tax
revenues.
In addition, for tax years beginning in 1987, 1988, or 1989. and for part of 1990, a
self-employed individual may deduct 25 percent of the cost of providing medical insurance to the
individual and his or her spouse and dependents. This is a temporary provision, added by the Tax
Reform Act of 1986 and extended by the Omnibus Budget Reconciliation Act of 1989. it expires on
October I, 1990. The President's 1991 Budget proposed a permanent extension.
The Private Annuity Model . Private annuities (outside of those under the basic pension model)
are purchased with after-tax income; no deduction is allowed for the purchase of the annuity.
However, taxation of the interest earned on the deposits in an annuity is deferred until receipt.
Eventual annuity payments are then composed of payments of both previously taxed deposits and
untaxed interest earnings. The latter are subject to tax, while the former are not again subject
to tax.
The private annuity model provides tax benefits very different from both the employer-provided
health insurance model and the basic pension model. Recall that employer-provided health insurance
can be viewed as equivalent to nontaxation of wages spent immediately on health insurance, while
pensions can be viewed as providing taxation of wages (in the form of payments into a pension plan)
but not the interest earned on pension funds. With private annuities, the initial amount is subject
to tax and the interest income earned on the annuity is only deferred from taxation. Thus, the
pension model generally provides a greater tax subsidy than does the annuity model.
The private annuity model applies not only to many annuities offered by insurance companies, but
also to certain IRAs. For employees covered by an employer pension plan who also have income
above a limit, deposits to IRAs are not deductible, but are taxable under the rules applying to
annuities. Similarly, the private annuity model applies to employee contributions of after-tax
income to retirement plans.
Benefits Practice . In practice, tax preferences for almost all forms of health, pension, and
annuity income fall under one of these models. Almost no expenditures on health are granted a
combination of the benefits of the basic pension model and the employer-provided health insurance
model. Tliat is, there are few prefunded health plans that receive the combination of a deduction

-45-
for deposits inlo the plan, nontaxation of interest earned on plan deposits as it accumulates, and
an exclusion of distributions from the plan. Such generous tax treatment would be almost without
parallel anywhere in (he Tax Code. While technically such tax treatment might be allowed under
current tax law in certain circumstances (see the discussion on prefunding of health plans, below),
there appear to be few benefits that currently qualify.
B. The Itemized Deduction for Medical Expenses
Although little income qualifies directly for the combined benefits of both the basic pension
model and the employer-provided health insurance model, many elderly individuals are able
nonetheless to achieve essentially the same results through another means.
Approximately 40 percent of the elderly are not subject to Federal income tax. The decline in
taxability between years of work and retirement effectively allows many to receive nontaxable health
benefits. In addition, for those elderly and nonelderly with taxable income and with significant
nonreimbursed medical expenses, an itemized deduction is allowed when such expenses are in excess of
7.5 percent of adjusted gross income. This deduction is also allowed for expenses of a spouse or
dependent, as well as for expenses of persons who would be dependents of the taxpayer (the taxpayer
provides one-half of support and meets certain other tests), except that the supported person had
more than $2,050 in income (in 1990). For example, an itemized deduction for the medical expenses
of an elderly parent who lived with a daughter could be taken by the daughter if she provided
one-half of the parent's income, even though the parent had income over $2,050.
30
The cost of institutional care may be treated as a medical expense under some circumstances.
In effect, many of the elderly with pension income will find that during many years of retirement
their income is nontaxable, they are in lower tax brackets than when employers made deposits to
pension plans on their behalf, or they are eligible for the itemized medical deduction. Only
higher-income elderly persons without substantial medical expenses effectively will fail to benefit
both from the basic pension model and from nontaxation of retirement income spent on medical
expenses.
C. Qualifications and Limits on Tax Benefits Under the Models
There are many qualifications and limits to the use of the three basic models applying to
pensions, employer-provided health insurance, and private annuities. These are summarized below
and described in more detail in Appendix A.
Limits on Tax-Preferred Contributions, Benefits, and Employer Funding . There are a number of
restrictions on annual contributions and benefits that may be provided to any individual under
defined contribution plans and defined benefit pension plans of an employer. The separate plan
limit for defined benefit plans, for instance, provides that an individual's annual retirement
benefit beginning at age 65 (or Social Security retirement age) may not exceed $90,000 in 1987 and
$98,064 in 1989. This figure is indexed in subsequent years. The annual contributions made to an
individual's account in a defined contribution plan may not exceed the lesser of 25 percent of the
individual's compensation, or $30,000.

-46-
There are also limits on the deductibility of contributions. For example, in the case of a
defined benefit plan, an employer may deduct only contributions that are necessary under reasonable
actuarial methods to fund retirement benefits within the current limits on annual benefits. In
determining the deductible level of prefunding. the employer may project salary increases of
employees (and thus prefund for a projected retirement benefit) but may not project increases in the
annual $90,000 limit. If a plan provides a cost-of-living increase as part of the benefit, the
employer may prefund for this projected increase but only within the $90,000 limit.
Distribution Rules . Qualified retirement plans are also subject to minimum distribution rules
that require that the distribution of an individual's retirement income commence by a certain age
and that the benefits be paid out at least as rapidly as on a level, nonincreasing basis.
Generally, all distributions from qualified plans are taxable, except to the extent that they are
allocable to basis (i.e., employee contributions from after-tax income). Basis is generally
recovered on a £ro rata basis.
Single lump-sum distributions may be eligible for special forward averaging which generally
results in lower tax. Forward averaging provides an incentive to make early lump-sum withdrawals
of retirement savings, thereby potentially encouraging the spending down of savings.
Nondiscrimin ation Rules . To be eligible for tax-favored treatment, health benefits provided
pursuant to a self-insured, employer-sponsored health plan must be provided on a comparable per
capita basis to a broad cross-section of employees. For pension plans, nondiscrimination rules
require generally that benefits be proportional to compensation (defined in various ways, such as
average earnings for (he highest years of pay). The nondiscrimination criteria, therefore, limit
the degree to which the plans offered by an employer may distinguish among classes of employees in
terms of coverage and benefits and amount of employer contributions.
There are a broad number of exceptions to these nondiscrimination rules, although recent changes
have tended to tighten up on the ability of plans to "discriminate" by favoring higher-income
persons. For example, the Tax Reform Act of 1986 strengthened the minimum requirements regarding
(he proportion of lower-income workers that must be covered under a pension plan relative to the
number of higher-income workers covered under the plan. Similarly, the degree to which a pension
plan's benefit obligations to an individual may be offset by the individual's Social Security
benefits was limited in the Tax Reform Act of 1986.
One explanation of the need for nondiscrimination rules is the belief that higher-paid workers
have a grealer desire and ability to save than lower-paid workers. The advantages of pooling
savings resources through the employment group (e.g.. the ability to hire professional moneymanagement and lower costs per investment transaction) lower the costs of employer-based saving
arrangements, even in the absence of any tax subsidies. Deferral of tax liability is also
relatively more valuable to higher-paid workers because their marginal tax rates are higher than
those of lower-paid workers. Higher-paid workers, therefore, may be more likely than lower-paid
workers to prefer to receive part of their pay through claims to future pension payments.

-47-
Because higher-paid workers have differentially higher tax incentives for retirement saving
through pension plans compared to lower-paid workers, the benefits of these incentives would, in
the absence of nondiscrimination rules, accrue mainly to higher-income taxpayers. Offering pension
benefits without rules requiring that they be provided in a nondiscriminatory manner to lower-paid
employees would be viewed by many as providing tax treatment that unduly benefited higher-income
workers. Moreover, since high-income individuals have greater resources to use for retirement
savings, much of the tax saving would simply represent a windfall gain to a selective group of
employees with little effect on retirement outcomes. Most importantly, low-income individuals might
not save as much outside the employer context and. hence, there would be much greater pressure on
the public retirement system and on welfare agencies to provide greater incomes to low-income
elderly. Empirically, these notions are supported by the much broader participation of low-income
workers in universal, nondiscriminatory, employer plans than in voluntary plans for salary reduction
or in individual retirement accounts.
D. Level Benefit Payments from Pension Plans
The goals of the Federal government in encouraging private pension plans include both insuring
adequate wage replacement for workers upon retirement and limiting private reliance upon the public
sector for support in old age. The design of pension plans, however, is not correlated closely with
these goals. In particular, pension plans have not fully accommodated changes in the characteris-
tics and needs of the retired population. The design of many pension plans is similar to that of
many decades ago. and. in particular, has not adjusted to the increased expected number of years in
retirement and the impact of inflation on replacement rates in retirement. Benefits are paid at the
same level in the early years of retirement as in later retirement years, when the need for
long-term care is greatest.
Even at moderate rates of inflation, many pension and annuity plans provide for real benefit
levels that are reduced by one-half and sometimes more between early retirement and later ages
(as illustrated in Figure 5.1). Thus, private pension plans often provide the greatest real
levels of support to higher income younger more healthy individuals and decreasing real levels of
support as retirees age and are more likely to need additional resources to cover expenses
associated with long-term care.
Current tax law allows companies to provide pension benefits which vary over retirement years.
For example, instead of providing one fixed level of benefits throughout retirement, actuarially
equivalent benefits could be set at a fixed lower level during early retirement years and a fixed
higher level in later retirement years. Alternatively, actuarially equivalent benefits could be set
to refiect an expected rate of inflation during retirement. Both of these alternative benefit
payment streams would serve to provide a higher level of real benefits in later retirement years
when the need for long-temi care is greatest.
E. Prefunding for Retiree Health Benefits
Employees" post -retirement health benefits might be prefunded in one of three ways: through
separate accounts in a tax-qualified pension plan, through a welfare benefit fund (or a voluntary
employees' benefit association, or VESA), or through a life insurance plan.

-48-
0)

-49-
Under the pension ailes, prefunding without immediate taxation of the interest is allowed for
certain post-retirement health benefits provided under a pension plan. These rules have not been
widely utilized in the past because of the various limitations under the current rules. Most
importantly, to be eligible for this tax-favored treatment, the medical benefits must be subordinate
to the retirement benefits provided by the plan. This requirement is met only if the aggregate
contributions to provide health benefits do not exceed 25 percent of the aggregate contributions to
the pension plan (other than contributions to fund past service credits) made since the medical
benefits were first included in the plan. There are additional requirements, such as separate
accounting for health benefits and a prohibition against the use of amounts in this separate account
for other purposes prior to the satisfaction of all liabilities with respect to the post-retirement
health benefits.
Under the welfare benefit fund (or VEBA) rules, payments to a prefunded account are excluded from
employees' income, but interest income earned in a trust or account set aside for post-retirement
health benefits is taxable as it accrues. Essentially, the VEBA rules provide for taxation in a
manner similar to the employer-provided health insurance model, although the time at which the wage
is excluded from taxation is separated from the time health benefits are received.
Finally, under rules governing the taxation of insurance companies, health benefits provided
under a noncancellable accident and health insurance contract might be prefunded and no tax assessed
immediately on the fund's interest earnings. However. Internal Revenue Sei-vice rulings have yet to
be issued to clarify operation of these rules, particularly as they might apply to an employer-
maintained plan. (An IRS ruling has clarified the treatment of reserves maintained by an insurance
c4ompany for individually-purchased group long-term care policies. See Appendix A.) Most important
is the interaction between the welfare benefit fund rules and the life insurance rules in the
context of an employer-maintained health plan.
A decision has yet to be made under current law regarding which of these rules govern the tax
treatment of long-term care insurance, whether individually purchased or employer-provided. Given
the wide disparity in these rules and the potential for significant revenue effects, a legislative
solution is more appropriate to provide certitude of treatment, as well as to insure that the
optimal social solution is decided in a formal way and not just in a happenstance manner.
In 1984. Congress restricted the tax preferences that apply to prefunded health plans under
welfare benefit rules, mainly by imposing current taxation of income earned within the account.
Understanding the rationale for these restrictions may help determine the proper tax treatment of
prefunded long-term care insurance.
According to the General Explanation of the Revenue Provisions of the Deficit Reduction Act of
1984, "The Congress concluded that prior-law favorable tax treatment of employer contributions to
welfare benefit plans, as compared with employer payments of wages and salary, was inappropriate.
In addition. Congress believed that prior-law rules... allowed excessive tax-free accumulation of
funds... Congressional concern was caused by... the tax-shelter potential of welfare benefit plans...
|I| in view of the advance deductions provided to employers for these [post-retirement medical)
benefits, it was determined that the allowance of... a tax-exempt reserve would provide an
unnecessary tax incentive with respect to these benefits."

-50-
Anolher difficully in prefuncling health plans is ascertaining both the amount of funding that is
required and the rate at which benefits accrue and should be vested. It is extraordinarily hard to
estimate iiow utilization of health benefits would change over time, especially in the case of
insured benefits for which there is little experience. Changes in technology and provider practices
also make prediction difficult. Moreover, in the case of the retired population, there is always a
good chance that the government would change the rules under Medicare and thereby change
dramatically the amount of funding needed. The recent addition of catastrophic care to Medicare,
and its subsequent repeal, provides a case in point.
Determining a "fair" accrual and vesting rule is a related complication. Unlike cash benefits,
which can accrue according to the number of years of service with an employer, it is much moredifficult to provide, say. one-half or one-third of a health insurance policy for an employee whohas spent only one-half or one-third of the time spent by the most senior employees. This is
especially true if vested rights are stated in terms of services or benefits provided rather than
dollars that might be available to purchase a health plan. Some sort of cliff vesting is often
used. Many employers that provide health benefits to retirees provide such benefits only to
employees who actually retire from that employer. Thus, many employees who work many years for an
employer but leave before reaching the requisite retirement age will receive no retiree health
benefits from the employer. If the subsequent employer does not provide health benefits to
retirees, or imposes a minimum years of ser\'ice requirement, these retirees may retire with no
health benefits.
The Administration has proposed allowing employers to use pension plan funds to pay certain
retiree health liabilities. Generally, the proposal would permit employers to transfer excess funds
from their pension plans to health accounts which would pay retiree health liabilities to current
retirees. The proposal would require certain safeguards in the pension plan to protect the security
of the pension benefits, such as vesting. In addition, in light of uncertainty about the
appropriate treatment for retiree health liabilities and concerns about the long-term revenue
effects of such a proposal, the proposal would be effective for only relatively short period. Anopen-ended rule, permitting prefunding of other health and welfare benefits, would result in a
significant revenue loss.
F. Individual Retirement Accounts
Because many proposals to deal with long-term care make use of the individual retirement account
type of system, it is uselul to review briefiy this particular form of benefit. For most purposes,
the individual retirement account follows the basic pension model in terms of its tax treatment.
Individual retirement accounts (IRAs) were never designed to provide the basic means of providing
for retirement income of employees. Instead, such accounts were established in 1974, as part of
ERISA, to provide a lax-favored means of savings for workers not participating in employer-provided
pensions. Eligible individuals under the age of 70-1/2 were entitled to deduct contributions to
IRAs from gross income, up to the lesser of $2,000 or 100 percent of compensation. Taxes on
interest accumulated in IRAs were deferred until withdrawal, and a penalty was imposed on early
withdrawals.
-51-
In 1981. in response to concern about low levels of national savings, eligibility for IRAs was
expanded to include all workers whether or not they participated in employer-provided pension plans.
Participation in IRAs grew rapidly, from 3.4 million returns claiming an IRA deduction in 1981 to
12.0 million in 1982 and 17.3 million in 1984. before falling to 15.5 million by 1986. The Tax
Reform Act of 1986 largely returned eligibility rules for upper-income taxpayers to those of
pre- 1 981 law. although all individuals are now able to make nondeductible contributions to IRAs,
with tax on interest still deferred.
Suggestions that long-term care be financed through a medical IRA, or Individual Medical Account
(IMA) have attracted attention. The next section describes these proposals.
II. INDIVIDUAL MEDICAL ACCOUNTS: AN ANALYSIS OF PROPOSALS
A number of proposals have been made to establish tax-favored medical Individual Retirement
Accounts (IRAs) or Individual Medical Accounts (IMAs) to finance long-term health care. President
Reagan's mandate for this study included the requirement that the Treasury Department analyze the
desirability of this approach for financing long-term care. Our analysis concludes that IMAs would
be too narrowly focused to be a broadly attractive saving incentive. However, our analysis also
suggests the option of allowing adjustments to Individual Retirement Accounts (IRAs) so that
distributions from IRAs were associated with long-term care needs as part of a broader pension and
long-term care package. In effect. IRAs could be modified to contain a long-term care insurance
component.
A. Description of IMA Proposals
Many IMA proposals have been offered. These proposals vary in several ways. First, the
relationship of the IMA with existing IRAs may differ. One proposal would allow tax-free
withdrawals from existing IRAs for the purchase of long-term care insurance. Alternative proposals
would allow conlribulioti limits on current IRAs to be raised to include the IMA, or would allow
IMAs to be established separately from IRAs. In each case, the proposals would alter the current
IRA rules by allowing withdrawals for long-term care expenditures made after age 65 to be tax-
free.
IMA proposals also vary in the type of care and the individuals to whom they would apply.
la)ng-tenn care is sometimes defined to cover only care in nursing homes, while other proposals would
also cover home care and community-based services. Some proposals include a pre-hospitalization
requirement; others do not. Tax-free withdrawals from IM As under some proposals would be used only
for the long-term health care of the IMA holders, while other proposals would allow tax-free
withdrawals for the care of spouses or other dependents.
The specific tax treatment afforded IMAs also varies among proposals. Contributions would be
deductible from taxable income or. alternatively, would generate tax credits. These differing tax
treatments affect the distribution of IMA utilization across income groups because deductibility is
of greater value to high-income taxpayers while a lax credit has equal value for all taxpayers.
Most proposals would allow tax-free withdrawals for designated purposes, thereby giving IMAs more
favorable tax treatment than IRAs.

-52-
Proposals can also be dislinguished by the extent to which IMAs would be combined with the
risk-pooling aspect of insurance. In a "Pure IMA" plan without any risk pooling, each individual
would rely on his or her own IMA savings to finance long-term care. Because there is great
variation in the utilization of long-term care-with a few individuals consuming a great deal, while
many require none-some form of risk-pooling might be desirable. Some proposals therefore would
combine a portion of the IMA contributions and interest to form a pooled fund, presumably separate
from the pooled funds that private insurance companies would establish.
Proposals also differ in what happens to account balances upon death. Under some proposals, the
entire balance would go to the individual's estate while under other proposals, some or all of the
remaining principal and interest would go into the risk pool.
B. Analysis of Proposed IMAs
IMAs would share certain features of current IRAs. but would generally be more restrictive in
terms of the uses of funds. IMAs could, therefore, be expected to be less effective than IRAs in
stimulating savings, to treat different taxpayers unfairly, and to be more difficult to administer
than are IRAs. Further, the availability of Medicaid would restrict IMA use. While the analysis
of IMAs would differ in certain aspects depending on which of the many alternatives is considered,
these common issues remain.
Effect on Savings. IMA participation could be expected to be well below that for IRAs and other,
more general, savings vehicles. This is largely due to the fact that IMAs would constrain savers
much more narrowly than do such vehicles. Individuals ineligible for tax-deductible IRAs can still
contribute to a nondeductible IRA. with a continued deferral of the tax on the earnings on these
nondeductible contributions and unlimited uses of the funds in retirement. The relative
attractiveness of a nondeductible IRA compared to a deductible IMA depends on an individual's
current and expected future tax rates and subjective probability of requiring future long-tenn care.
Use by Income Groups. One reason offered in support of IMA proposals is that IMAs would help
low-income households who most need to save to provide for long-term care. However. IMA usage is
likely to be more skewed toward high-income savers than IMA proposals; lower income households are
unlikely to place their limited savings in such a restrictive savings vehicle.
Inequ ities . Reliance on IMAs to finance long-term care would lead to unequal treatment of
individuals with equal long-term care expenditures and lifetime incomes and wealth, but different
sources of long-term care funds. Those who paid for long-term care out of ordinary savings would be
worse off, other things equal, than those who paid for long-term care out of an IMA account. This
differing treatment could be viewed as unfair.
In addition, two individuals with IMAs of the same size but with different needs-medical or
otherwise—would also be treated differently under most IMA proposals. For instance, a taxpayer
with children requiring expensive health care would be unable to receive the same benefits as
someone requiring long-term care. Again, this differing treatment could be viewed as unfair.

-53-
Administrability . In the typical proposal, withdrawals from IMAs would be tax-free as long as
the funds were used to finance long-term care or long-term care insurance. The Internal Revenue
Service would need to monitor the use of withdrawn funds to ensure that they were actually used for
long-term care. This would impose large recordkeeping and enforcement requirements. Further,
defining "long-term care" would be difficult for IMAs, as it would for any type of long-term care
plan. For instance, it is not simple to determine when paying for cooking and housekeeping is a
long-term care expenditure and when it is simply an expenditure for services.
Effect of Medicaid . To the extent that the existence of Medicaid as a payor of last resort makes
long-tenn care insurance less desirable. Medicaid also would make IMAs less desirable.
C. Tax-Free IRA Withdrawals for Long-Term Care
A proposal similar to the IMA proposals would allow tax-free withdrawals from IRAs for long-term
care expenditures. The potential beneficiaries, depending on the specifics of the proposals,
would be all individuals who have IRAs. or only those with tax-deductible IRAs. In the short run,
the proposal would make IRAs more attractive only to those taxpayers who currently participate in
IRAs. Approximately 5 percent of taxpayers currently hold tax-deductible IRAs. primarily those in
the $20,000 to $50,000 categories. If the provision were extended to nondeductible IRAs,
participation would be somewhat higher for higher-income groups.
D. An IRA Option for Further Consideration
The IRA option presented in Chapter 6 aims to accomplish many ofthe same goals as IMA proposals,
but in a way that would likely stimulate greater utilization by incorporating the insurance aspect
directly into (he IRA.
E. Conclusions
Special-purpose tax-favored savings accounts are not the most desirable mechanisms to finance
long-term care. Such narrowly targeted accounts are unlikely to induce broad participation, and
that which is induced is likely to be from high-income individuals.
IMAs would result in the inequitable treatment of individuals with similar long-term care
expenses but different sources of funds. In addition, individuals who made identical contributions
to IMAs but had different long-term care needs would also experience differences in treatment. The
IMA would also pose administrative difficulties.


CHAPTER 6: OPTIONS FOR FINANCING LONG-TERM CARE FOR THE ELDERLY
I. BASIC OPTIONS
A. Adjust Pension Payments for Long-Term Care
One of the current problems in financing to long-term care is that both public and private
retirement benefits focus on income needs in the early retirement years. Because of that fact, the
elderly are most likely to have resources comparable to the rest of the population in the early
retirement years, when the elderly are least likely to need long-term care. The problem arises in
late retirement years, when the older elderly are much more likely to need long-term care but also
to have fewer resources than the rest of the population. The structure of private pension benefits
contributes to the problem by making little, if any. adjustment in the size of the benefits to meet
the cost of long-term care.
An option that would make pension benefits more adaptable to needs arising in later retirement
years is to allow plans to vaiy benefit payments according to the long-term care needs of the
beneficiary. As discussed elsewhere in this Report, the greatest incentive for moderate income
employees to purchase private long-term care policies is when those policies are part of a braoder
retirement compensation package rather than a benefit that must be separately purchased or provided.
Choosing a long-term care benefit option within a pension plan need be no more complicated for an
employee than checking a box on the pension form. Employees who choose this option might, for a
modest reduction in current benefits receive an additional payment if certain serious impairments
that require custodial care arise. The additional payment, together with regular pension benefits
and other retirement income, may cover the cost of needed household custodial or nursing home care.
A long-term benefit in a pension plan might be particularly attractive to consumers because the
benefit could be paid in cash. Cash payments would permit beneficiaries to choose forms of care
that meet individual circumstances and take account of variations in family and community resources.
For instance, if home care provided by nonfamily members were to become more affordable over time,
pension holders requiring long-term care could simply redirect their cash to home rather than
nursing home care. Moreover, such benefits would eliminate the need to purchase separate insurance
policies geared to specific events, such as the onset of a chronic illness. Consumers who can
choose how to spend their increased pension income will also retain incentives to search for forms
of care that meet their needs at minimum cost. This option could provide for long-term care at
lower costs than would insurance limited to nursing home care. Note, however, that this option
would not prevent pension plans and insurance companies from limiting benefits to nursing home care:
it would only make it easier to offer options with greater choice.
Benefits paid under this long-term care option would continue to be treated as pension benefits
for purposes of the pension funding rules. Thus, an individual's overall pension benefit, including
benefits payable under a long-term care option, would be subject to the general limits on pension
benefits. This restriction on maximum combined benefits is needed to restrain revenue costs and to
-55-
-56-
limit the extenl to which the tax benefits inure to the benefit of highly compensated employees.
Similarly, benefits payable under a long-term care option would not be subject to the current law
restriction on the aggregate amount of contributions that may be made to a pension plan to provide
medical benefits. The pension option would effectively allow tax-favored prefunding of cash
payments related to health and long-term care. Because this is an issue of considerable controversy
for pension and health policy, as well as long-term care policy, limitations that restrain revenue
losses and target the benefits are important. It may be difficult to specify some of these limits
far in advance because of the difficulty in knowing future changes in Social Security or other
government policies, as well as nursing home costs. Pension plans could be allowed to determine
these limits on the basis of reasonable projections. In addition, a private pension plan could take
into account the real decline in the pension benefit in determining future long-term care benefit
limits. The purpose of the limits is simply to target the additional tax benefits to long-term care
assistance and those most in need.
B. Adjust Annuities, IRAs, and Life Insurance for Long-Term Care
A set of rules consistent with adjustments for long-term care within pension plans could be
applied to annuities and individual retirement accounts (IRAs). The rules would provide consistency
in financing long-term care between employment-related and individual settings. Symmetric treatment
would allow long-term care payment adjustments as an option under normal annuity policies provided
by life insurance companies. Current law does not allow a tax deduction for the purchase deposit
when an individual buys an annuity outside of the normal pension context. However, interest earned
on the deposit is not subject to tax until it is distributed to the purchaser. This option would
allow insurance companies to sell not only prefunded long-term care policies, but to combine the
policies with other individual annuity policies. Payments from these annuities could then be based
partly upon future long-term care needs.
The rules governing IRA accounts could also be amended to permit distributions to vary with
(he type of long-term care required. The rules for deductible IRA deposits would be similar to the
rules for qualified pension plans. The rules for nondeductible IRA deposits would be similar to the
rules for individual annuity accounts. This option would not be expected to increase significantly
the purchase of long-term care insurance. The purpose of the option would be to make IRA rules
consistent with other pension and annuity rules.
To make life insurance rules consistent with other pension and annuity rules, individuals could
be allowed to use assets in life insurance policies to purchase long-term care insurance without
incurring a tax penalty.
C. Clarify Tax Treatment of Distributions from Long-Term Care Policies
The current law tax treatment of long-term care benefits could be clarified. In all cases,
whether long-term care benefits are provided through pension plans, annuities, prefunded welfare
benefit plans, or individually purchased long-term care insurance, a common tax treatment should be
provided for distributions from such plans. Whether any portion of such distributions could be
deducted from income could be determined at the individual level through the rules affecting
itemized medical expenses. This approach would provide an appropriate level of tax preference and

-57-
allocate the tax preference where needs are greatest, would insure the maximum consumer choice amonglong-term care options, and would preserve the flexibility of future decision- makers to balance the
tax preference of long-term care expenditures with revenue constraints. Appropriate tax treatment
makes it less likely that employers would defer providing long-term care benefits to their employees
because of concern that the government will later establish a universal, but secondary, system of
medically-related long-term care. Under such a government system, taxable benefits that could be
used towards non-medical long-term care expenses would still be valuable.
Taxpayers currently are allowed to deduct medical expenses in excess of 7.5 percent of income.
Over 38 percent of the elderly are not subject to Federal income tax. For higher-income elderly whopay Federal income taxes, those with large medical expenses generally are allowed a deduction for
most of these expenses. For instance, a couple with $25,000 of adjusted gross income would exceed
the 7.5 percent threshold once expenses exceed $1,875. (Recall that the average amount of medical
expenditures, public and private, for a couple is in excess of $4,000.) The medical portion of
long-term care expenses would receive an appropriate tax preference through the itemized medical
expense deduction. In addition, because the availability of the tax preference relates to
individual income levels, benefits are related to ability to pay such costs.
Allowing the tax treatment of long-term care benefits to be determined at the time the benefits
are paid relieves the law and regulations related to long-term care from ex ante requirements on the
use of benefits. A taxpayer receiving cash payments, some of which were not spent on medical
aspects of long-term care, would not need to be concerned about violating requirements on its use.
Ex ante requirements that cash payments from long-term care policies be used for medical expenses
would have several consequences for long-term care insurance. Policies would be less likely to
provide additional cash payments and more likely to be restricted to those institutional and formal
care arrangements where determining the medical portion of future long-tenn care expenses would be
more clear-cut.
D. Analysis of Options
Maxitnize consumer choice. The preceding options maximize consumer choice by making manybenefits payable as cash benefits, leaving individuals to decide how to spend them.
Constrain revenue loss. The options could constrain the revenue loss from favorable tax
treatment of long-term care savings and benefits. Because much of long-term care expenses are for
the costs of daily living (such as food and shelter) and custodial, rather than medical care, a
significant portion of the revenue loss from favorable tax treatment of long-term care would be
attributable to these ordinary expenses rather than to health-related expenses. Some recipients of
long-term care may live in plush surroundings and enjoy considerable amenities. Others may join
retirement facilities that provide initially for little in the way of health or custodial care, but
increase the level of such services as the person ages and has greater need for custodial type of
care. These are all worthwhile arrangements, and individuals should be allowed to choose to spend
their money as they best see fit. Nonetheless, it clearly would be inefficient for tax laws to
encourage these arrangements over other equally worthwhile arrangements for living or obtaining
custodial care.

-58-
Increase flexibility to meet future needs. The preceding options would leave future
decisionmakers much greater flexibility to determine whether tax preferences for long-term care are
targeted at the greatest needs and benefit a broad cross-section of the population. The issue of
what portion of long-term care expenses represents health expenses, expenses over and above normal
living expenses, or truly extraordinary expenses is difficult to determine. It would be a mistake
to spend scarce revenues now to provide additional benefits for ordinary health expenses and
ordinary expenses of daily living when the revenues could more appropriately be spent addressing
more pressing needs.
Retain private incentives. The preceding options, in contrast to some proposals that have been
made, would not discourage employers from providing long-term care benefits to employees. As
discussed more thoroughly in other parts of the Report, few employers are going to offer long-term
care benefits restricted to health or institutional care that might later be provided by the
government. The concern is that the government might one day adopt a public universal long-term
care policy, but make its payments secondary to those of the private sector. Then those employers
and employees who negotiated long-term care packages would get the least benefit from the new public
policy. The options in this Report favor making long-term care payments in cash and not tied to
particular expenditures; the payments would be made regardless of their use by the taxpayer. There
would be less likelihood that the government could require that private insurance payments be madefirst. These private payments would function more like annuity or pension payments that currently
do not pre-empt other universally available benefits, such as Medicare.
II. VARIATIONS ON BASIC OPTIONS
A. Alternative Triggers to Long-Term Care Payments
The tax laws could be amended to permit pension plans to adjust the level of payments for certain
conditions associated with long-term care requirements. The pension plan could self-insure this
risk. or. as would likely be common, provide the long-term care protection through the purchase of
insurance. For example, a long-term care option based on attainment of age 85 could work as
follows: An individual entitled to a pension of $10,000 per year for life beginning at age 65 could
elect an actuarially equivalent long-term care option that would pay them $9,000 per year prior to
age 85. and then receive $30,000 per year upon attainment of age 85. Since this option is
actuarially equivalent to the payment of $10,000 per year beginning at age 65. the pension plan
incurs no additional cost from the election of the option. Alternatively, the plan might provide an
option under which the individual chooses to reduce the amount of the pension in exchange for a
promise of an additional specified amount in pension benefits upon the onset of certain medical
conditions that require increased care.
B. Alternative Limits to Long-Term Care Option in Pensions
Long-term care options in pension plans would have some revenue cost since the options
effectively permit a greater deferral of pension income than current law. Limits could be imposed
to restrain the revenue cost, and to insure that long-term care options do not permit excessive
deferral. The allowable reduction of the current pension benefit could be limited to an amount (for

-59-
example. $1 .000 per year adjusted for age at which reductions begin and indexed for price changes)
sufficient to fund a basic long-term care benefit. Limiting the reduction would also help to assure
that (he additional deferred income is used for reasonable and necessary long-term care
expenditures. An additional limit to long-term care payment options would pay increased benefits
only where the individual satisfies the conditions for payment; the options could not contain any
refund feature.
For plans that offer long-teiTn care as an option, rather than as a benefit for all participants,
the limit might be made more restrictive. In this case, the amount of additional cash benefit
allowed to be paid as long-term care insurance might be liinited approximately to the difference
between the basic pension benefit (in the case of a couple, one-half the benefit) plus any Social
Security benefit, and the average cost of a nursing home in the United States. Thus, a single
person with a total of $10,000 of private pension and Social Security benefits might be allowed an
additional $ 1 2 .000 payment when conditions requiring long-term care were present . However, one with
$25,000 of Social Security and pension benefits would not be allowed to benefit from the additional
deferral available with a long-term care option.
C. Alternative Limits on Maximum Pension Contributions
Another option to reallocate tax preferences received by pension contributions in order to offset
revenue losses due to long-term care options would be to limit the tax-preferred prefunding of the
expected value of future pension payments at retirement age. The limit would apply to both regular
pension payments and to any long-term care options in the plans. The limit would increase equity
among workers who have the same pension eligibility because they would all receive an actuarially
equivalent benefit stream. It would also target the tax preference more towards lower-income
workers.
in. REVENUE EFFECTS
Adding a long-term care option to private pension plans would reduce Federal revenues by roughly
$1 billion in 1993. A similar adjustment in annuities. IRAs, and life insurance would cost about
$100 million in 1993. The revenue cost of the options would grow over time. These options could
be financed by reallocating the tax preferences for pensions and health insurance as discussed
elsewhere in this Report.
The pension options would effectively allow tax-favored prefunding for cash payments which are
related to health and long-term care. This is an issue of considerable controversy for pension and
health policy in general, not just long-term care policy.
As noted earlier in this Report, Congress concluded in 1984 that blanket allowance of prefunding
can easily create tax shelter potential, so any changes in prefunded health rules must carefully
guard against additional unwarranted tax preferences. However, the options presented here would
somewhat liberalize the treatment of prefunded long-term care within the context of normal pension
and annuity policy. Ihe options therefore would incorporate existing rules to prevent unwarranted
preferences.

-60-
An open-ended rule on employee-benefit plan prefunding might set a precedent for prefunding ofother health and welfare benefits. Such changes could involve significant revenue losses over the
long-term and lead to an increase in tax rates on other forms of income.
PART THREE
FINANCING HEALTH INSURANCE FOR THE NONELDERLY

CHAPTER 7: INTRODUCTION AND SUMMARY
Heallh care for nonelclerly individuals accounts for about two-thirds of the Nation's direct
heahh care expenditures. The government influences the availability of health care for those
under age 65 piimarily through two mechanisms, public outlay programs including Medicaid and tax
subsidies. The government is often the direct payer of last resort. When individuals meet Federal
and state determined criteria related to income, wealth, family status, and health expense, they
become eligible for Medicaid.
For the majority of nonelderly the Federal government supports health care through the lax
system. This support is primarily in the form of the exclusion of the value of employer-provided
health insurance premiums from employees' income subject to income and Social Security taxes. For
an employee who is subject to a 15 percent income tax rate and a combined employer and employee
Social Security tax rate of slightly over 15 percent, the resultant reduction is over 30 cents for
each dollar spent on health insurance. The income tax expenditure associated with this exclusion of
employer-provided payments was estimated to be about $37 billion in fiscal year 1990. Theexclusion reduces Social Security system revenues by an estimated additional $19 billion. Nearly
all of these tax expenditure subsidies were received by nonelderly individuals.
Deductions from individual income taxes are also allowed for medical expenses in excess of
7.5 percent of adjusted gross income. This itemized deduction was changed in the Tax Reform Act
of 1986. primarily by raising the percentage floor for deductible expenses from 5 percent to
7.5 percent. The Federal tax expenditure for the itemized medical expense deduction was estimated
to be $2.9 billion in fiscal year 1990.
Part Three is concerned with the ways in which the tax system affects access to health insurance
for the nonelderly. Although Medicaid and other direct programs for providing medical care to the
nonelderly are not examined in detail, some important interactions between the system of providing
tax incentives and the system of providing direct medical care are discussed briefly.
I. CURRENT FINANCING OF HEALTH INSURANCE FOR THE NONELDERLY
Most Americans under the age of 65 obtain access to health care through a combination of their
own expenditures and employer-provided health insurance. Employment is the major source of health
insurance for the nonelderly. Approximately two-thirds of the nonelderly population in 1985
obtained health insurance through their own employment or that of a family member. Another 9
percent of the employed nonelderly population and their families were covered by public insurance
such as Medicaid. A significant number of employees, however, are not covered by health insurance.
Altogether including workers and persons not in the labor force, approximately 35 million persons
did not receive any insurance coverage in 1985 through either private or public programs, including
Medicaid, and many others lacked coverage for large medical expenses. Of those without health
insurance, about 55 percent were employed.
Insurance coverage is less likely to be provided by small businesses. This lower coverage seems
to result mainly from the high cost of insurance to small businesses and the lower overall compen-sation—wages and fringe benefits -paid to employees of small businesses.
-61

-62-
As noted above, employer-provided health insurance receives favorable tax treatment under the
Federal tax law: premiums are deductible by the employer, but are excluded from the income of
employees for both income and Social Security tax purposes. This tax treatment extends to owners
of corporate businesses who are employees of the businesses. Self-employed owners of noncorporate
businesses may deduct 25 percent of their health insurance premiums in the years 1987-89 (and
proposed permanently in the President's 1991 Budget), and may take the itemized deduction if the
premium and other health care costs exceed 7.5 percent of adjusted gross income, but may not
otherwise deduct or exclude health insurance premiums.
There are a number of reasons why individuals may not have insurance. Workers may prefer cash to
fringe benefits such as health insurance, even though insurance is subsidized by the tax system.
Small businesses may find that the cost of insurance is high because of higher administrative costs
and greater risks to insurance companies from selling to smaller groups. For many individuals,
health insurance may be foregone so that other needs can be met. Individuals between jobs may be
willing to go without health coverage for a while or believe they can postpone coverage until a newjob is obtained. Medicaid provides a fallback position for many individuals. Some individuals in
good health may simply be willing to gamble that they can do without health insurance for awhile.
Even among insured individuals, there is wide variation in the range of services covered by
health insurance policies. Limits include the specific kinds of care that are insured, the
maximum amount that the insurance will pay. and the fact that coverage often is terminated with
employment.
II. EXISTING TAX INCENTIVES FOR HEALTH INSURANCE
A tax incentive for the private purchase of health care insurance is usually justified on the
grounds that there are benefits to society from widespread insurance coverage. Individuals with
adequate coverage, and so access to health care, may be more likely to receive health care than
those without insurance, and all of society may benefit from this.
In addition, when the government sei"ves as payer of last resort, taxpayers benefit from not
having to provide the funds to cover expenses of those who, without insurance, would have
inadequate means to meet medical expenses. For some individuals with moderate or low income.
Medicaid or free community health center or hospital care may provide a type of insurance against
catastrophic events. A tax incentive may then be considered as an offset to the disincentive to pay
for private catastrophic insurance, especially when private insurance covers events that would be
covered under the public programs.
There are a number of reasons, however, to consider alternatives to the current unlimited
exclusion from taxable income of health insurance provided through employers. Workers receive the
tax benefits while nonworkers do not. Those who work for employers with generous plans receive muchhigher levels of tax benefits than those who work for employers with less generous plans. Finally,
those in higher tax brackets receive the largest amounts of tax benefits because the exclusion is of
greater value to them.
The current exclusion, because it is unlimited, encourages purchases of health insurance that are
not worth their full cost. An individual saving 30 cents of taxes for each dollar spent on health
insurance will demand an additional dollar of health insurance until such point as the insurance

-63-
is worth only 70 cents to him or her. The individual gets 70 cents worth of insurance at a
private cost of 70 cents but a social cost of $1, with the additional 30 cents being paid by other
taxpayers. This unlimited subsidy for the purchase of medical insurance leads to insurance coverage
of medical care (hat should not be subsidized. Since most workers would purchase at least some
insurance for catastrophic events and since employers are efficient providers of insurance for
large groups, many modest policies would be purchased in any case. With the unlimited tax subsidy,
however, policies are much more likely to provide first-dollar coverage and to cover relatively
predictable and routine expenses. Such broad coverage provides little incentive to control medical
spending. The increased demand for health care also tends to raise prices of medical services.
III. SUMMARY
The following three chapters provide a detailed description and analysis of actual and proposed
financing sources for increasing access of the nonelderly population to health insurance. Chapter
8 provides an overview of the role of insurance in current health care expenditures, and the
characteristics of those with insurance. Chapter 9 contains an analysis of existing incentives for
private health insurance. Chapter 10 presents a set of options for further consideration and
analysis that would increase access to health insurance for the nonelderly population.


CHAPTER 8: HEALTH INSURANCE FOR THE NONELDERLY: THE CURRENT SYSTEM
I. EXPENDITURES ON HEALTH CARE
4
Total direct health care expenditures in 1987 were an estimated $500 billion. The total
includes expenditures on the elderly and the nonelderly, including individuals who were
institutionalized. Estimates of the share of expenditures going to the nonelderly, and the sources
of funds that pay for their health care, are given in Table 8.1. The Health Care Financing
Administration (HCFA) estimated that in 1987. 64 percent of personal health care expenditures, the
major component of national health expenditures, was spent on persons under 65. ' HCFA also
estimated that between 1965 and 1987 the private share of personal health care expenditures for all
persons between 19 and 64 years of age fell from 81 to 75 percent (see Table 8. 1). For those under
19. the private share similarly fell from 85 percent to 74 percent.
Direct out-of-pocket payments by individuals and private insurance payments each accounted for
about half of private health care expenditures for the nonelderly, as shown in Table 8.2. Note
that these expenditure estimates exclude the amount of subsidy provided through preferential
tax provisions.
The public share of medical costs for the nonelderly had increased to approximately 26 percent
by 1987. Medicaid alone provided about 17 percent of total 1987 personal health care expenditures
for those under 19. and about 9 percent for those between 19 and 64. Medicare paid another 4
percent for those between 19 and 64. Public programs other than Medicare and Medicaid-in
particular. Defense, Veterans" Administration. Indian Health Service, and workers compensation—are
major sources of public health care expenditures for the nonelderly. In 1987, these other programs
paid about 9 percent of health care expenditures for persons under 19. For persons between 19 and
64. these other programs paid nearly 13 percent of health expenditures.
Health care expenses vary by age, overall state of health, and income. Health expenses generally
rise with age. Health expenses, as expected, also rise as health worsens, regardless of age and
income level. Health expenses generally are a higher proportion of income for lower-income
individuals, and lower-income individuals typically paid more out-of-pocket than did higher-income
individuals. Because out-of-pocket expenditures fall as income rises, the proportion of income
spent on health care falls with income. (Detailed tables are in Appendix B.)
II. SCOPE OF CURRENT HEALTH INSURANCE COVERAGE
Most nonelderly Americans are covered by health insurance. In 1985, an estimated 83 percent of
nonelderly individuals not in institutions were covered by some form of private or public health
insurance, as shown in Table 8.3. Employer-provided health insurance covered 66 percent of the
nonelderly, noninstitutionalized population, including many nonworkers such as spouses and children,
as well as workers themselves. Other private insurance covered I 1.5 percent of this group. Public
health insurance, primarily Medicaid, was available to 12 percent of this group. Because someindividuals in this group were covered under more than one form of insurance, coverage Figures are
not additive.
-65-

-66-
Table 8.1 Perrenfage Distribution of Funding for Personal Health Care,
Selected Calendar Years 1965 to 1987
Age Group 1987 1977 1965
(Percent)
All Ages:

-67-
V

-68-
OX)f3U>oUuCrtusc
1/2
a>
5O
u"3
CO
5 t/2a 5
2 >S o.2 cu
1 c
C t/T
e 3O
^i^u
2"3eoZ
00
o

69-

-70-
3O
rtuI
-71-
Privafe and public health insurance in 1985 did not cover over 17 percent of the nonelderly,
noninstitutionalized population, or nearly 35 million persons. Over half of those without coverage,
55 percent, were employed. Workers with low incomes-incomes below the poverty level-were more
than three times as likely as other workers not to have health insurance. Nearly one-third of those
without any insurance coverage in 1985, 11.2 million individuals, were in families with incomes
below the poverty level.
As the data in Table 8.3 show, the persons without insurance are not a single, easily identified
or targeted group. Uninsured individuals are found not only among the unemployed and the poor, but
also among the employed and those with higher incomes. Access to health care varies between the
uninsured and the insured and according to personal and financial characteristics of individuals.
The next section provides more detail on the access to health insurance among different groups in
the population.
Although having some form of health insurance increases access to health care and decreases
significantly the probability that the government will be payer of last resort, there are
significant variations in the expenses covered by various forms of health insurance. Depending
on the standards that are applied, not all persons with health insurance can be viewed as having
full access to health care. Two issues about coverage are raised most often in this context.
First, the combination of insurance and income may be considered inadequate to ensure that
individuals have access to routine and preventive health care as well as to less frequent, but
expensive, care such as hospitalization. Second, coverage for costly events may be limited so that
individuals still may bear out-of-pocket expenses that are large relative to their incomes.
There is a wide variation among health insurance plans in the coverage provided for insured
expenses. The amount of first-dollar coverage, coverage which requires no out-of-pocket
expenditures by the insured in traditional, fee-for-service plans, appears to be declining. Data
from a surxey of benefits offered by medium and large firms show that the proportion of participants
who have only major medical coverage increased from 19 percent in 1983 to 35 percent in 1986.
Major medical benefits cover many categories of care but typically require the participant to pay
both an initial deductible amount and a portion of hospital charges. The average amount of these
required deductible payments in traditional plans has been rising in nominal terms. The proportion
of participants in major medical plans who paid a deductible of $150 or more rose from about 8
percent in 1979 to 36 percent in 1986. Over the same period, the proportion who paid deductibles of
$50 or less fell from 30 percent to about 1 1 percent.
Although deductibles have become larger, coinsurance rates have shrunk. Nearly seven-eighths of
the 1986 participants were in plans that pay at least 80 percent of expenses beyond the deductible.
For about 80 percent of the participants, the proportion of expenses paid by the insurance plan
rises to 100 percent afier specified levels of total expenditures have been reached. By comparison,
in 1979. less than half of the participants in major medical plans were covered by maximum
expenditure limits.^^ The proportion of employees who pay part of their own health insurance costs
has been rising, as has the proportion who pay part of the costs of insuring family members.
Insurance fully paid for by employers for individual and family coverage fell from 72 and 5 1 percent

-72-
in 1980 to 54 and 35 percenl in 1986. Payments are more likely to be required in individual than
group plans. Another trend in health insurance coverage has been the increasing proportion of
coverage in health maintenance organizations and preferred provider organizations.
Data for 1977 indicate that over half of persons with group insurance received coverage for the
full costs of a semi-private room, but nearly one-fourth received either a limited daily benefit or
a limited hospital indemnity. The probability of full coverage increased with the size of the
insurance group. Levels of coverage also varied with industry, employment status, and sex. Details
are shown in Appendix Table B-IO.
III. HEALTH INSURANCE COVERAGE
Health insurancecoveragediffersamong the employed, unemployed, nonworkers. and self-employed.
Thus, it is useful to consider each group separately.
A. The Employed
Employment is the major source of health insurance coverage for the nonelderly. Table 8.3 shows
that about 71 percent of all workers had employer-provided insurance in 1985. However, nearly 36
million workers did not. and an estimated 19 million workers were completely uninsured. That is,
they were not covered by insurance provided by their own employer or that of family members,
through privately purchased insurance, or through public insurance programs, including Medicaid.
The absence of insurance among workers also affects the insurance coverage of their families. Over
half of the nonelderly without health insurance were in families where the head was employed full
time for the full year.
Workers with employer-provided insurance differ systematically from workers without it in terms
of age, earnings, industry, and size of fimi. Most uninsured workers are employees, rather than
self-employed business owners. Employees in larger firms are far more likely to be insured than
employees in smaller firms. Over 85 percent of employees in firms with 500 or more workers had
employer-provided health insurance, compared to slightly over one-third of workers in firms with
fewer than 25 employees. Table 8.4 shows that the proportion of employees with health insurance
increases with firm size, and that this relationship remained stable between 1979 and 1983. Workers
without employer-provided health insurance were also more likely to work in goods-producing
industries, where firms tend to be larger, than in service-producing industries. Just over half of
the self-employed had direct or indirect employer-provided insurance.
Workers with health insurance tend to have relatively higher earnings, with two-thirds earning at
least $10,000 in 1985. The proportion of workers with insurance was similarly higher among those
earning over $10,000 annually. Between 90 and 98 percent of workers in this earnings category were
insured, compared to 72 percent of those earning less than $10,000.
There is no single reason why many employees receive employer-provided medical insurance while
others do not. The explanations commonly offered include both costs to the firm and factors related
to worker characteristics.

-73-
Table 8.4 Group Health Insurance Coverage of Wage-and-Salary Workers
by Employment Size of Firm, 1979 and 1983
All Employment Size of Firm
Firms 1-24 25-99 100-499 500 +( Percent)
Included in Employer's Health Plan
1979 67.2 36.3 65.0 76.8 86.4
1983 67.2 38.7 65.4 75.2 85.4
Included in Employer's Health Plan
or Covered by Household
Member's Policy
1983 81.8 66.4 80.2 86.7 91.8
Department of the Treasury
Office of Tax Analysis
Source: The Stale of Small Business. 1985. Table 5.18.

-74-
Health insurance costs tend to be somewhat higher for workers in small firms than in larger
firms. Insurers typically charge higher premiums to recover the costs of handling smaller accounts
or accounts with higher turnover. The administrative costs to the small firm itself may also he
higher per employee. Rates for small groups also tend to be based on characteristics of individual
employees rather than a flat group rate. Basing insurance premiums on characteristics of individual
employees lends to raise costs and can also cause some employees to be denied insurance. Evidence
suggests that dollar outlays per policy are. in fact, higher in smaller firms, while fewer services
tend to be covered.
Whether in large or small firms, some workers may simply prefer cash compensation to fringe
benefits, such as health insurance. For instance, workers who receive insurance through other
family members would likely prefer cash even to insurance that was subsidized. Such indirect
coverage is important, providing insurance for 15 percent of all workers and 28 percent of workers
earning less than $10,000.
Determining the extent to which employees bear the cost of health insurance is difficult,
although the standard economic analysis of legally-required benefits such as Social Security and
unemployment payroll taxes concludes that workers bear almost the entire cost of both the employer
and employee contributions through reduced cash compensation, it is likely, therefore, that a
significant portion of the costs of employer-provided insurance are borne by workers in the form of
reduced wages. Lx)wer-paid workers may be less willing or able to reduce their money income in order
to receive health insurance. For workers initially at the minimum wage, a wage reduction is not
possible.
Employers may secure some advantage, such as decreased hiring and turnover costs, from providing
certain types of benefits, and could therefore bear some of the costs of health insurance.
Agreements collectively bargained between workers and employers could potentially exclude
health insurance in explicit exchange for other fringe benefits or work arrangements. Although
such tradeoffs are possible, analyses show that unionized workers are more likely to have
employer-provided health insurance than are nonunion workers. The evidence available, however, is
not sufficient to permit satisfactory tests of whether the higher benefit levels observed in
collective bargaining agreements actually are caused by the negotiations or whether they refiect
other factors.
Another set of workers may be uninsured because they are new hires who have not yet fulfilled
wailing periods for eligibility. Half of the full-time participants in medium and large firms
that offered employer-provided health in 1986 were in plans with waiting periods. These periods
typically were one or three months. Note, however, that waiting periods have generally been
decreasing. Some workers may also be affected by clauses excluding pre-existing conditions.
Finally, some employees may not want employer-provided health insurance because public programs
are available, although the number of such employees is likely to be small.

-75-
B. The Unemployed and Nonworkers
Employment -based lieallh insurance plays a prominent role in providing private insurance. The
unemployed and those who are not in the workplace are less likely to benefit from the incentives of
an employer-based system.
Individuals may be without jobs either because they are not in the labor force or because they
are in the labor force but currently are not employed. Individuals not in the labor force include
children, adults whose health prevents them from working, and adults who choose not to seek out-
side employment. The unemployed include individuals searching for their first job as well as
individuals who have separated from a job.
Many nonworkers have health insurance coverage. Employed family members, private purchases,
and public programs provide alternative sources of health insurance. However, about 15.6 million of
the nonworking. nonelderly population did not have private or public health insurance, in 1985, as
shown in Table 8.3. Of these, an estimated I I . I million, or over 70 percent, were children and 4.6
million were adults. Nonworkers accounted for nearly half—45 percent—of all uninsured
individuals. Nonworkers were more likely than workers to be uninsured, with 20 percent of
nonworkers uninsured compared to about 1 5 percent ofworkers. Nonworkers also were more likely than
workers to receive public insurance, but less likely to have either employer-provided coverage
through another family member or other private insurance coverage.
A number of unemployed persons are offered extended coverage through their former employers.
Over the years, many employers have offered the option to continue participation in health plans.
The Consolidated Omnibus Budget Reconciliation Act of 1985 requires that for health plan years
beginning after June 30. 1986. most employers extend to employees an option to purchase group
insurance for 18 months after leaving employment. The average duration of unemployment, by
contrast with the 18 month requirement, has ranged between 14 and 20 weeks in the last few years.
Unemployed persons, nonetheless, may find the full out-of-pocket cost of their former employer's
health insurance unaffordable. This may be especially true if the former employer offers fairly
complete coverage and does not offer any lower-cost option.
Some persons are uninsurable due to pre-existing conditions. Insurers may categorically refuse
to cover such persons or may offer insurance only at actuarially fair, but very high, prices. There
is little evidence, however, that this problem applies to more than a small portion of those without
insurance coverage.
Even in the absence of Medicaid, many may simply wish to self-insure. Persons whose own
resources would be inadequate to cover catastrophic expenses may be expressing a preference, say.
for $ 1 ,000 in cash now rather than $ 1 .000 spent on insurance against the unlikely event of incurring
catastrophic health expenses. Many may simply wish to take a gamble. In many cases, the gamble is
sensible. If the period of unemployment is expected to be short, for instance, it may be thought
that some medical services can be postponed. Or the person may be in good health and simply believe
that the gamble has a high probability of payoff. Of course, the possibilities of turning to
Medicaid or to the community should dire circumstances arise make the gamble more attractive to the
individual.
-76-
C. The Self-Employed
Theferm "self-employed" has several meanings. Working owners of unincorporaCed businesses-sole
proprietorships and partnerships-are "self-employed" for Federal tax purposes. The Federal tax law
meaning is used here. Under Federal tax law. owners of incorporated businesses who are employed by
the businesses, regardless of the size of the business and their ownership share, are treated the
same as other employees of the corporation and are not "self-employed." (Special rules apply in the
case of certain S corporation shareholders.) Insurance provided to employees (as opposed to the
owners of unincorporated businesses) has been and remains deductible for all types of businesses.
For many persons who are self-employed, their businesses may not be their only activity.
Forty-four percent of the owners of nonagricultural business do not work full-time at their
business. Self-employed persons often obtain health insurance either through another job or under
the policy of a spouse.
The self-employed are a heterogeneous group, and include many who move back and forth between
employment and self-employment. The self-employed also tend to be older than the work force in
general. About 87 percent of the self-employed were between 30 and 64 years old in 1986, compared
to about 65 percent of all employed workers. Correspondingly, about 82 percent of the uninsured
self-employed were between 30 and 64 years old.
Approximately 3 million persons without health insurance in 1985 (9 percent of all nonelderly
uninsured) were in families whose head was self-employed. Compared to the nonelderly population
as a whole, individuals in families whose head was self-employed are more likely to be uninsured
(25 percent versus 17 percent) and less likely to be covered by employer-provided insurance
(49 percent versus 66 percent).
Based on data from the Sui"vey on Income and Program Participation, it is estimated that
16 percent of all business owners were uninsured, in 1984. compared to about 10 percent of wageand salary employees. Sole proprietors and partners in 1984 were nearly four times more likely
to be uninsured than were owners of incorporated businesses (20 percent versus 5.4 percent).
The availability of health insurance to employees and owners of unincorporated businesses seems
mainly to depend on the size of the business and the average income or wage paid by the business.
Ihese relationships are likely due to considerations such as the cost of providing insurance to
small groups. In this regard, there is little difference between unincorporated and incorporated
businesses.
There is, however, one tax limitation that discourages the purchase of health insurance by the
self-employed. Except for the years 1987-1989 and the first 9 months of 1990, a self-employed
person is not allowed to deduct expenses for his or her own health insurance as a cost of business,
but instead is treated like nonworkers and workers without employer-provided insurance. That is,
insurance purchases are treated as non-deductible individual expenses. In the Tax Reform Act of
1986, self-employed persons were allowed to deduct 25 percent of their own health insurance
premiums for the years 1 987 through 1989. The Omnibus Budget Reconciliation Act of 1989 extended

-77-
the deduction through October 1, 1990, and the President's Budget would make the deduction
permanent.
Targeting a deduction to the self-employed is not easy because many are self-employed only part
time or have employed spouses with health insurance coverage. Because targeting is difficult, the
1986 Act included restrictions such as that the 25 percent deduction cannot exceed self-employment
income, and that the self-employed may not claim the deduction if they are eligible to participate
in a subsidized health plan of their own employer or their spouse's employer.


CHAPTER 9: CURRENT INCENTIVES FOR PRI\ ATE HEALTH INSURANCE
I. THE EXCLUSION FOR EMPLOYER-PROVIDED INSURANCE
A. Resource Allocation
Current tax treatment lowers the net price of health insurance to individuals who receive it from
their employers because it allows them, in effect, to purchase health insurance out of before-tax
dollars. There is relatively little evidence on precisely how much the exclusion increases health
insurance coverage. It does seem clear, however, that the reduction in the price of employer-
provided health insurance has stimulated overall demand for health insurance, although some of the
rise in employer-provided insurance has simply replaced purchases of individual health policies.
Feldslein and Friedman ( 1977) suggest that the effect of the exclusion on insurance coverage can be
substantial. They estimate that the exclusion from both income tax and Social Security payroll lax
substantially reduces the amount of medical care costs paid for directly by individuals through
out-of-pocket funds. For instance, the average coinsurance rate individuals are willing to bear
falls from 0.58 to 0.37.^^
This reduction in the proportion of medical care costs paid through out-of-pocket funds in
turn encourages consumers to increase their consumption of health services, and to purchase health
care that would not be purchased in the absence of third party payments. For instance, with a
30 percent subsidy, individuals would demand one dollar of medical care as long as they would pay at
least 70 cents for the care. This result might be desirable if the medical care provided
substantial external benefits, but for the additional care that the subsidy purchases, this may not
be the case. Therefore, some of the resources used in providing this tax subsidy might be more
cost-effectively used elsewhere.
A number of studies have found that changing the extent of patient cost-sharing strongly
influences the use of medical senices. Estimates vary somewhat from study to study, but a
consensus view is that reducing the price faced by consumers of medical care by 10 percent would
lead to an increase in health care services consumed by between I and 3 percent.^ The impact on
demand appears to be greater for outpatient medical care than for hospital care28
The last dollars of tax subsidy provided for health insurance are likely to be the least
cost-effective. Since most individuals would want some insurance for catastrophic events, modest
policies provided by employers would nomially replace purchases of similar individual policies, with
little impact on the overall level of coverage. However, the additional, or marginal, health
insurance expenditures that the current unlimited exclusion encourages are more likely to go toward
first-dollar coverage and coverage of relatively predictable and routine expenses, such as eye care
or dental care. The tax exclusion also gives individuals less reason to enroll in health
maintenance organizations (HMOs) and other types of programs designed to constrain costs. Thus,
the least cost-effective portion of the tax exclusion is in the last dollars spent on the tax
subsidy. Correspondingly, the greatest gains in cost-effectiveness from limiting the subsidy would
come from limiting the tax benefit rather than from taking away tax benefits for the first dollars
spent.
-79-

-80-
Overinsurance can result in additional and uneconomic administrative costs, rather than changes
in actual medical services obtained. Administrative costs—costs of processing and paying
claims-while small relative to large health bills, can be quite large relative to small bills. It
is the relatively small purchases that insurance covering first-dollar expenditures and routine care
is most likely to stimulate. Another inefficiency of the exclusion is to encourage employer-
provided insurance relative to other types of group insurance.
The inefficiencies that the exclusion introduces into the health care market and the economy in
general suggest that some of the resources it directs into health care could be used morecost-effectively. Estimates imply that the amount of resources involved is large. The exclusion
will reduce Fedenil income tax receipts by an estimated $37 billion in Fiscal Year 1990. and Social
Security receipts by an estimated $19 billion.
B. The Price of Medical Care
The exclusion for employer-provided health insurance increases demand for health insurance and
thereby increases demand for health care services. This rise in the demand for health care services
can increase not just the quantity of services provided, but their price as well. The price of
medical care has risen over the past 20 years at a rate significantly exceeding the general rate of
inllation.
This sustained relative price rise has several important implications. Those who lack health
insurance or who must purchase their own individual coverage pay more for health care than they
would in the absence of an exclusion. Even those who have some limited employer-provided insurance
may find that the health care price increases for their out-of-pocket expenses outweigh the
tax-subsidized cost of their insurance. The price increases also place additional strains on the
Medicaid and Medicare programs.
It is difficult to estimate precisely how much the exclusion affects price increases. A 30 or 40percent subsidy will increase prices by the entire amount of the subsidy if the amount supplied
varies little with price changes. If, on the other hand, the amount supplied varies substantially,
the price increases are less. For most goods, a subsidy increases both the price and the amountsupplied. It has been argued that when a large proportion of the population faces trivially small
out-of-pocket costs, and so saves little or nothing by demanding low-cost services, the demand side
of the market ceases to exert any control over the market. Some also argue that the
over-consumption of insurance may lead in the longer run to further increases in both demand and
price. The available data do not allow this assertion to be tested.
II. EFFECT ON COVERAGE
The current unlimited exclusion for employer-provided insurance, in addition to
introducing inefficiencies in the market for health care, creates disparities in the tax treatment
of individuals. Persons at similar income levels are treated differently, depending on the amountof health insurance (if any) their employer provides. Because persons with higher incomes are morelikely to have access to employer-provided insurance, the exclusion provides greater benefits to
those with higher incomes.
CHAPTER 10: OPTIONS FOR FINANCING HEALTH INSURANCE OF THENONELDERLY
I. OPTIONS RELATING TO EMPLOYER-PROVIDED HEALTH INSURANCE
A. Limit Employee Exclusion
Individuals who are eligible for employer-provided health insurance would continue to receive a
tax subsidy, but a fixed dollar limit per month on the exclusion would replace the current unlimited
exclusion. Employer contributions for health insurance in excess of a fixed dollar limit per month
would be included in the employee's gross income. Separate limits would be set for family and
individual plans. The limits would be adjusted annually for inflation. If the employer
contribution exceeded the limit, the employee would be subject to both income and Social Security
taxes on the excess in the same manner as wages. For purposes of the exclusion, all tax-preferred
money spent on health care should count towards the exclusion limit, whether the funds are termed
employer contributions or employee salary reductions. The cap could be set sufficiently high that
it would apply to relatively few employees.
A limit on the exclusion of employer-provided health insurance has been proposed before.
President Reagan's Budget for Fiscal Year 1985 proposed to limit employer contributions to health
and accident plans to $1 75 per month for a family plan and $70 per month for an individual plan. Asimilar limit was proposed in Treasury I, The Department of the Treasury Report to the President
on Tax RefoiTn for Fairness. Simplicity, and Economic Growth .
Effects of Limit. Limiting the exclusion could increase the efficiency of the health care system
and help restrain health care cost infiation. The increase in cost -effectiveness would depend on
the long-term response of employers and consumers. However, any reduction in the rate of health
care price increases would most likely be shared by both consumers of health care and taxpayers (who
pay for the cost of the public health care system). A slower rate of health care cost infiation
would be helpful to government health programs. A limit might also restrain future growth in health
expenditures and help people make explicit choices about the health care they receive.
Employers would remain free to provide any level and type of health insurance plan they and their
employees desire, and would still have a tax incentive to provide health insurance up to the limits.
Under this option, the trend towards plans with explicit cost-sharing between employers and
employees (or other cost management characteristics) would continue with the employer share at or
below the limit. Employees might purchase supplemental policies, but those purchases would be out
of their own after-tax income.
Disparities would be lessened among workers in firms that offer insurance and workers and
nonworkers without access to it. For workers with employer-provided insurance, the subsidy would no
longer increase without limit as the amount of employer-provided health insurance increases. The
limits could generally be set to exceed employer contributions for most employees (and so not
directly affect them), yet indirectly benefit many employees as well as many nonworkers.
-81

-82-
The number of persons affected by a limit on the exclusion, and the consequences for Federal tax
revenues, would depend on the levels chosen. Monthly limits on employer contributions of $400 for
families and $160 for individuals could affect about 16 percent of current recipients if such limits
were fully in place in 1992. depending on the structure of the exclusion limit. Lower limits, such
as $300 and $120, would affect an additional 19 percent of current recipients or about 35 percent of
current recipients.
Design Considerations . A number of design features need to be considered in developing a limit
to the exclusion. These features take account of a number of measurement and administrative issues
that reflect the diversity and complexity of the employer-provided health insurance system. The
services that the excluded employer contribution may cover must be defined. In addition, the
employer contribution for those services for each employee must be determined. It would be possible
to draw on several years of employer experience in making similar determinations under COBRAcontinuation rules.
Account also may also need to be taken of insurers" pricing practices. For example, underwriting
practices may cause price variations when a single set of insured services is purchased by employers
whose workforces, working conditions, or group size differ. Employers that operate in more than one
area may have contracts with a number of different insurers. Price variations across areas mayreflect variations in insurer characteristics, practice patterns, and health care prices. Someemployer practices, such as tracking the number of employees choosing a plan or plan option (high-
and low-options, self or family), but not which employees chose it, will need to be addressed.
Self-insuring firms pose additional design considerations because they may not currently have a
calculation corresponding to a third-party insurer premium available until after the employee's tax
year.
Alternative definitions of the payments that count towards the employee exclusion or employer
deduction limits would have to be considered. In current practice, employer-provided insurance
commonly includes services such as physician visits and hospital and surgical charges. In manyfirms, related benefits such as dental and vision services are provided as part of a health
insurance plan, while (he same ser\'ices may by provided separately in other firms. The concept of
health sometimes expands further to include a range of home health care services and various other
services that are more difficult to distinguish from ordinary expenses of living. The definition
matters because of the differing tax treatment the benefits would receive if they do not qualify
under the limits as health benefits.
B. Allow Exclusion Only for Policies with Specific Provisions
An alternative option would be to allow employees to exclude from income only those
employer-provided insurance policies with certain key provisions, such as a minimum deductible and
coinsurance rate. The option is design-based and would exclude from employee income all employer
contributions for health insurance coverage of the costs of specified health care and preventive
(e.g.. well-baby care) services, provided the insurance required deductibles and copayments from the
beneficiaries. For example, an annual deductible of $500, a 20-percen( copayment rate, and an
annual out-of-pocket maximum of $3,000 (all indexed), would protect beneficiaries from the costs of
extensive illnesses yet give them meaningful incentives to review and monitor their use of insured

-83-
health care. The deductible and copayment amounts could be set to provide the desired Federal tax
subsidy, and could be altered to control the cost of the subsidy. Employers and employees wouldremain free to choose any additional health insurance options they wish, but without Federal tax
subsidy.
Design Considerations . Many of the design considerations that apply to a limit on the
exclusion, such as underwriting, geographical and firm size variations in the cost of similar
policies, would not necessarily need to be imposed on employers in implementing this option because
it would be the design of the plan rather than cost that would lead to the exclusion. Private
insurers could continue to determine the price of the insurance they offer. Measurement issues
could not be avoided entirely in implementing this option, however. For example, it might be
necessary to calculate the national average of the cost of excludable insurance plans to determine
how much of employer contributions to Health Maintenance Organizations would be excludable: If the
entire contribution were excludable that might give HMO subscribers a much greater subsidy than
beneficiaries of regular insurance. The exclusion for HMO subscribers might, for example, be set at
the national average of the cost of excludable insurance plans.
The health and tax policy effects, as well as the revenue effects, of this option could depend
on the precise language chosen. If the language were not reasonably specific, it would possible for
workers in the same firm to receive very different Federal subsidies if they participate in
different plans. If the allowable coverages were not clearly delineated, it would possible for any
potential revenue gain to be eroded by expanded coverage of other medical sei"vices.
C. Limit Employer Deduction for Health Insurance
Another option is to apply the exclusion limit at the firm level. The limit could be applied at
the firm level by disallowing the employer deduction for insurance premium payments in excess of a
limit or by placing an excise tax on the employer. Applying the limit at the employer level could
be somewhat simpler administratively than applying the exclusion at the individual level.
However, applying an employer limit also presents several difficulties. Disallowing the employer
deduction would affect only employers who pay Federal income tax; it would not affect slate and
local governments or nonprofit institutions. Either disallowing the employer deduction or imposing
an employer excise lax is less visible to employees than is imposing the limit on individual
workers. Employees would be made less aware of the cost of their health insurance than they would
be with individual limits. Applying the deduction limit to average premiums in a firm rather than
to individual premiums also could also be less equitable. Employers could choose to achieve an
average thai equaled the limit by lowering the premiums they pay on behalf of some workers while
raising the premiums they pay on behalf of other workers.
Design Consideration s. Many of the design considerations affecting the preceding options would
also apply to limits on Ihe employer deduction.
II. CREDIT FOR HEALTH INSURANCE
One option for increasing access to health insurance coverage for persons who currently do not
benefit from Medicare. Medicaid, or employer-provided health insurance is a tax credit for health
insurance. The credit could be made refundable.
-84-
A refundable credit could, for example, apply only to health plans meeting certain criteria that
would help make insurance available to owners and employees of small businesses and to other groups
who otherwise find it difficult to purchase insurance. Its value could be adjusted annually for
inflation. The credit might not provide enough money for all the health insurance a family desired.
But many would be able to contribute additional amounts for their policies. This option would
increase access to standard care.
A credit option would have attractive budgetary features. Its cost could be controlled over time
by controlling the value of the credit. For example, actual usage of the credit might exceed
original projections because existing data do not allow an accurate assessment of why persons are
uninsured. The value of the credit could be controlled until total costs stayed within the desired
budgetary total.
Form of Credit . A modest refundable credit of $200 per individual for those not eligible for
coverage by employer-provided insurance or public insurance would be equivalent to about $600 per
family. A credit of this size would help a currently uninsured family purchase an insurance policy
covering fairly conventional care for major accidents and illness, or a comprehensive managed-care
option such as an HMO. But the credit alone would not be sufficient to cover most of the costs of a
policy or to pay for all routine care and the costs of minor illnesses and injuries. For example,
the 1990 cost of the standard Blue Cross policy available to Federal workers is $3,700. The credit
also could be structured to dovetail with community health programs to provide care at lower costs
and to provide for a greater sharing of the cost of care. For example, states could choose to
supplement this Federal credit.
A credit could be structured in several ways. For example, the credit could be extended to
everyone, rather than only to persons without employer-provided insurance or public health care
program. Structuring the credit this way would reduce one component of administrative costs,
because it would eliminate the need to verify that credit recipients received no other Federal
health care subsidy. However, the revenues required to fund even a modest credit and to administer
it would rise because far more persons would be eligible. Approximately 90 tnillion households would
be eligible for a general refundable credit, while approximately 30 to 33 million individuals wholack access to any insurance would he eligible for a targeted refundable credit. Also, the general
refundable credit would be available to persons who already receive a Federal subsidy for health
care through the exclusion of employer-provided insurance below the limit or through direct
services.
Whatever form a credit takes, most eligible individuals and families would claim the credit on
their tax returns at the end of the year. However, if the credit were refundable, insurance
companies could be allowed to file for a credit on behalf of individuals and their families who are
not required to file a tax return. To receive a credit, companies would file statements with the
Federal government showing that the insurance had been issued and listing the Social Security
numbers of individuals receiving it. This option would continue to relieve these individuals of the
burden of filing an income tax return when they otherwise would not need to do so. Administrative
issues would need to be considered in implementing this option.
Scope of Credit . There also are options on the scope of health insurance to which a refundable
credit could be applied. One option would be to allow the credit to apply towards any insurance

-85-
policy that meets relevant state laws as health insurance. However, policies that meet state
mandates may not be the most effective in assuring access to care for primary health needs. Analternative would be to require specific classes of care to be covered. For example, the insurance
might be required to insure against catastrophic financial losses by covering all hospital and
doctors' costs beyond a specified deductible. For the modest levels of credit discussed in this
Report, the deductible level is likely to be high. Individuals could insure themselves against more
routine out-of-pocket costs only by buying additional insurance with their own funds. The credit
could also be designed to apply to policies that cover cost-effective preventive care, or to cover
routine health care that is deemed essential to the public health, such as immunizations for
children.
Access to Insurance . A modest refundable credit alone may not provide meaningful access to
insurance for many individuals. Individuals may not have insurance because they lack the means to
pay for it. but also because of other barriers, such as being able to buy only policies with
individual, rather than group, undeiAvriting. Individual underwriting raises the cost of insurance;
a credit may not offset enough of the increased cost. To improve access, plans eligible for the
credit could be required to be offered uniformly to all credit recipients on a risk-shared basis.
By allowing the credit only for plans participating in an effective risk pool, the cost of
individual policies would be lowered, and the credit would be worth more.
The credit is unlikely to be sufficient to purchase insurance that covers both routine,
predictable health care expenses and high-cost, unpredictable expenses. The credit could be limited
to insurance against high-cost, unpredictable expenses. This restriction would prevent persons of
modest means from facing financial disaster in the event of a major illness. It would also prevent
people from relying on the insurance to cover routine and predictable health care expenses and
relying on Medicaid or other public insurance for the rare but costly expenditures.
The credit also would allow the private sector to continue to make choices about the optimal
designs of insurance packages (within any criteria that might be set). Individuals purchasing
insurance would be able to respond to market changes and to new and changing needs for care. Thelimit to the credit, like the limit to the employer exclusion, would remove incentives for purchases
of insurance that are, at the margin, of limited cost-effectiveness.
III. ADDITIONAL OPTIONS
In implementing any of the options discussed in this chapter, there are some groups whose
circumstances might be considered separately.
A. Groups of Special Concern
The Self-Em ployed: Deduction Instead of Credit . The self-employed could be permitted to deduct
the full cost of their health insurance instead of receiving the credit. The deduction could makehealth insurance more affordable for the self-employed (by the amount that the tax-saving from the
deduction exceeds the value of the credit), but would not affect the cost of insurance for any
employees of the self-employed. However, the deduction alone is unlikely to remove important
-86-
problems that the self-employed face in purchasing insurance, and a full deduction involves
significant revenue costs.
The Self-Employed: Permanent 25 Percent Deduction . Instead of allowing the self-employed to
deduct the full cost of their health insurance, the current 25 percent deduction for health
insurance for the self-employed could be extended permanently. The deduction is scheduled to expire
on October I. 1990. A permanent extension has been proposed in the President's Budget for 1991.
The 25 percent deduction makes health insurance more affordable for the self-employed and reduces
the inequity in treatment for this group of direct health insurance payments in contrast to full
exclusion of employer-paid premiums. Like the full deduction, however, it does not address the cost
of insurance for their employees or lower any of the barriers the self-employed face in purchasing
insurance.
Early Retirees . Persons who reach the age of 65 generally are eligible for the benefits of the
Federal Medicare program. Many persons currently retire at much younger ages. Many of these early
retirees have employer-provided health insurance that continues to be the main source of their
health care coverage until they become eligible for Medicare. Retirees who do not have
employer-provided health insurance and who are not eligible for Medicare may currently receive no
Federal subsidy for health care. They could be made eligible for a health insurance credit or for
direct outlay programs.
B. Design Considerations
These additional options would need to address many of the same design considerations as the
limit on the employee exclusion.
IV. REVENUE EFFECTS
Federal revenues, as well as the number of persons affected by a limit on the exclusion, depend
on the form and levels chosen for the limits. The higher the limit, the fewer current recipients of
employer-provided health insurance who would be affected. But the relationship among dollar limits,
affected recipients, and revenues is not straightfoi^ward. Revenues would also be affected by
specific choices (for example, in measuring employer contributions) that would have to be addressed
in implementing any option.
Illustrative examples of the number of persons affected by two alternative pairs of monthly
limits, and the corresponding estimated increase in Federal revenues, are shown in Table 10.1.
Monthly limits of $400 for a family and $160 for an individual would increase revenues by
approximately $3. 1 billion by 1992. Lx)wer limits of $300 and $120 would generate an estimated
additional $7.0 billion in 1992.
In the long run. the additional taxable wages generated by this proposal would result in somewhat
higher Social Security benefit payments and improve the Medicare trust fund balance. Thus, in the
very long run. the additional resources made available would come mainly from the income tax.

-87-
The cost of a modest refundable credit of $200 per individual for those not covered by
employer-provided insurance or public insurance would be about $6 billion in 1992. A relatively
high limit on the exclusion (such as $400 and $160) would not initially raise sufficient revenues to
cover the credit, but lower ($300/$ 120) limits would appear to be sufficient.
The cost of making permanent the current 25 percent deduction for the self-employed would be
about $400 million in 1992.

-88-
Table 10.1 Illustrative Revenue Estimates for Selected Options
1991 1992 1993 1994 1995
Monthly Limit on Exclusion
$400 families/ $160 individuals
Total receipts
Percent of affected recipients
$300 families/ $120 individuals
Total receipts
Percent of affected recipients
Annual Refundable Credit
($ in billions)
$1.5 $3.1 $4.5 $6.7 $9.6
15 % 16 % 19 % 22 % 26 %
$5.4 $10.1 $13.6 $18.4 $23.6
32 % 35 % 39 % 40 % 42 %
$200 per individual, up to
$600 per household
Total Cost -$0.4 -$6.1 -$6.6 -$7.3 -$7.8
Permanent 25% Deduction for
Self-Em ployed -0.2 -0.4 -0.5 -0.5 -0.6
Department of the Treasury
Office of Tax Analysis
Note: Estimates assume that contributions to cafeteria plans for health will be
included in the computation of employer contributions.
The monthly exclusion limit and the value of the refundable credit for
1991 and beyond are indexed by the Consumer Price Index for all items.
The refundable credit is available to persons who do not have employer-
provided insurance or public health insurance.

APPENDIX A
SYNOPSIS OF FEDERAL INCOME TAX RULES
RELATING TO HEALTH, PENSION, AND LONG-TERM CARE BENEFITS


SYNOPSIS OF FEOFRAL INCOME TAX RULESRELATING TO HEALTH, PENSION, AND LONG-TERM CARE BENEFITS
1. HEALTH BENEFITS
A. Current Health Benefits
Employer-p rovided hea lth benefits . An employer may deduct the cost of providing current health
benefits to employees, whether through insurance or otherwise. An individual employee may fully
exclude from income the value of employer-provided health benefits. This exclusion applies both for
income tax and PICA tax purposes. The exclusion is limited in the case of certain highly
compensated individuals who receive health benefits under a self-insured, employer-maintained health
plan that discriminates in favor of such highly compensated individuals (Sees. 105 and 106, of the
Internal Revenue Code of 1986).
An employer may maintain a cafeteria plan under section 1 25 of the Code that permits employees to
purchase health benefits on pre-tax basis through a salary reduction feature. This tax preferred
treatment is limited in the case of certain highly compensated individuals who participate in a
discriminatory cafeteria plan.
Individual medical expenses . Under section 213 of the Code, an individual may deduct
nonreimbursed personal medical expenses to the extent that they exceed 7.5 percent of the
individual's Adjusted Gross income. This deduction applies for income tax purposes and does not
apply for PICA or SECA tax purposes. Personal medical expenses include expenses for medical care of
the individual's spouse or dependents.
The entire cost of institutional care, such as nursing home care, may in some cases be treated as
a medical expense even though the cost covers such items as meals and lodging. Whether the entire
cost of institutional care may be treated as a medical expense requires a factual determination.
Internal Revenue Sei-vice regulations provide that if "an individual is in an institution because his
condition is such that the availability of medical care in such institution is a principal reason
for his presence there, and meals and lodging are furnished as a necessary incident to such care,
the entire cost of medical care and meals and lodging at the institution, which are furnished while
the individual requires continual medical care, shall constitute an expense for medical care." If
the individual's presence in the institution does not satisfy this test, then only the portion of
the cost of care in the institution attributable to medical care may be treated as a medical
expense.
-89-

-90-
In addition, section I62(m) provides that for tax years beginning after 1986, but not after 1990,
a self-employed individual may deduct 25 percent of the cost of providing medical insurance to the
individual and the individual's spouse and dependents. The deduction does not apply to amounts
expended on coverage for periods after October I, 1990. The deduction applies for income tax
purposes, but not for SECA purposes.
B. Post-Retirement Health Benefits
Employer-provided post-retirement health benefits . Generally, if an employer provides current
health benefits to retired employees, the rules discussed above relating to current health benefits
apply. Thus, if an employer provides health insurance to retirees on a current, pay-as-you-go
basis, the employer may deduct the cost of such insurance and the individual retirees may fully
exclude the value of the insurance.
Within certain limits, an employer may prefund on a tax-favored basis the cost of providing
health benefits to retirees. Under the general rules, an employer may not deduct the cost of
providing a benefit to employees until the year in which the benefit is received by the employees.
Thus, the fact that an employer promises in the current year to provide a certain benefit to an
employee in a later year is not sufficient to enable the employer to deduct the cost of the benefit
in the current year. The Code provides special rules, however, under which an employer maycurrently deduct contributions made to prefund the cost of providing health benefits to retirees.
Ihis may be accomplished through either a welfare benefit fund, or through a pension plan.
Welfare benefit funds . The term "welfare benefit fund" encompasses a broad category of vehicles
in which an employer has set aside funds to provide various benefits (such as health, life insurance
and disability benefits) to employees. Section 419(e) of the Code defines a welfare benefit fund to
include any fund through which an employer provides benefits to employees. A fund is in turn
broadly defined to include any of certain tax-exempt trusts (such as a VEBA—a Voluntary Employees'
Beneficiaries Trust under section 501(c)(9) of the Code), any taxable trust or corporation, and any
account held for the employer by another person. Thus, for example, a trust established by the
employer to provide health benefits to the employer's employees is a welfare benefit fund.
An employer may establish, through a welfare benefit fund, a reserve to pay post-retirement
health benefits to future retirees. The employer may currently deduct contributions to this reserve
within specified limits. An employer may deduct the contributions only to the extent that the
contributions do not exceed the amount necessary to fund such benefits on a level basis over the
working lives of the employees. In addition, the funding level must be based on current medical
costs. No projection for increases in medical costs in the future may be taken into account.
Finally, the fund must satisfy certain nondiscrimination rules.
Generally, any income earned by the post-retirement health benefits reserve is taxable currently.
If the reserve is held by any of certain tax-exempt trusts, such as a VEBA. then the income is
taxable to the trust, despite the trust's otherwise tax-exempt status (Sec. 512(a)(3)(E)(i)). If
the fund is held by any other organization, such as a taxable trust or an insurance company, then
the income is taxable currently to the employer (Sec. 419A(g)).
-91-
A post-retirement health benefits reserve must maintain separate accounts for funds set aside to
provide benefits to key employees. Amounts allocated to such separate accounts are taken into
account in applying certain limits on contributions to qualified retirement plans (See part II. A).
Pension plans . Section 401(h) of the Code provides that a qualified pension plan may provide
health benefits to retired employees, their spouses and dependents. Contributions to fund the
health benefits will be accorded the same tax-favored treatment as contributions to fund the pension
benefits -the contributions will be currently deductible by the employer and will accumulate
tax-free in the pension trust -provided that such benefits are provided on a nondiscriminatory basis
and are "subordinate" to the retirement benefits under the plan. Under Treasury Department
regulations, health benefits will be "considered subordinate to the retirement benefits if at all
times the aggregate of contributions (made after the date on which the plan first includes such
|health| benefits) to provide such |heallh| benefits and any life insurance protection does not
exceed 25 percent of the aggregate contributions |to the plan| (made after such date) other than
contributions lo fund past service credits." The health benefits may be funded on the basis of a
level annual amount, or a level annual percentage of compensation, over an employee's working
life.
The contributions made to fund the health benefits must be accounted for separately from the
funds set aside for retirement purposes. In addition, separate individual accounts must be
established with respect to funds set aside to provide health benefits to key employees.
Contributions to such separate individual accounts are taken into account in applying certain limits
on annual contributions to qualified retirement plans (See Part II. A., below).
II. PENSION BENEFITS
In general, amounts paid as deferred compensation are deductible by an employer only as they are
included in the income of employees. Moreover, income on amounts set aside by an employer to fund
deferred compensation is generally taxable to the employer as earned. Exceptions to these general
rules are provided for deferred compensation provided under tax-qualified retirement plans. Thus,
within certain limits, employer contributions to such plans are currently deductible by the employer
even though employees will not be taxable until they receive distributions from the plans. In
addition, the income earned on assets held in a tax-favored retirement plan is not subject to tax
while it remains in the plan.
A. Limits on Contributions and Benefits
An employer maintained retirement plan receives tax-favored treatment only if it satisfies
certain qualification requirements specified in the Internal Revenue Code. Among the qualification
requirements are restrictions on the annual contributions and benefits that may be provided with
respect to any individual under the defined contribution plans and defined benefit plans of the
employer. Separate limits apply to each individual in a defined contribution plan and to each
individual in a defined benefit plan ("separate plan limits"). A "combined plan limit" also applies
to any individual covered by both a defined contribution and a defined benefit plan. For this

-92-
purpose. defined contribution plans generally include profit-sharing, stock bonus, money purchase
pension and annuity plans, certain tax-sheltered annuities and simplified employee pensions.
Defined benefit plans for this purpose are limited to defined benefit pension plans.
Defined benefit plans . The separate plan limit for defined benefit plans provides that an
individual's annual retirement benefit at normal retirement age may not exceed $90,000. The $90,000
was the applicable figure for an individual retiring in 1987. and is indexed (in a manner similar to
the indexing of the PICA wage base) beginning in 1988. For 1989. the figure was $98,064.
A defined benefit pension plan may provide for an automatic cost of living adjustment to the
pension benefit. However, an individual's benefit in a given year may not exceed the limit on
annual benefits in effect for that year.
Section 4l5(k) provides for special cost of living arrangements in defined benefit plans. These
are voluntary arrangements under which employees may make after-tax contributions to prefund for
cost of living adjustments to their pension benefits. The employee contributions to such
arrangements are not taken into account for purposes of the annual limits on contributions although
Ihey are taken into account for purposes of the combined plan limit. In addition, an employee maytransfer employer contributions (and income) from a defined contribution plan to fund a
cost-of-living arrangement. Such transfers are not again taken into account under any of the plan
benefit limits. The benefits funded by such employee and transferred employee contributions are not
taken into account in determining whether annual benefits under the plan exceed the annual limit on
benefits.
Key employees (certain officers and owner-employees) may not be eligible to participate in a
cost-of-living arrangement.
Defined contribution plans. The annual contributions, forfeitures and other additions made to an
individual's account in a defined contribution plan by or on behalf of an individual may not exceed
the lesser of 25 percent of the individual's compensation and $30,000. The $30,000 limitation will
be indexed for infiation beginning with the year in which the annual defined benefit limit reaches
$120,000. In addition to contributions to defined contribution plans, allocations to separate
individual accounts for post-retirement health benefits for key employees count toward the $30,000
(but not the 25 percent) limit.
Combined plan limits . Combined plan limits operate to prevent an individual from receiving both
the maximum annual contribution under a defined contribution plan and the maximum annual pension
benefits under a defined benefit plan.
B. Deductions and Funding
An employer's deduction for contributions to a qualified retirement plan is subject to the
following limits.

-93-
In (he case of a defined benefit pension plan, the amount deductible may not exceed the lesser of
two limits. First, the deductible amount may not exceed contributions necessary under reasonable
actuarial methods to fund the retirement benefits under the plan. In determining this deductible
level of prefunding, the employer may project salary increases of employees (and thus prefund for a
projected retirement benefit) but may not project increases in the annual ($90,000) limit. If a
plan provides a cost-of-living increase as part of the benefit formula, the employer may prefund for
the projected cost-of-living benefit increases (within the $90,000 annual limits). Second, a
contribution is deductible only to the extent that the contribution does not result in total plan
assets in excess of 150 percent of the plan's current liability.
An employer's contribution to a profit-sharing or stock bonus plan is limited to 15 percent of
the aggregate compensation paid during the taxable year to all employees in the plan.
If an employer contributes to both a pension plan and a profit-sharing or stock bonus plan, the
total deduction for a year is limited to the greater of 25 percent of the aggregate compensation
paid during the year to employees covered by the plans and the contribution necessary to fund the
pension plan.
C. Distribution Rules
Requ ired distribution rules (Sec. 401(a )(9)). Qualified retirement plans are subject to minimum
distribution rules that require that distribution of an individual's retirement income commence by
a certain time, and require that (he retirement income then be paid out at least as rapidly as a
specified minimum rate. Sifnilar rules apply (o Individual Refirement Accounts. (There are
additional rules regarding required distributions after an employee's death to the employee's spouse
and other beneficiaries: those rules are no( discussed here.)
Minimum commencemen( rule. In general. dis(ribu(ionsof an individual's retirement income must
commence no later than the April 1 following the year in which the individual attains age 70-1/2.
Distributions may. of course, commence earlier.
Minimum rate rule. In general, an individual's retirement income must be distributed as
least as rapidly as substantially nonincreasing annual payments commencing at the required
commencement date over (he individual's life or life expec(ancy (or over the lives or joint life
expectancy of the individual and the individual's beneficiary). Distributions may decrease over
time. Distributions commencing as of the required commencement date may increase only if the
increase is based on a recognized cost-of-living index or results from benefit improvements under
the plan.
For example, in the case of a defined benefit pension plan, equal annual distributions made over
an individuals life (a life annuity), or over a period not exceeding the individual's life-
expectancy (a term certain annuity) will safisfy (he requiremen(s. Similarly, a life annuity that
provides for increasing annual payments, where the increase is based on a recognized cost-of-living
index, will satisfy the minimum distribution rules.

-94-
In a defined contribution plan, distributions commencing at tlie required commencement date will
satisfy the rules if the amount distributed in a year equals at least the product of the account
balance multiplied by a fraction equal to one divided by the individual's life expectancy. For
example, say an individual retires after attaining age 70-1/2 with a life expectancy of 15 years.
In the first year, he must withdraw at least 1/15 of his account balance. In the second year, 1/14,
and so on. The individual may recalculate his life expectancy each year.
Taxation. Generally, all distributions from qualified plans are taxable, except to the extent
allocable to basis. Basis is generally recovered on a pro rata basis.
Lump-sum distributions received after age 59-1/2 are eligible for special forward averaging
which generally results in lower tax. Forward averaging provides an incentive to make early
lump-sum withdrawals of retirement savings, and thereby potentially encourages the spending downof savings.
III. LONG-TERM CARE BENEFITS
Under IRS Revenue Ruling 89-43. reserves established by an insurance company under a level
premium, guaranteed renewable group long-term care policy are generally considered life insurance
reserves for income tax purposes. Accordingly, increases in such reserves, to the extent such
increases are within limits prescribed under the income tax law, are deductible in determining the
life insurance company's taxable income. Generally, this treatment enables the insurance company to
set aside resewes for future unaccrued claims (within the prescribed limits) on a deductible basis,
and enables such resen'es to grow on a substantially tax-free basis.

APPENDIX B
DETAILED TABLES FOR CHAPTERS 2, 3, 4, and 8


-95-
Table B-1 Average Real Income of Families, Adjusted
for Family Size, by Age of Head, 1967, 1979,
and 1984
Age of Head

-96-
Table B-2 Median Real Income of Families, Adjusted
for Family Size, by Age of Head, 1967,
1979, and 1984
Age of Head

-97-
Table B-3 Percent of Total Income by Source, Age, and Income Quartile, 1984
Age
Savings Public and
Income from Private
Savings and Pension Social
Earnings Investments Income Security
Cash Other
Welfare Income Total
to 4

-98-
Table B-4 Average Real Wealth of Households
by Age of Head, 1962 and 1983
Age of
Head 1962 1963
(1987 dollars)
Under 35

-99-
Table B-5 Median Real Wealth of Households
by Age of Head, 1962 and 1983
Age of
Head

100-
lacC3u
1CO
<na;
o S
CU CO
u3o
T3C03
a>
caXI
cwu
CU
Ol
c
= £
1/1
—I La
S CU
soI
sH
c
E
1)O
O00
usz
ao•5
C3O'•5
ocC3
> C3 ->
CL _L J:::
>>

-101-
Tnble B-7 Anniin! flenltli Care Expenses, Health Status, and Income:
Percent or Population in (iood or Poor Health and Average Expense Per Person,
By Age and Income, 1977

102-
Table B-8 Annual OnJ-of-Pocket Expense Tor Personal Health Ser\'ices and Private Health InsnrancePrenihnns as a Share of Family Income for Families With Positive Family Incomes, BySelected Population Characteristics, 1977
Characteristics of
Family Head andInsurance Coverage
Number Out-of-Pocket Expenseof for Personal Health
Families Services as Percent
(000) of Family Income
Out-of-Pockel Expense for
Personal Health Services
and Out-of-Pocket Premiumsas Percent of Family Income
Total 73,503 4.3% 6.2%
Age in Years:
19 to 24 6.710 3.7 5.8
25 to 5455 to 6465 and Over
Familv Incoine:
Less than $12,000
$12,000 to $IQ.000$20,000 or More
40.8231 1 ,092
14,726
30,991
18.845
23,667
Perceived Health Status:
Excellent 30.411Good 27.137Fair or Poor 13.067
Type of Insurance:
Private. Any CJroup 41.908Piivate, Nongroup 4.433Medicare and Private 13.521Medicare Only 2.525Medicaid Only ^ 3.510Medicare and Medicaid 2,157
3.4
4.46.7
7.1
2.8
1.7
3.3
4.1
6.6
2.9
6.1
6.48.9
3.9
4.4
5.0
6.59.3
10.1
5.5
2.5
5.2
6.1
8.6
4.7
11.3
9.7
8.9
3.9
4.4
Uninsured 5,449 5.9 5.9
Department of the IreasuryOffice of lax Analysis
Expenses in excess of income are set at 100 percent of income.
Includes families headed by persons less than 19 years of age. Excludes families with negative or zero income.
Excludes Medicare Part B premium.
Source: U.S. Department of Health and Human Services, Public Health Service, National Center for Health
Services Research and Health Care Technology Assessment, "A Summary of Expenditures and Sourcesof Payment for Personal Health Services From the National Medical Care Expenditure Survey," National Health Care Expenditures Study, Data Preview 24. May 1987, Table 12.

-103-

-104-
d3•4-iJ
CoUo\
I
»
2aH

-105-
Table B-10 Benefits for Hospital Room and Board: Percent Distribution of the Privately
Insured Population Under 65 With Coverage, by Type of Insurance, Sex, andEmployment Characteristics of the Primary Insured, 1977
Characteristics
of Primary Insured
Privately Insured
Population witii Hospital
Room and Board Benefits
Full Semip ii\ i te ChargeHigh
Maximum Other
All Persons
Type of Insurance:
NongroupAny Group25 or Fewer Members26-250 Members251-2.500 MembersMore Than 2.500 Members
Sex:
MaleFemale
Employment Status:
Full TimePart TimeSelf-Employed
Did Not Work In 1977
Industry:
Agriculture
Manufacturing and MiningConstruction
Transportation.
Communication and Utilities
Sales
Financial Services
Professional Services
Other Services
Public Administration and Military
(Percent)
98.3
95.8
98.6
98.0
99.1
99.2
98.2
98.2
98.6
98.5
97.9
97.5
97.2
96.0
98.9
99.0
98.9
98.5
98.7
98.8
96.4
98.3
-Percent Distribution-
Limited Daily Benefit
or Hospital Indemnity
53.2 21.1 25.7
11.3

FOOTNOTES
Part Two
^Doty. Liu and Weiner (1985).
See Report to the Secrelary on Private Financing of Long-Term Care for the Elderly . HHS, November 1986.
pp.^2-19.
See Report to the Congress and the Secretary by the Task Force on Long-Term Health Care Policies , HHS,
September 1987. p. 18.
Data on health expenditures cited in this chapter are from "National Health Care Fxpendittires. 1986-2000."
Health Care Financing Review . Summer. 1987. pp. 1-36. and "National Health Expenditures. 1987." Health Care Financing
Review. Winter 1988. pp. 109-122.
For a discussion of issues on the relationship between health expenditures and mortality trends, see.
e.g.. Fuchs (1983). Manton (1982). and Poterba and Summers (1987).
^See Pauly (1987).
''hHS (1986). pp. 2-22.* See "Who Can Afford a Nursing Home?" Consumer Reports . May 1988. pp. 300-31 1 . Also, a 1985 AARP poll
indicated that a majority of the elderly believed liiat Medicare covered most or all of the costs of a stay
in a nursing home.
'See HHS (1986). pp. 2-46 for additional information.^ ° The household income data are from Radner (1987). These data cover three years: 1967, 1979. and 1984. The data
are adjusted for differences in household size and are expressed in inflation-adjusted. 1987 dollars. The household
size adjustment was made by equivalence scales implicit in LI.S. poverty thresholds (see Radner, p. 15).
The median income of a group is a middle income level if incomes are ordered by size so that as many group
members have incomes above the median as below. The mean or average income is a related but different measure. The
mean income is the sum of all incomes in the group divided by the number of group members. Median income typically is
lower than mean income.^ ^ Poverty rate data are from the U.S. Bureau of the Census. Current Population Reports . Series P-60, Numbers 95
and 160.^ ^ A series of Census Bureau studies have shown a substantial absolute and relative decrease in the poverty rate
for the elderly when noncash benefits were included as a component of income. This result is sensitive to the method
of calculating the dollar value of noncash benefits and to the choice of which noncash benefits are included in
income. See also U.S. Department of Commerce. Bureau of the Census. Current Population Reports . Technical
Paper No. 50 for a discussion of the effect of noncash benefits on poverty, and Technical Paper Nos. 51-52 and
55-58 for poverty estimates which include the value of noncash benefits for the years 1979-1987.
^''Smeeding (1985) reports that a match by the Social Security Administration of the Current Population Survey
income records with administrative data records shows that households headed by an elderly individual understated
income by an average of 37 percent, compared with only 7 percent for nonelderly households. See also Radner 1987.
^^Smeeding (1985).^^ Wealth data are from the Federal Reserve Board, the 1962 Survey of Financial Characteristics of Consumers and
the 1983 Survey of Consumer Finances . The data are expressed here in 1987 dollars.
^^ Total assets is the sum of the value of the following: owner-occupied housing, other real estate, cash, demand
deposits, savings and time deposits, certificates of deposit, money market funds, government, corporate and foreign
bonds, other financial securities, the cash surrender value of life insurance and pension plans, unincorporated farm
and nonfarm business equity, corporate stocks and equity in trust funds. Total liabilities is the sum of mortgage
debt, consumer debt and other debt. Less fungible assets such as consumer durables and the present value of Social
Security and pension wealth are not included. (The cash surrender value of a pension holding is typically only a small
fraction of present value.)
SSA unpublished data.
^'u.S. Department of Health and Human Services. Social Security Bulletin. Annual Statistical Supplement. 1986 .
Table 4.
-107-

-108-
See U.S. Congress, CBO, "Tax Policy for Pensions and Other Retirement Saving," Table 29. The data are for private
wage and salary employees. Coverage includes participation in defined benefit and defined contribution pension plans,
pay-as-you-go and defened profit-sharing plans, plans of nonprofit organizations, union plans, and railroad plans.
Coveiage has been adjusted for participation in multiple plans. Note that employees may be covered by a pension plan
but not be eligible for pension benefits until they become vested in the plan (which under the Tax Reform Act of 1986
must occur within five years of being covered).
Note that many current retirees are unaffected by the ERISA changes because those changes generally took effect after
1976. by which time persons who were 65 years old in 1984 would have been 57 years old.
^^See. for example. CBO 1987, and the General Explanations of REA. TEFRA. COBRA, and TRA86for recent pension legislation. Appendix 1. CRS 1987. pp. 342-343, discusses the history of Federal pension
legislation.2 3
U.S. Department of Labor. Employer-Sponsored Retiree Health Insurance . 1986.
BLS 1987 Employee Benefits in Medium and Large Firms 1986 .
SSA unpublished data.2 6A survey commissioned by AARP in 1987 indicated that II percent of the elderly believed, mistakenly, that
Medicare covers a substantial portion of nursing home costs. The 1985 AARP survey indicated that a majority believed
that Medicare covers a substantial portion of nursing home costs.
See OAO "Long-lerm Care Insurance: Coverage Varies Widely in a Developing Market," May 1987.
A recent paper by Friedman and Manheim simulates demand for long-lerm care insurance and finds that demand for
such insurance is virtually zero when administrative costs and reserves amoimt to 30 percent of the premium— not
atypical for individual policies—while demand would be strong when administrative costs and reseives amount to
10 percent. Note, however, that certain insurance, such as Medigap policies, has been purchased on a widespread
individual basis by the elderly.2 9
"
To laiget this deduction, certain restrictions apply, such as that the 25 percent deduction cannot exceed
self-employnient income and that the self-employed may not claim the deduction if they are eligible to participate in a
subsidized health plan of their own employer or their spouse's employer.
Internal Revenue Service regulations provide that if "an individual is in an institution because his condition is
such that the availability of medical care in such institution is a principal reason for his presence there, and meals
and lodging are furnished as a necessary incident to such care, the entire cost of medical care and meals and lodging
at the institution, which are furnished while the individual requires continual medical care, shall constitute an exjiense
for medical care." If the individual's presence in the institution does not satisfy this test, then only the portion of
the cost of care in the institution attributable to medical care may be treated as a medical expense. So. for instance,
the costs of living in a retirement community would likely not be deductible as a medical expense.
Lower-paid workers may take account of the structure of Social Security in forming their savings preferences.
Replacement rates are relatively higher for lower-paid workers. See CBO 1987.
See Task Force on Long-Term Care. 1987.

-109-
Part Three
This estimate is bnsed on Hie age distiibiition of spending on tiie t\^'o largest categories of healtli care expenditures,
liospital and pliysician services. Projections made by tlie Healtii Care Financing Administration for 2000. allowing
for changes in the age and sex structure of the population, show the proportions to be similar in 1978 and 2000.
In 1978. the under-65 population accounted for 71 percent of hospital expenditures and 75 percent of physician
services. The proportions are projected to be 68 and 74 percent, respectively, in 2000. "National Health
Care Expenditures, 1986-2000. " Health Care Financing Review , Summer 1987, Table 5.
Office of Tax Analysis estimate.
Provisions of the Consolidated Omnibus Reconciliation Act of 1984 (COBRA) extend to unemployed workers for
18 months the option of continuing their former employer-provided plan at their own expense. These provisions are
discussed below. F.mployer-provided health coverage often extends into retirement, as discussed in Chapter 3.
"National Health Care Expenditures, 1987." Health Care Financing Review . Winter 1988.
The n)ost recent Health Care Financing Administration estimates of health care expenditures and sources of funds
for health care for the nonelderly were based primarily on data from the 1977 National Medical Care Expenditure
Survey (NMCES). More recent data, collected in a 1987 survey of national medical care expenditures, are not yet
available.
Charles Fisher. "Differences by Age Groups in Health Care Spending," Health Care Financing Review . Spring
1980. pp. 65-90.
Personal health care is one of the largest componetils of total national health expenditures (88 percent in 1987).
It includes health care services received directly by individuals. Ihese services include hospital and physicians"
services, dentists' and other professional services, drugs, eyeglasses, and nursing home care. The remaining
12 percent of national health expenditures includes primarily government expenditures on program administration,
public health, and research and construction of medical facilities.
Charles Fisher, "Differences by Age Groups in Health Care Spending," Health Care Financing Review , Spring
1980, p. 74.
Data from the NMCES, which exclude payments for institutionalized persons, showed a similar pattern for 1977.
See U.S. Department of Health and Human Services, Public Health Service, National Center for Health Services
Research and Health Care Technology Assessment, "A Summary of Expenditures and Sources of Payment for Personal
Health Services from the National Medical Care Expenditure Survey," National Health Care Expenditures Study,
Data Preview 24, May 1987. Table 8.
Bureau of Labor Statistics. Employee Benefits in Medium and Large Firms. 1986 . June 1987. Bulletin 2281,
p. 28.11
Bureau of Labor Statistics. Employee Benefits in Medium and Large Firms. 1986 . June 1987. Bulletin 2281.
pp. 28-29.12
Bureau of Labor Statistics. Employee Benefits in Medium and Large Firms. 1986 . June 1987. Bulletin 2281,
p. 28.13
Bureau of Labor Statistics. Employee Benefits in Medium and Large Firms, 1986 , June 1987, Bulletin 2281,
p. 31.1 4
Deborah Chollet, "Uninsured in the United States: The Nonelderly Population Without Health Insurance,"
Population Survey which collected information on health insurance coverage in 1985.
Deborah Chollet. "Uninsured in the United States: The Nonel
Employee Benefit Research Institute. March 1987. p. 15. Tabulations are based on the March 1986 Current
Dverage in 1985.
lelderly Population Without Health Insurance,"
Employee Benefit Research Institute. March 1987. p. 37.
Deborah Chollet, "Uninsured in the United States: The Nonelderly Population Without Health Insurance."
Employee Benefit Research Institute. March 1987. p. 36.17
Small Business Administration. The State of Small Business. 1987. pp. 162-166.
Deborah Chollet, "Uninsured in the United States: Ihe Nonelderly Population Without Health Insurance."
Employee Benefit Research Institute. March 1987. p. 27.
Wesley Mellow. "Employer Size and Wages." Review of Economics and Statistics . Vol. 63, 1982. and "Employer

-no-
Size, Unionism, and Wages," in New Approaches to Labor Unions, Research in Labor Economics . Supplement 1982. ed.
R.G. Ehrenberg. Greenwich, Conn.: JAI Press. Waiter Oi, "Fixed Employment Costs of Specialized Labor," in
The Measurement of Labor Cost . 1983, ed. Jack E. Triplett, Studies in Income and Wealth, Vol. 48. Chicago. 111.:
University of Chicago Press for the NBER. Richard Freeman and James Medoff, What Do Unions Do? 1984.
New York. N.Y.: Basic Books.
Although most studies show that unionized workers have higher wages and higher benefit levels, it is not clear
that union members, all else equal, have higher benefits. See. for example. Gregory M. Duncan and Frank P. Stafford.
"Do Union Members Receive Compensating Wage Differentials?" American Economic Review . Vol. 70, 1980, for a
discussion of whether there actually is a union wage premium once all factors are taken into account.
Appendix B describes the COBRA rules.
Deborah Chollet, "Uninsured in the United States: The Nonelderly Population Without Health Insurance,"
Employee Benefit Research Institute, March 1987. p. 19.
Deborah Chollet. "Uninsured in the United Slates: The Nonelderly Population Without Health Insurance,"
Employee Benefit Research Institute, March 1987, p. 20.
Small Business Administration, The State of Small Business, 1987. p. 151.
The coinsurance rate is the percentage of each dollar spent on covered health services that is paid for by the
consumer.
^*See Newhouse and Phelps (1976). Newhouse. et al. (1980). Newhouse. et al. (1981). Scitovsky and McCall
(1977), Wells, et aj. (1981) and Manning. Newhouse. et al. (1987).
See Manning. Newhouse, et aj. (1987).
Adamache and Sloan (1985) make this point.2 9
See, e.g., Newhouse (1981).3
See Goddeeris and Weisbrod (1985) and Manning. Newhouse £t aJ, (1987).
The proposal to cap the employee exclusion oiiginaled with Enthoven (1979).

BIBLIOGRAPHY
INCOME/WEALTH OF THE ELDERLY:
1988 Annual Report of the Board of Trustees of the Federal Old-Age and Survivors Insurance and Disability Insurance
Trust Funds, lable I I . p. 37.
Avery, R.B., G.E. Elliehausen, and A.B. Kennickell. "Measuring Wealth With Survey Data: An Evaluation of the 1983
Survey of Consumer Finances." Paper presented at the 20lh Congress of the lARIW. Rocca di Papa, Italy. 1987.
Chollel, D.J. and R.B. Friedland. "Income as a Proxy for the Economic Status of the Elderly." Paper presented to
the Society of Government Economists, the American Economic Association. Chicago. December 1987.
Danzinger, S., J. van der Gaag, E. Smolensky, and M.K. Taussig. "Income Transfers and the Economic Status
of the Elderly." In Economic Transfers in the United Slates, (edited by M. Moon.) Chicago: University of Chicago
Press. 1984.
Fuchs. V.R., How We Live. Cambridge, Mass.; Harvard University Press, 1983.
Holden, K.C. "Living Arrangements, Income, and Poverty of Older Women in the U.S., 1950-1980." IRP Discussion
Papers #804-86. University of Wisconsin: Madison. 1986.
. R.V. Rurkhauser, and DA. Myers. "Pensioners' Annuity Choice: Is the Well-Being of Their Widows
Considered?" IRP Discussion Papers #802-86. University of Wisconsin: Madison. 1986.
.Tianakoplos, N.A., P.L. Mcnchik. and P.O. Iivine. "Using Panel Data to Assess the Bias in Cross-Sectional
Inferences of Life-Cycle Changes in the Le\el and Composition of Household Wealth." Paper presented to the
Conference on the Measurement of Saving. Investment, and Wealth. Michigan State University. 1987.
Manton. G., "Changing Concejits of Morbidity and Mortality in the Elderly Population," Milbank Memorial Fund
Quarterly. Vol. 60 (Spring 1982).
Poterba, .I.M., and L.H. Summers, "Implications of Declining Old-Age Mortality," in G. Burtless, ed.. Work,
Health, and Income Among the Elderly. Washington, D.C: The Brookings Institution, 1987.
Radner, D.B. "Money Incomes of Aged and Nonaged Family Units, 1967-84." In Social Security Dulletin.
50(8), 9-28. 1987.
Ross, C S. Danzinger, and E. Smolensky. "Social Security, Work Effort, and Poverty Among Elderly Men,1939-1979." IRP Discussion Paper #785-85. University of Wisconsin: Madison. 1985.
Smeeding, T. "Full Income Estimates of the Relative Well-Being of the Elderly and the Nonelderly." IRP Discussion
Papers #779-85. University of Wisconsin: Madison. 1985.
U.S. Congress. CBO, "Tax Policy for Pensions and Other Retirement Saving," 1987.
. Congressional Research Service. Retirement Income for an Aging Population. Report prepared for the
Committee on Ways and Means. 1 00th Cong.. 1st sess., 1987. WMCP: 100-22.
.Senate. Committee on Labor and Human Relations. Subcommittee on Aging. Hearings on Older Americans
Act of 1987. lOOthCong.. 1st sess.. 1987. S. HRG. 100-196.
U.S. Department of Commerce. Bureau of the Census. Current Population Reports. "Pensions: Worker Coverage
and Retirement Income. 1984." Washington. D.C: U.S. G. P.O. 1987. Series P-70. No. 12.
."Decennial Census of the Population."
."Projections of the Population of the United States by Age, Sex, and Race: 1983 to 2080." Current
Population Reports, Series P-25, No. 952.
.Current Population Reports. Series P-60. Numbers 95 and 160.
.Current Population Reports. Technical Papers Nos. 50-52 and 55-58.
.Statistical Abstract of the United Stales. 1988.
U.S. Department of Health and Human Services, National Center for Health Statistics, Vital Statistics of the
United Stales. 1985, Vol. 11.
. Office of Research and Statistics. Income of the Population 55 and Over (1976-1984).
.Demographic and Economic Characteristics of the Aged: 1968 Social Security Survey.
-Ill-

-112-
U.S. CiAO. 'Tension PInns: Many Workers Don't Know When They Can Retire." Report to U.S. Congress.
House. Select Committee on Aging, House of Representatives. 1987. GAO/HRD-87-94BR.."Social Security: More Must Be Done to Credit Earnings to Individual's Accounts." Report to U.S.
Congressional Committees. 1987. GAO/HRD-87-52.U.S. Department of Labor, Employer-Sponsored Retiree Health Insurance, 1986.
.BLS, 1987 Employee Benefits in Medium aiid Large Finns J 986.
Venti. S.F.. and DA. Wise, "IRAs and Savings." NBER Working Paper 1879. April 1986.
"Who Can Afford a Nursing Home?" Consumer Reports. May 1988, pp. 300-31 1.
Wise. D. "The Economics of Aging." In NBER Reporter. Summer 1987. p. 1-4.
Wolff, E. "Social Security, Pensions, and the Wealth Holdings of the Poor." IRP Discussion Paper (!'799-85.
University of Wisconsin: Madison. 1985.
Yeas, M.A. and S. Grad. "Income of Retirement-Aged Persons in the United States." In Social Security Bulletin.
50(7), 5-14.
POLICY PROPOSALS:
Ball, R.M. "The Optimum Role for the Federal Government in Financing Catastrophic and Long-Term Care."
Paper presented to the policy forum "Financing Catastrophic and Long-Term Care: Beyond Recent Medicare
Reforms." Washington. DC: EBRI. 1987.
Bourque, D.P. "Personal Perspective: Look to the Private Sector for Innovative Long-Term Care Coverage." In
Business and Health. June 1987. 4(8), 64.
Davis, K. and D. Rowland. Medicare Policy: New Directions for Health and Long-Term Care. Baltimore:
Johns Hopkins University Press, 1986.
Mathematica Policy Research, Inc., The Evaluation of the National Long-Term Care Demonstration: Final Report.
Executive Summary. Princeton: Mathematica Policy Research Inc., May 1986.
National Conference of Slate Legislatures. "What Legislators Need to Know About Long-Term Care Insurance."
Washington, D.C., May 1987.
Shepard, D.S. and Zeckhauser, R.J. "The Choice of Health Policies with Heterogeneous Populations," In Economic
Aspects of Health, (edited by V. Fuchs). Chicago: Univeisily of Chicago Press. 1982,
U.S. Congress. Congressional Budget Office. "Fedeial Insurance of Private Pension Benefits." Washington, D.C:GPO. 1987.
.House. Committee on Post Office and Civil Service. Subcommittee on Coinpensation and Employee
Benefits. Hearings on Mcdi( are Catastrophic Trotection Act. 1 00th Cong. Istsess., 1987. Serial 100-27.
.House. Committee on Ways and Means. A Report on Medicare Catastrophic Protection Act of 1987. lOOlh
Cong.. Istsess., 1987. Rept. 100-105.
.Senate. Committee on Labor and Human Resources. Subcommittee on Aging. Hearings on the Older Americans
Act of 1987. lOOlh Cong. Istsess., 1987. S. HRG. 100-196.
.Senate. Committee on Small Business. Hearings to E.xamine the Cost and Availability of Health Care
Benepts for Small Businesses and Proposals for Federally Mandated Health Benepts. 100th Cong. 1st sess., 1987.
S. HRG. 100-144.
U.S. Department of Health and Human Services. HHS News and E.xeculive Summaiy on the Congressional Task
Force on Long-Term Health Care Policies. September 1987.
.Office of Health Policy. Insuring Catastrophic Illness for the General Population. 1986.
.Report to the Congress and the Secreiaty by the Task Force on Long-Term Health Care Policies.
September 1987.
.Technical Work Group on Private Financing of Long-Term Care for the Elderly, Report to the
Secretaiy on Private Financing of Long-Term Care for the Elderly. Novembei' 1986.
U.S. G.A.O. "Retirement Forecasting: Evaluation of Models Shows Need for Information on Forecast Accuracy."
Report to the U.S. Congress. Senate. Committee on Finance. Subcommittee on Social Security and IncomeMaintenance Programs. Vol. 1.1986. GAO/PEMD-87-6A.
U.S. G.A.O. "Retirement Forecasting: Technical Descriptions of Cost. Decision and Income Models." Report to
the U.S. Congress. Senate. Committee on Finance. Subcommittee on Social Security and Income Maintenance
Programs. Vol. 2. 1986. GAO/PEMD-87-6B.
-113-
Weiss, J.H. and L. Brodsky. "An Essay on the National Financing of Health Care." In The Journal of HumanResources. Spring 1972. 7(2). 139-l.Sl.
Wolfe, B. "Health Care Expenditures for the Elderly: Are Prospective Payment Systems and Community Care
the Paths to Cost Reduction?" IRP Discussion Papers #788-85. University of Wisconsin: Madison. 1985.
THEORY:
Blumenthal, D., M. Schlesinger, P.B. Drumheller and The Harvard Medicare Project. "The Future of Medicare."
In The New England Journal of Medicine. March 1986. 314(1 1), 722-728.
Doty, P., K. Liu, and J. Wiener. "An Overview of Long-Term Care." In Health Care Financing Review. Spring
1985. 6(3), 69-78.
Fries, J.F. "Aging, Natural Death, and the Compression of Morbidity." In The New England Journal of Medicine.
Tuly 1980. 303(3), 130-135.
Gabel. J.R.. C. Toth and K. Williams. "A Snapshot of the Private Market in Long-Term Care." In Business and
Health. May 1987. p. 34-39.
Health Insurance Association of America. "The Consumers Guide to Long-Term Care Insurance." Washington,
D.C.
."Private Insurance for Financing Long-Term Care." Statement before the Health Task Force. Budget
Committee. U.S. House of Representatives. October 1987.
Ignagni, K. "AFL-CIO Statement on Health Care Coverage." Paper presented to the policy forum "Financing
Catastrophic and Long-Term Care: Beyond Recent Medicare Reforms." Washington, D.C: EBRI. 1987.
Lane. L.F. "Assessing the Need for Catastrophic and Long-Term Health Care Coverage: Private Insurance
Policies." Papei presented to the policy forum "Financing Catastrophic and Long-Term Care: Beyond Recent
Medicare Reforms." Washington. D.C: EBRI. 1987.
Lautzenheiser. B..I. "Long-Term Care is Not Out of Reach." In Best's Review. January 1987. 87(9), p. 42.
Lemberger, M.E. "Getting Better at Long-Term Care." In Best's Review. February 1987. 87(10). p. 84.
Libassi, F.P. "Whose Responsibility Is It?" Paper presented to the policy forum "Financing Catastrophic and
Long-Term Care: Beyond Recent Medicare Reforms." Washington, D.C: EBRI. 1987.
McArdle, F.B. The Changing Health Care Market. Washington, D.C: EBRI. 1987.
McCormack, .T.J. "Long-Term Care Feasibility of Employer Involvement." Paper presented to the policy forum
"Financing Catastrophic and Long-Term Care: Beyond Recent Medicare Reforms." Washington, D.C: EBRI,
1987.
Myder. J. A. "Statement by American Health Care Association on Catastrophic Coverage for Long-Term Care."
Paper presented to the policy forum "Financing Catastrophic and Long-Term Care: Beyond Recent Medicare
Reforms." Washington. D.C: EBRI. 1987.
Myers. D.A.. R.V. Burkhauser. and K.C Holden. "The Transition From Wife to Widow: The Importance of
Survivor Benefits to the Weil-Being of Widows." IRP Discussion Paper #806-86. University of Wisconsin:
Madison 1986.
Newhouse. J. P. ct al
"Some Interim Results from a Controlled Trial of Cost Sharing in Health Insurance." In The New England
Journal of Medicine. December 1981 . 305(25), 1501-1507.
O'Brien. T. "Long-Term Care Insurance: An Employer's Perspective." Paper presented to the policy forum
"Financing Catastrophic and Long-Term Care: Beyond Recent Medicare Reforms." Washington, D.C: EBRI.
1987.
Pauly. M.V. "Medicare and the Health Care Costs of Retirees: Problems in Choosing the Future." Unpublished
paper. 1987.
Pauly. M.V. "Taxation. Health Insurance, and Market Failure in the Medical Economy." In Journal ofEconomic Literature.
24(2). 629-675. June 1986.
Percy, D.E. "Another Perspective." Paper presented at the Conference on Long-Term Care of the Elderly: Issues
and Options. University of Wisconsin: Madison. May 1987.
Peres. J.R. "Elderly Care: A Case of Catastrophic Confusion." Paper presented to the policy forum "Financing

-114-
Catastrophic and Long-Term Care: Beyond Recent Medicare Reforms." Washington, D.C.: EBRI. 1987.
Rappaport, A.M. and R.W. Kalman. "Vesting Issues in Retiree Medical Plans." In Business and Health. June
1987. 4(8), 24-28.
Roiher. J. "Catastrophic and Long-Term Care Costs: A Closer Look." Paper presented to the policy forum
"Financing Catastrophic and Long-Term Care: Beyond Recent Medicare Reforms." Washington, D.C.: EBRI.
1987.
Somers, A.R. "Long-Term Care for the Elderly and Disabled. A New Health Priority." In The New England
Journal <7f Medicine. July 1982. 307(4), 221-226.
laube, C.A. "Long-lerm Care for Mental Illness Among the Elderly." Paper presented at the Conference on
Long-Term Care of the Elderly: Issues and Options. University of Wisconsin: Madison. May 1987.
U.S. Congress. House. Committee on Small Business. Hearings on The Health Insurance Problem. lOOth Cong.
1st sess., 1987. Serial 100-7.
.House. Committee on Ways and Means. Subcommittee on Health. Proceedings of the Conference on the Future
of Medicare. 98lh Cong. 2nd sess.. 1984. WMCP: 98-23.
. House. Select Committee on Aging. A Report presented by the Chairman on Long-Term Care and Personal
Impoverishment: Seven in Ten Elderly Living Alone are at Risk. 100th Cong., 1st sess., 1987. Comm. Pub.
No. 100-631.
.Office of Technology Assessment. Life-Sustaining Technologies and the Elderly. Washington, D.C.: GPO.
1987. OTA-BA-306.
.Senate. Committee on Finance. Subcommittee on Health. Hearings on Medicare Hospital Paymeiu Rates.
lOOlh Cong. Islsess., 1987. S. HRG. 100-263.
.Senate. Committee on Labor and Human Resources. Hearings on Essential Health Care. 100th Cong.
1st .sess.. 1987. S. HRG. 100-267.
. Senate. Committee on Labor and Human Resources. Hearings on National Health Goals. 100th Cong.
1st sess.. 1987. S. HRG. 100-263.
U.S. Department of Commerce. Bureau of the Census. Current Population Reports. Household Economic Studies,
Series P-70, No. ?,. Disability. Functional Limitation, and Health Insurance Coverage: 1984/85.
Washington, D.C.: GPO. 1986.
.Population Estimates and Projections. Series P-25. No. 922. Projections of the Population of the
United Slates: 1982 to 2050 (Advance Report). Washington. D.C.: GPO, 1986.
U.S. Department of Health and Human Services. "National Health Care Expenditures. 1986-2000." Health Care
Financing Review. 8(4). Summer 1987. Washington. D.C.
.Social Security Bulletin. Annual Statistical Supplement. 1986. Table 4.
U.S. GAO. Long-Term Care Insurance. Coverage Varies Widely in a Developing Market. A Report to the
U.S. Congress. House. Select Committee on Aging. Subcommittee on Health and Long-Term Care.
Washington. DC: GAO. 1987. HRG. 87-80.
University of Wisconsin. Department of Economics. Center for Health Economics and Law. "Selected Statistical
Information." Appendices for the Conference on Long-Term Care of the Elderly: Issues and Options.
University of Wisconsin: Madison. May 1987.
The Washington Post. Growing Old in America. Health. Science and Society Weekly Journal of Medicine.
April 14. 1987.
Wasilewski. C. "Mature Customers. Immature Products." In Best's Review. April 1987. p. 39-46.
Weissert. W.G. "Estimating the Long-Term Care Population: Prevalence Rates and Selected Characteristics." In
Health Care Financing Review. Summer 1985. 6(4). 83-91.
Wolfe. B. "Health Status and Medical Expenditures: Is there a Link?" IRP Discussion Papers /'794-85.
University of Wisconsin: Madison. 1985.
Wolff. N.. B.A. Weisbrod. and S. Stearns. "Long-Term Caie of the Elderly: Issues and Options." Paper presented
at the Conference on Long-lerm Care of the Elderly: Issues and Options. University ol Wisconsin: Madison.
May. 1987.

115-
WORKLIFE ESTIMATES:
National Commission for Employment Policy. Older Worker Employmeni Comes of Age: Practice cvtd Polenlial.
Washington. D.C: GFO. 1986.
.Older yVorkers: Prospects. Problems and Policies. 9th Annual Report. Washington, D.C: NCEP. 1985.
President's Commission on Pension Policy. "Varieties of Retirement Ages." Washington, D.C: GPO. 1980.
Rix, S.E. and P. Fisher. Retirement-Age Policy: An International Perspective. New York: Pergamon Press Inc.,
1982.
U.S. Congress. Joint Economic Committee. Subcommittee on Economic Resources, Competitiveness, and Security
Economics. Demographic Changes in the United Stales: The Economic arid Social Consequences into the 21st Century.
99th Cong., 2d sess., 1986. S. HRG. 99-1088.
U.S. Department of Health and Human Services, Social Security Administration. Social Security Bulletin, Aitnual
Statistical Supplement. 1986.
U.S. Department of Labor, Bureau of Labor Statistics. Worklife Estimates: Effects of Race and Education.
Bulletin 2254, February 1986.
RETIREMENT INCOME:
Bristol, R.B. "Individual Retirement Accovmts: A Good Investment?" Tax Notes. March I, 1982.
Burtless, G.. ed. Work. Health, and Income Among the Elderly. Washington, D.C: The Brookings Institution.
1987.
Cagan. P. Saving for Retirement: Report on a Mini-Conference on Saving Held for the 1981 White House Conference
on Aging. New York: Columbia University Graduate School of Business. 1981
.
Congressional Quarterly Inc., Social Security and Retirement: Private Goals. Public Policy. Washington, D.C:Congressional Quarterly Inc.. 1983.
Danzinger, S., J. van der (laag, E. Smolensky, and M.K. Taussig. "Income Transfers and the Economic Status of
the Elderly." In Moon, M. (ed.) Economic Traiisfers in the United Slates, Chicago: The University of
Chicago Press. 1984.
Government Reseaich Corpoiation. "Pensions and Taxes, Who Wins, Who Loses: Private Sector Retirement and U.S.
Tax Policy." (lovernment Research Corporation. 1984.
Hubbard, R.G. "Pension Wealth and Individual Saving, Some New Evidence." Journal ofMoney, Credit, and Banking.
18(2), May 1986.
Kennell, D. and J. Valiante. "Pension Coverage and Expected Retirement Benefits." In Proceedings of Seventy-Fifth
Animal Conference. National Tax Association. 1982. pp. 264-71.
Kotlikoff, L..I. and D.E. Smith. Pensions in the American Economy. Chicago: University of Chicago Press, 1983.
Long. .I.E. and F.A. Scott. "The Impact of the 1981 Tax Act on Fringe Benefits and Federal Tax Revenues."
In National Tax Journal. 37(2). pp. 185-94.
Moffitt, R. "Trends in Social Security Wealth by Cohort." In Moon, M. (ed.) Economic Transfers in the United States,
Chicago: The University of Chicago Press. 1984.
Presidents Commission on Pension Policy. "Pension Coverage in the United States."
. Coming of Age: Toward a National Retirement Income Policy. 1981.
Radner. D.B. "Money Incomes of Aged and Nonaged Family Units, 1967-84." In Social Security Bulletin. August
1987. 50(8). pp. 9-28.
Santos, R.L. and CG. Lazaro. "An Examination of Imputation for Asset Items in the New Beneficiary Survey."
Philadelphia: lemple University, Institute for Survey Research.
U.S. Bureau of the Census. Current Population Reports. "Pensions: Worker Coverage and Retirement Income, 1984."
Washington. D.C: U.S. G. P.O. 1987. Series P-70. No. 12.
U.S. Congress. Congressional Budget Office. Tax Policy for Pensions and Other Retirement Saving. April 1987.
U.S. Congress. Congressional Research Service. "Private Pension Plans: Which Way are they Headed?" A Paper
for the Chairman of the Select Committee on Aging, U.S. Congress. House. 99th Cong., 1st sess. 1985.
Comm. Pub. #99-507.

-116-
. Rclircmcnt Income for on 'if^ing Pnpiilalion. lOOth Cong. . Istsess., 1987.
.SuhcomiiiKfee on Social Security and the Siibcoinmiltee on Oversight. Hearings on Retirement Income Security
in the United Stales. 99th Cong. 1st sess.. 1985. Serial 99-50.
U.S. GAO. "Pension Flans: Many Workers Don't Know When They Can Retire." Report to U.S. Congress. House.
Select Committee on Aging. House of Representatives. 1987. GAO/HRD-87-94BR.I'.S. Treasury. Division of Tax Research. "Ihe Income Tax Treatment of Pensions and Annuities." Washington,
DC: 1947.
Warlick. .I.I.. and R.V. Burkhauser. "Raising the Normal Retirement Age Under Social Security: A Life-Cycle
Analysis." Moon. M. (ed.) Economic Transfers in the United States, Chicago: The University of Chicago Press,
1984,
INCOME:
Belson. D. and R. Haveman. "The Role of Income Transfers in Reducing Inequality between and within Regions."
In Moon. M. (ed.) Economic Transfers in the United States. Chicago: The University of Chicago Press, 1984.
Morgan, .I.N. "The Role of Time in the Measurement of Transfers and Well-Being." In Moon, M. (ed.) Economic
Transfers in ilie United Stales. Chicago: The I'niversity of Chicago Press, 1984.
U.S. Department of Commerce, Bureau of the Census. Current Population Reports. Series P-60, No. 157,
Money Income and Poverty Status of Families and Persons in the United States: 1986. Washington, D.C.:
GPO. 1987.
HEALTH INSURANCE:
Adamache. Killard W. and Frank A. Sloan, "Fringe Benefits: To Tax Or Not To Tax?" National Tax Journal, 38
(March 1985). pp. 47-64.
Bergstiom, T.C. "Medical Care, Medical Insurance, and Survival Probability: The True Cost of Living." In
Economic Aspects of Health, edited by Victor Fuchs. Chicago: University of Chicago Press, 1982.
Chollel, D. "Assuring Retiree Rights to Health Plan Benefits: The Potential Impact of Vesting Rules." Paper
presented for the Secretary's National Conference on Retiree Health Care Benefits: A Challenge for the Future.
U.S.D.H.H.S. 1987.
. Employer-Provided Health ncncftts: Coveraf>e. Provisions, and Policv Issues. Washington. D.C.: EBRI. 1984.
."Uninsured in the United States: The Nonelderly Population Without Health Insurance." Washington, D.C.:
EBRI. 1987.
,and R.B. Friedland. "Employer Financing of Long-Term Care." In Advances in Health Economics and Health
Seirices Research. (Edited by R.M. Scheffier and L.F. Rossiter.) .lAI Press. 1987.
Clotfelter, (Charles T.. "Equity. Efficiency, and the Tax Treatment of In-Kind Compensation." National Ta\ Journal,
32 (March 1979). pp. 51-60.
Doty. P.. K. Liu. and .1. Wiener. "An Overview of Long-Term Care." In Health Care Financing Review. Spring 1985.
6(3). pp. 69-78.
Duncan. Gregory M. and Frank P. Stafford. "Do Union Members Receive Compensating Wage Differentials?" American
Economic Review. Vol. 70. 1980.
Dunlop. J. T. "The Changing Health Care System." In Proceedings of the Industrial Relations Research Association.
1987. pp. 524-27.
Enllio\en. A. "Recommended Low -Cost Changes to Existing Law to Enhance Competition Among Health Care Financing
and Delivery Plans." Unpublished note, February 1979.
Executive Office of Ihe President, Office of Management and Budget. 1988. Special Analyses. Budget of the
United Slates Government. 1989.
Feldstein, Martin. "On The Theory of Tax Reform," Journal of Public Economics. 6, (July/August 1976).
pp. 77-104.
Freeman, Richard and James Medoff. What Do Unions Do? 1984. New York, N.Y.: Basic Books.

-117-
Feldstcin. Martin and Bernard Friedman. "Tax Subsidies. The Rational Demand for Insurance and the HeahhCare Crisis." Journal of I'liblic Ecotwmics. 7. (April 1977). pp. 155-78.
Fisher. Charles. "Uifferences by Age Groups in Health Care Spending," Health Care Financing Review, Spring 1980,
pp. 65-90.
Goddeeris. .lohn and Burton A. Weisbrod. "What We Don't Know About Why Health Expenditures Have Soared:
Interaction of Insurance and Technology." Mount Sinai Journal of Medicine. November 1985, 52. pp. 685-91.
Paper #214, December 1984.
Greenspan. Nancy and Ronald Vogel, "Taxation and Its Effect Upon Public and Private Health Insurance and
Medical Demand." Health Care Financing Review. Spring 1980. pp. 39-45.
Grimaldi. P.L. Medicaid Reimbursement of Nursing Hoitie Care. Washington, D.C.: American Enterprise Institute
for Public Policy Research. 1982.
Helms. R.B. "Contemporary Health Policy. Dealing with the Cost of Care." In Policy Studies: Review Annual,
Vol. 3. (Edited by R. Javeman and B.B. Zellher), Beverly Hills: Sage Publishing, 1979.
Hill-Chinn, L. "Community-Based Health Care Systems." In Proceedings of the Industrial Relations Research
Association. 1987. pp. 534-38.
Kosters. Marvin H. and Eugene Steuerle. "The Effect of Fringe Benefit Tax Policies on Labor and ConsumerMarkets." National Tax Association-Tax Institute of America Troceedings of the Seventy-Fourth Annual
Conference. \9^\. pp. B6-92.
Levy. M.D. The Tax Treatment of Social Security: Should the Exclusion of Benefits be Eliminated?
Washington. D.C.: American Enterprise Institute for Public Policy Research. 1980.
Lewin, M.E. (ed.) The Health Policy Agenda: Some Critical Questions. Washington, D.C.: American Enterprise
Institute for Public Policy Research.
Manning. Willard G.. .Joseph Newhouse. el al.. "Health Insurance and the Demand for Medical Care: Evidence
from a Randomised Experiment." American Economic Review. 77, (June 1987), pp. 251-277.
Mellow, Wesley. "Employer Size and Wages." Review of Economics and Statistics. Vol. 63. 1982.
."Employer Sise. Unionism, and Wages," in New Approaches to Labor Unions. Research in Labor Economics,
Supplement 1982, ed. R.G. Ehrenberg. Greenwich, Conn.: JAI Press.
Meyer. .LA. (ed.) Market Reforms in Health Care: Current Issues. New Directions, Strategic Decisions.
Washington. D.C.: American Enterjirise Institute for Public Policy Research.
.W.R. .Fohnson. and S. Sullivan. Passing the Health Care Buck: Who Pays the Hidden Cost?
Washington. D.C.: Ameiican Enterprise Institute for Public Policy Research. 1983.
. (ed.) Incentives vs. Controls in Health Policy: Bioadening the Debate. Washington. D.C.: American
Enterprise Institute for Public Policy Research. 1985.
Mitchell. B.M.. and C.E. Phelps. "National Health Insurance: Some Costs and Effects of Mandated Employee
Coverage." Journal of Political Economy. 1976. 84(3). pp. 533-571.
Newhouse. Joseph P. " I'he Erosion of the Medical Marketplace." in Richard Scheffler. Editor. Advances in Health
Economics and Health Seirices Research //(Greenwich. CT: JAI Press, 1981), pp. 1-34.
Newhouse, Joseph P. and Charles E. Phelps. "New Estimates of Price and Income Elasticities of Medical Care
Services," in Richard N. Rosett, Editor, I he Role of Health Insurance in the Health Services Sector
(New York: NBER, 1976), pp. 261-312.
Newhouse. Joseph P., et al.. "Some Interim Results From a Controlled Trial of Cost Sharing in Health Insurance,"
New England Journal of Mcdiciiw, 305, December 17. 1981, pp. 1501-28.
Oi, Walter "Fixed Employment Costs of Specialized Labor," in The Management of Labor Cost, 1983, ed. Jack E.
Triplett. Studies in Income and Wealth. Vol. 48. Chicago. III.: University of Chicago Press for the NBER.Olson, M. A New Approach to the Economics of Health Care. Washington, D.C.: American Enterprise Institute for
Public Policy Research. 1981.
Pauly, M.V. "Taxation, Health Insurance, and Market Failure in the Medical Econotiiy." Journal of Economic
Literature, 24, June 1986. pp. 629-675.
Phelps, C.E. "National Health Insurance by Regulation: Mandated Employee Benefits." In National Health
Insurance: What Now, What Later, What Never? (Edited by Mark V. Pauly). Washington: American Enterprise
Institute, 1980.
-118-
Presidenls Commission for llie Study of Ethical Problems in Medicine and Biomedical and Behavioral Research.
Securiug Access to Health Care. Volume One: Report. Washington. D.C.: OPO. 1983.
Scitovsky, Anne A. and Nelda McCall, "Coinsurance and the Demand for Physician Services: Four Years Later,"
Social Security Bulletin, 40. May 1977. pp. 19-27.
Seidman, L.S. "A Cash-Fquivalent Option Under 'Major-Risk" National Health Insurance." Policy Analysis, Winter
1978, 4(1). pp. 123-127.
."A Strategy for National Health Insurance." In Policy Studies Review Annual, Vol 3. (Edited by Robert
Haveman, and B.B. Zelher). Beverly Hills: Sage Publishing, 1979.
Steuerle, C. Eugene, "Some Implications of Proposals to Change the Tax Treatment of Medical Expenditures,"
National Tax Association-Tax Institute of America Proceedings of the Seventy-Third Annual Conference, 1980,
pp. 124-29.
Steuerle, C. Eugene and Ronald Hoffman. "Tax Expenditures for Health Care," National Tax Journal XXXII(Itme 1979), pp. 101-115.
Thibault, Ci. "A Perspective on the Health Care System." In Proceedings of the Industrial Relations Research
Association. 1987. pp. 527-33.
U.S. Congress. House. Committee on Small Business. The Health Insurance Problem: Alternative Strategies to
E.xpand Coverage Among Small liusinesses. lOOth Cong. 1st sess., 1987.
.House. Committee on Ways and Means. Subcommittee on Social Security and the Subcommittee on Select
Revenue Measures. Hearings on the Distribution and Economics of Employer-Provided Fringe lienefits. 98th CoPig.
2d sess.. 1984. Serial 98-98.
.Senate. Committee on Labor and Human Resources. Hearings on Essential Health Care. lOOth Cong.
1st sess., 1987. S. HRG. 100-267.
.Senate. Committee on Labor and Human Resources. Hearings on Natioital Health Goals. 100th Cong,
1st sess.. 1987. S. HRG. 100-265.
.Senate. Committee on Finance. Subcommittee on Health. Hearings on Medicare and Medicaid. 100th Cong,.
1st sess., 1987.
.Senate. Committee on Small Business. Hearings To Examine the Cost and Availability of Health Care
Benefits for Small Businesses and Proposals for Federally Mandated Health Benefits. lOOth Cong. 1st sess..
1987. S. HRG. 100-144.
U.S. Congress, Congressional Research Service, Health Insurance and the Uninsured: Background Data and Analysis,
June 1988.
U.S. Department of Health and Human Services, Public Health Service, National Center for Health Services Research
and Health Care Technology Assessment. NMCES Health Insurance/Employer Survey. "Private Insurance in the
United States," National Health Care E.xpenditures Study, Data Preview 23, September 1986.
."A Summary of Expenditures and Sources of Payment for Personal Health Services from the National
Medical Care Expenditure Survey," National Health Care E.\pcnditures Study, Data Preview 24, May 1987.
.Social Security Administration. Social Security Bulletin Annual Supplement 1987.
U.S. Department of Labor. Employee Benefits in Medium and Large Firms. 1985. Washington, D.C.: GPO. 1986.
Bulletin 2262.
.1986. June 1987, Bulletin 2281.
U.S. Small Business Administration. The State of Small Busiiiess, 1987.
U.S. Department of Treasury, Report to the Congress on Certain Employee Benefits Not Subject to Federal Income Tax,
June 1988.
Wells, Kenneth, Willard G. Manning, Naihua Duan, etal., Cost-Sharing and the Demandfor Ambulaioiy Mental Health
Service, (Santa Monica. CA: The Rand Corporation, 1982).
Wolfe, B.L. "National Health Insurance: Another Alternative." Policy Analysis, Fall 1980, 6(4), pp. 495-499.

-119-
CATASTROPIIIC HEALTH:
Chollet. D.I. and C.L. Betley. "Identifying Real Costs of Major Illnesses." In Business and Health 4(11).
September 1987.
Dawson. D., G. Hendershot. and .1. Fulton. "Aging in the Eighties: Functional Limitations of Individuals Age 65
Years and Over." \n Advance Data. National Center for Health Statistics. June 1987. p. 133.
Friedland. R.B. "Assessing the Need for Catastrophic Health Care Cost Insurance." Paper presented at a policy
forum: Financing Catastrophic and Long-Term Care: Beyond Recent Medicare Reforms. Employee Benefit Research
Institute, 1987.
Friedman, B., C. Ross, and G. Misek. "On the Suprisingly Low Cost of State Catastrophic Health Insurance
Programs." In the Journal of Risk and Insurance. March 1984, 51(1), pp. 31-48.
."Rationales for Government Initiative in Catastrophic Health Insurance." In National Health Insurance:
What Now, What Later, What Never? (Edited by Mark V. Pauly.) Washington, D.C.: American Enterprise Institute,
1980.
Hutli, S.A. "Medicare Catastrophic Coverage Grabs Headlines, But Other Medicare Proposals Will Hit Employers."
In Employee Renejit Plan Review. April 1987, 41(9).
IgTiagni, K. "AFL-CIO Statement on Health Care Coverage." Paper presented at a policy forum: Financing
Catastrophic and Long-Term Care: Beyond Recent Medicare Reforms. Employee Benefit Research Institute,
1987.
-lacobs. B., and W.G. Weissert. Helping Protect the Elderly and the Public Against the Catastrophic Costs of
Long-Term Care.
Kovar. M.G.. and A.Z. LaCroix. "Aging in the Eighties, Ability to Perform Work-Related Activities: Data From the
Sujiplement on Aging to the National Health Interview Survey: United States, 1984." In Advance Data. National
Center for Health Statistics. May 1987. p. 136.
Lane, L.F. "Assessing the Need for Catastrophic and Long-Term Health Care Coverage: Private Insurance Policies."
Paper presented at a policy forum: Financing Catastrophic and Long-Term Care: Beyond Recent Medicare Reforms.
Employee Benefit Research Institute, 1987.
McCoimack, .T..F. "Long-Term Care Feasibility of Employer Involvement." Paper presented at a policy forum:
Financing Catastrophic and Long-Term Care: Beyond Recent Medicare Reforms. Employee Benefit Research
Institute. 1987.
Myder, J. A. "Statement by American Health Care Association on Catastrophic Coverage for Long-Term Care." Paper
presented at a policy forum: Financing Catastrophic and Long-Term Care: Beyond Recent Medicare Reforms,
Employee Benefit Research Institute, 1987.
O'Brien, T. "Long-Term Care Insurance. An Employers Perspective." Paper presented at a policy forum: Financing
Catastrophic and Long-Term Care: Beyond Recent Medicare Reforms. Employee Benefit Research Institute,
1987.
Peres. J.R. "Elderly Care: A Case of Catastrophic Confusion." Paper presented at a policy forum: Financing
Catastrophic and Long-Term Care: Beyond Recent Medicare Reforms. Employee Benefit Research Institute,
1987.
Rother. .T. "Catastrophic and Long-Term Care Costs: A Closer Look." Paper presented at a policy forum: Financing
Catastrophic and Long-Term Care: Beyond Recent Medicare Reforms. Employee Benefit Research Institute,
1987.
U.S. Congress. Senate. Committee on Labor and Human Resources. Hearings on Catastrophic Health Insurance.
lOOlh Cong. 1st sess., 1987. S. HRG. 100-375.
.House. Committee on Ways and Means. Subcommittee on Health. Hearings on Catastrophic Illness E.\pcnses.
100th Cong. 1st sess., 1987. Serial 100-7.
U.S. Department of Health and Human Services. Office of Health Policy. Insuring Catastrophic Illness for
the General Population.
.Social Security Administration. Rhode Island Catastrophic Health Insurance Plan. Social Security
Bulletin. February 1975, 39(3), pp. 41-43.

-120-
Wyszewianski. L. "Catastrophic Health Expenditures: Toward a Wori<ing Definition." Paper presented at a policy
forum: Financing Catastrophic and Long-Term Care: Beyond Recent Medicare Reforms. Employee Benefit Research
Institute, 1987.
Zeckhauser, R.J. "Coverage for Catastrophic Illness." In Public Policy, Spring 1973, 21(2), pp. 149-172.
Zook. C..F.. F.D. Moore, and R.J. Zeckhauser. "Catastrophic' Health Insurance-A Misguided Prescription?"
In 7/if Public hiicresi. Winter 1981, 62. pp. 66-87.


U S THEASURV LIBHAHV
Department of the Treasury
Washington, D.C. 20220
Official Business
Penalty for Private Use, $300
0038103
SPECIAL FOURTHCLASS MAIL