financing small and - kba.co.ke financing survey.pdf · financing small and ... in the kenyan...
TRANSCRIPT
July 2016
Financing Small and Medium Enterprise:The Reconciliation of Borrower-lender Expectations
About this Report
This Report presents the findings of the third Survey published by the Kenya Bankers Association Centre for Research on Financial Markets and Policy®. The Survey was undertaken in collaboration with Ipsos Limited. The Centre for Research on Financial Markets and Policy® commissioned Ipsos Limited to undertake the field work that underpins the findings and interpretations presented in the Report. We gratefully acknowledge the efforts of the Report’s authors as well as the support of the financial institutions and entreprises as well as all other questionnaire respondents and the team that conducted field work.
The Centre for Research on Financial Markets and Policy® was established by the Kenya Bankers Association in 2012 to offer an array of research, commentary, and dialogue regarding critical policy matters that impact on financial markets in Kenya. The Centre sponsors original research, provides thoughtful commentary, and hosts dialogues and conferences involving scholars and practitioners on key financial market issues. Through these activities, the Centre acts as a platform for intellectual engagement and dialogue between financial market experts, the banking sector and the policy makers in Kenya. It therefore contributes to an informed discussion that influences critical financial market debates and policies.
The entire content of this publication is protected by copyright laws. Reproduction in part or whole requires express written consent from the publisher.
© Kenya Bankers Association, 2016
CENTRE FOR RESEARCH ON
F I N A N C I A L M A R K E T S A N D P O L I C Y ®
Centre for Research on Financial Markets & Policy, KBA 1
Small and Medium Entreprises (SMEs) form an important part of a country’s economy. In Kenya, they are estimated to contribute up to 20% of the GDP and substantially to employment creation. Not withstanding such significant contribution SMEs are faced with myriad challenges. Challenges related to financing their operations have received lots of prominence, although such prominence by no means suggests that they do
not face other challenges.
This study sought to provide further insights on the financing challenges faced by SMEs, linking them with the other non-financing challenges. The one value adding aspect of this study is that it considers such challenges from both the demand dimension as well as the supply dimension. One of the Key findings of the study was that both costs of finance and access to finance are key challenges although the SMEs indicated that the former is more binding than the latter. This is a view that conforms to findings of other studies.
The study also sought to understand whether, the funding constraints vary by different SME groupings based on firmographics. The incidence of financial constraints is similar across SMEs in different sectors, localities in the country and by duration of operation just to mention a few. This suggests that the financial constraints are homogenous across different SMEs hence solutions to mitigate may be done across the board without specific reference to any SME grouping.
On the adoption of sustainability in the operations of SMEs, the study concludes that sustainable finance among SMEs is still a new concept. There is limited awareness on mainstreaming sustainable finance among the operations SMEs. More so, SMEs have limited knowledge on the benefits accruing from adoption of sustainable finance. This therefore calls for sensitization of the SMEs on the need to ebbed sustainability in their business operations.
Abstract
2 Centre for Research on Financial Markets & Policy, KBA
Centre for Research on Financial Markets & Policy, KBA 3
ABSTRACT 1TABLE OF CONTENTS 3LIST OF TABLES & FIguRES 4ABBREVIATIONS AND ACRONYMS 5
Chapter one INTRODuCTION 61.1 Background 61.2 Statement of the research problem 61.3 Study objectives 7 Box: The Kenyan Banking Industry and Micro, Medium 8 and Small Enterprises (MSMEs)
Chapter two RESEARCH METHODOLOgY 112.0 Definition of an SME 11
2.1 Proposed Methodology 92.2 Fieldwork, Quality Control and Data Management 11
Chapter three SuRVEY FINDINgS AND DISCuSSION 153.1 demand-side Analysis 153.2 Supply-side Analysis 25
Chapter four CONCLuSIONS 314.1 Homogeneity of funding constraints 314.2 Sustainable finance and SMEs sustainability 31
REFERENCES 32
Contents
4 Centre for Research on Financial Markets & Policy, KBA
LIST OF FIguRESFigure 1: Main Challenges facing SMEs in Kenya – SummaryFigure 2: Main Challenges facing SMEs in Kenya – DetailedFigure 3: Incidence of funding-related constraintsFigure 4: Source of Start-Up CapitalFigure 5: Most important factor considered when seeking financingFigure 6: Awareness of APRFigure 7: Incidence of funding-related constraintsFigure 8: Awareness of sustainability practices for SMEsFigure 9: Source of sustainability practices for SMEs awarenessFigure 10: Importance levels for adopting sustainability practicesFigure 11: Benefits of adopting sustainability practicesFigure 12: Presence of a documented sustainability planFigure 13: Willingness to come up with a sustainability plan
LIST OF TABLESTable 1: Banks and MFIs KIIs sampleTable 2: SME sample by town and localityTable 3: SME sample by the sector of the economyTable 3: SME sample by the sector of the economyTable 5: Summary of SME challenges by business sizeTable 6: Financing terms and conditionsTable 7: Analysis of APR vs firmographic variablesTable 8: Funding constraint by type of financingTable 9: Funding constraint by provider of financingTable 10: Funding constraint by provider of financingTable 11: Funding constraint by nature of businessTable 12: Funding constraint by sector of the economyTable 13: Funding constraint by locality of the businessTable 14: Funding constraint by the size of the businessTable 15: Funding constraint by the duration of operation
Tables & Figures
Centre for Research on Financial Markets & Policy, KBA 5
Abbreviations
APR Annual Percentage Rate
CAPI Computer Assisted Personal Interviews
CBK Central Bank of Kenya
CFO Chief Finance Officer
DEg German Investment Corporation
gDP Gross Domestic Product
HAPI Hand Held Aided Personal Interviews
ICT Information and Communication Technology
KBRR Kenya Bank Reference Rate
KES Kenya Shilling
KNBS Kenya National Bureau of Statistics
KWFT Kenya Women Finance Trust
KII Key Informant Interviews
MFI Micro Finance Institution
NEMA National Environment Management Authority
OECD Organization for Economic Cooperation and Development
SACCO Savings and Credit Cooperative Organisation
SME Small Medium Sized Entreprise
Www World Wide Web
6 Centre for Research on Financial Markets & Policy, KBA
1.1 BACKgROuND
Many studies have addressed the importance of SMEs in a country’s economy. The general argument is that SMEs contribute significantly to a country’s GDP (Quader, 2009). In Kenya, SMEs are estimated to contribute about 20% of the GDP (Miller and Nyauncho, 2014).
IntroductionChapter 1
SMEs contribute to the growth of an economy mainly through employment creation. It is estimated that in Kenya, 80% of job opportunities are provided by the SMEs (Miller and Nyauncho, 2014). Other contributions of SMEs to the economy are through tax base expansion and driving innovation (Katua, 2014).
Even with such a significant contribution of the SMEs to the economy, there still exist SME definitional challenges and controversies to date. There is no globally accepted definition of what SMEs are (Quader, 2009: Miller and Nyauncho, 2014 and Katua, 2014). Many typologies have been used. Some have been based on registration status, workforce size, annual turnover and asset base as described in the sessional paper No. 2 of 2005. However, this definition still varies considerably between donor agencies, government and financial institutions. A country’s specific economic context is also an important consideration in the definition SMEs. A single definition is therefore not appropriate for countries at different stages of economic development. Therefore the common consensus is to use a context specific definition applicable to the situation at hand.
Besides the SME definition dilemma, SMEs are known to face many challenges. First, the failure rate and stagnation of SMEs in Kenya is very high (Nyagah, 2013). Several efforts have been put in place to assist SMEs succeed beyond the psychological 3 years of operation barrier. The World Bank, government and other institutions have created programs to incubate these businesses for success. However, majority of published literature looks at SME challenges not from the
failure/stagnation standpoint but from reported constraints that hinder them from achieving their desired goals. Quader (2009) provides guidelines on how to address SME challenges by grouping them into five broad but exhaustive categories. These are financial, regulatory, physical, technical and marketing challenges. While various authors have elaborated on many of these challenges, financial constraints have received considerable attention.
In a bid to improve how SMEs operate, there have been various attempts to introduce them to sustainability practices. According to Network of Business Sustainability (2013), sustainability in the context of SMEs is the inclusion of financial, environmental and social concerns into business decisions. These three key concerns are foundations of the Triple Bottom Line Sustainability Model that suggests that SMEs can adopt, measure and report performance on economic, environmental and social aspects (Slaper and Hall 2013). It is not clear what SMEs in Kenya have achieved so far in terms of sustainability.
1.2 STATEMENT OF THE RESEARCH PROBLEM
One of the ways SMEs financial challenges have been amplified in literature is by the postulation of the SME financing gap theory. The theory presents a case whereby, when businesses are grouped into three tiers: - as large corporates, SMEs and Micro-Enterprises, it has been observed that large corporates’ financial needs are well served by established banks. The needs for micro enterprises are mostly served by micro finance institutions, leaving SMEs with no financial institution that will address its unique needs hence the SME financing gap.
Centre for Research on Financial Markets & Policy, KBA 7
According to OECD 2006, some countries and especially those in developing economies seem to experience the financial gap more than the developed economies. This gap is also complicated by the legal, institutional and regulatory frameworks critical in determining SMEs access to finance. In addition, SMEs also have challenges in information and skills required to access external finance.
In addressing the SME Financing Gap, banks have been on the receiving end. However, there seems to be two schools of thought surrounding the issue of banks and SME finance. The first school of thought believes that banks have played a big role in providing access of financial services to SMEs. For example in Kenya, Kenya Banker’s Association analyzed the role of the Kenyan banks in supporting SMEs. The report indicated that there was a 35% growth of bank lending to SMEs, 95% of banks had at least a product tailored for SMEs and that banks were able to provide lending to SMEs in different sectors of the economy despite the risks involved with some of the sectors. The second school of thought argues that while banks have put an effort to serve SMEs, these efforts are not properly suited for SMEs for various reasons. Kashangaki (2014) debates that to date, growing enterprises still find it hard to access finance and more so appropriate for their needs. Banks still do not have properly differentiated products for SMEs. Banks have pseudo strategies that are dominated by sales and marketing initiatives more than proper strategies to serve the SME sector and their financial needs. Kashangaki (2014) and Miller and Nyauncho (2014) suggested that, the current FIs need to have a paradigm shift and devise new innovative strategies that will have SMEs at the center of their banking products innovation process. A further look at literature shows that some of the challenges SMEs have with banks can be solved by other financial institutions such as Micro Finance Institutions (MFIs) (Quaye, 2014) and SACCOs (Miller and Nyauncho, 2014).
In the Kenyan context the studies done on the SME financing gap tend to be one market sided:- they either address the demand side in isolation of supply side or address supply side in isolation of demand side. This presents then need for analyzing the SME financing gap from both the demand and supply side of the market simualtaneously. In addition scanty information exists on whether the funding constraints are homogenous between different SME firmographics or certain SMEs suffer more financial constraints than others. This study is going to fill this gap. It will complement recent annual surveys undertaken by KBA (See Box – Pages 8 and 9).
In the recent past, there has been a drive to encourage SMEs to pursue sustainability initiatives. The value of adopting sustainability practices for SMEs is huge. According to Global Reporting Initiative (2014) the benefits of adopting sustainability are twofold. First, there are benefits internal to the organization. These include; improvement of management systems and processes, identifying organizational strengths and weaknesses, and finally to attract, motivate and retain employees. Secondly are external benefits such as; enhance company reputation, attract funding, ensure transparency to stakeholders and to achieve competitive advantage and leadership.
Davis and O’Halloran (2013) observed that SMEs seem to be confused on how to introduce and report sustainability measures and it may take time before the SMEs can allocate resources to sustainability initiatives that they do not properly understand. This study attempted to establish where SMEs in Kenya are adopting sustainable business practices or whether SMEs are considering sustainability as a viable business model that could also improve their access to finance.
1.3 STuDY OBjECTIVES
The following are the objectives that guided the study.
i. To establish whether SMEs are constrained more by the access to funds than the cost of funds or a combination of the two both from the demand and supply sides
ii. To determine whether SMEs constraints in terms of funding are homogenous regardless of the type of funding (debt or equity), the provider of funding (bank, non-bank lender [SACCO, Informal Money Lenders among others.]), nature of business the SMEs are engaged in (trading, processing, among others), type of sector/industry, or location of enterprise (Nairobi, other cities and urban areas, and rural areas).
iii. To find out whether environmental, social and economic considerations are key to the SME business and whether the SMEs consider these aspects to be key as they seek financing. In essence the study will seek to establish the appreciation of the aspect of sustainable finance among SMEs and how it is likely to influence their choice of potential financiers.
8 Centre for Research on Financial Markets & Policy, KBA
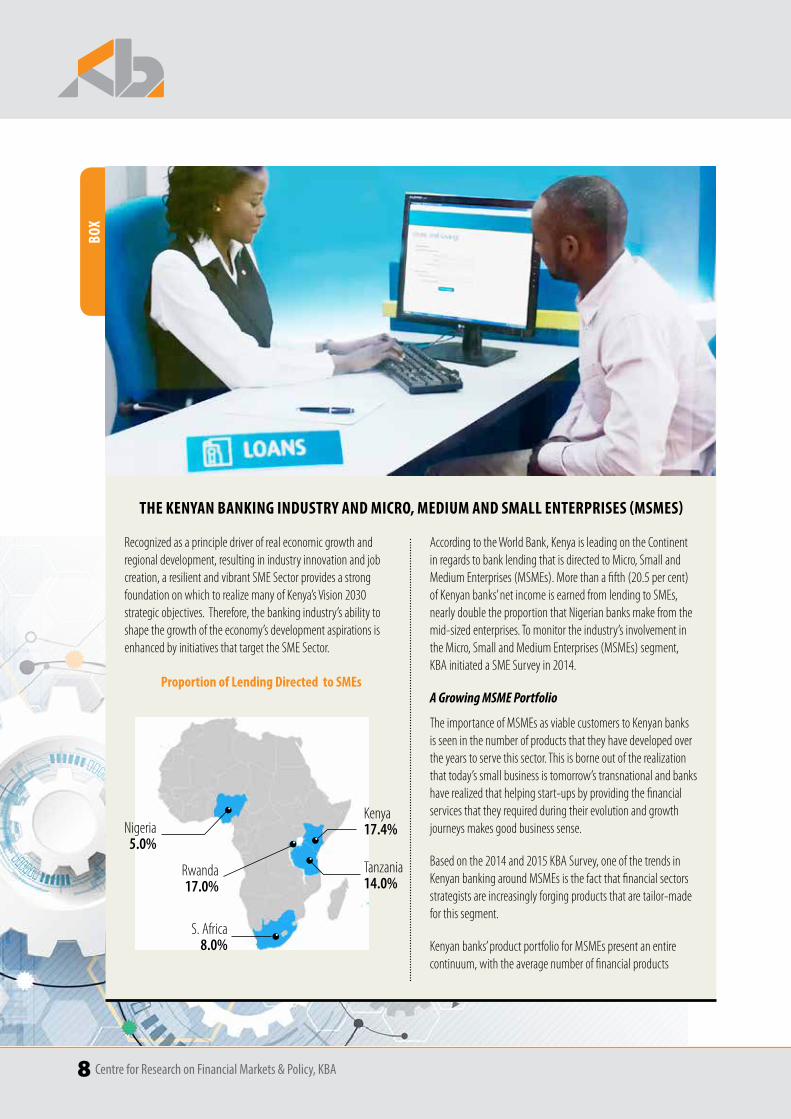
Recognized as a principle driver of real economic growth and regional development, resulting in industry innovation and job creation, a resilient and vibrant SME Sector provides a strong foundation on which to realize many of Kenya’s Vision 2030 strategic objectives. Therefore, the banking industry’s ability to shape the growth of the economy’s development aspirations is enhanced by initiatives that target the SME Sector.
According to the World Bank, Kenya is leading on the Continent in regards to bank lending that is directed to Micro, Small and Medium Enterprises (MSMEs). More than a fifth (20.5 per cent) of Kenyan banks’ net income is earned from lending to SMEs, nearly double the proportion that Nigerian banks make from the mid-sized enterprises. To monitor the industry’s involvement in the Micro, Small and Medium Enterprises (MSMEs) segment, KBA initiated a SME Survey in 2014.
A Growing MSME Portfolio
The importance of MSMEs as viable customers to Kenyan banks is seen in the number of products that they have developed over the years to serve this sector. This is borne out of the realization that today’s small business is tomorrow’s transnational and banks have realized that helping start-ups by providing the financial services that they required during their evolution and growth journeys makes good business sense.
Based on the 2014 and 2015 KBA Survey, one of the trends in Kenyan banking around MSMEs is the fact that financial sectors strategists are increasingly forging products that are tailor-made for this segment.
Kenyan banks’ product portfolio for MSMEs present an entire continuum, with the average number of financial products
THE KENYAN BANKINg INDuSTRY AND MICRO, MEDIuM AND SMALL ENTERPRISES (MSMES)
BOX
Kenya 17.4%
Tanzania 14.0%
Rwanda 17.0%
S. Africa 8.0%
Nigeria 5.0%
Proportion of Lending Directed to SMEs
Centre for Research on Financial Markets & Policy, KBA 9
BOX
being developed at nine per bank and most respondents ranging between three to 23 products targeting SMEs. The highest number of products targeted at this segment was 40, demonstrating an advanced level of product specialization.
Among the products that banks have developed for MSMEs are to be found in four broad categories: financial products, Value Added Services (VAS), Training and Capacity Building and Networking and Mentorship.
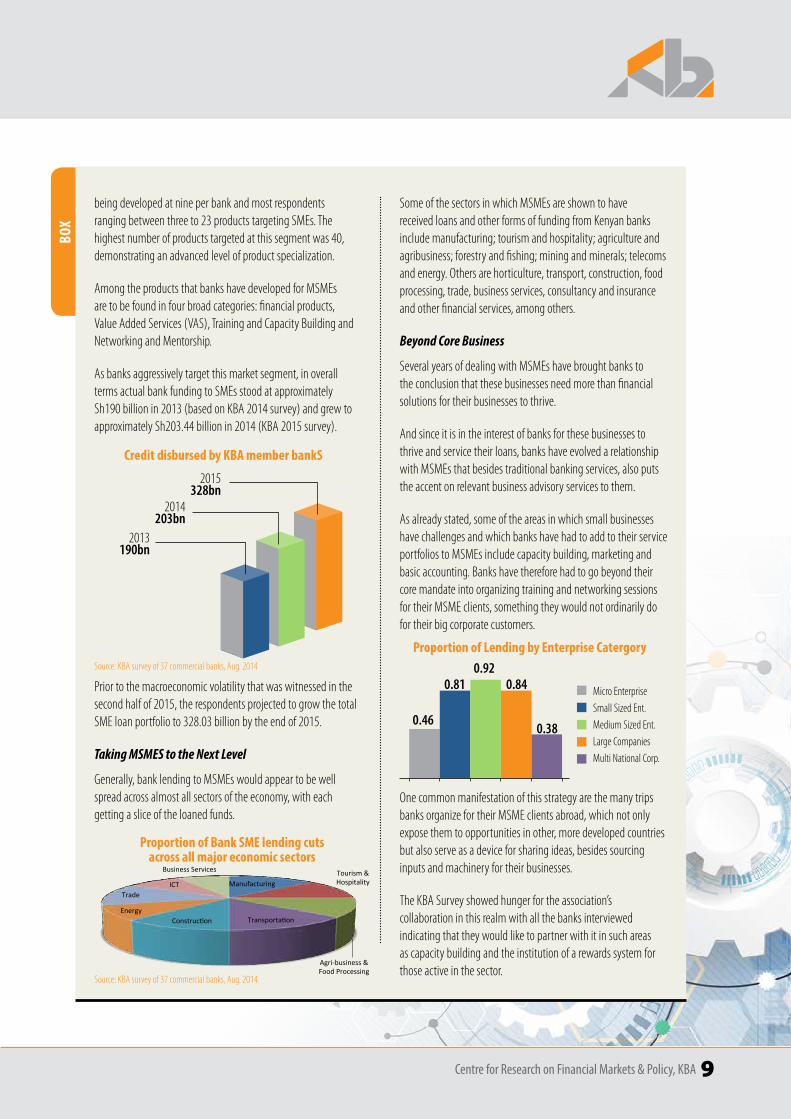
As banks aggressively target this market segment, in overall terms actual bank funding to SMEs stood at approximately Sh190 billion in 2013 (based on KBA 2014 survey) and grew to approximately Sh203.44 billion in 2014 (KBA 2015 survey).
2013 190bn
2014 203bn
2015 328bn
Credit disbursed by KBA member bankS
Prior to the macroeconomic volatility that was witnessed in the second half of 2015, the respondents projected to grow the total SME loan portfolio to 328.03 billion by the end of 2015.
Taking MSMES to the Next Level
Generally, bank lending to MSMEs would appear to be well spread across almost all sectors of the economy, with each getting a slice of the loaned funds.
Some of the sectors in which MSMEs are shown to have received loans and other forms of funding from Kenyan banks include manufacturing; tourism and hospitality; agriculture and agribusiness; forestry and fishing; mining and minerals; telecoms and energy. Others are horticulture, transport, construction, food processing, trade, business services, consultancy and insurance and other financial services, among others.
Beyond Core Business
Several years of dealing with MSMEs have brought banks to the conclusion that these businesses need more than financial solutions for their businesses to thrive.
And since it is in the interest of banks for these businesses to thrive and service their loans, banks have evolved a relationship with MSMEs that besides traditional banking services, also puts the accent on relevant business advisory services to them.
As already stated, some of the areas in which small businesses have challenges and which banks have had to add to their service portfolios to MSMEs include capacity building, marketing and basic accounting. Banks have therefore had to go beyond their core mandate into organizing training and networking sessions for their MSME clients, something they would not ordinarily do for their big corporate customers.
One common manifestation of this strategy are the many trips banks organize for their MSME clients abroad, which not only expose them to opportunities in other, more developed countries but also serve as a device for sharing ideas, besides sourcing inputs and machinery for their businesses.
The KBA Survey showed hunger for the association’s collaboration in this realm with all the banks interviewed indicating that they would like to partner with it in such areas as capacity building and the institution of a rewards system for those active in the sector.
Source: KBA survey of 37 commercial banks, Aug. 2014
Source: KBA survey of 37 commercial banks, Aug. 2014
Manufacturing Tourism & Hospitality
Agri-‐business & Food Processing
Transporta<on Construc<on Energy
Trade ICT
Business Services
Proportion of Bank SME lending cuts across all major economic sectors
0.46
0.81
0.92
0.84
0.38
Micro Enterprise
Small Sized Ent.
Medium Sized Ent.
Large Companies
Multi National Corp.
Proportion of Lending by Enterprise Catergory
10 Centre for Research on Financial Markets & Policy, KBA
BOX
Among the areas in which they would seek KBA’s partnership are in influencing Government policy in areas such as MSME funding and statistics; simplification of security perfection and related costs e.g. legal fees. They would also like collaboration in the organization of regular stakeholder forums and training in such areas as supply chain management and book-keeping.
Banks surveyed would also like to see collaboration in levelling regulation between Microfinance and Commercial banks e.g. on single borrower limits and equitable allocation of MSME funds to financial institutions.
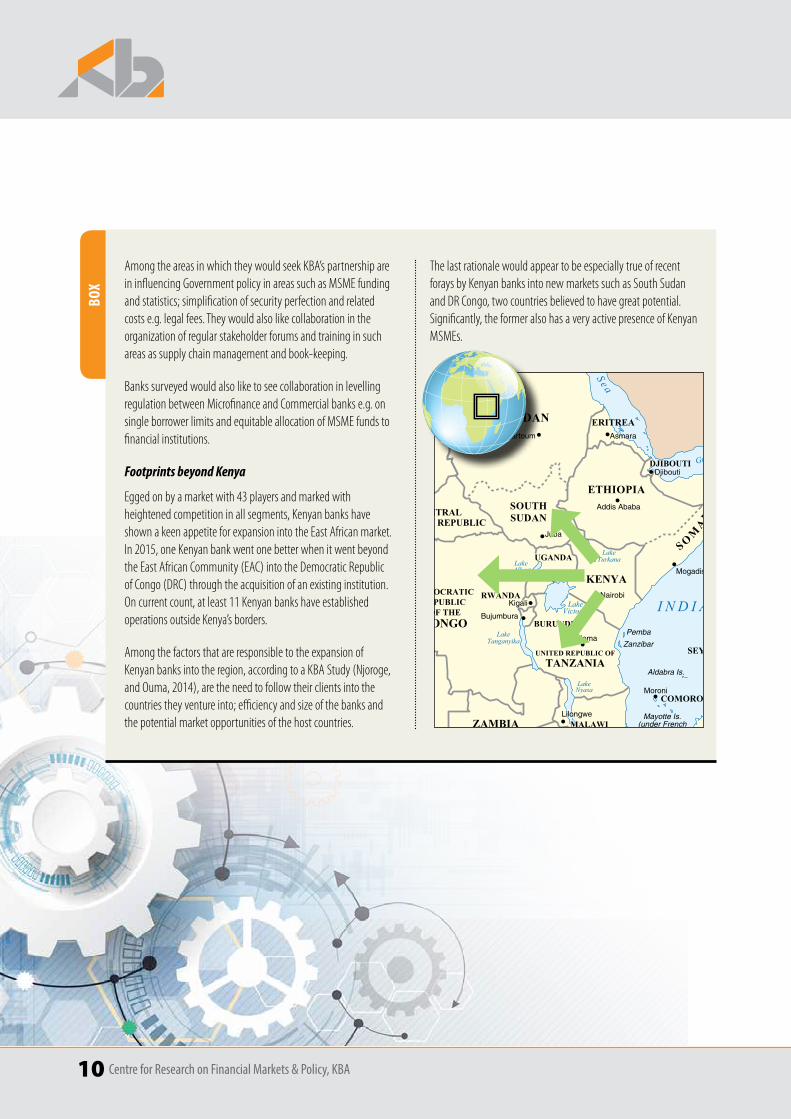
Footprints beyond Kenya
Egged on by a market with 43 players and marked with heightened competition in all segments, Kenyan banks have shown a keen appetite for expansion into the East African market. In 2015, one Kenyan bank went one better when it went beyond the East African Community (EAC) into the Democratic Republic of Congo (DRC) through the acquisition of an existing institution. On current count, at least 11 Kenyan banks have established operations outside Kenya’s borders.
Among the factors that are responsible to the expansion of Kenyan banks into the region, according to a KBA Study (Njoroge, and Ouma, 2014), are the need to follow their clients into the countries they venture into; efficiency and size of the banks and the potential market opportunities of the host countries.
The last rationale would appear to be especially true of recent forays by Kenyan banks into new markets such as South Sudan and DR Congo, two countries believed to have great potential. Significantly, the former also has a very active presence of Kenyan MSMEs.
Socotra
Providence Is.
Agalega Is.Farquhar Is.
Mayotte Is.(under French
admin.)
Aldabra Is.
Amirante Is.Zanzibar
Pemba
Carajos
Réunion
TromelinSt. Helena
Ascension
Madeira Is.
Canary Is.
Principe
Cargados
Annobón
São Tomé
Asmara
LibrevilleKampala
Nairobi
Moroni
Brazzaville
Kinshasa
Yaoundé
Khartoum
Addis Ababa
N'Djamena
Bangui
Kigali
Bujumbura
Lilongwe
Djibouti
Banjul
Conakry
Yamoussoukro Accra
Freetown
Monrovia
Abidjan
Abuja
Nouakchott
Dakar
Bissau
Bamako
Ouagadougou
Malabo
Niamey
Luanda
PortoNovo
Tripoli
TunisAlgiers
Rabat
Laayoune
Cairo
Lusaka
Harare
Pretoria
MaseruBloemfontein
MbabaneMaputo
Cape Town
Windhoek Gaborone
Antananarivo
Dodoma Victoria
Mogadishu
Praia
Lom
e
Port Louis
SãoTomé
Juba
A T L A N T I C
O C E A N
LakeTurkanaLake
Albert
LakeTanganyika
LakeNyasa
LakeKariba
LakeChad
LakeVictoria I N D I A N O C E A N
M e d i t e r r a n e a n S e a
Re d S e a
Gulf of Aden
SUDAN
SOUTHSUDAN
NIGERIA
NAMIBIA
LIBYA
CHAD
SOUTHAFRICA
UNITED REPUBLIC OFTANZANIA
MOROCCO
SAO TOME AND PRINCIPE
ZAMBIA
CENTRALAFRICAN REPUBLIC
TUNISIA
UGANDA
CÔTE- D'IVOIRE
LIBERIA
SIERRALEONE
BURKINA FASOGAMBIA
CAMEROON
EQUATORIAL GUINEA
WesternSahara
MAURITIUS
CAPE VERDE
ERITREA
C
ONGO
NIGER
DEMOCRATIC REPUBLIC
OF THECONGO
GABON
MALI
Cabinda(ANGOLA)
MAURITANIA
BOTSWANA
SWAZILAND
LESOTHO
MALAWI
BURUNDI
RWANDA
ZIMBABWE
DJIBOUTI
KENYA
COMOROS
SEYCHELLES
MO
ZA
M
BIQ U E
MA
DA
GA
SCAR
ANGOLA
ALGERIA
SENEGAL
GUINEA-BISSAU GUINEA
EGYPT
ETHIOPIA
(EQUATORIAL GUINEA)
(PORTUGAL)
(SPAIN)
(UK)
(UK)
(YEMEN)
(MAURITIUS)
(FRANCE)
(FRANCE)
GHANA
BEN
IN
TOG
O
SOMA
LIA
Map No. 4045 Rev. 7 UNITED NATIONSNovember 2011
Department of Field SupportCartographic Section
0
0
500 1000 km
500 mi
AFRICA
The boundaries and names shown and the designations used on this map do not imply official endorsement or acceptance by the United Nations.
Final boundary between the Republic of the Sudan and the Republic of South Sudan has not yet been determined.
Centre for Research on Financial Markets & Policy, KBA 11
Research MethodologyChapter 2
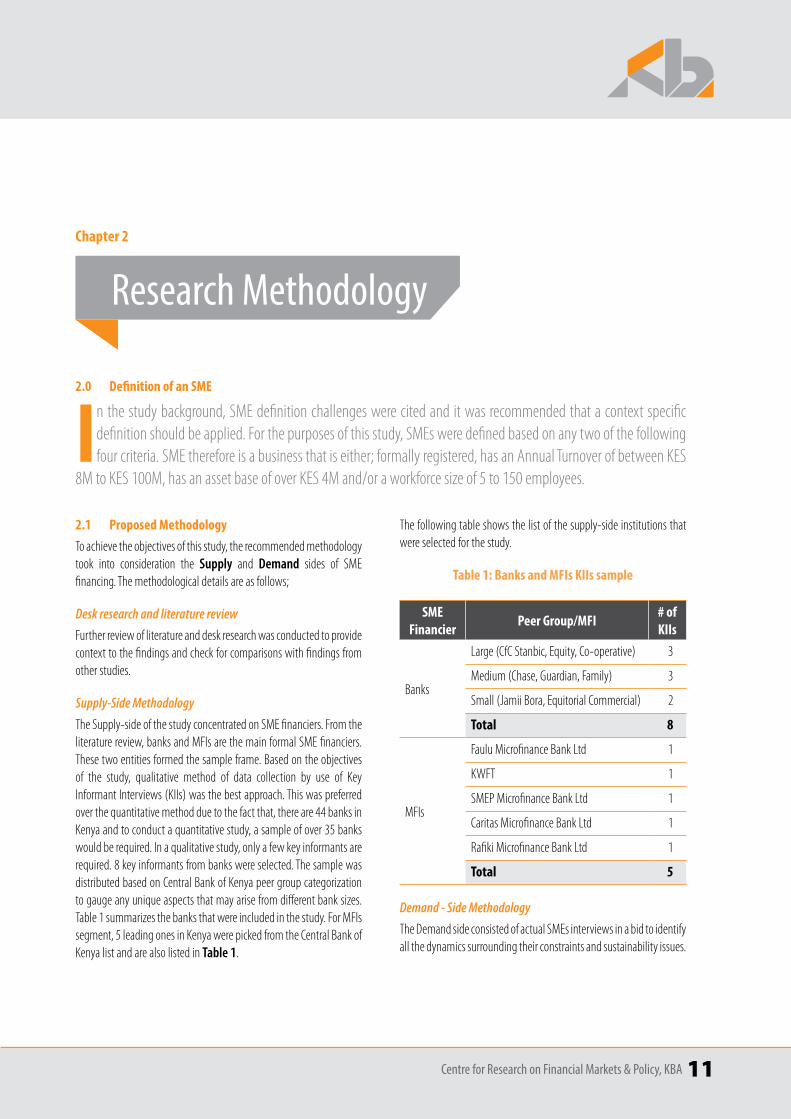
2.1 Proposed MethodologyTo achieve the objectives of this study, the recommended methodology took into consideration the Supply and Demand sides of SME financing. The methodological details are as follows;
Desk research and literature review
Further review of literature and desk research was conducted to provide context to the findings and check for comparisons with findings from other studies.
Supply-Side Methodology
The Supply-side of the study concentrated on SME financiers. From the literature review, banks and MFIs are the main formal SME financiers. These two entities formed the sample frame. Based on the objectives of the study, qualitative method of data collection by use of Key Informant Interviews (KIIs) was the best approach. This was preferred over the quantitative method due to the fact that, there are 44 banks in Kenya and to conduct a quantitative study, a sample of over 35 banks would be required. In a qualitative study, only a few key informants are required. 8 key informants from banks were selected. The sample was distributed based on Central Bank of Kenya peer group categorization to gauge any unique aspects that may arise from different bank sizes. Table 1 summarizes the banks that were included in the study. For MFIs segment, 5 leading ones in Kenya were picked from the Central Bank of Kenya list and are also listed in Table 1.
The following table shows the list of the supply-side institutions that were selected for the study.
Table 1: Banks and MFIs KIIs sample
SME Financier Peer group/MFI # of
KIIs
Banks
Large (CfC Stanbic, Equity, Co-operative) 3
Medium (Chase, Guardian, Family) 3
Small (Jamii Bora, Equitorial Commercial) 2
Total 8
MFIs
Faulu Microfinance Bank Ltd 1
KWFT 1
SMEP Microfinance Bank Ltd 1
Caritas Microfinance Bank Ltd 1
Rafiki Microfinance Bank Ltd 1
Total 5
Demand - Side Methodology
The Demand side consisted of actual SMEs interviews in a bid to identify all the dynamics surrounding their constraints and sustainability issues.
2.0 Definition of an SME
In the study background, SME definition challenges were cited and it was recommended that a context specific definition should be applied. For the purposes of this study, SMEs were defined based on any two of the following four criteria. SME therefore is a business that is either; formally registered, has an Annual Turnover of between KES
8M to KES 100M, has an asset base of over KES 4M and/or a workforce size of 5 to 150 employees.
12 Centre for Research on Financial Markets & Policy, KBA
Quantitative data collection method was most appropriate in addressing the demand side objectives. A semi-structured questionnaire was administered to SME owners and where owners were not available, to SME employees who hold positions that would allow them to comment on the financial aspects of the SMEs such as Chief Financial Officers (CFOs).
Due to the fact that a comprehensive listing of active SMEs in Kenya is not readily available (FinAccess 2015), it was difficult to create a sampling frame that could be used for random sampling purposes. To circumvent this drawback, a purposive sampling design was employed. Purposive sampling design is a non-random design that is commonly used when a credible sampling frame is not available. Ipsos has been conducting SME surveys in the recent years and it has created a database of some of the SMEs in Kenya. As a starting point this list was used to set up appointments with potential respondents.
For non-random sampling methods such as the purposive sampling design described above, sample size determination is not based on any statistical formula but on a couple of factors that would make the sample size credible. The sample was initially stratified by criteria important in achieving the objectives of the study. The factors were the specific town the SME is located, the locality of the SME (whether in urban/cities or rural areas), the SMEs sector of the economy and a natural balance between the Small and Medium sized enterprises.
It is important to note that as far as the locality based on the urban rural dichotomy is concerned, and by going with the standard definition provided by the Kenya National Bureau of Statistics, most SMEs are found in Urban and Peri-Urban areas and not in deep rural areas where infrastructure and access to social amenities is almost non-existent.
After considering these factors and more so ensuring that there is a logical allocation of sample size to the different cities and also by ensuring that a minimum of 20 SMEs are done in each town, a final sample of 607 SMEs were interviewed.
Regional, sectoral and SME size distributions (as shown in table 2, 3 and 4 respectively) were done a priori. The distribution of the sample size across the different categories was informed by previous studies. These studies indicate that larger towns and cities tend to have a higher concentration of SMEs. Trade/Retail and Agribusiness and Food processing are the most popular sectors, while Small Enterprises are likely to be more in number than the Medium ones.
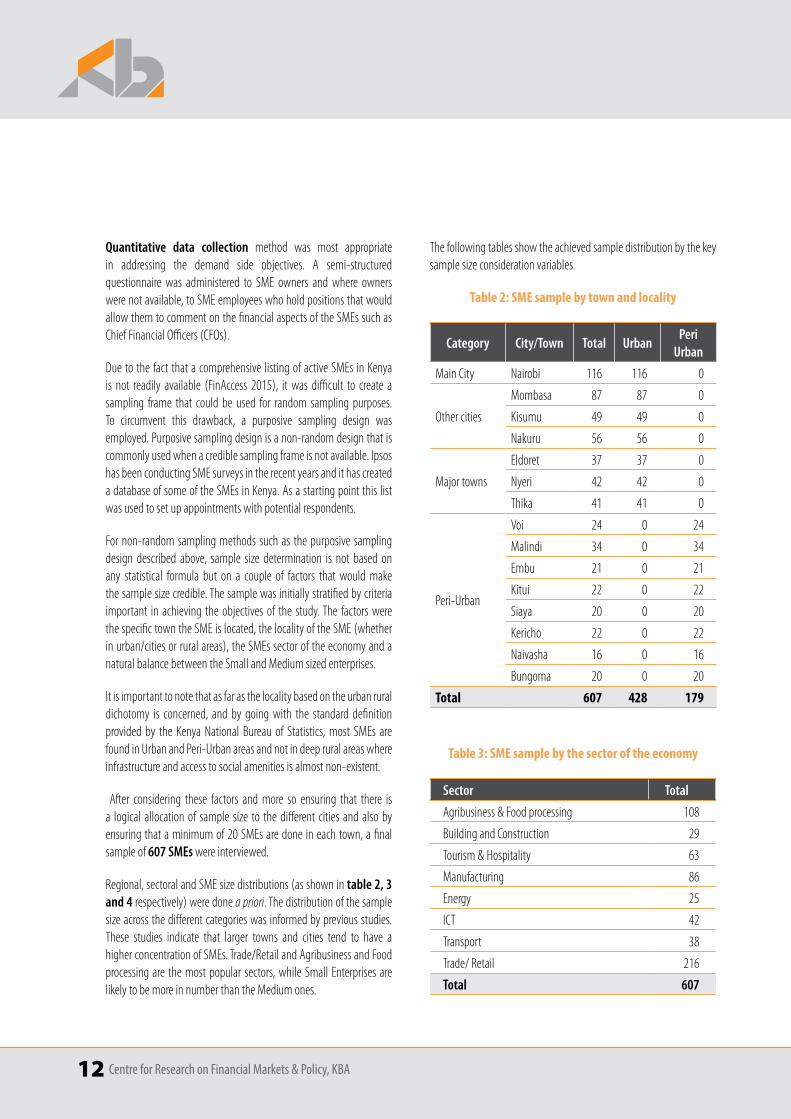
The following tables show the achieved sample distribution by the key sample size consideration variables.
Table 2: SME sample by town and locality
Category City/Town Total UrbanPeri
Urban
Main City Nairobi 116 116 0
Other cities
Mombasa 87 87 0
Kisumu 49 49 0
Nakuru 56 56 0
Major towns
Eldoret 37 37 0
Nyeri 42 42 0
Thika 41 41 0
Peri-Urban
Voi 24 0 24
Malindi 34 0 34
Embu 21 0 21
Kitui 22 0 22
Siaya 20 0 20
Kericho 22 0 22
Naivasha 16 0 16
Bungoma 20 0 20
Total 607 428 179
Table 3: SME sample by the sector of the economy
Sector Total
Agribusiness & Food processing 108
Building and Construction 29
Tourism & Hospitality 63
Manufacturing 86
Energy 25
ICT 42
Transport 38
Trade/ Retail 216
Total 607
Centre for Research on Financial Markets & Policy, KBA 13
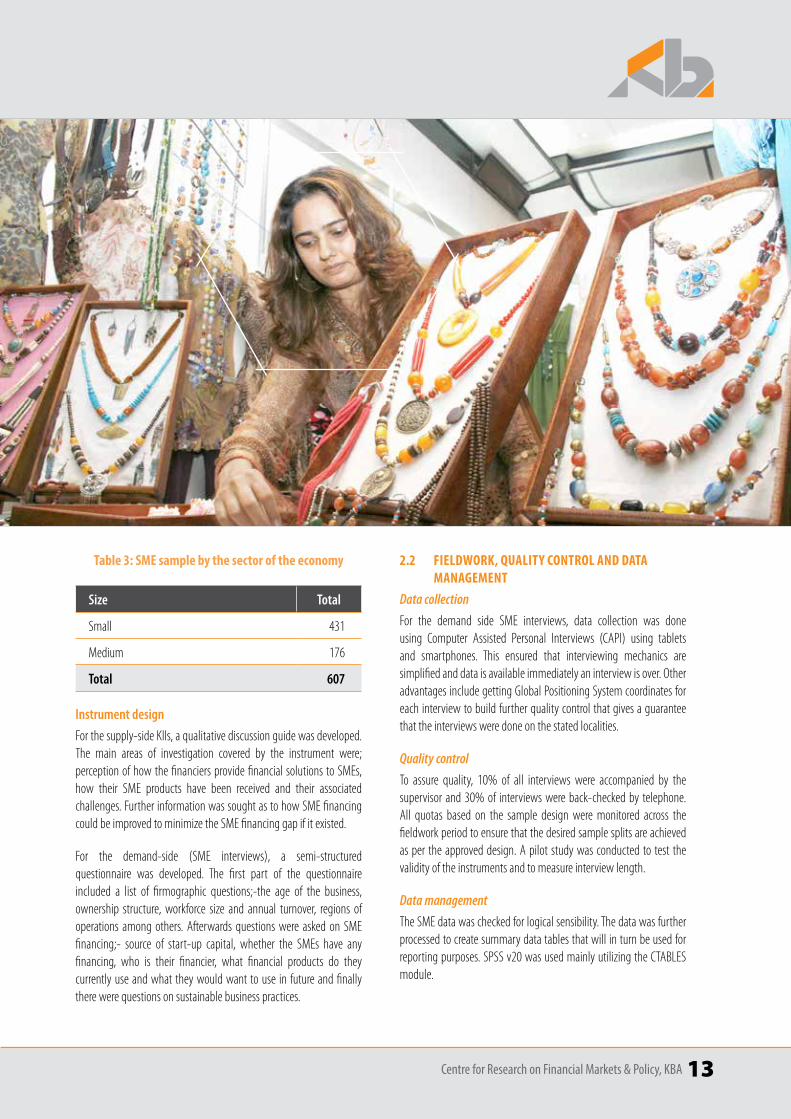
Table 3: SME sample by the sector of the economy
Size Total
Small 431
Medium 176
Total 607
Instrument design
For the supply-side KIIs, a qualitative discussion guide was developed. The main areas of investigation covered by the instrument were; perception of how the financiers provide financial solutions to SMEs, how their SME products have been received and their associated challenges. Further information was sought as to how SME financing could be improved to minimize the SME financing gap if it existed.
For the demand-side (SME interviews), a semi-structured questionnaire was developed. The first part of the questionnaire included a list of firmographic questions;-the age of the business, ownership structure, workforce size and annual turnover, regions of operations among others. Afterwards questions were asked on SME financing;- source of start-up capital, whether the SMEs have any financing, who is their financier, what financial products do they currently use and what they would want to use in future and finally there were questions on sustainable business practices.
2.2 FIELDWORK, QuALITY CONTROL AND DATA MANAgEMENT
Data collection
For the demand side SME interviews, data collection was done using Computer Assisted Personal Interviews (CAPI) using tablets and smartphones. This ensured that interviewing mechanics are simplified and data is available immediately an interview is over. Other advantages include getting Global Positioning System coordinates for each interview to build further quality control that gives a guarantee that the interviews were done on the stated localities.
Quality control
To assure quality, 10% of all interviews were accompanied by the supervisor and 30% of interviews were back-checked by telephone. All quotas based on the sample design were monitored across the fieldwork period to ensure that the desired sample splits are achieved as per the approved design. A pilot study was conducted to test the validity of the instruments and to measure interview length.
Data management
The SME data was checked for logical sensibility. The data was further processed to create summary data tables that will in turn be used for reporting purposes. SPSS v20 was used mainly utilizing the CTABLES module.
14 Centre for Research on Financial Markets & Policy, KBA
Centre for Research on Financial Markets & Policy, KBA 15
Survey Findings and DiscussionChapter 3
3.1 DEMAND-SIDE ANALYSISThis section provides information for the demand-side – the SMEs.
Constraints that SMEs face in Kenya
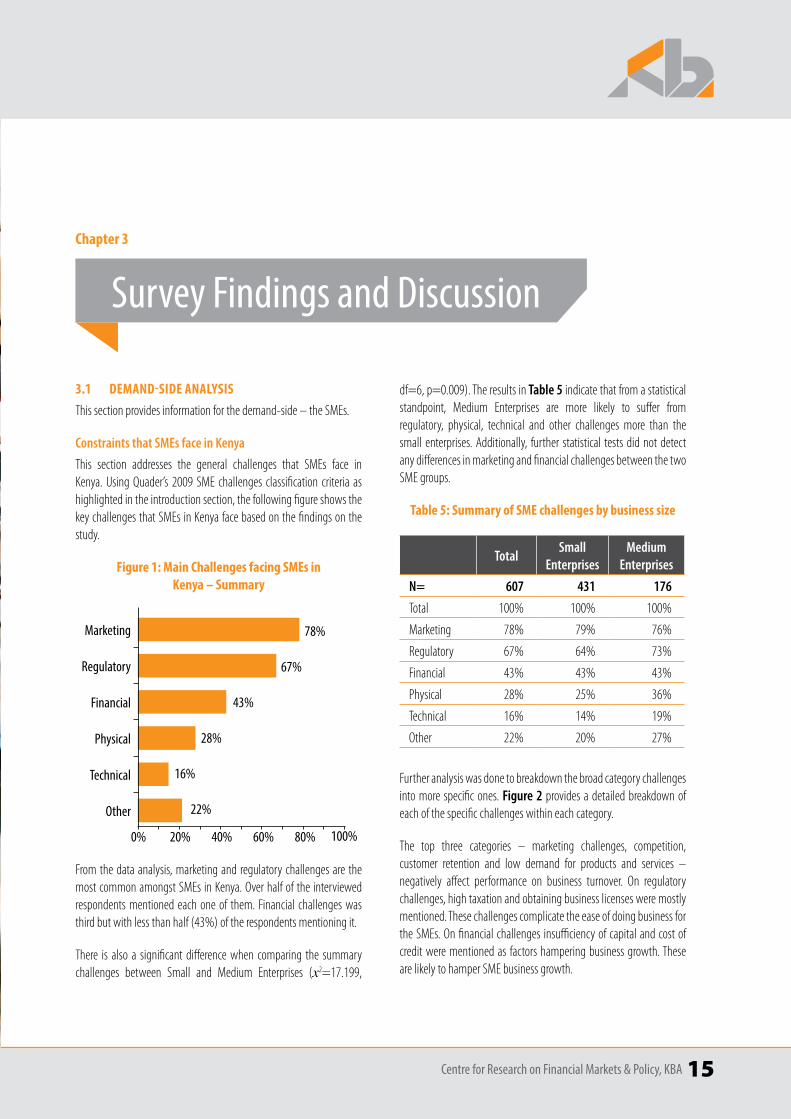
This section addresses the general challenges that SMEs face in Kenya. Using Quader’s 2009 SME challenges classification criteria as highlighted in the introduction section, the following figure shows the key challenges that SMEs in Kenya face based on the findings on the study.
Figure 1: Main Challenges facing SMEs in Kenya – Summary
78%Marketing
Financial
Technical
Regulatory
Physical
Other
67%
43%
28%
16%
22%
0% 20% 40% 60% 80% 100%
From the data analysis, marketing and regulatory challenges are the most common amongst SMEs in Kenya. Over half of the interviewed respondents mentioned each one of them. Financial challenges was third but with less than half (43%) of the respondents mentioning it.
There is also a significant difference when comparing the summary challenges between Small and Medium Enterprises (х2=17.199,
df=6, p=0.009). The results in Table 5 indicate that from a statistical standpoint, Medium Enterprises are more likely to suffer from regulatory, physical, technical and other challenges more than the small enterprises. Additionally, further statistical tests did not detect any differences in marketing and financial challenges between the two SME groups.
Table 5: Summary of SME challenges by business size
TotalSmall
EnterprisesMedium
Enterprises
N= 607 431 176
Total 100% 100% 100%
Marketing 78% 79% 76%
Regulatory 67% 64% 73%
Financial 43% 43% 43%
Physical 28% 25% 36%
Technical 16% 14% 19%
Other 22% 20% 27%
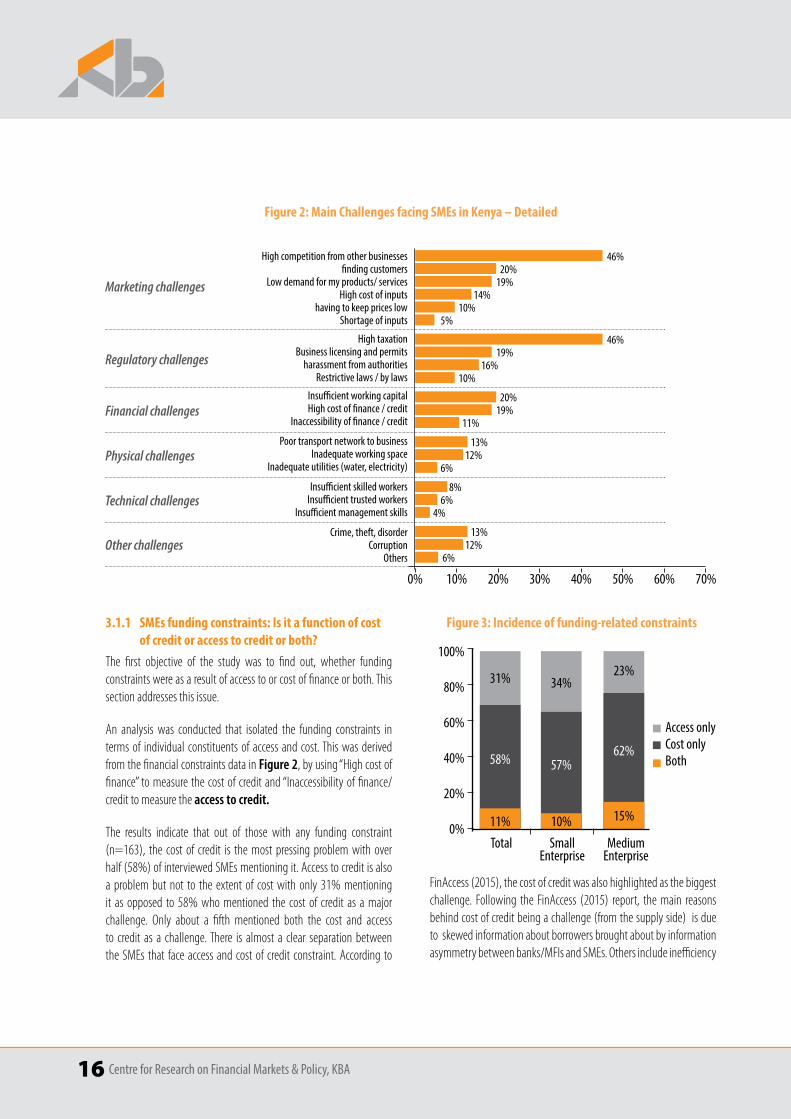
Further analysis was done to breakdown the broad category challenges into more specific ones. Figure 2 provides a detailed breakdown of each of the specific challenges within each category.
The top three categories – marketing challenges, competition, customer retention and low demand for products and services – negatively affect performance on business turnover. On regulatory challenges, high taxation and obtaining business licenses were mostly mentioned. These challenges complicate the ease of doing business for the SMEs. On financial challenges insufficiency of capital and cost of credit were mentioned as factors hampering business growth. These are likely to hamper SME business growth.
16 Centre for Research on Financial Markets & Policy, KBA
3.1.1 SMEs funding constraints: Is it a function of cost of credit or access to credit or both?
The first objective of the study was to find out, whether funding constraints were as a result of access to or cost of finance or both. This section addresses this issue.
An analysis was conducted that isolated the funding constraints in terms of individual constituents of access and cost. This was derived from the financial constraints data in Figure 2, by using “High cost of finance” to measure the cost of credit and “Inaccessibility of finance/credit to measure the access to credit.
The results indicate that out of those with any funding constraint (n=163), the cost of credit is the most pressing problem with over half (58%) of interviewed SMEs mentioning it. Access to credit is also a problem but not to the extent of cost with only 31% mentioning it as opposed to 58% who mentioned the cost of credit as a major challenge. Only about a fifth mentioned both the cost and access to credit as a challenge. There is almost a clear separation between the SMEs that face access and cost of credit constraint. According to
FinAccess (2015), the cost of credit was also highlighted as the biggest challenge. Following the FinAccess (2015) report, the main reasons behind cost of credit being a challenge (from the supply side) is due to skewed information about borrowers brought about by information asymmetry between banks/MFIs and SMEs. Others include inefficiency
Figure 3: Incidence of funding-related constraints
31%
58%
34%
57%
23%
62%
0%
20%
40%
60%
80%
100%
Total SmallEnterprise
MediumEnterprise
11% 10% 15%
Access onlyCost onlyBoth
Figure 2: Main Challenges facing SMEs in Kenya – Detailed
High competition from other businesses
High taxation
Insufficient working capital
Poor transport network to business
Insufficient skilled workers
Crime, theft, disorder
finding customers
Business licensing and permits
High cost of finance / credit
Inadequate working space
Insufficient trusted workers
Corruption
Low demand for my products/ services
harassment from authorities
Inaccessibility of finance / credit
Inadequate utilities (water, electricity)
Insufficient management skills
Others
High cost of inputs
Restrictive laws / by laws
having to keep prices lowShortage of inputs
46%20%
19%14%
10%5%
46%19%
16%10%
20%19%
11%
13%12%
6%
8%6%
4%
13%12%
6%
0% 10% 20% 30% 40% 50% 60% 70%
Marketing challenges
Regulatory challenges
Financial challenges
Physical challenges
Technical challenges
Other challenges
Centre for Research on Financial Markets & Policy, KBA 17
in collateral registration process, the cost of judicial process and high overhead costs.
Even though by looking at absolute percentages, the data seems to suggest that small enterprises are more likely to have access of funding constraints than the medium enterprises while medium ones are more likely to have cost of credit constraints a chi-square test of independence confirms no statistical difference was detected (х2=2.157, df=2, p=0.340). This is due to a small base size (especially on the Medium Enterprises; Total n=163, Small Enterprises n=116 and Medium Enterprises n=47) of those who reported to have any funding challenge.
Source of startup capital
Figure 4 below, shows the popular sources of start-up capital. About 6 in 10 SMEs (62%) started their business operations using personal savings with 28% borrowing from banks only and a paltry 6% using
Non-bank lending institutions. The use of personal savings may in a way explain the fact that funding per sé is not a major constraint. It equally signals the need to feel in control of ownership of the business. The minimal role of non-bank lending institutions indicates that SMEs in Kenya may not necessarily be facing the SME Financing gap which is mainly related to access more than cost.
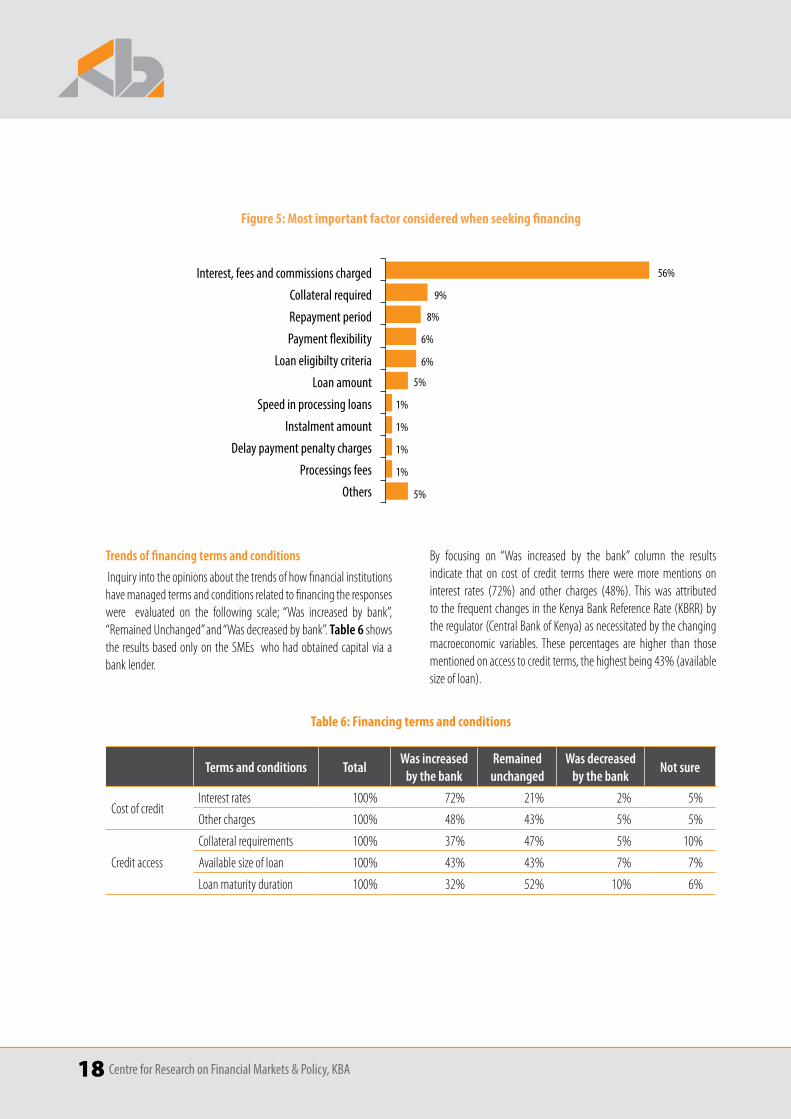
Factors considered by SMEs when seeking financing
An inquiry into the key factors considered when seeking for financing from different financial sources (with exclusion of personal savings) the results reveal that the cost of credit (as exemplified by interest, fees and commissioned charged) is the most important factor of consideration.
Other aspects that relate to access of credit (as exemplified by collateral required, payment flexibility, loan eligibility criteria) are mentioned but at a comparatively low proportion. In particular, collateral may not be a big issue to SMEs, since they prefer short term/quick loans typically lasting less than 2 years.
Figure 4: Source of Start-up Capital
Personal money / personal savings
Borrowwd from commercial banks
External equity investors
Personal money / savings from my parners and I
Borrowwd from family and friends
Funded by donor agencies / NGOs
Borrowwd from non-bank financial institutions
Governement loans / grants Other (specify)
62%14%
28%13%
6%
2%1%
0%13%
18 Centre for Research on Financial Markets & Policy, KBA
Trends of financing terms and conditions
Inquiry into the opinions about the trends of how financial institutions have managed terms and conditions related to financing the responses were evaluated on the following scale; “Was increased by bank”, “Remained Unchanged” and “Was decreased by bank”. Table 6 shows the results based only on the SMEs who had obtained capital via a bank lender.
By focusing on “Was increased by the bank” column the results indicate that on cost of credit terms there were more mentions on interest rates (72%) and other charges (48%). This was attributed to the frequent changes in the Kenya Bank Reference Rate (KBRR) by the regulator (Central Bank of Kenya) as necessitated by the changing macroeconomic variables. These percentages are higher than those mentioned on access to credit terms, the highest being 43% (available size of loan).
Figure 5: Most important factor considered when seeking financing
Table 6: Financing terms and conditions
Terms and conditions TotalWas increased
by the bankRemained
unchangedWas decreased
by the bankNot sure
Cost of creditInterest rates 100% 72% 21% 2% 5%
Other charges 100% 48% 43% 5% 5%
Credit access
Collateral requirements 100% 37% 47% 5% 10%
Available size of loan 100% 43% 43% 7% 7%
Loan maturity duration 100% 32% 52% 10% 6%
Interest, fees and commissions charged
Collateral required
Repayment period
Payment flexibility
Loan eligibilty criteria
Loan amount
Speed in processing loans
Instalment amount
Delay payment penalty charges
Processings fees
Others 5%
1%
1%
1%
1%
5%
6%
6%
8%
9%
56%
Centre for Research on Financial Markets & Policy, KBA 19
Annual Percentage Rate
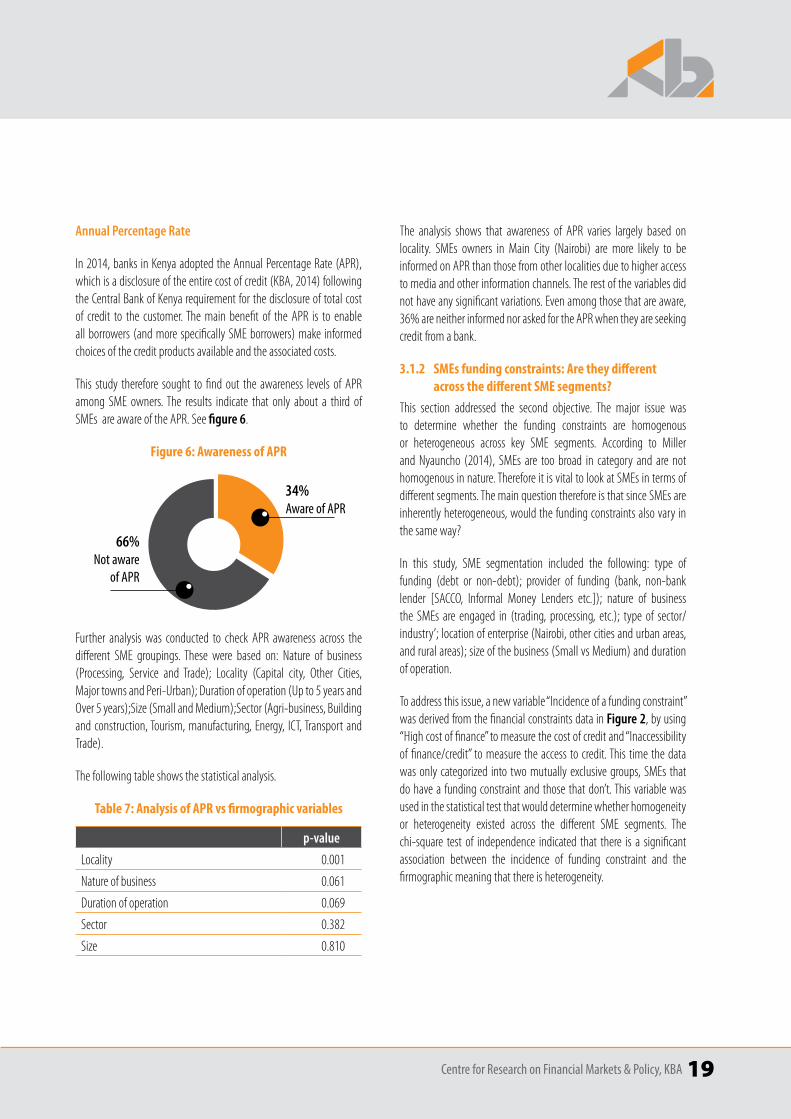
In 2014, banks in Kenya adopted the Annual Percentage Rate (APR), which is a disclosure of the entire cost of credit (KBA, 2014) following the Central Bank of Kenya requirement for the disclosure of total cost of credit to the customer. The main benefit of the APR is to enable all borrowers (and more specifically SME borrowers) make informed choices of the credit products available and the associated costs.
This study therefore sought to find out the awareness levels of APR among SME owners. The results indicate that only about a third of SMEs are aware of the APR. See figure 6.
Figure 6: Awareness of APR
34% Aware of APR
66% Not aware
of APR
Further analysis was conducted to check APR awareness across the different SME groupings. These were based on: Nature of business (Processing, Service and Trade); Locality (Capital city, Other Cities, Major towns and Peri-Urban); Duration of operation (Up to 5 years and Over 5 years);Size (Small and Medium);Sector (Agri-business, Building and construction, Tourism, manufacturing, Energy, ICT, Transport and Trade).
The following table shows the statistical analysis.
Table 7: Analysis of APR vs firmographic variables
p-value
Locality 0.001
Nature of business 0.061
Duration of operation 0.069
Sector 0.382
Size 0.810
The analysis shows that awareness of APR varies largely based on locality. SMEs owners in Main City (Nairobi) are more likely to be informed on APR than those from other localities due to higher access to media and other information channels. The rest of the variables did not have any significant variations. Even among those that are aware, 36% are neither informed nor asked for the APR when they are seeking credit from a bank.
3.1.2 SMEs funding constraints: Are they different across the different SME segments?
This section addressed the second objective. The major issue was to determine whether the funding constraints are homogenous or heterogeneous across key SME segments. According to Miller and Nyauncho (2014), SMEs are too broad in category and are not homogenous in nature. Therefore it is vital to look at SMEs in terms of different segments. The main question therefore is that since SMEs are inherently heterogeneous, would the funding constraints also vary in the same way?
In this study, SME segmentation included the following: type of funding (debt or non-debt); provider of funding (bank, non-bank lender [SACCO, Informal Money Lenders etc.]); nature of business the SMEs are engaged in (trading, processing, etc.); type of sector/industry’; location of enterprise (Nairobi, other cities and urban areas, and rural areas); size of the business (Small vs Medium) and duration of operation.
To address this issue, a new variable “Incidence of a funding constraint” was derived from the financial constraints data in Figure 2, by using “High cost of finance” to measure the cost of credit and “Inaccessibility of finance/credit” to measure the access to credit. This time the data was only categorized into two mutually exclusive groups, SMEs that do have a funding constraint and those that don’t. This variable was used in the statistical test that would determine whether homogeneity or heterogeneity existed across the different SME segments. The chi-square test of independence indicated that there is a significant association between the incidence of funding constraint and the firmographic meaning that there is heterogeneity.
20 Centre for Research on Financial Markets & Policy, KBA
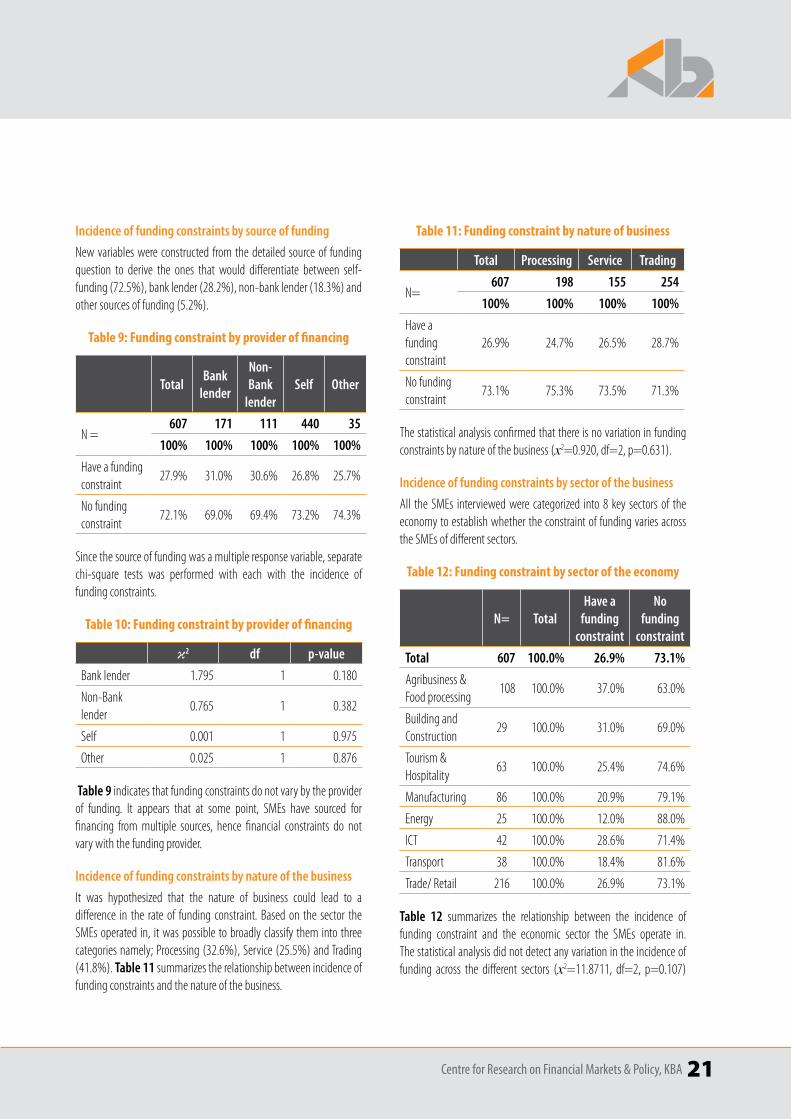
Incidence of funding constraints for SMEs
It was important to establish what proportion of SMEs in Kenya faces a funding constraint, either in terms of access or in terms of cost.
Figure 7: Incidence of funding-related constraints
34% Have a funding constraint
73% No funding
constraint
Slightly above a quarter (27%) of the SMEs reported a funding constraint.
Incidence of funding constraint by type of funding
An analysis of the SMEs funding revealed that, most of the funding was either by debt or by personal savings. There were very few mentions of equity financing (2%) as seen in Figure 4. Therefore, for the purposes of this study, the type of funding was grouped into debt and non-debt financing. 41.5% had some form of debt financing while 74% had
non-debt financing. These two groups were not mutually exclusive since about a quarter (24%) had multiple sources of funding that would span across the two categories. Therefore separate chi-square analyses were conducted for the two groups to test whether the source of funding predisposes an SME to a funding constraint.
Table 8: Funding constraint by type of financing
TotalDebt
FinancingNon-Debt Financing
N=607 252 449
100% 100% 100%
Have a funding constraint 27.9% 31.3% 26.9%
Does not have a funding constraint
72.1% 68.7% 73.1%
The analysis indicated that those SMEs that sourced for credit to finance their businesses were more likely to mention a funding constraint (х2=4.051, df=1, p=0.035) as opposed to those who did not source for credit (х2=0.008, df=1, p=0.929). This may be explained by the fact that those who have sought for credit may not have had any other source of funding and hence settled for borrowing. Since initial findings indicated that cost of credit is the biggest driver of funding constraint, those with debt financing have had this experience. Those who had other sources of financing like personal savings do not suffer from ‘cost of credit’ challenges.
Centre for Research on Financial Markets & Policy, KBA 21
Incidence of funding constraints by source of funding
New variables were constructed from the detailed source of funding question to derive the ones that would differentiate between self-funding (72.5%), bank lender (28.2%), non-bank lender (18.3%) and other sources of funding (5.2%).
Table 9: Funding constraint by provider of financing
TotalBank
lender
Non-Bank
lenderSelf Other
N =607 171 111 440 35
100% 100% 100% 100% 100%
Have a funding constraint
27.9% 31.0% 30.6% 26.8% 25.7%
No funding constraint
72.1% 69.0% 69.4% 73.2% 74.3%
Since the source of funding was a multiple response variable, separate chi-square tests was performed with each with the incidence of funding constraints.
Table 10: Funding constraint by provider of financing
κ2 df p-value
Bank lender 1.795 1 0.180
Non-Bank lender
0.765 1 0.382
Self 0.001 1 0.975
Other 0.025 1 0.876
Table 9 indicates that funding constraints do not vary by the provider of funding. It appears that at some point, SMEs have sourced for financing from multiple sources, hence financial constraints do not vary with the funding provider.
Incidence of funding constraints by nature of the business
It was hypothesized that the nature of business could lead to a difference in the rate of funding constraint. Based on the sector the SMEs operated in, it was possible to broadly classify them into three categories namely; Processing (32.6%), Service (25.5%) and Trading (41.8%). Table 11 summarizes the relationship between incidence of funding constraints and the nature of the business.
Table 11: Funding constraint by nature of business
Total Processing Service Trading
N=607 198 155 254
100% 100% 100% 100%
Have a funding constraint
26.9% 24.7% 26.5% 28.7%
No funding constraint
73.1% 75.3% 73.5% 71.3%
The statistical analysis confirmed that there is no variation in funding constraints by nature of the business (х2=0.920, df=2, p=0.631).
Incidence of funding constraints by sector of the business
All the SMEs interviewed were categorized into 8 key sectors of the economy to establish whether the constraint of funding varies across the SMEs of different sectors.
Table 12: Funding constraint by sector of the economy
N= TotalHave a
funding constraint
No funding
constraint
Total 607 100.0% 26.9% 73.1%
Agribusiness & Food processing
108 100.0% 37.0% 63.0%
Building and Construction
29 100.0% 31.0% 69.0%
Tourism & Hospitality
63 100.0% 25.4% 74.6%
Manufacturing 86 100.0% 20.9% 79.1%
Energy 25 100.0% 12.0% 88.0%
ICT 42 100.0% 28.6% 71.4%
Transport 38 100.0% 18.4% 81.6%
Trade/ Retail 216 100.0% 26.9% 73.1%
Table 12 summarizes the relationship between the incidence of funding constraint and the economic sector the SMEs operate in. The statistical analysis did not detect any variation in the incidence of funding across the different sectors (х2=11.8711, df=2, p=0.107)
22 Centre for Research on Financial Markets & Policy, KBA
even though a number of sectors over and under indexed against the overall average. This essentially means that no sector is affected by funding constraints more than the other; hence to tackle any funding issue, sectoral bias is not necessary as per this study. Enterprises have also learnt to manage their risks hence the funding constraints are also sector blind.
Incidence of funding constraints by locality of the business
By the virtue of the fact that different SMEs are located in different areas of the country, it was interesting to find out whether this affects SMEs which face more or less of the funding constraint. The locality variable was captured directly from the areas where the interviews were conducted as had been shown in Table 2. The areas were grouped into Main City (19.1%), Other Cities (31.6%), Major Towns (19.8%) and Peri-Urban areas (29.5%). Table 13 shows the results.
Table 13: Funding constraint by locality of the business
TotalMain City
Other cities
Major towns
Peri-Urban
N=607 116 192 120 179
100% 100% 100% 100% 100%
Have a funding constraint
26.9% 26.7% 25.0% 32.5% 25.1%
No funding constraint
73.1% 73.3% 75.0% 67.5% 74.9%
The chi-square analysis did not detect variation in funding constraints across the various localities (х2=2.552, df=3, p=0.466) even though major towns seem to over index more than the rest of the localities. This signifies the fact that there is a level playing field across the country as far as the development and provision of funding products to SMEs is concerned hence no geographical nuances.
Incidence of funding constraints by size of the business
Following the definition of SMEs adopted for this study in the methodology section, the SMEs were initially stratified into Small (KES 8M to 50M – 71%) and Medium (KES 50M to 100M – 29%) enterprises. The major difference between the two is annual turnover. This study sought to find out whether the size of the business could be associated with the incidence of funding constraint.
Table 14: Funding constraint by the size of the business
TotalSmall
EnterpriseMedium
Enterprise
N=607 431 176
100% 100% 100%
Have a funding constraint
26.9% 26.9% 26.7%
No funding constraint 73.1% 73.1% 73.3%
The statistical analysis did not detect any differentiation between the two groups of SMEs as far as the incidence of funding constraint is concerned (х2=0.003, df=1, p=0.958). These results indicate that small and medium sized businesses experience funding constraints at the same rate. This could be one reason why both groups are widely considered as a single entity. It therefore means despite medium enterprises having more efficient operations and risk management strategies, this is not linked to whether or not they would have a funding constraint.
Incidence of funding constraints by duration of operation
Different businesses have been in operation for a varied number of years. About 40.7% of SMEs have been in operation for less than 5 years while the rest (59.3%) have been in operation for over 5 years. It could be hypothesized that businesses that have been in operation for a longer period of time would have gone through business performance cycles making them less susceptible to funding constraints.
Further analysis was done to test whether SMEs that have been in operation for less than 5 years are likely to suffer from funding constraints more than those that have been in operation for a longer period of time.
Table 15: Funding constraint by the duration of operation
TotalUp to 5 years
5 years and above
N=607 247 360
100.0% 100.0% 100.0%
Have a funding constraint
26.9% 25.1% 28.1%
No funding constraint 73.1% 74.9% 71.9%
Centre for Research on Financial Markets & Policy, KBA 23
Table 15 shows the results. However, the statistical test did not detect any difference in the incidence of funding constraints by duration of operation (х2=0.651, df=1, p=0.475). Surprisingly, it appears that some businesses irrespective of how long they have been in operation they still would have the same funding challenges over the years.
3.1.3 SMEs, sustainable practices and sustainable finance
The third objective was dedicated to relative new concept to SMEs in Kenya; SME sustainability and its relation to access to finance. A review of literature revealed that most SMEs especially in the developed world have been encouraged to adopt sustainability practices, not necessarily as an avenue to improve chances of accessing funds from financial institutions. However, financial institutions are increasingly putting in place mechanisms of incentivising SMEs to embed sustainability in their business models. The literature seems to suggest that the concept of sustainable finance is a financial institution (supply side) idea that will allow them inculcate the concept amongst their customers. On their part, SMEs (demand side) would consider a sustainability model not necessarily as a basis for accessing funding, even though such considerations could lead to ease of access of funds from institutions that subscribe to sustainable finance principles.
Awareness of sustainability practices for SMEs
The respondents were presented by a description of what sustainability is and were asked to indicate their level of awareness of the issue.
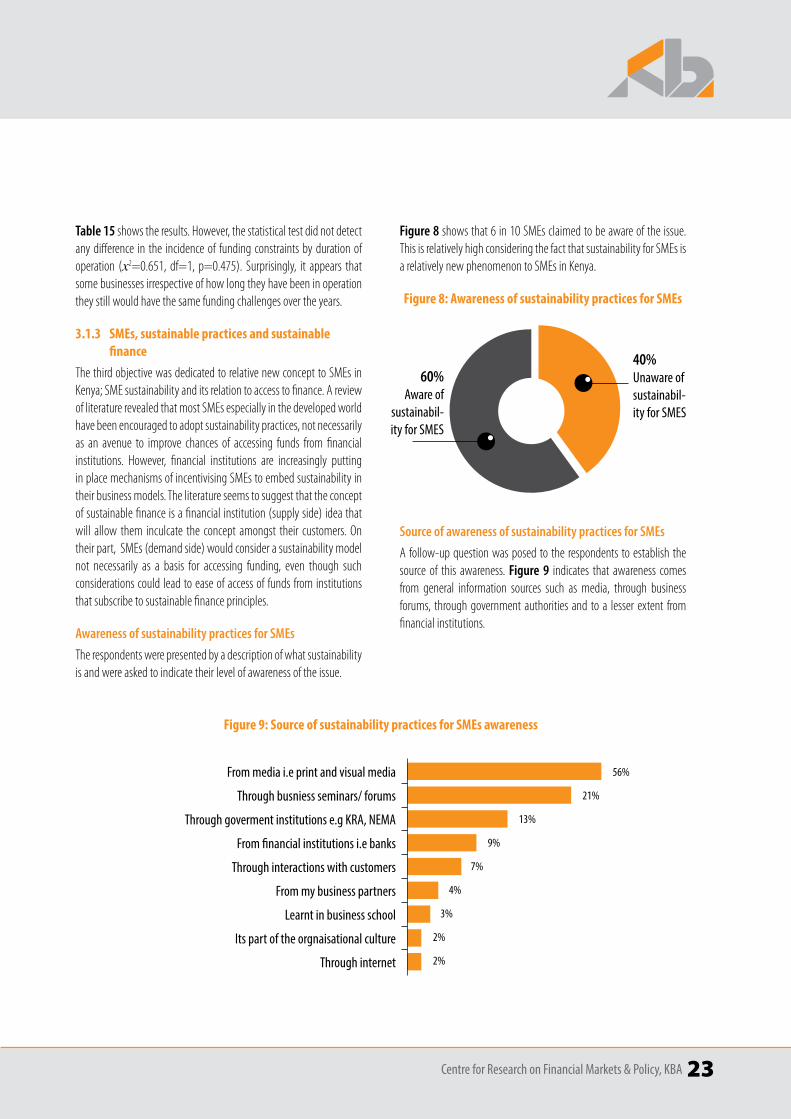
Figure 8 shows that 6 in 10 SMEs claimed to be aware of the issue. This is relatively high considering the fact that sustainability for SMEs is a relatively new phenomenon to SMEs in Kenya.
Figure 8: Awareness of sustainability practices for SMEs
40% Unaware of sustainabil-ity for SMES
60% Aware of
sustainabil-ity for SMES
Source of awareness of sustainability practices for SMEs
A follow-up question was posed to the respondents to establish the source of this awareness. Figure 9 indicates that awareness comes from general information sources such as media, through business forums, through government authorities and to a lesser extent from financial institutions.
Figure 9: Source of sustainability practices for SMEs awareness
From media i.e print and visual media
Through busniess seminars/ forums
Through goverment institutions e.g KRA, NEMA
From financial institutions i.e banks
Through interactions with customers
From my business partners
Learnt in business school
Its part of the orgnaisational culture
Through internet
56%
21%
13%
9%
7%
4%
3%
2%
2%
24 Centre for Research on Financial Markets & Policy, KBA
These results have present key implications. First media-based awareness in part suggests that some SMEs may have reacted to the sustainability issue as a general knowledge topic rather than a deliberate institutionalized process and business model. For example, the importance of the environment or giving back to the community is a very common topic. The same could be said for awareness emanating from SMEs interaction with government authorities. For example KRA requiring SMEs to be tax compliant or NEMA requiring environmental management practices may not necessarily indicate that SMEs have adopted sustainability as a business model.
Secondly, awareness from business forums and from financial institutions suggests that some SMEs have been exposed to the correct concepts of sustainability and hence their awareness is valid.
Therefore while claimed awareness is high at 60%, not all of it can be attributed to awareness of the correct concept of sustainability.
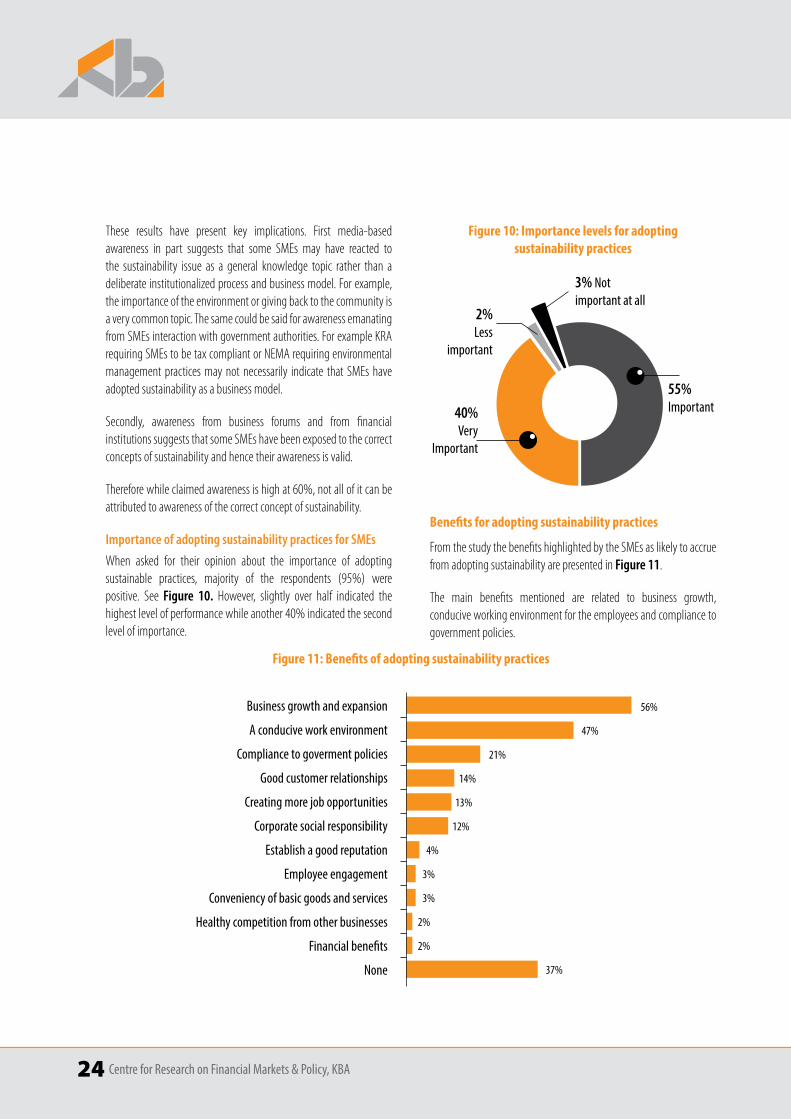
Importance of adopting sustainability practices for SMEs
When asked for their opinion about the importance of adopting sustainable practices, majority of the respondents (95%) were positive. See Figure 10. However, slightly over half indicated the highest level of performance while another 40% indicated the second level of importance.
Figure 10: Importance levels for adopting sustainability practices
55% Important40%
Very Important
2% Less
important
3% Not important at all
Benefits for adopting sustainability practices
From the study the benefits highlighted by the SMEs as likely to accrue from adopting sustainability are presented in Figure 11.
The main benefits mentioned are related to business growth, conducive working environment for the employees and compliance to government policies.
Figure 11: Benefits of adopting sustainability practices
Business growth and expansion
A conducive work environment
Compliance to goverment policies
Good customer relationships
Creating more job opportunities
Corporate social responsibility
Establish a good reputation
Employee engagement
Conveniency of basic goods and services
Healthy competition from other businesses
Financial benefits
None
56%
47%
21%
14%
13%
12%
4%
3%
3%
2%
2%
37%
Centre for Research on Financial Markets & Policy, KBA 25
It’s interesting, but not surprising, that SMEs are not able to see the linkage between adopting sustainable practices and access to funding. In some way, business growth can translate to financial benefits. Another 37% actually did not see any benefits that would accrue as a result of being sustainable. This calls for efforts towards sensitising SMEs on the importance of adopting sustainable business models.
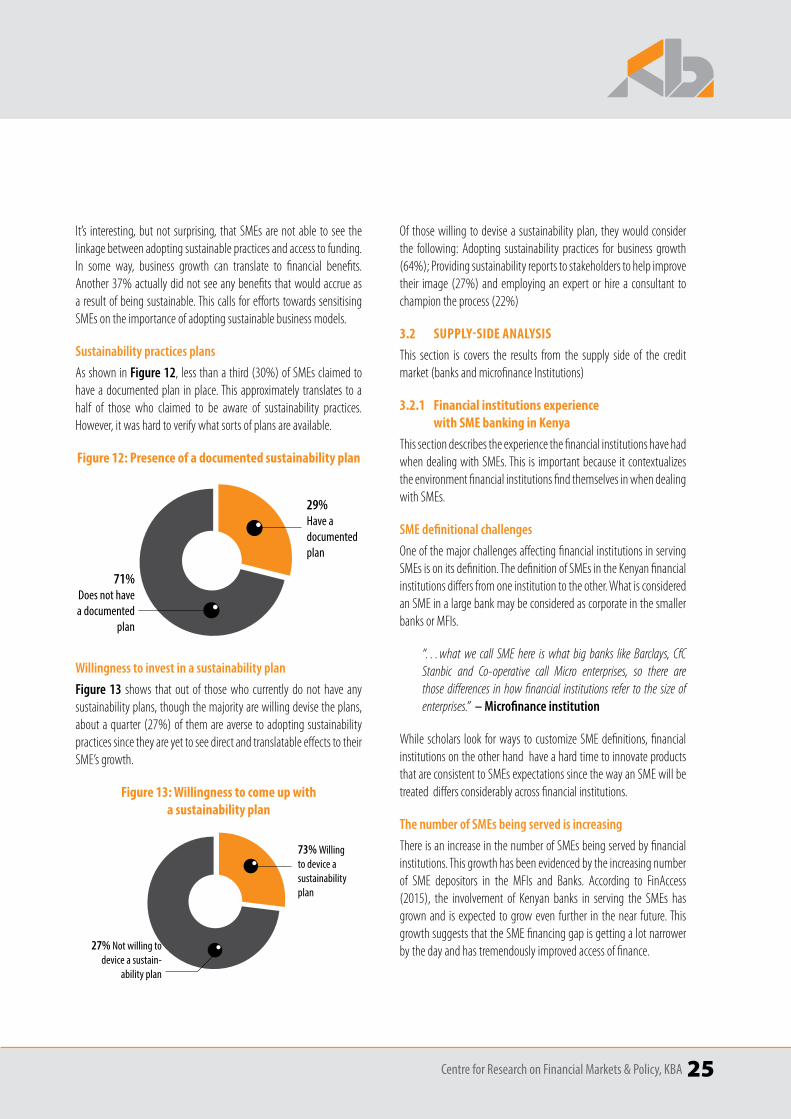
Sustainability practices plans
As shown in Figure 12, less than a third (30%) of SMEs claimed to have a documented plan in place. This approximately translates to a half of those who claimed to be aware of sustainability practices. However, it was hard to verify what sorts of plans are available.
Figure 12: Presence of a documented sustainability plan
29% Have a documented plan
71% Does not have a documented
plan
Willingness to invest in a sustainability plan
Figure 13 shows that out of those who currently do not have any sustainability plans, though the majority are willing devise the plans, about a quarter (27%) of them are averse to adopting sustainability practices since they are yet to see direct and translatable effects to their SME’s growth.
Figure 13: Willingness to come up with a sustainability plan
Of those willing to devise a sustainability plan, they would consider the following: Adopting sustainability practices for business growth (64%); Providing sustainability reports to stakeholders to help improve their image (27%) and employing an expert or hire a consultant to champion the process (22%)
3.2 SuPPLY-SIDE ANALYSISThis section is covers the results from the supply side of the credit market (banks and microfinance Institutions)
3.2.1 Financial institutions experience with SME banking in Kenya
This section describes the experience the financial institutions have had when dealing with SMEs. This is important because it contextualizes the environment financial institutions find themselves in when dealing with SMEs.
SME definitional challenges
One of the major challenges affecting financial institutions in serving SMEs is on its definition. The definition of SMEs in the Kenyan financial institutions differs from one institution to the other. What is considered an SME in a large bank may be considered as corporate in the smaller banks or MFIs.
“…what we call SME here is what big banks like Barclays, CfC Stanbic and Co-operative call Micro enterprises, so there are those differences in how financial institutions refer to the size of enterprises.” – Microfinance institution
While scholars look for ways to customize SME definitions, financial institutions on the other hand have a hard time to innovate products that are consistent to SMEs expectations since the way an SME will be treated differs considerably across financial institutions.
The number of SMEs being served is increasing
There is an increase in the number of SMEs being served by financial institutions. This growth has been evidenced by the increasing number of SME depositors in the MFIs and Banks. According to FinAccess (2015), the involvement of Kenyan banks in serving the SMEs has grown and is expected to grow even further in the near future. This growth suggests that the SME financing gap is getting a lot narrower by the day and has tremendously improved access of finance.27% Not willing to
device a sustain-ability plan
73% Willing to device a sustainability plan
26 Centre for Research on Financial Markets & Policy, KBA
The growth of SMEs being served by financial institutions has been driven by:
• Accessibility of financial institutions and services
Financial institutions (banks and MFIs) have branches in areas where small to medium size business are growing. This has driven SME’s to bank or do financial transactions with them. Mobile and internet banking has made financial services and products easily accessible. This has enhanced financial inclusion for SMEs hence the increased number of SMEs being service by financial institutions.
“..SMEs and other customers are able to access financial products because of the increase in mobile phones and internet usage and this has also increased financial inclusion” – Small size bank
• Financial institutions embracing more SME banking
Large and medium size banks have now narrowed down to SME banking from corporate and retail banking. This has made SMEs embrace banking provided by these banks hence an increase in the number of SMEs being served by banks.
“...initially we dwelt more on corporate banking but now we have narrowed down to medium even the small enterprises, we have products and services for them too.” – Small size bank
• SMEs specific financial products
Financial institutions have innovated products that suit the specific financial needs of SMEs. This has attracted SMEs hence the increased number of SMEs being served.
“…we are trying to better serve them by coming up with products that suit their needs but the problem is they are so dynamic and not easy to predict …” – Medium size bank
• Marketing activities
There are increased marketing activities by financial institutions among SMEs that have made them embrace banking and enjoy the financial facilities provided by the financial institutions. These include advertisements and marketing campaigns both in the traditional and new (social) media.
“… There are many marketing activities the bank involves in even walking to the SMEs and telling them about the products we have in range for them...” – Microfinance institution
3.2.2 Challenges faced by financial institutions when dealing with SMEs
In serving the SMEs, financial institutions face a myriad of problems. The following challenges were mentioned. They provide in depth analysis of where SMEs fall short of the financial institutions expectations
• Lack of financial management skills
Most SMEs have little knowledge on the importance of proper financial management and record keeping. They rarely keep consistent financial records. This is a challenge to the financial institutions especially when the documents are requested for.
“…you find somebody is doing some good business for sure but they don’t maintain financial records; they don’t know what their income or profit is; they don’t have financial records for you to analyze and know whether they qualify for a loan or not…” – Microfinance institution
“…most SMEs do not keep proper records that can be relied upon to do a proper assessment of the business in terms of its current status and growth opportunities…” – Small size bank
• SMEs have unpredictable business operations
SMEs are unpredictable and inconsistent in terms of their business operations. It is hard to keep track of the business because of the dynamism and flexibility to change the type of business or introduce new businesses lines to their already existing business is very high. They are able to close their current business and start a different business line. This dynamism has posed a challenge to financial institutions tracking of their business and serving them.
“…It’s becoming very hard to predict SME businesses. You find that someone is going to take a loan to finance a tender but they actually take it to add stock…” – Medium size bank
“..Today he is doing spare parts business and tomorrow he has closed shop and he is doing something different, which is a challenge to us…” – Microfinance institution
Centre for Research on Financial Markets & Policy, KBA 27
• Most SMEs are Multi-bankedSMEs hold several bank accounts with different banks and/or financial institutions. This poses a challenge of tracking their financial capability and strength and sometimes this leads to loan defaulting. There are many financial institutions offering credit facilities and SMEs have taken advantage of this hence multi-borrowing
“…one of the challenges is multi-banking, they have accounts with several other banks and as such our capacity to manage them is a challenge…” – Large size bank
“…Basically we have so many institutions that are offering credit facilities, so most of the SMEs are borrowing from more than one institution and the repayment of this facility is becoming a burden hence the default rate has increased tremendously…” – Large size bank
• Some SME owners are not technologically savvyThe banking sector is modernizing rapidly and technology is at the center of this growth. Most SMEs owners have little knowledge on the technological advancement in the banking sector. For example, most find it challenging to fill online requirements or read materials shared with them online.
“…Sometimes you want them to check emails and some newsletters that you send. Most of them don’t have the ability to operate computers to do so online, so they must come here…” – Small size bank
• SMEs operate in very many different sectors of the economy
SMEs are all very unique in their business operations. There are those in agriculture, manufacturing and service delivery. These differences make it difficult to appraise them all under a common base or make a product that will suit all
“..You know SMEs are varied in their areas of business operation and that alone makes it difficult to tailor make a product that will suit them all...” – Microfinance institution
3.2.3 Factors considered before providing an SME with a financial product
There are several factors that are important to financial institutions when it comes to appraising SMEs for eligibility of a banking lending product. They are as follows;
• The size of the businessFinancial institutions use parameters like the annual turnover of SMEs, to estimate the business size. In some banks, there are different marketing teams assigned to businesses of different sizes as part of their internal marketing strategies. This has been a challenge because some SMEs do not keep proper business records that would aid in estimating the turnover.
“…we have to know the size of the business. Is it a micro enterprise? Is it a medium, small or large? That really matters.” – Large size bank
• The type of business the SME is engaged inThe business specialization of SMEs determines the type of product it will targeted with from financial institutions. While some SMEs deal in service business others are in products offering, manufacturing or processing, there are specific products for the different categories.
“…this financial organization has to assess the type of business one is doing, although we finance even individuals for things like tanks or assets like land and vehicles…” – Microfinance institution
• Business need Different SMEs have different business and/or financial needs. These needs may also vary within the same SME depending on the most pressing business issue at a particular moment.
Financial Institutions have devised specific financial products for specific needs. With the need identified, it is possible for a financial institution to recommend an already existing product.
“..Our products are specific to business needs. However the dynamism among SMEs has made it difficult to tailor products for specific SME needs...” – Large size bank
28 Centre for Research on Financial Markets & Policy, KBA
• Affordability
Financial institutions consider the affordability of their products before offering them to SMEs. While some products may be suitable for SMEs, they may not be affordable.
“…not all SMEs are able to afford financial products from banks or microfinance institutions. Loans of a certain amount demands high criteria for qualification to acquire them and this is a challenge for them…” – Small size bank
• Legal Business Requirements It is a legal requirement for SMEs to have legal business documents like certificates of registration and tax documents. Others like financial statements are also needed. Some financial institutions have sustainability frameworks that SMEs have to qualify like being conscious of the environment, having the needed expertise in the area of business operation and among others, the economic power of the SMEs.
“…We look at the documents that are needed to verify whether they are eligible or qualify for the products. For instance, what is their economic power i.e. their capability to repay the loan. Other normal documents like tax, whether they are registered or not etc. Such things matter before we give loans or other financial products...” – Large size bank
3.2.4 Financial institutions and sustainable finance for SMEs
• Sustainability in the financial sectorAccording to Kariuki (2015) sustainability in the financial sector is necessary due to the fact that the sector plays a key role in national development. The financial sector is an enabling factor in financing investments in the sectors of the economy that have impact on social and environmental wellbeing such as agriculture, manufacturing, infrastructure, energy, mining etc. As such, there is need to adopt sustainable finance strategies to ensure that those establishments that banks interact with are also sustainable.
In early December 2015, the Kenyan banking industry adopted the Sustainable Banking principles as designed by the Kenya Bankers Association (KFW DEG, 2015).Through the Sustainable
Financing Initiative, KBA highlighted three key priorities. These are, comprehensive risk management, business practice, leadership and governance and growth through inclusivity, innovation and technology. Within these priorities, guiding principles and associated best practice standards were established. Below is a list of the industry guiding principles.
� Principle 1: Financial returns versus Economic viability
� Principle 2: Growth through inclusivity and Innovation
� Principle 3: Managing and Mitigating Associated Risks
� Principle 4: Resource scarcity and choice
� Principle 5: Business Ethics and Values
• Challenges of financial institutions engaging SMEs with sustainability requirementsKariuki (2015), highlight the constraints banks have when it comes to adopting sustainable finance practices. Some of the highlighted challenges include the absence of internal capacity to understand the impact of sustainability to its clients, lack of consistency in enforcement of laws related to sustainable finance and lack of sector-specific guidelines to identify and manage risks related to sustainability.
The following section attempts to provide the constraints financial institutions have when adopting sustainable practices specifically for SMEs.
• Sustainability is still not yet embraced by MFIsThe fact that the Sustainable Finance Initiative targeted banks, MFIs have been left behind as far as sustainability is concerned. Even though SME borrowing from non-bank institutions is low,
There is a risk that if banks tighten sustainability requirements, despite its advantages, SMEs may result to solutions that may not require compliance to sustainability regulations.
• Sustainability is still not well understood by SMEsSMEs have not yet embraced the concept of sustainability to its entirety. Key informants asserted that the concept of sustainable financing has not been well understood by most SMEs.
Centre for Research on Financial Markets & Policy, KBA 29
“…I would say a number of SMEs understand the concept of sustainability but there is also a big number that don’t. But what is encouraging is that they listen and they are ready to learn to improve their businesses, what we need to do is reach out to them and they will do as we say…” – Large size bank
• Lack of sustainable finance knowledge by sales representativesThere were reported cases of banks lacking personnel /sales representatives who are trained in sustainable finance. Most financial institutions’ representatives are fresh graduates who may not be knowledgeable on the products or services that suits the SMEs. Some of these representatives may not be well versed with the concept of sustainability and sustainable finance.
“…most of the people dealing with the SMEs are the fresh graduates who may not be well versed with the operational requirements of the SMEs and other technical business requirements of the SMEs this hinders the implementation of the sustainable framework..” – Medium size bank
• Financial institutions inadequately engaging SMEs on sustainabilityFinancial institutions have not adequately engaged SMEs on the issue of sustainability. This has lagged the implementation of
the practices among SMEs. This could be part of the reason why sustainability and sustainable finance is not properly understood by SMEs.
“…I must say we in the financial sector have not engaged the SMEs adequately on the issues of sustainability as much as we have the framework, this is an area we have failed and we need to rise to the occasion...” – Medium size bank
• Inadequate compliance by the SMEsMany SMEs are not complying with the need to be sustainable. This has posed a challenge for the implementation of sustainable business financing. For example it has been observed that there is lack of will from SMEs when called upon by financial institutions to attend training programs on financial management and sustainable business practices.
“…Most SME owners would rather be at their business than come to these trainings even if they are beneficial to their business; they are always driven by the cost benefit principle in that if they attend what does that add to their income or business on that day...” – Large size bank

30 Centre for Research on Financial Markets & Policy, KBA
Centre for Research on Financial Markets & Policy, KBA 31
Between cost of credit and access to credit, cost of credit is the biggest challenge and also not both of them. From the demand side the major reason for cost of credit being an important issue is due to the fact that interest and fees is still the most important factor considered when seeking financing. Secondly, in the recent past, banks have increased their interest rates following the frequent changes in the KBRR by thye regulator as the macroeconomic factors change. Finally, the APR awareness is low meaning that SME owners are not aware that they can explore borrowing alternatives by knowing the total cost of credit from different suppliers.
Financial institutions need to address the issue of cost of credit for SMEs, first by reinforcing the use of APR. Banks also need to innovate ways of reducing credit costs to SMEs.
HOMOgENEITY OF FuNDINg CONSTRAINTSOne way to formulate effective policy recommendations on funding constraints for SMEs is to understand whether SMEs are segmented in a manner that differentiates the SMEs on the incidence of funding constraints. This study established that funding challenges do not vary by the various classification systems of SMEs, whether by locality, provider of funding, duration of operation, sector of the economy and so no. It should be noted that other types of constraints may vary by these SME classifications.
The implication here is that, financial challenges are homogenous across the different SME classifications. Therefore any strategies
adopted by financial institutions to solve financial constraints may not necessarily require customization for different classifications of the SMEs. Once SME financial needs are identified, products and solutions may be designed irrespective of SMEs differentiations in terms of firmographics.
SuSTAINABLE FINANCE AND SMES SuSTAINABILITYThe issues of sustainable finance and SME sustainability are still new in Kenya, both on the demand and supply sides of SME financing. Efforts and especially on banks have been made to make them adopt sustainable finance faster.
The biggest challenge on sustainable finance is that sustainability is still a new phenomenon for SMEs. SMEs may not see any immediate need to adopt sustainable practices notwithstanding that majority of them are not aware of what sustainability is, how to implement it in their organizations and what financial benefits they may accrue by adopting the strategy.
While there are many stakeholders interested in developing sustainability programs for SMEs in Kenya, banks should take a leading role in sensitizing SMEs on the importance of sustainability and how this may affect them in future should sustainability become a lending qualification criteria from banks. This is because banks in Kenya are now focusing on sustainability more than any other stakeholder dealing with SMEs.
ConclusionsChapter 4
SMES FuNDINg CHALLENgE
The study findings indicate that SMEs face many challenges. Financial challenges are not the main ones mainly because most SMEs utilize self-funding options to start or grow the business. However, a substantial number of them still face financial challenges.
32 Centre for Research on Financial Markets & Policy, KBA
1. Davis, C. and O’Halloran, T. (2013). Needs of SMEs to Advance on the Sustainability Path, Developing Sustainable Regions Through Responsible SMEs (DESUR).
2. FSD Kenya. (2015). FinAccess Business – Supply: Bank Financing of SMEs in Kenya.
3. Global Reporting Initiative (2014). Ready to Report? Introducing Sustainability Reporting for SMEs.
4. Kariuki, F. (2015). Sustainability in the Financial Sector in Kenya. Working paper series, KBA Center for Research on Financial Markets and Policy.
5. Kashangaki, J. (2014). Transforming SME Finance. Project Briefing Note 1, GrowthCap/FSD Kenya.
6. Katua, D.T. (2014). The Role of SMEs in Employment Creation and Economic Growth in Selected Countries, International Journal of Education and Research, Vol 2, No.12
7. KBA (2014). Banks Adopt Annual Percentage Rate Calculation Method for Consumer Loans.
8. KFW DEG. (2015). DEG Supports Sustainability Guidelines for Kenyan Banks.
9. Miller, M.M and Nyauncho, E (2014). State of Practice of SME banking. GrowthCap/FSD Kenya.
10. Network for Business Sustainability. (2013). SME Sustainability Challenges 2013, SMEs Can’t Go it Alone.
11. Njoroge, L and Ouma S (2014) Determinants of Bank Expansion in the East African Community: An Empirical Analysis of Kenyan Banks KBA Working Paper Series (WPS/04/14) March
12. Nyaga, C. N. (2013). Non-Financial constraints hindering the growth of SMEs in Kenya. The case of plastic manufacturing companies in industrial area in Nairobi County (Unpublished Master’s Thesis). Kenyatta University.
13. OECD (2006). The SME financing gap. Theory and evidence. Volume I. OECD Publishing.
14. Quader, S.M (2009). Constraints to SME: A Factor Analysis approach. South Asian Studies, Vol 24. No.2, pp 334-350.
15. Quaye, I, et. Al. (2014). Bridging the SME financing gap in Ghana: The role of Micro Finance Institutions. Open Journal of Business and Management. Published Online, October 2015.
16. Slaper, T. F. and Hall, T. J. (2011). The Triple Bottom Line. What it is and How does it Work?
REFERENCES

Centre for Research on Financial Markets & Policy, KBA 33

Kenya Bankers Association13th Floor, International House, Mama Ngina StreetP.O. Box 73100– 00200 NAIROBITelephone: 254 20 2221704/2217757/2224014/5Cell: 0733 812770/ 0711 562910Fax: 254 20 2221792Email: [email protected]: www.kba.co.ke