financing the schools in montgomery county, virginia
TRANSCRIPT

Financing the Schools in Montgomery County, Introduction i
Financing the Schools in Montgomery County, Virginia
A Study Conducted by
The League of Women Voters of Montgomery County, VA
Introduction The Montgomery County League of Women Voters approved a study of financing for the Montgomery County Public Schools at its annual meeting on May 9, 2018. League members Mary Houska and Wayne “Dempsey” Worner are co-directors of the study. The study addresses the following questions:
1. Is state funding of public education adequate and equitable, and how does it impact funding Montgomery County schools?
2. Has the Montgomery County School Board prepared budgets and has the Board of Supervisors funded budgets that accurately reflect school needs?
3. Are properties in Montgomery County taxed equitably to reflect an appropriate balance of tax revenues from commercial and residential properties?
4. Has the Montgomery County School Board created mechanisms that guarantee equal access to quality programs for all students attending the public schools in the County?
The planned completion date for the study was April 2019 for presentation to the League's May 2019 Annual Meeting. Over the summer and fall of 2018:
• Meetings were held with representatives of the Montgomery County School Division, the Board of Supervisors, the Commissioner of Revenue’s Office, the Virginia Tech Educational Foundation, and two members of the Virginia General Assembly;
• Members of the Montgomery County LWV were invited to join the study group;
• Data sources included (1) reports prepared by the Virginia Department of Education; (2) reports prepared by the Commonwealth Institute for Fiscal Analysis; (3) the Montgomery County Schools Budget and Annual Report documents; (4) the Montgomery County Budget; (5) the Virginia Education Association; (6) Joint Legislative Audit and Review Commission (JLARC) reports; and others.
Extending the Study Completion Date As the 2018 came to a close, a number of factors kept the study from being completed in 2019 including the likelihood that actions by the 2019 General Assembly could impact the findings and the challenge of analyzing data sets with different reporting schedules. A
decision was made to delay the completion of the report until the spring of 2020. Prior to release of a League sponsored study to the public, the members must approve the report. For

Financing the Schools in Montgomery County, Introduction ii
a study to be considered by the membership at its annual meeting, members must receive copies of the report at least two weeks prior to the annual meeting. As it turned out, none of these scheduling issues were of much significance due to the coronavirus outbreak. The report is now scheduled for review by League membership at its annual 2020 meeting in July. Although the extent to which public education will suffer as a result of the economic and social impacts of COVID-19 is unknown, the facts and conclusions compiled in this study give insight into state and local funding and commitment to education that will continue to determine the quality of public schools in Montgomery County.
End of a Chapter The history of public education is replete with incidents that have changed its nature and character. Nationally, World Wars, Brown vs. Board of Education, Sputnik, Education for Students with Disabilities, and other social/political events have changed our school systems. In the last sixty years, the ill-conceived public policy of “Massive Resistance” and the recession of 2008–09 had a devastating impact on Virginia’s public schools.
This report serves as a marker for the decade that followed the economic turmoil of 2008–2009. It has taken just over ten years for the Commonwealth to reach a level of school funding that existed pre-recession. No one can predict what the future will hold. Nevertheless, this document is both descriptive and thoughtful. While there are not specific “calls for action”, there is, we hope, information that might provoke conversation about what education should or could be in the next decade.
Acknowledgments We especially want to thank people who gave of their time to this project. To our committee members: Phyllis Albritton, Elva Miller, Jane Sprague, Carol Linker, Bev Fleming, Pat Ceperley, Carolyn Rude, and Gunin Kiran; Montgomery County School officials Mark Meier, Tommy Krantz, Lois Graham, Anne Whitaker, and their colleagues; County officials Craig Meadows, Helen Royal and her staff, and VT Foundation CEO John Dooley.
A special thanks to our Virginia Tech colleagues, Professor David Alexander and Professor Emeritus Richard Salmon, for their contributions, insights, and editing, and to others who provided advice and counsel. We alone take responsibility for the content of the report. We hope it will serve some useful purpose.
Mary Houska
Wayne “Dempsey” Worner

ductionFinancing the Schools in Montgomery County, Part I: State Funding, Executive Summary 1
Part I: State Funding, Executive Summary Part I of the Montgomery County School Finance Study examines these questions:
1. Who is responsible for K12 public education in Virginia?
2. Who funds K12 public education in Virginia?
3. Is a quality K12 public education system a priority in the Commonwealth?
4. What is “Quality”?
5. Does the state fund K12 public education adequately?
6. Is the current state funding system of K12 public education equitable?
Who is responsible for K12 public education in Virginia? K12 public education is a state function. Unfortunately, the State Constitution does not require that the state provide a high-quality education for its students—only that the General Assembly “shall seek to ensure that an educational program of high quality is established and continually maintained.”
Who funds K12 public education in Virginia? K12 public education is funded in part by the General Assembly; a larger portion (about 55%) is provided by local governments. A very small portion (4%–6%) comes from federal funds.
Is a quality K12 public education system a priority in the Commonwealth? Politicians claim that K12 public education is a priority. The evidence, however, is less convincing. While Virginia’s per capita personal income ranks 11th in the nation, the state ranks 42nd in State Per Pupil Funding of education PreK through 12.
What is “Quality”? Quality is in the eye of the beholder. However, the Standards of Quality (SOQs), which all school systems must meet or exceed, are more accurately standards of mediocrity. Every municipality in Virginia spends much more than would be required by the SOQs. In fact, statewide, local governments spend twice (an additional $4 billion) the amount required under the standards.
Does the state fund K12 public education adequately? Local school boards and their city councils or boards of supervisors approve expenditures that far exceed the misnamed Standards of Quality. Some personnel necessary to assure the health and safety of students are not included as a part of the SOQ formula for school funding. None of those positions and no school construction are funded by the state.
Is the current state funding system of K12 public education equitable? While there is an effort to differentiate state funding to local school divisions based upon the wealth of the municipality, the largest portion of the state funding is distributed only insofar as it addresses the SOQ requirements. The excess required to operate the school division (and construct facilities) is the responsibility of the local municipality. There is a 10:1 differential in the capacity of local municipalities to raise comparable dollars per student through local taxation. The quality of the public school systems in Virginia depends upon your zip code.

Financing the Schools in Montgomery County, Part I: State Funding 2
Part I: State Funding
Funding of Public Schools in America Because the United States Constitution is silent on the matter of public education, the responsibility for education was left to the several states. Consequently, the creation, operation, and funding of public schools differ among the 50 states and, to some extent, among the nearly 15,000 school districts in the nation. The United States is different from almost every other country in the world in that we have a decentralized system of education while most other countries operate a national system. This system illustrates why cross-country comparisons of student performance indicators are suspect.
Up until the 1950s, the federal government had little involvement financially or otherwise in state and local school system operations save for some support of vocational agriculture and related programs. In the decade of the ’50s, two major events changed that relationship: (1) Brown v. Board of Education ended the “separate but equal” standard that resulted in separate school systems for black and white students in many states; and (2) The Russian launch of Sputnik created a sense of “national emergency.” Shortly thereafter, Congress approved the National Defense Education Act (NDEA), which provided funds to support expanded programs in science and mathematics. In the 1960s that involvement was expanded by passage of the Elementary and Secondary Education Act (ESEA).
Subsequently, federal legislation supporting educational services for special needs students, requiring equity between men’s and women’s programs and a host of other initiatives, have been implemented. Typically, the full funding promised for many of those programs has not materialized while regulations affecting the operation of schools have increased.
Today, school systems in the United States generally receive about 6–8% of their operating budgets from the federal government. In the main, those federal funds are received by the state to be distributed to local school systems based upon some formula (for example, number of students served). Such funds are typically referred to as “flow-through revenue.”
The FY 2020 approved budget for the Montgomery County School system estimated $4.35 million of federal funding to support specific programs. Most of those funds are targeted to support programs serving: (a) low-income student populations (ESEA $1.96 million) and (b) special education programs (IDEA $2.02 million). Smaller amounts in support of Vocational Education Programs and Medicaid Reimbursement were also anticipated. For the most part, federal funding is earmarked, which is to say that these funds can only be used for the specific purposes for which they were allocated. With one small exception, there are NO federal funds that can simply be added to the school system’s revenue stream and used for purposes determined by the local school board. In addition to the fore-mentioned funds, the federal government provides approximately $2.3 million annually in support of the non-instructional School Nutrition Program, which is held in a separate fund.

Financing the Schools in Montgomery County, Part I: State Funding 3
Public School Funding in Virginia It has already been noted that each state has the responsibility for creating and funding the local school systems. Most states refer to those educational sub-units as “school districts.” However, in Louisiana they are referred to as “parishes”; in Indiana, “school corporations”; and, in Virginia, they are called “school divisions.” In some states, the school districts are independent of any other governmental unit; in others (like Virginia) they are coterminous with local governmental units (i.e., counties and cities). In most states, local school districts are fiscally independent—meaning they have taxing power (though many are limited by statue and/or mechanisms which require local voter approval). The governance of school systems also varies. Some have elected school boards; others have appointed boards.
Virginia has 132 local school divisions; all are fiscally dependent. Montgomery County has an elected school board of seven members, one of 108 school divisions in the state that elect their members. It is, like all other school boards in the Commonwealth, fiscally dependent—meaning that the school division depends on the Board of Supervisors for local funding.
The responsibility for state funding of education is articulated in the 1971 Constitution of the Commonwealth—Article VIII – Education.
Section 1: Public Schools of High Quality to be Maintained. The General Assembly shall provide for a system of free public elementary and secondary schools for all children of school age throughout the Commonwealth and shall seek to ensure that an educational program of high quality is established and continually maintained. [emphasis added]
With regard to the definition of “high quality” the following appears:
Section 2: Standards of Quality: State and Local Support of Public Schools. Standards of quality for the several school divisions shall be determined and prescribed from time to time by the Board of Education, subject to revision only by the General Assembly.
The General Assembly shall determine the manner in which funds are to be provided for the cost of maintaining an educational program meeting the prescribed standards of quality and shall provide for the apportionment of the cost of such program between the Commonwealth and the local units of government comprising such school divisions. Each unit of local government shall provide its portion of such cost by local taxes or from other available funds. [emphasis added]
Imbedded in the language of Section 1 above is the commitment to “seek to ensure an educational program of high quality,” later defined in a Section 2 reference “as an educational program meeting the prescribed standards of quality” (SOQs).

Financing the Schools in Montgomery County, Part I: State Funding 4
This language established the Standards of Quality (SOQs) as the benchmarks to be used in providing an educational program of “high quality”. It was during the General Assembly 1969 debate on Article VIII of the 1971 Constitution that the phrase “seek to” was added to the language offered by the Commission that had drafted a Constitution. That phrase essentially neutralized the commitment to “high quality.” A Roanoke Times editorial (3/26/19) describes the debate that surrounded the Education Article of the 1971 Constitution. (See Attachment 1.) It argues that the addition of that phrase effectively changed the intent of Article VIII, Section 1, from a mandate to an aspiration.
What are the SOQs? The Standards of Quality outline minimum staffing requirements for instruction, administration, and support services; define required instructional programs and learning components; set performance standards (SOLs), accreditation, and other operational functions. State funding is based upon the costs of meeting these minimum standards. For a brief description of the SOQs see Attachment 2. (Taking the Mystery Out of Virginia School Finance, 2nd Edition, Salmon and Alexander, pp 42–43.)
Do the SOQs result in programs of “high quality”? According to a 2019 report from the Commonwealth Institute for Fiscal Analysis, Virginia localities invested $4.2 billion above the required local effort of $3.7 billion for SOQ programs in 2017–2018. No school division in Virginia expended only the required amount in support of their schools. Over one-half of the school divisions invested more than twice of the required local expenditures to fund the SOQs. While the definition of “quality” is in the eye of the beholder, it is clear that citizens in every jurisdiction support an expenditure of local funds to provide programs that exceed the misnamed “Standards of Quality.”
Who pays the bill? Given the reality that the SOQs hardly reflect a standard of quality acceptable to anyone, does the state provide the funds to meet those minimum standards (adequacy)? The short answer is NO! On balance, the state provides just over 40 percent of the operating costs while local taxpayers pick up over 50 percent when local sales tax revenues are included as a local contribution. (Federal funding for earmarked expenses constitutes the remainder).
How much does the state contribute to the funding of schools in Montgomery County? As noted before, the state requires all school divisions to offer programs and services that meet the state prescribed Standards of Quality. The Constitution delegates the responsibility to the General Assembly for determining what share of the cost for implementing those standards will be borne by the state and what part will be borne by the local governmental unit. The proportion or share of the total SOQ costs is, more or less, determined by examining the relative wealth of the local governmental units—in theory an effort to recognize variations in wealth (ability to pay) across the state. Factors used in determining the relative wealth of school divisions include measures of: (a) taxable property valuation, (b) adjusted gross

Financing the Schools in Montgomery County, Part I: State Funding 5
income, and (c) retail sales. These three factors (all weighted differently) are used in computing the Local Composite Index (LCI) which in turn is used to determine what percentage of the SOQs will be funded by the State and what part will be funded by the local government. LCIs generally range between 20% and 80% of the share to be paid by the local government.
Remembering that the state’s support of education is based upon the funding of minimum standards, this formula represents a minor effort to recognize the variations in wealth, albeit redistribution of an inadequate resource. An in-depth discussion of the formula used to determine how state funds are allocated to local school divisions appears in Attachment 3.
Montgomery County LCI. The LCI for Montgomery County is .4005, which ranks at about the middle for all school divisions in the state. Operationally, this means that Montgomery County is expected to pay about 40% of the costs for implementing the Standards of Quality. This suggests that the state is paying 60% of those costs in the county. It should be noted again that the Standards of Quality represent a minimal education program—so much so that every school division in the Commonwealth exceeded the required expenditures for the SOQs. Statewide, local school divisions spent $4.2 billion above the required local expenditures or 113.3% more than required by the SOQs in 2017–18. According to the Commonwealth Institute for Fiscal Analysis, Montgomery County invested 95.6% more than required under the SOQs that same year.
The Montgomery County School budget for FY 2020, estimated the State Foundation Guaranteed funding in support of the SOQs at $51.2 million. In addition to SOQ funding, the local school division expects to receive state funding from other sources in support of specific programs. These funds come in the form of Incentive ($2.6 million) and Categorical funds ($0.6 million). In addition, the County will receive about $4.9 million from Lottery Funds, also in support of specific activities. Total state funding for the FY 2020 is estimated at $59.3 million.
The County School Board approved a FY2020 budget of $116.5 million. Of that, a total of $59.3 million was estimated to come from all state sources. However, approximately $12.2 million of those funds come from locally generated sales taxes but are, nonetheless, counted in the aid formula as a “state contribution.”
If locally generated sales tax revenues are counted as a local contribution, then the state’s contribution falls to $47.1 million (5$9.3 million, the state contribution amount, minus $12.2 million local sales tax). Federal funding was estimated at $4.35 million. This means that the local contribution to the public schools would be $65.0 million or 56% of the budget while the state share would represent slightly more than 40% with the federal government contributing a little less than 4%.
Financing the Schools in Montgomery County, Part I: State Funding 6
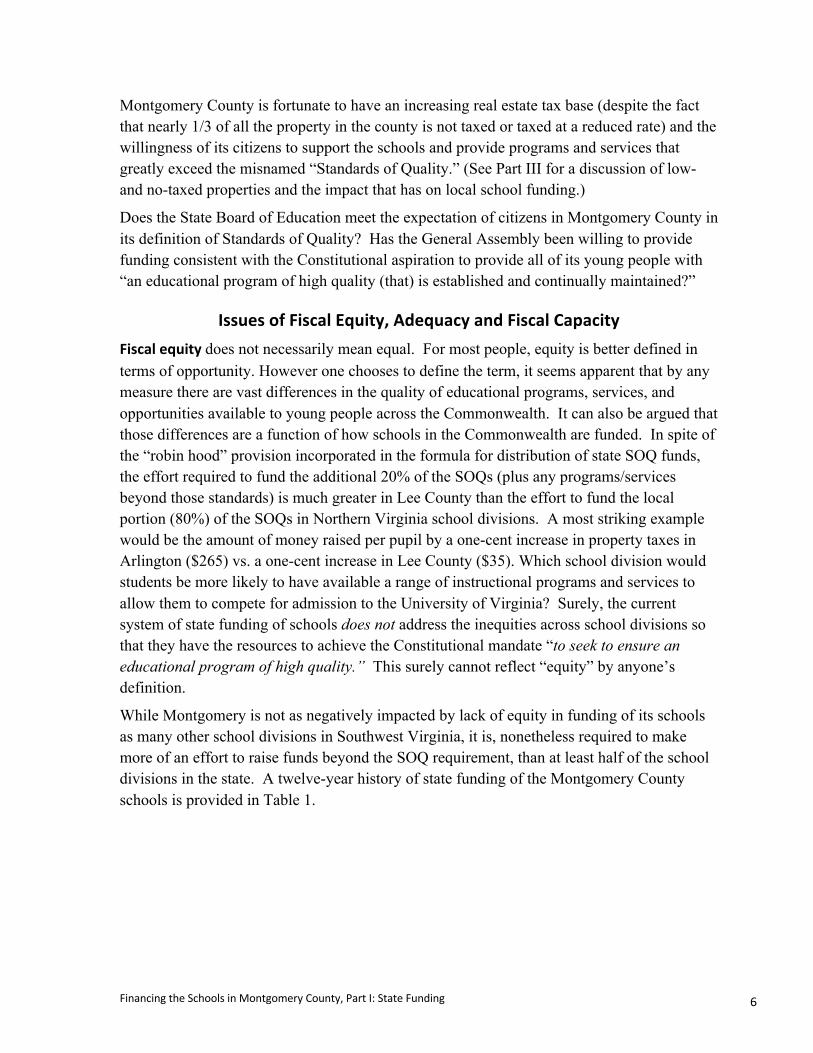
Montgomery County is fortunate to have an increasing real estate tax base (despite the fact that nearly 1/3 of all the property in the county is not taxed or taxed at a reduced rate) and the willingness of its citizens to support the schools and provide programs and services that greatly exceed the misnamed “Standards of Quality.” (See Part III for a discussion of low- and no-taxed properties and the impact that has on local school funding.)
Does the State Board of Education meet the expectation of citizens in Montgomery County in its definition of Standards of Quality? Has the General Assembly been willing to provide funding consistent with the Constitutional aspiration to provide all of its young people with “an educational program of high quality (that) is established and continually maintained?”
Issues of Fiscal Equity, Adequacy and Fiscal Capacity Fiscal equity does not necessarily mean equal. For most people, equity is better defined in terms of opportunity. However one chooses to define the term, it seems apparent that by any measure there are vast differences in the quality of educational programs, services, and opportunities available to young people across the Commonwealth. It can also be argued that those differences are a function of how schools in the Commonwealth are funded. In spite of the “robin hood” provision incorporated in the formula for distribution of state SOQ funds, the effort required to fund the additional 20% of the SOQs (plus any programs/services beyond those standards) is much greater in Lee County than the effort to fund the local portion (80%) of the SOQs in Northern Virginia school divisions. A most striking example would be the amount of money raised per pupil by a one-cent increase in property taxes in Arlington ($265) vs. a one-cent increase in Lee County ($35). Which school division would students be more likely to have available a range of instructional programs and services to allow them to compete for admission to the University of Virginia? Surely, the current system of state funding of schools does not address the inequities across school divisions so that they have the resources to achieve the Constitutional mandate “to seek to ensure an educational program of high quality.” This surely cannot reflect “equity” by anyone’s definition.
While Montgomery is not as negatively impacted by lack of equity in funding of its schools as many other school divisions in Southwest Virginia, it is, nonetheless required to make more of an effort to raise funds beyond the SOQ requirement, than at least half of the school divisions in the state. A twelve-year history of state funding of the Montgomery County schools is provided in Table 1.

Financing the Schools in Montgomery County, Part I: State Funding 7
Table 1 Ten Year History of State Funding for
Montgomery County Schools 2008–2009 to 2019–2020
Year
Total State Funds*
(in Millions)
School Budget
(In Millions)
State % of School Funding
2008-2009 47.6 97.4 48.9% 2009-2010 39.5 96.4 40.9% 2010-2011 35.7 88.6 40.3% 2011-2012 37.7 91.3 41.3% 2012-2013 36.9 92.0 40.1% 2013-2014 38.5 94.7 40.7% 2014-2015 40.3 97.0 41.5% 2015-2016 40.9 100.5 40.7% 2016-2017 41.8 100.4 41.6% 2017-2018 44.6 106.6 41.8% 2018-2019 43.9 108.9 40.3%
2019-2020** 47.1 116.4 40.4% * funds minus local sales taxes ** estimates
According to the most recent data shown in Table 1, the funding provided to the Montgomery County between FY 2009 and FY 2019 had declined by nearly $4 million measured in real dollars and almost $6 million when adjusted for inflation. During this period of time, while the enrollment in the Montgomery County School system held steady or increased slightly; the number of staff members was reduced by over 150, which included the loss of more than 50 teachers, counselors, librarians, and other certified personnel.
As to the questions of educational adequacy and fiscal capacity, does the current state funding system provide sufficient resources (adequacy) to fund an “educational program of high quality”? If we answer NO to that question, we would be wrong—at least insofar as the Courts in Virginia are concerned.
In 1994, eleven public school students and seven local school boards filed a bill of complaint seeking a declaratory judgment that the current system of funding public elementary and secondary schools violates the Virginia Constitution by denying the student complainants and other children “an educational opportunity substantially equal to that of children who attend public school in wealthier divisions.”
Plaintiffs in this case cited data illustrating the vast difference in expenditures supporting programs and services in wealthier vs poorer school divisions. For example, for the latest

Financing the Schools in Montgomery County, Part I: State Funding 8
school year that data were available, total per pupil funding for general education in the Commonwealth’s school divisions ranged from $2,895 to $7,268. Thus, the Commonwealth and its subdivisions spend 2.5 times more money per child on some of its school children than on other school children.
The trial court, in its memorandum opinion, concluded that, although public education is a “fundamental right,” the Constitution “does not…make equalized funding (by) the Commonwealth a constitutional right.” Instead, the Constitution “guarantees only that the Standards of Quality be met.” The trial court noted that the students “do not” allege that the present funding system has failed to reach the Standards of Quality.”
Subsequently, in a 1994 ruling (Reid Scott, et al. v. Commonwealth of Virginia), the Supreme Court of Virginia reaffirmed the trial court in stating,
In sum, we agree with the trial court that education is a fundamental right under the Constitution. Even applying a strict scrutiny test, as urged by the Students, however, we hold that nowhere does the Constitution require equal, or substantially equal, funding or programs among and within the Commonwealth’s school divisions. [emphasis added]
Later the court said,
Therefore, while the elimination of substantial disparity between school divisions may be a worthy goal, it simply is not required by the Constitution. Consequently, any relief to which the Students may be entitled must come from the General Assembly. (See Attachment 4.)
Unfortunately, the argument that great disparity existed in programs and services was not compelling or relevant to the Constitutional question.
Educational adequacy. The recommendation of the Court to seek redress from the General Assembly to address the problem has not been productive. In fact, according to the Commonwealth Institute for Fiscal Analysis, the state direct aid for public schools (adjusted for inflation) declined by some eight percent between 2009 and 2019. The most recent session of the General Assembly (2019) did little to improve that situation.
The Constitution places the responsibility for determining the SOQs on the State Board of Education—“Standards of quality for the several school divisions shall be determined and prescribed from time to time by the Board of Education,” subject only to modification by the General Assembly.
It might, therefore, seem reasonable to confront the Virginia State Board of Education as to whether the current standards really represent “Quality.” Revised (higher level) standards that more closely represent a level of quality consistent with the practice of the median expenditure school divisions would require additional support from the General Assembly. It seems, however, that the General Assembly has chosen to define quality at the current low

Financing the Schools in Montgomery County, Part I: State Funding 9
level. There can be little doubt that current funding is inadequate to provide the quality education desired by Virginia. Nor is it distributed in a way that provides equal opportunity for Virginia’s students regardless of where they live.
Can the state afford it (does it have fiscal capacity)? According to the 2019 Joint Legislative Audit and Review Commission (JLARC) report, “Virginia Compared to the Other States,” Virginia’s per capita personal income ranked 11th in the nation. That same report shows Virginia ranks 42nd in State Per Pupil Funding Pre-K through 12; slightly lower than Alabama, Louisiana, Georgia and Mississippi. It appears that Virginia has the fiscal capacity to adequately and equitably fund the public schools. It seems, however, that they do not have the will to do so.
Update 2020 In the fall of 2019, the Virginia State Board of Education called for major revisions in the SOQ requirements, the funding of school operations, increased teacher salaries and improved equity in the distribution of funds across the school divisions of the State. The proposed changes would have required an additional billion dollars to support K-12 education in the State. Governor Northam and several members of the General Assembly identified support of public education as a funding priority. In addition, there was at least some support for drafting a State funded bond proposal that would support construction and retrofitting of school facilities across the state.
So, What happened? Arguably, the 2020 session of the General Assembly provided more support for public education than in prior years. Unfortunately, neither of the two priorities articulated by politicians, namely, (1) to make an effort to improve teacher salaries and bring those salaries closer to the national average and (2) to address the acknowledged need for dealing with deteriorating school facilities, were not addressed in a meaningful way.
The General Assembly approved funding for the state share of a 2% salary increase for
SOL covered employees in both years of the biennium. Operationally the state share is, on average, half of the 2% with local jurisdictions responsible providing the other half. Then there is the reality that as many as 25% of the personnel in local school divisions are not “SOL covered.” The local school divisions are required to fund the entire 2% increase for those employees. The bottom line is that while the politicians take credit for improving teacher salaries by 2% their contribution is closer 0.7% with local governments responsible for the larger share of that increase. And to be clear, Montgomery County teacher salaries still remain $5,000 dollars below the state average.
Almost everyone seems to acknowledge that there are major facility challenges in school divisions. Construction and retro-fitting of facilities is entirely a local responsibility. Once

Financing the Schools in Montgomery County, Part I: State Funding 10
again, a proposal to ask the public to support a bond issue to deal with the “crumbling schools” problem was rejected. Instead, politicians opted for “a study of the problem” along with some additional funds directed to the Literary fund. Currently, the literary fund does not build schools: it is a mechanism for schools to obtain low-interest loans—small consolation to school divisions that lack the resources to make payments on those loans.
As of the date this report was written, the Coronavirus had resulted in the closing of all public schools in the Commonwealth for the remainder of the school year. In addition, the economic impact of the virus had yet to be determined. What is known for sure is that local and state revenue streams will be seriously disrupted. Until the 2020 General Assembly and Governor come together for the “veto session” on April 23, 2020, none of the expenditures approved by the General Assembly can be taken for granted. That uncertainty, coupled with projections of reduced local tax revenues, have made planning for the future extremely difficult. As these issues are sorted out, they will be incorporated as an addendum to this study report.
Summary • Funding of the local school system is a shared responsibility of the state and local
government;
• The Standards of Quality define the minimum level of programming and staffing required to be provided in every school division in the state;
• The State contribution to the funding of the SOQs differs from school division to school division based upon a formula that takes into account the ability of the local school division to contribute to the SOQ program funding in the school system;
• For programs and/or staffing that exceed the minimums established in the SOQs the local governmental unit is responsible for total funding of those programs, services and personnel.
• It is estimated that the citizens of Montgomery County contribute over 55% of the cost of operating the school system in the County and 100% of the cost for construction and major maintenance of school facilities.
• While the 1971 Constitution calls for “Public Schools of High Quality to be Maintained,” it seems clear that (1) the Standards of Quality do not describe what most Virginian’s believe to “of High Quality” and (2) that the funding provided by the General Assembly is neither adequate nor equitable.
• While the State Board of Education made positive strides in updating the Standards of Quality, it is questionable whether the new standards come close to approaching guidelines that would truly result in a level of quality that most would consider high
quality.

Financing the Schools in Montgomery County, Part I: State Funding 11
• While the governor and the General Assembly approved appropriations in support of K12 education, the current level of state funding remains both inadequate. As importantly, the process by which those funds are distributed still not address the inequities that currently exist across the state’s school divisions. A major study of adequacy and equity similar to those currently underway in Arkansas, New Hampshire, and Nevada should be undertaken at the earliest possible date.
• The General Assembly again failed to address the major problem of “crumbling schools”—especially in those communities least able to fund repairs or replacement.
• The coronavirus pandemic will not change the historical description of state school funding in Virginia. Nor will it change the data that describe the past state, local and federal school funding proportions. It does, however, have the potential to change many of the assumptions and trends about the future of public school funding in Virginia.

Financing the Schools in Montgomery County, Part II: Local Funding, Executive Summary 12
Part II: Local Funding, Executive Summary Part II of the Montgomery County School Finance Study examines these questions:
1. Is local funding adequate to address the needs of students attending the schools of Montgomery County?
2. How does the level of funding the Montgomery County Schools receive from the Board of Supervisors compare with comparable school divisions with respect to capacity (wealth) and effort (tax rates)?
3. How do Montgomery County School budget expenditures compare with other school divisions?
4. How do Montgomery County Schools performance measures compare with other school systems?
5. What are the major challenges facing the Montgomery County School system?
The needs (and opportunities) of, and for all students can never be fully addressed. By most measures, the Montgomery County School Division provides a rich array of programs and services. Funding in support of School Division programs and services is nearly twice the level required under the Standards of Quality. Eighteen of the nineteen schools in the county are fully accredited. While some differences exist in the allocation of resources and program availability across the schools of Montgomery County, the school system is making efforts to mediate those differences. Those differences, and the efforts underway to address them, are the focus of Part IV of this study.
Lack of Commonwealth funding to support School Division operations and the absence of any meaningful financial support for capital outlay places a disproportionate burden on local taxpayers to support the “educational program of high quality” which, according to the state Constitution, is an obligation of the Commonwealth of Virginia. The Montgomery County Board of Supervisors has, over the past ten years, “stepped up” to provide local funding to replace the diminished level of state support for the public schools of Montgomery County both in terms of operational funding and capital outlay. With the state’s reduced support, the proportional contribution of the county taxpayers to school operations has increased from 46% to over 55% (over $20 Million) over the past ten years. In addition, literally all school construction costs are the responsibility of the local governments.
Montgomery County ranks 47th in fiscal capacity (of 132 municipalities) and 97th in effort. These figures do not take into account the unusually high expenditures required to build two new high schools and other facilities over the past ten years.
Montgomery County Schools per-pupil expenditures are $11,204—fifth highest of eleven comparable school divisions but nearly $2,000 below the state average per-pupil expenditure. The portions of the School Division budget dedicated to instruction, administration, health

Financing the Schools in Montgomery County, Part II: Local Funding, Executive Summary 13
services, and transportation are slightly below state averages but 50% higher in operations and maintenance.
The Montgomery County School Division has a reputation for high quality across the state and among the citizens of Montgomery County. By most measures, Montgomery County students perform at or above the level of students in comparable school divisions and in statewide comparisons. Performance measures include both academic and co-curricular ratings.
Significant school facility needs exist in Montgomery County with limited resources available to address them in a timely manner. Recent adjustments to teacher salaries and replacement of personnel lost to previous budget reductions reflect the continuing concern and support of both the School Board and the Board of Supervisors. Nevertheless, providing competitive employee compensation remains a major challenge.
To examine these questions in greater depth, read the expanded Part II section of the report.

Financing the Schools in Montgomery County, Part II: Local Funding 14
Part II: Local Funding of the Montgomery County Schools
Introduction As noted earlier in this report, the schools in Montgomery County have basically three sources of revenue: federal, state and local. For the current year (FY 2020) the federal government’s share of school funding in the county was projected to be at 4% of the current budget; the state share 40+% (excluding local sales tax contributions), and the local share 56%. Over the past ten years, funds provided by the “Feds” (almost all of which are earmarked) have changed little, usually ranging from 4% to 6%. Over that same period of time, the state contribution (excluding local retail tax contributions) has declined from about 49% to 40% with the local contribution increasing from about 45% to over 55%.
Beyond the funding provided by the Commonwealth and the federal government, local governments are tasked with the responsibility to provide funds necessary for the operation of the local public schools (as well as the facilities that house the students). Part I of this study reviewed the pattern of State funding over a ten-year period. An examination of public school funding in Virginia included a review of the following five questions:
1. The question of adequacy: Have sufficient funds been appropriated by the General Assembly to fund the Standards of Quality (SOQs) that are mandated by the Virginia Board of Education and/or the General Assembly?
2. Are those funds distributed in a way (equitably) that assures that all students in the Commonwealth have available programs that meet the prescribed SOQs?
3. Do the SOQs prescribe a level of quality that reflects what the citizens of Virginia expect their schools to provide in the way of programs and services and do the SOQs meet the Constitutional standard “ensur(ing) that educational programs of high quality are maintained”?
4. Do the significant differences that exist in the fiscal capacity (ability/local tax base) of localities result in qualitative differences in programs to the detriment of students living in poorer school divisions?
5. Compared to the other 49 states, how does Virginia stack up with respect to wealth (ability measured by per capita income) and effort (measured by state per pupil funding)?
Several conclusions were reached based upon the data examined in Part I of the study.
1. The Standards of Quality do not reflect or prescribe a level of quality that matches the
expectations of most Virginia citizens;
2. Quality is an elusive concept—defined differently both across the state and within local school divisions;
3. Significant differences exist in the fiscal ability of local governments to fund the
programs and services that local citizens desire in their schools;

Financing the Schools in Montgomery County, Part II: Local Funding 15
4. The willingness of local communities to tax themselves (effort) to support high quality programs and services varies considerably across the Commonwealth.
5. State funding of public Pre-K-12 education is both inadequate and inequitable even at the low level of quality prescribed in the Standards of Quality.
6. Virginia has the fiscal capacity but lacks the commitment to provide higher levels of support for Pre-K-12 public education;
7. Program quality (however one measures it) varies dramatically from location to location. In essence “program quality” can be predicted by zip code;
8. Equal educational opportunities are not available to all of Virginia’s students.
Responsibility for Local Funding The short description of how the local funding of schools in Virginia works is: (a) the School Board prepares a budget request that outlines the “needs” of the school division; (b) the budget is submitted to the Board of Supervisors or City Council, which determine how much of the budget request they will fund. As noted earlier, all school divisions are fiscally dependent—they depend on the governing body (Board of Supervisors or City Council) to allocate resources for the operation of schools. While the Boards of Supervisors or Council members do not fund by line item, it goes without saying that School Boards are sensitive to the views of the governing bodies as to their priorities or constituent views as to what is important. In a perfect world, everyone would agree as to the needs of a school system. The reality is that School Boards exercise wisdom by not submitting budgets they know will be rejected out-of-hand by their governing bodies. This is not unique to Virginia or Montgomery County. Whether one lives in a state where school boards are fiscally independent (have taxing authority) or in a state like Vermont where annual budgets are voted on in town meetings, “what the traffic will bear” is always a consideration.
What Constitutes “A Need”? When is the request for funding a “want” and when is it a “need”? In some, thankfully rare, instances, some boards of supervisors have taken the position that the SOQs represent the needs and thus the obligation of the governing body to fund the schools. In other cases, the governing board may be sympathetic to a request to fund school board identified needs even though they exceed the SOQ requirements but believe that their citizens will not support tax increases to fund those “needs”. Or, they may believe, that there are other competing interests (social services, sheriff’s office, libraries, facility improvements) that have higher priority.
The second and related area of potential disagreement is “What is Quality?” Most agree that quality is in the eye of the beholder. Some would argue that “What I had was good enough.” Still others believe that the school system should be benchmarking its programs and services against the best of the best. One might observe that these very different views about quality exist not only from school division to school division but also within the taxpaying public of Montgomery County.

Financing the Schools in Montgomery County, Part II: Local Funding 16
Given that there are significant variations across the Commonwealth as to what constitutes a “Quality” education, each school division is expected to produce documents that articulate those goals (the local definition of quality)—usually in the form of a strategic planning document that is submitted to and approved by the Virginia Department of Education. In many/most school divisions this plan is developed with significant input from stakeholders and thus, represents a community view as to what constitutes a “Quality” education in that community. Arguably, the only way to achieve the goals is to fund them. And the more ambitious the goals; the more funding that is required.
With those plans/goals in hand, school boards are expected to assess and report the progress of the school division in accomplishing the goals/outcomes articulated in the plan. Each year: (1) the school board prepares a budget designed to accomplish the goals and (2) submits that proposed budget to the funding body (Boards of Supervisors or City Councils). The governing body is then tasked with the responsibility of funding the school system. In theory, the case for achieving the goals should drive the funding decisions of Supervisors or City Council members. In practice, there are real questions that arise:
1. What is the capacity of the local government to fund the requests?
2. How much of the funding request represent “wants” vs. “needs”?
3. How much effort (available or new resources) is the Board (hopefully reflecting the community’s beliefs and priorities) prepared to support—either through reallocation of priorities or new revenue sources (taxes)?
The Facts • According to a October 2019 report, prepared by the Commonwealth Institute for Fiscal
Analysis (CIFA), the Commonwealth of Virginia has reduced its support of public
schools in Montgomery County in terms of both real and adjusted for inflation dollars over the past ten years. Adjusted for inflation, per student funding declined by 16% from FY2009 to FY2019 at the same time enrollment was projected to increase by more than 300 students.
• From FY 2009 until FY 2020, the Montgomery County School budget increased from $96.4 million to an estimated $116.4 million. Over that same period, state funding has decreased (in real dollars) by approximately half a million dollars. As a result of declining federal revenues and the decline in state funding, the Montgomery County taxpayer contribution (including local retail sales tax) for school operations increased by more than $20 million. This figure does not include capital outlay and debt service funding, which is discussed later in this section.
• It is obvious that the Montgomery County Board of Supervisors (BOS) has “stepped up” over the past ten years to help soften the blow of reduced state and federal funding. In spite of the BOS efforts, State and Federal funding of the Montgomery County School Division is just now approaching 2009 levels. According to the 2018 CIFA report the decrease in funding by the State resulted in a loss of some 278 staff members including

Financing the Schools in Montgomery County, Part II: Local Funding 17
approximately 80 teachers, counselors, administrators and librarians. More recent School division reports (FY20) indicate enrollment has increased by 425 students since 2009 but the school division was still down 35 teachers.
So, to what extent has the Board of Supervisors funded the budget requests (needs/wants) submitted by the School Board? The Table below provides a ten year analysis of budget requests submitted by the School Board; the level of funding approved by the Board of Supervisors and the percentage of new county revenues that have been appropriated for operating expenses of the local school division.
Table 2 Board of Supervisor Funding of Montgomery County Schools
FY2009–FY2020 FY School
Board Request
New County Undesignated
Revenues
BOS Increased Allocation to
SB from Undesignated
Revenues
% of New Undesignated
Revenue to Schools
One-Time Only
Funds*
Total new Operating
Funds from County
FY 19-20 $8,093,794 $7,600,000* $3,844,609 50.59%** $400,000** $3,892,109 FY 18-19 $2,322,066 $1,985,257 $1,500,000 75.56% $387,986 $1,887,986 FY 17-18 $4,440,339 $2,990,069 $ 960,000 32.11% $540,000 $1,500,000 FY 16-17 $3,089,413 $3,125,142 $1,310,831 41.94% $750,000 $2,060,831 FY 15-16 $3,294,543 $3,010,571 $2,131,454 70.80% $303,707 $2,435,161 FY 14-15 $5,169,114 $2,352,257 0 0% 0 0 FY 13-14 $3,560,317 $4,811,800 $2,237,990 48.59% $575,000 $2,912,990 FY 12-13 $8,575,867 $10,406,590 $3,328,198 31.98% $750,000 $4,078,198 FY 11-12 $3,385,002 $2,778,108 $ 700,000 25.20% 0 $2,778,108 FY 10-11 $ 211,459 $1,474,003 $ 610,211 41.40% 0 $1,474,003 FY 09-10 $ 376,988 $1,453,880 $ 227,535 15.65% 0 $ 227,535 FY 08-09 $4,138,609 -?- -?- -?- 0 $1,718,539 * One-Time Only Funds represent unspent funds from the previous year. School Divisions are not allowed to “carry-
over” unspent funds which must be returned to the County unless the County approves the reallocation of those funds as an addition to school division funding for the upcoming year.
** Estimated Table 2 provides a graphic illustration of how the recession, a decade ago, impacted the School Division budget, funding requests, and County allocation of resources for the support of public schools. In addition, over that same period of time there were at least four changes in the school division leadership (superintendent) counting a short stint by an interim superintendent prior to Dr. Meier which could have affected planning processes and budget requests. Further complicating funding issues was the collapse of the Blacksburg High School roof and the subsequent decision to replace rather than repair that facility.
Based upon conversations with school and county officials, it appears as though relationships between the administration and Board members of both groups have been cordial. While members

Financing the Schools in Montgomery County, Part II: Local Funding 18
of both boards tend to agree on the needs (especially those needs related to facilities and salary/benefit considerations), there have been different views as to how to pay for those items. As in most settings, there is some reluctance to increasing taxes, especially given the relatively large increase required over the past ten years to construct needed facilities. At the same time, salaries in the School Division, and for many county employees, have stagnated. The counter argument is that Montgomery is, compared to neighboring districts, relatively wealthy and can afford (and citizens are willing to support) increased funding even if it means incremental yearly increases in the real estate tax rates.
Using a slightly modified 1990s cohort model that created clusters of schools comparable to each other in enrollment, demographic and socio-economic factors, ten school divisions were chosen for comparison of fiscal capacity and tax effort rankings. Table 3 illustrates the rankings of these school systems on fiscal capacity, fiscal effort, per pupil expenditure and the per pupil funds raised through local effort.
Table 3 Cohort Measures and Comparisons of Capacity, Effort,
Per Pupil Expenditures, Wealth, and Tax Rates
School
Division (county)
1
End of Year ADM
Enrollment
2
Fiscal Capacity
Rank
3
Fiscal Effort Rank
4
Per Pupil Expenditures
(Total)
5
Per Pupil Expend.
Local share
6 Expend. Exceed
Req. SOQ by %
7 $ Raised
With Penny
Increase
8 $/Pupil
With Penny
Increase
9
Local Tax
Rate Albemarle 13,884 13 19
(-6) $14,644 $10,471 158.4% $1,711,700 $123 85.4
Augusta
10,158 65 66 (-1)
$10,989 $4,350 99.2% $690,300 $66 63.0
Bedford 9,638 36 118 (-82)
$10,722 $4,105 102.4% $840,700 $87
50.0
Botetourt 4,636 51 34 (+17)
$11,521 $5,469 124.3% $334,000 $72 79.0
Campbell 7,872 104 54 (+50)
$10,176 $3,543 107.9% $383,100 $49 52.0
Montgomery 9,860 47 97 (-50)
$11,204 $4,994 95.6% $773,000 $78 89.0
Orange 5,029 49 85 (-36)
$10,750 $4,030 55.7% $374,500 $74 80.4
Roanoke 14,098 59 37 (+22)
$10,878 $4.755 100.8% $825,400 $59 1.09
Rockbridge 2,635 27 87 (-60)
$12,205 $5,599 65.4% $264,700 $100 73
Rockingham 11,823 62 15 (+47)
$11,893 $5,592 157.6% $779,600 $66 74.0
York 12,741 43 32 (+11)
$10,766 $4,468 79.3% $911,700 $72 79.5
Data in Columns 1-5 from Virginia Educational Disparities 2017-18, VEA, July 2019. Data in Columns 6-8 from Commonwealth Institute for Fiscal Analysis, September 2019; their data source from VDOE and US Census Bureau.

Financing the Schools in Montgomery County, Part II: Local Funding 19
Interpretation of Table 3 1. Albemarle County has a high fiscal capacity ranking (13th of 132) and a relatively high
effort ranking (19th of 132) as well. Consequently, they have a per pupil expenditure of almost $2,500 higher than the other ten school divisions—because they contribute almost $5,000 more local money per pupil than any other system. Apparently, their governing bodies (and communities) are willing to support schools at a higher level than other members of the cohort.
2. In a perfect world, the fiscal capacity and local tax effort would be approximately the same (see Augusta County). This would suggest that the effort is matching the capacity. These data are compromised somewhat by other funding issues, notably capital outlay and debt service costs.
3. Using this data set, there could be an argument that Montgomery County, with a ranked capacity of 47th, is not making an effort (97th) consistent with its capacity. The counter argument is that the tax rate (.89) is the second highest in the cohort due, in large measure, to the high debt incurred for construction of facilities.
Funding School Facilities/Capital Outlay Considerations In addition to the impact of the recession a decade ago, the “elephant in the room” with regard to school funding in Montgomery County over the past ten years has been the need to allocate significant resources for the construction of facilities. Starting with the roof collapse at Blacksburg High School in (2010), the construction of a new high school in Riner, and a new Prices Fork Elementary School, the county has been forced to increase property taxes over a ten-year period from 71 cents per $100 of assessed value in 2009 to the current level of 89 cents per $100. Even with this effort, the facilities problems have not been totally resolved. Over the past five years shifting enrollment patterns, aging facilities, and overcrowding in at least five schools have contributed to new pressures for capital outlay expenditures.
Basically, the Commonwealth of Virginia does not contribute to the funding of major renovations or construction of new facilities. The Virginia Public School Authority does provide some opportunity for local jurisdictions to bundle their bond sales with other units of government around the state. In addition, the Literary Fund makes available a limited amount of funding at low interest rates. Neither of these sources provide much relief to the problems facing Montgomery County.
The county government and the school division are both responsible for approving construction initiatives since the county must assure the repayment of bonds. In some cases, the school division may budget for debt service/interest payments on the bonds, but since the money all comes from the county, the process by which principal and interest on bonds is repaid is largely irrelevant.
Policy guidelines impacting capital outlay funding. Over a number of years and for a variety of reasons, the Montgomery County Board of Supervisors has established guidelines (targets) for a number of financial indicators and self-imposed borrowing limits for capital funding. Those fiscal policy restrictions include:

Financing the Schools in Montgomery County, Part II: Local Funding 20
1. Maintaining an “Unassigned General Fund Balance at the end of each fiscal year of at
least 12% of General Fund plus School Operating Fund Revenues, excluding the
General Fund transfer to the School Operating Fund.” Periodically, some counties balance their budgets using funds from this source rather than increasing taxes to do so. That has not been the case in Montgomery County. Over the past three years, Montgomery County has maintained their unassigned (reserve) fund balance at the 12% level.
This fund balance (currently around $21 million) is maintained to protect against major unanticipated expenses and, in part, to meet obligations when revenues have not yet been received (cash flow issues).
2. Another self-imposed restriction is “The ratio of debt service as a percent of governmental fund expenditures should strive to be below 10% but not exceed 12%”. Obviously “striving to” suggests this is more guideline than prohibition. In fact, Montgomery County was forced to exceed its policy guidance in 2013 when the debt service ratio increased to more than 15% in order to service the debt incurred to construct the new Blacksburg High School and other needed facilities. Over the past six year, the debt service (interest on bonds) has returned to approximately 11% and, with no additional debt, would be reduced to under 10% by 2023.
How does this compare with other similar counties? In this case “similar” means other counties with triple A (Aaa) or double A bond ratings. Only five of 36 “similar” counties have debt service expenditure percentage as high or higher than Montgomery County. About half have a debt service percentage expenditure of 8% or lower.
3. A third self-imposed limit is “Net debt as a percentage of estimated market value of
taxable property should strive to be below 3% but not exceed 4%.” Over the past ten years, the debt limit has never approached 4% and only twice exceeded the 3% guideline. It was in 2012 and 2013 with the construction of Blacksburg High School and other facilities that the percentage reached or exceeded 3%. As county property values increase (notwithstanding the high percentage of no- or low-taxed property in Montgomery County), it is unlikely that this limitation will come into play in the foreseeable future.
Consequence of limitations: Impact on capital funding options Several questions might be raised with regard to the limits the County has placed on borrowing:
• Are these limits legal requirements? The answer to that question is “No,” they are self-imposed limits that Montgomery County policy makers believe are in the best interest of county taxpayers.
• If the limits are not legally imposed, why couldn’t the Board of Supervisors simply borrow the money (sell bonds) to address the obvious facility needs related to public services (fire department facilities, libraries, recreation facilities, etc. and the public school facility needs)? The answer is, they could do that but with some likely consequences to local taxpayers.

Financing the Schools in Montgomery County, Part II: Local Funding 21
• What might those consequences be? In the first case, it is possible, perhaps even likely, that incurring debt beyond the self-imposed limits could negatively affect the county’s bond rating. A reduction in the bond rating would likely lead to a higher rate of interest connected to the sale of bonds which, over the long haul, would cost the taxpayers more.
• Would this happen? And how much more would it cost? The answer is unknown; however, two credit rating organizations (Moody and S&P) agree that (a) a decline of reserves and liquidity and (b) increased debt burden are factors that can contribute to a downgrade in ratings.
• What is the current tax supported debt service in Montgomery County? Currently, the debt is $187 million. That debt is being retired at about $21 million a year. As currently structured with no additional debt, these bonds will be retired in 2032.
What does all of this mean in terms of available funds for capital outlay expenses? At the present time the “Debt Service vs. Expenditures” is the limiting factor for Montgomery County. (See self- imposed limitation #2 above.). According to Davenport & Company (the Montgomery County Bond consultants), “Assuming a 20-year level debt service issued at 4% and expenditures growth at 2.0% annually beginning in FY 2019, the county could issue tax-supported debt up to the amounts shown below without violating its limit of ‘not to exceed 12% financial policy’.”
Table 4 Future Debt Capacity*
First Five Years/Second Five Years/Ten Years 2020 2021 2022 2023 2024 2020/2024
$15,715,847 $12,516,053 $6,485,604 $23,403,819 $21,161,153 $79,282,478 2025 2026 2027 2028 2029 2025/2029
$21,078,638 $22,818,701 $19,400,567 $12,599,255 $7,211,316 $83,108,478 2020/2029 $162,390,956
*Future Debt Capacity Analysis prepared by Davenport & Company (8/12/2019)
Facility Needs/Alternatives/Decisions As the first draft of this section was being prepared (mid-April 2019), the school facility needs had been identified (see discussion on school capacity and Table 5 below). Over the past six years, as the enrollment increases created overcrowding concerns at several schools (primarily in the Christiansburg area), these issues have been addressed in two ways: (1) Some additional “classroom space” was created by utilizing areas not designed for classrooms. Typically, those areas were undersized and not designed for regular classroom instruction (whiteboards, electrical outlets, etc.), and (2) when those retrofitting options were not sufficient, the school division added “portable/temporary” modular classrooms adjacent to the main building. In the spring of 2019, there were 17 such units in service throughout the school division. (Note: The enrollment crush is not limited to the Christiansburg area. A modular unit with four classrooms was scheduled to be located at the Harding Avenue site in Blacksburg for the 2019–2020 school year.)

Financing the Schools in Montgomery County, Part II: Local Funding 22
While those units were meant to be temporary to solve overcrowding problems until new facilities or additions to existing facilities could be constructed, given the lack of available funding for new facilities or permanent additions, they have become semi-permanent. Aside from the inconvenience of having students moving back and forth from temporary facilities to the main buildings, the infrastructure of each main school is overextended (cafeteria, indoor physical education space, etc.). Additionally, the funds required for lease or purchase of these units represent dollars that are no longer available for permanent facilities or instructional programs and services. (e.g. the lease cost for the Harding Avenue unit is slightly more than $5,600 per month.
While some elementary schools were over capacity, one school in the Christiansburg area (Falling Branch) was “under enrolled” (see Table 5). In response to the capacity/facility “problem”, the school division administration developed four possible scenarios that included: (1) reassigning students, (2) new facility construction, (3) adding capacity by updating and expanding existing facilities, and (4) a combination of those options. Not unexpectedly, the proposal to redraw boundary lines brought strong opposition from parents.
The need for expansion and upgrading the Christiansburg High School (CHS) is also a problem facing the Montgomery County School Board. All of the options developed by the school administration suggested that planning for CHS would begin immediately with construction activities unlikely to commence until 2023.
As the various options unfolded, the School Board settled on the option that included:
• No new school construction;
• Use the very limited funding capacity to begin construction of facility additions at the most impacted schools (40 classrooms and other needed upgrades and improvements at CPS and CES) with subsequent elimination of the modular units currently serving those schools;
• Retain Belview Elementary School (closing that facility without a new school replacement would exacerbate the overcrowding problems at other elementary schools) and adding six additional classrooms and other improvements; and
• Begin planning for needed upgrade/additions to CHS for possible construction in 2023.
Table 5 Overcrowding in Christiansburg Area Schools
2018-2019 School Year
School Program Capacity
Current Enrollment
Difference
Projected Enrollment 2024
Belview Elementary 222 260 or 117% +36 242 or 109% C’burg Elementary 266 462 or 174% +196 516 or 194% C’burg Primary 342 511 or 149% +169 508 or 148% Falling Branch Elem. 740 535 or 70% -205 560 or 91% Elementary School Totals 1,570 1,766 or 113% +196 1,826 or 116% C’burg High School 866 1041 or 120% +175 1,112 or 128%

Financing the Schools in Montgomery County, Part II: Local Funding 23
Context. For the past few years, the Montgomery County Board of Supervisors, recognizing the facility challenges, set aside a portion of the current year’s taxes to be held for capital outlay needs. In addition to that set aside, the Board of Supervisors’ budget for the 2019–20 year included an additional $1.2 million to be held for future capital outlay expenses. In the spring of 2019, these funds became a part of the budget conversations between the School Board and the Board of Supervisors.
In addition to consideration of facility needs, the School Board, in the spring of 2019, was concerned about addressing teacher salaries and replacement of teachers lost as a result of earlier budget reductions. As a result of those factors, the School Board made a request of the BOS to NOT set aside the proposed $1.2 million for future capital outlay but, instead, to transfer those resources to the School Division operating budget to address salary and teacher replacement needs. In addition, they developed a plan (see above) with a schedule that would permit the construction of new facilities on a scheduled basis within available (or soon to be available) bonding capacity.
All of the stakeholders including members of the Board of Supervisors and the School Board recognized the need for expanded and upgraded facilities. Some of those most in need were not mentioned in the previous discussion (e.g., Shawsville Middle School). Four things seemed clear:
• The need for additional and upgraded facilities in both the school system and county exist;
• There was not currently, sufficient resources in hand to immediately address those needs;
• Starting salaries (and teacher salaries generally) as shown in Table 6 needed to be addressed;
• Increased enrollments coupled with staff reductions needed to be addressed. As an aside, it is unfortunate that the General Assembly of the Commonwealth of Virginia, having acknowledged the widespread problems facing local school divisions in addressing what the Governor described as “crumbling school buildings,” once again passed on the opportunity to allow Virginia’s citizens the chance to weigh in on the problem. A proposed statewide referendum that would have given Virginians the chance to vote for a major bond issue to support repair and replacement of deteriorating school facilities was blocked in committee. In the 2020 General Assembly, once again the “can was kicked down the road” with the only action an agreement to create a committee to “study the problem.”
Added to the incredibly low level of State fiscal support for operations discussed in Part I of this study, it is clear that it is the Commonwealth, not the cities, counties or local school boards, that has defaulted in the provision of a quality education for all Virginia’s young people.
Other factors. Fiscal capacity, tax effort, and capital expenditures are not the only factors that influence costs. With employee costs constituting nearly 80% of a school division’s operational budget, labor pool and cost of living factors play a significant role in the “cost of doing business.” It is a fact that it costs more to live in Northern Virginia than in Henry County. Consequently, average teacher salaries in one Northern Virginia School Division exceed $80,000 compared to an average annual salary of less than $40,000 in one Southwestern Virginia School Division.

Financing the Schools in Montgomery County, Part II: Local Funding 24
Completely aside from moral considerations and value questions, the fact is that geography and labor pool greatly affect budget considerations. Given that reality, part of the calculus surrounding the question of teacher pay, is the availability of teachers. The teacher shortage in Virginia, (in all fields), has reached a critical point. For several reasons, those shortages are slightly less critical in the New River Valley—in part because of the number of spouses of graduate students and faculty partners willing to work as a second wage earner. For that reason, the cohort group identified to examine capacity and effort is not as useful. With the reality that recruitment and retention is more localized, a decision was made to create a second cohort (displayed in Table 6) that compares starting salaries in Montgomery County with starting salaries in adjacent school divisions, those divisions with whom Montgomery County competes most directly for its employees. The table also lists the Composite Index (measure of relative wealth) for those same school systems.
These data illustrate that while Montgomery County is the “wealthiest” member of this seven school division group, the starting salary for beginning teachers a year ago (2018–2019 school year) was the lowest in the cohort. This year (2019–2020) they rank second, seven hundred dollars behind Salem but about $2000 or more higher than other members of the group.
Table 6 2019/2020 Comparison of Starting Salary
and LCI In Cohort School Divisions School
Division Local
Composite Index
Rank LCI in Cohort
Rank Starting Pay 2018–19
Rank Starting Pay
2019–20 Montgomery .4005 1 7 2 Roanoke Co. .3660 2 3 6 Salem .3641 3 1 1 Floyd .3418 4 5 7 Roanoke City .3284 5 2 3 Pulaski .3235 6 6 5 Radford .2452 7 4 4
While starting salaries provide one data point, progression on the Salary Schedule is also a factor in both attraction and retention of teachers. Table 7 provides comparative data on salaries over time in the seven school divisions.
Table 7 illustrates that while Montgomery County starting teacher salaries have become more competitive, comparisons over time place the county salaries fourth in the seven school division cohort trailing Salem, Roanoke County and Roanoke City at the 9th and 19th step.

Financing the Schools in Montgomery County, Part II: Local Funding 25
Table 7 2019/2020 Salary Schedule Comparison
School Division
Starting Pay BA/BS
9th Year
19th Year
Top of Schedule
# of Years to Reach Top of
Schedule Roanoke County $39,555 $45,228 $52,489 $60,914 30 Floyd County $39,250 $41,620 $47,560 $59,600 30 Pulaski County $39,579 $41,707 $46,944 $60,927 32 Radford City $40,055 $44,042 $49,489 $61,902 30 Roanoke City $40,073 $45,123 $55,372 $67,500 30 Salem City $42,714 $48,848 $56,217 $65,130 30 Montgomery Co. $42,000 $44,356 $50,276 $62,594 32
What Has Happened over the Past Twelve Months? Budget outcome—Spring 2019. A year ago, on April 15, 2019, the Montgomery County Board of Supervisors unanimously approved a budget that included almost all of the School Board requests for funding. The Board of Supervisors included in their School Division operational funding $844 thousand of the $1.2 million they had previously intended to set aside for future capital outlay expenses. These funds addressed salary considerations and allowed the return of as many as 18 teachers previously lost to budget reductions.
In the fall of 2019 bonds in the amount of $35.0 million were issued to provide funds for facility additions and improvements in the Christiansburg strand. Design and site work are currently underway with construction slated to begin at Christiansburg Elementary, Belview Elementary and Christiansburg Primary this spring, with completion of work at Belview in January 2021 and Christiansburg Elementary and Primary School in July 2021. It is hoped that Christiansburg High School renovation might begin as early as the fall of 2021.
Budget planning—FY 2021. The Montgomery County School Board budget for FY 2021 was presented to the Board of Supervisors on February 24, 2020. The proposed School Board budget included an additional 10 positions to accommodate increased enrollment; a 3% salary increase for all employees; maintaining health benefits at no additional cost to employees; and increasing the minimum wage for all employees to at least $13/hour. The total increase in the school budget was projected at $3.7 million. The proposed budget anticipated an increase in state funding of $1.9+ million. The School Board requested $1.74+ million new funds from the county.
On March 2, 2020, County Administrator Craig Meadows presented his recommended budget to the Board of Supervisors. The county budget anticipated a projected revenue growth of $3.8 million. His budget included $1.55 million for the School Division operating fund—about $200 thousand less than the School Board requested.
In the second week of March (2020) Virginia saw its first case of the Coronavirus. Over the next two weeks the virus had infected over 1,000 Virginia residents. Within a week, all Virginia schools were closed for a four-week period. At the end of the second week, the governor closed

Financing the Schools in Montgomery County, Part II: Local Funding 26
schools for the remainder of the year. A March 17 planned meeting of the County Board of
Supervisors and School Board was cancelled and had not been rescheduled as of April 1.
It has become increasingly clear that the economic impact of the virus will affect state and local tax revenues and, consequently, planned expenditures. At present, it is not known, with any certainty, precisely what this might mean for funding of state and local FY 2021 budgets. It does, however, appear likely that there will be major reductions in appropriations to support public education. Whether those reductions will be short term or long term will depend on (a) how long the virus continues to disrupt life as we have known it and (b) how long it will take the economy to recover once the virus has run its course.
It seems certain, that at the very least, the 2020–2021 school year will not return to “normal”. Clearly, school funding (and consequently programs and services) will be seriously eroded due to the economic impact of the virus. It also seems likely that the aftermath of the virus will impact public schools over the next several years. Much of the current study is focused on the ten year period beginning with the recession of 2008–09 and continuing through last year. It is unlikely that the trends and assumptions in this study (which are based on the trends of the past decade) will be useful in predicting the next ten years.
Given that caveat, the reader is cautioned to consider whether or not the information that follows will be useful in planning or simply serve as an historical benchmark that describes education in Montgomery County at the time Coronavirus changed everything.
Where Does the Money Go? What are the Results? Quality measures: Cohort comparisons. Quality can be measured in many ways. One approach is to compare the resources provided in support of the school division. Those resources (input) are used to hire teachers and other instructional and support personnel, pay for fringe benefits (accounting for 80% of a typical school system budget), purchase instructional supplies and equipment, maintain buildings, transport children and more. As noted in Table 3, the ability/capacity of school systems varies considerably. Montgomery County ranks 4th out of the 11 school divisions in this cohort with respect to the amount of money per pupil ($78) that can be raised with each penny increase in the local tax rate. Currently (April 2019), Montgomery County’s tax rate of 0.89 placed it second in the same cohort. That rating is due in large part to the high costs associated with the need to replace facilities. The proposed FY 2021 budget for Montgomery County contemplates no change in real estate or other taxes.
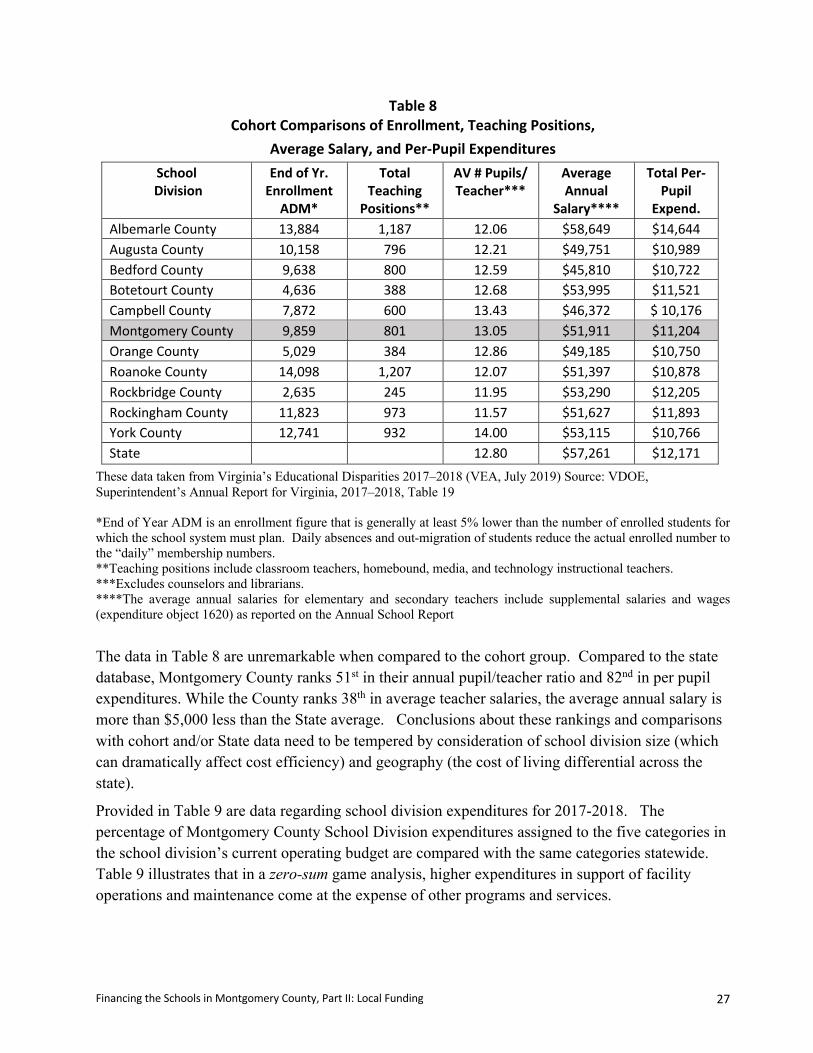
A critical question is “How are these resources deployed and to what end?” In Table 8, three such measures are presented: (1) staffing ratios, (2) teacher salaries and (3) cost per pupil, the latter which is driven by the first two measures. How did Montgomery compare with similar school divisions?
Financing the Schools in Montgomery County, Part II: Local Funding 27
Table 8 Cohort Comparisons of Enrollment, Teaching Positions,
Average Salary, and Per-Pupil Expenditures School
Division End of Yr.
Enrollment ADM*
Total Teaching
Positions**
AV # Pupils/ Teacher***
Average Annual
Salary****
Total Per-Pupil
Expend. Albemarle County 13,884 1,187 12.06 $58,649 $14,644 Augusta County 10,158 796 12.21 $49,751 $10,989 Bedford County 9,638 800 12.59 $45,810 $10,722 Botetourt County 4,636 388 12.68 $53,995 $11,521 Campbell County 7,872 600 13.43 $46,372 $ 10,176 Montgomery County 9,859 801 13.05 $51,911 $11,204 Orange County 5,029 384 12.86 $49,185 $10,750 Roanoke County 14,098 1,207 12.07 $51,397 $10,878 Rockbridge County 2,635 245 11.95 $53,290 $12,205 Rockingham County 11,823 973 11.57 $51,627 $11,893 York County 12,741 932 14.00 $53,115 $10,766 State 12.80 $57,261 $12,171
These data taken from Virginia’s Educational Disparities 2017–2018 (VEA, July 2019) Source: VDOE, Superintendent’s Annual Report for Virginia, 2017–2018, Table 19 *End of Year ADM is an enrollment figure that is generally at least 5% lower than the number of enrolled students for which the school system must plan. Daily absences and out-migration of students reduce the actual enrolled number to the “daily” membership numbers. **Teaching positions include classroom teachers, homebound, media, and technology instructional teachers. ***Excludes counselors and librarians. ****The average annual salaries for elementary and secondary teachers include supplemental salaries and wages (expenditure object 1620) as reported on the Annual School Report The data in Table 8 are unremarkable when compared to the cohort group. Compared to the state database, Montgomery County ranks 51st in their annual pupil/teacher ratio and 82nd in per pupil expenditures. While the County ranks 38th in average teacher salaries, the average annual salary is more than $5,000 less than the State average. Conclusions about these rankings and comparisons with cohort and/or State data need to be tempered by consideration of school division size (which can dramatically affect cost efficiency) and geography (the cost of living differential across the state).
Provided in Table 9 are data regarding school division expenditures for 2017-2018. The percentage of Montgomery County School Division expenditures assigned to the five categories in the school division’s current operating budget are compared with the same categories statewide. Table 9 illustrates that in a zero-sum game analysis, higher expenditures in support of facility operations and maintenance come at the expense of other programs and services.

Financing the Schools in Montgomery County, Part II: Local Funding 28
Table 9 A Comparison of Montgomery County School
Expenditures and State Percentages by Budget Category 2017–2018
Expenditure Category State %* Montgomery County %*
Difference
Administration 3.5% 2.3% -1.2% Instruction 78.7% 77.1% -1.6% Attendance & Health Services
2.0%
1.4%
-.6%
Pupil Transportation 6.1% 5.0% -1.1% Operations & Maintenance
9.6%
14.3%
+4.7%
*Numbers do not equal 100% due to rounding The previous two tables provide input information—a summary of “how” the money is spent to enhance the purpose and quality of the enterprise, namely, the education of young people. In addition to the information provided above, any number of other measures might be reported such as teacher quality (qualifications), quality of facilities; range of programs (elective courses), availability of special education and gifted programs, breadth of co-curricular programs, and more. These data are available in a number of school division reports including the annual budget document and the 2019–2020 Strategic Planning Notebook provided to the committee working to prepare an updated Strategic Plan for the school division.
The equally, or perhaps, more important question is “What happens as a result of these expenditures? What are the outputs? What is produced? What should we measure? What do we get for our money?” The Virginia Department of Education requires a comprehensive testing program in the name of accountability; school divisions use as one quality measure the success of their graduating seniors by reporting ACT and SAT scores, student college acceptance rates, certification of employment competencies, and scholarships earned. Performance measures abound (an example is provided in Table 10 below) but do not really answer the question as to whether the schools are adequately funded.
Local funding and adequacy. Do the local funds added to the state funds provide a quality of education acceptable to the citizens of Montgomery County? The answer to that questions is complicated. The county schools have an excellent reputation. Mainstream programs for special needs students have a national reputation; athletic (and other co-curricular) programs consistently compete at the highest level. The development of career exploration with a wide range of intern and work experience opportunities has received state-wide recognition. Academically, 18 of the 19 Montgomery County Schools are fully accredited; test scores exceed state averages in all areas of the curriculum. It is clear, however that the outputs/performance measures are uneven across the school system. In part those differences can be explained by parental support and expectations and school size differences. It is also obvious that major differences exist in the area of school

Financing the Schools in Montgomery County, Part II: Local Funding 29
facilities with some schools facing major overcrowding situations. An examination of those within-school division similarities and differences is the primary focus of Part IV in this study.
Table 10 A Comparison of Montgomery County School Division To Cohort School Divisions of Student Drop Out Rates,
On-Time Graduation, and Attendance Rates 2017–2018
School Division
Drop Out Rate
On Time Graduation
Attendance
Albemarle County 5.0% 92.7% 96% Augusta County 2.7% 91.2% 95% Bedford County 5.3% 91.8% 95% Botetourt County 1.8% 95.3% 96% Campbell County 3.2% 91.3% 95% Montgomery County 3.4% 95.4% 95% Orange County 3.8% 93.2% 95% Roanoke County 2.8% 95.2% 96% Rockbridge County 6.3% 90.6% 93%
Rockingham County 4.4% 94.2% 96% York County 2.1% 96.9% 96% State 5.5% 91.6%
Source: Virginia Department of Education Division Level Cohort Report
Summary • The Montgomery County School Division has a reputation for high quality across the state
and among the citizens of Montgomery County;
• By most measures, Montgomery County students perform at or above the level of students in comparable school divisions and, in comparison, with State measures;
• The performance indicators include both academic and co-curricular activities;
• Lack of state funding to support School Division operations and the absence of any meaningful financial support for capital outlay places a disproportionate burden on local taxpayers to support the “educational program of high quality” which, according to the State Constitution, is an obligation of the Commonwealth of Virginia;
• The Montgomery County Board of Supervisors has, over the past ten years, stepped up to provide local funding to replace the diminished level of state support for the public schools of Montgomery County both in terms of operational funding and capital outlay;

Financing the Schools in Montgomery County, Part II: Local Funding 30
• Differences exist in the allocation of resources and program availability across the schools of Montgomery County. These differences, and the efforts underway to address those differences, are the focus of Part IV of this study.
• Significant school facility needs exist in Montgomery County with limited resources available to address them in a timely manner;
• Recent adjustments to teacher salaries and replacement of personnel lost to previous budget reductions reflect the continuing concern and support of both the School Board and the Board of Supervisors;
• Montgomery County is fortunate to have an expanding economy and tax base in spite of the unusually high percentage of no- or low-tax properties. That phenomenon is the focus of Part III of this study.
• The onset of the Coronavirus pandemic in March of 2020 will likely bring about significant changes in the projected budgets reported in this document. Those changes and the consequences will, undoubtedly, be reflected in the input and output data describing public education in the Montgomery County Schools and school divisions across the Commonwealth for several years to come.

Financing the Schools in Montgomery County, Part III: Local Taxes and School Funding 31
Part III: Local Taxes and School Funding, Executive Summary Part III of this study examines questions related to Montgomery County tax policies and practices and how they impact funding of the Montgomery County Schools. In summary, the findings are as follows:
• Montgomery County has an unusually high proportion of real estate property that is either not taxed or taxed at less than the full rate.
• When some properties are not taxed or taxed at a reduced rate, owners of fully taxed properties pay higher taxes for the services provided by the county and local municipalities to compensate for the reduced revenues.
• The state funding of public schools is based on a formula that includes taxpayer’s income, property taxes, and sales tax receipts. It is not clear whether the funds county schools receive from the state are influenced by the unusual real estate tax profile in the county.
• The Federal government provides funding to local school districts (Impact Aid) to compensate for the loss of tax revenues associated with Federal ownership of real estate when the parents of enrolled students work on those non-taxed properties.
• The State does not make any adjustment in school funding where large percentages of the parents of enrolled students work in or at untaxed state properties. Perhaps as many as 2,500 Montgomery County students would fit the category of Impact Aid qualifying students if such a program were put in place. Using a formula comparable to that used to compute Federal Impact Aid could result in an increase in excess of $3 million in state aid.
• State “Impact Aid” would be one possible way for the state to provide funding for the burden placed on local taxpayers who pay higher level taxes because the state has removed properties from the tax rolls.
Mary Houska, in cooperation with the Office of the Commissioner of Revenue, has created a map giving the locations of non-taxable county real estate, ownership and use of each parcel, and the assessed valuation of the parcel. The map appears on the Montgomery County League of Women Voter’s website. To access the map. go to LWVMCVA.org, then to Studies, then the Education Study, then to the map and tap the map icon. The map will expand to full-screen that can be enlarged and panned.
To examine the issues related to taxation of governmental and non-profit properties, and the implications for funding of School Division programs and other county services, read the expanded Part III section of this report.

Financing the Schools in Montgomery County, Part III: Local Taxes and School Funding 32
Part III: Local Taxes and School Funding
Introduction The proposed 2021 FY operating budget for the Montgomery County Public Schools is approximately $120 million. The Commonwealth of Virginia will contribute about 40% of the revenue needed to fund that budget; the Federal government adds another 5%. When local sales tax revenues are included, Montgomery County will fund about 55% of the school division’s operating budget.
In addition, the County is responsible for the entire cost of past school construction including bond repayment and interest of approximately $200 million over the next 15 years. (Additional capital outlay costs of $100 million are projected over the next 5–10 years.) Approximately 70% of the proposed $209.3 million Montgomery County budget is dedicated to school purposes including operating funds and school division related debt service.
After removing earmarked fund transfers (State and Federal funds sometimes called “flow through” funding) from the revenue projections, approximately two-thirds of the remaining revenues to fund the County budget are derived from the real estate property tax.
Just over 30% of the assessed value of real estate in the County is not taxable under the
state code. This 30% of real estate includes Virginia Tech, various non-profit organizations (e.g. churches), Radford University property, the Radford Army Ammunition Plant, all local government property, the National Forest, and the Carilion New River Hospital complex. A
total of over $4.0 billion of real estate in Montgomery County is non-taxable.
By far, the most valuable non-taxable real estate in the County is Virginia Tech itself with a value well over $2 billion.
As an aside, much of the non-taxable property is located in the northern half of the County. About 46% of the assessed value of real estate in the Town of Blacksburg is non-taxable. Table 1 displays the distribution of taxable and non-taxable real estate properties in the County, Christiansburg and Blacksburg.
Table 1 Assessed Value of County Real Estate in 2020
Assessed Value In Jurisdiction
Nontaxable Real Estate
Taxable Real Estate
All Real Estate
Christiansburg $ 296,927,500 $ 2,337,147,000 $ 2,634,074,500 Blacksburg $ 3,066,087,000 $ 3,388,336,900 $ 6,454,423,900 County (excl. towns) $ 647,013,500 $ 3,049,551,300 $ 3,696,564,800
Total (all county) $ 4,010,028,800 $ 8,775,035,200 $12,785,063,200 Source: Montgomery County Commissioner of Revenue

Financing the Schools in Montgomery County, Part III: Local Taxes and School Funding 33
Tax Implications of Non-Profit Leasing Arrangements Commercial activity on publicly owned property is not taxable. Leasors of non-profit property do pay business taxes and some portion of their real estate taxes. How much they pay depends on the length of their lease.
According to State code, if a commercial restaurant, located on a non-profit’s real estate, leases their space for 50 or more years, it pays the full real estate tax which they would be paying if the restaurant were on private property. Bruce Smith has a 50-year lease on the hotel, restaurant, and apartment complex he built on Virginia Tech Foundation property located on Prices Fork and Plantation Roads. The percentage of real estate taxes which a commercial business pays on non-profit land it is renting is a function of the length of the lease. The shorter the lease, the lower the percentage of taxes paid. Most of the leases on non-profit properties pay only 15% of what they would pay if renting from a private landowner.
The Virginia Tech Foundation: A Special Case The Virginia Tech Foundation has enabled the University to be flexible and, especially, to pursue major research and development activities like building much of the Corporate Research Center and the Smart Road. To have funds to enable them to grow, the foundation has invested in what had been private commercial property—mostly in the northern part of the County. Most of the leases for commercial use of their space are short-term leases; consequently, most of them pay 15% of the real estate taxes that the business would be obligated to pay if they were located on privately owned property. Thus, as the ownership of commercial property by the Virginia Tech Foundation increases, the potential tax revenue from commercial properties is reduced. The foundation will soon own part of the University Mall in Blacksburg, Collegiate Square, and all the new buildings on Turner Street. What is more problematic is that it appears these actions are accelerating with the result that potential tax revenue will decline further.
Consequences and options. One consequence of the significant economic activity that takes place on publicly owned or non-profit land is that private owners of real estate in the
county must pay higher taxes to support the level of services that the citizens desire
including high quality public school programs and services.
One option is for those with fiscal responsibility for properties that are either publicly owned or owned by a non-profit typically would be for them to make payments to local government for services provided: (e.g., police and fire protection, water and sewage disposal) to share in these costs. In some locations, Federal and state-owned institutions also contribute toward

Financing the Schools in Montgomery County, Part III: Local Taxes and School Funding 34
the education of their workers’ children. A description of those procedures and possible options that might be considered are described in the section below labeled “Impact Aid.”
There are some agreements currently in place to create shared costs of services (e.g. water and airport authority are examples). Discussions continue about other possible cost sharing possibilities though none have been public discussed or announced.
One possible resolution to this dilemma is action by the General Assembly to rewrite
the code to better recognize the scope of the impact resulting from application of the
current laws.
One of the questions arising from this phenomenon is: To what extent, if any, does the
unusually high percentage of non-taxed or low-taxed properties in Montgomery County
influence the amount of funding received from the state for operation of the public
schools? (See Attachment B for a detailed description of the State funding formula.)
Because the formula for school funding depends on three different wealth components (property, income, and sales), it remains unclear as to whether State funding is impacted at all for several reasons:
• Several of the untaxed properties (VT and the Corporate Research Center) employ individuals (who live in the community) at higher than average incomes, thus impacting that part of the school funding formula;
• Some of those employees purchase higher cost housing (new homes) at prices considerably above the average home costs in the County, thus enhancing the property tax base;
• It is likely, however, that Virginia Tech and the CRC employ at least as many modestly paid employees who also have school children in their families. They live in low- to moderately-assessed real estate property in the County and are subject to those increased taxes;
• Most of the students at the university live in rental units (apartment complexes) which do pay real estate taxes. Most of those students do not have children in the public school system and thus do not generate a need for additional PK–12 spending in the County.
For those reasons as well as questions related to sales tax revenues (also a part of the formula) and how much of that revenue is generated by student purchases, the answer to the question as to whether (or how) the State funding is affected is not clear. Most likely these factors do not have a major impact on State funding. Unfortunately, there have been no studies conducted to determine how these factors balance out.
While the impact on the State funding of the local school system remains unclear, what is clear is that the tax base in Montgomery County has shifted to local real estate and those business/corporation entities that are taxed at the regular rates. The County gets no relief

Financing the Schools in Montgomery County, Part III: Local Taxes and School Funding 35
from the high concentration of state and other untaxed/low-taxed properties (except for some funds for Federal impact aid; see note below). This likely influences the decisions of County officials and local residents about increasing taxes when those increases fall disproportionately on those businesses and residents who are taxed at the full rate including those less well paid VT and CRC employees residing in low- to moderate-valued real estate property.
In practice, little is likely to happen to persuade owners of low- or no-tax properties to subsidize local government tax revenue beyond what the publicly-owned and non-profit facilities are currently doing. What appears to be clear is that the presence of a large state university and a corporate research center, as well as the other large public facilities in the County, creates an added burden on county taxpayers. At the same time, it also results in a direct and indirect source of considerable benefits to County residents. What is alarming local decision-makers is the accelerating pace of the Virginia Tech Foundation to purchase private commercial property, and lease of those properties to private users who pay, often, a small fraction of the taxes they would pay the county and towns if the property were still privately owned.
The foundation is also acquiring publicly-owned property and using it partially or fully for commercial use, thus competing with privately owned businesses.
The fundamental problem is that State code enables non-profit organizations to lease for private use—often at greatly reduced local real estate tax rates—by tying tax obligations to the length of the private lease. The foundation’s decision to invest in local commercial property can also carry lower risk because this investment can be coordinated with the future plans of the University.
Changing the State code so that there are no tax advantages in the foundation’s leasing to private entities would help resolve this problem. Unfortunately, there appears to be a reluctance to push for these changes.
In the absence of a willingness to initiate those changes in the code, an alternative might be an approach used by the Federal government to compensate for the increased financial burden of providing educational services to students whose parents work on properties that produce no tax revenue to support those programs or services.
Federal Impact Aid. Many local school districts across the United States include within their boundaries parcels of land that are owned by the Federal government or that have been removed from the local tax rolls by the federal government. These school districts face special challenges—they must provide a quality education to the children while sometimes operating with less local revenue than is available to other school districts, because the federal property is exempt from local property taxes.

Financing the Schools in Montgomery County, Part III: Local Taxes and School Funding 36
Since 1950, Congress has provided financial assistance to these local school districts through the Impact Aid Program. Impact Aid was designed to assist local school districts that have lost property tax revenue due to the presence of tax-exempt Federal property, or that have experienced increased expenditures due to the enrollment of federally connected children. The Impact Aid law (now Title VII of the Elementary and Secondary Education Act of 1965 (ESEA)) provides assistance to local school districts with concentrations of children residing on Indian lands, military bases, low-rent housing properties, or other Federal properties and, to a lesser extent, concentrations of children who have parents in the uniformed services or
employed on eligible federal properties who do not live on Federal property.
Over 93% of the $1.3 billion appropriated for FY 2016 is targeted for payment to school districts based on an annual count of federally connected school children. Slightly more than 5% assists school districts that have lost significant local assessed value due to the acquisition of property by the federal government since 1938.
Payments for federally connected children are made to school districts who submit student counts annually for each of the eligible categories. Each category is given a different weight in the funding formula. For example, children who live on and whose parents work on Federal property are given a weight of one, (Type A Students) while children who live in Federal low-rent housing (subject to the Housing Act of 1937) are given a weight of 0.10, and children whose parents are in the military but do not live on base (Type B students)
are given a weight of 0.20. The funding formula also accounts for average daily attendance in the district, percentage of students in the district who are federally connected, how many state and local funds are paid per student in the district, and the amount Impact Aid contributes to the district's total expenditures.1 Congress has funded this grant annually since the inception of the Impact Aid law. In previous years, a school district would need to demonstrate that at least 3% of its student population qualified under one or more of those categories.
There is no comparable legislation in place in Virginia to assist local school divisions who have significant property in their jurisdictions owned by the state and/or large numbers of students whose parents work on those properties. Clearly, there are large numbers of students in Montgomery County whose parents work on properties not subject to local real estate taxes. This loss of funding could be offset by legislation that would provide “impact aid” for school divisions with high concentrations of students whose parents are employed in these settings.
State Impact Aid: What would it mean? If that same 3% rationale was applied to students whose parents are employed in non-taxed state properties in Montgomery County, it is clear that the county schools would qualify for “State Impact Aid” were it to exist. Whether the
1 https://en.wikipedia.org/wiki/Federal_Impact_Aid#cite_note-5
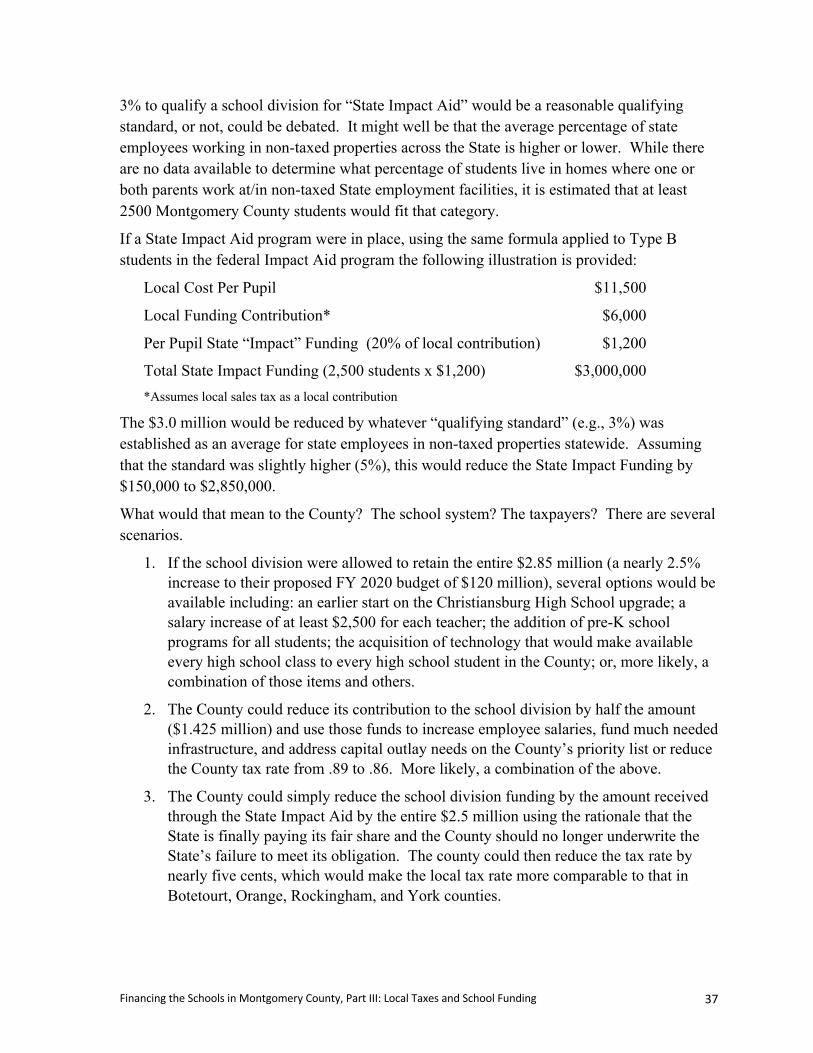
Financing the Schools in Montgomery County, Part III: Local Taxes and School Funding 37
3% to qualify a school division for “State Impact Aid” would be a reasonable qualifying standard, or not, could be debated. It might well be that the average percentage of state employees working in non-taxed properties across the State is higher or lower. While there are no data available to determine what percentage of students live in homes where one or both parents work at/in non-taxed State employment facilities, it is estimated that at least 2500 Montgomery County students would fit that category.
If a State Impact Aid program were in place, using the same formula applied to Type B students in the federal Impact Aid program the following illustration is provided:
Local Cost Per Pupil $11,500
Local Funding Contribution* $6,000
Per Pupil State “Impact” Funding (20% of local contribution) $1,200
Total State Impact Funding (2,500 students x $1,200) $3,000,000 *Assumes local sales tax as a local contribution
The $3.0 million would be reduced by whatever “qualifying standard” (e.g., 3%) was established as an average for state employees in non-taxed properties statewide. Assuming that the standard was slightly higher (5%), this would reduce the State Impact Funding by $150,000 to $2,850,000.
What would that mean to the County? The school system? The taxpayers? There are several scenarios.
1. If the school division were allowed to retain the entire $2.85 million (a nearly 2.5% increase to their proposed FY 2020 budget of $120 million), several options would be available including: an earlier start on the Christiansburg High School upgrade; a salary increase of at least $2,500 for each teacher; the addition of pre-K school programs for all students; the acquisition of technology that would make available every high school class to every high school student in the County; or, more likely, a combination of those items and others.
2. The County could reduce its contribution to the school division by half the amount ($1.425 million) and use those funds to increase employee salaries, fund much needed infrastructure, and address capital outlay needs on the County’s priority list or reduce the County tax rate from .89 to .86. More likely, a combination of the above.
3. The County could simply reduce the school division funding by the amount received through the State Impact Aid by the entire $2.5 million using the rationale that the State is finally paying its fair share and the County should no longer underwrite the State’s failure to meet its obligation. The county could then reduce the tax rate by nearly five cents, which would make the local tax rate more comparable to that in Botetourt, Orange, Rockingham, and York counties.

Financing the Schools in Montgomery County, Part III: Local Taxes and School Funding 38
Long ago, the Federal government reached the conclusion that aid should be provided to schools to compensate for the loss of local tax revenues in communities where parents worked on Federal (non-taxed) properties and the impact that had on those communities. The Federal government has recognized and addressed the problem created when property is not taxed but services are necessary. It is not known whether any state has acknowledged that the same problem exists with respect to heavy concentrations of non-taxed state properties. So far as can be determined, there are no examples of a comprehensive “impact aid” program operating in other states thought there are reported to be some limited programs that provide assistance to local school districts.
Why not? Do not unusually high proportions of non-taxed state property have the same impact as high concentrations of non-taxed federal properties?
Summary • Montgomery County has an unusually high proportion of real estate property that is
either not taxed or taxed at less than the full rate.
• When some properties are not taxed or taxed at a reduced rate, owners of fully taxed properties pay higher taxes for the services provided by the County and local municipalities to compensate for the reduced revenues.
• The State funding of public schools is based on a formula that includes taxpayer’s income, property taxes and sales tax receipts. It is not clear whether the funds County schools receive from the State are influenced by the unusual real estate tax profile in the county.
• The Federal government provides funding to local school districts (Impact Aid) to compensate for the loss of tax revenues associated with Federal ownership of real estate when the parents of enrolled students work on those non-taxed properties.
• The State does not make any adjustment in school funding where large percentages of the parents of enrolled students work in or at untaxed State properties.
• State “Impact Aid” would be one possible way for the State to provide funding for the burden placed on local taxpayers who pay higher level taxes because the state has removed properties from the tax rolls.
• It is highly unlikely that State Impact Aid would be considered as a separate item for legislative action. More likely, if ever considered, it would be as a variable to examine if and when the State Board of Education, the Virginia Department of Education, and the General Assembly undertake a comprehensive review of the way in which State funds are distributed to all school divisions in the Commonwealth.

Financing the Schools in Montgomery County, Part IV: Equal Opportunity for All Students, Executive Summary 39
Part IV: Providing for Equal Opportunity, Executive Summary Part IV of the Montgomery County School Finance Study examines these questions:
1. Do all students in Montgomery County have access to the same level of programs and services?
2. If not, why not?
3. What efforts have been made by the School Board and Administration to provide equal access and opportunity to all students?
Same levels of programs and services: Yes and no. At the elementary level, resources (teacher quality, student teacher ratios, counselor student ratios, access to gifted programs, and other special activities) are roughly equivalent. While some elementary schools and one middle school must deal with overcrowding and/or outdated facilities, measures of student performance indicate that the school division recognizes and is having some success in addressing differences in student needs.
At the high school level, however, there are substantial differences in the opportunities available to students in the four high schools. The number of programs and courses available to students in those schools differ dramatically. Perhaps, as a result of those differences, student output measures (percentage of students with advanced diplomas, advanced placement and dual enrollment, and enrollment in post-secondary programs) is markedly different from school to school.
Differences in student population demographics and school size. These are two primary factors that influence the allocation of resources and programs across the schools. Across the schools, the percentage of students classified as economically disadvantaged ranges from 20% to 75%. The needs and abilities of students in those schools vary greatly and, in part, influence the allocation of resources and the programs/services provided. In addition, especially in the high schools, school size and student interest determine whether courses will be offered or not.
School Board and Administration efforts to optimize learning opportunities for all students. The school division recognizes the demographic difference between and within the several elementary schools and has made efforts to provide additional resources and services to those schools and students most in need.
In the elementary schools:
1. Counselor/Student ratios have been reduced;
2. Reading specialists provided to schools with greater needs;
3. Allteachersnewtothedivisionreceivetrainingforteachingstudentsfrompoverty:

Financing the Schools in Montgomery County, Part IV: Equal Opportunity for All Students, Executive Summary 40
4. Inidentifiedhighpovertyschools,federallysponsored(ESEATitleI)instructionalcoachesareassigned.Theseschoolsalsoreceiveadditionalfundstosupportremediation/tutorialprogramsforstrugglingstudents.
5. State sponsored pre-school programs are located in high poverty elementary schools.
At the high school level:
• Smaller high schools are allowed to schedule under-enrolled electives;
• Technology is allowing students in smaller schools to participate in classes offered at the larger high schools.
To examine these questions in greater depth, read the expanded Part IV section of the report.

Financing the Schools in Montgomery County, Part IV: Equal Opportunity for All Students 41
Part IV: Providing for Equal Opportunity for All Students Data that compare school divisions can be interesting and useful. Those data are also limited in that they often do not provide information as to how resources are distributed within school divisions and the extent to which equal opportunities for ALL students in the system are made available. The challenges associated with comparing schools within a division are at least as complicated as comparing the quality of one school division to another. While it is relatively easy to collect “input” data, e.g., pupil-teacher ratios, number of counselors per student, range of programs for gifted and special needs students, facility conditions, teacher certification, it is much more challenging when one seeks to measure “output” or performance indicators. What measures are important? Test scores? School climate? Attendance? Parent satisfaction? Drop-out percentages? The answer is “It depends.” If there is no common definition of “quality” then any measure will do.
Measuring Student Performance Someone once made the observation that “the most important things are the most difficult to measure”. We can easily measure the number of students who enroll in a government class. We can collect their scores on some sort of instrument measuring their knowledge of local, state and national government. But we do not collect data on their subsequent participation in government e.g. whether they vote or not. We certainly don’t try to measure the quality of the graduate’s decision making processes as they prepare to vote. Regrettably, the measures used most often to assess school system or individual school quality, are standardized test scores of one type or another. Too often, these tests measure low levels of cognition rather than application, analysis, creativity and other higher level thinking skills. It is only recently that other measures (e.g. portfolios, products, performances) have been introduced to assess student performance. Regardless of the instrument or the criteria used for measurement too often one question goes unanswered. Namely, how much growth is the student demonstrating? Only recently, the Virginia Department of Education has begun to examine school and individual student year-to-year growth as a metric more meaningful than simply comparing student scores against other students in the age/grade cohort each year. (Example: A student learner functioning at a level six months behind his peer group on a grade two reading comprehension test, scores three months behind his peer group the following year. While that student is still “below average” (when compared to his classmates), his performance this past year was “above average” and demonstrates success on the part of the student and, likely, the teachers).
Rightly or wrongly test scores are often used as proxies for quality—internationally, state to state, school system to school system and school to school within systems. Consequently, school systems have little alternative other than to emphasize programs and activities that will enhance those scores. For at least 50 years researchers have used “improving test scores” as the rationale for promoting (and evaluating) innovations, initiatives or other “silver bullets”

Financing the Schools in Montgomery County, Part IV: Equal Opportunity for All Students 42
that proport to leave “no child left behind” and result in every population sub-group performing at high levels. Open-space schools, hand’s on curricula, team teaching, teacher quality, carpeted classroom floors, differentiated staffing, air conditioned classrooms, merit pay and numerous other “innovations” or “treatments”— have been implemented with the promise that they would improve student test scores.
After 50 years of research to determine which variable(s) most accurately predict differences in test scores, they are: (a) poverty level and (b) the mother’s academic achievement level that are the most powerful predictors of student achievement. Students coming from homes with comparable economic conditions have comparable test scores regardless of family structure, race or other demographic variables. Schools with larger percentages of students who are “economically disadvantaged” and less well educated mothers, tend to perform at levels lower than members of their cohort group.
With one exception, all of the public schools in Montgomery County are fully accredited—meaning, they meet the State Board of Education’s prescribed Standards of Learning and Standards of Quality (SOQ) requirements. The one school that failed to meet accreditation standards missed the target level of 70% passing the state test in science by five percentage points.
By definition, accredited schools meet the minimum state requirements reflected in those requirements. For the most part, students in all of the Montgomery County schools meet or surpass statewide test score averages on all of the tests required by the state. There are differences (See Tables B, D and F) in the performance of students on standardized tests across the schools in Montgomery County. Socio-economic status (SES) measured by % of students qualifying for free and reduced price lunches, expectations and opportunities likely account for those differences. Whether any of this is relevant can be debated. If in fact, we
measure the wrong things then what difference does it make?
This section (Part IV) of the study is not, however, focused primarily on differences in test scores. It is intended to examine three fundamental questions:
1. Do all students in Montgomery County have access to the same level of programs and services?
2. If not, why not?
3. What efforts have been made by the School Board and Administration to provide equal access and opportunity to all students?
In an effort to answer the first question, data are presented that describe the resources and conditions that exist in the schools that might impact opportunity. Among the questions raised are: • Do some schools have better qualified teachers (more experience, more training)?
• Do some schools have more professional resources (counselors/pupil ratio, teacher/pupil ratio;)?

Financing the Schools in Montgomery County, Part IV: Equal Opportunity for All Students 43
• Do schools have comparable facilities?
• Do all schools have a similar range of programs (gifted, special education)?
• Do high school students have equal access to courses and programs (AP, Dual enrollment, CTE)?
Elementary Schools Equity Concerns Input data including staffing and program offerings in Montgomery County Elementary Schools are displayed in Table 1. A comparison of outputs (performance indicators for all elementary schools) is found in Table 2.
As can be observed in Table 1 there are dramatic differences in the percentage of students classified as economically disadvantaged across the school division. Three schools, Belview, Eastern Montgomery and Prices Fork enroll the highest percentage of economically disadvantaged (51%, 74% and 60%) students for an average of 61%. The average for the three schools (Kipps, Harding and Linkous) with the lowest percentage of economically disadvantaged is about 23%. Using the percentage of students qualifying for free or reduced price lunch provides a similar comparison 61% to 19% for those two sets of schools. Except for those differences there is little or no evidence that students in one school or another are advantaged with respect to the resources, programs, and services available to them.
Interestingly, there are fewer differences in the performance measures reported for each school in Table 2 than in those “input data” displayed in Table 1. While there is some correlation between the performance measures and economic status of students across the schools, the differences are much less dramatic. In most cases the range between the highest and lowest test scores is ten points or less and, in several cases, the lowest score reported is not for one of the three schools with the lowest SES profile.
So, what is the school division doing that might explain why student performance in low SES schools is higher than might be expected.? One possible explanation is found in Table 1, which reports the percentage of students that have been involved in a pre-school program. The three schools with the highest percentages of economically disadvantaged students are also the schools with the highest percentage of students who have had a formal pre-school experience. Students in the low SES schools were twice as likely to have had that experience as those in the higher SES schools.
Research is very clear that, with comparable student populations, pre-school programs have a long lasting positive effect on students enrolled in those programs including fewer dropouts, higher levels of performance on multiple measures, fewer discipline problems, better attendance, and other measures of student success. It is conceivable, and even likely, that the higher than predicted level of student test scores in the lower SES schools is attributable, in part, to the high percentage of those students enrolled in pre-school programs.

Financing the Schools in Montgomery County, Part IV: Equal Opportunity for All Students 44
Table 1
Montgomery County Elementary Schools Demographics and Resource Allocation 2018–2019
Variable Auburn Elem
Belview Elem
C’Burg Elem
C’Burg Primary
E. Mont Elem
F. Branch Elem
Linkous Elem
Harding Elem
Kipps Elem
Beeks Elem
Pr. Fork. Elem
School Division
Grade Levels PK-5 PK-5 3-5 PK-2 PK-5 PK-5 PK-5 K-5 K-5 PK-5 PK-5
Enrollment 556 280 388 458 449 629 380 345 403 444 474
Accreditation Full Full Full Full Full Full Full Full Full Full Full
% Economically Disadvantaged
47.7% 51.3% 49.0% 42.1% 74.3% 45.9% 29.1% 20.5% 19.8% 33.3% 59.5% 39.7% (K-12)
% Free/Reduced Lunches
46.8% 55.4% 45.8% 39.2% 72.0% 40.8% 20.4% 18.1% 18.7% 30.7% 55.6% 35.8% (K-12)
% Inexperienced Teachers
5.9% 3.3% none 4.4% 3.6% 2.0% 6.3% 6.7% none none 9.1% 3% (K-12)
% Provisionally Qualified Tchrs.
2.0% none none none 3.6% none none 3.3% 2.8% 2.6% 4.5% 2.7% (K-12)
% =/> Adv. Degrees
50+% 53+% 70+% 54+% 66+% 51+% 56+% 63+% 55+% 54% 62+% 60+% (K-12)
% Pre-School Experience
29% 57% N/A 26% 61% 30% 24% 5% 11% 34% 53% 30%
Pupil/Teacher Ratio
19.14 18.47 18.62 17.32 17.32 19.38 18.90 18.56 18.95 19.22 18.91 18.63 PreK-5
Counselor/Pupil Ratio
370.66 280 388 458 299.33 419.33 380 345 403 444 316 369.69
Gifted Program Yes Yes Yes Yes Yes Yes Yes Yes Yes Yes Yes

Financing the Schools in Montgomery County, Part IV: Equal Opportunity for All Students 45
Table 2 Montgomery County Elementary Schools Outcome Measures
2018–2019
Variable Auburn Elem
Belview Elem
CB Elem
CB Primary
E. Mont Elem
F. Br. Elem
Linkous Elem
Harding Elem
Kipps Elem
Beeks Elem
Pr. Fork Elem
School Division
State
Grade Levels PK-5 PK-5 3-5 PK-2 PK-5 PK-5 PK-5 K-5 K-5 PK-5 PK-5 ------- -----
Enrollment 556 280 388 458 449 629 380 345 403 444 474 ------- -----
Accreditation Full Full Full Full Full Full Full Full Full Full Full ------- -----
% Students (3-5)
Proficient in
Reading
73%
73%
76%
N/A
69%
81%
84%
79%
80%
78%
75%
81%
78%
% Students (3-5)
Proficient in
Math
83%
77%
89%
N/A
81%
85%
87%
90%
89%
82%
81%
86%
82%
% Chronic
Student Absent
6.1% 8.1% 9.3% 8.6% 14.9% 11.7% 7.7% 3.2% 3.2% 5.9% 11.4% 11.2% -----
English Academic
Passing Rate
72% 82% 82% 82% 77% 88% 90% 86% 89% 83% 82% --- ---
% Students (Gr.5)
Proficient in
Science
77%
78%
83%
N/A
80%
85%
94%
81%
90%
70%
76%
---
---
% Students
Proficient in VA
Studies
73%
63%
73%
N/A
77%
72%
85%
84%
80%
89%
83%
---
---
Kg PALS =/>
Benchmarks
83%
94%
N/A
92%
94%
81%
88%
89%
91%
84%
89%
85%
81%

Financing the Schools in Montgomery County, Part IV: Equal Opportunity for All Students 46
The school division has recognized the difference in the demographics of the several elementary schools and has made efforts to provide additional resources and services to those schools and students most in need. School officials provided these examples:
• Counselor/Student ratios have been reduced;
• Reading specialists are assigned to schools with greater needs;
• Allteachersnewtothedivisionreceivetrainingforteachingstudentsfrompoverty:
• Inidentifiedhighpovertyschools,federallysponsored(TitleI)instructionalcoachesareassigned.Theseschoolsalsoreceiveadditionalfundstosupportremediation/tutorialprogramsforstrugglingstudents.
• State sponsored pre-school programs are located in high poverty elementary schools.
Under the federally funded Elementary and Secondary Act (ESEA), additional resources, including instructional coaches are assigned to Title I Schools. (Only consultation time is provided in other schools). Through the State-funded Pre-School Initiative program, Eastern Montgomery Elementary School and Prices Fork Elementary have two classrooms due to the needs of incoming students in those communities. There are also two pre-school classrooms located at Falling Branch Elementary School. Based on student needs, one of those classrooms would have been assigned to Christiansburg Primary but that facility did not have space available to accommodate the program.
What is not included in either table, is an assessment of the adequacy and condition of the several schools. Overcrowding and the condition of facilities can reduce the effectiveness of teachers and diminish opportunities for student learning. In some cases, programs or services cannot be offered due to lack of space or condition of the building. The condition and/or adequacy of facilities was a major concern for the School Board, administration and Board of Supervisors as they planned their budgets last spring (2019). All parties agreed that something needed to be done to address the problem. The alternatives for solving those problems were not simple. Limited bonding capacity reduced options for new construction and additions to facilities. The plan submitted by the School Board this past spring was designed to provide relief to overcrowding in the Christiansburg area. It delayed for at least three years any resolution of the facility issues at Christiansburg High School. The plan also did not address projected overcrowding issues in Blacksburg; retrofitting or replacement of the Shawsville Middle School facility and identified capital needs on the Board of Supervisor’s list of priorities. Those issues were discussed in greater detail in Part II of this study.

Financing the Schools in Montgomery County, Part IV: Equal Opportunity for All Students 47
Secondary Schools Equity Concerns The data displayed in Tables 3 and 4 illustrate that while staffing and most other resources in the four County Middle Schools are comparable the student profile is markedly different with respect to SES. While 65% of Shawsville Middle School’s students are identified as economically disadvantaged (60% eligible for free or reduced lunch); Blacksburg Middle School has only 27% of its students similarly classified and only 20% (1/3 that of Shawsville) qualified for free or reduced lunch. That factor alone, likely contributes to much of the 20 to 30 percentage point differential between those two schools in reported scores on state prescribed achievement tests.
Table 3 Montgomery County Middle School Demographics and Resource Allocation
2018–2019
Table 4 Montgomery County Middle School Outcomes and Performance Indicators
2018–2019 Measure/School AMS BMS CMS SMS DIV STATE English-Acad/Ach 86% 91% 80% 66% --- ---
Chronic Absences 11.2% 8.1% 15.7% 16.1% --- ---
Reading Performance 83% 88% 79% 69% 81% 78%
Writing Performance 74% 79% 68% 43% 77% 76% Math Performance 85% 89% 82% 71% 86% 82%
Science Performance 72% 86% 79% 62% 83% 81%
History Performance 80% 90% 82% 74% 78% 80%
Consistent with the data reported for elementary and middle schools, Table 5 suggests that there are few significant differences in the allocation of personnel resources in the county’s
Variable/School AMS BMS CMS SMS Accreditation Full Full Full Conditional
Enrollment (1/1/19) 285 965 782 224
% Econ. Disadvantaged 50% 27% 46% 65%
% Free/Reduced 41% 20% 43% 60% % Inexperienced Tchrs. 2.9% None 1.5% none
% Prov. Certif. none 5.2% 1.5% none
%=/> Masters Deg. 46% 57% 62% 69%
Staff/Student Ratio 18.51 21.29 19.97 14.51
Counselor/Stud. Ratio 307:1 320:1 273:1 215:1

Financing the Schools in Montgomery County, Part IV: Equal Opportunity for All Students 48
four high schools. There are, however, major differences in the percentages of economically disadvantaged students attending the four high schools.
Table 5
Montgomery County High Schools Demographics and Resource Allocation 2018–2019
*First-year teachers
While Table 5 demonstrates that the teacher, counselor and other support systems available to high school students are equivalent, it is clear that the courses and program options are not equivalent (See numbers of Advanced Placement (AP) and Dual Enrollment (DE) classes available at each school.) Students attending Auburn High School and Eastern Montgomery High School have a much smaller menu of courses from which to choose. The major factors contributing to those decisions are the size of the school population and the economics of providing staff and resources for a class that may have only a very few students indicating an interest in it.
Variable/School AHS BHS CHS EMHS DIV Accreditation Full Full Full Full 4 of 4
Enrollment 1/1/19 409 1,201 1,030 264 2904
% Econ. Disadvantaged 37% 20% 38% 64% 32.6%
% Free and Reduced Lunch 30% 16% 33% 59% 27.9% % Inexperienced Teachers.* 4.8% 1.0% 6.1% 2.4% 3.0% % Prov. Qual. Teachers none 2.0% 9.1% 4.9% .3% %=/> MS Degree 70% 71% 66% 60% 54%
Staff/Student Ratio 20.0:1 23.2:1 19.9:1 16.4:1 20.3:1
Counselor/Student Ratio 193:1 316:1 252:1 274:1 248:1
Number AP Classes Available 9 21 13 8 ----
Number DE Classes Available 33 50 38 33 ----

Financing the Schools in Montgomery County, Part IV: Equal Opportunity for All Students 49
Table 6 Montgomery County High School Outputs and Performance Indicators
2018–2019
While between school test score data and other output data (graduation rate, dropouts, state test results and absenteeism) are not dramatically different, there are some differences; notably between the school with the highest SES profile (Blacksburg) and the school with the
9-12 Enrollment
State
Division
Auburn HS 409
B’Burg HS 1201
C’Burg HS 1030
E Mont HS 264
Reading: Proficiency 78% 81% 90% 94% 83% 82%
Chronically Absent --- 11.2% 13.2% 12.1% 17.2% 22.7% Drop Out 5.6% 3.2% 2 .8% 2.0% 4.5% 4.2% Graduation/Completion 91.5% 96.0% 97.0% 97.0% 95+% 95+% College/Career Readiness
Adv. Diploma 51.5% 56.9% 51.4% 70.1% 51.5%% 29.2% Standard Dip. 40.0% 39.1% 42.9% 25.7% 39.8% 56.9%% Drop Out 5.5% 3.4% 2.8% 2.0% 4.5% 4.2% GED/other 2.9% 1.2% 2.8%% 2.0% 4.2% 9.7% Post-Secondary Enroll. --- --- 69% 80.% 75.% 57.0% Assessment Data Writing --- --- 84% 79% 82% 74% Math --- --- 93% 91% 93% 86% Science --- --- 85% 91% 83% 75% History --- --- 76% 83% 73% 56%
2018-19 AP Enrollment AP Enrollment N/% 26.4% 72/17.39% 517/42.83% 136/13.06% 50/18.59% Tests Taken N/% 20.95% 62/14.98% 456/37.78% 92/8.84% 4/1.49% Dual Enrolled N/% 30.09% 103/24.88% 451/37.37% 259/24.88% 60/22.3%
2017-18 AP Test Data*
Test Takers 41 336 94 Insuf. Data # Tests 61 636 130 Insuf. Data #/w Pass Score 39 538 54 Insuf. Data
Passing Rate 63.9% 84.6% 41.5% Insuf. Data
Technical Education Programs
Number and Percentage of Students Earning one or
More Credentials
N=87 / 21%
N=379 /13%
N=325 / 32%
N = 28 / 11%
CTE Completers N and % N=73 /18% N=154 / 13%
N=47 / 5% N=28 / 11%

Financing the Schools in Montgomery County, Part IV: Equal Opportunity for All Students 50
largest percentage of economically disadvantaged students (East Mont). These data support the premise that students in schools with higher levels of poverty are less likely to graduate with advanced diplomas, enroll in advanced placement and dual enrollment classes and participate in post-secondary programs. It should also be noted that students in Eastern Montgomery High School have fewer AP and Dual Enrollment courses from which to choose because of size/cost considerations. The school division has made efforts to address the dual problem of reduced opportunities and academic challenges in those schools by providing additional resources e.g. providing staff to teach under-enrolled classes and using technology to “stream” classes to interested students. In addition, instructional coaches are assigned to schools with larger percentages of students requiring academic support services.
Opportunity/Equity/Equality: Are They the Same? Is equal the same as equitable? Equal funding is a simple construct—every school in the system receives the same resources on a per pupil basis. Even with such a simple definition, equal funding of schools is much more complicated. Even more so at the student level. Does the student in a 28 student classroom receive the same attention as a student in a 21 student classroom? Are all teachers created equal? Can we assume that all facilities provide an equally conducive learning environment? Of course not.
Efforts to provide equal resources are generally assessed using input as a proxy for equal. In other words, is the teacher-pupil ratio roughly the same when comparing schools? Are counseling services equivalent (similar students/counselor ratio)? Are program offerings (gifted programs, foreign language programs, extra-curricular programs) essentially the same?
Shouldn’t we expect that equal inputs will produce equal outputs (measures of student performance)? But what if the participants (students) in those programs differ markedly from school to school? They differ in the sense of what students bring to school (e.g., pre-school preparation, family support and stability, books in the home, internet access, health and nutrition). Some students come to school with limited pre-school learning experience; sometime hungry, less healthy and on balance, less receptive to the learning experiences they will encounter in the school setting. Should we assume “one size fit’s all” when we provide the same learning experience for all students in all schools regardless of their differences?
Probably not.
Given that reality—What Is? Or, What should be the school system’s responsibility to address those issues? In our schools? Before the children come to school?
A federal initiative. In the early 1960s, Congress passed the Elementary and Secondary Education Act (ESEA). Title I ESEA recognized that students in schools with higher levels of poverty perform less well than students in schools with low poverty levels. Students in

Financing the Schools in Montgomery County, Part IV: Equal Opportunity for All Students 51
those high poverty schools were less likely to have well educated parents, lower expectations, fewer with pre-school program experience, fewer books (computer access) in the home; parents unable or less willing to spend time reading to their children; poor nutrition and a variety of other factors less conducive to learning.
The Elementary and Secondary Education Act was funded on the proposition that many students with those deficiencies could, with extra help, achieve at much higher levels. That, frankly, our country was ignoring an untapped resource by not helping all students reach their potential. Thus, was born ESEA Title I. Title I funds are appropriated to provide compensatory education programs (additional resources) in support of students in high poverty schools. These programs, and others like them (i.e. pre-school initiative) are based on the proposition that equity and opportunity do not necessarily mean equal. That more difficult problems require more attention than simple problems. That disadvantaged students need more resources to bring their achievement level nearer to that of students in “richer” environments.
The Virginia Preschool Initiative Program. The Virginia Preschool Initiative distributes state funds to schools and community-based organizations to provide quality preschool programs for at-risk four-year-olds unserved by the Federal Head Start program.
The purpose of the grant is to reduce disparities among young children upon formal school entry and to reduce or eliminate those risk factors that lead to early academic failure. The Montgomery County Schools have nine preschool classrooms assigned to seven different elementary schools.
Equal is not equitable. The illustration that follows provides a graphic illustration of the difference between those two concepts. Equity requires a disproportionate response in support of those schools whose students favor greater challenges. Tables 1, 3, and 4 provide data that illustrates difference in the profiles of student who attend Montgomery County elementary schools and a summary of the resources available to students in each of the schools.
Putting aside the question of how much responsibility the schools (or society) should take in correcting the fundamental inequities that exist in parental income, employment opportunities, family structures, and other factors that predict student success, schools must deal with the reality that those differences do exist and that they do influence student learning.
Accountability. There is also disagreement as to whether schools should be held accountable for (a) providing equal opportunities for all students or (b) guaranteeing that all students will be able to perform at a high level. The recently discarded “No Child Left Behind” initiative postulated that all students would perform at a prescribed high level given sufficient time and resources. One observer noted that such an expectation was akin to assuming that with

Financing the Schools in Montgomery County, Part IV: Equal Opportunity for All Students 52
enough time and lots of coaching, every student could run the 100-yard dash in 12.0 seconds or less.
If one takes as a working definition of equity that: (1) “ALL students will be provided with an opportunity to achieve at the highest level”; and (2) that the school system will make every effort to help student’s achieve at the highest level of their capabilities; then school divisions will need to differentiate the way they allocate resources and take into consideration the variations in student needs and abilities.
Obviously ESEA funding and the Pre-School Initiative are two externally funded initiatives that address these goals. The earlier tables, in addition to describing the differences in school populations, also provide a partial overview of how resources are allocated. The Montgomery County School Board and administration have made some adjustment in the way resources are allocated to direct additional (not equal) resources to support programs and services in schools with students evidencing the greatest needs. Several of those initiatives have been described earlier.
Opportunity defined. Opportunity in a school system is the concept that every student will have available and access to the same level and quality of programs and services regardless of the which school they attend. Is equal opportunity provided to every student enrolled in the Montgomery County Division. The short answer to that is NO! This is especially

Financing the Schools in Montgomery County, Part IV: Equal Opportunity for All Students 53
evident if one examines “opportunity indicators” at the high school level. The list of “opportunity indicators” includes items like the number of electives available; the number of advanced placement and dual enrollment classes; the number of CTE (technical certification) courses; the number and breadth of the co-curricular and extra-curricular programs available; internship opportunities and more.
School size, opportunity and politics. Why does there appear to be such a large discrepancy in the number and range of these opportunities? First and foremost, the answer is school size. The number of students enrolled in the MCPS high school senior classes ranges from about 70 (Eastern Montgomery) to just over 300 (Blacksburg). The late 60’s decision to maintain four high schools in the county was, in large part, driven by the political reality that voters in the Shawsville and Riner portion of the county would not have supported a decision that would have required them to give up their “community” schools and send their children to Christiansburg or Blacksburg. Over time all four communities had new high schools constructed for their parts of the county. The downside of that decision was that the smaller schools would not have the same range of programs and services available to their students. Today, as the size differences have increased, the opportunity differential has also increased.
Summary 1. All students in Montgomery County do not have access to the same level of programs
and services. While those differences are modest at the elementary and middle school levels, they are pronounced at the high school level.
2. The differences in program and service availability from school to school (especially across the four high schools) is primarily a function of school size. To a lesser extent, student interests and abilities define the curriculum and services offered at each school.
3. The school division administration and School Board recognize these differences and have made efforts to minimize the differences by: (a) allocating proportionately more resources to the smaller, less efficient schools that allow “under-enrolled” classes to be offered and (b) providing access to students in the smaller high schools through the use of innovative instructional practices and technology.
It is unknown how the menu of programs and services offered in the school division will be impacted by the Coronavirus. It seems unlikely that the school division revenues will be increased and, most likely, will be reduced as a result of the economic disaster that has accompanied the virus. Consequently, efforts to enhance program offerings in the smaller high schools will likely be delayed for some time. It remains to be seen whether the efforts to provide virtual educational programs and services will expand as a result of the school division’s experiences in delivering online or packaged instructional programming.