finding restaurant investment opportunities as the...
TRANSCRIPT
?
April 2015
September 2014
Finding Restaurant Investment Opportunities as the Moat-Disruptive Fast-Casual Category Matures
Executive Summary
Restaurants have been one of the most intriguing categories within the consumer space the past several
years, with fast-casual chains like Chipotle and Panera increasingly becoming disruptive forces for both
traditional quick-service and casual-dining restaurant chains. Broadly speaking, we believe that many
fast-casual concepts warrant premium valuations relative to their peers because of the pricing power
inherent in their brands—the impetus for positive moat trends for many players in the space—as well
as a cost-effective model than casual-dining players. However, as many established fast-casual chains
reach maturity at a time when smaller emergent players have relatively easy access to attractive real
estate and inexpensive rents, we believe investors must be cognizant of the potential fast-casual
"bubble" in the market today.
Additionally, increased competition from fast-casual players has triggered many strategic
countermeasures to unlock value across other quick-service and casual-dining restaurant chains. This
includes more straightforward efforts such as localized/regional menu and marketing decisions,
increased customization, mobile ordering, and reimaging efforts leveraging digital platforms but also
more aggressive tactics such as more aggressive franchising/refranchising, real estate transactions, and
spin-offs. In this report, we also examine which strategic actions can realistically unlock shareholder
value, and opportunities where these efforts haven't been priced into the stocks.
Morningstar’s Top Restaurant Investment Ideas
Name/Ticker
Economic
Moat
Moat
Trend
Currency
Fair Value
Estimate
Current
Price
Uncertainty
Rating
Morningstar
Rating
Credit
Rating
Market
Cap(Bil)
Panera PNRA None Positive USD 184.00 165.97 Medium QQQQ — 4.4
Starbucks SBUX Wide Positive USD 50.00 47.62 Medium QQQ A- 71.4
Yum Brands YUM Narrow Stable USD 88.00 78.30 Medium QQQQ BBB 33.9
Contents
2 Key Takeaways
5 Best Ideas
7 Fast-Casual Has Reshaped Preferences
Across the Restaurant Category,
Resulting in Material Changes in
Industry Pricing Power
27 Are There Any Restaurant Investment
Opportunities in a Market Willing to Pay
More Than 500 Times for Shake Shack?
49 Assessing Traditional Restaurants'
Countermeasures to Fast-Casual
Competitive Pressures
67 How Have Restaurant Industry
Changes Reshaped Our Moat Rating
Methodology?
Restaurant Coverage Universe
69 Panera
71 Yum Brands
73 Starbucks
75 Restaurant Brands International
77 McDonald's
79 Chipotle
81 Darden
83 Dunkin' Brands
85 Appendix
Consumer Observer | 9 April 2015
Healthcare Observer | 14 April 2015
Page 2 of 86
Page 2 of 86
Key Takeaways
Fast-Casual Has Reshaped Preferences Across the Restaurant Category, Resulting in Material
Changes in Industry Pricing Power
× Fast-casual restaurants have better adjusted to changes in consumer behavior during the past several
years, including increased spending power among minority groups and millennials (which has created
demand for a wider variety of flavors, better-for-you products, and locally sourced food), evolving views
about in-restaurant experiences (resulting in consumer calls for customizable menus and faster
throughput), and widespread advances in consumer-facing technologies (leading to mobile-based
ordering, payment, and loyalty programs as well as in-restaurant wireless offerings).
× More important, consumers aren't just willing to visit fast-casual chains more frequently; they're also
willing to pay premium prices for the product and restaurant experience. The companies that have
stayed ahead of changing consumer preferences have also experienced a meaningful increase in
average checks during the past five years, while the increase for traditional quick-service restaurants, or
QSRs, has been more muted. In our view, the increase in average check suggests greater pricing power,
and by extension, a strengthening of the brand intangible asset source that we consider when
evaluating economic moats among retailers and restaurants.
× The ability to adapt to evolving consumer preferences, and the subsequent pricing power, was a key
consideration behind the positive moat trends we've assigned to fast-casual chains such as Chipotle and
Panera as well as Starbucks. Likewise, the inability to react to these changes was a factor in our
negative moat trend for McDonald's and the removal of our narrow moat rating for Darden.
Are There Any Restaurant Investment Opportunities in a Market Willing to Pay 500 Times for
Shake Shack?
× With fast-casual restaurants aligned with changes in consumer dining-out preferences and favorable
retail rent and vacancy trends, we expect the fast-casual category revenue to grow at a compound
annual growth rate (CAGR) of 9.4% during the next five years, taking share from QSRs and casual-dining
restaurants, or CDRs, which we expect to grow 4.1% and 3.7%, respectively.
× The rise of e-commerce has reduced the number of reliable growth concepts among traditional retailers,
which we believe has led to higher valuations across much of the restaurant industry (which now trades
at a forward price/earnings multiple of almost 26 times, up from 16 times five years ago). While some of
this multiple expansion is warranted given the growth potential and the lack of a major disruptive
presence like Amazon, we generally believe the market has overshot the longer-term potential of many
fast-casual concepts such as Noodles & Company, Zoe's Kitchen, and Habit Restaurants.
× Conversely, we find shares of Panera attractive at current levels and believe the market isn't giving the
company enough credit for its longer-term unit growth opportunities (both traditional locations and
delivery and catering hubs) and the cash flow potential of its "Panera 2.0" restaurant remodeling
initiative.
Lead Analyst
R. J. Hottovy, CFA
Consumer Equity Strategist
+1 312-244-7060
Consumer Observer | 9 April 2015
Healthcare Observer | 14 April 2015
Page 3 of 86
Page 3 of 86
Assessing Traditional Restaurants' Countermeasures to Fast-Casual Competitive Pressures
× We believe consumers' willingness to pay premium prices has been at the heart of the recent QSR
industry movement toward fewer menu items, but more customization options. However, we believe it
will take time for QSRs to realize the benefits of these menu changes, where rationalizing the number of
menu items helps speed up service and customer experience improves over the next year or so followed
by increased awareness and adoption of menu customization options.
× For many traditional restaurant operators, we believe that expansion into other dayparts (breakfast and
snacking, for example), increased adoption of technology to increase throughput via mobile ordering and
payments, and greater delivery/catering alternatives have the potential to improve store productivity
through both increased guest counts and higher average checks. We view each of the Best Ideas that
we've highlighted in this report—Panera, Starbucks, and Yum Brands—as well-positioned to achieve
better utilization trends out of their existing restaurants in the years to come.
× While refranchising isn't the sole factor driving multiple expansion in the industry, it's noteworthy that
the companies that have pursued refranchising more aggressively have generally experienced greater
multiple expansion over the past five years. We believe McDonald's will probably explore refranchising
options in the near future, as recently appointed CEO Steve Easterbrook has said he is committed to
considering "all options" to improve shareholder value. However, refranchising efforts at Panera and
Yum could also provide positive catalysts over the next several years.
× We believe the market's appetite for potential real estate transactions have increased over the past year
given the current low interest-rate environment and REIT spin-off announcements from other retailer
and restaurant chains. With $39 billion in land and building assets on its balance sheet as of December
2014 and $6.1 billion in rents collected from franchisees last year, McDonald's remains a popular target
for real estate transactions among activist investors and hedge funds. The potential tax savings would
ultimately depend on how much real estate the company was willing to commit to a property company
subsidiary, but because REITs must pay out at least 90% of taxable earnings to shareholders as
dividends and don't pay federal income taxes on income distributed to shareholders, we believe
McDonald's could unlock shareholder value by creating an internal REIT.
× We generally have mixed views on separating multibrand restaurant companies into separate publicly or
privately held entities. On one hand, we appreciate that different chains have different target audiences,
growth trajectories, and capital needs, which can put considerable strain on management teams. On the
other hand, separating brands also runs the risk of trading short-term gains for diminished scale
advantages—particularly with respect to overhead, purchasing, and advertising—which can destroy
value. The idea of separating Yum's China division has some merit, as we've long thought that Yum was
much more than a China growth story and believe that separation would allow investors to tailor their
level of exposure to China and Yum's other emerging markets. Additionally, Yum China is a mostly self-
contained supply chain, distribution, site selection, and advertising ecosystem, and we believe a
separation would be relatively seamless from an operating perspective and would not sacrifice
meaningful scale advantages.
Consumer Observer | 9 April 2015
Healthcare Observer | 14 April 2015
Page 4 of 86
Page 4 of 86
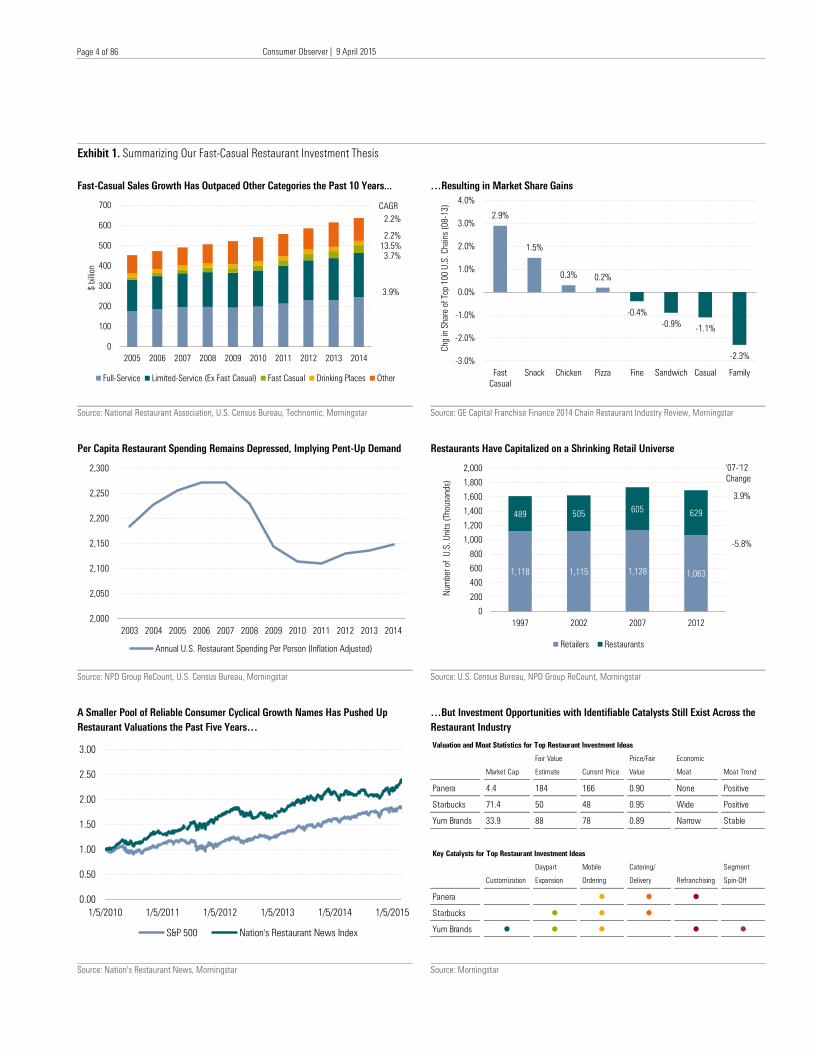
Exhibit 1. Summarizing Our Fast-Casual Restaurant Investment Thesis
Fast-Casual Sales Growth Has Outpaced Other Categories the Past 10 Years... …Resulting in Market Share Gains
Source: National Restaurant Association, U.S. Census Bureau, Technomic, Morningstar Source: GE Capital Franchise Finance 2014 Chain Restaurant Industry Review, Morningstar
Per Capita Restaurant Spending Remains Depressed, Implying Pent-Up Demand Restaurants Have Capitalized on a Shrinking Retail Universe
Source: NPD Group ReCount, U.S. Census Bureau, Morningstar Source: U.S. Census Bureau, NPD Group ReCount, Morningstar
A Smaller Pool of Reliable Consumer Cyclical Growth Names Has Pushed Up
Restaurant Valuations the Past Five Years…
…But Investment Opportunities with Identifiable Catalysts Still Exist Across the
Restaurant Industry
Source: Nation's Restaurant News, Morningstar Source: Morningstar
0
100
200
300
400
500
600
700
2005 2006 2007 2008 2009 2010 2011 2012 2013 2014
$ b
illion
Full-Service Limited-Service (Ex Fast Casual) Fast Casual Drinking Places Other
CAGR
2.2%
2.2%
13.5%
3.7%
3.9%
2.9%
1.5%
0.3% 0.2%
-0.4%
-0.9%-1.1%
-2.3%-3.0%
-2.0%
-1.0%
0.0%
1.0%
2.0%
3.0%
4.0%
Fast
Casual
Snack Chicken Pizza Fine Sandwich Casual Family
Chg in S
hare o
f Top 1
00
U.S
. C
hain
s (
08
-1
3)
2,000
2,050
2,100
2,150
2,200
2,250
2,300
2003 2004 2005 2006 2007 2008 2009 2010 2011 2012 2013 2014
Annual U.S. Restaurant Spending Per Person (Inflation Adjusted)
1,118 1,115 1,128 1,063
489 505605
629
0
200
400
600
800
1,000
1,200
1,400
1,600
1,800
2,000
1997 2002 2007 2012
Num
ber o
f U
.S.
Unit
s (
Thousands)
Retailers Restaurants
'07-'12
Change
3.9%
-5.8%
0.00
0.50
1.00
1.50
2.00
2.50
3.00
1/5/2010 1/5/2011 1/5/2012 1/5/2013 1/5/2014 1/5/2015
S&P 500 Nation's Restaurant News Index
Valuation and Moat Statistics for Top Restaurant Investment Ideas
Market Cap
Fair Value
Estimate Current Price
Price/Fair
Value
Economic
Moat Moat Trend
Panera 4.4 184 166 0.90 None Positive
Starbucks 71.4 50 48 0.95 Wide Positive
Yum Brands 33.9 88 78 0.89 Narrow Stable
Key Catalysts for Top Restaurant Investment Ideas
Customization
Daypart
Expansion
Mobile
Ordering
Catering/
Delivery Refranchising
Segment
Spin-Off
Panera l l l
Starbucks l l l
Yum Brands l l l l l
Consumer Observer | 9 April 2015
Healthcare Observer | 14 April 2015
Page 5 of 86
Page 5 of 86
Best Ideas
Below, we've highlighted a handful of investment ideas that we believe are well-positioned to capitalize
on the themes we've discussed or are insulated from disruptive changes in the industry. Each company
has a wide or narrow moat and/or a positive moat trend and trades at a discount to our fair value
estimate.
Panera
Accelerating restaurant guest counts give us greater conviction that "Panera 2.0" customer-experience
investments—peak-hour throughput capacity, more accessible prices, new marketing tactics, and digital
ordering—can drive sustainable top-line momentum. We're also optimistic about Panera's new growth
avenues such as delivery and catering hubs, consumer packaged goods, and its usage of mobile devices
and other digital technology to engage with consumers and improve store-level operations, all of which
are poised to become more meaningful cash-flow contributors. The costs of these investments are
expected to weigh on profitability through 2015. However, as comparable transaction trends continue to
improve and customer-experience investments wind down, we believe Panera's longer-term margin
opportunities will become more apparent. Looking beyond 2015, however, our model assumes low- to
mid-single-digit comps (even in light of increased fast-casual competition), resulting in roughly 9%
average annual revenue growth. During that same time horizon, we expect restaurant-level margins to
grow to the 21% range compared with 17.9% in 2014, with operating margins expanding to around 16%
driven by higher-margin menu additions (including a mix shift to the breakfast daypart), increased fixed-
cost leverage, a vertically integrated supply chain, and contribution from catering and delivery
operations.
In addition, Panera's refranchising efforts—including plans to refranchise 50-150 locations this year and
expand franchise ownership to 55%-65% of the system over time —comes on the heels of similar
announcements across the industry and could accelerate Panera 2.0 conversions while allowing
management to focus more on brand, menu innovation, and marketing efficacy
Starbucks
We view Starbucks as one of the most compelling growth stories in the consumer space today, poised
for top-line growth and margin expansion through menu innovations, sustainable cost advantages, and
its evolution into a diversified retail and consumer packaged goods platform. Although it is already the
leading specialty coffee retailer in the U.S., we believe Starbucks has meaningful domestic growth
potential, including new store formats (smaller-format express stores, drive-thrus, beverage trucks, and
square footage reallocation for its premium Starbucks Reserve sub-brand), greater peak-hour capacity,
expanded food offerings, lunch/evening daypart expansion, mobile payments and delivery, and My
Starbucks Rewards usage. At a time when most restaurants and retailers are struggling to stimulate
traffic growth, Starbucks' recent transaction gains suggest that it remains a key consumer destination,
validating the strength of its brand intangible asset.
Starbucks is much more than a retail story, however, and we believe it is just starting to scratch the
surface of its longer-term channel development, brand diversification, and geographic expansion
potential. Many of Starbucks' core retail competitive advantages should extend into these efforts,
Consumer Observer | 9 April 2015
Healthcare Observer | 14 April 2015
Page 6 of 86
Page 6 of 86
putting the company in a unique position to capture retail and wholesale market share. Platforms like
VIA Instant coffee and K-Cups should support channel diversification efforts over the medium term, with
nascent brands like Teavana, La Boulange, and Evolution Fresh becoming important cash flow
contributors over an extended horizon. We're also optimistic about mobile, digital, and loyalty program
synergies across the various business lines. Starbucks' international growth opportunities are
undeniable--particularly in China, India, Japan, and Brazil--and we believe best practices from its U.S.
operations can be applied to these regions to drive future growth. Competitive threats exist in both the
retail and wholesale channels, but we believe a wide moat founded on strong brand equity, bargaining
clout with suppliers of all kinds, and an increasingly leverageable model will be enough to stave off
rivals.
Yum Brands
Although rivalry among quick-service restaurants is on the rise globally, we believe Yum Brands offers
investors an intriguing long-term global growth alternative. Our optimism stems from a narrow economic
moat derived from strong brand intangible assets in KFC, Pizza Hut, and Taco Bell as well as a scalable
franchise business model. Although Greg Creed assumed the reins from longtime CEO David Novak at
the beginning of the year, we believe Yum's playbook will remain the same: Combine unit growth and
same-store sales layers to drive systemwide sales, increase operating leverage, and bolster returns on
capital. This approach has served Yum well in the past and should help it withstand an evolving
restaurant category marked by new sources of competition and changing consumer preferences and
tastes.
Yum China comps have remained under pressure in early 2015 amid concerns about improper food
handling practices at one of the region's key beef and poultry suppliers, but we believe its brands can
withstand these issues through quality-assurance marketing and menu revamps. We remain optimistic
about Yum China's long-term potential because of its established distribution infrastructure and local
site-development teams, and we generally find management's division goal of 20% restaurant margins
and 15% normalized operating income growth reachable through low-double-digit unit growth, midteen
system sales growth, and moderate general and administrative expense leverage, partly tempered by
promotional activity and labor cost inflation.
With roughly 40% of Yum's operating income coming from China, the stock is tied to market perceptions
of macro and consumer trends in the region. However, we view Yum as more than a China story and
encourage investors to evaluate Yum's other divisions. With KFC, Pizza Hut, and Taco Bell consolidated
by brand in every region except China and India, we have started to see increased unit and comp growth
with margin expansion via centralized brand support and best-practice sharing across regions. Coupled
with a goal of 95% system franchisee ownership by 2017 (excluding China and India), we view
management's long-term goal of companywide 10% operating income growth as achievable. K
Consumer Observer | 9 April 2015
Healthcare Observer | 14 April 2015
Page 7 of 86
Page 7 of 86
Executive Summary
Restaurants have been one of the most dynamic industries within the broader consumer cyclical sector
during the past several years, influenced by a wide range of company, industry, and macroeconomic
factors. Retracing the past five years within the category, we believe many of the beneficiaries of these
industry changes can be found in the fast-casual restaurant category, whose participants offer higher-
quality ingredients and command greater pricing power than traditional quick-service chains but are
more cost-effective to operate than casual-dining restaurants due to smaller formats but higher-
throughput locations lacking a traditional waitstaff. The fast-casual category has been the sweet spot
within the restaurant category in recent years, outpacing the other categories and creating a ripple
effect across much of the restaurant industry, with traditionally more affluent QSR patrons gravitating to
fast-casual chains and the pricing power of many of CDR chains deteriorating as they resort to more
aggressive discounting to remain competitive.
In this section of this report, we examine the industry changes driving the success of fast-casual
restaurants in greater detail, the sustainability of these trends, and the implications for pricing power
(and by extension, economic moats) for the rest of the restaurant industry.
Key Takeaways
× Fast-casual restaurants have better adjusted to changes in consumer behavior the past several years,
including increased spending power among minority groups and millennials (which has created demand
for a wider variety of flavors, better-for-you products, and locally sourced food), evolving views about in-
restaurant experiences (resulting in consumer calls for customizable menus and faster throughput), and
widespread advances in consumer-facing technologies (leading to mobile-based ordering, payment, and
loyalty programs as well as in-restaurant wireless offerings).
× More important, consumers aren't just willing to visit fast-casual chains more frequently; they're also
willing to pay premium prices for the product and restaurant experience. Restaurants that have stayed
ahead of changing consumer preferences have also experienced a meaningful increase in average
checks the past five years, while the increase for traditional QSR players have been more muted. In our
view, the increase in average checks suggests greater pricing power, and by extension, a strengthening
of the brand intangible asset source that we consider when evaluating economic moats among retailers
and restaurants.
× The ability to adapt to evolving consumer preferences and the subsequent pricing power was a key
consideration behind the positive moat trends we've assigned to fast-casual players such as Chipotle
and Panera as well as Starbucks. Likewise, the inability to react to these changes was a factor in our
negative moat trend for McDonald's and the removal of our narrow moat rating for Darden.
Fast-Casual Has Reshaped Preferences Across the Restaurant Category, Resulting in Material Changes in Industry Pricing Power
R. J. Hottovy, CFA
Consumer Observer | 9 April 2015
Healthcare Observer | 14 April 2015
Page 8 of 86
Page 8 of 86
Evolving Consumer Preferences Are At the Root of Fast-Casual Restaurant Growth
We attribute much of the success of fast-casual chains the past several years to their ability to adapt to
evolving consumer expectations across the restaurant industry. Many of these consumer changes are
characteristic of larger consumer industry trends, including increased spending power among minority
groups and millennials (which has created demand for a wider variety of flavors, better-for-you products,
and locally sourced food), evolving views about in-restaurant experiences (resulting in consumer calls for
customizable menu offerings products and faster throughput), and widespread advances in consumer-
facing technologies (leading to mobile-based ordering, payment, and loyalty programs as well as in-
restaurant wireless offerings). The impact of these changes among consumer behaviors has been
widespread, leaving many established restaurant players playing catch-up.
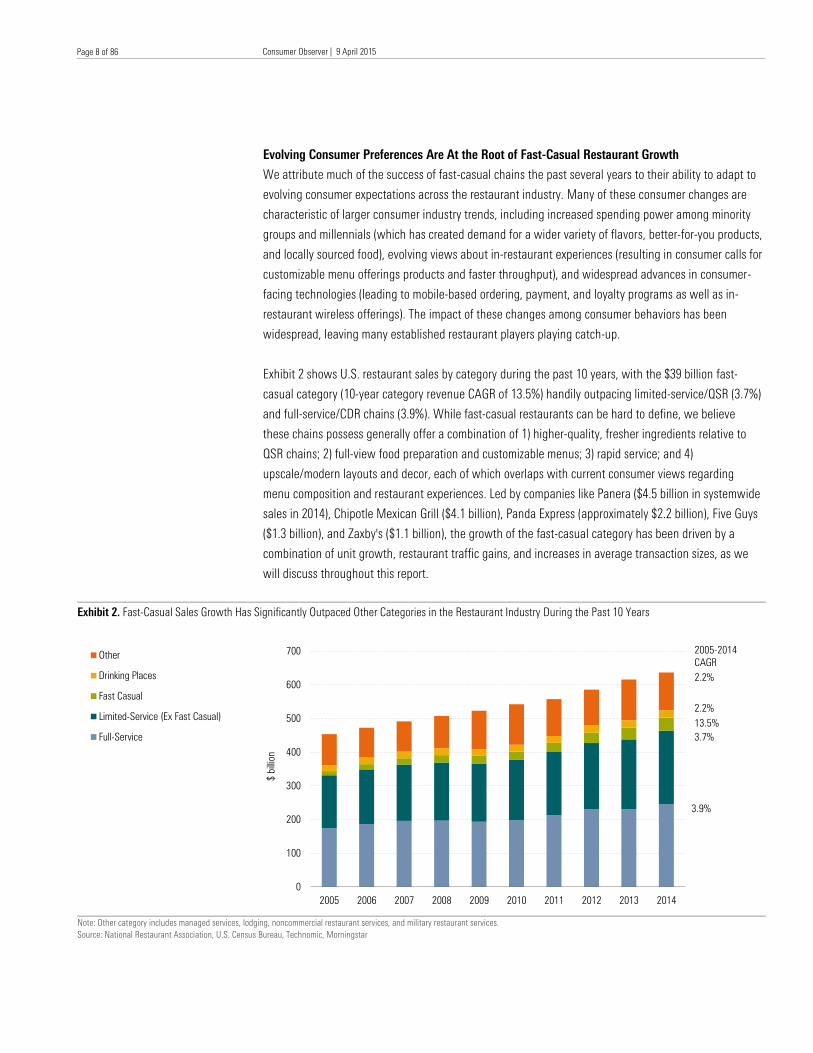
Exhibit 2 shows U.S. restaurant sales by category during the past 10 years, with the $39 billion fast-
casual category (10-year category revenue CAGR of 13.5%) handily outpacing limited-service/QSR (3.7%)
and full-service/CDR chains (3.9%). While fast-casual restaurants can be hard to define, we believe
these chains possess generally offer a combination of 1) higher-quality, fresher ingredients relative to
QSR chains; 2) full-view food preparation and customizable menus; 3) rapid service; and 4)
upscale/modern layouts and decor, each of which overlaps with current consumer views regarding
menu composition and restaurant experiences. Led by companies like Panera ($4.5 billion in systemwide
sales in 2014), Chipotle Mexican Grill ($4.1 billion), Panda Express (approximately $2.2 billion), Five Guys
($1.3 billion), and Zaxby's ($1.1 billion), the growth of the fast-casual category has been driven by a
combination of unit growth, restaurant traffic gains, and increases in average transaction sizes, as we
will discuss throughout this report.
Exhibit 2. Fast-Casual Sales Growth Has Significantly Outpaced Other Categories in the Restaurant Industry During the Past 10 Years
Note: Other category includes managed services, lodging, noncommercial restaurant services, and military restaurant services.
Source: National Restaurant Association, U.S. Census Bureau, Technomic, Morningstar
0
100
200
300
400
500
600
700
2005 2006 2007 2008 2009 2010 2011 2012 2013 2014
$ b
illion
Other
Drinking Places
Fast Casual
Limited-Service (Ex Fast Casual)
Full-Service
2005-2014
CAGR
2.2%
2.2%
13.5%
3.7%
3.9%
Consumer Observer | 9 April 2015
Healthcare Observer | 14 April 2015
Page 9 of 86
Page 9 of 86
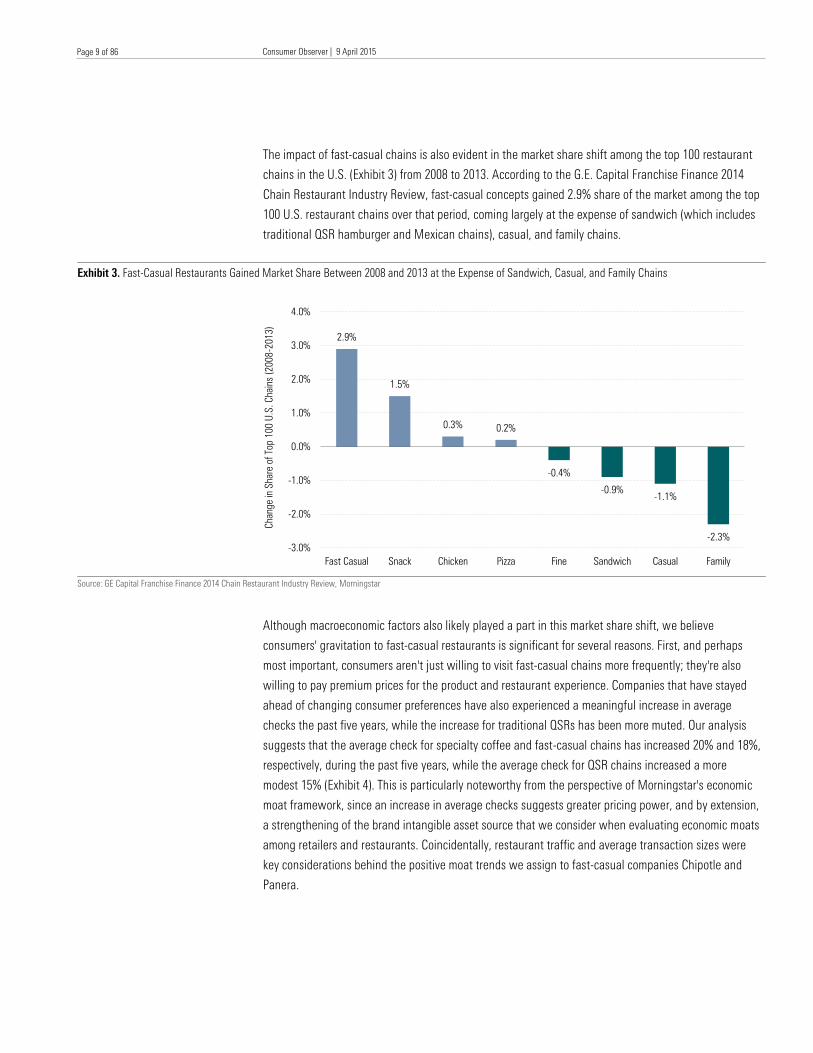
The impact of fast-casual chains is also evident in the market share shift among the top 100 restaurant
chains in the U.S. (Exhibit 3) from 2008 to 2013. According to the G.E. Capital Franchise Finance 2014
Chain Restaurant Industry Review, fast-casual concepts gained 2.9% share of the market among the top
100 U.S. restaurant chains over that period, coming largely at the expense of sandwich (which includes
traditional QSR hamburger and Mexican chains), casual, and family chains.
Exhibit 3. Fast-Casual Restaurants Gained Market Share Between 2008 and 2013 at the Expense of Sandwich, Casual, and Family Chains
Source: GE Capital Franchise Finance 2014 Chain Restaurant Industry Review, Morningstar
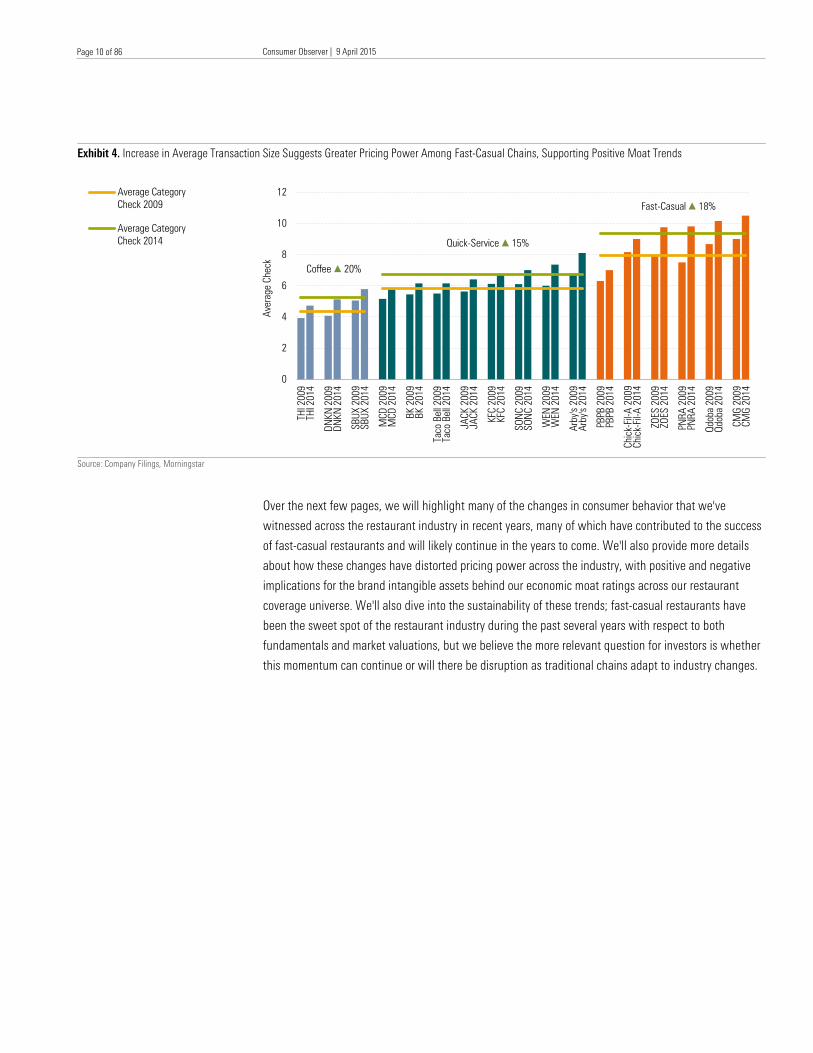
Although macroeconomic factors also likely played a part in this market share shift, we believe
consumers' gravitation to fast-casual restaurants is significant for several reasons. First, and perhaps
most important, consumers aren't just willing to visit fast-casual chains more frequently; they're also
willing to pay premium prices for the product and restaurant experience. Companies that have stayed
ahead of changing consumer preferences have also experienced a meaningful increase in average
checks the past five years, while the increase for traditional QSRs has been more muted. Our analysis
suggests that the average check for specialty coffee and fast-casual chains has increased 20% and 18%,
respectively, during the past five years, while the average check for QSR chains increased a more
modest 15% (Exhibit 4). This is particularly noteworthy from the perspective of Morningstar's economic
moat framework, since an increase in average checks suggests greater pricing power, and by extension,
a strengthening of the brand intangible asset source that we consider when evaluating economic moats
among retailers and restaurants. Coincidentally, restaurant traffic and average transaction sizes were
key considerations behind the positive moat trends we assign to fast-casual companies Chipotle and
Panera.
2.9%
1.5%
0.3%0.2%
-0.4%
-0.9%-1.1%
-2.3%
-3.0%
-2.0%
-1.0%
0.0%
1.0%
2.0%
3.0%
4.0%
Fast Casual Snack Chicken Pizza Fine Sandwich Casual Family
Change in S
hare o
f Top 1
00
U.S
. C
hain
s (
20
08
-2
01
3)
Consumer Observer | 9 April 2015
Healthcare Observer | 14 April 2015
Page 10 of 86
Page 10 of 86
Exhibit 4. Increase in Average Transaction Size Suggests Greater Pricing Power Among Fast-Casual Chains, Supporting Positive Moat Trends
Source: Company Filings, Morningstar
Over the next few pages, we will highlight many of the changes in consumer behavior that we've
witnessed across the restaurant industry in recent years, many of which have contributed to the success
of fast-casual restaurants and will likely continue in the years to come. We'll also provide more details
about how these changes have distorted pricing power across the industry, with positive and negative
implications for the brand intangible assets behind our economic moat ratings across our restaurant
coverage universe. We'll also dive into the sustainability of these trends; fast-casual restaurants have
been the sweet spot of the restaurant industry during the past several years with respect to both
fundamentals and market valuations, but we believe the more relevant question for investors is whether
this momentum can continue or will there be disruption as traditional chains adapt to industry changes.
0
2
4
6
8
10
12
TH
I 2
009
TH
I 20
14
DN
KN
20
09
DN
KN
20
14
SB
UX
20
09
SB
UX
20
14
MC
D 2
00
9
MC
D 2
01
4
BK
20
09
BK
20
14
Taco B
ell 2
009
Taco B
ell 2
014
JA
CK
200
9
JA
CK
201
4
KFC
20
09
KFC
20
14
SO
NC
20
09
SO
NC
20
14
WEN
20
09
WEN
20
14
Arby's
200
9
Arby's
201
4
PB
PB
2009
PB
PB
201
4
Chic
k-Fil-A
200
9
Chic
k-Fil-A
201
4
ZO
ES
20
09
ZO
ES
20
14
PN
RA
200
9
PN
RA
201
4
Qdoba 2
009
Qdoba 2
014
CM
G 2
00
9
CM
G 2
01
4
Average C
heck
Average Category
Check 2009
Average Category
Check 2014
Coffee Ö 20%
Quick-Service Ö 15%
Fast-Casual Ö 18%
Consumer Observer | 9 April 2015
Healthcare Observer | 14 April 2015
Page 11 of 86
Page 11 of 86
Trend: Backed by Changes in Purchasing Power, Consumers Are Demanding Menu Innovations
and Flavors
At the risk of stating the obvious, we believe taste is still the most important factor when consumers
make restaurant purchase decisions. However, we believe that one of the underrated but also more
impactful changes in restaurant spending trends in recent years is a shift in general taste preferences,
with consumers increasingly demanding nontraditional ingredients, new flavors, and spicier fare. It's
difficult to chalk up these changes to a single factor; instead, we attribute changing consumer tastes to
a number of sources, including greater spending power among minorities, heightened demand for
healthier, or better-for-you, offerings, increased television programming devoted to food, the
globalization of restaurant concepts and sharing menu innovations across borders, and the influence of
social media.
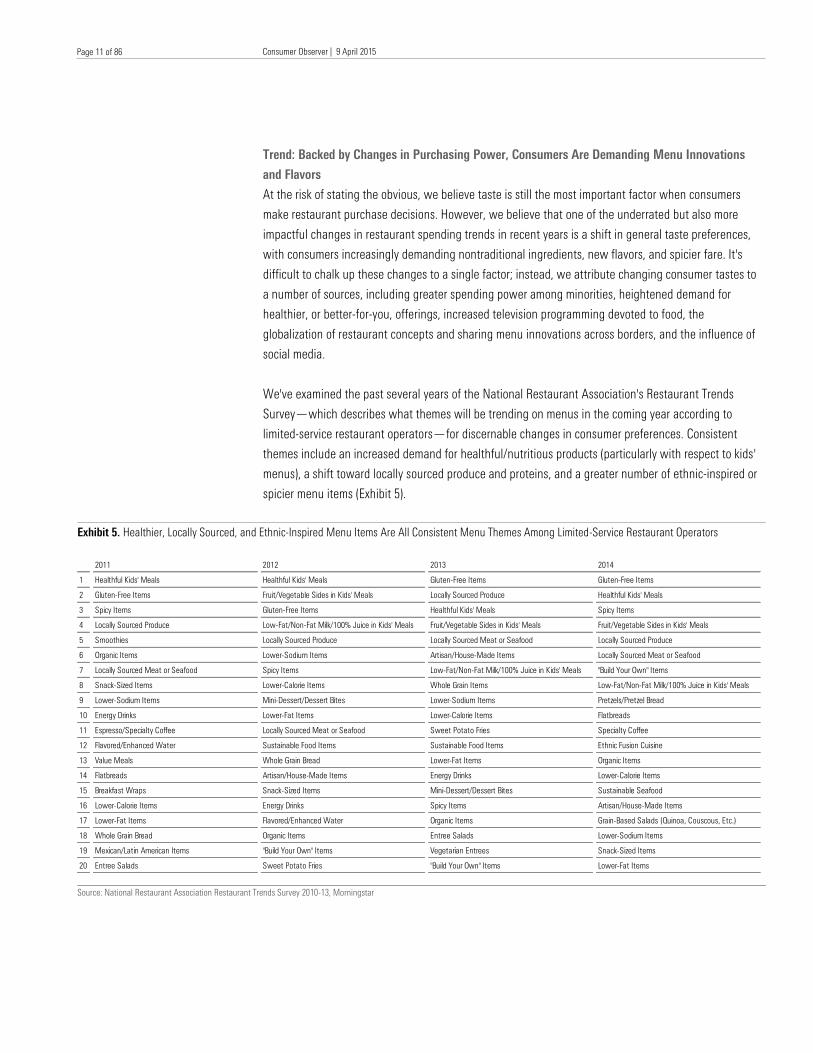
We've examined the past several years of the National Restaurant Association's Restaurant Trends
Survey—which describes what themes will be trending on menus in the coming year according to
limited-service restaurant operators—for discernable changes in consumer preferences. Consistent
themes include an increased demand for healthful/nutritious products (particularly with respect to kids'
menus), a shift toward locally sourced produce and proteins, and a greater number of ethnic-inspired or
spicier menu items (Exhibit 5).
Exhibit 5. Healthier, Locally Sourced, and Ethnic-Inspired Menu Items Are All Consistent Menu Themes Among Limited-Service Restaurant Operators
Source: National Restaurant Association Restaurant Trends Survey 2010-13, Morningstar
2011 2012 2013 2014
1 Healthful Kids' Meals Healthful Kids' Meals Gluten-Free Items Gluten-Free Items
2 Gluten-Free Items Fruit/Vegetable Sides in Kids' Meals Locally Sourced Produce Healthful Kids' Meals
3 Spicy Items Gluten-Free Items Healthful Kids' Meals Spicy Items
4 Locally Sourced Produce Low-Fat/Non-Fat Milk/100% Juice in Kids' Meals Fruit/Vegetable Sides in Kids' Meals Fruit/Vegetable Sides in Kids' Meals
5 Smoothies Locally Sourced Produce Locally Sourced Meat or Seafood Locally Sourced Produce
6 Organic Items Lower-Sodium Items Artisan/House-Made Items Locally Sourced Meat or Seafood
7 Locally Sourced Meat or Seafood Spicy Items Low-Fat/Non-Fat Milk/100% Juice in Kids' Meals "Build Your Own" Items
8 Snack-Sized Items Lower-Calorie Items Whole Grain Items Low-Fat/Non-Fat Milk/100% Juice in Kids' Meals
9 Lower-Sodium Items Mini-Dessert/Dessert Bites Lower-Sodium Items Pretzels/Pretzel Bread
10 Energy Drinks Lower-Fat Items Lower-Calorie Items Flatbreads
11 Espresso/Specialty Coffee Locally Sourced Meat or Seafood Sweet Potato Fries Specialty Coffee
12 Flavored/Enhanced Water Sustainable Food Items Sustainable Food Items Ethnic Fusion Cuisine
13 Value Meals Whole Grain Bread Lower-Fat Items Organic Items
14 Flatbreads Artisan/House-Made Items Energy Drinks Lower-Calorie Items
15 Breakfast Wraps Snack-Sized Items Mini-Dessert/Dessert Bites Sustainable Seafood
16 Lower-Calorie Items Energy Drinks Spicy Items Artisan/House-Made Items
17 Lower-Fat Items Flavored/Enhanced Water Organic Items Grain-Based Salads (Quinoa, Couscous, Etc.)
18 Whole Grain Bread Organic Items Entree Salads Lower-Sodium Items
19 Mexican/Latin American Items "Build Your Own" Items Vegetarian Entrees Snack-Sized Items
20 Entree Salads Sweet Potato Fries "Build Your Own" Items Lower-Fat Items
Consumer Observer | 9 April 2015
Healthcare Observer | 14 April 2015
Page 12 of 86
Page 12 of 86
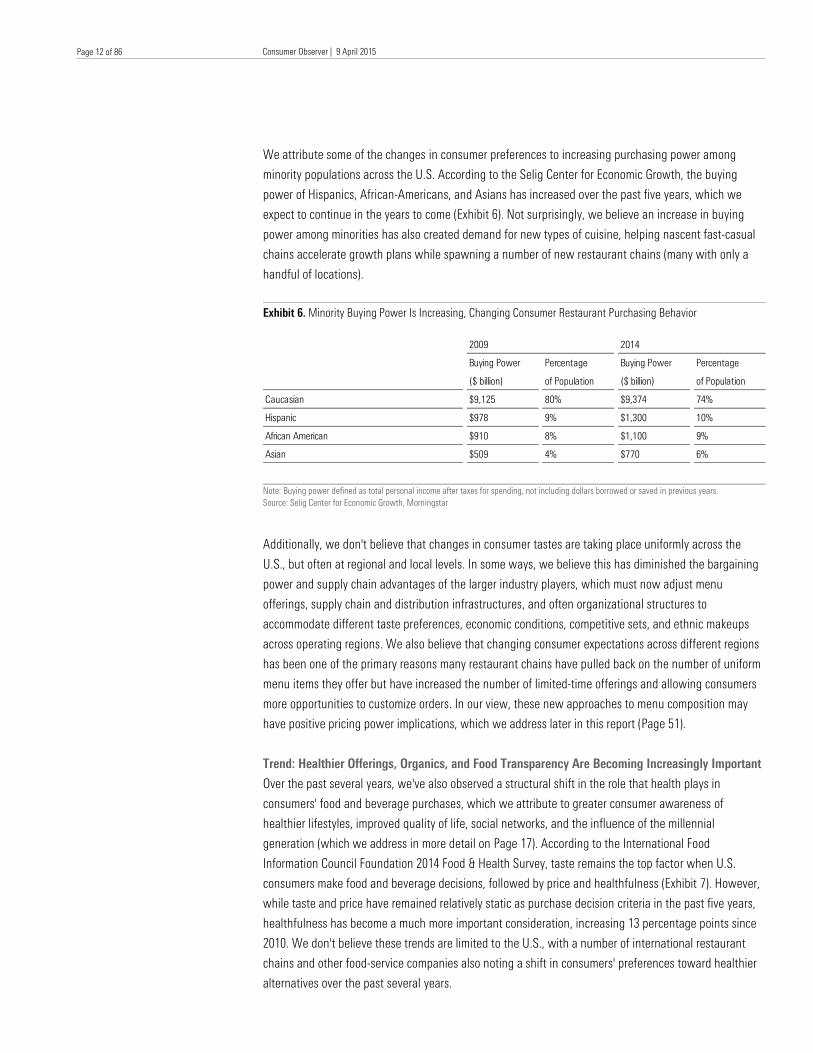
We attribute some of the changes in consumer preferences to increasing purchasing power among
minority populations across the U.S. According to the Selig Center for Economic Growth, the buying
power of Hispanics, African-Americans, and Asians has increased over the past five years, which we
expect to continue in the years to come (Exhibit 6). Not surprisingly, we believe an increase in buying
power among minorities has also created demand for new types of cuisine, helping nascent fast-casual
chains accelerate growth plans while spawning a number of new restaurant chains (many with only a
handful of locations).
Exhibit 6. Minority Buying Power Is Increasing, Changing Consumer Restaurant Purchasing Behavior
Note: Buying power defined as total personal income after taxes for spending, not including dollars borrowed or saved in previous years.
Source: Selig Center for Economic Growth, Morningstar
Additionally, we don't believe that changes in consumer tastes are taking place uniformly across the
U.S., but often at regional and local levels. In some ways, we believe this has diminished the bargaining
power and supply chain advantages of the larger industry players, which must now adjust menu
offerings, supply chain and distribution infrastructures, and often organizational structures to
accommodate different taste preferences, economic conditions, competitive sets, and ethnic makeups
across operating regions. We also believe that changing consumer expectations across different regions
has been one of the primary reasons many restaurant chains have pulled back on the number of uniform
menu items they offer but have increased the number of limited-time offerings and allowing consumers
more opportunities to customize orders. In our view, these new approaches to menu composition may
have positive pricing power implications, which we address later in this report (Page 51).
Trend: Healthier Offerings, Organics, and Food Transparency Are Becoming Increasingly Important
Over the past several years, we've also observed a structural shift in the role that health plays in
consumers' food and beverage purchases, which we attribute to greater consumer awareness of
healthier lifestyles, improved quality of life, social networks, and the influence of the millennial
generation (which we address in more detail on Page 17). According to the International Food
Information Council Foundation 2014 Food & Health Survey, taste remains the top factor when U.S.
consumers make food and beverage decisions, followed by price and healthfulness (Exhibit 7). However,
while taste and price have remained relatively static as purchase decision criteria in the past five years,
healthfulness has become a much more important consideration, increasing 13 percentage points since
2010. We don't believe these trends are limited to the U.S., with a number of international restaurant
chains and other food-service companies also noting a shift in consumers' preferences toward healthier
alternatives over the past several years.
2009 2014
Buying Power
($ billion)
Percentage
of Population
Buying Power
($ billion)
Percentage
of Population
Caucasian $9,125 80% $9,374 74%
Hispanic $978 9% $1,300 10%
African American $910 8% $1,100 9%
Asian $509 4% $770 6%
Consumer Observer | 9 April 2015
Healthcare Observer | 14 April 2015
Page 13 of 86
Page 13 of 86
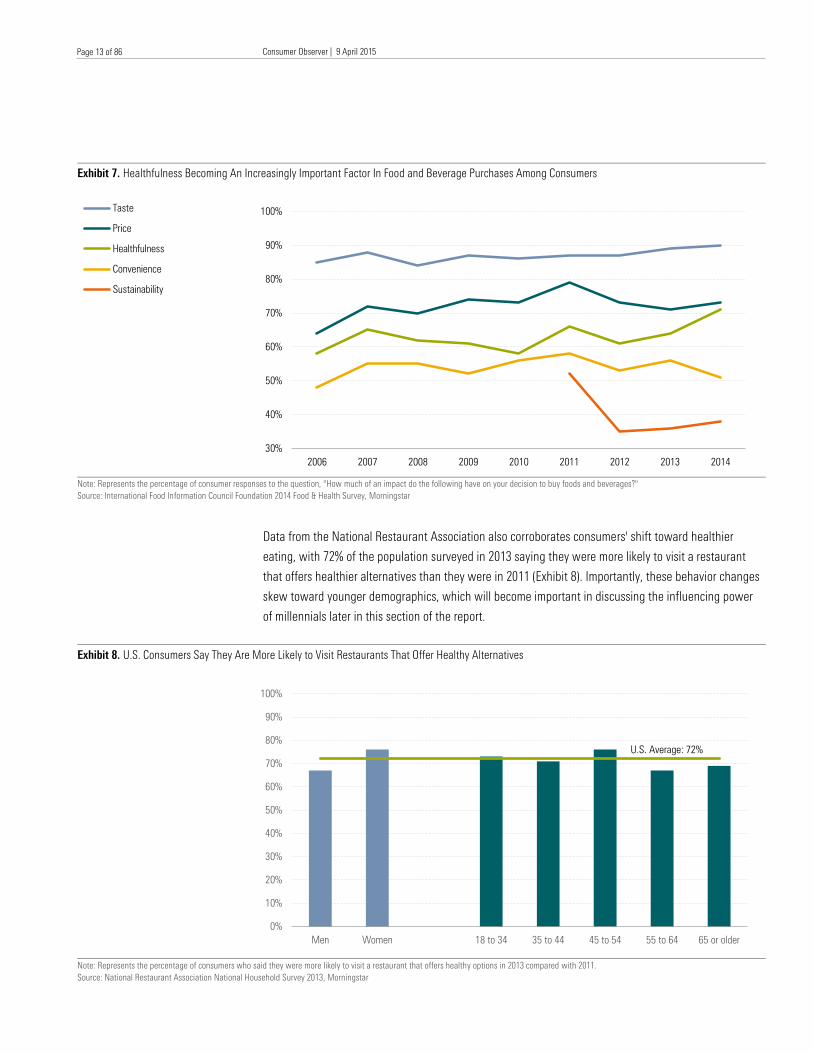
Exhibit 7. Healthfulness Becoming An Increasingly Important Factor In Food and Beverage Purchases Among Consumers
Note: Represents the percentage of consumer responses to the question, "How much of an impact do the following have on your decision to buy foods and beverages?"
Source: International Food Information Council Foundation 2014 Food & Health Survey, Morningstar
Data from the National Restaurant Association also corroborates consumers' shift toward healthier
eating, with 72% of the population surveyed in 2013 saying they were more likely to visit a restaurant
that offers healthier alternatives than they were in 2011 (Exhibit 8). Importantly, these behavior changes
skew toward younger demographics, which will become important in discussing the influencing power
of millennials later in this section of the report.
Exhibit 8. U.S. Consumers Say They Are More Likely to Visit Restaurants That Offer Healthy Alternatives
Note: Represents the percentage of consumers who said they were more likely to visit a restaurant that offers healthy options in 2013 compared with 2011.
Source: National Restaurant Association National Household Survey 2013, Morningstar
30%
40%
50%
60%
70%
80%
90%
100%
2006 2007 2008 2009 2010 2011 2012 2013 2014
Taste
Price
Healthfulness
Convenience
Sustainability
0%
10%
20%
30%
40%
50%
60%
70%
80%
90%
100%
Men Women 18 to 34 35 to 44 45 to 54 55 to 64 65 or older
U.S. Average: 72%
Consumer Observer | 9 April 2015
Healthcare Observer | 14 April 2015
Page 14 of 86
Page 14 of 86
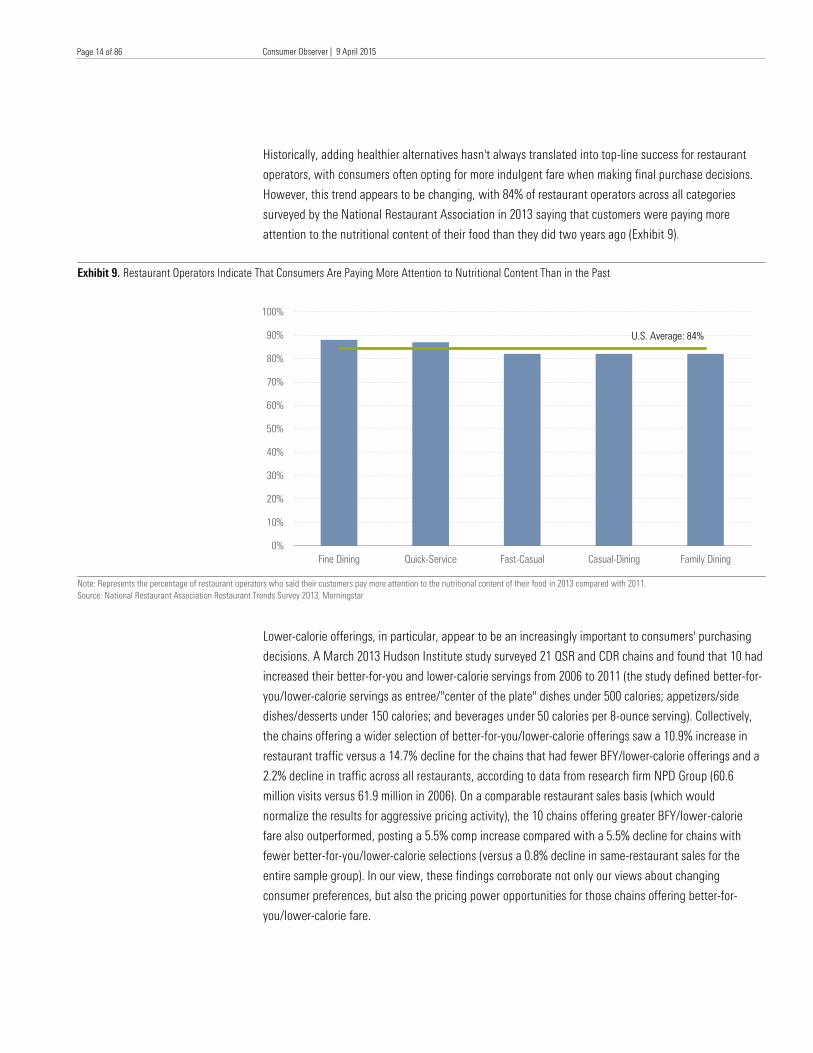
Historically, adding healthier alternatives hasn't always translated into top-line success for restaurant
operators, with consumers often opting for more indulgent fare when making final purchase decisions.
However, this trend appears to be changing, with 84% of restaurant operators across all categories
surveyed by the National Restaurant Association in 2013 saying that customers were paying more
attention to the nutritional content of their food than they did two years ago (Exhibit 9).
Exhibit 9. Restaurant Operators Indicate That Consumers Are Paying More Attention to Nutritional Content Than in the Past
Note: Represents the percentage of restaurant operators who said their customers pay more attention to the nutritional content of their food in 2013 compared with 2011.
Source: National Restaurant Association Restaurant Trends Survey 2013, Morningstar
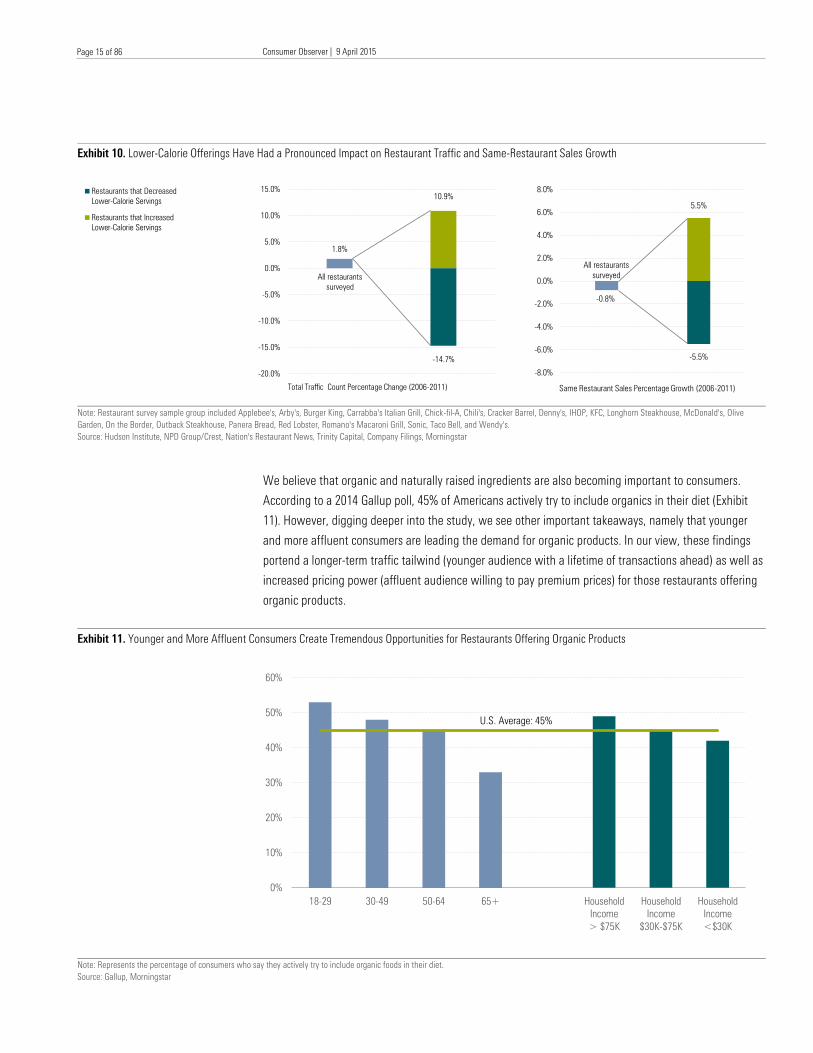
Lower-calorie offerings, in particular, appear to be an increasingly important to consumers' purchasing
decisions. A March 2013 Hudson Institute study surveyed 21 QSR and CDR chains and found that 10 had
increased their better-for-you and lower-calorie servings from 2006 to 2011 (the study defined better-for-
you/lower-calorie servings as entree/"center of the plate" dishes under 500 calories; appetizers/side
dishes/desserts under 150 calories; and beverages under 50 calories per 8-ounce serving). Collectively,
the chains offering a wider selection of better-for-you/lower-calorie offerings saw a 10.9% increase in
restaurant traffic versus a 14.7% decline for the chains that had fewer BFY/lower-calorie offerings and a
2.2% decline in traffic across all restaurants, according to data from research firm NPD Group (60.6
million visits versus 61.9 million in 2006). On a comparable restaurant sales basis (which would
normalize the results for aggressive pricing activity), the 10 chains offering greater BFY/lower-calorie
fare also outperformed, posting a 5.5% comp increase compared with a 5.5% decline for chains with
fewer better-for-you/lower-calorie selections (versus a 0.8% decline in same-restaurant sales for the
entire sample group). In our view, these findings corroborate not only our views about changing
consumer preferences, but also the pricing power opportunities for those chains offering better-for-
you/lower-calorie fare.
0%
10%
20%
30%
40%
50%
60%
70%
80%
90%
100%
Fine Dining Quick-Service Fast-Casual Casual-Dining Family Dining
U.S. Average: 84%
Consumer Observer | 9 April 2015
Healthcare Observer | 14 April 2015
Page 15 of 86
Page 15 of 86
Exhibit 10. Lower-Calorie Offerings Have Had a Pronounced Impact on Restaurant Traffic and Same-Restaurant Sales Growth
Note: Restaurant survey sample group included Applebee's, Arby's, Burger King, Carrabba's Italian Grill, Chick-fil-A, Chili's, Cracker Barrel, Denny's, IHOP, KFC, Longhorn Steakhouse, McDonald's, Olive
Garden, On the Border, Outback Steakhouse, Panera Bread, Red Lobster, Romano's Macaroni Grill, Sonic, Taco Bell, and Wendy's.
Source: Hudson Institute, NPD Group/Crest, Nation's Restaurant News, Trinity Capital, Company Filings, Morningstar
We believe that organic and naturally raised ingredients are also becoming important to consumers.
According to a 2014 Gallup poll, 45% of Americans actively try to include organics in their diet (Exhibit
11). However, digging deeper into the study, we see other important takeaways, namely that younger
and more affluent consumers are leading the demand for organic products. In our view, these findings
portend a longer-term traffic tailwind (younger audience with a lifetime of transactions ahead) as well as
increased pricing power (affluent audience willing to pay premium prices) for those restaurants offering
organic products.
Exhibit 11. Younger and More Affluent Consumers Create Tremendous Opportunities for Restaurants Offering Organic Products
Note: Represents the percentage of consumers who say they actively try to include organic foods in their diet.
Source: Gallup, Morningstar
1.8%
10.9%
-14.7%
-20.0%
-15.0%
-10.0%
-5.0%
0.0%
5.0%
10.0%
15.0%
Total Traffic Count Percentage Change (2006-2011)
Restaurants that Decreased
Lower-Calorie Servings
Restaurants that Increased
Lower-Calorie Servings
All restaurants
surveyed
5.5%
-0.8%
-5.5%
-8.0%
-6.0%
-4.0%
-2.0%
0.0%
2.0%
4.0%
6.0%
8.0%
Same Restaurant Sales Percentage Growth (2006-2011)
Restaurants that Decreased
Lower-Calorie Servings
Restaurants that Increased
Lower-Calorie Servings
All restaurants
surveyed
0%
10%
20%
30%
40%
50%
60%
18-29 30-49 50-64 65+ Household
Income
> $75K
Household
Income
$30K-$75K
Household
Income
<$30K
U.S. Average: 45%
Consumer Observer | 9 April 2015
Healthcare Observer | 14 April 2015
Page 16 of 86
Page 16 of 86
Through its "Food with Integrity" mantra, Chipotle has been at the forefront of the industry movement
toward naturally raised proteins, dairy products from pasture-raised cattle, and organic produce. Though
more costly to source than processed food, these fresh ingredients are a key source of differentiation
and play a part in the brand intangible asset source underpinning our narrow moat rating. Additionally,
by sourcing naturally raised and organic products—often from local ranchers and farmers—Chipotle
has more clout with its suppliers than chains of comparable size (though we have not assigned the
company a cost advantage moat source given its smaller size relative to larger QSR firms).
We believe the success of Chipotle's Food with Integrity has triggered similar movements in the broader
restaurant industry, starting with other fast-casual companies like Panera (whose food-policy statement
advocates removing artificial trans fats, eliminating artificial colors, sweeteners, flavors, and
preservatives, and purchasing only livestock and poultry that have been raised responsibly) and Zoe's
Kitchen but more recently expanding to traditional QSR chains like McDonald's (which recently
announced that it would serve antibiotic-free chicken) and Dunkin' Brands (which announced a
commitment to cage-free eggs and gestation-crate-free pork in the U.S over the next several years).
Given the positive traffic and pricing power implications, we would not be surprised to see organic and
naturally raised ingredients incorporated into menus industrywide in the years to come.
Consumer behavior regarding organic and naturally raised ingredients also substantiate analysis from
Morningstar's February 2015 Consumer Defensive Observer piece "Robust Organic Food Growth Poised
to Bolster Defensive Retailers' Edge, but Could Detract From Consumer Product Firms' Moats," which
concluded that outlets specializing in organic and naturally raised products can extend the pricing power
inherent in brand intangible assets, drive incremental traffic, and bolster economies of scale.
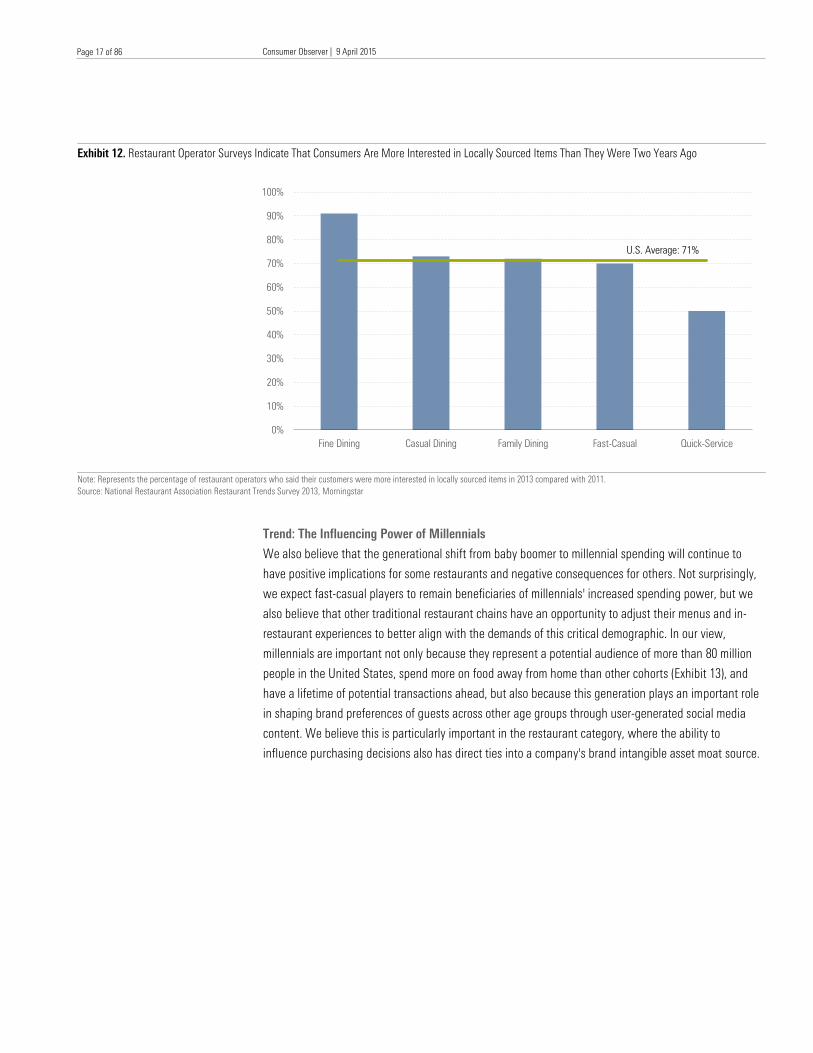
Local sourcing and food transparency are also influencing consumers' purchasing decisions. According
to the National Restaurant Association's Restaurant Trends Survey from 2013, 71% of restaurant
operators surveyed said that customers were more interested in locally sourced items than they were
two years earlier (Exhibit 12). While demand for locally sourced products has been more pronounced at
fine-dining and other full-service restaurants, we believe the difference between fast-casual and QSR
chains also partly explains the previously discussed market share gains and increase in average
transaction sizes between the two segments.
Consumer Observer | 9 April 2015
Healthcare Observer | 14 April 2015
Page 17 of 86
Page 17 of 86
Exhibit 12. Restaurant Operator Surveys Indicate That Consumers Are More Interested in Locally Sourced Items Than They Were Two Years Ago
Note: Represents the percentage of restaurant operators who said their customers were more interested in locally sourced items in 2013 compared with 2011.
Source: National Restaurant Association Restaurant Trends Survey 2013, Morningstar
Trend: The Influencing Power of Millennials
We also believe that the generational shift from baby boomer to millennial spending will continue to
have positive implications for some restaurants and negative consequences for others. Not surprisingly,
we expect fast-casual players to remain beneficiaries of millennials' increased spending power, but we
also believe that other traditional restaurant chains have an opportunity to adjust their menus and in-
restaurant experiences to better align with the demands of this critical demographic. In our view,
millennials are important not only because they represent a potential audience of more than 80 million
people in the United States, spend more on food away from home than other cohorts (Exhibit 13), and
have a lifetime of potential transactions ahead, but also because this generation plays an important role
in shaping brand preferences of guests across other age groups through user-generated social media
content. We believe this is particularly important in the restaurant category, where the ability to
influence purchasing decisions also has direct ties into a company's brand intangible asset moat source.
0%
10%
20%
30%
40%
50%
60%
70%
80%
90%
100%
Fine Dining Casual Dining Family Dining Fast-Casual Quick-Service
U.S. Average: 71%
Consumer Observer | 9 April 2015
Healthcare Observer | 14 April 2015
Page 18 of 86
Page 18 of 86
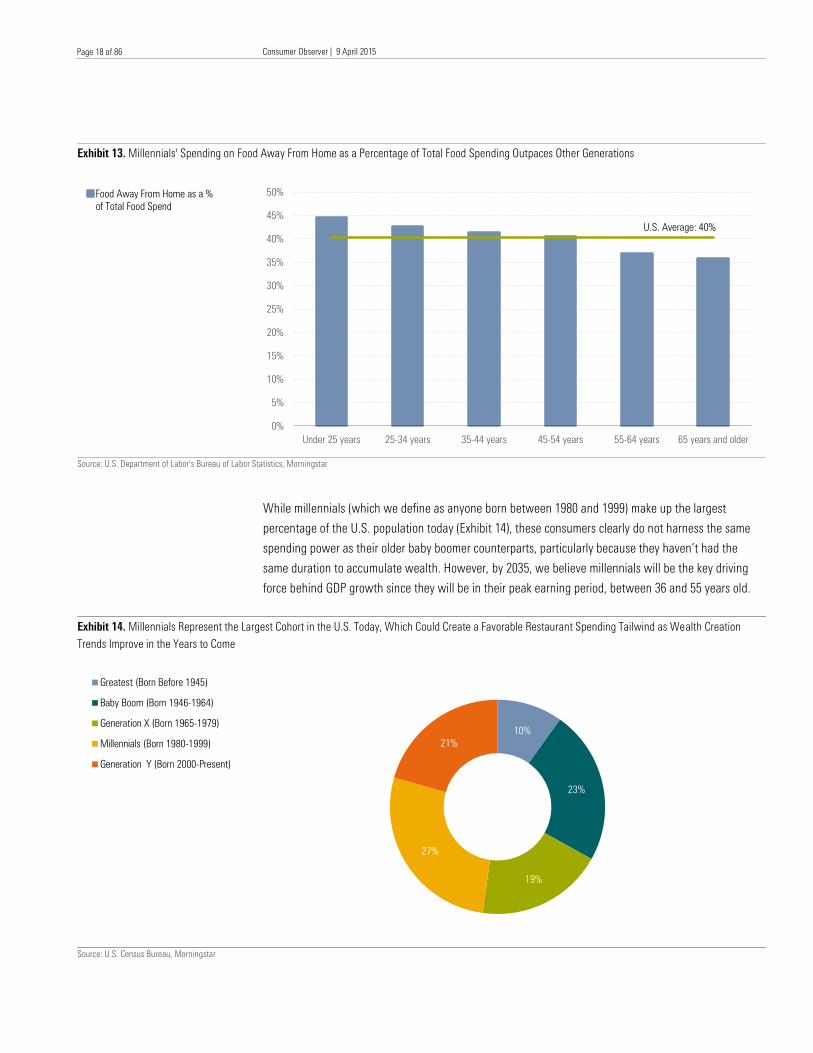
Exhibit 13. Millennials' Spending on Food Away From Home as a Percentage of Total Food Spending Outpaces Other Generations
Source: U.S. Department of Labor's Bureau of Labor Statistics, Morningstar
While millennials (which we define as anyone born between 1980 and 1999) make up the largest
percentage of the U.S. population today (Exhibit 14), these consumers clearly do not harness the same
spending power as their older baby boomer counterparts, particularly because they haven’t had the
same duration to accumulate wealth. However, by 2035, we believe millennials will be the key driving
force behind GDP growth since they will be in their peak earning period, between 36 and 55 years old.
Exhibit 14. Millennials Represent the Largest Cohort in the U.S. Today, Which Could Create a Favorable Restaurant Spending Tailwind as Wealth Creation
Trends Improve in the Years to Come
Source: U.S. Census Bureau, Morningstar
0%
5%
10%
15%
20%
25%
30%
35%
40%
45%
50%
Under 25 years 25-34 years 35-44 years 45-54 years 55-64 years 65 years and older
Food Away From Home as a %
of Total Food Spend
U.S. Average: 40%
10%
23%
19%
27%
21%
Greatest (Born Before 1945)
Baby Boom (Born 1946-1964)
Generation X (Born 1965-1979)
Millennials (Born 1980-1999)
Generation Y (Born 2000-Present)
Consumer Observer | 9 April 2015
Healthcare Observer | 14 April 2015
Page 19 of 86
Page 19 of 86
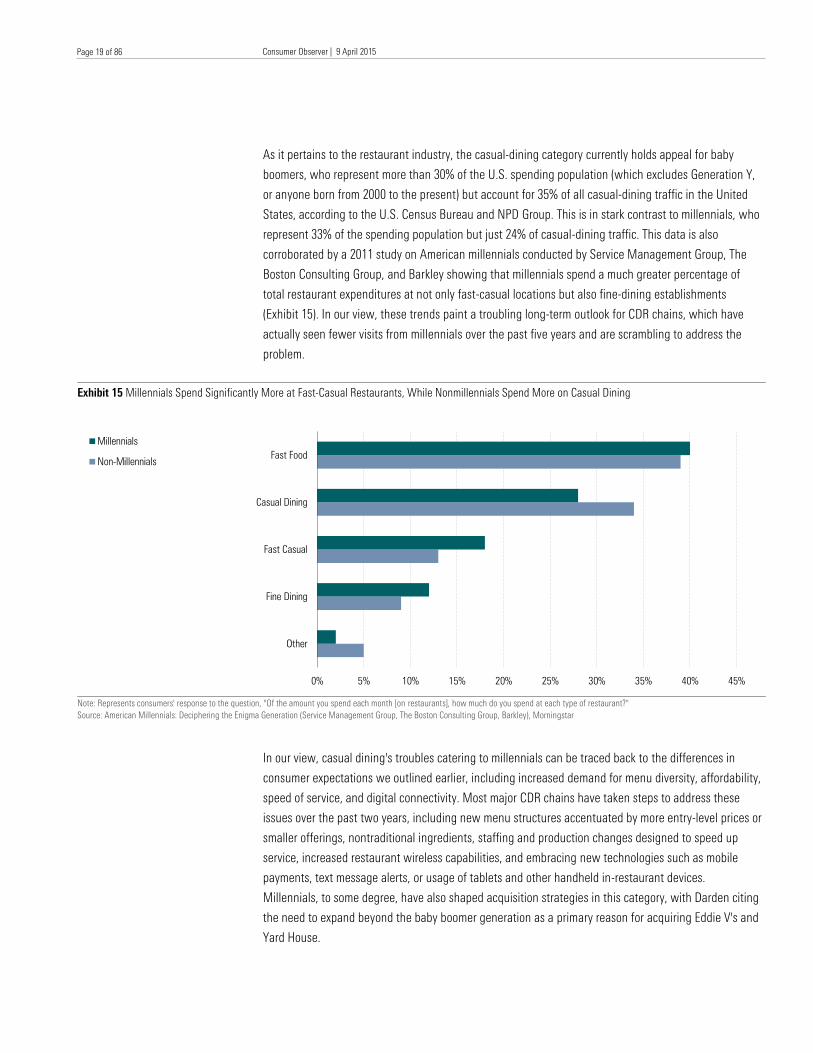
As it pertains to the restaurant industry, the casual-dining category currently holds appeal for baby
boomers, who represent more than 30% of the U.S. spending population (which excludes Generation Y,
or anyone born from 2000 to the present) but account for 35% of all casual-dining traffic in the United
States, according to the U.S. Census Bureau and NPD Group. This is in stark contrast to millennials, who
represent 33% of the spending population but just 24% of casual-dining traffic. This data is also
corroborated by a 2011 study on American millennials conducted by Service Management Group, The
Boston Consulting Group, and Barkley showing that millennials spend a much greater percentage of
total restaurant expenditures at not only fast-casual locations but also fine-dining establishments
(Exhibit 15). In our view, these trends paint a troubling long-term outlook for CDR chains, which have
actually seen fewer visits from millennials over the past five years and are scrambling to address the
problem.
Exhibit 15 Millennials Spend Significantly More at Fast-Casual Restaurants, While Nonmillennials Spend More on Casual Dining
Note: Represents consumers' response to the question, "Of the amount you spend each month [on restaurants], how much do you spend at each type of restaurant?"
Source: American Millennials: Deciphering the Enigma Generation (Service Management Group, The Boston Consulting Group, Barkley), Morningstar
In our view, casual dining's troubles catering to millennials can be traced back to the differences in
consumer expectations we outlined earlier, including increased demand for menu diversity, affordability,
speed of service, and digital connectivity. Most major CDR chains have taken steps to address these
issues over the past two years, including new menu structures accentuated by more entry-level prices or
smaller offerings, nontraditional ingredients, staffing and production changes designed to speed up
service, increased restaurant wireless capabilities, and embracing new technologies such as mobile
payments, text message alerts, or usage of tablets and other handheld in-restaurant devices.
Millennials, to some degree, have also shaped acquisition strategies in this category, with Darden citing
the need to expand beyond the baby boomer generation as a primary reason for acquiring Eddie V's and
Yard House.
0% 5% 10% 15% 20% 25% 30% 35% 40% 45%
Other
Fine Dining
Fast Casual
Casual Dining
Fast Food
Millennials
Non-Millennials
Consumer Observer | 9 April 2015
Healthcare Observer | 14 April 2015
Page 20 of 86
Page 20 of 86
While some of these initiatives will probably improve casual dining's resonance with millennials, we
believe the emergence of fast-casual restaurants has permanently changed the dynamics of the
restaurant industry and will make margin expansion difficult for CDR chains to sustain over an extended
horizon. At its 2013 investor meeting, Darden management noted that the casual-dining guest
experience is not improving fast enough, making premium prices—even after discounting—tougher to
justify. We agree with this sentiment, but we don't expect guest experience improvements to restore the
pricing power these brands once had across all generations. This provides the basis for our negative
moat trend rating for Darden and our generally cautious long-term outlook for much of the casual-dining
industry.
We believe fast-casual restaurants better address the specific demands of millennials, which is the
primary reason that generation spends more eating out than other groups, $174 a month compared with
$153 for nonmillennials, according to the 2011 study detailed in Exhibit 15. We also think there is a
direct correlation between millennial spending and fast-casual restaurant industry growth trends.
In our view, the fast-casual restaurant industry will continue to resonate with millennials in the years to
come. We expect the fast-casual restaurant category to grow nearly 10% during the next five years
because of a compelling consumer value proposition, menu variety, and speed of service as well as unit
economics (lower real estate and labor costs than CDR operators) conducive to accelerated restaurant
opening plans. This exceeds our low-single-digit growth forecast for the broader restaurant industry (we
also discuss our growth forecasts for specific restaurant categories in more detail on Page 47.
The passing of the torch from baby boomers to millennials will also have implications across other
restaurant categories beyond CDRs and fast-casual restaurants. In our view, the fine-dining restaurants
are more likely to benefit from this shift, as millennials have shown a penchant for trading up for special
occasions and bypassing casual dining, which we attribute in part to casual-dining chains' inability to
modify their customer experience for the millennials and the subsequent negativity surrounding many
casual-dining brands. Traditional QSR chains also face some of the brand perception issues that are
plaguing casual-dining restaurants, but we believe these chains will find it easier to modify their menus
and restaurant layouts to more directly align with millennials’ demands (which could create future
pricing opportunities in the process). We've addressed many of these opportunities for traditional QSR
chains in the third section of this report that begins on Page 49.
For additional insights on the potential impact of millennials across several consumer discretionary
categories, please refer to our May 2014 report "Millennials to Power the Next Generation of Leisure
Spending."
Consumer Observer | 9 April 2015
Healthcare Observer | 14 April 2015
Page 21 of 86
Page 21 of 86
Trend: Technology Reshaping How Restaurants Reach Customers, Enhance the In-Restaurant
Experience
Almost every restaurant industry investor day presentation we've attended in the past two years has
placed heavy emphasis on the importance of technology in reshaping purchase decisions and enhancing
the customer experience. These innovations include consumer-facing applications (mobile ordering and
payment capabilities, electronic ordering and payments at the table, video menu boards, self-service
kiosks) and front-of-the-house technologies (tablets/handheld devices and other point-of-sale system
software upgrades to manage restaurant throughput levels), and back-of-the-house innovations
(handheld devices to assist with inventory replenishment, special bar-coding to identify food sources,
and other freshness indicators). Technology has also become increasingly relevant to restaurant chains'
marketing plans, with most planning to devote more resources to digital and mobile advertising in 2015,
which has natural marketing synergies with current loyalty programs. In our view, technology
enhancements can help reinforce a restaurant company's brand intangible asset moat source.
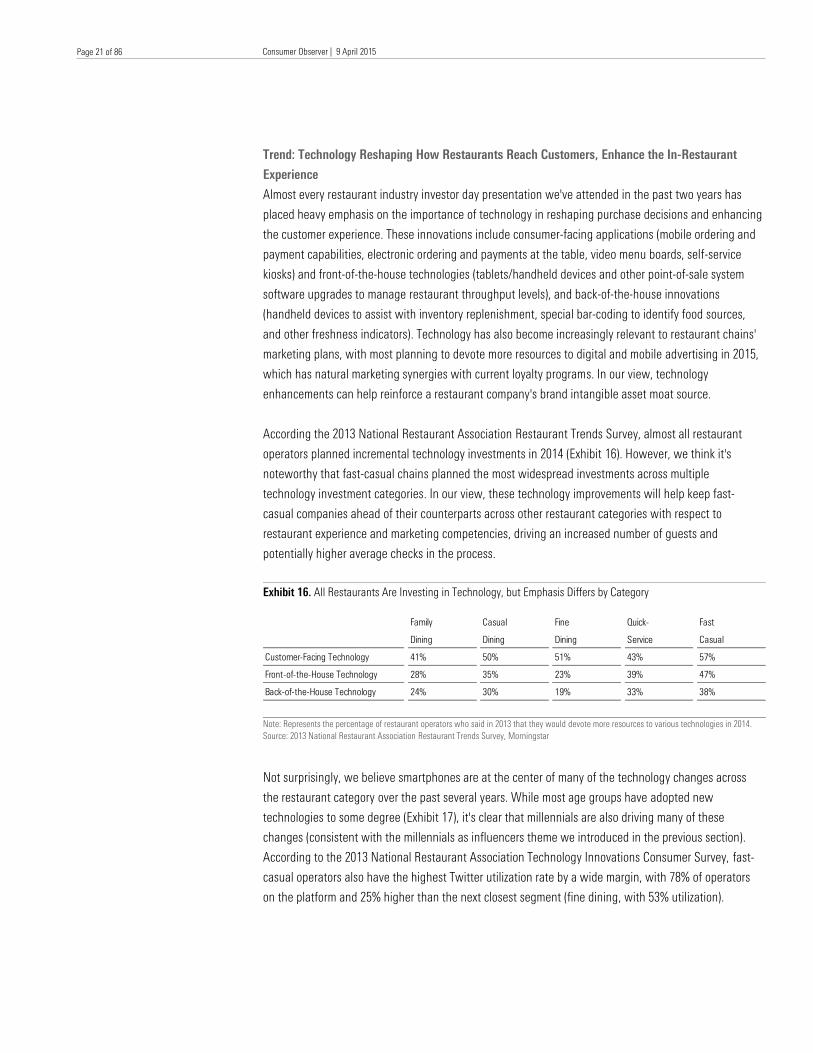
According the 2013 National Restaurant Association Restaurant Trends Survey, almost all restaurant
operators planned incremental technology investments in 2014 (Exhibit 16). However, we think it's
noteworthy that fast-casual chains planned the most widespread investments across multiple
technology investment categories. In our view, these technology improvements will help keep fast-
casual companies ahead of their counterparts across other restaurant categories with respect to
restaurant experience and marketing competencies, driving an increased number of guests and
potentially higher average checks in the process.
Exhibit 16. All Restaurants Are Investing in Technology, but Emphasis Differs by Category
Note: Represents the percentage of restaurant operators who said in 2013 that they would devote more resources to various technologies in 2014.
Source: 2013 National Restaurant Association Restaurant Trends Survey, Morningstar
Not surprisingly, we believe smartphones are at the center of many of the technology changes across
the restaurant category over the past several years. While most age groups have adopted new
technologies to some degree (Exhibit 17), it's clear that millennials are also driving many of these
changes (consistent with the millennials as influencers theme we introduced in the previous section).
According to the 2013 National Restaurant Association Technology Innovations Consumer Survey, fast-
casual operators also have the highest Twitter utilization rate by a wide margin, with 78% of operators
on the platform and 25% higher than the next closest segment (fine dining, with 53% utilization).
Family
Dining
Casual
Dining
Fine
Dining
Quick-
Service
Fast
Casual
Customer-Facing Technology 41% 50% 51% 43% 57%
Front-of-the-House Technology 28% 35% 23% 39% 47%
Back-of-the-House Technology 24% 30% 19% 33% 38%
Consumer Observer | 9 April 2015
Healthcare Observer | 14 April 2015
Page 22 of 86
Page 22 of 86
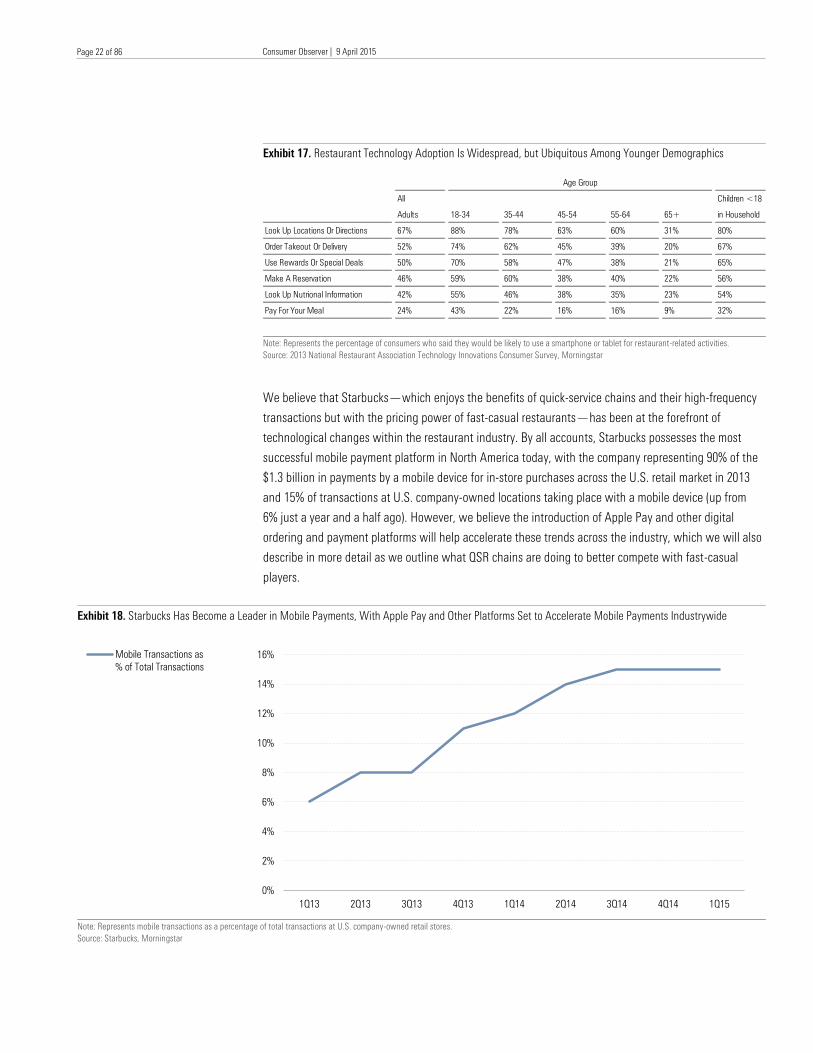
Exhibit 17. Restaurant Technology Adoption Is Widespread, but Ubiquitous Among Younger Demographics
Note: Represents the percentage of consumers who said they would be likely to use a smartphone or tablet for restaurant-related activities.
Source: 2013 National Restaurant Association Technology Innovations Consumer Survey, Morningstar
We believe that Starbucks—which enjoys the benefits of quick-service chains and their high-frequency
transactions but with the pricing power of fast-casual restaurants—has been at the forefront of
technological changes within the restaurant industry. By all accounts, Starbucks possesses the most
successful mobile payment platform in North America today, with the company representing 90% of the
$1.3 billion in payments by a mobile device for in-store purchases across the U.S. retail market in 2013
and 15% of transactions at U.S. company-owned locations taking place with a mobile device (up from
6% just a year and a half ago). However, we believe the introduction of Apple Pay and other digital
ordering and payment platforms will help accelerate these trends across the industry, which we will also
describe in more detail as we outline what QSR chains are doing to better compete with fast-casual
players.
Exhibit 18. Starbucks Has Become a Leader in Mobile Payments, With Apple Pay and Other Platforms Set to Accelerate Mobile Payments Industrywide
Note: Represents mobile transactions as a percentage of total transactions at U.S. company-owned retail stores.
Source: Starbucks, Morningstar
Age Group
All
Adults 18-34 35-44 45-54 55-64 65+
Children <18
in Household
Look Up Locations Or Directions 67% 88% 78% 63% 60% 31% 80%
Order Takeout Or Delivery 52% 74% 62% 45% 39% 20% 67%
Use Rewards Or Special Deals 50% 70% 58% 47% 38% 21% 65%
Make A Reservation 46% 59% 60% 38% 40% 22% 56%
Look Up Nutrional Information 42% 55% 46% 38% 35% 23% 54%
Pay For Your Meal 24% 43% 22% 16% 16% 9% 32%
0%
2%
4%
6%
8%
10%
12%
14%
16%
1Q13 2Q13 3Q13 4Q13 1Q14 2Q14 3Q14 4Q14 1Q15
Mobile Transactions as
% of Total Transactions
Consumer Observer | 9 April 2015
Healthcare Observer | 14 April 2015
Page 23 of 86
Page 23 of 86
Changing Consumer Preferences Has Changed Pricing Power Within the Restaurant Industry,
With Moat Implications
As we said at the start of this report, evolving consumer expectations have helped accelerate the growth
of fast-casual restaurants and had far-reaching implications for the rest of the industry. We believe the
most noticeable impact has been the pricing power of both QSR and CDR chains, but for different
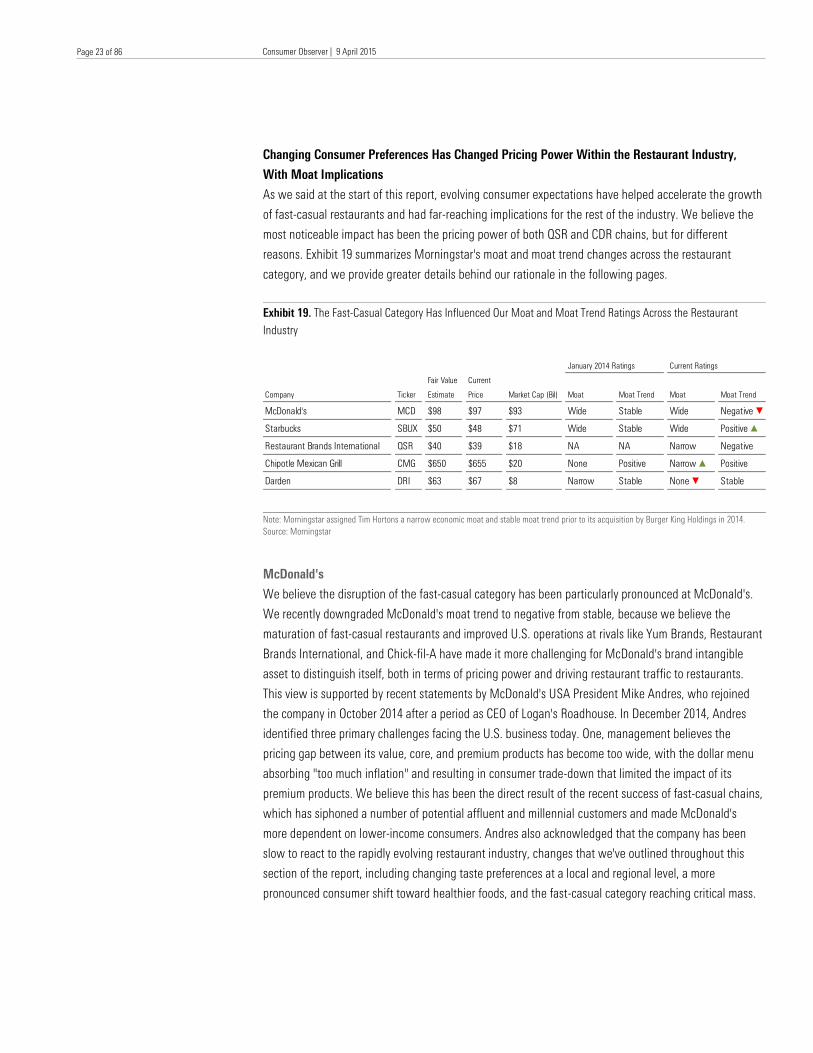
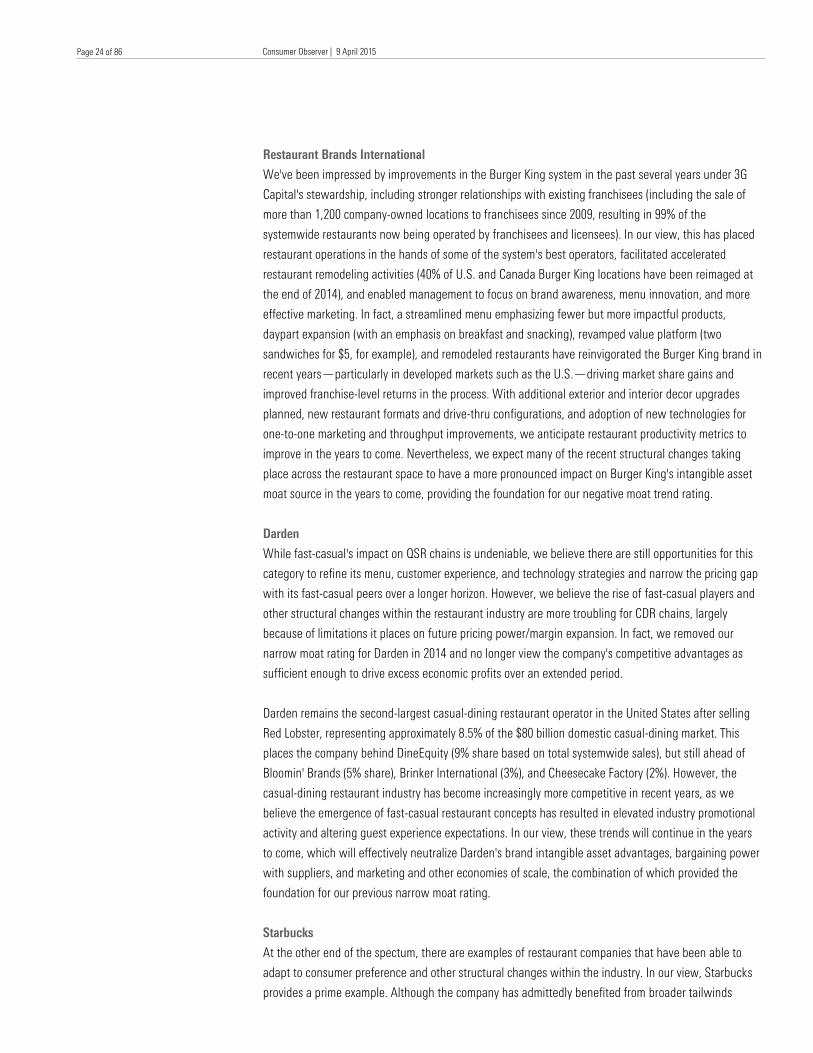
reasons. Exhibit 19 summarizes Morningstar's moat and moat trend changes across the restaurant
category, and we provide greater details behind our rationale in the following pages.
Exhibit 19. The Fast-Casual Category Has Influenced Our Moat and Moat Trend Ratings Across the Restaurant
Industry
Note: Morningstar assigned Tim Hortons a narrow economic moat and stable moat trend prior to its acquisition by Burger King Holdings in 2014.
Source: Morningstar
McDonald's
We believe the disruption of the fast-casual category has been particularly pronounced at McDonald's.
We recently downgraded McDonald's moat trend to negative from stable, because we believe the
maturation of fast-casual restaurants and improved U.S. operations at rivals like Yum Brands, Restaurant
Brands International, and Chick-fil-A have made it more challenging for McDonald's brand intangible
asset to distinguish itself, both in terms of pricing power and driving restaurant traffic to restaurants.
This view is supported by recent statements by McDonald's USA President Mike Andres, who rejoined
the company in October 2014 after a period as CEO of Logan's Roadhouse. In December 2014, Andres
identified three primary challenges facing the U.S. business today. One, management believes the
pricing gap between its value, core, and premium products has become too wide, with the dollar menu
absorbing "too much inflation" and resulting in consumer trade-down that limited the impact of its
premium products. We believe this has been the direct result of the recent success of fast-casual chains,
which has siphoned a number of potential affluent and millennial customers and made McDonald's
more dependent on lower-income consumers. Andres also acknowledged that the company has been
slow to react to the rapidly evolving restaurant industry, changes that we've outlined throughout this
section of the report, including changing taste preferences at a local and regional level, a more
pronounced consumer shift toward healthier foods, and the fast-casual category reaching critical mass.
January 2014 Ratings Current Ratings
Company Ticker
Fair Value
Estimate
Current
Price Market Cap (Bil) Moat Moat Trend Moat Moat Trend
McDonald's MCD $98 $97 $93 Wide Stable Wide Negative Õ
Starbucks SBUX $50 $48 $71 Wide Stable Wide Positive Ö
Restaurant Brands International QSR $40 $39 $18 NA NA Narrow Negative
Chipotle Mexican Grill CMG $650 $655 $20 None Positive Narrow Ö Positive
Darden DRI $63 $67 $8 Narrow Stable None Õ Stable
Consumer Observer | 9 April 2015
Healthcare Observer | 14 April 2015
Page 24 of 86
Page 24 of 86
Restaurant Brands International
We've been impressed by improvements in the Burger King system in the past several years under 3G
Capital's stewardship, including stronger relationships with existing franchisees (including the sale of
more than 1,200 company-owned locations to franchisees since 2009, resulting in 99% of the
systemwide restaurants now being operated by franchisees and licensees). In our view, this has placed
restaurant operations in the hands of some of the system's best operators, facilitated accelerated
restaurant remodeling activities (40% of U.S. and Canada Burger King locations have been reimaged at
the end of 2014), and enabled management to focus on brand awareness, menu innovation, and more
effective marketing. In fact, a streamlined menu emphasizing fewer but more impactful products,
daypart expansion (with an emphasis on breakfast and snacking), revamped value platform (two
sandwiches for $5, for example), and remodeled restaurants have reinvigorated the Burger King brand in
recent years—particularly in developed markets such as the U.S.—driving market share gains and
improved franchise-level returns in the process. With additional exterior and interior decor upgrades
planned, new restaurant formats and drive-thru configurations, and adoption of new technologies for
one-to-one marketing and throughput improvements, we anticipate restaurant productivity metrics to
improve in the years to come. Nevertheless, we expect many of the recent structural changes taking
place across the restaurant space to have a more pronounced impact on Burger King's intangible asset
moat source in the years to come, providing the foundation for our negative moat trend rating.
Darden
While fast-casual's impact on QSR chains is undeniable, we believe there are still opportunities for this
category to refine its menu, customer experience, and technology strategies and narrow the pricing gap
with its fast-casual peers over a longer horizon. However, we believe the rise of fast-casual players and
other structural changes within the restaurant industry are more troubling for CDR chains, largely
because of limitations it places on future pricing power/margin expansion. In fact, we removed our
narrow moat rating for Darden in 2014 and no longer view the company's competitive advantages as
sufficient enough to drive excess economic profits over an extended period.
Darden remains the second-largest casual-dining restaurant operator in the United States after selling
Red Lobster, representing approximately 8.5% of the $80 billion domestic casual-dining market. This
places the company behind DineEquity (9% share based on total systemwide sales), but still ahead of
Bloomin' Brands (5% share), Brinker International (3%), and Cheesecake Factory (2%). However, the
casual-dining restaurant industry has become increasingly more competitive in recent years, as we
believe the emergence of fast-casual restaurant concepts has resulted in elevated industry promotional
activity and altering guest experience expectations. In our view, these trends will continue in the years
to come, which will effectively neutralize Darden's brand intangible asset advantages, bargaining power
with suppliers, and marketing and other economies of scale, the combination of which provided the
foundation for our previous narrow moat rating.
Starbucks
At the other end of the spectum, there are examples of restaurant companies that have been able to
adapt to consumer preference and other structural changes within the industry. In our view, Starbucks
provides a prime example. Although the company has admittedly benefited from broader tailwinds
Consumer Observer | 9 April 2015
Healthcare Observer | 14 April 2015
Page 25 of 86
Page 25 of 86
fueling the specialty coffee category, we believe the company has taken steps to enhance the brand
intangible asset behind its wide moat rating, resulting in a positive moat trend. This view is validated by
four consecutive years of global comparable-restaurant sales of 5% or greater. Additionally, we believe
that few national/regional restaurant or specialty coffee operators are willing or able to compete with
Starbucks' in-store customer experience, outside a handful of smaller independent coffee chains or
select fast-casual concepts.
We identify several drivers for Starbucks to improve store productivity at new and existing locations,
adding incremental support to our positive moat trend rating. Among the most innovative productivity
initiatives is Mobile Order & Pay, which dovetails nicely with the company's existing digital and loyalty
platforms and could be a game changer across high-frequency retailers and restaurant concepts. The
program, which is expected to be launched nationwide in the U.S. during 2015, allows customers to
place customized beverage and food orders from mobile devices for pickup in a store of their choosing.
We see many benefits from the platform, including more My Starbucks Reward loyalty members, greater
targeted marketing efforts leading to higher food attachment rates and average ticket sizes, increased
purchasing frequency from existing customers, and greater store throughput by effectively eliminating
point-of-sale pain points. Although it may take some time for consumers to adopt this program, we
believe in-store disruptions or the need for a material increase in in-store labor/equipment will be
limited. Management also plans to introduce delivery in 2015, facilitating deliveries in high-density
markets by creating staging areas in unused office buildings and using its existing store locations and
third-party contracted delivery companies in more suburban locations.
Chipotle
With industry-leading comparable sales growth and restaurant-level margins during an increasingly
competitive environment for restaurant operators, we believe Chipotle has carved out a narrow
economic moat. Breaking down Chipotle's recent comparable-restaurant sales trends, we see many
characteristics that validate the strength of its brand intangible asset, which provides the foundation for
our moat rating. Chipotle has averaged 10% comparable-restaurant sales growth the past four years,
driven in large part by traffic growth and only minimal pricing increases. This outpaces traffic for the
broader restaurant category averages—which we peg in the low-single-digit range across all restaurant
categories and low- to mid-single-digit growth for fast-casual concepts—implying market share gains
and helping put Chipotle's brand intangible asset in perspective. However, we believe that recent
transaction growth in the high-single- to low-double-digit range during the past few quarters is
particularly noteworthy, as it comes on top of a 6% increase in menu prices put in place during the
second quarter of 2014 (the first meaningful menu price increase since 2010) as well as an uptick in
catering and add-on orders. In our view, these contributors also provide further evidence of the pricing
power inherent in the brand, a key component when evaluating intangible assets among consumer
companies.
Chipotle's success and compelling unit economics have not gone unnoticed, however, spawning
multiple fast-casual restaurant rivals with aggressive growth aspirations. We anticipate that category
rivalry will escalate and evolve over the next several years (including competition from new entrants as
well as existing quick-service, fast-casual, and casual-dining restaurant operators), forcing firms to
Consumer Observer | 9 April 2015
Healthcare Observer | 14 April 2015
Page 26 of 86
Page 26 of 86
increasingly compete with one another for share through menu innovations, aggressive pricing, and
limited-time offers (not dissimilar to the maturation of the quick-service restaurant industry in the U.S.
over the past decade). Additionally, with retail landlords looking for tenants for unoccupied real estate
and restaurant operators finding themselves with easier access to capital, we anticipate new fast-casual
restaurant entrants will increasingly come to the market.
Nevertheless, we believe Chipotle has separated itself from its fast-casual peers and can defend market
share from new rivals while preserving pricing power. This is in large part due to its "Food with Integrity"
mantra (sourcing naturally raised proteins, dairy products from pasture-raised cattle, and organic
produce, which are more costly but offer a key source of differentiation), upscale restaurant
environments, and uniquely customizable menu structure, each of which enriches Chipotle's brand
intangible asset moat source.
Panera
What about Panera, the largest player in the $39 billion domestic fast-casual industry? In our view,
Panera has exhibited several signs of an emerging intangible asset moat source, resulting in a positive
moat trend. The compelling economics of the fast-casual bakery-cafe concept have attracted a number
of substitutes in recent years, including encroaching competition from traditional quick-service and
casual-dining participants. However, the Panera brand has shown more pricing power than most
restaurant chains, as evidenced by average annual menu price increases of approximately 3% during the
past five years. We believe the Panera brand can maintain its pricing power through its Panera 2.0
initiatives, which are focused on reducing customer friction through additional peak-hour throughput
capacity, labor and production equipment investments, moderating restaurant complexity, implementing
new marketing strategies, and introducing menus that allow for greater portion-size control but also
leave flexibility for new items. We also view the company's plans to use mobile technology for in-cafe
and take-away opportunities constructively, which is critical for restaurant operators to stay engaged
with consumers in a rapidly evolving retail environment.
Although we expect capital expenditures to gradually rise during the next several years for new store
openings (particularly in underpenetrated urban markets), restaurant exterior and interior upgrades,
delivery and catering hubs, and capacity, throughput, and customer experience initiatives, we believe
these measures will help enhance Panera's brand intangible asset and increase the operating leverage
inherent in its restaurant model, which supports our positive moat trend rating. Over a longer horizon,
we expect adjusted return on invested capital to improve to the high teens range, outpacing our 9% cost
of capital assumption and suggesting that the firm may be on its way to establishing an economic moat.
K
Consumer Observer | 9 April 2015
Healthcare Observer | 14 April 2015
Page 27 of 86
Page 27 of 86
Executive Summary
Now that we've discussed the changes reshaping consumer expectations across the restaurant industry,
which we believe has helped to facilitate the growth of fast-casual restaurants, we can better frame a
discussion about industry valuation. In our view, the key to whether the market is valuing the restaurant
industry appropriately can be found in the sector's supply and demand dynamics.
Based on per capita restaurant spending that remains below prerecession levels and surveys suggesting
that consumers are not eating out as much as they'd like, we believe there is a tremendous amount of
pent-up demand for fast-casual restaurants. Our analysis also indicates that market conditions are ripe
for unit growth, with a shakeout of independent restaurant operators and retail square footage
displaced by the growth of e-commerce leaving retail landlords in the need for high-quality tenants.
The growth of online retail has also resulted in fewer reliable growth stories among traditional retailers,
stirring greater investor demand for these names. We understand the market's attraction to fast-casual
names given their ability to satisfy evolving consumer preferences (and the increased pricing power),
long runway for unit growth, and shrinking pool of other growth investment vehicles in the consumer
space. In fact, we believe that in most cases, publicly traded fast-casual chains warrant a premium
valuation. However, we also believe that investors must also carefully analyze the longer-term unit
growth, margin expansion, and free cash flow opportunities of each concept to better assess whether
current market prices are realistic.
Key Takeaways
× With fast-casual restaurants aligned with changes in consumer dining-out preferences and favorable
retail rent and vacancy trends, we expect the fast-casual category revenue to grow at a CAGR of 9.4%
over the next five years, taking share from QSR and CDR chains, which we expect to grow 4.1% and
3.7%, respectively.
× The rise of e-commerce has reduced the number of reliable growth concepts among traditional retailer
space, resulting in premium valuations for much of the restaurant industry (which now trades at a
forward price/earnings multiple of almost 26 times, up from 16 times five years ago). While some of this
multiple expansion is warranted given the growth potential and lack of major disruptive presence like
Amazon, we generally believe the market has overshot the longer-term potential of many fast-casual
concepts such as Noodles & Company, Zoe's Kitchen, and Habit Restaurants.
× Conversely, we find shares of Panera attractive at current levels and don't believe the market is giving
the company enough credit for its longer-term unit growth opportunities (both traditional locations and
delivery and catering hubs) and the cash flow potential of its "Panera 2.0" restaurant remodeling
initiative.
Are There Any Restaurant Investment Opportunities in a Market Willing to Pay More Than 500 Times for Shake Shack?
R. J. Hottovy, CFA
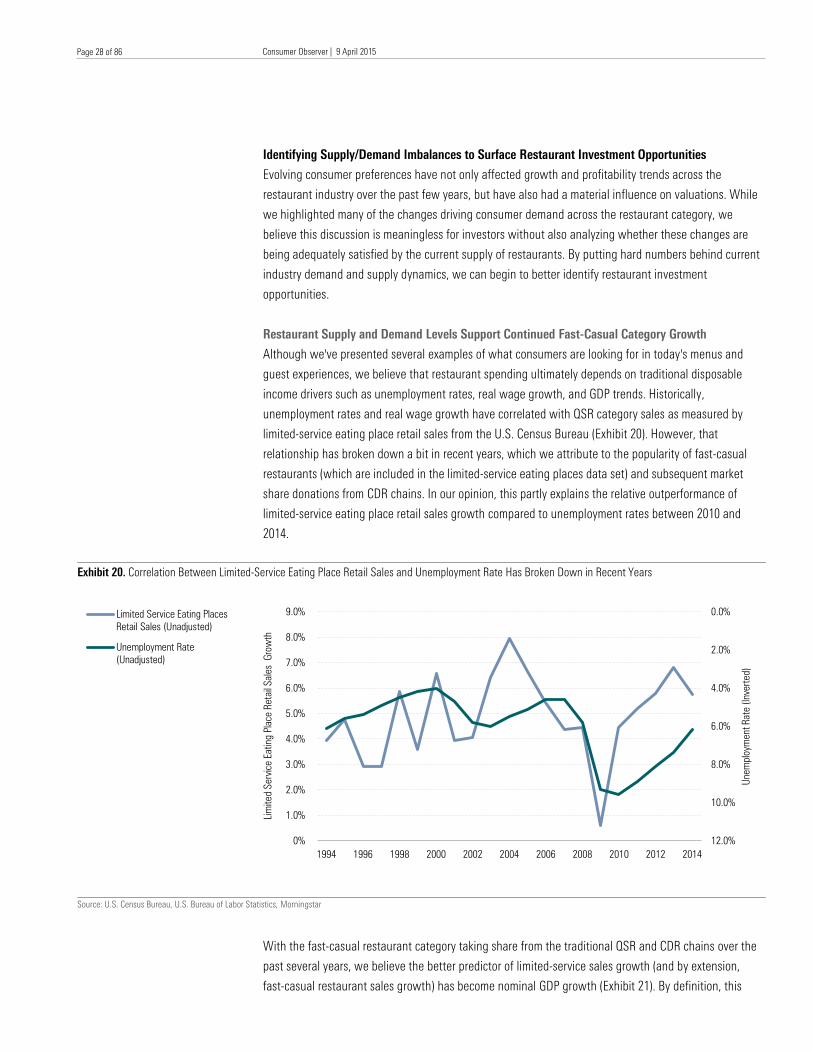
Consumer Observer | 9 April 2015
Healthcare Observer | 14 April 2015
Page 28 of 86
Page 28 of 86
Identifying Supply/Demand Imbalances to Surface Restaurant Investment Opportunities
Evolving consumer preferences have not only affected growth and profitability trends across the
restaurant industry over the past few years, but have also had a material influence on valuations. While
we highlighted many of the changes driving consumer demand across the restaurant category, we
believe this discussion is meaningless for investors without also analyzing whether these changes are
being adequately satisfied by the current supply of restaurants. By putting hard numbers behind current
industry demand and supply dynamics, we can begin to better identify restaurant investment
opportunities.
Restaurant Supply and Demand Levels Support Continued Fast-Casual Category Growth
Although we've presented several examples of what consumers are looking for in today's menus and
guest experiences, we believe that restaurant spending ultimately depends on traditional disposable
income drivers such as unemployment rates, real wage growth, and GDP trends. Historically,
unemployment rates and real wage growth have correlated with QSR category sales as measured by
limited-service eating place retail sales from the U.S. Census Bureau (Exhibit 20). However, that
relationship has broken down a bit in recent years, which we attribute to the popularity of fast-casual
restaurants (which are included in the limited-service eating places data set) and subsequent market
share donations from CDR chains. In our opinion, this partly explains the relative outperformance of
limited-service eating place retail sales growth compared to unemployment rates between 2010 and
2014.
Exhibit 20. Correlation Between Limited-Service Eating Place Retail Sales and Unemployment Rate Has Broken Down in Recent Years
Source: U.S. Census Bureau, U.S. Bureau of Labor Statistics, Morningstar
With the fast-casual restaurant category taking share from the traditional QSR and CDR chains over the
past several years, we believe the better predictor of limited-service sales growth (and by extension,
fast-casual restaurant sales growth) has become nominal GDP growth (Exhibit 21). By definition, this
0.0%
2.0%
4.0%
6.0%
8.0%
10.0%
12.0%0%
1.0%
2.0%
3.0%
4.0%
5.0%
6.0%
7.0%
8.0%
9.0%
1994 1996 1998 2000 2002 2004 2006 2008 2010 2012 2014
Unem
plo
ym
ent R
ate (
Inverted)
Lim
ited S
ervic
e E
atin
g P
lace R
etail S
ale
s G
row
th
Limited Service Eating Places
Retail Sales (Unadjusted)
Unemployment Rate
(Unadjusted)
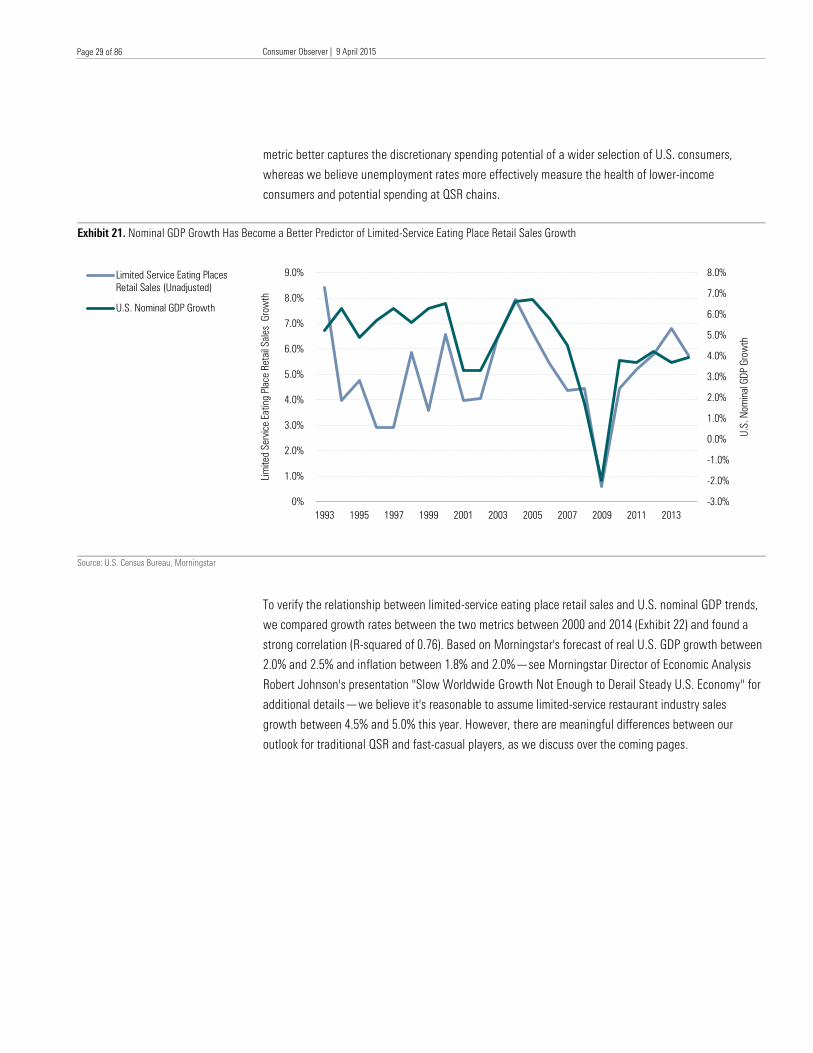
Consumer Observer | 9 April 2015
Healthcare Observer | 14 April 2015
Page 29 of 86
Page 29 of 86
metric better captures the discretionary spending potential of a wider selection of U.S. consumers,
whereas we believe unemployment rates more effectively measure the health of lower-income
consumers and potential spending at QSR chains.
Exhibit 21. Nominal GDP Growth Has Become a Better Predictor of Limited-Service Eating Place Retail Sales Growth
Source: U.S. Census Bureau, Morningstar
To verify the relationship between limited-service eating place retail sales and U.S. nominal GDP trends,
we compared growth rates between the two metrics between 2000 and 2014 (Exhibit 22) and found a
strong correlation (R-squared of 0.76). Based on Morningstar's forecast of real U.S. GDP growth between
2.0% and 2.5% and inflation between 1.8% and 2.0%—see Morningstar Director of Economic Analysis
Robert Johnson's presentation "Slow Worldwide Growth Not Enough to Derail Steady U.S. Economy" for
additional details—we believe it's reasonable to assume limited-service restaurant industry sales
growth between 4.5% and 5.0% this year. However, there are meaningful differences between our
outlook for traditional QSR and fast-casual players, as we discuss over the coming pages.
-3.0%
-2.0%
-1.0%
0.0%
1.0%
2.0%
3.0%
4.0%
5.0%
6.0%
7.0%
8.0%
0%
1.0%
2.0%
3.0%
4.0%
5.0%
6.0%
7.0%
8.0%
9.0%
1993 1995 1997 1999 2001 2003 2005 2007 2009 2011 2013
U.S
. N
om
inal G
DP G
row
th
Lim
ited S
ervic
e E
atin
g P
lace R
etail S
ale
s G
row
th
Limited Service Eating Places
Retail Sales (Unadjusted)
U.S. Nominal GDP Growth
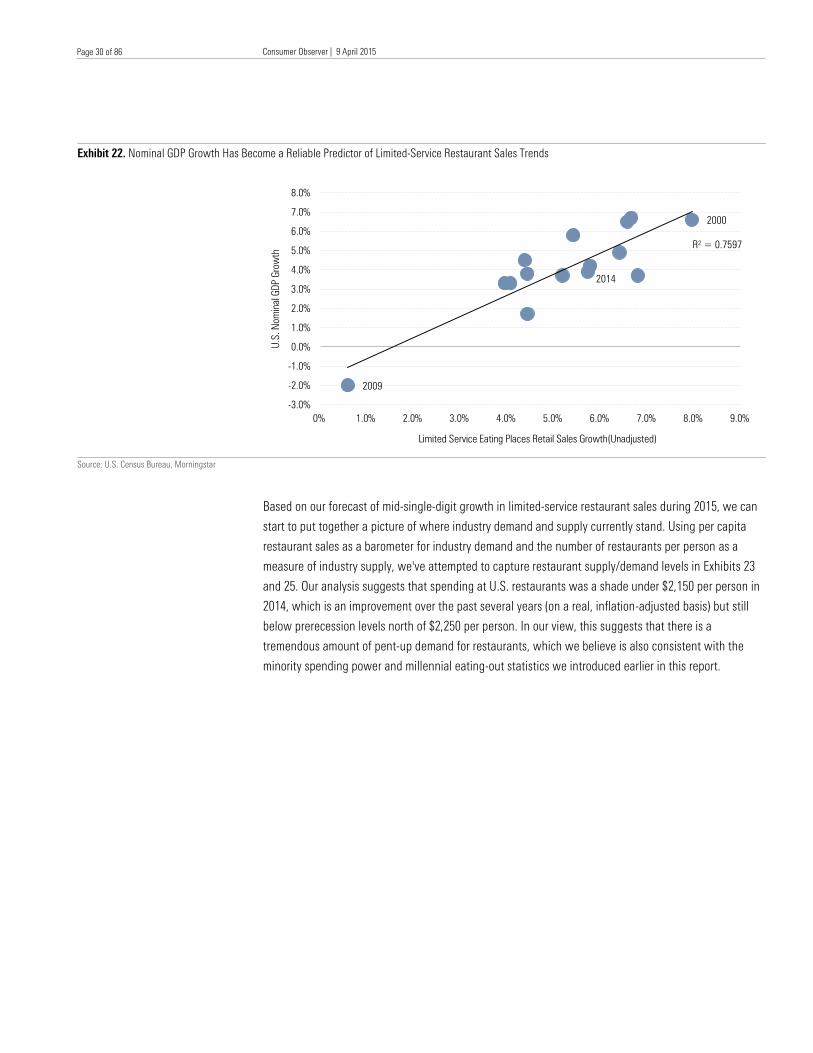
Consumer Observer | 9 April 2015
Healthcare Observer | 14 April 2015
Page 30 of 86
Page 30 of 86
Exhibit 22. Nominal GDP Growth Has Become a Reliable Predictor of Limited-Service Restaurant Sales Trends
Source: U.S. Census Bureau, Morningstar
Based on our forecast of mid-single-digit growth in limited-service restaurant sales during 2015, we can
start to put together a picture of where industry demand and supply currently stand. Using per capita
restaurant sales as a barometer for industry demand and the number of restaurants per person as a
measure of industry supply, we've attempted to capture restaurant supply/demand levels in Exhibits 23
and 25. Our analysis suggests that spending at U.S. restaurants was a shade under $2,150 per person in
2014, which is an improvement over the past several years (on a real, inflation-adjusted basis) but still
below prerecession levels north of $2,250 per person. In our view, this suggests that there is a
tremendous amount of pent-up demand for restaurants, which we believe is also consistent with the
minority spending power and millennial eating-out statistics we introduced earlier in this report.
2000
2009
2014
R² = 0.7597
-3.0%
-2.0%
-1.0%
0.0%
1.0%
2.0%
3.0%
4.0%
5.0%
6.0%
7.0%
8.0%
0% 1.0% 2.0% 3.0% 4.0% 5.0% 6.0% 7.0% 8.0% 9.0%
U.S
. N
om
inal G
DP G
row
th
Limited Service Eating Places Retail Sales Growth(Unadjusted)
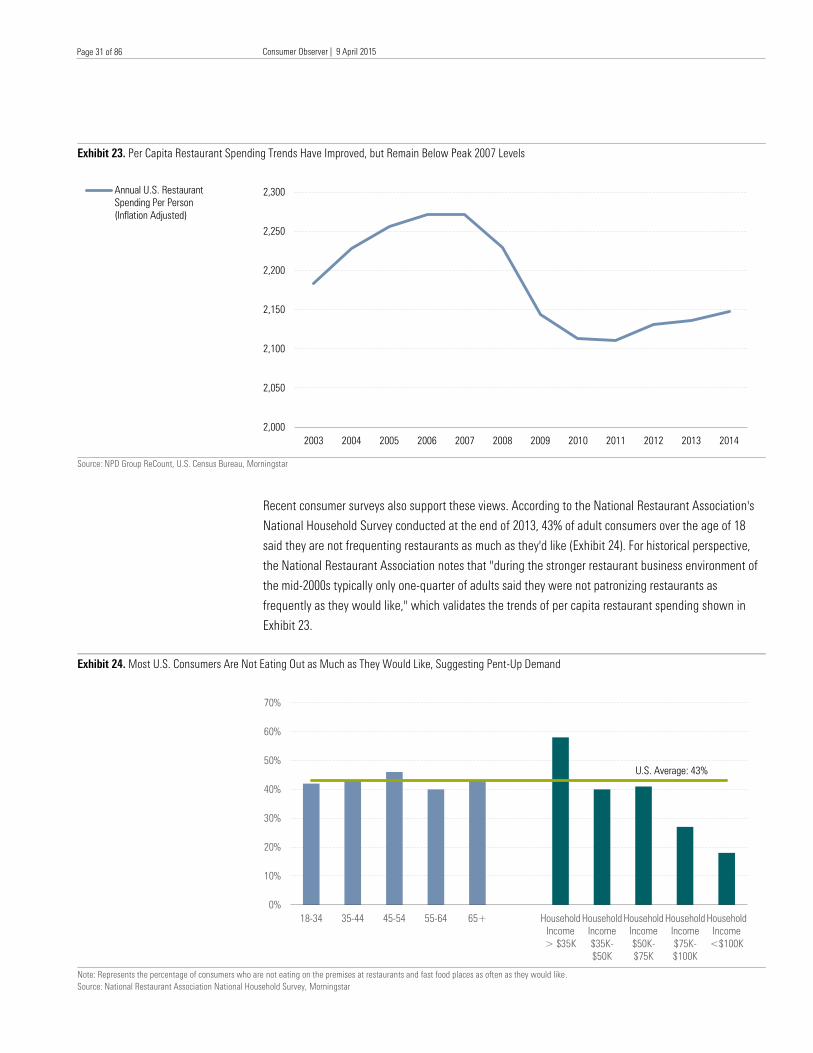
Consumer Observer | 9 April 2015
Healthcare Observer | 14 April 2015
Page 31 of 86
Page 31 of 86
Exhibit 23. Per Capita Restaurant Spending Trends Have Improved, but Remain Below Peak 2007 Levels
Source: NPD Group ReCount, U.S. Census Bureau, Morningstar
Recent consumer surveys also support these views. According to the National Restaurant Association's
National Household Survey conducted at the end of 2013, 43% of adult consumers over the age of 18
said they are not frequenting restaurants as much as they'd like (Exhibit 24). For historical perspective,
the National Restaurant Association notes that "during the stronger restaurant business environment of
the mid-2000s typically only one-quarter of adults said they were not patronizing restaurants as
frequently as they would like," which validates the trends of per capita restaurant spending shown in
Exhibit 23.
Exhibit 24. Most U.S. Consumers Are Not Eating Out as Much as They Would Like, Suggesting Pent-Up Demand
Note: Represents the percentage of consumers who are not eating on the premises at restaurants and fast food places as often as they would like.
Source: National Restaurant Association National Household Survey, Morningstar
2,000
2,050
2,100
2,150
2,200
2,250
2,300
2003 2004 2005 2006 2007 2008 2009 2010 2011 2012 2013 2014
Annual U.S. Restaurant
Spending Per Person
(Inflation Adjusted)
0%
10%
20%
30%
40%
50%
60%
70%
18-34 35-44 45-54 55-64 65+ Household
Income
> $35K
Household
Income
$35K-
$50K
Household
Income
$50K-
$75K
Household
Income
$75K-
$100K
Household
Income
<$100K
U.S. Average: 43%
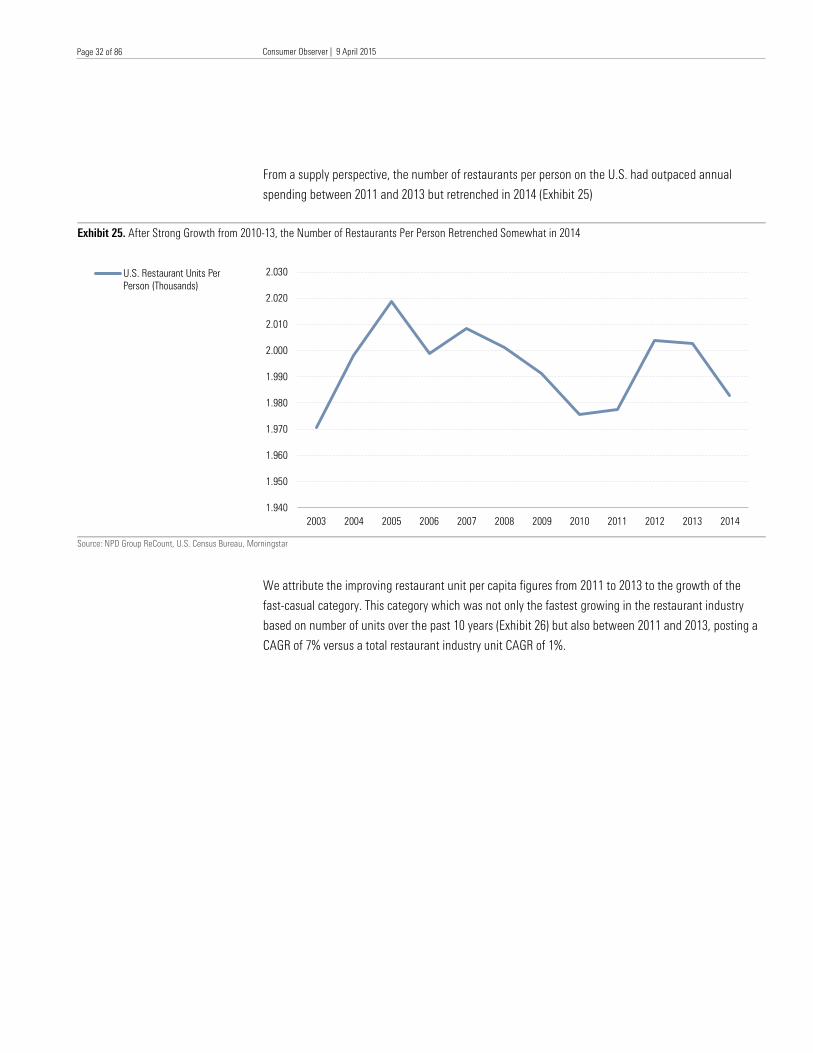
Consumer Observer | 9 April 2015
Healthcare Observer | 14 April 2015
Page 32 of 86
Page 32 of 86
From a supply perspective, the number of restaurants per person on the U.S. had outpaced annual
spending between 2011 and 2013 but retrenched in 2014 (Exhibit 25)
Exhibit 25. After Strong Growth from 2010-13, the Number of Restaurants Per Person Retrenched Somewhat in 2014
Source: NPD Group ReCount, U.S. Census Bureau, Morningstar
We attribute the improving restaurant unit per capita figures from 2011 to 2013 to the growth of the
fast-casual category. This category which was not only the fastest growing in the restaurant industry
based on number of units over the past 10 years (Exhibit 26) but also between 2011 and 2013, posting a
CAGR of 7% versus a total restaurant industry unit CAGR of 1%.
1.940
1.950
1.960
1.970
1.980
1.990
2.000
2.010
2.020
2.030
2003 2004 2005 2006 2007 2008 2009 2010 2011 2012 2013 2014
U.S. Restaurant Units Per
Person (Thousands)
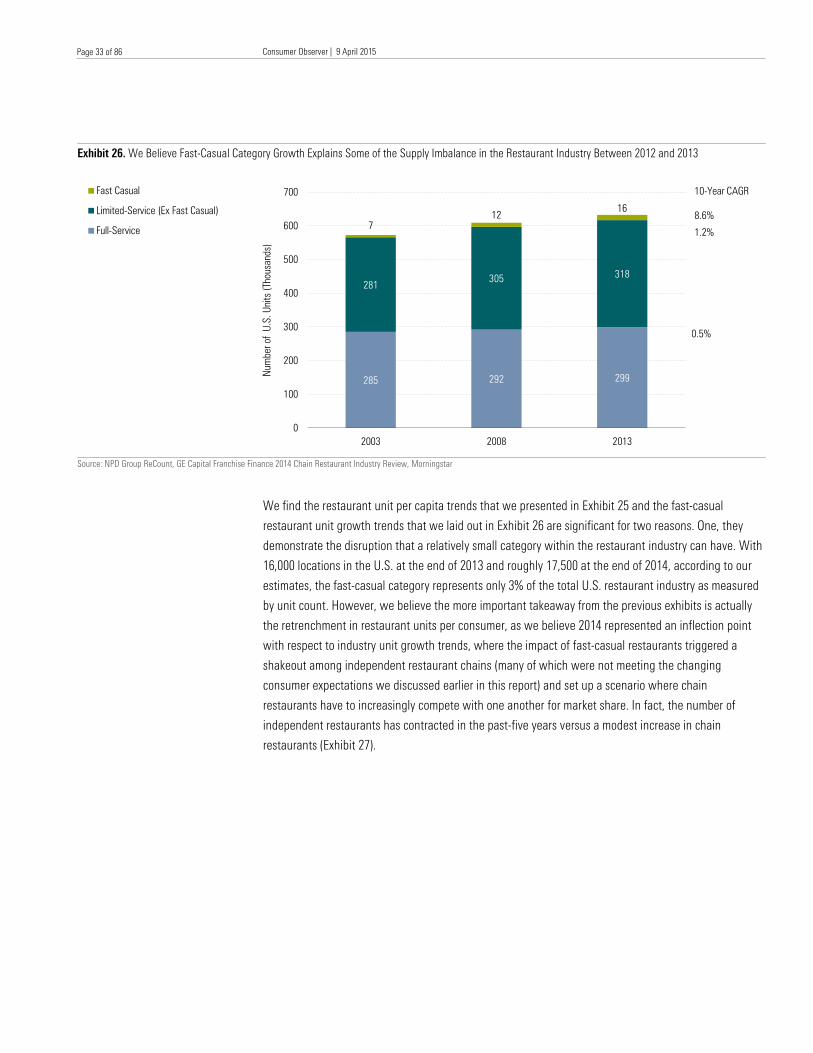
Consumer Observer | 9 April 2015
Healthcare Observer | 14 April 2015
Page 33 of 86
Page 33 of 86
Exhibit 26. We Believe Fast-Casual Category Growth Explains Some of the Supply Imbalance in the Restaurant Industry Between 2012 and 2013
Source: NPD Group ReCount, GE Capital Franchise Finance 2014 Chain Restaurant Industry Review, Morningstar
We find the restaurant unit per capita trends that we presented in Exhibit 25 and the fast-casual
restaurant unit growth trends that we laid out in Exhibit 26 are significant for two reasons. One, they
demonstrate the disruption that a relatively small category within the restaurant industry can have. With
16,000 locations in the U.S. at the end of 2013 and roughly 17,500 at the end of 2014, according to our
estimates, the fast-casual category represents only 3% of the total U.S. restaurant industry as measured
by unit count. However, we believe the more important takeaway from the previous exhibits is actually
the retrenchment in restaurant units per consumer, as we believe 2014 represented an inflection point
with respect to industry unit growth trends, where the impact of fast-casual restaurants triggered a
shakeout among independent restaurant chains (many of which were not meeting the changing
consumer expectations we discussed earlier in this report) and set up a scenario where chain
restaurants have to increasingly compete with one another for market share. In fact, the number of
independent restaurants has contracted in the past-five years versus a modest increase in chain
restaurants (Exhibit 27).
285 292 299
281305
318
7
1216
0
100
200
300
400
500
600
700
2003 2008 2013
Num
ber o
f U
.S.
Unit
s (
Thousands)
Fast Casual
Limited-Service (Ex Fast Casual)
Full-Service
10-Year CAGR
8.6%
1.2%
0.5%
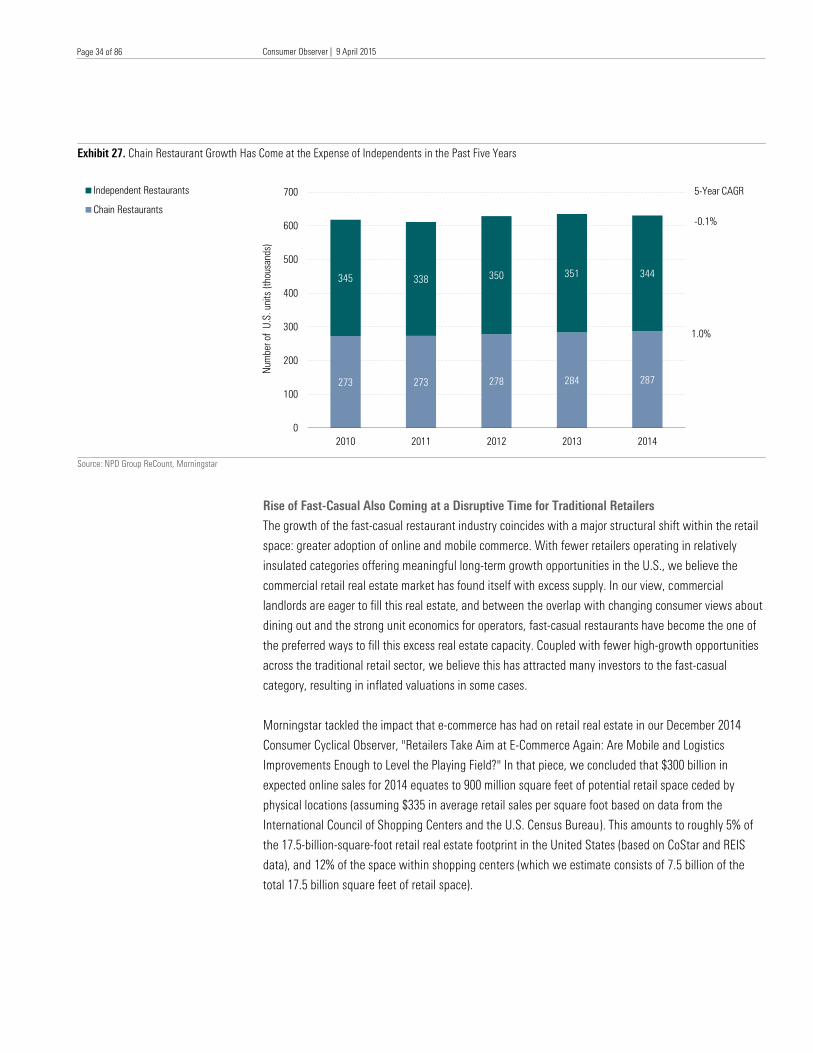
Consumer Observer | 9 April 2015
Healthcare Observer | 14 April 2015
Page 34 of 86
Page 34 of 86
Exhibit 27. Chain Restaurant Growth Has Come at the Expense of Independents in the Past Five Years
Source: NPD Group ReCount, Morningstar
Rise of Fast-Casual Also Coming at a Disruptive Time for Traditional Retailers
The growth of the fast-casual restaurant industry coincides with a major structural shift within the retail
space: greater adoption of online and mobile commerce. With fewer retailers operating in relatively
insulated categories offering meaningful long-term growth opportunities in the U.S., we believe the
commercial retail real estate market has found itself with excess supply. In our view, commercial
landlords are eager to fill this real estate, and between the overlap with changing consumer views about
dining out and the strong unit economics for operators, fast-casual restaurants have become the one of
the preferred ways to fill this excess real estate capacity. Coupled with fewer high-growth opportunities
across the traditional retail sector, we believe this has attracted many investors to the fast-casual
category, resulting in inflated valuations in some cases.
Morningstar tackled the impact that e-commerce has had on retail real estate in our December 2014
Consumer Cyclical Observer, "Retailers Take Aim at E-Commerce Again: Are Mobile and Logistics
Improvements Enough to Level the Playing Field?" In that piece, we concluded that $300 billion in
expected online sales for 2014 equates to 900 million square feet of potential retail space ceded by
physical locations (assuming $335 in average retail sales per square foot based on data from the
International Council of Shopping Centers and the U.S. Census Bureau). This amounts to roughly 5% of
the 17.5-billion-square-foot retail real estate footprint in the United States (based on CoStar and REIS
data), and 12% of the space within shopping centers (which we estimate consists of 7.5 billion of the
total 17.5 billion square feet of retail space).
273 273 278 284 287
345 338350 351 344
0
100
200
300
400
500
600
700
2010 2011 2012 2013 2014
Num
ber o
f U
.S.
unit
s (
thousands)
Independent Restaurants
Chain Restaurants
5-Year CAGR
-0.1%
1.0%
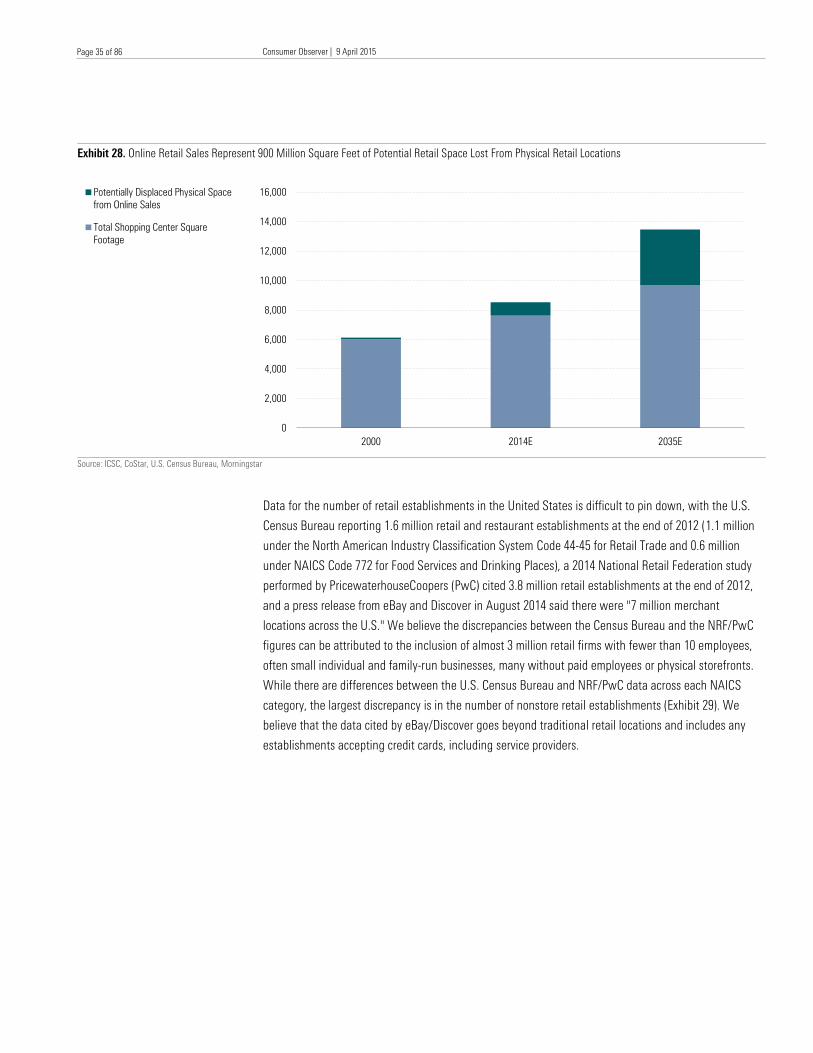
Consumer Observer | 9 April 2015
Healthcare Observer | 14 April 2015
Page 35 of 86
Page 35 of 86
Exhibit 28. Online Retail Sales Represent 900 Million Square Feet of Potential Retail Space Lost From Physical Retail Locations
Source: ICSC, CoStar, U.S. Census Bureau, Morningstar
Data for the number of retail establishments in the United States is difficult to pin down, with the U.S.
Census Bureau reporting 1.6 million retail and restaurant establishments at the end of 2012 (1.1 million
under the North American Industry Classification System Code 44-45 for Retail Trade and 0.6 million
under NAICS Code 772 for Food Services and Drinking Places), a 2014 National Retail Federation study
performed by PricewaterhouseCoopers (PwC) cited 3.8 million retail establishments at the end of 2012,
and a press release from eBay and Discover in August 2014 said there were "7 million merchant
locations across the U.S." We believe the discrepancies between the Census Bureau and the NRF/PwC
figures can be attributed to the inclusion of almost 3 million retail firms with fewer than 10 employees,
often small individual and family-run businesses, many without paid employees or physical storefronts.
While there are differences between the U.S. Census Bureau and NRF/PwC data across each NAICS
category, the largest discrepancy is in the number of nonstore retail establishments (Exhibit 29). We
believe that the data cited by eBay/Discover goes beyond traditional retail locations and includes any
establishments accepting credit cards, including service providers.
0
2,000
4,000
6,000
8,000
10,000
12,000
14,000
16,000
2000 2014E 2035E
Potentially Displaced Physical Space
from Online Sales
Total Shopping Center Square
Footage
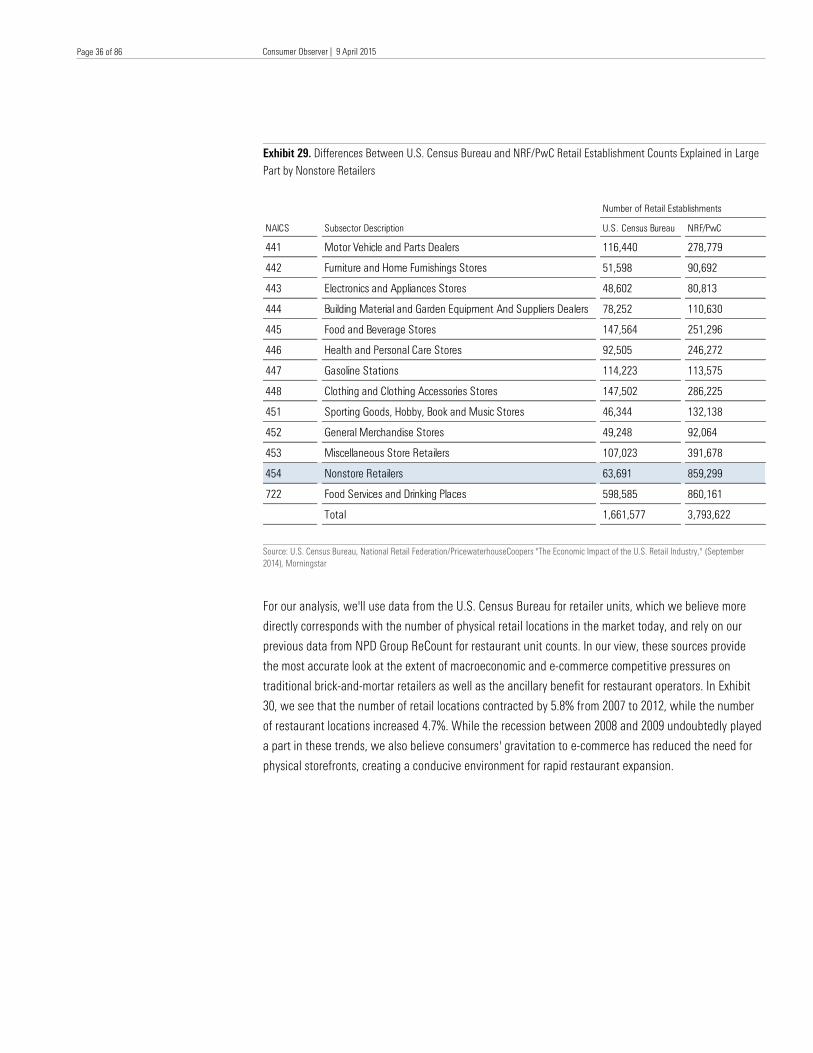
Consumer Observer | 9 April 2015
Healthcare Observer | 14 April 2015
Page 36 of 86
Page 36 of 86
Exhibit 29. Differences Between U.S. Census Bureau and NRF/PwC Retail Establishment Counts Explained in Large
Part by Nonstore Retailers
Source: U.S. Census Bureau, National Retail Federation/PricewaterhouseCoopers "The Economic Impact of the U.S. Retail Industry," (September
2014), Morningstar
For our analysis, we'll use data from the U.S. Census Bureau for retailer units, which we believe more
directly corresponds with the number of physical retail locations in the market today, and rely on our
previous data from NPD Group ReCount for restaurant unit counts. In our view, these sources provide
the most accurate look at the extent of macroeconomic and e-commerce competitive pressures on
traditional brick-and-mortar retailers as well as the ancillary benefit for restaurant operators. In Exhibit
30, we see that the number of retail locations contracted by 5.8% from 2007 to 2012, while the number
of restaurant locations increased 4.7%. While the recession between 2008 and 2009 undoubtedly played
a part in these trends, we also believe consumers' gravitation to e-commerce has reduced the need for
physical storefronts, creating a conducive environment for rapid restaurant expansion.
Number of Retail Establishments
NAICS Subsector Description U.S. Census Bureau NRF/PwC
441 Motor Vehicle and Parts Dealers 116,440 278,779
442 Furniture and Home Furnishings Stores 51,598 90,692
443 Electronics and Appliances Stores 48,602 80,813
444 Building Material and Garden Equipment And Suppliers Dealers 78,252 110,630
445 Food and Beverage Stores 147,564 251,296
446 Health and Personal Care Stores 92,505 246,272
447 Gasoline Stations 114,223 113,575
448 Clothing and Clothing Accessories Stores 147,502 286,225
451 Sporting Goods, Hobby, Book and Music Stores 46,344 132,138
452 General Merchandise Stores 49,248 92,064
453 Miscellaneous Store Retailers 107,023 391,678
454 Nonstore Retailers 63,691 859,299
722 Food Services and Drinking Places 598,585 860,161
Total 1,661,577 3,793,622
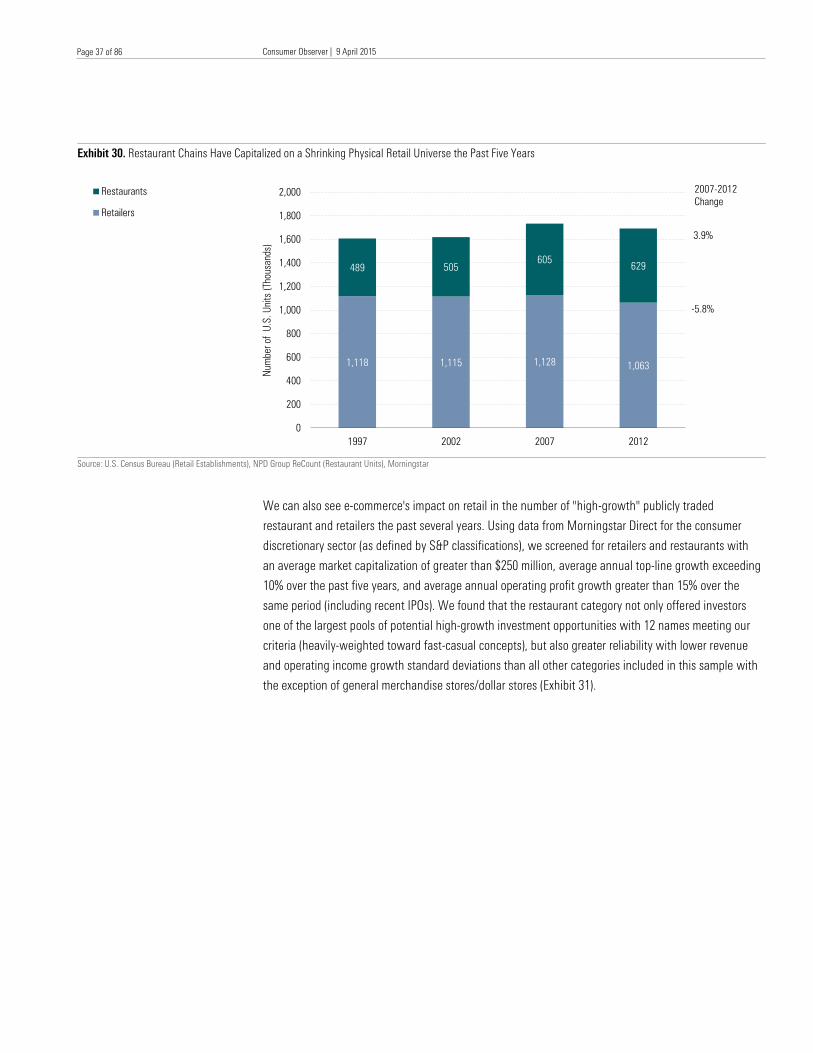
Consumer Observer | 9 April 2015
Healthcare Observer | 14 April 2015
Page 37 of 86
Page 37 of 86
Exhibit 30. Restaurant Chains Have Capitalized on a Shrinking Physical Retail Universe the Past Five Years
Source: U.S. Census Bureau (Retail Establishments), NPD Group ReCount (Restaurant Units), Morningstar
We can also see e-commerce's impact on retail in the number of "high-growth" publicly traded
restaurant and retailers the past several years. Using data from Morningstar Direct for the consumer
discretionary sector (as defined by S&P classifications), we screened for retailers and restaurants with
an average market capitalization of greater than $250 million, average annual top-line growth exceeding
10% over the past five years, and average annual operating profit growth greater than 15% over the
same period (including recent IPOs). We found that the restaurant category not only offered investors
one of the largest pools of potential high-growth investment opportunities with 12 names meeting our
criteria (heavily-weighted toward fast-casual concepts), but also greater reliability with lower revenue
and operating income growth standard deviations than all other categories included in this sample with
the exception of general merchandise stores/dollar stores (Exhibit 31).
1,118 1,115 1,1281,063
489 505
605629
0
200
400
600
800
1,000
1,200
1,400
1,600
1,800
2,000
1997 2002 2007 2012
Num
ber o
f U
.S.
Unit
s (
Thousands)
Restaurants
Retailers
2007-2012
Change
3.9%
-5.8%
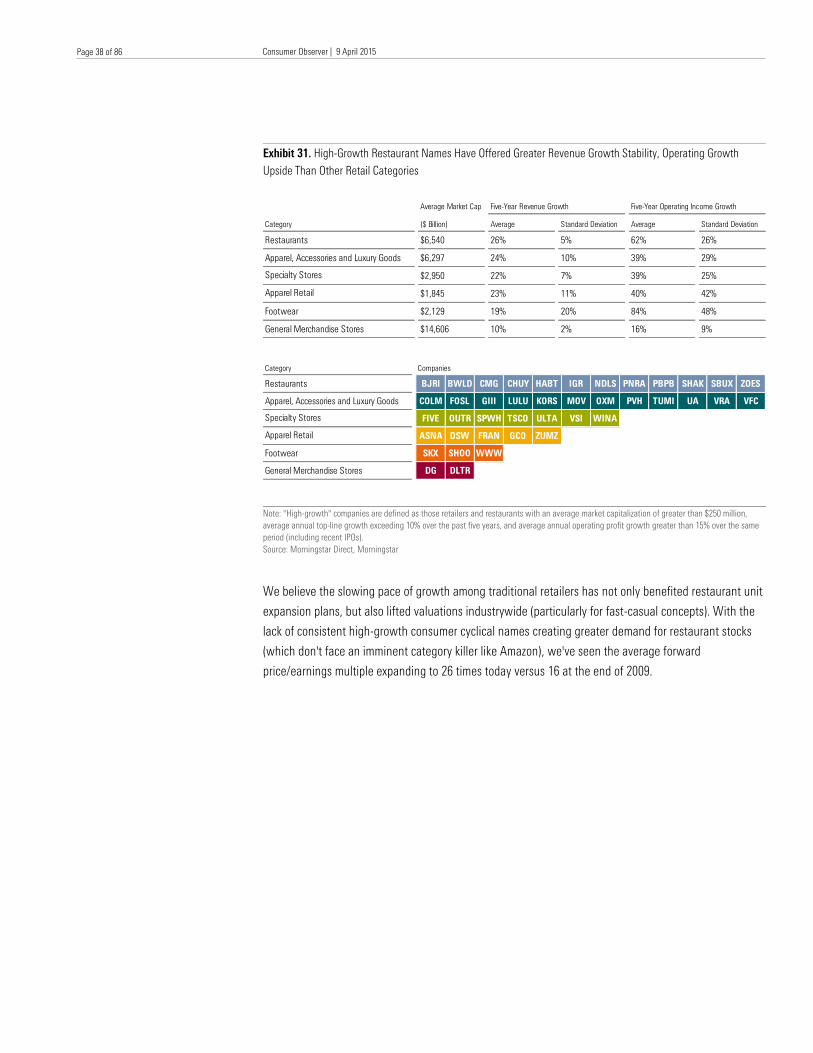
Consumer Observer | 9 April 2015
Healthcare Observer | 14 April 2015
Page 38 of 86
Page 38 of 86
Exhibit 31. High-Growth Restaurant Names Have Offered Greater Revenue Growth Stability, Operating Growth
Upside Than Other Retail Categories
Note: "High-growth" companies are defined as those retailers and restaurants with an average market capitalization of greater than $250 million,
average annual top-line growth exceeding 10% over the past five years, and average annual operating profit growth greater than 15% over the same
period (including recent IPOs).
Source: Morningstar Direct, Morningstar
We believe the slowing pace of growth among traditional retailers has not only benefited restaurant unit
expansion plans, but also lifted valuations industrywide (particularly for fast-casual concepts). With the
lack of consistent high-growth consumer cyclical names creating greater demand for restaurant stocks
(which don't face an imminent category killer like Amazon), we've seen the average forward
price/earnings multiple expanding to 26 times today versus 16 at the end of 2009.
Average Market Cap Five-Year Revenue Growth Five-Year Operating Income Growth
Category ($ Billion) Average Standard Deviation Average Standard Deviation
Restaurants $6,540 26% 5% 62% 26%
Apparel, Accessories and Luxury Goods $6,297 24% 10% 39% 29%
Specialty Stores $2,950 22% 7% 39% 25%
Apparel Retail $1,845 23% 11% 40% 42%
Footwear $2,129 19% 20% 84% 48%
General Merchandise Stores $14,606 10% 2% 16% 9%
Category Companies
Restaurants BJRI BWLD CMG CHUY HABT IGR NDLS PNRA PBPB SHAK SBUX ZOES
Apparel, Accessories and Luxury Goods COLM FOSL GIII LULU KORS MOV OXM PVH TUMI UA VRA VFC
Specialty Stores FIVE OUTR SPWH TSCO ULTA VSI WINA
Apparel Retail ASNA DSW FRAN GCO ZUMZ
Footwear SKX SHOO WWW
General Merchandise Stores DG DLTR
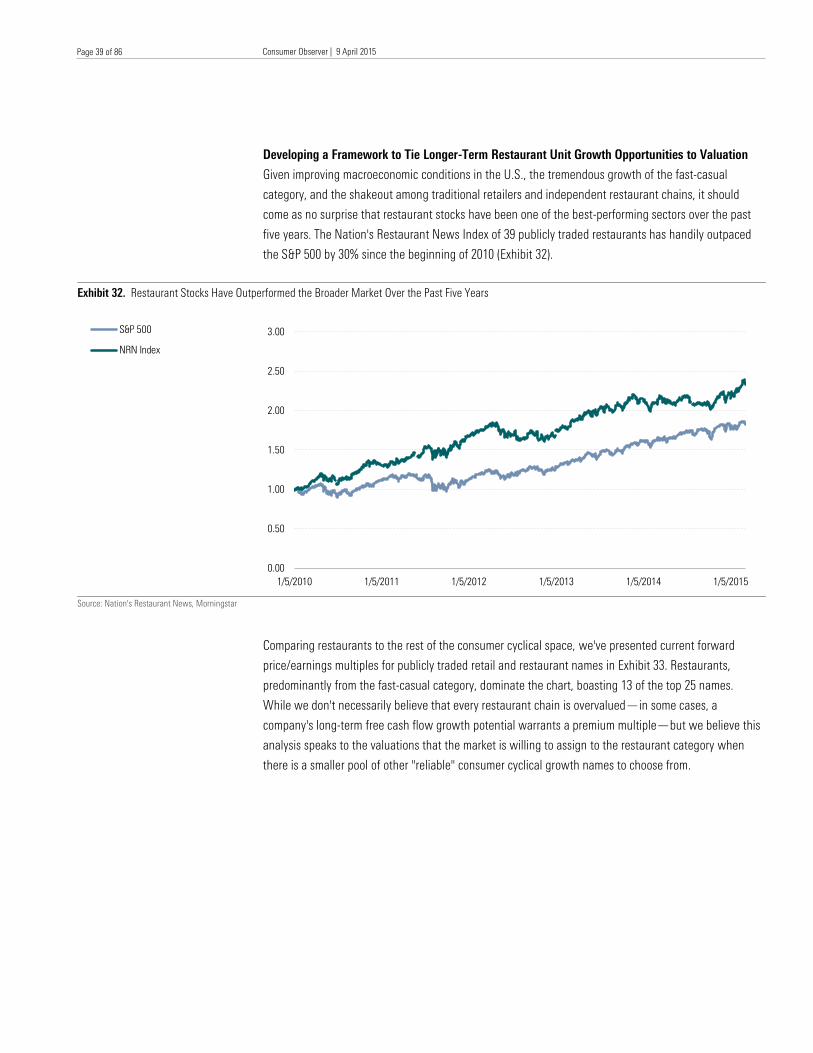
Consumer Observer | 9 April 2015
Healthcare Observer | 14 April 2015
Page 39 of 86
Page 39 of 86
Developing a Framework to Tie Longer-Term Restaurant Unit Growth Opportunities to Valuation
Given improving macroeconomic conditions in the U.S., the tremendous growth of the fast-casual
category, and the shakeout among traditional retailers and independent restaurant chains, it should
come as no surprise that restaurant stocks have been one of the best-performing sectors over the past
five years. The Nation's Restaurant News Index of 39 publicly traded restaurants has handily outpaced
the S&P 500 by 30% since the beginning of 2010 (Exhibit 32).
Exhibit 32. Restaurant Stocks Have Outperformed the Broader Market Over the Past Five Years
Source: Nation's Restaurant News, Morningstar
Comparing restaurants to the rest of the consumer cyclical space, we've presented current forward
price/earnings multiples for publicly traded retail and restaurant names in Exhibit 33. Restaurants,
predominantly from the fast-casual category, dominate the chart, boasting 13 of the top 25 names.
While we don't necessarily believe that every restaurant chain is overvalued—in some cases, a
company's long-term free cash flow growth potential warrants a premium multiple—but we believe this
analysis speaks to the valuations that the market is willing to assign to the restaurant category when
there is a smaller pool of other "reliable" consumer cyclical growth names to choose from.
0.00
0.50
1.00
1.50
2.00
2.50
3.00
1/5/2010 1/5/2011 1/5/2012 1/5/2013 1/5/2014 1/5/2015
S&P 500
NRN Index
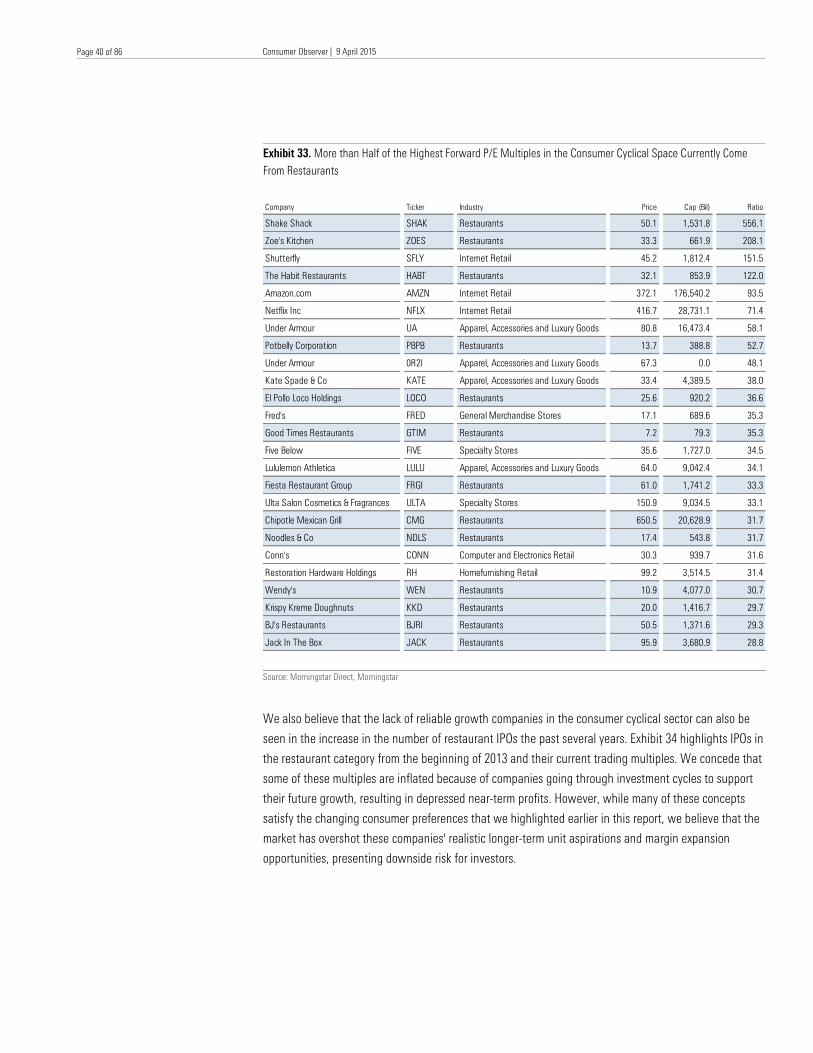
Consumer Observer | 9 April 2015
Healthcare Observer | 14 April 2015
Page 40 of 86
Page 40 of 86
Exhibit 33. More than Half of the Highest Forward P/E Multiples in the Consumer Cyclical Space Currently Come
From Restaurants
Source: Morningstar Direct, Morningstar
We also believe that the lack of reliable growth companies in the consumer cyclical sector can also be
seen in the increase in the number of restaurant IPOs the past several years. Exhibit 34 highlights IPOs in
the restaurant category from the beginning of 2013 and their current trading multiples. We concede that
some of these multiples are inflated because of companies going through investment cycles to support
their future growth, resulting in depressed near-term profits. However, while many of these concepts
satisfy the changing consumer preferences that we highlighted earlier in this report, we believe that the
market has overshot these companies' realistic longer-term unit aspirations and margin expansion
opportunities, presenting downside risk for investors.
Company Ticker Industry Price
Market
Cap (Bil)
Forward P/E
Ratio
Shake Shack SHAK Restaurants 50.1 1,531.8 556.1
Zoe's Kitchen ZOES Restaurants 33.3 661.9 208.1
Shutterfly SFLY Internet Retail 45.2 1,812.4 151.5
The Habit Restaurants HABT Restaurants 32.1 853.9 122.0
Amazon.com AMZN Internet Retail 372.1 176,540.2 93.5
Netflix Inc NFLX Internet Retail 416.7 28,731.1 71.4
Under Armour UA Apparel, Accessories and Luxury Goods 80.8 16,473.4 58.1
Potbelly Corporation PBPB Restaurants 13.7 388.8 52.7
Under Armour 0R2I Apparel, Accessories and Luxury Goods 67.3 0.0 48.1
Kate Spade & Co KATE Apparel, Accessories and Luxury Goods 33.4 4,389.5 38.0
El Pollo Loco Holdings LOCO Restaurants 25.6 920.2 36.6
Fred's FRED General Merchandise Stores 17.1 689.6 35.3
Good Times Restaurants GTIM Restaurants 7.2 79.3 35.3
Five Below FIVE Specialty Stores 35.6 1,727.0 34.5
Lululemon Athletica LULU Apparel, Accessories and Luxury Goods 64.0 9,042.4 34.1
Fiesta Restaurant Group FRGI Restaurants 61.0 1,741.2 33.3
Ulta Salon Cosmetics & Fragrances ULTA Specialty Stores 150.9 9,034.5 33.1
Chipotle Mexican Grill CMG Restaurants 650.5 20,628.9 31.7
Noodles & Co NDLS Restaurants 17.4 543.8 31.7
Conn's CONN Computer and Electronics Retail 30.3 939.7 31.6
Restoration Hardware Holdings RH Homefurnishing Retail 99.2 3,514.5 31.4
Wendy's WEN Restaurants 10.9 4,077.0 30.7
Krispy Kreme Doughnuts KKD Restaurants 20.0 1,416.7 29.7
BJ's Restaurants BJRI Restaurants 50.5 1,371.6 29.3
Jack In The Box JACK Restaurants 95.9 3,680.9 28.8
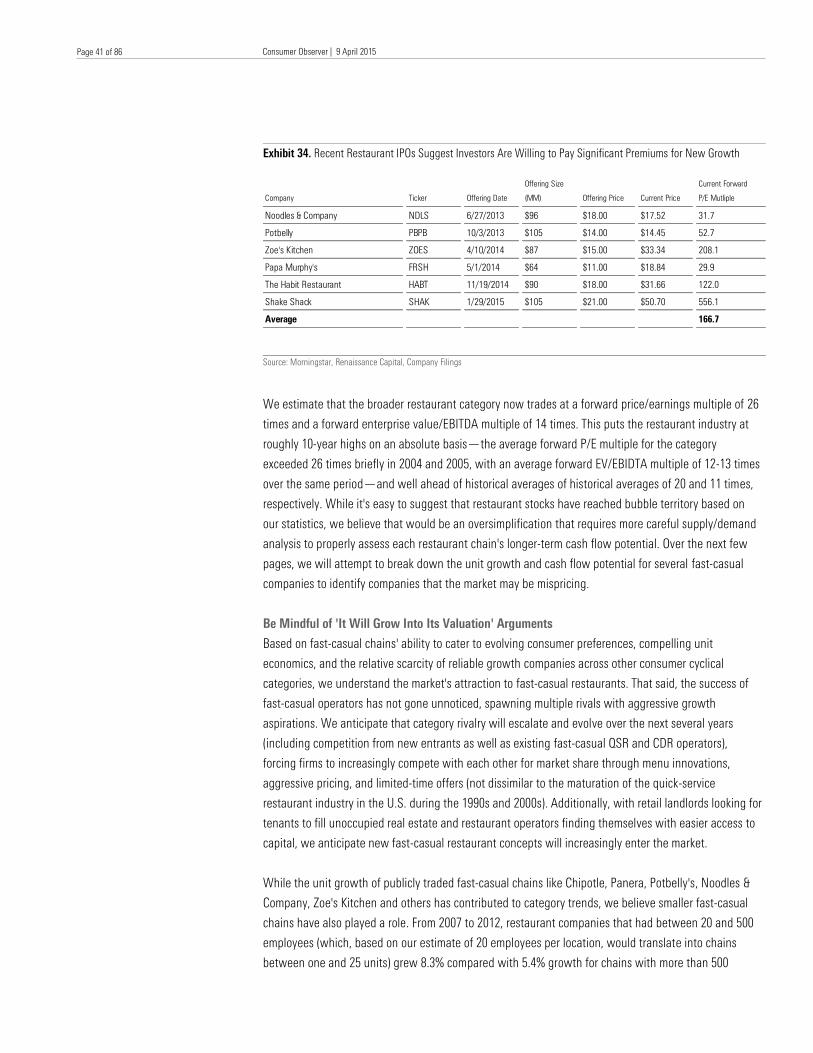
Consumer Observer | 9 April 2015
Healthcare Observer | 14 April 2015
Page 41 of 86
Page 41 of 86
Exhibit 34. Recent Restaurant IPOs Suggest Investors Are Willing to Pay Significant Premiums for New Growth
Stories
Source: Morningstar, Renaissance Capital, Company Filings
We estimate that the broader restaurant category now trades at a forward price/earnings multiple of 26
times and a forward enterprise value/EBITDA multiple of 14 times. This puts the restaurant industry at
roughly 10-year highs on an absolute basis—the average forward P/E multiple for the category
exceeded 26 times briefly in 2004 and 2005, with an average forward EV/EBIDTA multiple of 12-13 times
over the same period—and well ahead of historical averages of historical averages of 20 and 11 times,
respectively. While it's easy to suggest that restaurant stocks have reached bubble territory based on
our statistics, we believe that would be an oversimplification that requires more careful supply/demand
analysis to properly assess each restaurant chain's longer-term cash flow potential. Over the next few
pages, we will attempt to break down the unit growth and cash flow potential for several fast-casual
companies to identify companies that the market may be mispricing.
Be Mindful of 'It Will Grow Into Its Valuation' Arguments
Based on fast-casual chains' ability to cater to evolving consumer preferences, compelling unit
economics, and the relative scarcity of reliable growth companies across other consumer cyclical
categories, we understand the market's attraction to fast-casual restaurants. That said, the success of
fast-casual operators has not gone unnoticed, spawning multiple rivals with aggressive growth
aspirations. We anticipate that category rivalry will escalate and evolve over the next several years
(including competition from new entrants as well as existing fast-casual QSR and CDR operators),
forcing firms to increasingly compete with each other for market share through menu innovations,
aggressive pricing, and limited-time offers (not dissimilar to the maturation of the quick-service
restaurant industry in the U.S. during the 1990s and 2000s). Additionally, with retail landlords looking for
tenants to fill unoccupied real estate and restaurant operators finding themselves with easier access to
capital, we anticipate new fast-casual restaurant concepts will increasingly enter the market.
While the unit growth of publicly traded fast-casual chains like Chipotle, Panera, Potbelly's, Noodles &
Company, Zoe's Kitchen and others has contributed to category trends, we believe smaller fast-casual
chains have also played a role. From 2007 to 2012, restaurant companies that had between 20 and 500
employees (which, based on our estimate of 20 employees per location, would translate into chains
between one and 25 units) grew 8.3% compared with 5.4% growth for chains with more than 500
Company Ticker Offering Date
Offering Size
(MM) Offering Price Current Price
Current Forward
P/E Mutliple
Noodles & Company NDLS 6/27/2013 $96 $18.00 $17.52 31.7
Potbelly PBPB 10/3/2013 $105 $14.00 $14.45 52.7
Zoe's Kitchen ZOES 4/10/2014 $87 $15.00 $33.34 208.1
Papa Murphy's FRSH 5/1/2014 $64 $11.00 $18.84 29.9
The Habit Restaurant HABT 11/19/2014 $90 $18.00 $31.66 122.0
Shake Shack SHAK 1/29/2015 $105 $21.00 $50.70 556.1
Average 166.7
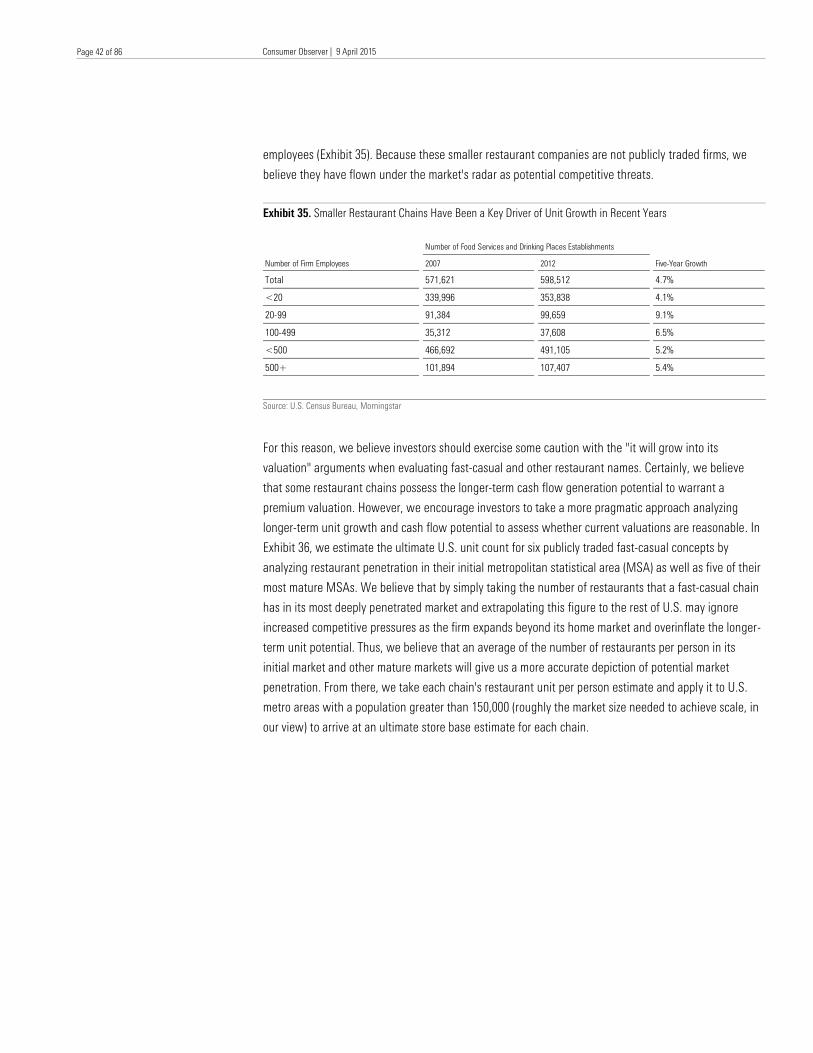
Consumer Observer | 9 April 2015
Healthcare Observer | 14 April 2015
Page 42 of 86
Page 42 of 86
employees (Exhibit 35). Because these smaller restaurant companies are not publicly traded firms, we
believe they have flown under the market's radar as potential competitive threats.
Exhibit 35. Smaller Restaurant Chains Have Been a Key Driver of Unit Growth in Recent Years
Source: U.S. Census Bureau, Morningstar
For this reason, we believe investors should exercise some caution with the "it will grow into its
valuation" arguments when evaluating fast-casual and other restaurant names. Certainly, we believe
that some restaurant chains possess the longer-term cash flow generation potential to warrant a
premium valuation. However, we encourage investors to take a more pragmatic approach analyzing
longer-term unit growth and cash flow potential to assess whether current valuations are reasonable. In
Exhibit 36, we estimate the ultimate U.S. unit count for six publicly traded fast-casual concepts by
analyzing restaurant penetration in their initial metropolitan statistical area (MSA) as well as five of their
most mature MSAs. We believe that by simply taking the number of restaurants that a fast-casual chain
has in its most deeply penetrated market and extrapolating this figure to the rest of U.S. may ignore
increased competitive pressures as the firm expands beyond its home market and overinflate the longer-
term unit potential. Thus, we believe that an average of the number of restaurants per person in its
initial market and other mature markets will give us a more accurate depiction of potential market
penetration. From there, we take each chain's restaurant unit per person estimate and apply it to U.S.
metro areas with a population greater than 150,000 (roughly the market size needed to achieve scale, in
our view) to arrive at an ultimate store base estimate for each chain.
Number of Food Services and Drinking Places Establishments
Number of Firm Employees 2007 2012 Five-Year Growth
Total 571,621 598,512 4.7%
<20 339,996 353,838 4.1%
20-99 91,384 99,659 9.1%
100-499 35,312 37,608 6.5%
<500 466,692 491,105 5.2%
500+ 101,894 107,407 5.4%
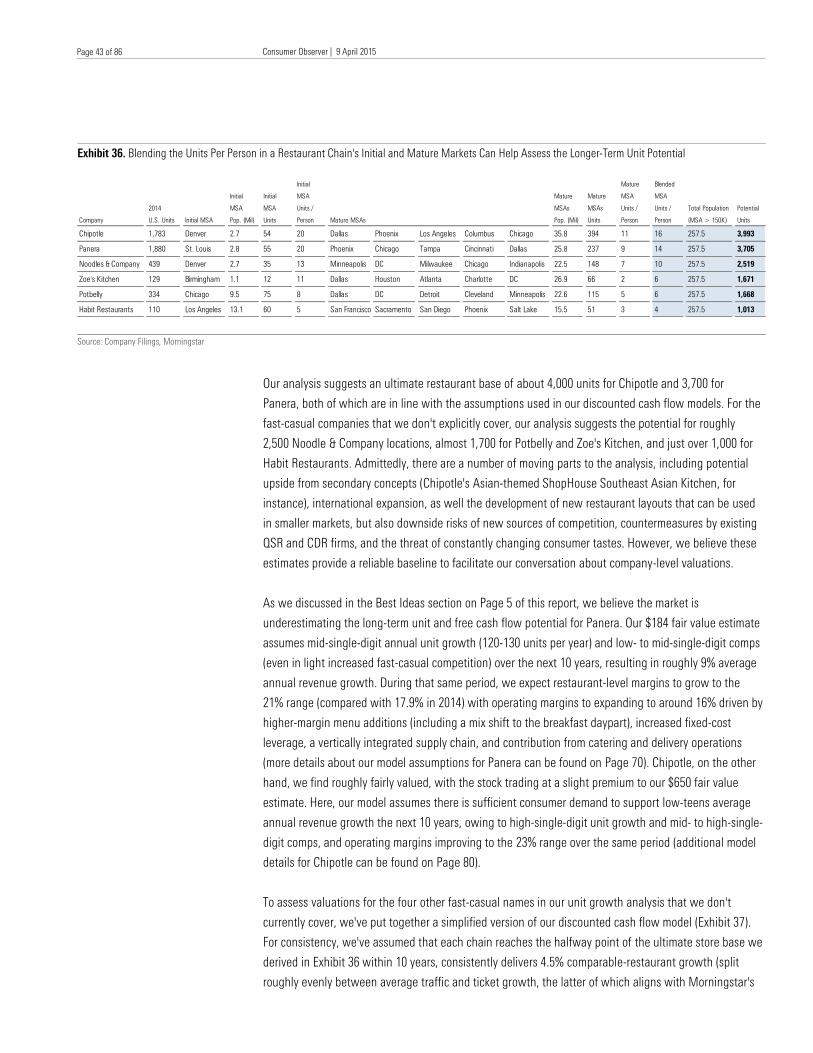
Consumer Observer | 9 April 2015
Healthcare Observer | 14 April 2015
Page 43 of 86
Page 43 of 86
Exhibit 36. Blending the Units Per Person in a Restaurant Chain's Initial and Mature Markets Can Help Assess the Longer-Term Unit Potential
Source: Company Filings, Morningstar
Our analysis suggests an ultimate restaurant base of about 4,000 units for Chipotle and 3,700 for
Panera, both of which are in line with the assumptions used in our discounted cash flow models. For the
fast-casual companies that we don't explicitly cover, our analysis suggests the potential for roughly
2,500 Noodle & Company locations, almost 1,700 for Potbelly and Zoe's Kitchen, and just over 1,000 for
Habit Restaurants. Admittedly, there are a number of moving parts to the analysis, including potential
upside from secondary concepts (Chipotle's Asian-themed ShopHouse Southeast Asian Kitchen, for
instance), international expansion, as well the development of new restaurant layouts that can be used
in smaller markets, but also downside risks of new sources of competition, countermeasures by existing
QSR and CDR firms, and the threat of constantly changing consumer tastes. However, we believe these
estimates provide a reliable baseline to facilitate our conversation about company-level valuations.
As we discussed in the Best Ideas section on Page 5 of this report, we believe the market is
underestimating the long-term unit and free cash flow potential for Panera. Our $184 fair value estimate
assumes mid-single-digit annual unit growth (120-130 units per year) and low- to mid-single-digit comps
(even in light increased fast-casual competition) over the next 10 years, resulting in roughly 9% average
annual revenue growth. During that same period, we expect restaurant-level margins to grow to the
21% range (compared with 17.9% in 2014) with operating margins to expanding to around 16% driven by
higher-margin menu additions (including a mix shift to the breakfast daypart), increased fixed-cost
leverage, a vertically integrated supply chain, and contribution from catering and delivery operations
(more details about our model assumptions for Panera can be found on Page 70). Chipotle, on the other
hand, we find roughly fairly valued, with the stock trading at a slight premium to our $650 fair value
estimate. Here, our model assumes there is sufficient consumer demand to support low-teens average
annual revenue growth the next 10 years, owing to high-single-digit unit growth and mid- to high-single-
digit comps, and operating margins improving to the 23% range over the same period (additional model
details for Chipotle can be found on Page 80).
To assess valuations for the four other fast-casual names in our unit growth analysis that we don't
currently cover, we've put together a simplified version of our discounted cash flow model (Exhibit 37).
For consistency, we've assumed that each chain reaches the halfway point of the ultimate store base we
derived in Exhibit 36 within 10 years, consistently delivers 4.5% comparable-restaurant growth (split
roughly evenly between average traffic and ticket growth, the latter of which aligns with Morningstar's
Company
2014
U.S. Units Initial MSA
Initial
MSA
Pop. (Mil)
Initial
MSA
Units
Initial
MSA
Units /
Person Mature MSAs
Mature
MSAs
Pop. (Mil)
Mature
MSAs
Units
Mature
MSA
Units /
Person
Blended
MSA
Units /
Person
Total Population
(MSA > 150K)
Potential
Units
Chipotle 1,783 Denver 2.7 54 20 Dallas Phoenix Los Angeles Columbus Chicago 35.8 394 11 16 257.5 3,993
Panera 1,880 St. Louis 2.8 55 20 Phoenix Chicago Tampa Cincinnati Dallas 25.8 237 9 14 257.5 3,705
Noodles & Company 439 Denver 2.7 35 13 Minneapolis DC Milwaukee Chicago Indianapolis 22.5 148 7 10 257.5 2,519
Zoe's Kitchen 129 Birmingham 1.1 12 11 Dallas Houston Atlanta Charlotte DC 26.9 66 2 6 257.5 1,671
Potbelly 334 Chicago 9.5 75 8 Dallas DC Detroit Cleveland Minneapolis 22.6 115 5 6 257.5 1,668
Habit Restaurants 110 Los Angeles 13.1 60 5 San Francisco Sacramento San Diego Phoenix Salt Lake 15.5 51 3 4 257.5 1,013
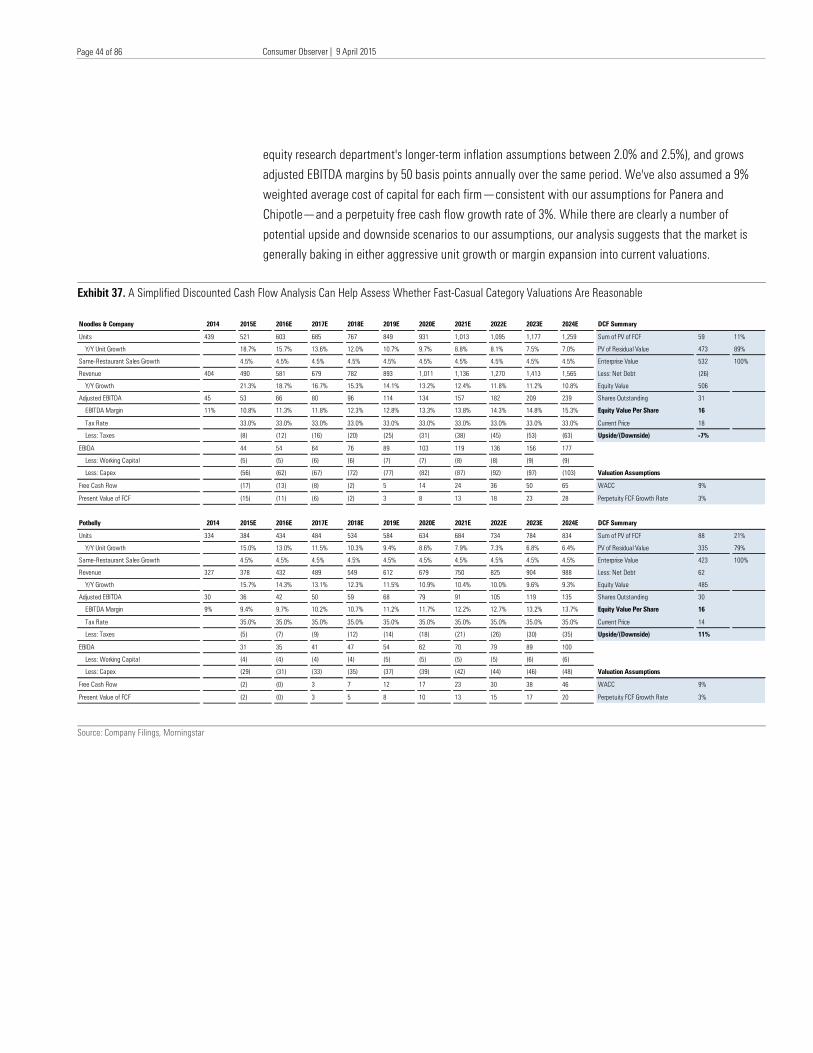
Consumer Observer | 9 April 2015
Healthcare Observer | 14 April 2015
Page 44 of 86
Page 44 of 86
equity research department's longer-term inflation assumptions between 2.0% and 2.5%), and grows
adjusted EBITDA margins by 50 basis points annually over the same period. We've also assumed a 9%
weighted average cost of capital for each firm—consistent with our assumptions for Panera and
Chipotle—and a perpetuity free cash flow growth rate of 3%. While there are clearly a number of
potential upside and downside scenarios to our assumptions, our analysis suggests that the market is
generally baking in either aggressive unit growth or margin expansion into current valuations.
Exhibit 37. A Simplified Discounted Cash Flow Analysis Can Help Assess Whether Fast-Casual Category Valuations Are Reasonable
Source: Company Filings, Morningstar
Noodles & Company 2014 2015E 2016E 2017E 2018E 2019E 2020E 2021E 2022E 2023E 2024E DCF Summary
Units 439 521 603 685 767 849 931 1,013 1,095 1,177 1,259 Sum of PV of FCF 59 11%
Y/Y Unit Growth 18.7% 15.7% 13.6% 12.0% 10.7% 9.7% 8.8% 8.1% 7.5% 7.0% PV of Residual Value 473 89%
Same-Restaurant Sales Growth 4.5% 4.5% 4.5% 4.5% 4.5% 4.5% 4.5% 4.5% 4.5% 4.5% Enterprise Value 532 100%
Revenue 404 490 581 679 782 893 1,011 1,136 1,270 1,413 1,565 Less: Net Debt (26)
Y/Y Growth 21.3% 18.7% 16.7% 15.3% 14.1% 13.2% 12.4% 11.8% 11.2% 10.8% Equity Value 506
Adjusted EBITDA 45 53 66 80 96 114 134 157 182 209 239 Shares Outstanding 31
EBITDA Margin 11% 10.8% 11.3% 11.8% 12.3% 12.8% 13.3% 13.8% 14.3% 14.8% 15.3% Equity Value Per Share 16
Tax Rate 33.0% 33.0% 33.0% 33.0% 33.0% 33.0% 33.0% 33.0% 33.0% 33.0% Current Price 18
Less: Taxes (8) (12) (16) (20) (25) (31) (38) (45) (53) (63) Upside/(Downside) -7%
EBIDA 44 54 64 76 89 103 119 136 156 177
Less: Working Capital (5) (5) (6) (6) (7) (7) (8) (8) (9) (9)
Less: Capex (56) (62) (67) (72) (77) (82) (87) (92) (97) (103) Valuation Assumptions
Free Cash Flow (17) (13) (8) (2) 5 14 24 36 50 65 WACC 9%
Present Value of FCF (15) (11) (6) (2) 3 8 13 18 23 28 Perpetuity FCF Growth Rate 3%
Potbelly 2014 2015E 2016E 2017E 2018E 2019E 2020E 2021E 2022E 2023E 2024E DCF Summary
Units 334 384 434 484 534 584 634 684 734 784 834 Sum of PV of FCF 88 21%
Y/Y Unit Growth 15.0% 13.0% 11.5% 10.3% 9.4% 8.6% 7.9% 7.3% 6.8% 6.4% PV of Residual Value 335 79%
Same-Restaurant Sales Growth 4.5% 4.5% 4.5% 4.5% 4.5% 4.5% 4.5% 4.5% 4.5% 4.5% Enterprise Value 423 100%
Revenue 327 378 432 489 549 612 679 750 825 904 988 Less: Net Debt 62
Y/Y Growth 15.7% 14.3% 13.1% 12.3% 11.5% 10.9% 10.4% 10.0% 9.6% 9.3% Equity Value 485
Adjusted EBITDA 30 36 42 50 59 68 79 91 105 119 135 Shares Outstanding 30
EBITDA Margin 9% 9.4% 9.7% 10.2% 10.7% 11.2% 11.7% 12.2% 12.7% 13.2% 13.7% Equity Value Per Share 16
Tax Rate 35.0% 35.0% 35.0% 35.0% 35.0% 35.0% 35.0% 35.0% 35.0% 35.0% Current Price 14
Less: Taxes (5) (7) (9) (12) (14) (18) (21) (26) (30) (35) Upside/(Downside) 11%
EBIDA 31 35 41 47 54 62 70 79 89 100
Less: Working Capital (4) (4) (4) (4) (5) (5) (5) (5) (6) (6)
Less: Capex (29) (31) (33) (35) (37) (39) (42) (44) (46) (48) Valuation Assumptions
Free Cash Flow (2) (0) 3 7 12 17 23 30 38 46 WACC 9%
Present Value of FCF (2) (0) 3 5 8 10 13 15 17 20 Perpetuity FCF Growth Rate 3%
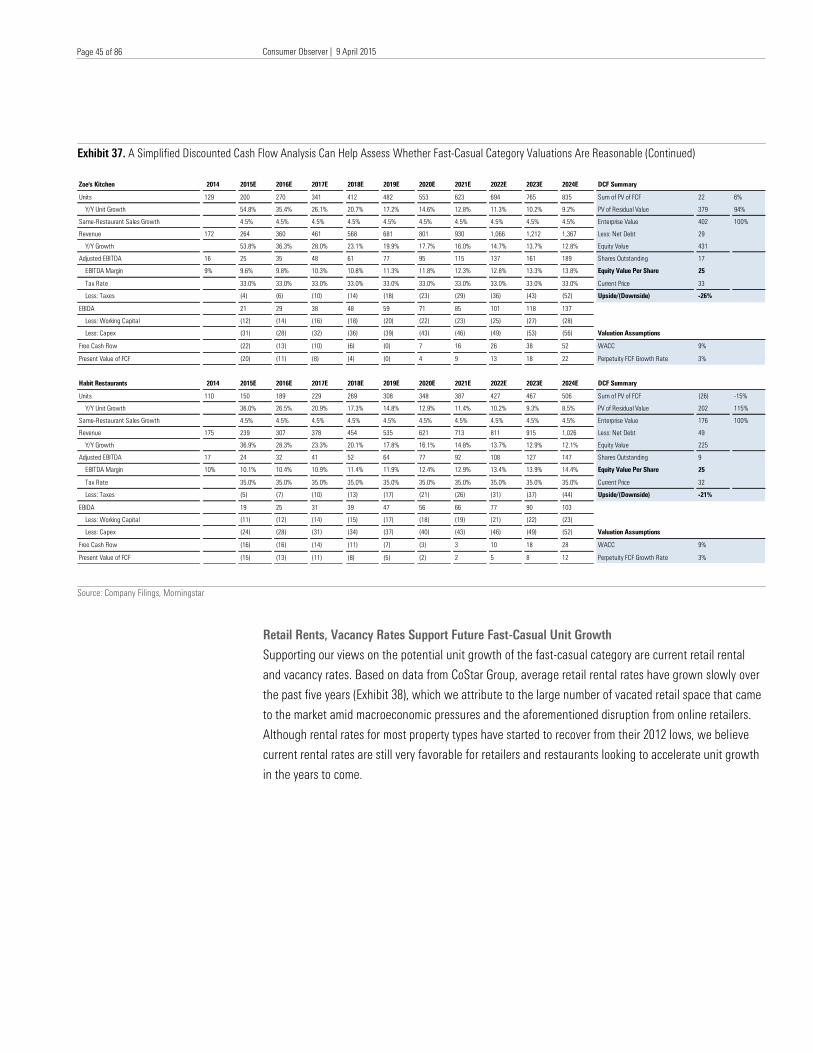
Consumer Observer | 9 April 2015
Healthcare Observer | 14 April 2015
Page 45 of 86
Page 45 of 86
Exhibit 37. A Simplified Discounted Cash Flow Analysis Can Help Assess Whether Fast-Casual Category Valuations Are Reasonable (Continued)
Source: Company Filings, Morningstar
Retail Rents, Vacancy Rates Support Future Fast-Casual Unit Growth
Supporting our views on the potential unit growth of the fast-casual category are current retail rental
and vacancy rates. Based on data from CoStar Group, average retail rental rates have grown slowly over
the past five years (Exhibit 38), which we attribute to the large number of vacated retail space that came
to the market amid macroeconomic pressures and the aforementioned disruption from online retailers.
Although rental rates for most property types have started to recover from their 2012 lows, we believe
current rental rates are still very favorable for retailers and restaurants looking to accelerate unit growth
in the years to come.
Zoe's Kitchen 2014 2015E 2016E 2017E 2018E 2019E 2020E 2021E 2022E 2023E 2024E DCF Summary
Units 129 200 270 341 412 482 553 623 694 765 835 Sum of PV of FCF 22 6%
Y/Y Unit Growth 54.8% 35.4% 26.1% 20.7% 17.2% 14.6% 12.8% 11.3% 10.2% 9.2% PV of Residual Value 379 94%
Same-Restaurant Sales Growth 4.5% 4.5% 4.5% 4.5% 4.5% 4.5% 4.5% 4.5% 4.5% 4.5% Enterprise Value 402 100%
Revenue 172 264 360 461 568 681 801 930 1,066 1,212 1,367 Less: Net Debt 29
Y/Y Growth 53.8% 36.3% 28.0% 23.1% 19.9% 17.7% 16.0% 14.7% 13.7% 12.8% Equity Value 431
Adjusted EBITDA 16 25 35 48 61 77 95 115 137 161 189 Shares Outstanding 17
EBITDA Margin 9% 9.6% 9.8% 10.3% 10.8% 11.3% 11.8% 12.3% 12.8% 13.3% 13.8% Equity Value Per Share 25
Tax Rate 33.0% 33.0% 33.0% 33.0% 33.0% 33.0% 33.0% 33.0% 33.0% 33.0% Current Price 33
Less: Taxes (4) (6) (10) (14) (18) (23) (29) (36) (43) (52) Upside/(Downside) -26%
EBIDA 21 29 38 48 59 71 85 101 118 137
Less: Working Capital (12) (14) (16) (18) (20) (22) (23) (25) (27) (28)
Less: Capex (31) (28) (32) (36) (39) (43) (46) (49) (53) (56) Valuation Assumptions
Free Cash Flow (22) (13) (10) (6) (0) 7 16 26 38 52 WACC 9%
Present Value of FCF (20) (11) (8) (4) (0) 4 9 13 18 22 Perpetuity FCF Growth Rate 3%
Habit Restaurants 2014 2015E 2016E 2017E 2018E 2019E 2020E 2021E 2022E 2023E 2024E DCF Summary
Units 110 150 189 229 269 308 348 387 427 467 506 Sum of PV of FCF (26) -15%
Y/Y Unit Growth 36.0% 26.5% 20.9% 17.3% 14.8% 12.9% 11.4% 10.2% 9.3% 8.5% PV of Residual Value 202 115%
Same-Restaurant Sales Growth 4.5% 4.5% 4.5% 4.5% 4.5% 4.5% 4.5% 4.5% 4.5% 4.5% Enterprise Value 176 100%
Revenue 175 239 307 378 454 535 621 713 811 915 1,026 Less: Net Debt 49
Y/Y Growth 36.9% 28.3% 23.3% 20.1% 17.8% 16.1% 14.8% 13.7% 12.9% 12.1% Equity Value 225
Adjusted EBITDA 17 24 32 41 52 64 77 92 108 127 147 Shares Outstanding 9
EBITDA Margin 10% 10.1% 10.4% 10.9% 11.4% 11.9% 12.4% 12.9% 13.4% 13.9% 14.4% Equity Value Per Share 25
Tax Rate 35.0% 35.0% 35.0% 35.0% 35.0% 35.0% 35.0% 35.0% 35.0% 35.0% Current Price 32
Less: Taxes (5) (7) (10) (13) (17) (21) (26) (31) (37) (44) Upside/(Downside) -21%
EBIDA 19 25 31 39 47 56 66 77 90 103
Less: Working Capital (11) (12) (14) (15) (17) (18) (19) (21) (22) (23)
Less: Capex (24) (28) (31) (34) (37) (40) (43) (46) (49) (52) Valuation Assumptions
Free Cash Flow (16) (16) (14) (11) (7) (3) 3 10 18 28 WACC 9%
Present Value of FCF (15) (13) (11) (8) (5) (2) 2 5 8 12 Perpetuity FCF Growth Rate 3%
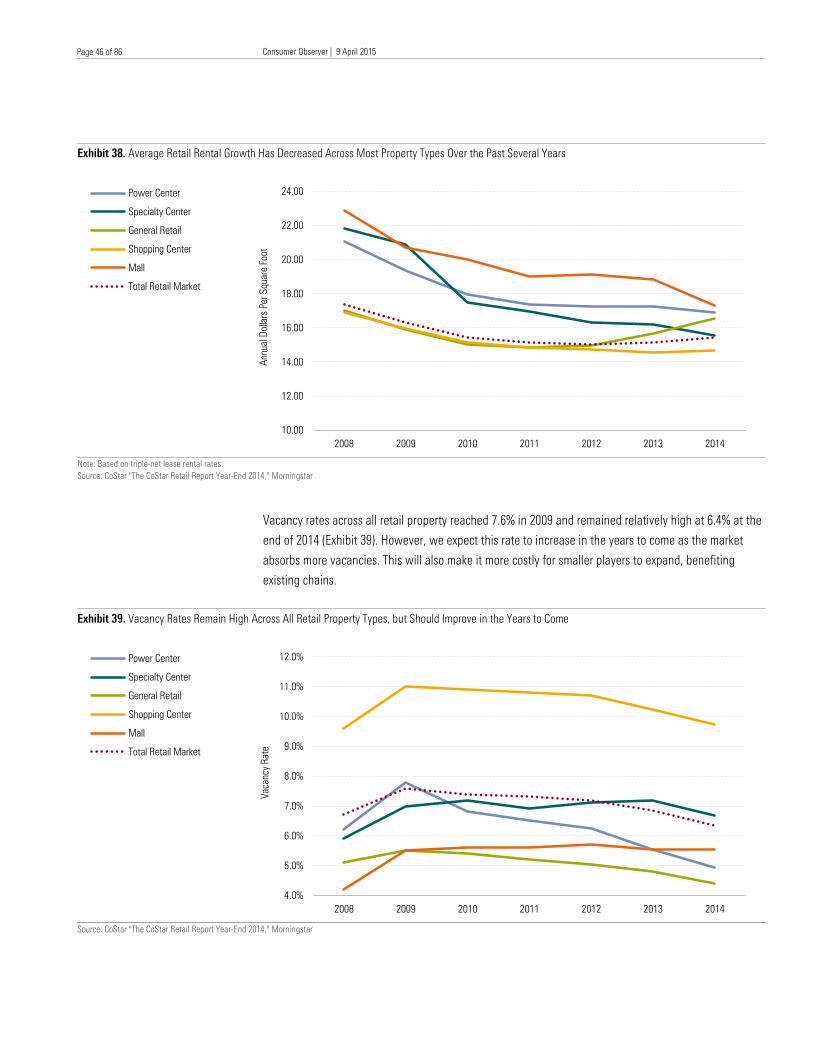
Consumer Observer | 9 April 2015
Healthcare Observer | 14 April 2015
Page 46 of 86
Page 46 of 86
Exhibit 38. Average Retail Rental Growth Has Decreased Across Most Property Types Over the Past Several Years
Note: Based on triple-net lease rental rates
Source: CoStar "The CoStar Retail Report Year-End 2014," Morningstar
Vacancy rates across all retail property reached 7.6% in 2009 and remained relatively high at 6.4% at the
end of 2014 (Exhibit 39). However, we expect this rate to increase in the years to come as the market
absorbs more vacancies. This will also make it more costly for smaller players to expand, benefiting
existing chains.
Exhibit 39. Vacancy Rates Remain High Across All Retail Property Types, but Should Improve in the Years to Come
Source: CoStar "The CoStar Retail Report Year-End 2014," Morningstar
10.00
12.00
14.00
16.00
18.00
20.00
22.00
24.00
2008 2009 2010 2011 2012 2013 2014
Annual D
ollars P
er S
quare F
oot
Power Center
Specialty Center
General Retail
Shopping Center
Mall
Total Retail Market
4.0%
5.0%
6.0%
7.0%
8.0%
9.0%
10.0%
11.0%
12.0%
2008 2009 2010 2011 2012 2013 2014
Vacancy R
ate
Power Center
Specialty Center
General Retail
Shopping Center
Mall
Total Retail Market
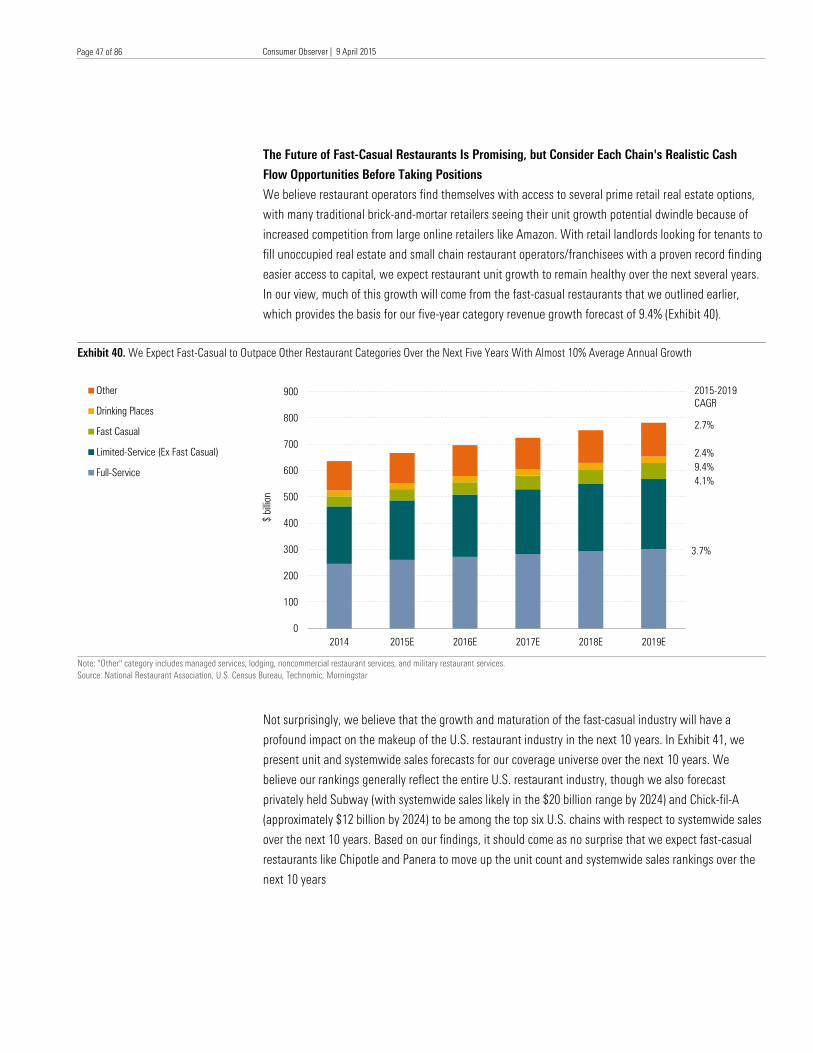
Consumer Observer | 9 April 2015
Healthcare Observer | 14 April 2015
Page 47 of 86
Page 47 of 86
The Future of Fast-Casual Restaurants Is Promising, but Consider Each Chain's Realistic Cash
Flow Opportunities Before Taking Positions
We believe restaurant operators find themselves with access to several prime retail real estate options,
with many traditional brick-and-mortar retailers seeing their unit growth potential dwindle because of
increased competition from large online retailers like Amazon. With retail landlords looking for tenants to
fill unoccupied real estate and small chain restaurant operators/franchisees with a proven record finding
easier access to capital, we expect restaurant unit growth to remain healthy over the next several years.
In our view, much of this growth will come from the fast-casual restaurants that we outlined earlier,
which provides the basis for our five-year category revenue growth forecast of 9.4% (Exhibit 40).
Exhibit 40. We Expect Fast-Casual to Outpace Other Restaurant Categories Over the Next Five Years With Almost 10% Average Annual Growth
Note: "Other" category includes managed services, lodging, noncommercial restaurant services, and military restaurant services.
Source: National Restaurant Association, U.S. Census Bureau, Technomic, Morningstar
Not surprisingly, we believe that the growth and maturation of the fast-casual industry will have a
profound impact on the makeup of the U.S. restaurant industry in the next 10 years. In Exhibit 41, we
present unit and systemwide sales forecasts for our coverage universe over the next 10 years. We
believe our rankings generally reflect the entire U.S. restaurant industry, though we also forecast
privately held Subway (with systemwide sales likely in the $20 billion range by 2024) and Chick-fil-A
(approximately $12 billion by 2024) to be among the top six U.S. chains with respect to systemwide sales
over the next 10 years. Based on our findings, it should come as no surprise that we expect fast-casual
restaurants like Chipotle and Panera to move up the unit count and systemwide sales rankings over the
next 10 years
0
100
200
300
400
500
600
700
800
900
2014 2015E 2016E 2017E 2018E 2019E
$ b
illion
Other
Drinking Places
Fast Casual
Limited-Service (Ex Fast Casual)
Full-Service
2015-2019
CAGR
2.7%
2.4%
9.4%
4.1%
3.7%
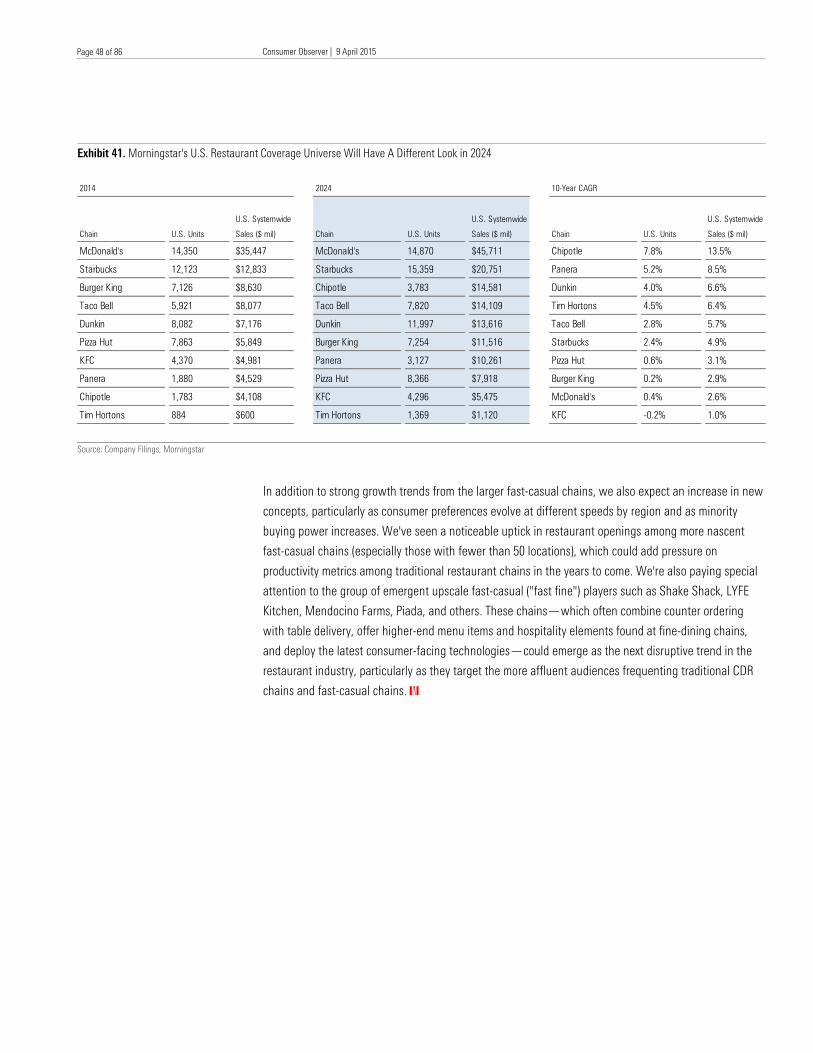
Consumer Observer | 9 April 2015
Healthcare Observer | 14 April 2015
Page 48 of 86
Page 48 of 86
Exhibit 41. Morningstar's U.S. Restaurant Coverage Universe Will Have A Different Look in 2024
Source: Company Filings, Morningstar
In addition to strong growth trends from the larger fast-casual chains, we also expect an increase in new
concepts, particularly as consumer preferences evolve at different speeds by region and as minority
buying power increases. We've seen a noticeable uptick in restaurant openings among more nascent
fast-casual chains (especially those with fewer than 50 locations), which could add pressure on
productivity metrics among traditional restaurant chains in the years to come. We're also paying special
attention to the group of emergent upscale fast-casual ("fast fine") players such as Shake Shack, LYFE
Kitchen, Mendocino Farms, Piada, and others. These chains—which often combine counter ordering
with table delivery, offer higher-end menu items and hospitality elements found at fine-dining chains,
and deploy the latest consumer-facing technologies—could emerge as the next disruptive trend in the
restaurant industry, particularly as they target the more affluent audiences frequenting traditional CDR
chains and fast-casual chains. K
2014 2024 10-Year CAGR
Chain U.S. Units
U.S. Systemwide
Sales ($ mil) Chain U.S. Units
U.S. Systemwide
Sales ($ mil) Chain U.S. Units
U.S. Systemwide
Sales ($ mil)
McDonald's 14,350 $35,447 McDonald's 14,870 $45,711 Chipotle 7.8% 13.5%
Starbucks 12,123 $12,833 Starbucks 15,359 $20,751 Panera 5.2% 8.5%
Burger King 7,126 $8,630 Chipotle 3,783 $14,581 Dunkin 4.0% 6.6%
Taco Bell 5,921 $8,077 Taco Bell 7,820 $14,109 Tim Hortons 4.5% 6.4%
Dunkin 8,082 $7,176 Dunkin 11,997 $13,616 Taco Bell 2.8% 5.7%
Pizza Hut 7,863 $5,849 Burger King 7,254 $11,516 Starbucks 2.4% 4.9%
KFC 4,370 $4,981 Panera 3,127 $10,261 Pizza Hut 0.6% 3.1%
Panera 1,880 $4,529 Pizza Hut 8,366 $7,918 Burger King 0.2% 2.9%
Chipotle 1,783 $4,108 KFC 4,296 $5,475 McDonald's 0.4% 2.6%
Tim Hortons 884 $600 Tim Hortons 1,369 $1,120 KFC -0.2% 1.0%
Consumer Observer | 9 April 2015
Healthcare Observer | 14 April 2015
Page 49 of 86
Page 49 of 86
Executive Summary
As we've illustrated throughout this report, the popularity of the fast-casual category has had a ripple
effect across the entire restaurant industry. We believe the impact has been most pronounced at the
largest companies in the quick-service and casual-dining restaurant categories—McDonald's and
Darden, which was the largest casual-dining company before its spin-off of Red Lobster—which we
attribute to not only the increased competitive threats and changes in consumer preferences, but also
slow reaction speeds to these changes and other self-inflicted wounds.
We believe there are a number of operational corrective measures that traditional restaurants can
deploy in response to increased fast-casual competition and changes in consumer preferences, many of
which are not currently being reflected in current stock prices. These include relatively straightforward
changes, including streamlining menus and eliminating items (which would help improve restaurant
productivity and increase throughput), greater customization capabilities (which can have a positive
impact on average transaction size), daypart expansion (greater restaurant utilization), and better
adoption of technology. Taking a page out of 3G Capital's turnaround efforts with Burger King, we also
believe that many of the large publicly traded restaurant chains will look to increase the number of
franchised-owned locations in their systems, putting additional restaurants in the hands of seasoned
operators while reducing their own capital responsibilities. We believe current industry conditions are
conducive to refranchising, with chains going this route often rewarded with higher market valuations.
We also think the shift in consumer preferences, increased fast-casual competition, and slow reaction
times by traditional players in the restaurant industry explain in part the increased involvement of
activist shareholders over the past several months, most notably Starboard Value's ousting of Darden's
board in October 2014. While management changes, more aggressive general and administrative cost
cutting (particularly at the corporate level), and increased franchising/refranchising have been
consistent areas of focus among activist investors, there have also been more extreme proposals
pushing restaurant companies to explore real estate transactions, spin-offs of certain businesses, and
other more significant structural changes.
Over the next several pages, we highlight some of the ways that companies are adapting to the new
reality in the restaurant industry. More important, we'll identify which strategic initiatives have the
highest probability of success and which have not been accurately priced into current market valuations.
R. J. Hottovy, CFA
Assessing Traditional Restaurants' Countermeasures to Fast-Casual Competitive Pressures
Consumer Observer | 9 April 2015
Healthcare Observer | 14 April 2015
Page 50 of 86
Page 50 of 86
Key Takeaways
× We believe consumers' willingness to pay premium prices has been at the heart of the recent QSR
industry movement toward fewer menu items and greater customization options. However, we believe it
will take time for QSR players to realize the benefits of these menu changes, where rationalizing menu
items helps improve speed of service and customer experience scores improve over the next year or so,
followed by increased awareness and adoption of customization options.
× For many traditional restaurant operators, we believe that expanding into other dayparts, greater
adoption of technology to increase throughput via mobile ordering and payments, and offering more
delivery/catering alternatives have the potential to improve store productivity metrics through both more
guests and higher average checks. We view each of the Best Ideas that we highlighted at the beginning
of this report—Panera, Starbucks, and Yum Brands—as well-positioned to achieve better utilization
trends out of its existing restaurants in the years to come.
× While refranchising isn't the sole factor driving multiple expansion in the industry, we believe it's
noteworthy that the companies that have pursued refranchising more aggressively have generally
experienced greater multiple expansion over the past five years. We believe McDonald's will likely
explore refranchising options in the near future, as recently appointed CEO Steve Easterbrook has said
he is committed to exploring "all options" to improve shareholder value. However, we believe refinancing
efforts at Panera and Yum could also provide positive catalysts over the next several years.
× We believe the market's appetite for potential real estate transactions have increased over the past year
given the low interest rates environment and REIT spin-off announcements from other retailer and
restaurant chains. With $39 billion in land and building assets on its balance sheet as of December 2014
and $6.1 billion in rents collected from franchisees last year, McDonald's remains a popular target for
potential real estate transactions among activist investors and hedge funds. The possible tax savings
would ultimately depend on how much real estate the company was willing to commit to a property
company subsidiary (PropCo), but because REITs must pay out at least 90% of taxable earnings to
shareholders as dividends and don’t pay federal income taxes on income distributed to shareholders, we
believe McDonald's could unlock shareholder value by creating an internal REIT.
× We generally have mixed views on separating multibrand restaurant companies into separate publicly
or privately held entities. On one hand, we appreciate that different chains have different target
audiences, growth trajectories, and capital needs, which can put considerable strain on management
teams. On the other hand, separating brands also runs the risk of trading short-term gains for diminished
scale advantages—particularly with respect to overhead, purchasing, and advertising—which can
destroy value. The idea of separating Yum's China division has some merit, as we've long thought that
Yum was much more than a China growth story and believe that a separation would allow investors to
tailor their exposure to China and Yum's other emerging markets. Additionally, Yum China is a mostly
self-contained supply chain, distribution, site selection, and advertising ecosystem, we believe a
separation would be relatively seamless from an operating perspective and would not sacrifice
meaningful scale advantages.
Consumer Observer | 9 April 2015
Healthcare Observer | 14 April 2015
Page 51 of 86
Page 51 of 86
What Does the Future Hold for Traditional Restaurant Chains?
The first two sections of this report provided an overview of how consumer preferences are changing,
how fast-casual restaurants are capitalizing on these changes, and our outlook for the future of the fast-
casual industry. To summarize, we believe fast-casual concepts will continue to adapt to consumers'
evolving menu and restaurant experience preferences, positioning them for continued top-line growth
and margin expansion while also driving valuations higher (to unreasonable levels in many cases). That
said, we believe there are still ways for traditional restaurant chains to adapt and even thrive in the new
reality within the restaurant industry. Over the next several pages, we highlight some of the ways that
restaurant companies are adapting to changes within the restaurant industry, which countermeasures
have the greatest probability of success, and which companies are best-positioned to capitalize. We also
call out examples where these strategic initiatives have been overlooked by the market, which could
offer investment opportunities.
Using Simplified Menus and Customization to Regain Pricing Power
As we've highlighted throughout this report, we believe consumer tastes will continue to evolve over the
next several years, resulting in new approaches to menu composition (a wider variety of flavors, better-
for-you products, and locally sourced food), restaurant experience (more flexible menu offerings and
faster throughput), and technology (mobile-based ordering, payment, and loyalty programs, free in-
restaurant wireless). Some restaurant companies have been quick to adapt to these changes, but many
others have struggled to keep pace, affecting both restaurant guest counts and average transaction
sizes. One of the key takeaways from the first section of this report is that, as expectations about menus
and restaurant experience have changed, consumers have shown not only a willingness to frequent a
restaurant with a more customizable menu but also to pay premium prices. We believe this has been at
the heart of the recent QSR industry movement toward fewer but more customizable menu items.
Perhaps no restaurant company has been more affected by evolving consumer expectations than
McDonald's. The company has found itself in a difficult position because of changing consumer
expectations. At an investor event in December 2014, McDonald's USA President Mike Andres identified
three primary challenges the business faces today. One, management believes that the pricing gap
between its value, core, and premium products has become too wide, with the dollar menu absorbing
"too much inflation" and resulting in consumer trade-down that has limited the impact of its more
premium products. Andres also acknowledged that the company has been slow to react to a rapidly
evolving restaurant industry, marked by changing tastes at a local and regional level, a more
pronounced consumer shift toward healthier foods, and the fast-casual category reaching critical mass
(which we believe has captured share of McDonald's previous middle- to upper-middle-income
consumers and left the company more dependent on lower-income consumers). Lastly, management has
also recognized that it had added too much complexity to the menu, with 100 items added over the past
10 years.
We don't think McDonald's has been the only QSR chain to face these pressures, although lagging
same-restaurant sales trends suggest that many peers have been quicker to react. Nevertheless, we
believe that management has outlined a number of sensible corrective measures to combat these
challenges, highlighted by reducing the number of items on the menu; building a customer "Experience
Consumer Observer | 9 April 2015
Healthcare Observer | 14 April 2015
Page 52 of 86
Page 52 of 86
of the Future" flexible enough to accommodate the demographic, competition, taste, and franchisee
permutations across its operating regions; and making more menu and marketing decisions at the local
and regional levels. Among the most immediate changes consumers will see in restaurants is the
removal of eight items from the menu, taking Extra Value Menus from 16 to 11 items, and less emphasis
on variations of core products. We view this decision as prudent—especially on the heels of 3G Capital's
successful approach to Burger King's menu with "fewer but more impactful products" over the past
several years—and we would not be surprised to see even greater product rationalization efforts under
newly appointed CEO Steve Easterbrook. However, we also acknowledge that the composition of
McDonald's menu will require a careful balancing act between rationalization and incorporating local
preferences, something that could take additional time and resources (capital, labor, data analytics) to
fine tune.
As McDonald's moves further into 2015, we expect its Experience of the Future initiative will garner
greater investor interest, focused on increased customization/personalization options for consumers,
increased ordering flexibility (including kiosks and eventually mobile ordering), and a "dual-point"
restaurant configuration that separates areas for ordering and pickup. Among the pillars of the
Experience of the Future initiatives, perhaps none has generated more attention than McDonald's
"Create-Your-Taste" (CYT) personalized sandwich platform that has been rolled out in a handful of
locations in the U.S. (including Laguna Beach and San Diego in California and Downers Grove, Illinois)
and Australia. This initiative, which gives consumers the ability to customize a burger (or chicken
sandwich in the California markets) from a predetermined list of buns, cheeses, toppings, and sauces
through an ordering kiosk (Exhibit 42), is expected to be implemented at between 1,000 and 2,000
locations across three markets in the U.S. in 2015 and 800 locations in Australia in 2015. There is a lot to
like about the CYT customization efforts, with early tests showing between 2 and 3 times the visit
frequency from existing customers who have experimented with the platform, and it has helped improve
metrics during the evening daypart, suggesting that the McDonald's brand intangible asset moat source
can benefit from this program. Additionally, this platform has natural ties to the company's digital efforts
(via ordering kiosks and eventual mobile ordering apps), which should eventually help the company
better facilitate local preferences by tailoring the customization selections to regional tastes.
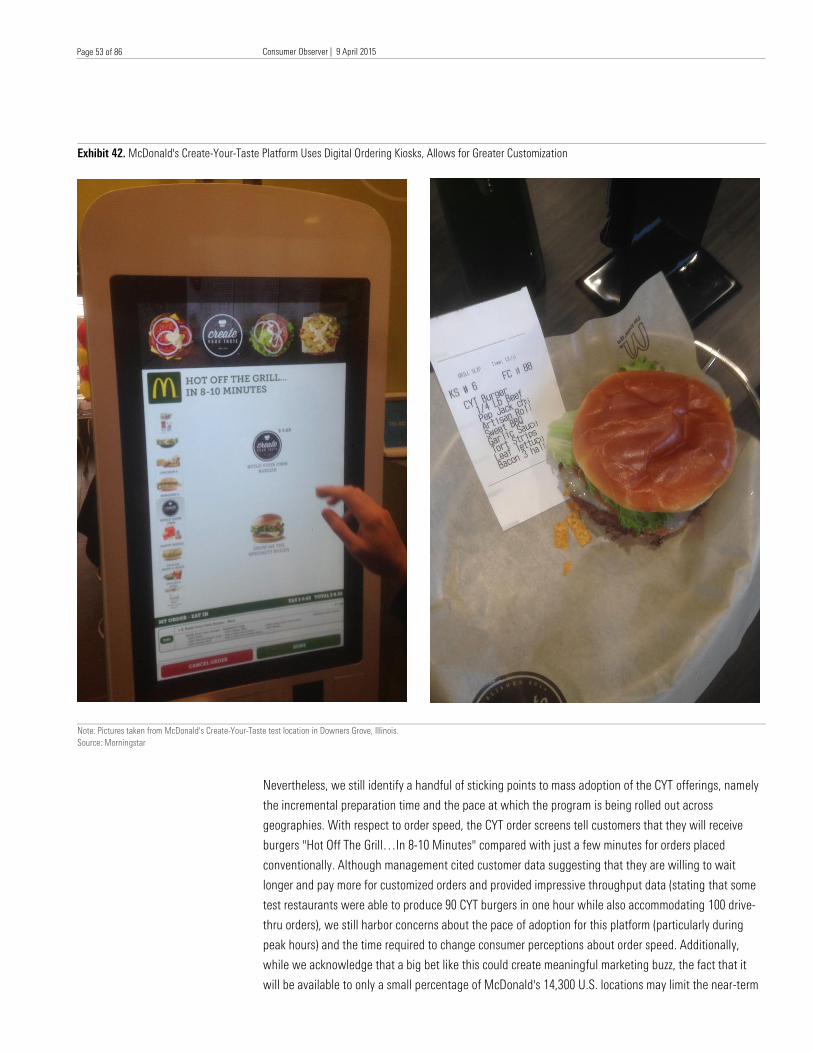
Consumer Observer | 9 April 2015
Healthcare Observer | 14 April 2015
Page 53 of 86
Page 53 of 86
Exhibit 42. McDonald's Create-Your-Taste Platform Uses Digital Ordering Kiosks, Allows for Greater Customization
Note: Pictures taken from McDonald's Create-Your-Taste test location in Downers Grove, Illinois.
Source: Morningstar
Nevertheless, we still identify a handful of sticking points to mass adoption of the CYT offerings, namely
the incremental preparation time and the pace at which the program is being rolled out across
geographies. With respect to order speed, the CYT order screens tell customers that they will receive
burgers "Hot Off The Grill…In 8-10 Minutes" compared with just a few minutes for orders placed
conventionally. Although management cited customer data suggesting that they are willing to wait
longer and pay more for customized orders and provided impressive throughput data (stating that some
test restaurants were able to produce 90 CYT burgers in one hour while also accommodating 100 drive-
thru orders), we still harbor concerns about the pace of adoption for this platform (particularly during
peak hours) and the time required to change consumer perceptions about order speed. Additionally,
while we acknowledge that a big bet like this could create meaningful marketing buzz, the fact that it
will be available to only a small percentage of McDonald's 14,300 U.S. locations may limit the near-term
Consumer Observer | 9 April 2015
Healthcare Observer | 14 April 2015
Page 54 of 86
Page 54 of 86
impact of these efforts, especially when factoring the continued growth of the fast-casual category and
menu innovations from traditional quick-service restaurants. Instead, we see McDonald's menu
improvements over the next few years as a multistage process where menu item rationalization efforts
help improve speed of service and customer experience scores as 2015 progresses (and helping to push
same-restaurant sales to flat to slightly positive territory in the back half of the year), with increased
awareness and consumer trial of CYT offerings becoming more prevalent in 2016 and helping stabilize
same-restaurant sales in the low-single-digit range.
At December 2014 investor presentations, Yum Brands also noted that consumers "are clearly looking for
customization and variety," but that its three core concepts were already well-positioned for
customization because products aren't made until they are ordered. In fact, management noted that 60%
of Taco Bell orders today are already customized, and expects this number to increase as mobile
ordering becomes more mainstream. According to management, mobile ordering will allow restaurants
to highlight other ingredient options, many of which will result in higher average checks.
Admittedly, restaurant operators must exercise caution when implementing menu customization, since it
requires new workflow processes, kitchen configurations (and often new equipment), and can slow
throughput. However, if executed properly, we believe consumers' willingness to pay premium prices for
customized products and the potential to drive increased guest traffic counts make this a worthwhile
endeavor for many traditional QSR chains.
Improving Restaurant Utilization Metrics Through Daypart Expansion, Mobile Ordering/Payments,
and Delivery/Catering
Faced with the increasing competitive threat of fast-casual rivals, it's not a surprise that operators have
also placed a greater emphasis on getting more out of their restaurant assets in recent years, including
expansion into other dayparts, using technology to increase throughput via mobile ordering and
payments, and exploring greater delivery/catering alternatives. For many traditional restaurant
operators, we believe these initiatives have the potential to improve store productivity through both
increased guest counts and higher average checks. Over the next few pages, we discuss a number of
the upcoming restaurant asset utilization trends that we expect across the industry.
× Daypart expansion. Almost every recent restaurant industry investor day presentation we've attended
has highlighted daypart expansion as way to boost comparable-restaurant sales. Most restaurants plan
to increase hours of operation during 2015, with QSR chains increasingly moving to 24-hour operations
and CDR chains emphasizing new lunch menu offerings.
Broadly speaking, we view daypart expansion as worthwhile, since average unit volumes improve and
certain dayparts (breakfast and snack) lend themselves to higher-margin products such as beverages.
Looking at the current daypart mix across the industry (Exhibit 43), it's no surprise that many QSRs have
emphasized breakfast as their top daypart priority (we estimate that breakfast makes up less than 20%
of system sales for most QSR chains compared with 30% for breakfast daypart leader McDonald's) with
some added emphasis on the snacking daypart, while specialty coffee companies look to expand more
into the lunch, snack, and evening dayparts.
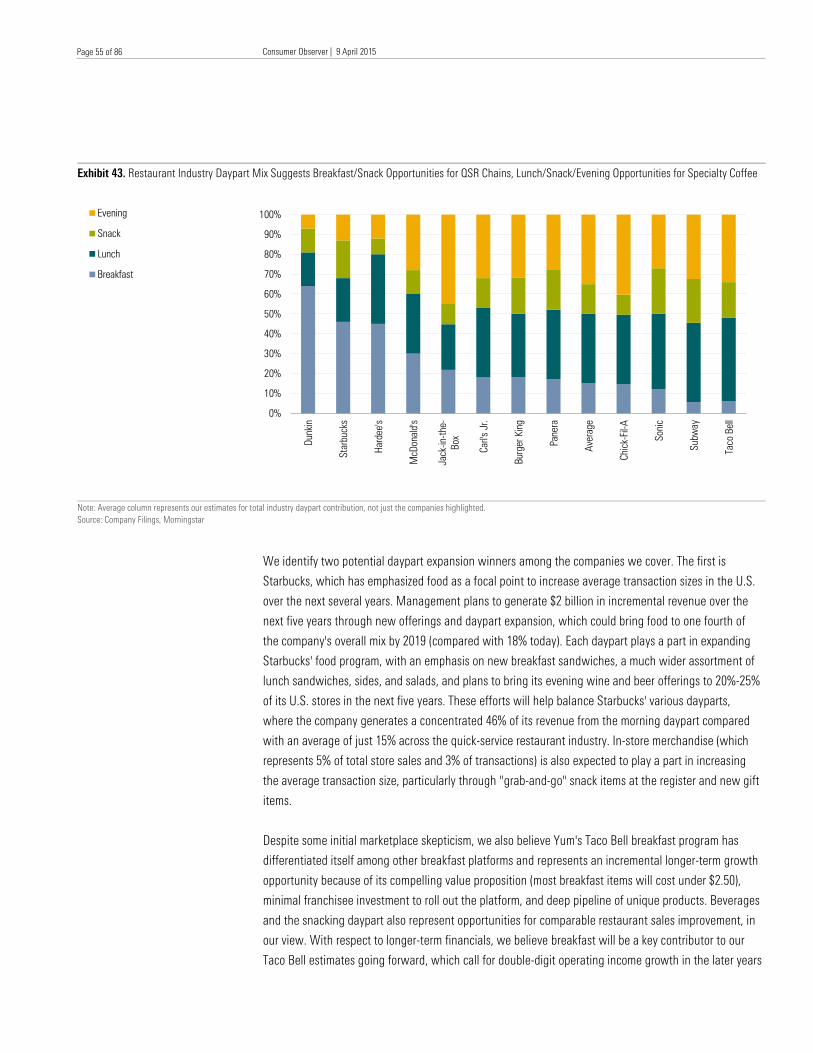
Consumer Observer | 9 April 2015
Healthcare Observer | 14 April 2015
Page 55 of 86
Page 55 of 86
Exhibit 43. Restaurant Industry Daypart Mix Suggests Breakfast/Snack Opportunities for QSR Chains, Lunch/Snack/Evening Opportunities for Specialty Coffee
Note: Average column represents our estimates for total industry daypart contribution, not just the companies highlighted.
Source: Company Filings, Morningstar
We identify two potential daypart expansion winners among the companies we cover. The first is
Starbucks, which has emphasized food as a focal point to increase average transaction sizes in the U.S.
over the next several years. Management plans to generate $2 billion in incremental revenue over the
next five years through new offerings and daypart expansion, which could bring food to one fourth of
the company's overall mix by 2019 (compared with 18% today). Each daypart plays a part in expanding
Starbucks' food program, with an emphasis on new breakfast sandwiches, a much wider assortment of
lunch sandwiches, sides, and salads, and plans to bring its evening wine and beer offerings to 20%-25%
of its U.S. stores in the next five years. These efforts will help balance Starbucks' various dayparts,
where the company generates a concentrated 46% of its revenue from the morning daypart compared
with an average of just 15% across the quick-service restaurant industry. In-store merchandise (which
represents 5% of total store sales and 3% of transactions) is also expected to play a part in increasing
the average transaction size, particularly through "grab-and-go" snack items at the register and new gift
items.
Despite some initial marketplace skepticism, we also believe Yum's Taco Bell breakfast program has
differentiated itself among other breakfast platforms and represents an incremental longer-term growth
opportunity because of its compelling value proposition (most breakfast items will cost under $2.50),
minimal franchisee investment to roll out the platform, and deep pipeline of unique products. Beverages
and the snacking daypart also represent opportunities for comparable restaurant sales improvement, in
our view. With respect to longer-term financials, we believe breakfast will be a key contributor to our
Taco Bell estimates going forward, which call for double-digit operating income growth in the later years
0%
10%
20%
30%
40%
50%
60%
70%
80%
90%
100%
Dunkin
Starbucks
Hardee's
McD
onald
's
Jack-in
-the-
Box
Carl's J
r.
Burger K
ing
Panera
Average
Chic
k-Fil-A
Sonic
Subw
ay
Taco B
ell
Evening
Snack
Lunch
Breakfast
Consumer Observer | 9 April 2015
Healthcare Observer | 14 April 2015
Page 56 of 86
Page 56 of 86
of our explicit forecast period due to daypart and international expansion efforts, exceeding
management's longer-term outlook of 6% annual operating profit growth.
× Mobile ordering and payments. With technology also reshaping consumer expectations across the
restaurant industry, we believe mobile ordering and payment platforms could be game changers,
particularly for high-frequency (QSR and fast-casual) concepts. While mainstream adoption is still likely a
year or two off, we expect many players in the restaurant industry to follow Starbucks' leadership in this
field and introduce mobile ordering and payment platforms in the years to come. Starbucks' program,
which was introduced in Portland, Oregon, in late 2014 and is expected to be launched nationwide
during 2015, allows customers to place customized beverage and food orders from mobile devices for
store pickup. Starbucks Chief Technology Officer Adam Brotman outlined four benefits of the platform: 1)
more My Starbucks Reward customers, 2) increased targeted marketing efforts leading to higher food
attachment rates and average ticket sizes, 3) higher purchasing frequency from existing customers, and
4) greater store throughput by effectively eliminating point-of-sale pain points, and we believe many of
these benefits will also apply to other restaurant operators. Although it may take some time for
consumers to adopt this program, we believe Starbucks' Mobile Order & Pay initiative will serve as a
blueprint for the rest of the industry in rolling out a mobile ordering and payment platform without
disrupting in-store operations or requiring material labor or equipment investments.
Panera has also spent a good amount of time discussing technology as a tool to enhance the customer
experience. This includes the rollout of Rapid Pick Up (RPU) mobile ordering (eat-in and to-go) and
payment capabilities across the entire system in 2014-15, as well as software upgrades to better
manage cafe throughput and assist with inventory replenishment functions. Technology also applies to
Panera's marketing plans, as the company plans to devote more resources to digital and national
television mediums in 2014 (which will comprise 82% of Panera's $80 million-plus advertising budget in
2014 compared with 56% of the $60 million budget in 2013). We also believe that increasing use of
mobile technology will have natural marketing synergies with Panera's current loyalty program, which
encompasses 16 million members and accounts for 50% of transactions (putting it among industry
leaders with respect to loyalty program usage, according to our estimates). While certainly there were
other drivers at play, we believe these technology initiatives helped to contribute to transaction growth
in the latter part of 2014 and should help drive 2015 comps to the high end of management's forecast
range (2.0%-3.5%). Management also noted that roughly 8% of transactions in the fourth quarter of
2014 were digital, putting the company ahead of most restaurant chains. In our view, these technology
enhancements will help to reinforce the company's brand intangible asset, and could eventually help the
company develop an economic moat.
Leveraging the success of Pizza Hut's online ordering platform—online and mobile orders represent
more than 40% of Pizza Hut U.S. orders—we believe Yum could also emerge as one of the early winners
with respect to technology enhancements. The company plans to launch mobile ordering at Taco Bell in
2015, which will allow greater customization and open up new customer loyalty alternatives.
In our view, no discussion about restaurant technology would be complete without mentioning Apple
Pay, which we believe may be the industry's next significant game-changing technology. Restaurants
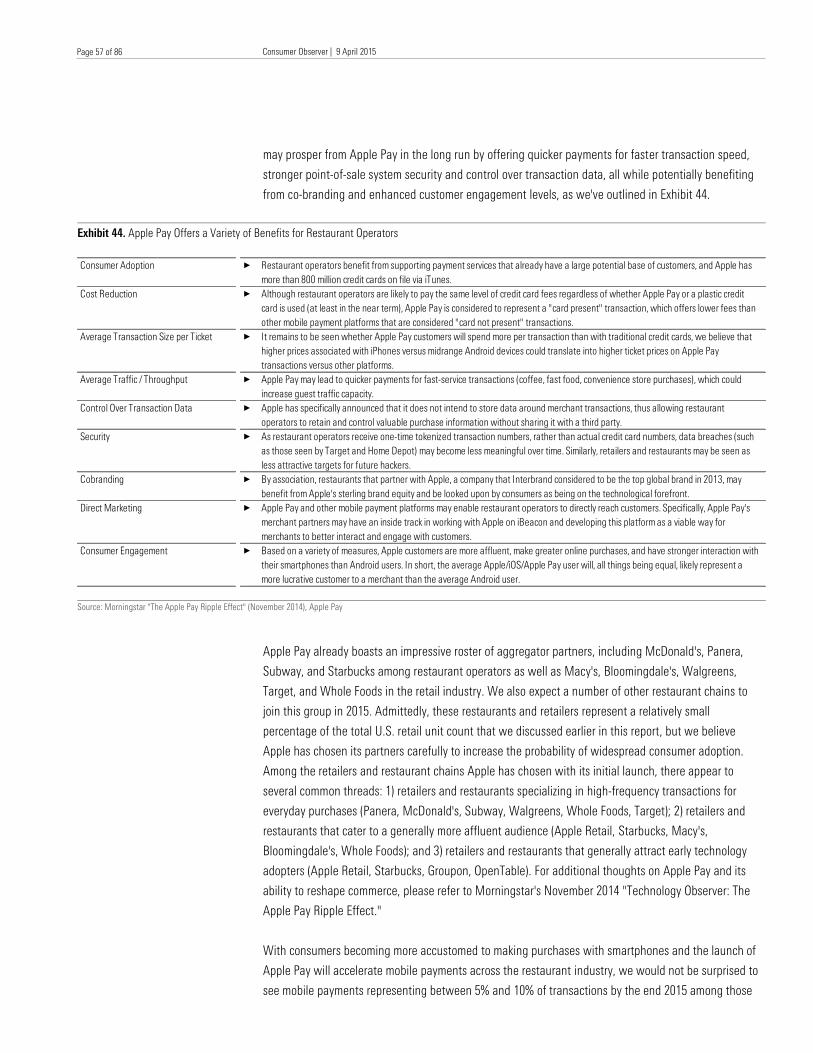
Consumer Observer | 9 April 2015
Healthcare Observer | 14 April 2015
Page 57 of 86
Page 57 of 86
may prosper from Apple Pay in the long run by offering quicker payments for faster transaction speed,
stronger point-of-sale system security and control over transaction data, all while potentially benefiting
from co-branding and enhanced customer engagement levels, as we've outlined in Exhibit 44.
Exhibit 44. Apple Pay Offers a Variety of Benefits for Restaurant Operators
Source: Morningstar "The Apple Pay Ripple Effect" (November 2014), Apple Pay
Apple Pay already boasts an impressive roster of aggregator partners, including McDonald's, Panera,
Subway, and Starbucks among restaurant operators as well as Macy's, Bloomingdale's, Walgreens,
Target, and Whole Foods in the retail industry. We also expect a number of other restaurant chains to
join this group in 2015. Admittedly, these restaurants and retailers represent a relatively small
percentage of the total U.S. retail unit count that we discussed earlier in this report, but we believe
Apple has chosen its partners carefully to increase the probability of widespread consumer adoption.
Among the retailers and restaurant chains Apple has chosen with its initial launch, there appear to
several common threads: 1) retailers and restaurants specializing in high-frequency transactions for
everyday purchases (Panera, McDonald's, Subway, Walgreens, Whole Foods, Target); 2) retailers and
restaurants that cater to a generally more affluent audience (Apple Retail, Starbucks, Macy's,
Bloomingdale's, Whole Foods); and 3) retailers and restaurants that generally attract early technology
adopters (Apple Retail, Starbucks, Groupon, OpenTable). For additional thoughts on Apple Pay and its
ability to reshape commerce, please refer to Morningstar's November 2014 "Technology Observer: The
Apple Pay Ripple Effect."
With consumers becoming more accustomed to making purchases with smartphones and the launch of
Apple Pay will accelerate mobile payments across the restaurant industry, we would not be surprised to
see mobile payments representing between 5% and 10% of transactions by the end 2015 among those
Consumer Adoption × Restaurant operators benefit from supporting payment services that already have a large potential base of customers, and Apple has
more than 800 million credit cards on file via iTunes.
Cost Reduction × Although restaurant operators are likely to pay the same level of credit card fees regardless of whether Apple Pay or a plastic credit
card is used (at least in the near term), Apple Pay is considered to represent a "card present" transaction, which offers lower fees than
other mobile payment platforms that are considered "card not present" transactions.
Average Transaction Size per Ticket × It remains to be seen whether Apple Pay customers will spend more per transaction than with traditional credit cards, we believe that
higher prices associated with iPhones versus midrange Android devices could translate into higher ticket prices on Apple Pay
transactions versus other platforms.
Average Traffic / Throughput × Apple Pay may lead to quicker payments for fast-service transactions (coffee, fast food, convenience store purchases), which could
increase guest traffic capacity.
Control Over Transaction Data × Apple has specifically announced that it does not intend to store data around merchant transactions, thus allowing restaurant
operators to retain and control valuable purchase information without sharing it with a third party.
Security × As restaurant operators receive one-time tokenized transaction numbers, rather than actual credit card numbers, data breaches (such
as those seen by Target and Home Depot) may become less meaningful over time. Similarly, retailers and restaurants may be seen as
less attractive targets for future hackers.
Cobranding × By association, restaurants that partner with Apple, a company that Interbrand considered to be the top global brand in 2013, may
benefit from Apple's sterling brand equity and be looked upon by consumers as being on the technological forefront.
Direct Marketing × Apple Pay and other mobile payment platforms may enable restaurant operators to directly reach customers. Specifically, Apple Pay's
merchant partners may have an inside track in working with Apple on iBeacon and developing this platform as a viable way for
merchants to better interact and engage with customers.
Consumer Engagement × Based on a variety of measures, Apple customers are more affluent, make greater online purchases, and have stronger interaction with
their smartphones than Android users. In short, the average Apple/iOS/Apple Pay user will, all things being equal, likely represent a
more lucrative customer to a merchant than the average Android user.
Consumer Observer | 9 April 2015
Healthcare Observer | 14 April 2015
Page 58 of 86
Page 58 of 86
restaurant chains allowing Apple Pay. We believe Starbucks' technology efforts have been appreciated
by the market, but believe the impact that it could have on players like Panera and Yum have not been
appropriately priced into current market valuations.
× Catering/delivery. Fast-casual restaurants have also been at the forefront of increased demand for
delivery and catering options. In particular, we remain optimistic about Panera's plans for catering/large
order delivery hubs, where large and small catering orders will be fulfilled through "delivery hubs,"
dedicated store square footage (either attached or directly next to current stores) with specifically
dedicated catering management teams. Delivery is a $300 million-plus business for Panera today, but we
would not be surprised to see this develop into a multibillion-dollar revenue stream over the next 10
years, especially as mobile technologies make catering and delivery options more accessible and the
company takes advantage of the current retail real estate market to accelerate delivery hub expansion
plans. Chipotle has also seen early success with its catering platform, which has contributed a point or
two to recent comparable-restaurant sales growth trends.
Many traditional restaurant chains are also looking to delivery as a new potential revenue stream.
Among the more notable customer delivery initiatives across the restaurant category comes from
Starbucks, where management unveiled its delivery plans at its December 2014 investor day
presentations. In densely populated markets, the company plans to offer "green apron" deliveries where
web-based beverage and food orders are prepared and delivered by baristas from existing Starbucks
locations (or staging areas in unused office buildings). In less densely populated markets, Starbucks will
work with other third-party contractors (including Postmates in Seattle) to facilitate deliveries. In
addition to Starbucks' delivery aspirations, we've also seen delivery options offered at some Burger King
locations, and Taco Bell also recently announcing plans to test delivery in a handful of markets in 2015.
McDonald's has also commented a few times in the past about the possibility of delivery tests, though
we believe there are other initiatives higher on the company's near-term priority list.
Although we are mindful of the costs that go along with catering and delivery capabilities, we find many
of these initiatives as intriguing ways to drive more productivity out of existing locations while
accelerating digital marketing efforts (most ordering options will take place via web- or mobile-app-
based platforms). Although the ultimate contribution will depend on consumer adoption trends, we
believe these initiatives can be additive to comparable sales for many restaurant companies over a
longer horizon. We believe fast-casual players will continue to enjoy the most success with catering and
delivery operations over the next several years, with Starbucks also poised to see an extended same-
restaurant sales tailwind after rolling out its delivery platform later this year.
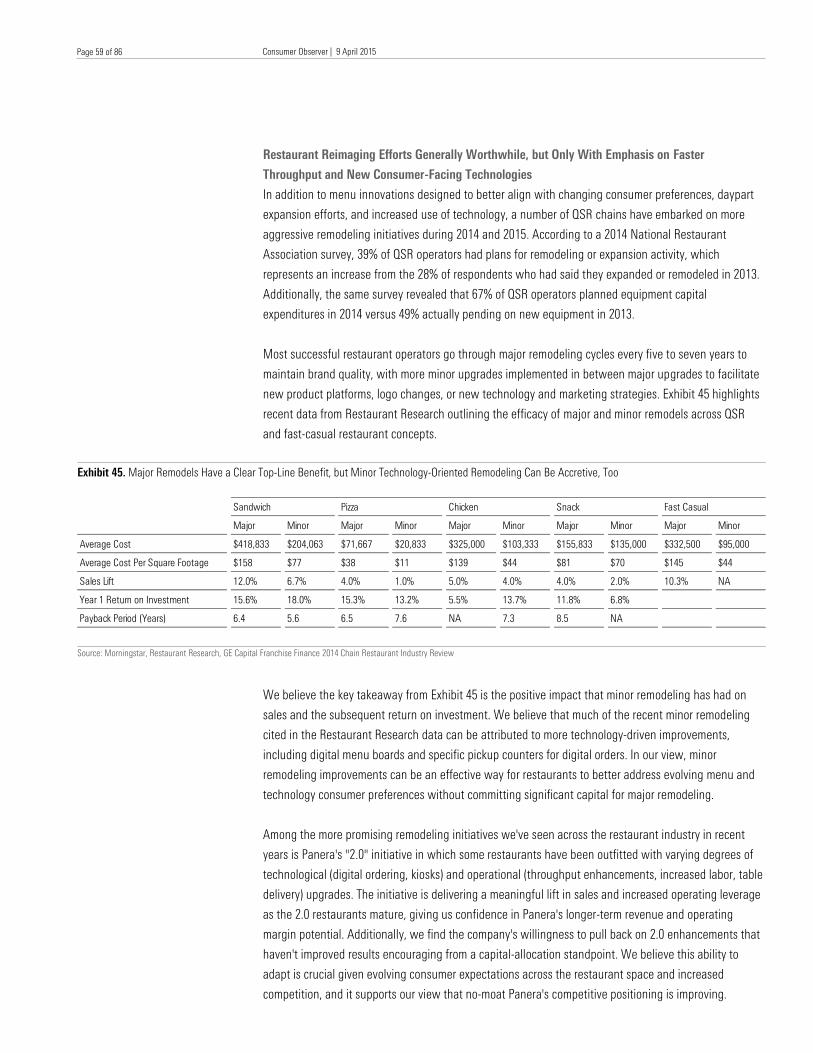
Consumer Observer | 9 April 2015
Healthcare Observer | 14 April 2015
Page 59 of 86
Page 59 of 86
Restaurant Reimaging Efforts Generally Worthwhile, but Only With Emphasis on Faster
Throughput and New Consumer-Facing Technologies
In addition to menu innovations designed to better align with changing consumer preferences, daypart
expansion efforts, and increased use of technology, a number of QSR chains have embarked on more
aggressive remodeling initiatives during 2014 and 2015. According to a 2014 National Restaurant
Association survey, 39% of QSR operators had plans for remodeling or expansion activity, which
represents an increase from the 28% of respondents who had said they expanded or remodeled in 2013.
Additionally, the same survey revealed that 67% of QSR operators planned equipment capital
expenditures in 2014 versus 49% actually pending on new equipment in 2013.
Most successful restaurant operators go through major remodeling cycles every five to seven years to
maintain brand quality, with more minor upgrades implemented in between major upgrades to facilitate
new product platforms, logo changes, or new technology and marketing strategies. Exhibit 45 highlights
recent data from Restaurant Research outlining the efficacy of major and minor remodels across QSR
and fast-casual restaurant concepts.
Exhibit 45. Major Remodels Have a Clear Top-Line Benefit, but Minor Technology-Oriented Remodeling Can Be Accretive, Too
Source: Morningstar, Restaurant Research, GE Capital Franchise Finance 2014 Chain Restaurant Industry Review
We believe the key takeaway from Exhibit 45 is the positive impact that minor remodeling has had on
sales and the subsequent return on investment. We believe that much of the recent minor remodeling
cited in the Restaurant Research data can be attributed to more technology-driven improvements,
including digital menu boards and specific pickup counters for digital orders. In our view, minor
remodeling improvements can be an effective way for restaurants to better address evolving menu and
technology consumer preferences without committing significant capital for major remodeling.
Among the more promising remodeling initiatives we've seen across the restaurant industry in recent
years is Panera's "2.0" initiative in which some restaurants have been outfitted with varying degrees of
technological (digital ordering, kiosks) and operational (throughput enhancements, increased labor, table
delivery) upgrades. The initiative is delivering a meaningful lift in sales and increased operating leverage
as the 2.0 restaurants mature, giving us confidence in Panera's longer-term revenue and operating
margin potential. Additionally, we find the company's willingness to pull back on 2.0 enhancements that
haven't improved results encouraging from a capital-allocation standpoint. We believe this ability to
adapt is crucial given evolving consumer expectations across the restaurant space and increased
competition, and it supports our view that no-moat Panera's competitive positioning is improving.
Sandwich Pizza Chicken Snack Fast Casual
Major Minor Major Minor Major Minor Major Minor Major Minor
Average Cost $418,833 $204,063 $71,667 $20,833 $325,000 $103,333 $155,833 $135,000 $332,500 $95,000
Average Cost Per Square Footage $158 $77 $38 $11 $139 $44 $81 $70 $145 $44
Sales Lift 12.0% 6.7% 4.0% 1.0% 5.0% 4.0% 4.0% 2.0% 10.3% NA
Year 1 Return on Investment 15.6% 18.0% 15.3% 13.2% 5.5% 13.7% 11.8% 6.8%
Payback Period (Years) 6.4 5.6 6.5 7.6 NA 7.3 8.5 NA
Consumer Observer | 9 April 2015
Healthcare Observer | 14 April 2015
Page 60 of 86
Page 60 of 86
Peeling back the metrics behind Panera 2.0 conversions, we believe the clear highlight is that they are
driving sustainable top-line momentum over a multiyear period across different regions, validating
management's efforts to reduce friction and improve throughput. While sales trends vary by market, and
a few regions are still in very early stages, the results from Panera's stores in Boston, Charlotte, North
Carolina, (which got off to a slow start because of other Panera openings in the region but have seen
strong results in recent quarters), Dallas, Jacksonville, Florida, and the Southwest are encouraging, with
retail sales increasing from low-single-digit growth immediately after the conversion to mid- to high-
single-digit growth a year to two years later. With 300 more restaurants slated for conversion this year
(75-100 in the first half and 200-225 in the second half, bringing the total number of converted stores to
400, or more than 20% of the base), we believe Panera 2.0 will represent a meaningful source of top-line
growth for years to come. Not surprisingly, the labor and other restaurant expenses tied to the initiative
are typically higher immediately after the conversion, since it takes time for consumers to recognize the
changes to the restaurants and drive increased frequency. However, we're encouraged by the operating
expense leverage that starts to show up at the converted stores roughly a year after the conversion,
something that should be improved as management fine tunes the various attributes of the in-store
experience that drives frequency and reduces spending on less important features.
Favorable Market Conditions Conducive for More Aggressive Franchising/Refranchising
Not surprisingly, increased pressure from fast-casual companies has also prompted other restaurant
chains to take a closer look at the ownership mix of their restaurant portfolios. Whether on their own
volition or by the encouragement of activist shareholders, putting more locations in the hands of
franchisees has taken on increased emphasis in recent years. We generally take a positive view
regarding refranchising, as we believe it can reduce a restaurant company's operational and financial
risks, bolster return on invested capital metrics by lowering a company's invested capital base and
transferring capital responsibilities to franchisees, and provide additional cash proceeds that can be
used for other shareholder-enhancing activities or debt reduction where prudent. Additionally, we
believe cap rate conditions are conducive for more aggressive franchising/refranchising activity.
Before it acquired Tim Hortons and created Restaurant Brands International, Burger King's relationships
with existing franchisees improved significantly under 3G's stewardship and its refranchising efforts.
More than 1,200 company-owned locations have been sold to franchisees since 2009, resulting in 99%
of the systemwide restaurants now being operated by franchisees and licensees. In our view, this has
placed restaurant operations in the hands of some of the system's best operators, facilitated accelerated
restaurant remodeling activities (40% of U.S. and Canada Burger King locations have been reimaged at
the end of 2014), and enabled management to focus on brand awareness, menu innovation, and more
effective marketing practices. In fact, a streamlined menu emphasizing fewer but more impactful
products, daypart expansion (with an emphasis on breakfast and snacking), revamped value platform
(two sandwiches for $5, for example), and remodeled restaurants have reinvigorated the Burger King
brand in recent years—particularly in developed markets such as the U.S.—driving market share gains
and improved franchise-level returns in the process.
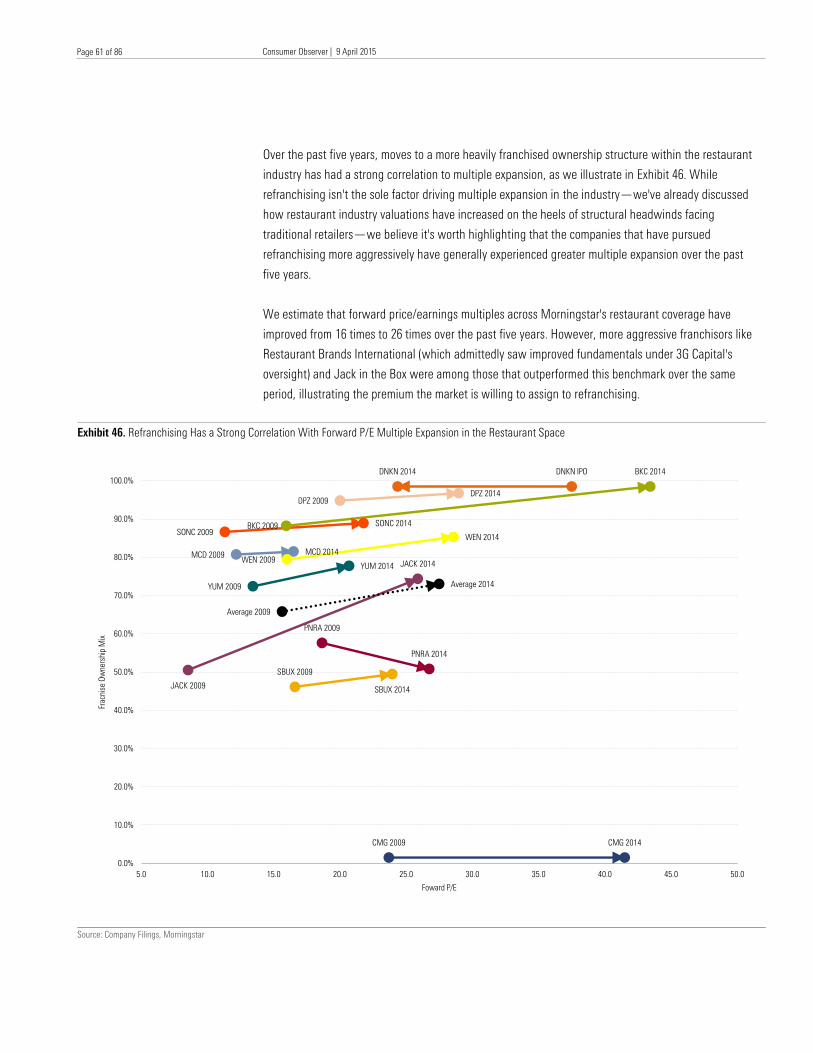
Consumer Observer | 9 April 2015
Healthcare Observer | 14 April 2015
Page 61 of 86
Page 61 of 86
Over the past five years, moves to a more heavily franchised ownership structure within the restaurant
industry has had a strong correlation to multiple expansion, as we illustrate in Exhibit 46. While
refranchising isn't the sole factor driving multiple expansion in the industry—we've already discussed
how restaurant industry valuations have increased on the heels of structural headwinds facing
traditional retailers—we believe it's worth highlighting that the companies that have pursued
refranchising more aggressively have generally experienced greater multiple expansion over the past
five years.
We estimate that forward price/earnings multiples across Morningstar's restaurant coverage have
improved from 16 times to 26 times over the past five years. However, more aggressive franchisors like
Restaurant Brands International (which admittedly saw improved fundamentals under 3G Capital's
oversight) and Jack in the Box were among those that outperformed this benchmark over the same
period, illustrating the premium the market is willing to assign to refranchising.
Exhibit 46. Refranchising Has a Strong Correlation With Forward P/E Multiple Expansion in the Restaurant Space
Source: Company Filings, Morningstar
MCD 2009MCD 2014
YUM 2009
YUM 2014
BKC 2009
BKC 2014
SBUX 2009
SBUX 2014
DNKN IPODNKN 2014
PNRA 2009
PNRA 2014
CMG 2009 CMG 2014
JACK 2009
JACK 2014
SONC 2009
SONC 2014
DPZ 2009
DPZ 2014
WEN 2009
WEN 2014
Average 2009
Average 2014
0.0%
10.0%
20.0%
30.0%
40.0%
50.0%
60.0%
70.0%
80.0%
90.0%
100.0%
5.0 10.0 15.0 20.0 25.0 30.0 35.0 40.0 45.0 50.0
Fracnis
e O
wnership
Mix
Foward P/E
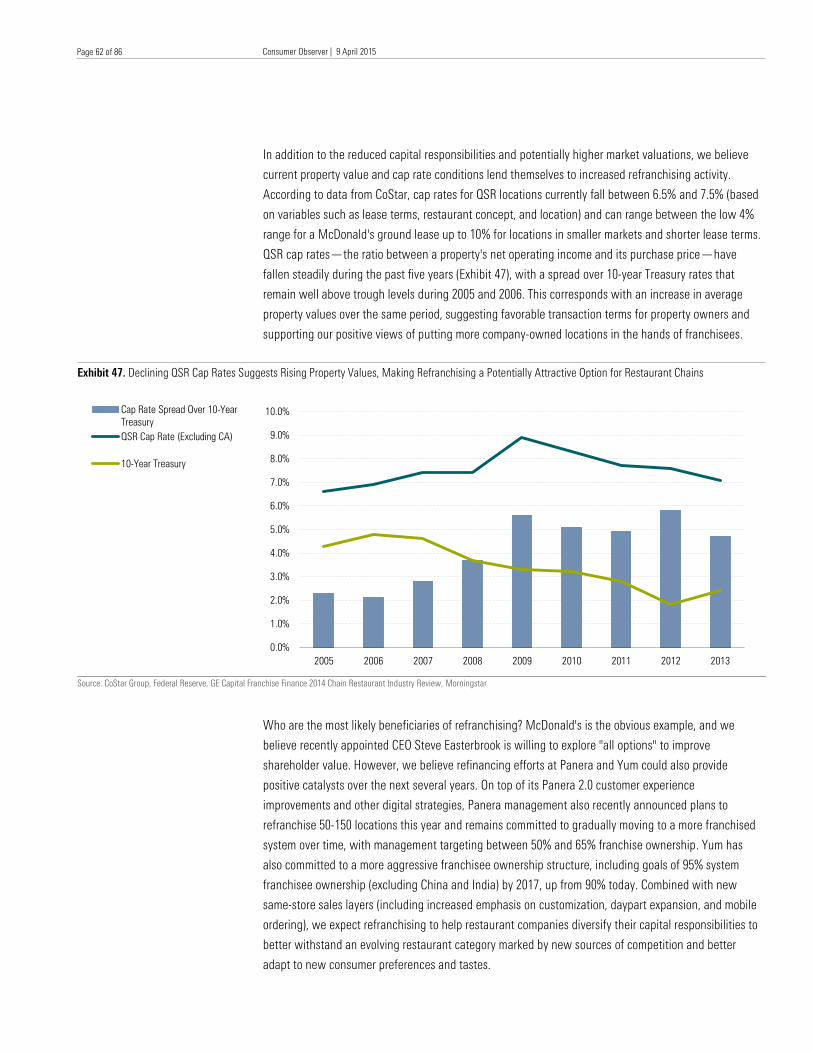
Consumer Observer | 9 April 2015
Healthcare Observer | 14 April 2015
Page 62 of 86
Page 62 of 86
In addition to the reduced capital responsibilities and potentially higher market valuations, we believe
current property value and cap rate conditions lend themselves to increased refranchising activity.
According to data from CoStar, cap rates for QSR locations currently fall between 6.5% and 7.5% (based
on variables such as lease terms, restaurant concept, and location) and can range between the low 4%
range for a McDonald's ground lease up to 10% for locations in smaller markets and shorter lease terms.
QSR cap rates—the ratio between a property's net operating income and its purchase price—have
fallen steadily during the past five years (Exhibit 47), with a spread over 10-year Treasury rates that
remain well above trough levels during 2005 and 2006. This corresponds with an increase in average
property values over the same period, suggesting favorable transaction terms for property owners and
supporting our positive views of putting more company-owned locations in the hands of franchisees.
Exhibit 47. Declining QSR Cap Rates Suggests Rising Property Values, Making Refranchising a Potentially Attractive Option for Restaurant Chains
Source: CoStar Group, Federal Reserve, GE Capital Franchise Finance 2014 Chain Restaurant Industry Review, Morningstar
Who are the most likely beneficiaries of refranchising? McDonald's is the obvious example, and we
believe recently appointed CEO Steve Easterbrook is willing to explore "all options" to improve
shareholder value. However, we believe refinancing efforts at Panera and Yum could also provide
positive catalysts over the next several years. On top of its Panera 2.0 customer experience
improvements and other digital strategies, Panera management also recently announced plans to
refranchise 50-150 locations this year and remains committed to gradually moving to a more franchised
system over time, with management targeting between 50% and 65% franchise ownership. Yum has
also committed to a more aggressive franchisee ownership structure, including goals of 95% system
franchisee ownership (excluding China and India) by 2017, up from 90% today. Combined with new
same-store sales layers (including increased emphasis on customization, daypart expansion, and mobile
ordering), we expect refranchising to help restaurant companies diversify their capital responsibilities to
better withstand an evolving restaurant category marked by new sources of competition and better
adapt to new consumer preferences and tastes.
0.0%
1.0%
2.0%
3.0%
4.0%
5.0%
6.0%
7.0%
8.0%
9.0%
10.0%
2005 2006 2007 2008 2009 2010 2011 2012 2013
Cap Rate Spread Over 10-Year
Treasury
QSR Cap Rate (Excluding CA)
10-Year Treasury
Consumer Observer | 9 April 2015
Healthcare Observer | 14 April 2015
Page 63 of 86
Page 63 of 86
REIT Transactions: The Next Big Trend in Restaurants?
We believe the market's appetite for real estate transactions has increased over the past year given the
low interest rate environment and REIT spin-off announcements from other retailer and restaurant
chains (most notably, Darden's plans to explore transactions for its real estate under its Starboard Value-
led board). We understand the appeal of REIT transactions given their tax-favorable structures, the
ability to pay dividends from pretax earnings, and the generally low cap rate environment that we
outlined in Exhibit 47. However, we believe that each potential real estate transaction should be
evaluated individually.
With $39 billion in land and building assets on its balance sheet as of December 2014 and $6.1 billion in
rents collected from franchisees last year, McDonald's remains a popular target for real estate
transactions among activist investors and hedge funds (including several proposals from Pershing
Square's Bill Ackman dating back to 2005 and more recent proposals from Glenview Capital's Larry
Robbins to name just a few). McDonald's management has historically rebuffed these proposals, citing
the desire to 1) maintain control of its properties; 2) uphold its relationship with franchisees; and 3)
preserve its credit rating, which provides franchisees access to capital at attractive rates. However,
management's views on REITs appear to be shifting somewhat, with Chief Administrative Officer (and
former Chief Financial Officer) Pete Bensen noting at a March investor conference that management is
"constantly challenging its thinking on the REIT (structure)" and "always looking as ways to continue to
increase value."
Leveraging research from Morningstar's Ken Perkins and his June 2013 piece, "REIT Spin-Offs Can
Surface Value for Property Owners, but Moats and Margin and Safety Remain More Important," we
don't believe a REIT spin-off would significantly alter any of McDonald's moat sources (especially if a
transaction were structured in a way that franchisees were allowed to participate in the ownership of
the newly created REIT) or its pretax cash flows. The level of potential tax savings would ultimately
depend on how much real estate the company was willing to commit to a property company subsidiary
(PropCo), but because REITs must pay out at least 90% of taxable earnings to shareholders as dividends
and don’t pay federal income taxes on income distributed to shareholders, we believe McDonald's could
unlock shareholder value by creating an internal REIT (similar to recent transactions completed by
Windstream and Dillard's and proposed by Sears) and the subsequent tax savings.
In Exhibit 48, we run through some simple calculations to illustrate the tax savings that could be created
by McDonald's moving to an internal REIT structure. Starting with the $6.1 billion in rents collected from
franchisees in 2014 and assuming that McDonald's pays out 18.3% of this revenue stream in the form of
occupancy costs (rent and depreciation), we estimate that the company generated roughly $5.0 billion in
pretax income from franchised restaurants last year. Applying an assumed corporate tax rate of 32% to
the franchised restaurant pretax income, we arrive at roughly $3.4 billion in aftertax profits. While our
calculation admittedly ignores any incremental selling, general, and administrative expenses or any
changes to the corporate tax rate stemming from the accounting treatment of McDonald's land or real
estate assets, we estimate between $400 million and $1.2 billion in annual tax savings depending on the
amount of real estate contributed to a property company subsidiary, or between $7.50-$22.50 in
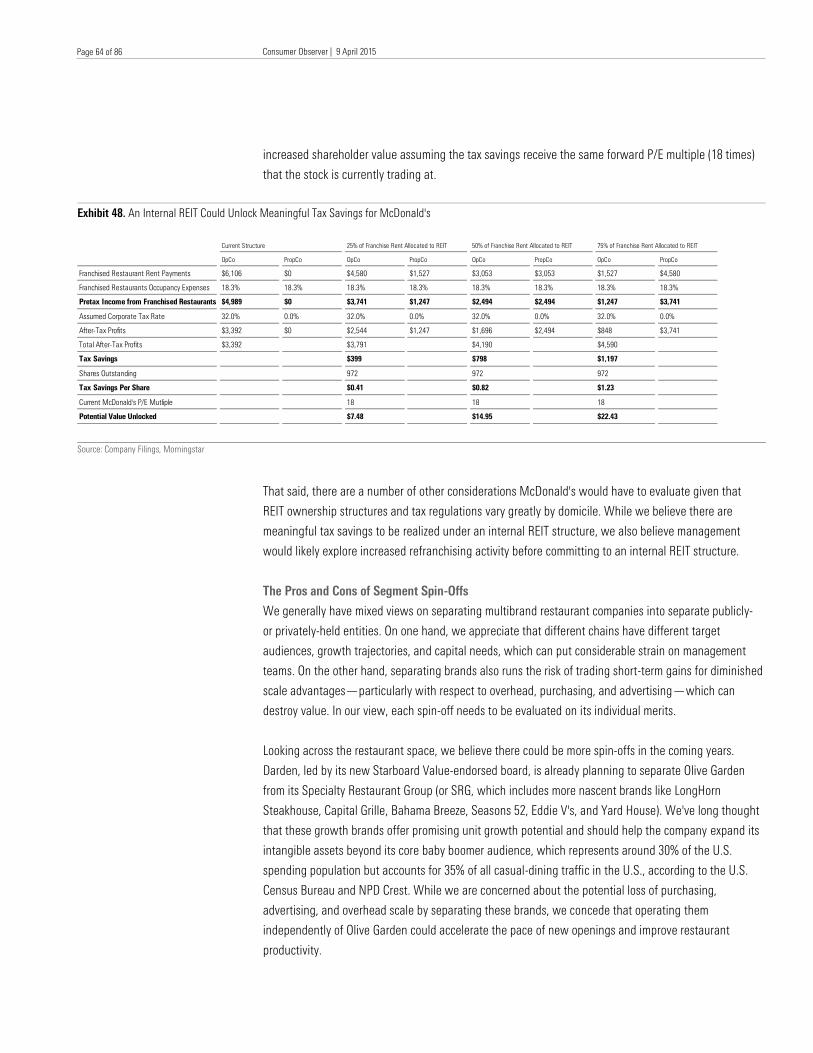
Consumer Observer | 9 April 2015
Healthcare Observer | 14 April 2015
Page 64 of 86
Page 64 of 86
increased shareholder value assuming the tax savings receive the same forward P/E multiple (18 times)
that the stock is currently trading at.
Exhibit 48. An Internal REIT Could Unlock Meaningful Tax Savings for McDonald's
Source: Company Filings, Morningstar
That said, there are a number of other considerations McDonald's would have to evaluate given that
REIT ownership structures and tax regulations vary greatly by domicile. While we believe there are
meaningful tax savings to be realized under an internal REIT structure, we also believe management
would likely explore increased refranchising activity before committing to an internal REIT structure.
The Pros and Cons of Segment Spin-Offs
We generally have mixed views on separating multibrand restaurant companies into separate publicly-
or privately-held entities. On one hand, we appreciate that different chains have different target
audiences, growth trajectories, and capital needs, which can put considerable strain on management
teams. On the other hand, separating brands also runs the risk of trading short-term gains for diminished
scale advantages—particularly with respect to overhead, purchasing, and advertising—which can
destroy value. In our view, each spin-off needs to be evaluated on its individual merits.
Looking across the restaurant space, we believe there could be more spin-offs in the coming years.
Darden, led by its new Starboard Value-endorsed board, is already planning to separate Olive Garden
from its Specialty Restaurant Group (or SRG, which includes more nascent brands like LongHorn
Steakhouse, Capital Grille, Bahama Breeze, Seasons 52, Eddie V's, and Yard House). We've long thought
that these growth brands offer promising unit growth potential and should help the company expand its
intangible assets beyond its core baby boomer audience, which represents around 30% of the U.S.
spending population but accounts for 35% of all casual-dining traffic in the U.S., according to the U.S.
Census Bureau and NPD Crest. While we are concerned about the potential loss of purchasing,
advertising, and overhead scale by separating these brands, we concede that operating them
independently of Olive Garden could accelerate the pace of new openings and improve restaurant
productivity.
Current Structure 25% of Franchise Rent Allocated to REIT 50% of Franchise Rent Allocated to REIT 75% of Franchise Rent Allocated to REIT
OpCo PropCo OpCo PropCo OpCo PropCo OpCo PropCo
Franchised Restaurant Rent Payments $6,106 $0 $4,580 $1,527 $3,053 $3,053 $1,527 $4,580
Franchised Restaurants Occupancy Expenses 18.3% 18.3% 18.3% 18.3% 18.3% 18.3% 18.3% 18.3%
Pretax Income from Franchised Restaurants $4,989 $0 $3,741 $1,247 $2,494 $2,494 $1,247 $3,741
Assumed Corporate Tax Rate 32.0% 0.0% 32.0% 0.0% 32.0% 0.0% 32.0% 0.0%
After-Tax Profits $3,392 $0 $2,544 $1,247 $1,696 $2,494 $848 $3,741
Total After-Tax Profits $3,392 $3,791 $4,190 $4,590
Tax Savings $399 $798 $1,197
Shares Outstanding 972 972 972
Tax Savings Per Share $0.41 $0.82 $1.23
Current McDonald's P/E Mutliple 18 18 18
Potential Value Unlocked $7.48 $14.95 $22.43
Consumer Observer | 9 April 2015
Healthcare Observer | 14 April 2015
Page 65 of 86
Page 65 of 86
In addition to Darden's potential SRG transaction, interest in other possible deals are gaining steam,
including a separation of Yum Brands' China division from its other global operations and the separation
of Qdoba from Jack in the Box. Separating Yum's China division has some merit, since we've long
thought that Yum was much more than a China growth story and believe that separation would allow
investors to tailor their exposure to China and Yum's other emerging markets. Additionally, last year's
corporate restructuring—where operations outside China and India were consolidated at the KFC, Pizza
Hut, and Taco Bell brand level—has helped to improve the focus of the different brand management
teams (KFC outside of China in particular) and made these segments less dependent on Yum China.
Based on the reorganization and that Yum China is a mostly self-contained supply chain, distribution,
site selection, and advertising ecosystem, we believe a separation would be relatively seamless from an
operating perspective and would not sacrifice meaningful scale advantages. Still, there would be some
drawbacks to a Yum China spin-off, including significant transaction and listing fees and reduced
opportunities for sharing the brand's best practices (though stand-alone publicly traded companies like
Arcos Dorados and Domino's Pizza Enterprises suggest that brand synergies can exist across multiple
entities). Nevertheless, we do not believe that spinning off Yum China is at the top of management's
priority list, and would not give it consideration until same-store sales trends have improved.
Although we no longer cover Jack in the Box, we don't believe it will look to spin off its fast-casual
Qdoba concept in the near future. Management has done an admirable job of stabilizing Qdoba's same-
restaurant sales and shedding unprofitable locations over the past few years, and we share its views
that the market is currently giving Jack in the Box sufficient credit for its longer-term unit growth and
margin expansion opportunities.
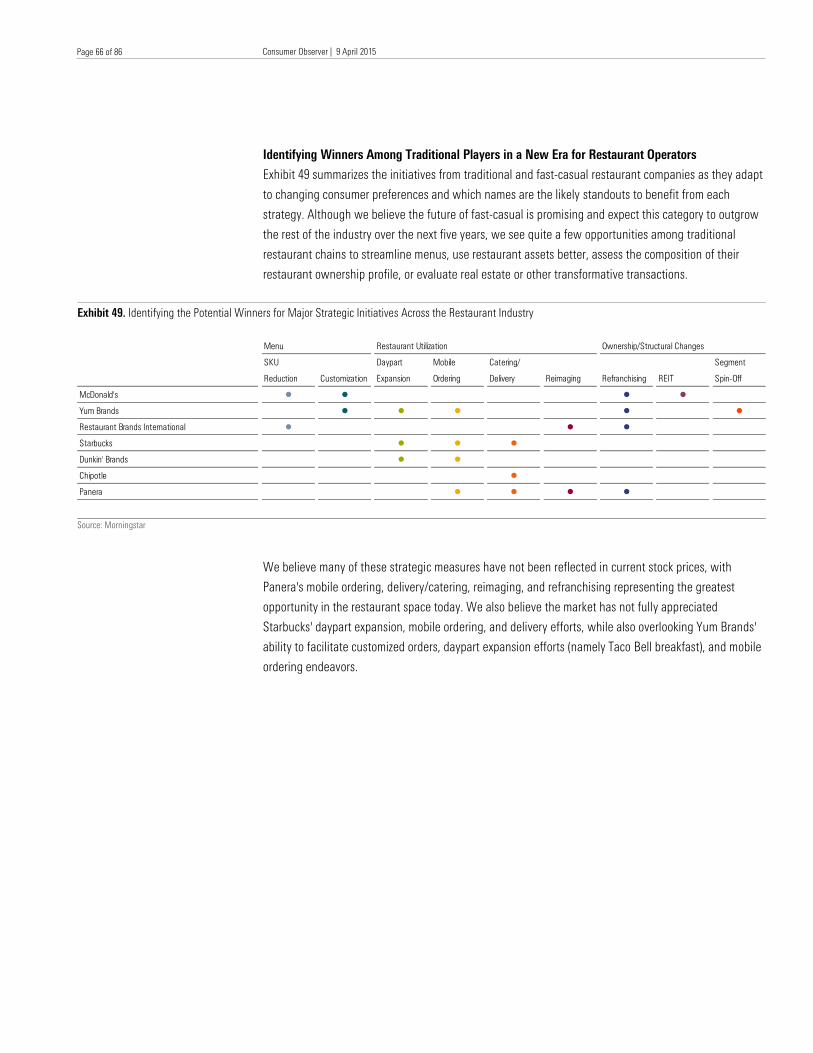
Consumer Observer | 9 April 2015
Healthcare Observer | 14 April 2015
Page 66 of 86
Page 66 of 86
Identifying Winners Among Traditional Players in a New Era for Restaurant Operators
Exhibit 49 summarizes the initiatives from traditional and fast-casual restaurant companies as they adapt
to changing consumer preferences and which names are the likely standouts to benefit from each
strategy. Although we believe the future of fast-casual is promising and expect this category to outgrow
the rest of the industry over the next five years, we see quite a few opportunities among traditional
restaurant chains to streamline menus, use restaurant assets better, assess the composition of their
restaurant ownership profile, or evaluate real estate or other transformative transactions.
Exhibit 49. Identifying the Potential Winners for Major Strategic Initiatives Across the Restaurant Industry
Source: Morningstar
We believe many of these strategic measures have not been reflected in current stock prices, with
Panera's mobile ordering, delivery/catering, reimaging, and refranchising representing the greatest
opportunity in the restaurant space today. We also believe the market has not fully appreciated
Starbucks' daypart expansion, mobile ordering, and delivery efforts, while also overlooking Yum Brands'
ability to facilitate customized orders, daypart expansion efforts (namely Taco Bell breakfast), and mobile
ordering endeavors.
Menu Restaurant Utilization Ownership/Structural Changes
SKU
Reduction Customization
Daypart
Expansion
Mobile
Ordering
Catering/
Delivery Reimaging Refranchising REIT
Segment
Spin-Off
McDonald's l l l l
Yum Brands l l l l l
Restaurant Brands International l l l
Starbucks l l l
Dunkin' Brands l l
Chipotle l
Panera l l l l
Consumer Observer | 9 April 2015
Healthcare Observer | 14 April 2015
Page 67 of 86
Page 67 of 86
How Have Restaurant Industry Changes Reshaped Our Moat Rating Methodology?
Before summarizing each of the companies in our restaurant coverage universe over the following
pages, we also wanted to provide an updated summary of how we apply our moat methodology across
the restaurant industry, and how fast-casual concepts have changed our views. As a reminder, we
believe there are several questions investors can ask themselves to gauge whether a restaurant
company has established an economic moat, which we have included below:
× Does the brand possess enough pricing power to offset food and labor cost inflation? If the restaurant
operator can maintain guest counts and operating margins after raising prices, the brand may have
sufficient pricing power to support an economic moat.
× How has the company historically fared during price wars? Because switching costs are nonexistent, the
restaurant industry has a long history of price wars. If an operator has been able to preserve operating
margins during periods of aggressive industry discounting, the firm's cost advantages may indicate an
economic moat.
× Has the restaurant concept been successfully replicated across multiple markets? Few restaurant
concepts have the brand recognition or scale to expand to multiple markets. If the operator continues to
grow unit counts across multiple markets while also improving underlying margins, it may suggest an
intangible asset or scale cost advantages worthy of a moat.
× Is the restaurant franchise system cohesive? For restaurant franchisors that collect royalties on
franchisee sales, the intangible asset moat source depends on the overall health of its franchisees.
Signals of a strong franchise system include a company's willingness to provide franchisees with capital
for remodeling projects and new equipment, low franchisee bankruptcy rates, and robust franchise
owner cash flow.
As we discussed earlier, we believe the growth of fast-casual restaurants has been particularly relevant
to the first moat source regarding brand pricing power. Generally speaking, we believe fast-casual
restaurants have done a better job of adapting to new consumer preferences regarding menu
composition, in-restaurant experience, and technologies, resulting in more robust guest traffic and
greater average transaction sizes (resulting in positive moat trends for the fast-casual chains we cover).
We also believe that the success of fast-casual chains has put downward pressure on the pricing power
of many traditional restaurant chains like McDonald's and Darden.
Exhibit 50 plots the market share of each company we cover (within its primary restaurant subcategory)
against our average return on invested capital (excluding goodwill) estimates for the next five years. In
our view, the market share statistics help confirm the power of each restaurant company's brand (or
brand portfolio), while return on invested capital estimates often indicate the cohesion of a restaurant
company's franchisee network or its ability to replicate its concepts across multiple markets.
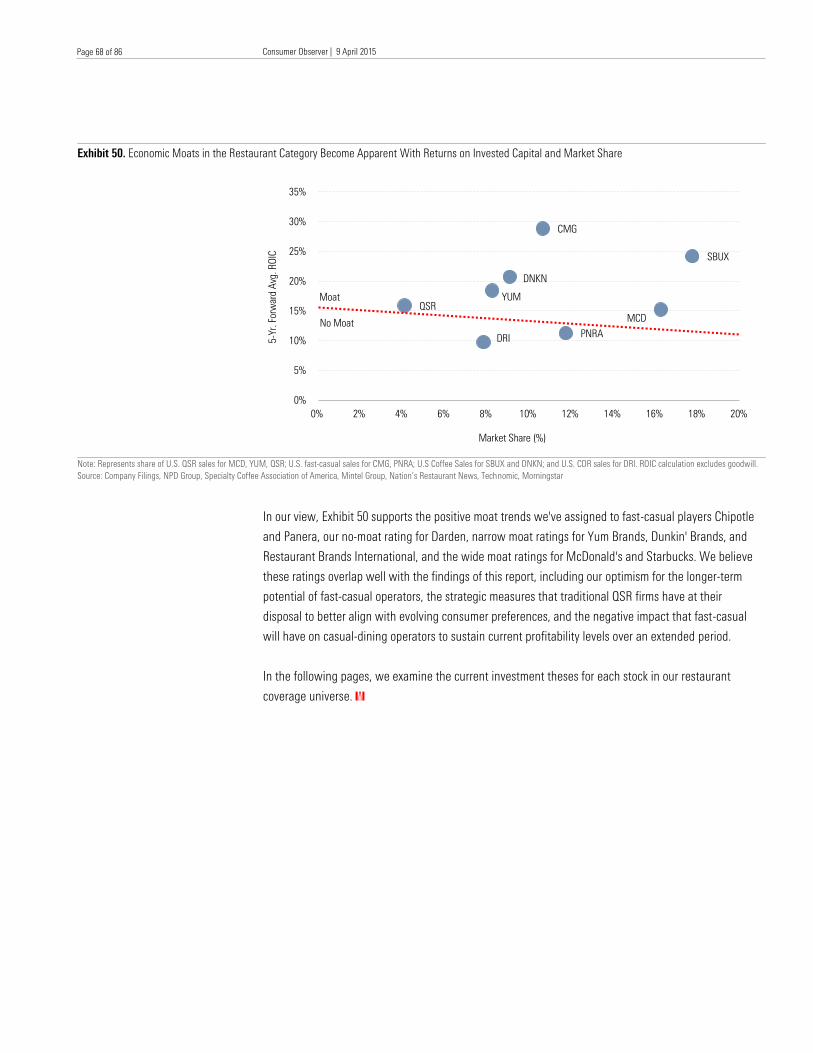
Consumer Observer | 9 April 2015
Healthcare Observer | 14 April 2015
Page 68 of 86
Page 68 of 86
Exhibit 50. Economic Moats in the Restaurant Category Become Apparent With Returns on Invested Capital and Market Share
Note: Represents share of U.S. QSR sales for MCD, YUM, QSR; U.S. fast-casual sales for CMG, PNRA; U.S Coffee Sales for SBUX and DNKN; and U.S. CDR sales for DRI. ROIC calculation excludes goodwill.
Source: Company Filings, NPD Group, Specialty Coffee Association of America, Mintel Group, Nation’s Restaurant News, Technomic, Morningstar
In our view, Exhibit 50 supports the positive moat trends we've assigned to fast-casual players Chipotle
and Panera, our no-moat rating for Darden, narrow moat ratings for Yum Brands, Dunkin' Brands, and
Restaurant Brands International, and the wide moat ratings for McDonald's and Starbucks. We believe
these ratings overlap well with the findings of this report, including our optimism for the longer-term
potential of fast-casual operators, the strategic measures that traditional QSR firms have at their
disposal to better align with evolving consumer preferences, and the negative impact that fast-casual
will have on casual-dining operators to sustain current profitability levels over an extended period.
In the following pages, we examine the current investment theses for each stock in our restaurant
coverage universe. K
QSR
CMG
DRI
DNKN
MCD
PNRA
SBUX
YUM
0%
5%
10%
15%
20%
25%
30%
35%
0% 2% 4% 6% 8% 10% 12% 14% 16% 18% 20%
5-Y
r. Forw
ard A
vg. R
OIC
Market Share (%)
Moat
No Moat
Consumer Observer | 9 April 2015
Healthcare Observer | 14 April 2015
Page 69 of 86
Page 69 of 86
Executive Summary
Accelerating restaurant transaction trends give us greater conviction that "Panera 2.0" customer
experience investments—peak-hour throughput capacity, more accessible menu prices, new marketing
tactics, and digital ordering—have reinforced the brand intangible asset underpinning our positive moat
trend. The costs of these investments are expected to weigh on profitability through 2015, but as
comparable transaction trends continue to improve and customer experience investments wind down,
we believe Panera's longer-term margin opportunities will become more apparent. Certainly, a more
competitive fast-casual restaurant landscape provides potential risks to our assumptions, but we believe
these transformation efforts will spur greater unit-level productivity (where Panera is already among
industry leaders, with $2.5 million in average unit volumes) while enhancing its operating leverage,
better positioning Panera to compete with existing and emerging rivals.
Key Investment Considerations
× Given a decline in real estate and construction costs and a shakeout among local independent
restaurant operators and retailers, we believe that Panera is one of a handful of restaurant concepts
with realistic aspirations to sustain high-single-digit top-line growth rates over the next 10 years, with
some year-to-year variation due to economic cycles. If the chain can match the density of its home
market in St. Louis and its other more mature markets, we estimate that it could ultimately expand to
3,500-4,000 domestic units.
× While there is some variance among the sales trends by market, and a few regions are still in very early
stages, the results from Panera's early 2.0 test markets are encouraging, with retail sales increasing from
low-single-digit growth immediately after the conversion to mid- to high-single-digit growth and
increased operating expense leverage after a few quarters.
× Beyond the Panera 2.0 customer experience improvements and overall digital strategies, we remain
optimistic about Panera's catering/large order delivery hubs as well as plans to refranchise 50-150
locations this year and expand franchise ownership to 55%-65% of the system over time. Delivery is a
$300 million-plus business for Panera today, but we would not be surprised to see this develop into a
multibillion-dollar revenue stream over the next 10 years. Panera's refranchising plans come on the heels
of similar announcements across the industry and could accelerate Panera 2.0 conversions while
allowing management to focus more on brand, menu innovation, and marketing efficacy.
Economic Moat None
Moat Trend Positive
Morningstar Rating QQQQ
Fair Value Estimate $184
Current Price $166
Price/Fair Value 0.90
Uncertainty Rating Medium
Market Cap ($ Billion) 4.4
Panera (Top Pick): Positioned to Take Market Share by Embracing Technology, Delivery/Catering, Refranchising
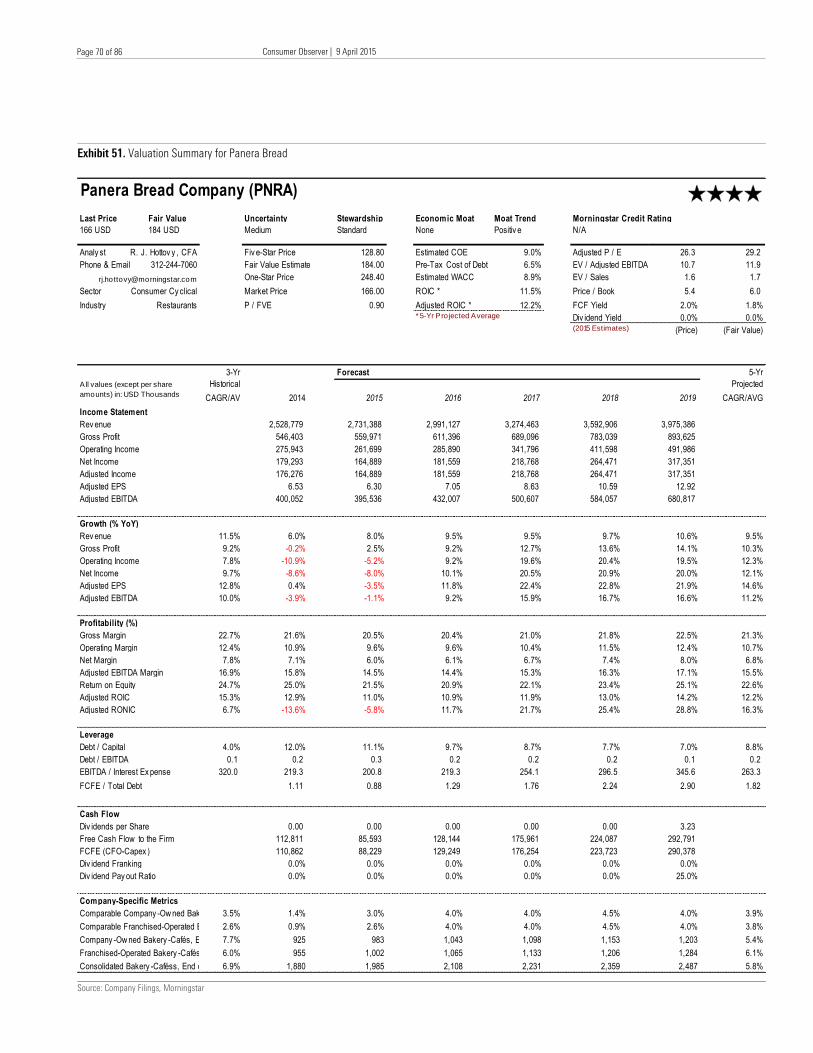
Consumer Observer | 9 April 2015
Healthcare Observer | 14 April 2015
Page 70 of 86
Page 70 of 86
Exhibit 51. Valuation Summary for Panera Bread
Source: Company Filings, Morningstar
Last Price Fair Value Uncertainty Stewardship Economic Moat Moat Trend Morningstar Credit Rating
166 USD 184 USD Medium Standard None Positiv e N/A
Analy st R. J. Hottov y , CFA Fiv e-Star Price 128.80 Estimated COE 9.0% Adjusted P / E 26.3 29.2
Phone & Email 312-244-7060 Fair Value Estimate 184.00 Pre-Tax Cost of Debt 6.5% EV / Adjusted EBITDA 10.7 11.9
[email protected] One-Star Price 248.40 Estimated WACC 8.9% EV / Sales 1.6 1.7
Sector Consumer Cy clical Market Price 166.00 ROIC * 11.5% Price / Book 5.4 6.0
Industry P / FVE 0.90 Adjusted ROIC * 12.2% FCF Yield 2.0% 1.8%* 5-Yr Pro jected Average Div idend Yield 0.0% 0.0%
(2015 Estimates) (Price) (Fair Value)
3-Yr Forecast 5-Yr
Historical
CAGR/AV 2014 2015 2016 2017 2018 2019
Projected
CAGR/AVG
Income Statement
Rev enue 2,528,779 2,731,388 2,991,127 3,274,463 3,592,906 3,975,386
Gross Profit 546,403 559,971 611,396 689,096 783,039 893,625
Operating Income 275,943 261,699 285,890 341,796 411,598 491,986
Net Income 179,293 164,889 181,559 218,768 264,471 317,351
Adjusted Income 176,276 164,889 181,559 218,768 264,471 317,351
Adjusted EPS 6.53 6.30 7.05 8.63 10.59 12.92
Adjusted EBITDA 400,052 395,536 432,007 500,607 584,057 680,817
Growth (% YoY)
Rev enue 11.5% 6.0% 8.0% 9.5% 9.5% 9.7% 10.6% 9.5%
Gross Profit 9.2% -0.2% 2.5% 9.2% 12.7% 13.6% 14.1% 10.3%
Operating Income 7.8% -10.9% -5.2% 9.2% 19.6% 20.4% 19.5% 12.3%
Net Income 9.7% -8.6% -8.0% 10.1% 20.5% 20.9% 20.0% 12.1%
Adjusted EPS 12.8% 0.4% -3.5% 11.8% 22.4% 22.8% 21.9% 14.6%
Adjusted EBITDA 10.0% -3.9% -1.1% 9.2% 15.9% 16.7% 16.6% 11.2%
Profitability (%)
Gross Margin 22.7% 21.6% 20.5% 20.4% 21.0% 21.8% 22.5% 21.3%
Operating Margin 12.4% 10.9% 9.6% 9.6% 10.4% 11.5% 12.4% 10.7%
Net Margin 7.8% 7.1% 6.0% 6.1% 6.7% 7.4% 8.0% 6.8%
Adjusted EBITDA Margin 16.9% 15.8% 14.5% 14.4% 15.3% 16.3% 17.1% 15.5%
Return on Equity 24.7% 25.0% 21.5% 20.9% 22.1% 23.4% 25.1% 22.6%
Adjusted ROIC 15.3% 12.9% 11.0% 10.9% 11.9% 13.0% 14.2% 12.2%
Adjusted RONIC 6.7% -13.6% -5.8% 11.7% 21.7% 25.4% 28.8% 16.3%
Leverage
Debt / Capital 4.0% 12.0% 11.1% 9.7% 8.7% 7.7% 7.0% 8.8%
Debt / EBITDA 0.1 0.2 0.3 0.2 0.2 0.2 0.1 0.2
EBITDA / Interest Ex pense 320.0 219.3 200.8 219.3 254.1 296.5 345.6 263.3
FCFE / Total Debt 1.11 0.88 1.29 1.76 2.24 2.90 1.82
Cash Flow
Div idends per Share 0.00 0.00 0.00 0.00 0.00 3.23
Free Cash Flow to the Firm 112,811 85,593 128,144 175,961 224,087 292,791
FCFE (CFO-Capex ) 110,862 88,229 129,249 176,254 223,723 290,378
Div idend Franking 0.0% 0.0% 0.0% 0.0% 0.0% 0.0%
Div idend Pay out Ratio 0.0% 0.0% 0.0% 0.0% 0.0% 25.0%
3.5% 1.4% 3.0% 4.0% 4.0% 4.5% 4.0% 3.9%
2.6% 0.9% 2.6% 4.0% 4.0% 4.5% 4.0% 3.8%
7.7% 925 983 1,043 1,098 1,153 1,203 5.4%
6.0% 955 1,002 1,065 1,133 1,206 1,284 6.1%
6.9% 1,880 1,985 2,108 2,231 2,359 2,487 5.8%
Franchised-Operated Bakery -Cafés, End of Period
Consolidated Bakery -Caféss, End of Period
Comparable Franchised-Operated Bakery -Café Sales Grow th
Company -Ow ned Bakery -Cafés, End of Period
Panera Bread Company (PNRA)
Restaurants
All values (except per share
amounts) in: USD Thousands
Company-Specific Metrics
Comparable Company -Ow ned Bakery -Café Sales Grow th
Consumer Observer | 9 April 2015
Healthcare Observer | 14 April 2015
Page 71 of 86
Page 71 of 86
Executive Summary
Although rivalry among quick-service restaurants is on the rise globally, we believe Yum Brands offers
one of the more intriguing global growth stories in our consumer coverage universe. Our optimism stems
from a narrow economic moat derived from strong brand intangible assets in KFC, Pizza Hut, and Taco
Bell as well as a scalable franchise business model. With Greg Creed assuming the reins from longtime
CEO David Novak at the beginning of 2015, we believe Yum's playbook will remain the same: Combine
unit growth and same-store sales layers to drive systemwide sales, increase operating leverage, and
bolster returns on capital. This approach has served Yum well in the past and should help the company
withstand an evolving restaurant category marked by new sources of competition and changing
consumer preferences and tastes.
Key Investment Considerations
× Yum China comps will remain under pressure in early 2015 amid negative publicity tied to concerns
about one of the region's key beef and poultry suppliers, but we believe its brands can withstand these
issues through quality-assurance marketing and menu revamps. We remain optimistic about Yum
China's long-term potential due to an established distribution infrastructure and local site development
teams, and we generally find management's division goal of 20% restaurant margins and 15%
normalized operating income growth reachable through low-double-digit unit growth, midteen system
sales growth, and moderate G&A expense leverage, partly tempered by promotional activity and labor
cost inflation.
× Separating Yum's China division has some merit, as we've long thought that Yum was much more than a
China growth story and believe that separation would allow investors to tailor their exposure to China
and Yum's other emerging markets. Additionally, last year's corporate restructuring—where operations
outside China and India were consolidated at the KFC, Pizza Hut, and Taco Bell brand level—has helped
improve the focus of the different brand management teams (KFC outside of China in particular) and
made these segments less dependent on Yum China. Based on the reorganization and that Yum China is
a mostly self-contained supply chain, distribution, site selection, and advertising ecosystem, we believe
a separation would be relatively seamless from an operating perspective and would not sacrifice
meaningful scale advantages.
× With roughly 40% of Yum's operating income coming from China, the stock is tied to market perceptions
of macro and consumer trends in the region. However, we view Yum as more than a China story and
encourage investors to evaluate Yum's other divisions. With KFC, Pizza Hut, and Taco Bell consolidated
by brand in every region except China and India, we have started to see increased unit and comp growth
with margin expansion via centralized brand support and sharing best practices across regions. Coupled
with a goal of 95% system franchisee ownership by 2017 (excluding China and India), we view
management's long-term goal of companywide 10% operating income growth as achievable.
Yum Brands: Is a Separation of Yum China Inevitable?
Economic Moat Narrow
Moat Trend Stable
Morningstar Rating QQQQ
Fair Value Estimate $88
Current Price $80
Price/Fair Value 0.89
Uncertainty Rating Medium
Market Cap ($ Billion) 33.9
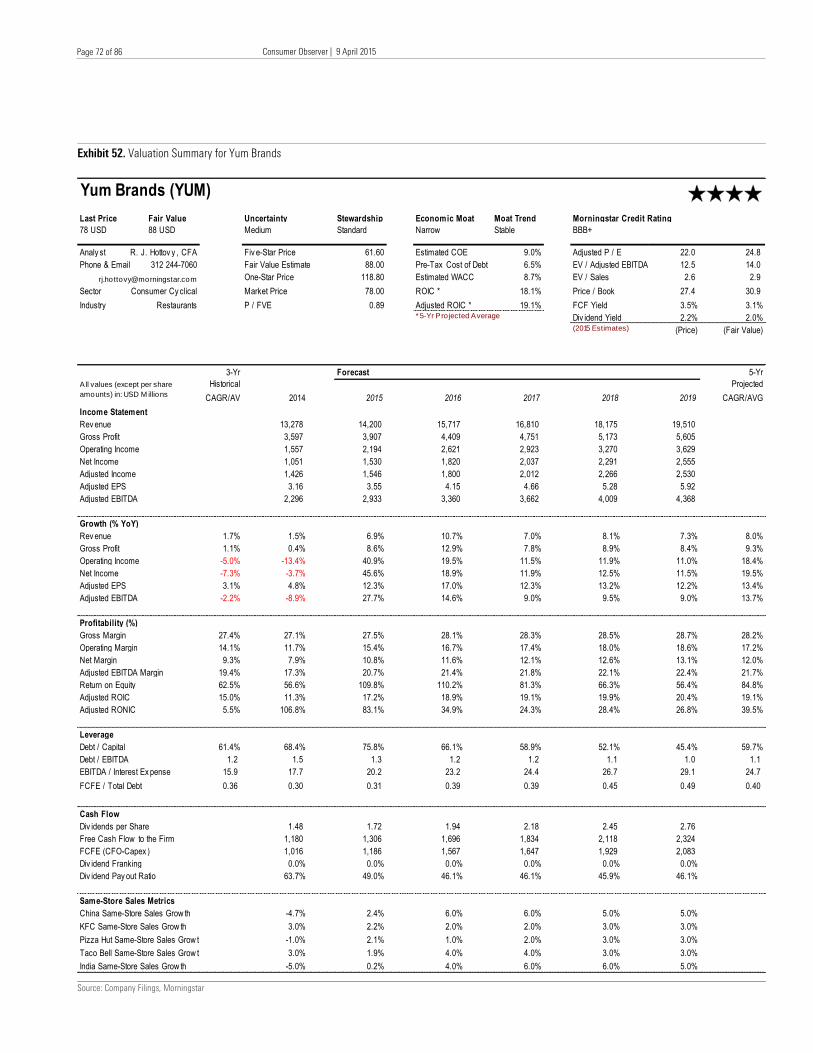
Consumer Observer | 9 April 2015
Healthcare Observer | 14 April 2015
Page 72 of 86
Page 72 of 86
Exhibit 52. Valuation Summary for Yum Brands
Source: Company Filings, Morningstar
Last Price Fair Value Uncertainty Stewardship Economic Moat Moat Trend Morningstar Credit Rating
78 USD 88 USD Medium Standard Narrow Stable BBB+
Analy st R. J. Hottov y , CFA Fiv e-Star Price 61.60 Estimated COE 9.0% Adjusted P / E 22.0 24.8
Phone & Email 312 244-7060 Fair Value Estimate 88.00 Pre-Tax Cost of Debt 6.5% EV / Adjusted EBITDA 12.5 14.0
[email protected] One-Star Price 118.80 Estimated WACC 8.7% EV / Sales 2.6 2.9
Sector Consumer Cy clical Market Price 78.00 ROIC * 18.1% Price / Book 27.4 30.9
Industry P / FVE 0.89 Adjusted ROIC * 19.1% FCF Yield 3.5% 3.1%* 5-Yr Pro jected Average Div idend Yield 2.2% 2.0%
(2015 Estimates) (Price) (Fair Value)
3-Yr Forecast 5-Yr
Historical
CAGR/AV 2014 2015 2016 2017 2018 2019
Projected
CAGR/AVG
Income Statement
Rev enue 13,278 14,200 15,717 16,810 18,175 19,510
Gross Profit 3,597 3,907 4,409 4,751 5,173 5,605
Operating Income 1,557 2,194 2,621 2,923 3,270 3,629
Net Income 1,051 1,530 1,820 2,037 2,291 2,555
Adjusted Income 1,426 1,546 1,800 2,012 2,266 2,530
Adjusted EPS 3.16 3.55 4.15 4.66 5.28 5.92
Adjusted EBITDA 2,296 2,933 3,360 3,662 4,009 4,368
Growth (% YoY)
Rev enue 1.7% 1.5% 6.9% 10.7% 7.0% 8.1% 7.3% 8.0%
Gross Profit 1.1% 0.4% 8.6% 12.9% 7.8% 8.9% 8.4% 9.3%
Operating Income -5.0% -13.4% 40.9% 19.5% 11.5% 11.9% 11.0% 18.4%
Net Income -7.3% -3.7% 45.6% 18.9% 11.9% 12.5% 11.5% 19.5%
Adjusted EPS 3.1% 4.8% 12.3% 17.0% 12.3% 13.2% 12.2% 13.4%
Adjusted EBITDA -2.2% -8.9% 27.7% 14.6% 9.0% 9.5% 9.0% 13.7%
Profitability (%)
Gross Margin 27.4% 27.1% 27.5% 28.1% 28.3% 28.5% 28.7% 28.2%
Operating Margin 14.1% 11.7% 15.4% 16.7% 17.4% 18.0% 18.6% 17.2%
Net Margin 9.3% 7.9% 10.8% 11.6% 12.1% 12.6% 13.1% 12.0%
Adjusted EBITDA Margin 19.4% 17.3% 20.7% 21.4% 21.8% 22.1% 22.4% 21.7%
Return on Equity 62.5% 56.6% 109.8% 110.2% 81.3% 66.3% 56.4% 84.8%
Adjusted ROIC 15.0% 11.3% 17.2% 18.9% 19.1% 19.9% 20.4% 19.1%
Adjusted RONIC 5.5% 106.8% 83.1% 34.9% 24.3% 28.4% 26.8% 39.5%
Leverage
Debt / Capital 61.4% 68.4% 75.8% 66.1% 58.9% 52.1% 45.4% 59.7%
Debt / EBITDA 1.2 1.5 1.3 1.2 1.2 1.1 1.0 1.1
EBITDA / Interest Ex pense 15.9 17.7 20.2 23.2 24.4 26.7 29.1 24.7
FCFE / Total Debt 0.36 0.30 0.31 0.39 0.39 0.45 0.49 0.40
Cash Flow
Div idends per Share 1.48 1.72 1.94 2.18 2.45 2.76
Free Cash Flow to the Firm 1,180 1,306 1,696 1,834 2,118 2,324
FCFE (CFO-Capex ) 1,016 1,186 1,567 1,647 1,929 2,083
Div idend Franking 0.0% 0.0% 0.0% 0.0% 0.0% 0.0%
Div idend Pay out Ratio 63.7% 49.0% 46.1% 46.1% 45.9% 46.1%
-4.7% 2.4% 6.0% 6.0% 5.0% 5.0%
3.0% 2.2% 2.0% 2.0% 3.0% 3.0%
-1.0% 2.1% 1.0% 2.0% 3.0% 3.0%
3.0% 1.9% 4.0% 4.0% 3.0% 3.0%
-5.0% 0.2% 4.0% 6.0% 6.0% 5.0%
KFC Same-Store Sales Grow th
Pizza Hut Same-Store Sales Grow th
Yum Brands (YUM)
Restaurants
All values (except per share
amounts) in: USD M illions
Same-Store Sales Metrics
China Same-Store Sales Grow th
Taco Bell Same-Store Sales Grow th
India Same-Store Sales Grow th
Consumer Observer | 9 April 2015
Healthcare Observer | 14 April 2015
Page 73 of 86
Page 73 of 86
Executive Summary
We view Starbucks as one of the most compelling growth stories in the consumer space today, poised
for top-line growth and margin expansion through menu innovations, sustainable cost advantages, and
its evolution into a diversified retail and consumer packaged goods platform. Although it is already the
leading specialty coffee retailer in the U.S., we believe Starbucks has meaningful domestic growth
potential, including new store formats (including smaller-format express stores, drive-thrus, beverage
trucks, and square footage reallocation for its premium Starbucks Reserve sub-brand), greater peak-hour
capacity, expanded food offerings, lunch and evening daypart expansion, mobile payments and delivery,
and My Starbucks Rewards usage. At a time when most restaurants and retailers are struggling to
stimulate traffic growth, Starbucks' recent transaction gains suggest that it remains a key consumer
destination, validating the strength of its brand intangible asset. Starbucks is much more than a retail
story, however, and we believe the company is just starting to scratch the surface of its longer-term
channel development, brand diversification, and geographic expansion potential. Many of Starbucks'
core retail competitive advantages should extend into these efforts, putting the company in a unique
position to capture retail and wholesale market share.
Key Investment Considerations
× We believe Starbucks is capitalizing its various moat sources to build a longer-term channel, geographic,
and brand extension growth story. These examples includes prioritizing the aspects of the business with
the greatest pricing power (including the introduction of the Starbucks Reserve premium sub-brand and
greater emphasis on the tea category) and new mobile technologies (including the potentially game-
changing "Mobile Order & Pay" and delivery innovations), each which should help to preserve brand
intangible asset and maintain Starbucks' position as a destination store in a time of declining retail
traffic. In addition, management's commitment to increasing the leverage inherent in its model through
supply chain, sourcing, and product and store mix enhancements should strengthen its cost advantage
moat source, and when combined with top-line drivers, drive ROIC north of 30% over the next ten years.
× Among its more emergent brands, management has put the most near-term emphasis on Teavana,
which we believe makes prudent sense given the vast market opportunity. Euromonitor estimates that
the global tea category, which represented approximately 9% of Starbucks' system sales in fiscal 2014,
will grow from $109 billion in 2013 to $143 billion in 2017 (representing a CAGR of 7%), making the
category larger than the global coffee market, which is expected to grow from $86 billion to $104 billion
(a 5% CAGR). Much like its proven strategy in coffee, management plans to embark on a multichannel
strategy to further penetrate the category, using its own Starbucks locations, the domestic and
international grocery and mass channel, and gradual rollout of Teavana tea bar concept to build market
share.
Starbucks Revolutionized Specialty Coffee—Is Tea Next?
Economic Moat Wide
Moat Trend Positive
Morningstar Rating QQQ
Fair Value Estimate $50
Current Price $48
Price/Fair Value 0.95
Uncertainty Rating Medium
Market Cap ($ Billion) 71.4
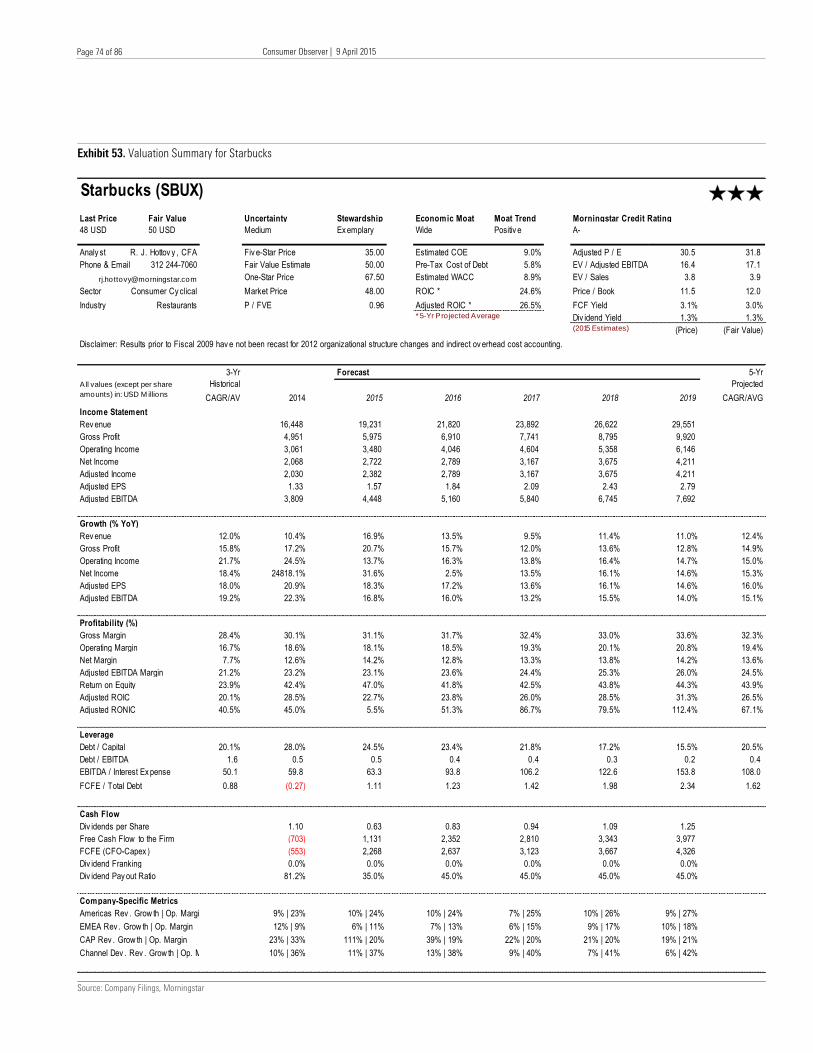
Consumer Observer | 9 April 2015
Healthcare Observer | 14 April 2015
Page 74 of 86
Page 74 of 86
Exhibit 53. Valuation Summary for Starbucks
Source: Company Filings, Morningstar
Last Price Fair Value Uncertainty Stewardship Economic Moat Moat Trend Morningstar Credit Rating
48 USD 50 USD Medium Ex emplary Wide Positiv e A-
Analy st R. J. Hottov y , CFA Fiv e-Star Price 35.00 Estimated COE 9.0% Adjusted P / E 30.5 31.8
Phone & Email 312 244-7060 Fair Value Estimate 50.00 Pre-Tax Cost of Debt 5.8% EV / Adjusted EBITDA 16.4 17.1
[email protected] One-Star Price 67.50 Estimated WACC 8.9% EV / Sales 3.8 3.9
Sector Consumer Cy clical Market Price 48.00 ROIC * 24.6% Price / Book 11.5 12.0
Industry P / FVE 0.96 Adjusted ROIC * 26.5% FCF Yield 3.1% 3.0%* 5-Yr Pro jected Average Div idend Yield 1.3% 1.3%
(2015 Estimates) (Price) (Fair Value)
Disclaimer: Results prior to Fiscal 2009 hav e not been recast for 2012 organizational structure changes and indirect ov erhead cost accounting.
3-Yr Forecast 5-Yr
Historical
CAGR/AV 2014 2015 2016 2017 2018 2019
Projected
CAGR/AVG
Income Statement
Rev enue 16,448 19,231 21,820 23,892 26,622 29,551
Gross Profit 4,951 5,975 6,910 7,741 8,795 9,920
Operating Income 3,061 3,480 4,046 4,604 5,358 6,146
Net Income 2,068 2,722 2,789 3,167 3,675 4,211
Adjusted Income 2,030 2,382 2,789 3,167 3,675 4,211
Adjusted EPS 1.33 1.57 1.84 2.09 2.43 2.79
Adjusted EBITDA 3,809 4,448 5,160 5,840 6,745 7,692
Growth (% YoY)
Rev enue 12.0% 10.4% 16.9% 13.5% 9.5% 11.4% 11.0% 12.4%
Gross Profit 15.8% 17.2% 20.7% 15.7% 12.0% 13.6% 12.8% 14.9%
Operating Income 21.7% 24.5% 13.7% 16.3% 13.8% 16.4% 14.7% 15.0%
Net Income 18.4% 24818.1% 31.6% 2.5% 13.5% 16.1% 14.6% 15.3%
Adjusted EPS 18.0% 20.9% 18.3% 17.2% 13.6% 16.1% 14.6% 16.0%
Adjusted EBITDA 19.2% 22.3% 16.8% 16.0% 13.2% 15.5% 14.0% 15.1%
Profitability (%)
Gross Margin 28.4% 30.1% 31.1% 31.7% 32.4% 33.0% 33.6% 32.3%
Operating Margin 16.7% 18.6% 18.1% 18.5% 19.3% 20.1% 20.8% 19.4%
Net Margin 7.7% 12.6% 14.2% 12.8% 13.3% 13.8% 14.2% 13.6%
Adjusted EBITDA Margin 21.2% 23.2% 23.1% 23.6% 24.4% 25.3% 26.0% 24.5%
Return on Equity 23.9% 42.4% 47.0% 41.8% 42.5% 43.8% 44.3% 43.9%
Adjusted ROIC 20.1% 28.5% 22.7% 23.8% 26.0% 28.5% 31.3% 26.5%
Adjusted RONIC 40.5% 45.0% 5.5% 51.3% 86.7% 79.5% 112.4% 67.1%
Leverage
Debt / Capital 20.1% 28.0% 24.5% 23.4% 21.8% 17.2% 15.5% 20.5%
Debt / EBITDA 1.6 0.5 0.5 0.4 0.4 0.3 0.2 0.4
EBITDA / Interest Ex pense 50.1 59.8 63.3 93.8 106.2 122.6 153.8 108.0
FCFE / Total Debt 0.88 (0.27) 1.11 1.23 1.42 1.98 2.34 1.62
Cash Flow
Div idends per Share 1.10 0.63 0.83 0.94 1.09 1.25
Free Cash Flow to the Firm (703) 1,131 2,352 2,810 3,343 3,977
FCFE (CFO-Capex ) (553) 2,268 2,637 3,123 3,667 4,326
Div idend Franking 0.0% 0.0% 0.0% 0.0% 0.0% 0.0%
Div idend Pay out Ratio 81.2% 35.0% 45.0% 45.0% 45.0% 45.0%
9% | 23% 10% | 24% 10% | 24% 7% | 25% 10% | 26% 9% | 27%
12% | 9% 6% | 11% 7% | 13% 6% | 15% 9% | 17% 10% | 18%
23% | 33% 111% | 20% 39% | 19% 22% | 20% 21% | 20% 19% | 21%
10% | 36% 11% | 37% 13% | 38% 9% | 40% 7% | 41% 6% | 42%
EMEA Rev . Grow th | Op. Margin
CAP Rev . Grow th | Op. Margin
Starbucks (SBUX)
Restaurants
All values (except per share
amounts) in: USD M illions
Company-Specific Metrics
Americas Rev . Grow th | Op. Margin
Channel Dev . Rev . Grow th | Op. Margin
Consumer Observer | 9 April 2015
Healthcare Observer | 14 April 2015
Page 75 of 86
Page 75 of 86
Executive Summary
The consolidation of Burger King and Tim Hortons franchisee systems as Restaurant Brands International
creates the third-largest global quick-service restaurant chain, with meaningful unit growth and cost
reduction opportunities, as well as the potential to add to its house of brands over time. As the
integration process gets underway, we believe the company's priorities are relatively straightforward:
Combine unit growth and same-store sales layers to drive systemwide sales, optimize its corporate cost
structure, and bolster franchisee returns. We also believe this combination will better-position both
brands to weather the evolving restaurant landscape, highlighted by struggling industry leader
McDonald's, the increased popularity of fast-casual concepts, and the rapid retail and wholesale growth
of specialty coffee players like Starbucks and Dunkin' Brands.
Key Investment Considerations
× Despite plans to manage the Burger King and Tim Hortons brands independently, we see several
similarities among the four pillars underpinning Burger King's "menu/marketing
communications/image/operations" strategic vision and components of the five-year plan Tim Hortons
unveiled in February 2014, which focused on brand awareness and guest experience investments;
increased use of technology as a customer acquisition, throughput, and marketing tool; international
expansion; and channel diversification efforts.
× We share management's view that 3G's master franchise joint venture structure provides the company
with the means to accelerate Tim Hortons' unit growth. As part of its global portfolio realignment
initiative, the company assigned master franchise rights to a combination of local operating and private-
equity financing partners in emerging markets like Brazil, Russia, China (and more recently in India,
France, and South Africa) in return for significant minority interest stakes, some governance rights, and
a say in local marketing and operations. We consider these partners--including Vinci Partners in Brazil,
Burger Rus in Russia (which was also behind Russia coffee chain Shokoladnitsa), and the Kordoglu
family/Cartesian Capital Group consortium in China--to be sound operators possessing extensive local
market expertise and access to capital, which should position the Burger King system for longer-term
unit growth in the mid-single-digit range (versus pre-acquisition growth trends in the low-single-digit
range).
× While the incremental leverage taken on as a part of the Tim Hortons transaction limits near-term
acquisitions, we would not be surprised to see the company explore other brand partnerships to develop
a more comprehensive brand portfolio over time. Evaluating the company's current franchise ownership
and geographic mix, a pizza or emergent fast-casual concept could make for an interesting acquisition
target, though we would be surprised if the company made a large acquisition in 2015.
Restaurant Brands International Is Ahead of the Refranchising Trend; Who's Next to Join the Portfolio?
Economic Moat Narrow
Moat Trend Negative
Morningstar Rating QQQ
Fair Value Estimate $40
Current Price $39
Price/Fair Value 0.97
Uncertainty Rating Medium
Market Cap ($ Billion) 18.1
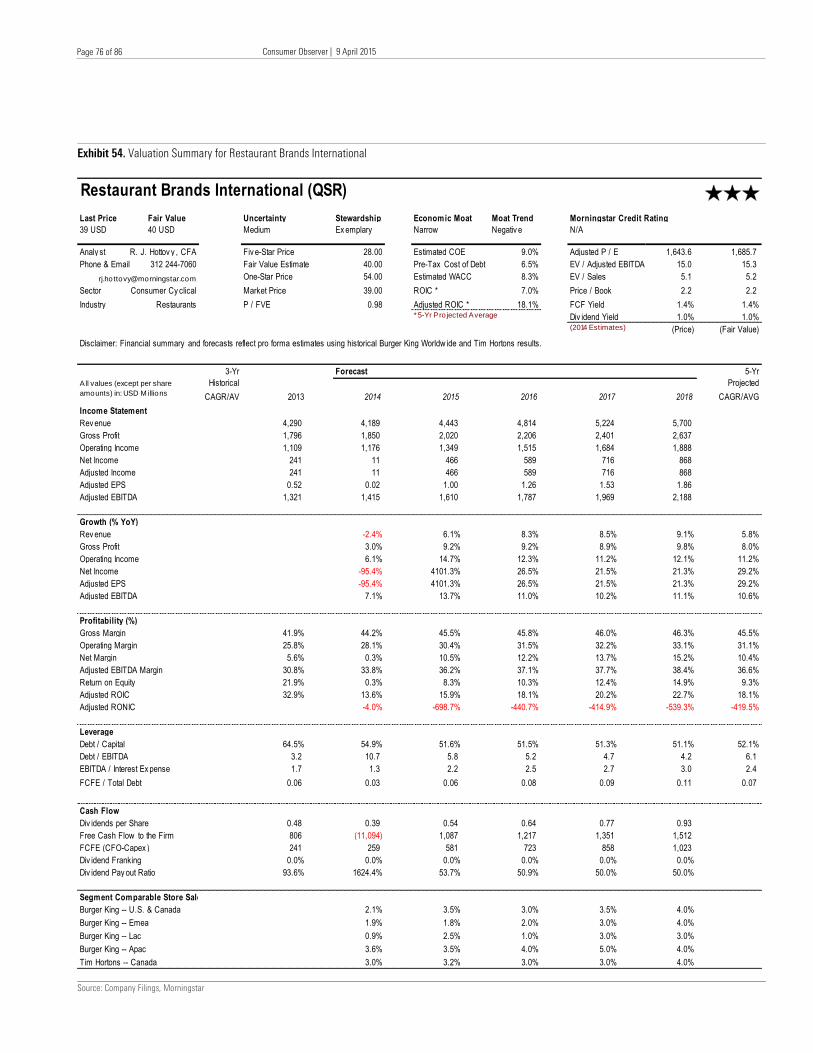
Consumer Observer | 9 April 2015
Healthcare Observer | 14 April 2015
Page 76 of 86
Page 76 of 86
Exhibit 54. Valuation Summary for Restaurant Brands International
Source: Company Filings, Morningstar
Last Price Fair Value Uncertainty Stewardship Economic Moat Moat Trend Morningstar Credit Rating
39 USD 40 USD Medium Ex emplary Narrow Negativ e N/A
Analy st R. J. Hottov y , CFA Fiv e-Star Price 28.00 Estimated COE 9.0% Adjusted P / E 1,643.6 1,685.7
Phone & Email 312 244-7060 Fair Value Estimate 40.00 Pre-Tax Cost of Debt 6.5% EV / Adjusted EBITDA 15.0 15.3
[email protected] One-Star Price 54.00 Estimated WACC 8.3% EV / Sales 5.1 5.2
Sector Consumer Cy clical Market Price 39.00 ROIC * 7.0% Price / Book 2.2 2.2
Industry P / FVE 0.98 Adjusted ROIC * 18.1% FCF Yield 1.4% 1.4%* 5-Yr Pro jected Average Div idend Yield 1.0% 1.0%
(2014 Estimates) (Price) (Fair Value)
Disclaimer: Financial summary and forecasts reflect pro forma estimates using historical Burger King Worldw ide and Tim Hortons results.
3-Yr Forecast 5-Yr
Historical
CAGR/AV 2013 2014 2015 2016 2017 2018
Projected
CAGR/AVG
Income Statement
Rev enue 4,290 4,189 4,443 4,814 5,224 5,700
Gross Profit 1,796 1,850 2,020 2,206 2,401 2,637
Operating Income 1,109 1,176 1,349 1,515 1,684 1,888
Net Income 241 11 466 589 716 868
Adjusted Income 241 11 466 589 716 868
Adjusted EPS 0.52 0.02 1.00 1.26 1.53 1.86
Adjusted EBITDA 1,321 1,415 1,610 1,787 1,969 2,188
Growth (% YoY)
Rev enue -2.4% 6.1% 8.3% 8.5% 9.1% 5.8%
Gross Profit 3.0% 9.2% 9.2% 8.9% 9.8% 8.0%
Operating Income 6.1% 14.7% 12.3% 11.2% 12.1% 11.2%
Net Income -95.4% 4101.3% 26.5% 21.5% 21.3% 29.2%
Adjusted EPS -95.4% 4101.3% 26.5% 21.5% 21.3% 29.2%
Adjusted EBITDA 7.1% 13.7% 11.0% 10.2% 11.1% 10.6%
Profitability (%)
Gross Margin #DIV/0! 41.9% 44.2% 45.5% 45.8% 46.0% 46.3% 45.5%
Operating Margin #DIV/0! 25.8% 28.1% 30.4% 31.5% 32.2% 33.1% 31.1%
Net Margin #DIV/0! 5.6% 0.3% 10.5% 12.2% 13.7% 15.2% 10.4%
Adjusted EBITDA Margin #DIV/0! 30.8% 33.8% 36.2% 37.1% 37.7% 38.4% 36.6%
Return on Equity #DIV/0! 21.9% 0.3% 8.3% 10.3% 12.4% 14.9% 9.3%
Adjusted ROIC #DIV/0! 32.9% 13.6% 15.9% 18.1% 20.2% 22.7% 18.1%
Adjusted RONIC #DIV/0! -4.0% -698.7% -440.7% -414.9% -539.3% -419.5%
Leverage
Debt / Capital 64.5% 54.9% 51.6% 51.5% 51.3% 51.1% 52.1%
Debt / EBITDA 3.2 10.7 5.8 5.2 4.7 4.2 6.1
EBITDA / Interest Ex pense 1.7 1.3 2.2 2.5 2.7 3.0 2.4
FCFE / Total Debt 0.06 0.03 0.06 0.08 0.09 0.11 0.07
Cash Flow
Div idends per Share 0.48 0.39 0.54 0.64 0.77 0.93
Free Cash Flow to the Firm 806 (11,094) 1,087 1,217 1,351 1,512
FCFE (CFO-Capex ) 241 259 581 723 858 1,023
Div idend Franking 0.0% 0.0% 0.0% 0.0% 0.0% 0.0%
Div idend Pay out Ratio 93.6% 1624.4% 53.7% 50.9% 50.0% 50.0%
2.1% 3.5% 3.0% 3.5% 4.0%
1.9% 1.8% 2.0% 3.0% 4.0%
0.9% 2.5% 1.0% 3.0% 3.0%
3.6% 3.5% 4.0% 5.0% 4.0%
3.0% 3.2% 3.0% 3.0% 4.0%
Burger King -- Apac
Tim Hortons -- Canada
Burger King -- Emea
Burger King -- Lac
Restaurant Brands International (QSR)
Restaurants
All values (except per share
amounts) in: USD M illions
Segment Comparable Store Sales Metrics
Burger King -- U.S. & Canada
Consumer Observer | 9 April 2015
Healthcare Observer | 14 April 2015
Page 77 of 86
Page 77 of 86
Executive Summary
After an impressive eight-year run from 2004 to 2011 highlighted by average annual global comparable
sales growth of 5.6% and roughly 1,500 basis points of operating margin expansion to north of 31%,
McDonald's fundamentals have weakened amid increased competition, self-inflicted product pipeline
and marketing issues, a tepid macro environment, and evolving consumer preferences. To confront these
challenges, management has unveiled a global approach "to increase its relevance with customers and
drive guest traffic," including a more modern restaurant experience and a comprehensive digital
ordering, payments, and marketing strategy. McDonald's also outlined new initiatives designed to
improve U.S. operations, including a more nimble organization with decisions made closer to the
customer at the local and regional level; revamped marketing that emphasizes food quality; and a
simplified yet customizable menu that balances core items and locally relevant options. While we view
each of these initiatives as appropriate, execution and timing remain questions, and investors should not
expect an overnight turnaround.
Key Investment Considerations
× Recently appointed CEO Steve Easterbrook envisions himself as an "internal activist," and is reportedly
open to "all options" to improve shareholder value. We would not be surprised to see even greater menu
rationalization efforts over the near term, with more aggressive refranchising efforts or potential real
estate transactions evaluated as ways to unlock shareholder value. Although McDonald's management
has historically rebuffed potential real estate proposals, its views on REITs appear to be shifting
somewhat, with Chief Administrative Officer Pete Bensen noting at a March investor conference that
management is "constantly challenging its thinking on the REIT (structure)" and "always looking as ways
to continue to increase value."
× We also appreciate McDonald's aspirations to becoming a more nimble organization, particularly with
respect to making more menu and marketing decisions at the local and regional level. Although we
consider McDonald's size and scale to be a key competitive advantage--the foundation of our cost
advantage moat source--questions about the agility of its supply chain have surfaced in recent years,
especially in a restaurant industry experiencing changing taste preferences at a local and regional level,
a more pronounced consumer shift toward healthier foods, and fast-casual players reaching critical
mass. There have been instances when competitors have been able to bring new products to market
more rapidly than McDonald's because of raw material procurement constraints, but we are hopeful that
localized menu decisions will help to alleviate some bottlenecks in the system and level the playing field
somewhat. Nevertheless, this process will probably take time to iron out between key suppliers, regional
management, and franchisees, and we have not factored in much margin benefit from these efforts over
the next two to three years.
McDonald's: Predicting Easterbrook's 'Internal Activist' Turnaround Blueprint
Economic Moat Wide
Moat Trend Negative
Morningstar Rating QQQ
Fair Value Estimate $98
Current Price $97
Price/Fair Value 0.99
Uncertainty Rating Medium
Market Cap ($ Billion) 93.1
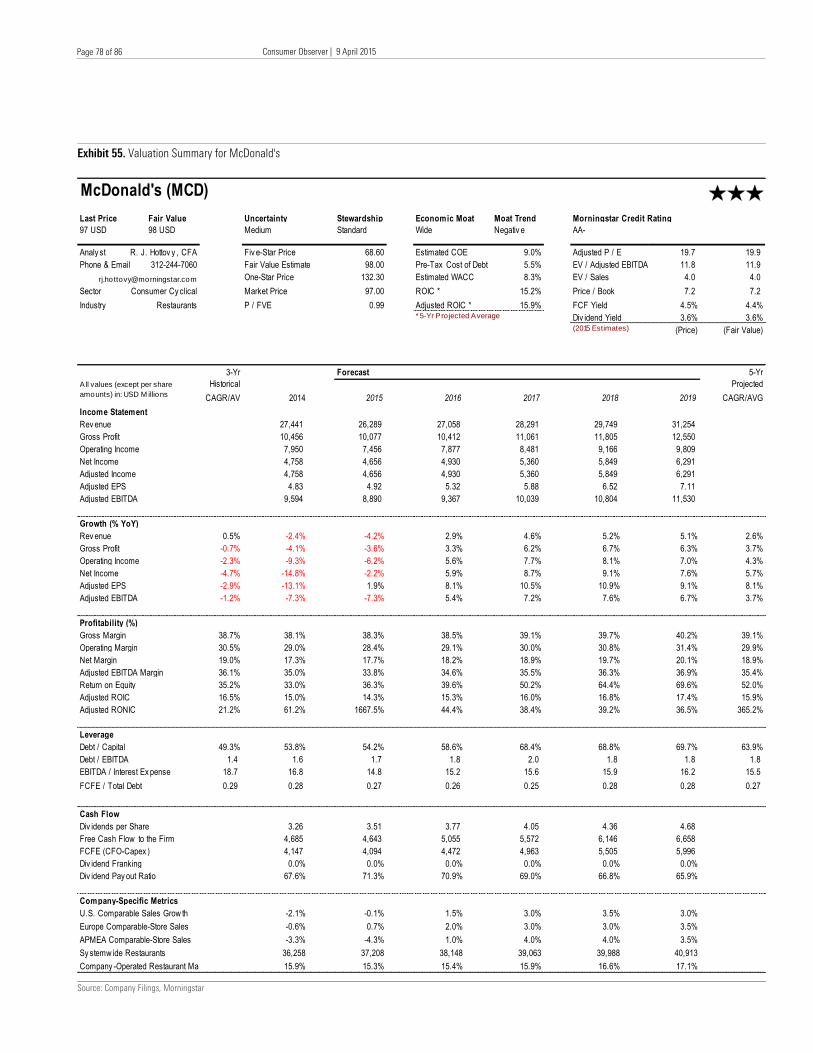
Consumer Observer | 9 April 2015
Healthcare Observer | 14 April 2015
Page 78 of 86
Page 78 of 86
Exhibit 55. Valuation Summary for McDonald's
Source: Company Filings, Morningstar
Last Price Fair Value Uncertainty Stewardship Economic Moat Moat Trend Morningstar Credit Rating
97 USD 98 USD Medium Standard Wide Negativ e AA-
Analy st R. J. Hottov y , CFA Fiv e-Star Price 68.60 Estimated COE 9.0% Adjusted P / E 19.7 19.9
Phone & Email 312-244-7060 Fair Value Estimate 98.00 Pre-Tax Cost of Debt 5.5% EV / Adjusted EBITDA 11.8 11.9
[email protected] One-Star Price 132.30 Estimated WACC 8.3% EV / Sales 4.0 4.0
Sector Consumer Cy clical Market Price 97.00 ROIC * 15.2% Price / Book 7.2 7.2
Industry P / FVE 0.99 Adjusted ROIC * 15.9% FCF Yield 4.5% 4.4%* 5-Yr Pro jected Average Div idend Yield 3.6% 3.6%
(2015 Estimates) (Price) (Fair Value)
3-Yr Forecast 5-Yr
Historical
CAGR/AV 2014 2015 2016 2017 2018 2019
Projected
CAGR/AVG
Income Statement
Rev enue 27,441 26,289 27,058 28,291 29,749 31,254
Gross Profit 10,456 10,077 10,412 11,061 11,805 12,550
Operating Income 7,950 7,456 7,877 8,481 9,166 9,809
Net Income 4,758 4,656 4,930 5,360 5,849 6,291
Adjusted Income 4,758 4,656 4,930 5,360 5,849 6,291
Adjusted EPS 4.83 4.92 5.32 5.88 6.52 7.11
Adjusted EBITDA 9,594 8,890 9,367 10,039 10,804 11,530
Growth (% YoY)
Rev enue 0.5% -2.4% -4.2% 2.9% 4.6% 5.2% 5.1% 2.6%
Gross Profit -0.7% -4.1% -3.6% 3.3% 6.2% 6.7% 6.3% 3.7%
Operating Income -2.3% -9.3% -6.2% 5.6% 7.7% 8.1% 7.0% 4.3%
Net Income -4.7% -14.8% -2.2% 5.9% 8.7% 9.1% 7.6% 5.7%
Adjusted EPS -2.9% -13.1% 1.9% 8.1% 10.5% 10.9% 9.1% 8.1%
Adjusted EBITDA -1.2% -7.3% -7.3% 5.4% 7.2% 7.6% 6.7% 3.7%
Profitability (%)
Gross Margin 38.7% 38.1% 38.3% 38.5% 39.1% 39.7% 40.2% 39.1%
Operating Margin 30.5% 29.0% 28.4% 29.1% 30.0% 30.8% 31.4% 29.9%
Net Margin 19.0% 17.3% 17.7% 18.2% 18.9% 19.7% 20.1% 18.9%
Adjusted EBITDA Margin 36.1% 35.0% 33.8% 34.6% 35.5% 36.3% 36.9% 35.4%
Return on Equity 35.2% 33.0% 36.3% 39.6% 50.2% 64.4% 69.6% 52.0%
Adjusted ROIC 16.5% 15.0% 14.3% 15.3% 16.0% 16.8% 17.4% 15.9%
Adjusted RONIC 21.2% 61.2% 1667.5% 44.4% 38.4% 39.2% 36.5% 365.2%
Leverage
Debt / Capital 49.3% 53.8% 54.2% 58.6% 68.4% 68.8% 69.7% 63.9%
Debt / EBITDA 1.4 1.6 1.7 1.8 2.0 1.8 1.8 1.8
EBITDA / Interest Ex pense 18.7 16.8 14.8 15.2 15.6 15.9 16.2 15.5
FCFE / Total Debt 0.29 0.28 0.27 0.26 0.25 0.28 0.28 0.27
Cash Flow
Div idends per Share 3.26 3.51 3.77 4.05 4.36 4.68
Free Cash Flow to the Firm 4,685 4,643 5,055 5,572 6,146 6,658
FCFE (CFO-Capex ) 4,147 4,094 4,472 4,963 5,505 5,996
Div idend Franking 0.0% 0.0% 0.0% 0.0% 0.0% 0.0%
Div idend Pay out Ratio 67.6% 71.3% 70.9% 69.0% 66.8% 65.9%
-2.1% -0.1% 1.5% 3.0% 3.5% 3.0%
-0.6% 0.7% 2.0% 3.0% 3.0% 3.5%
-3.3% -4.3% 1.0% 4.0% 4.0% 3.5%
36,258 37,208 38,148 39,063 39,988 40,913
15.9% 15.3% 15.4% 15.9% 16.6% 17.1%
Europe Comparable-Store Sales
APMEA Comparable-Store Sales
McDonald's (MCD)
Restaurants
All values (except per share
amounts) in: USD M illions
Company-Specific Metrics
U.S. Comparable Sales Grow th
Sy stemw ide Restaurants
Company -Operated Restaurant Margin Dollars
Consumer Observer | 9 April 2015
Healthcare Observer | 14 April 2015
Page 79 of 86
Page 79 of 86
Executive Summary
With a simple but uniquely customizable menu featuring naturally raised and organic products and
aesthetically pleasing restaurant designs, Chipotle has developed a powerful brand intangible asset, the
basis for our narrow moat rating. In turn, this has helped drive industry-leading comparable sales and
restaurant-level margins during a tepid environment for most industry players. Additionally, by sourcing
from local ranchers and farmers, Chipotle has more clout with suppliers than chains of comparable size.
Although many restaurant concepts have looked promising early before succumbing to overextension or
competition, we are optimistic that Chipotle will continue to balance growth with profitability, creating
excess economic returns in the process.
Key Investment Considerations
× We believe Chipotle has separated itself from its fast-casual peers and can defend market share from
new rivals while maintaining pricing power. This is in large part due to its "Food with Integrity" mantra
(sourcing naturally raised proteins, dairy products from pasture-raised cattle, and organic produce,
which are more costly to source but offer a key source of differentiation), upscale restaurant
environments, and uniquely customizable menu structure, each of which enriches Chipotle's brand
intangible asset moat source.
× In our view, fast-casual restaurants like Chipotle are better equipped to address the specific demands of
a millennial audience. They offer higher-quality ingredients and better menu diversity than quick-service
chains but at lower average prices and greater speed of service than casual-dining restaurants. Chipotle
and many other fast-casual players have also fully embraced digital capabilities such as mobile
payments (with Chipotle likely to adopt Apple Pay sometime in 2015), social media marketing, and usage
of tablets or other handheld devices to augment restaurant operations.
× We assume Chipotle will outgrow its fast-casual peers. If the chain can match the density of its home
market in Denver, we estimate that it could ultimately expand to 4,000 domestic units before nearing
saturation (compared with more than 1,800 today), implying high-single-digit unit growth for at least a
decade. New restaurant prototypes requiring less buildout costs could provide entry into secondary
markets and push this number higher.
× We find Chipotle's secondary concepts (ShopHouse Southeast Asian Kitchen and Pizzeria Locale) and
international plans intriguing—with the possibility to extend its ultimate store base to 5,000-6,000—but
also believe it will take years before these initiatives have a cash flow impact.
Chipotle: Not All Fast-Casual Concepts Are Created Equal
Economic Moat Narrow
Moat Trend Positive
Morningstar Rating QQQ
Fair Value Estimate $650
Current Price $655
Price/Fair Value 1.01
Uncertainty Rating High
Market Cap ($ Billion) 20.3
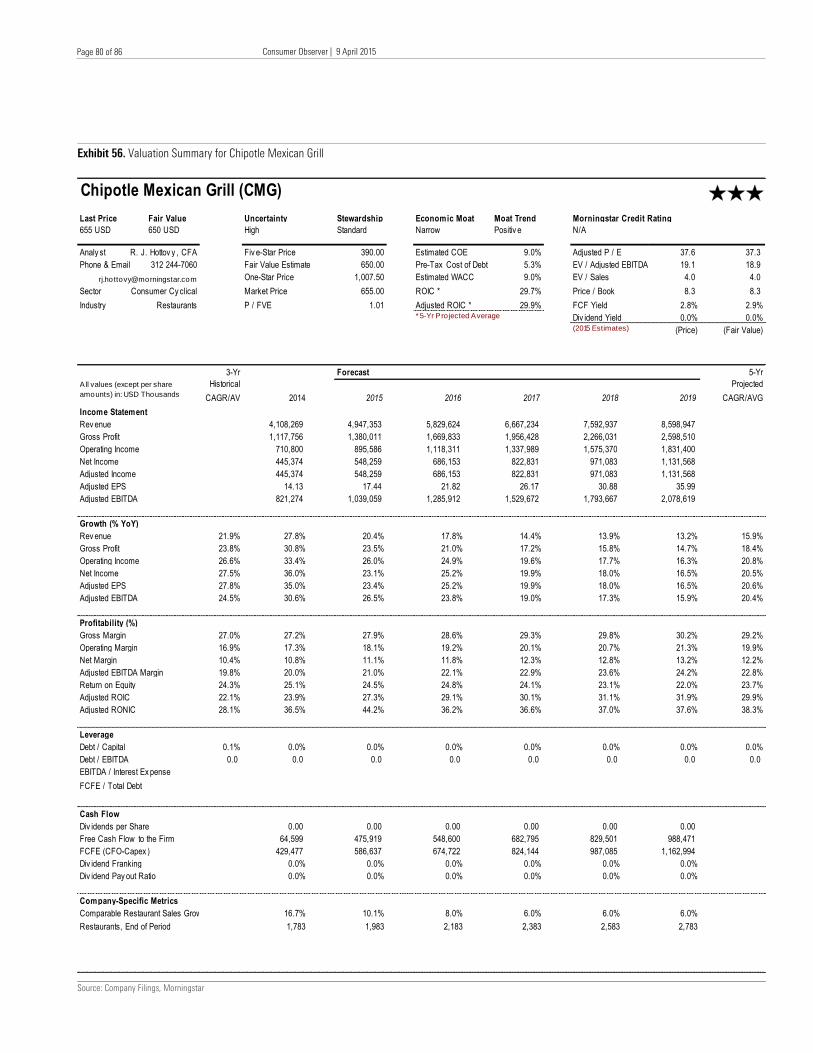
Consumer Observer | 9 April 2015
Healthcare Observer | 14 April 2015
Page 80 of 86
Page 80 of 86
Exhibit 56. Valuation Summary for Chipotle Mexican Grill
Source: Company Filings, Morningstar
Last Price Fair Value Uncertainty Stewardship Economic Moat Moat Trend Morningstar Credit Rating
655 USD 650 USD High Standard Narrow Positiv e N/A
Analy st R. J. Hottov y , CFA Fiv e-Star Price 390.00 Estimated COE 9.0% Adjusted P / E 37.6 37.3
Phone & Email 312 244-7060 Fair Value Estimate 650.00 Pre-Tax Cost of Debt 5.3% EV / Adjusted EBITDA 19.1 18.9
[email protected] One-Star Price 1,007.50 Estimated WACC 9.0% EV / Sales 4.0 4.0
Sector Consumer Cy clical Market Price 655.00 ROIC * 29.7% Price / Book 8.3 8.3
Industry P / FVE 1.01 Adjusted ROIC * 29.9% FCF Yield 2.8% 2.9%* 5-Yr Pro jected Average Div idend Yield 0.0% 0.0%
(2015 Estimates) (Price) (Fair Value)
3-Yr Forecast 5-Yr
Historical
CAGR/AV 2014 2015 2016 2017 2018 2019
Projected
CAGR/AVG
Income Statement
Rev enue 4,108,269 4,947,353 5,829,624 6,667,234 7,592,937 8,598,947
Gross Profit 1,117,756 1,380,011 1,669,833 1,956,428 2,266,031 2,598,510
Operating Income 710,800 895,586 1,118,311 1,337,989 1,575,370 1,831,400
Net Income 445,374 548,259 686,153 822,831 971,083 1,131,568
Adjusted Income 445,374 548,259 686,153 822,831 971,083 1,131,568
Adjusted EPS 14.13 17.44 21.82 26.17 30.88 35.99
Adjusted EBITDA 821,274 1,039,059 1,285,912 1,529,672 1,793,667 2,078,619
Growth (% YoY)
Rev enue 21.9% 27.8% 20.4% 17.8% 14.4% 13.9% 13.2% 15.9%
Gross Profit 23.8% 30.8% 23.5% 21.0% 17.2% 15.8% 14.7% 18.4%
Operating Income 26.6% 33.4% 26.0% 24.9% 19.6% 17.7% 16.3% 20.8%
Net Income 27.5% 36.0% 23.1% 25.2% 19.9% 18.0% 16.5% 20.5%
Adjusted EPS 27.8% 35.0% 23.4% 25.2% 19.9% 18.0% 16.5% 20.6%
Adjusted EBITDA 24.5% 30.6% 26.5% 23.8% 19.0% 17.3% 15.9% 20.4%
Profitability (%)
Gross Margin 27.0% 27.2% 27.9% 28.6% 29.3% 29.8% 30.2% 29.2%
Operating Margin 16.9% 17.3% 18.1% 19.2% 20.1% 20.7% 21.3% 19.9%
Net Margin 10.4% 10.8% 11.1% 11.8% 12.3% 12.8% 13.2% 12.2%
Adjusted EBITDA Margin 19.8% 20.0% 21.0% 22.1% 22.9% 23.6% 24.2% 22.8%
Return on Equity 24.3% 25.1% 24.5% 24.8% 24.1% 23.1% 22.0% 23.7%
Adjusted ROIC 22.1% 23.9% 27.3% 29.1% 30.1% 31.1% 31.9% 29.9%
Adjusted RONIC 28.1% 36.5% 44.2% 36.2% 36.6% 37.0% 37.6% 38.3%
Leverage
Debt / Capital 0.1% 0.0% 0.0% 0.0% 0.0% 0.0% 0.0% 0.0%
Debt / EBITDA 0.0 0.0 0.0 0.0 0.0 0.0 0.0 0.0
EBITDA / Interest Ex pense #DIV/0!
FCFE / Total Debt #DIV/0! #DIV/0! #DIV/0! #DIV/0! #DIV/0! #DIV/0! #DIV/0!
Cash Flow
Div idends per Share 0.00 0.00 0.00 0.00 0.00 0.00
Free Cash Flow to the Firm 64,599 475,919 548,600 682,795 829,501 988,471
FCFE (CFO-Capex ) 429,477 586,637 674,722 824,144 987,085 1,162,994
Div idend Franking 0.0% 0.0% 0.0% 0.0% 0.0% 0.0%
Div idend Pay out Ratio 0.0% 0.0% 0.0% 0.0% 0.0% 0.0%
16.7% 10.1% 8.0% 6.0% 6.0% 6.0%
1,783 1,983 2,183 2,383 2,583 2,783Restaurants, End of Period
Chipotle Mexican Grill (CMG)
Restaurants
All values (except per share
amounts) in: USD Thousands
Company-Specific Metrics
Comparable Restaurant Sales Grow th
Consumer Observer | 9 April 2015
Healthcare Observer | 14 April 2015
Page 81 of 86
Page 81 of 86
Executive Summary
Darden plans to pursue several structural and operational changes after the election of its new
Starboard-controlled board in October 2014, including the appointment of Gene Lee to CEO and other
executive leadership changes, a significant cost-cutting program, and potential transactions for its real
estate assets or Specialty Restaurant Group brands. Near-term priorities include cutting corporate
expenses, reducing food procurement and waste costs, optimizing labor/facilities/advertising costs,
increasing alcoholic beverage sales, and accelerating table turns, which should drive near-term revenue
and margin growth. Management has wasted little time putting these efforts into place, already
announcing a streamlined support staff structure and the elimination of a layer of field management for
Olive Garden and LongHorn.
Key Investment Considerations
× We acknowledge that management, under the stewardship of its new Starboard-led board, is taking
prudent steps to optimize Darden's cost structure and improve restaurant-level operations. We also
expect that Starboard to continue certain aspects of the Olive Garden brand renaissance plan, including
steps to address menu diversity, affordability, speed of service, and digital connectivity issues.
× The board also remains committed to evaluating options for Darden's real estate portfolio, including
sale-leaseback transactions, a REIT spin-off/tax-free merger, and more aggressive
franchising/refranchising efforts. Management noted that it recently engaged in "test-case" sale-
leaseback transactions for 31 properties (most at cap rates below 6%, suggesting that the properties
were sold at high levels). We still have concerns over the valuation that a stand-alone Darden REIT
would fetch, but we concede that a shift to a more capital-friendly franchise ownership structure could
be a way to better monetize Darden's real estate assets and drive longer-term free cash flow growth.
× Additionally, we expect management will look to spin off its SRG brands. We've long since thought these
growth brands (including LongHorn Steakhouse, Capital Grille, Seasons 52, Eddie V's, and Yard House)
offer promising unit potential and should help the company expand its intangible assets beyond its core
baby boomer audience. While we harbor concerns about a potential loss of purchasing, advertising, and
overhead scale by separating these brands, we believe that operating these brands independently of
Olive Garden could accelerate the pace of new openings and improve restaurant productivity metrics..
× Taken together, we expect these strategies to help drive operating margins ahead of casual-dining
industry averages around 7%, but we're concerned that industry dynamics will prevent Darden from
returning to peak levels around 10%. In particular, we believe that disruptions from fast-casual
companies are likely to become more pronounced in the years to come—led by a new class of upscale
fast-casual chains—with Darden requiring lower prices or significant restaurant format changes to keep
pace. We believe the market has fully priced in a good deal of Starboard's top-line growth initiatives,
cost reductions, and strategic actions, and we would exercise caution at current levels.
Starboard-Led Changes Already Priced Into Darden's Stock
Economic Moat None
Moat Trend Stable
Morningstar Rating QQQ
Fair Value Estimate $63
Current Price $67
Price/Fair Value 1.07
Uncertainty Rating High
Market Cap ($ Billion) 8.5
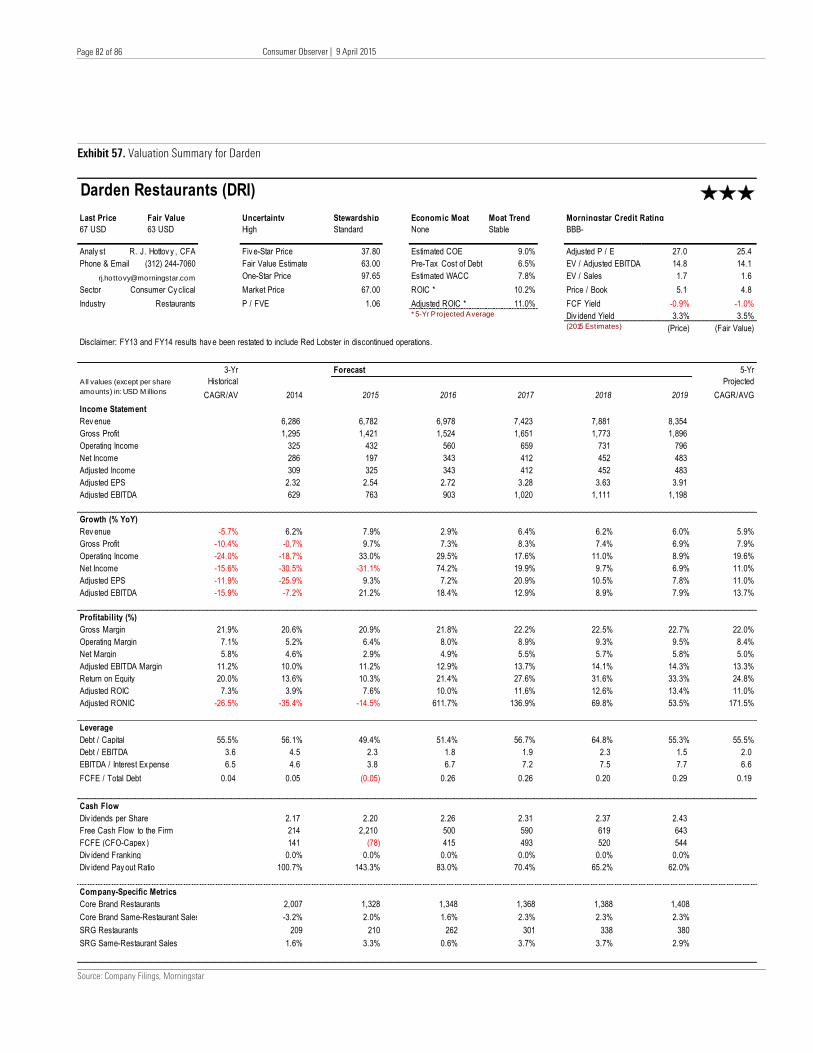
Consumer Observer | 9 April 2015
Healthcare Observer | 14 April 2015
Page 82 of 86
Page 82 of 86
Exhibit 57. Valuation Summary for Darden
Source: Company Filings, Morningstar
Last Price Fair Value Uncertainty Stewardship Economic Moat Moat Trend Morningstar Credit Rating
67 USD 63 USD High Standard None Stable BBB-
Analy st R. J. Hottov y , CFA Fiv e-Star Price 37.80 Estimated COE 9.0% Adjusted P / E 27.0 25.4
Phone & Email (312) 244-7060 Fair Value Estimate 63.00 Pre-Tax Cost of Debt 6.5% EV / Adjusted EBITDA 14.8 14.1
[email protected] One-Star Price 97.65 Estimated WACC 7.8% EV / Sales 1.7 1.6
Sector Consumer Cy clical Market Price 67.00 ROIC * 10.2% Price / Book 5.1 4.8
Industry P / FVE 1.06 Adjusted ROIC * 11.0% FCF Yield -0.9% -1.0%* 5-Yr Pro jected Average Div idend Yield 3.3% 3.5%
(2015 Estimates) (Price) (Fair Value)
Disclaimer: FY13 and FY14 results hav e been restated to include Red Lobster in discontinued operations.
3-Yr Forecast 5-Yr
Historical
CAGR/AV 2014 2015 2016 2017 2018 2019
Projected
CAGR/AVG
Income Statement
Rev enue 6,286 6,782 6,978 7,423 7,881 8,354
Gross Profit 1,295 1,421 1,524 1,651 1,773 1,896
Operating Income 325 432 560 659 731 796
Net Income 286 197 343 412 452 483
Adjusted Income 309 325 343 412 452 483
Adjusted EPS 2.32 2.54 2.72 3.28 3.63 3.91
Adjusted EBITDA 629 763 903 1,020 1,111 1,198
Growth (% YoY)
Rev enue -5.7% 6.2% 7.9% 2.9% 6.4% 6.2% 6.0% 5.9%
Gross Profit -10.4% -0.7% 9.7% 7.3% 8.3% 7.4% 6.9% 7.9%
Operating Income -24.0% -18.7% 33.0% 29.5% 17.6% 11.0% 8.9% 19.6%
Net Income -15.6% -30.5% -31.1% 74.2% 19.9% 9.7% 6.9% 11.0%
Adjusted EPS -11.9% -25.9% 9.3% 7.2% 20.9% 10.5% 7.8% 11.0%
Adjusted EBITDA -15.9% -7.2% 21.2% 18.4% 12.9% 8.9% 7.9% 13.7%
Profitability (%)
Gross Margin 21.9% 20.6% 20.9% 21.8% 22.2% 22.5% 22.7% 22.0%
Operating Margin 7.1% 5.2% 6.4% 8.0% 8.9% 9.3% 9.5% 8.4%
Net Margin 5.8% 4.6% 2.9% 4.9% 5.5% 5.7% 5.8% 5.0%
Adjusted EBITDA Margin 11.2% 10.0% 11.2% 12.9% 13.7% 14.1% 14.3% 13.3%
Return on Equity 20.0% 13.6% 10.3% 21.4% 27.6% 31.6% 33.3% 24.8%
Adjusted ROIC 7.3% 3.9% 7.6% 10.0% 11.6% 12.6% 13.4% 11.0%
Adjusted RONIC -26.5% -35.4% -14.5% 611.7% 136.9% 69.8% 53.5% 171.5%
Leverage
Debt / Capital 55.5% 56.1% 49.4% 51.4% 56.7% 64.8% 55.3% 55.5%
Debt / EBITDA 3.6 4.5 2.3 1.8 1.9 2.3 1.5 2.0
EBITDA / Interest Ex pense 6.5 4.6 3.8 6.7 7.2 7.5 7.7 6.6
FCFE / Total Debt 0.04 0.05 (0.05) 0.26 0.26 0.20 0.29 0.19
Cash Flow
Div idends per Share 2.17 2.20 2.26 2.31 2.37 2.43
Free Cash Flow to the Firm 214 2,210 500 590 619 643
FCFE (CFO-Capex ) 141 (78) 415 493 520 544
Div idend Franking 0.0% 0.0% 0.0% 0.0% 0.0% 0.0%
Div idend Pay out Ratio 100.7% 143.3% 83.0% 70.4% 65.2% 62.0%
2,007 1,328 1,348 1,368 1,388 1,408
-3.2% 2.0% 1.6% 2.3% 2.3% 2.3%
209 210 262 301 338 380
1.6% 3.3% 0.6% 3.7% 3.7% 2.9%SRG Same-Restaurant Sales
Core Brand Same-Restaurant Sales
SRG Restaurants
Darden Restaurants (DRI)
Restaurants
All values (except per share
amounts) in: USD M illions
Company-Specific Metrics
Core Brand Restaurants
Consumer Observer | 9 April 2015
Healthcare Observer | 14 April 2015
Page 83 of 86
Page 83 of 86
Executive Summary
We believe Dunkin' Brands offers investors an intriguing cash flow growth story, backed by the
intangible assets inherent in the Dunkin' Donuts brand and a cohesive franchisee system, particularly in
the northeastern United States. We believe Dunkin' can extend its brand reach beyond its core markets,
supported by improving franchisee returns in more nascent markets stemming from better site selection,
national advertising, higher-margin products, and flat national pricing for raw materials. Improved
franchisee metrics, including cash-on-cash returns exceeding 25% in many markets, should attract a
large franchise base and allow Dunkin' to double its U.S. store count (management's long-term target is
17,000-plus U.S. units, compared with 8,100 today). We also think several factors driving franchisee
returns in the U.S. can be applied overseas, which should help improve results in Dunkin's international
joint ventures and attract new global franchise partners.
Key Investment Considerations
× Franchisees own virtually all Dunkin' Donuts and Baskin-Robbins locations, providing an annuitylike
stream of royalties with few corresponding capital needs. The stability of this revenue stream, coupled
with strong unit growth prospects (our model is aligned with management's long-term global target of
30,000 units), limited commodities exposure, and supply chain improvements, could drive 800 basis
points of operating margin expansion over the next 10 years (implying adjusted operating margins of
56% by 2024) with ROIC (excluding goodwill) exceeding 20%.
× We believe Dunkin's expanded K-Cup distribution partnership with Keurig and J.M. Smucker is
significant for two reasons, as this channel expansion should be accretive to longer-term free cash flow
while also reinforcing the strength of the Dunkin' brand intangible asset, a key component of our narrow
moat rating. Details about the expanded partnership are sparse, but Smucker will distribute/market
Dunkin' K-Cups exclusively to grocery chains, mass merchants, drugstores, dollar stores, and home-
improvement stores in the U.S. and Canada, while Keurig will distribute/market to specialty stores and
office superstores. Dunkin' K-Cups will also be available online in spring 2015.
× Dunkin's strong free cash flow generation and lack of near-term debt maturities should also drive total
shareholder returns through steady dividend increases.
× Despite our optimism for Dunkin's asset-light business model and longer-term growth potential, we
expect competition in global specialty coffee category will become more pronounced in the coming years
because of aggressive expansion plans from existing players and daypart expansion from QSR chains.
We still view Dunkin' as a nascent channel diversification story among large-cap consumer stocks, but
view shares as modestly overvalued at current levels.
Dunkin' Brands: Compelling Long-Term Franchise Growth Story, but Competition Is Rising
Economic Moat Narrow
Moat Trend Stable
Morningstar Rating QQ
Fair Value Estimate $43
Current Price $48
Price/Fair Value 1.12
Uncertainty Rating Medium
Market Cap ($ Billion) 4.7
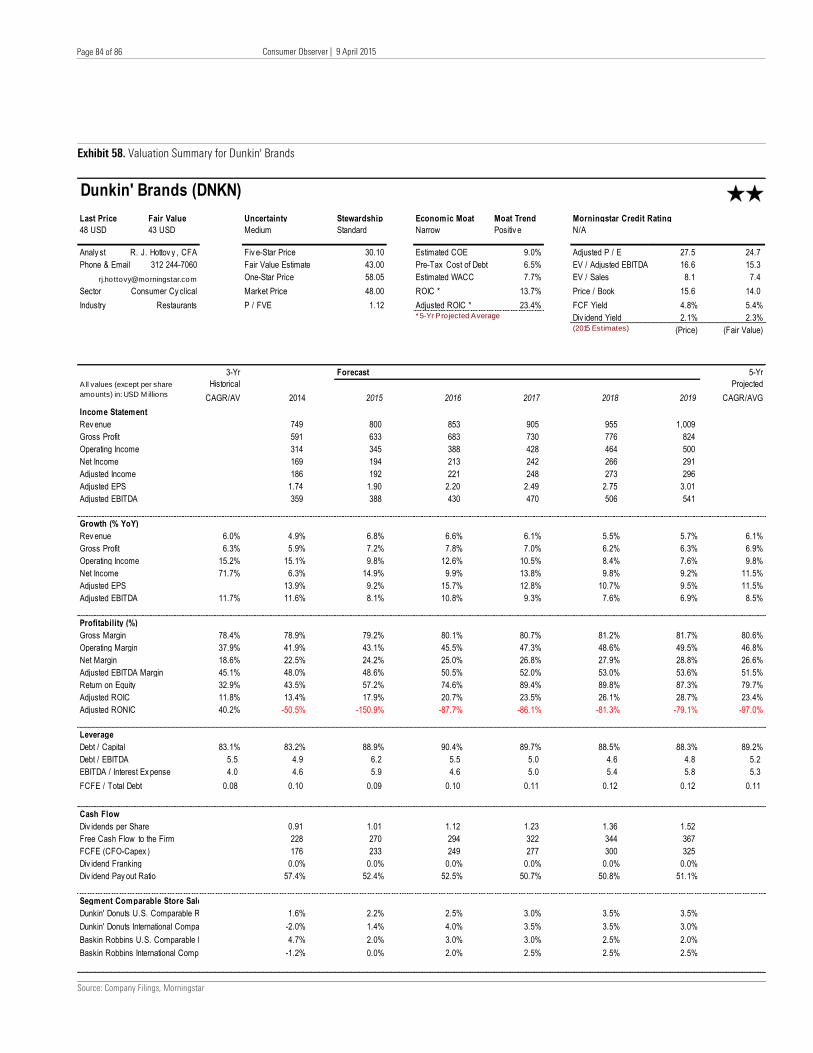
Consumer Observer | 9 April 2015
Healthcare Observer | 14 April 2015
Page 84 of 86
Page 84 of 86
Exhibit 58. Valuation Summary for Dunkin' Brands
Source: Company Filings, Morningstar
Last Price Fair Value Uncertainty Stewardship Economic Moat Moat Trend Morningstar Credit Rating
48 USD 43 USD Medium Standard Narrow Positiv e N/A
Analy st R. J. Hottov y , CFA Fiv e-Star Price 30.10 Estimated COE 9.0% Adjusted P / E 27.5 24.7
Phone & Email 312 244-7060 Fair Value Estimate 43.00 Pre-Tax Cost of Debt 6.5% EV / Adjusted EBITDA 16.6 15.3
[email protected] One-Star Price 58.05 Estimated WACC 7.7% EV / Sales 8.1 7.4
Sector Consumer Cy clical Market Price 48.00 ROIC * 13.7% Price / Book 15.6 14.0
Industry P / FVE 1.12 Adjusted ROIC * 23.4% FCF Yield 4.8% 5.4%* 5-Yr Pro jected Average Div idend Yield 2.1% 2.3%
(2015 Estimates) (Price) (Fair Value)
3-Yr Forecast 5-Yr
Historical
CAGR/AV 2014 2015 2016 2017 2018 2019
Projected
CAGR/AVG
Income Statement
Rev enue 749 800 853 905 955 1,009
Gross Profit 591 633 683 730 776 824
Operating Income 314 345 388 428 464 500
Net Income 169 194 213 242 266 291
Adjusted Income 186 192 221 248 273 296
Adjusted EPS 1.74 1.90 2.20 2.49 2.75 3.01
Adjusted EBITDA 359 388 430 470 506 541
Growth (% YoY)
Rev enue 6.0% 4.9% 6.8% 6.6% 6.1% 5.5% 5.7% 6.1%
Gross Profit 6.3% 5.9% 7.2% 7.8% 7.0% 6.2% 6.3% 6.9%
Operating Income 15.2% 15.1% 9.8% 12.6% 10.5% 8.4% 7.6% 9.8%
Net Income 71.7% 6.3% 14.9% 9.9% 13.8% 9.8% 9.2% 11.5%
Adjusted EPS 13.9% 9.2% 15.7% 12.8% 10.7% 9.5% 11.5%
Adjusted EBITDA 11.7% 11.6% 8.1% 10.8% 9.3% 7.6% 6.9% 8.5%
Profitability (%)
Gross Margin 78.4% 78.9% 79.2% 80.1% 80.7% 81.2% 81.7% 80.6%
Operating Margin 37.9% 41.9% 43.1% 45.5% 47.3% 48.6% 49.5% 46.8%
Net Margin 18.6% 22.5% 24.2% 25.0% 26.8% 27.9% 28.8% 26.6%
Adjusted EBITDA Margin 45.1% 48.0% 48.6% 50.5% 52.0% 53.0% 53.6% 51.5%
Return on Equity 32.9% 43.5% 57.2% 74.6% 89.4% 89.8% 87.3% 79.7%
Adjusted ROIC 11.8% 13.4% 17.9% 20.7% 23.5% 26.1% 28.7% 23.4%
Adjusted RONIC 40.2% -50.5% -150.9% -87.7% -86.1% -81.3% -79.1% -97.0%
Leverage
Debt / Capital 83.1% 83.2% 88.9% 90.4% 89.7% 88.5% 88.3% 89.2%
Debt / EBITDA 5.5 4.9 6.2 5.5 5.0 4.6 4.8 5.2
EBITDA / Interest Ex pense 4.0 4.6 5.9 4.6 5.0 5.4 5.8 5.3
FCFE / Total Debt 0.08 0.10 0.09 0.10 0.11 0.12 0.12 0.11
Cash Flow
Div idends per Share 0.91 1.01 1.12 1.23 1.36 1.52
Free Cash Flow to the Firm 228 270 294 322 344 367
FCFE (CFO-Capex ) 176 233 249 277 300 325
Div idend Franking 0.0% 0.0% 0.0% 0.0% 0.0% 0.0%
Div idend Pay out Ratio 57.4% 52.4% 52.5% 50.7% 50.8% 51.1%
1.6% 2.2% 2.5% 3.0% 3.5% 3.5%
-2.0% 1.4% 4.0% 3.5% 3.5% 3.0%
4.7% 2.0% 3.0% 3.0% 2.5% 2.0%
-1.2% 0.0% 2.0% 2.5% 2.5% 2.5%Baskin Robbins International Comparable Restaurant Sales
Dunkin' Donuts International Comparable Restaurant Sales
Baskin Robbins U.S. Comparable Restaurant Sales
Dunkin' Brands (DNKN)
Restaurants
All values (except per share
amounts) in: USD M illions
Segment Comparable Store Sales Metrics
Dunkin' Donuts U.S. Comparable Restaurant Sales
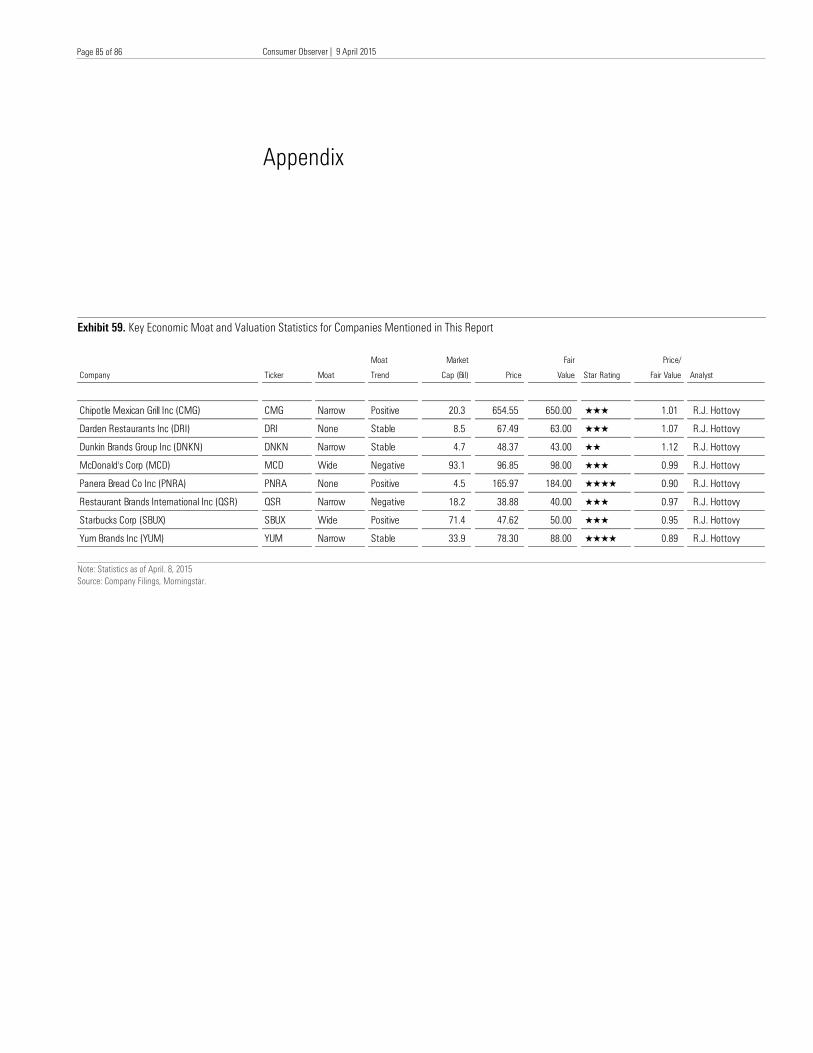
Consumer Observer | 9 April 2015
Healthcare Observer | 14 April 2015
Page 85 of 86
Page 85 of 86
Appendix
Exhibit 59. Key Economic Moat and Valuation Statistics for Companies Mentioned in This Report
Note: Statistics as of April. 8, 2015
Source: Company Filings, Morningstar.
Company Ticker Moat
Moat
Trend
Market
Cap (Bil) Price
Fair
Value Star Rating
Price/
Fair Value Analyst
Chipotle Mexican Grill Inc (CMG) CMG Narrow Positive 20.3 654.55 650.00 QQQ 1.01 R.J. Hottovy
Darden Restaurants Inc (DRI) DRI None Stable 8.5 67.49 63.00 QQQ 1.07 R.J. Hottovy
Dunkin Brands Group Inc (DNKN) DNKN Narrow Stable 4.7 48.37 43.00 QQ 1.12 R.J. Hottovy
McDonald's Corp (MCD) MCD Wide Negative 93.1 96.85 98.00 QQQ 0.99 R.J. Hottovy
Panera Bread Co Inc (PNRA) PNRA None Positive 4.5 165.97 184.00 QQQQ 0.90 R.J. Hottovy
Restaurant Brands International Inc (QSR) QSR Narrow Negative 18.2 38.88 40.00 QQQ 0.97 R.J. Hottovy
Starbucks Corp (SBUX) SBUX Wide Positive 71.4 47.62 50.00 QQQ 0.95 R.J. Hottovy
Yum Brands Inc (YUM) YUM Narrow Stable 33.9 78.30 88.00 QQQQ 0.89 R.J. Hottovy
Consumer Observer | 9 April 2015
Healthcare Observer | 14 April 2015
Page 86 of 86
Page 86 of 86
About Morningstar® Institutional Equity Research™
Morningstar Institutional Equity Research provides independent, fundamental equity research
differentiated by a consistent focus on sustainable competitive advantages, or Economic Moats.
For More Information
+1 312-696-6869
?
22 West Washington Street
Chicago, IL 60602 USA
©2015 Morningstar. All Rights Reserved. Morningstar's Credit Ratings & Research is produced and offered by Morningstar, Inc.,
which is not registered with the U.S. Securities and Exchange Commission as a Nationally Recognized Statistical Rating
Organization (“NRSRO”). Unless otherwise provided in a separate agreement, you may use this report only in the country in which
its original distributor is based. The information, data, analyses and opinions presented herein do not constitute investment advice;
are provided solely for informational purposes and therefore are not an offer to buy or sell a security; and are not warranted to be
correct, complete or accurate. The opinions expressed are as of the date written and are subject to change without notice. Except
as otherwise required by law, Morningstar shall not be responsible for any trading decisions, damages or other losses resulting
from, or related to, the information, data, analyses or opinions or their use. The information contained herein is the proprietary
property of Morningstar and may not be reproduced, in whole or in part, or used in any manner, without the prior written consent
of Morningstar. To order reprints, call +1 312-696-6100. To license the research, call +1 312-696-6869.