finding strategic and cyclical exposure: sector and...
TRANSCRIPT

For financial professional use only. Do not distribute to the public. 1
Finding Strategic and Cyclical Exposure:
Sector and Factor Investing

For financial professional use only. Do not distribute to the public. 2
Housekeeping
‣ Ask Questions
‣ Polls
‣ Survey & Giveaway
• Complete survey for a chance to win a power bank battery

For financial professional use only. Do not distribute to the public. 3
Today’s Presenters
Moderator Panelist Panelist
Tom Lydon Denise Chisholm Darby Nielson
Editor & Publisher Sector Strategist Managing Director of Research
ETF Trends Fidelity Investments Fidelity Investments

Not FDIC Insured May Lose Value No Bank Guarantee
For Investment Professionals
March 2017
Finding Strategic and Cyclical Exposure:
Sector and Factor Investing
Denise Chisholm
Sector Strategist
Darby Nielson
Managing Director of Research

Sector Theme Investing
For Investment Professionals

Where We’ve Been …
Where Are We Going?
For Investment Professionals

Where We’ve Been One of the critical issues facing the market is earnings growth contraction
7
IVA & CCAdj (SAAR, $) % Change—Year to Year
Source: Bureau of Economic Analysis (BEA), as of 9/15
Capital consumption adjustment (CCAdj): the difference between private capital consumption allowances (CCA) and private consumption of
fixed capital (CFC) IVA: Inventory valuation adjustment; SAAR: Seasonally Adjusted Annual Rates.
CORPORATE PROFITS AFTER TAX
-30%
-20%
-10%
0%
10%
20%
30%
40%
50%
60%
19
62
19
63
19
65
19
67
19
68
19
70
19
72
19
73
19
75
19
77
19
78
19
80
19
82
19
83
19
85
19
87
19
88
19
90
19
92
19
93
19
95
19
97
19
98
20
00
20
02
20
03
20
05
20
07
20
08
20
10
20
12
20
13
20
15
For Investment Professionals

Profits Have Slowed Sectors can be a great way to play this theme
8
Equity universe is defined as the top 3,000 U.S. stocks by market capitalization; sectors as defined by the Global Industry Classification Standard
(GICS). Source: Haver, as of 12/15.
Alpha: A measure of performance on a risk-adjusted basis. Also referred to as excess return.
SECTOR AVERAGE ALPHA WHEN EARNINGS GROWTH IS DECELERATING
1985 to Present
7.1% 6.0%
2.0% 1.0% 0.5% 0.3%
-0.1% -0.4% -0.8% -1.6%
Co
nsu
me
r S
taple
s
He
alth
Care
Utilit
ies
Ene
rgy
Mate
rials
Co
nsu
me
r D
iscre
tion
ary
Tele
com
mu
nic
ation
s
Fin
an
cia
ls
Indu
str
ials
Tech
no
logy
For Investment Professionals

Potential for Change
9
Corporate Tax Reform?
Potential for Financial Services Deregulation?
For Investment Professionals

Possible Impact on Earnings
10
Corporate Profits is from our internal database defined as the top 3,000 U.S. stocks by market capitalization; sectors as def ined by the Global
Industry Classification Standard (GICS). Source: Haver, as of 12/16.
CORPORATE PROFIT ACCELERATION & GROWTH DURING CORPORATE TAX CUTS
12%
14%
2%
Acceleration During Growth Post Cut Years Before
For Investment Professionals

Tax Reform Implications
11
Equity universe is defined as the top 3,000 U.S. stocks by market capitalization; sectors as defined by the Global Industry Classification Standard
(GICS). Source: Haver, as of 12/16. Defense is an average of staples, healthcare, utilities and telecom sector relative performance. Cyclicals is an
average of energy, industrials, materials, discretionary, technology, and financials relative performance.
AVERAGE SECTOR RETURNS
Higher Corporate Taxes vs. Lower Corporate Taxes
-2%
1%
5%
-1%
Defensive Sectors Cyclical Sectors
Lower Tax Rates Higher Tax Rates
For Investment Professionals

Financial Services Deregulation Implications
12
Equity universe is defined as the top 3,000 U.S. stocks by market capitalization; sectors as defined by the Global Industry Classification Standard
(GICS). Source: Haver, as of 12/16. Defense is an average of staples, healthcare, utilities and telecom sector relative performance. Cyclicals is an
average of energy, industrials, materials, discretionary, technology, and financials relative performance.
2%
-1%
0%
1%
Less Willing to Lend More Willing to Lend
Average Defensive Sectors Average Cyclical Sectors
AVERAGE SECTOR RETURNS
Banks More Willing to Lend vs. Less
For Investment Professionals
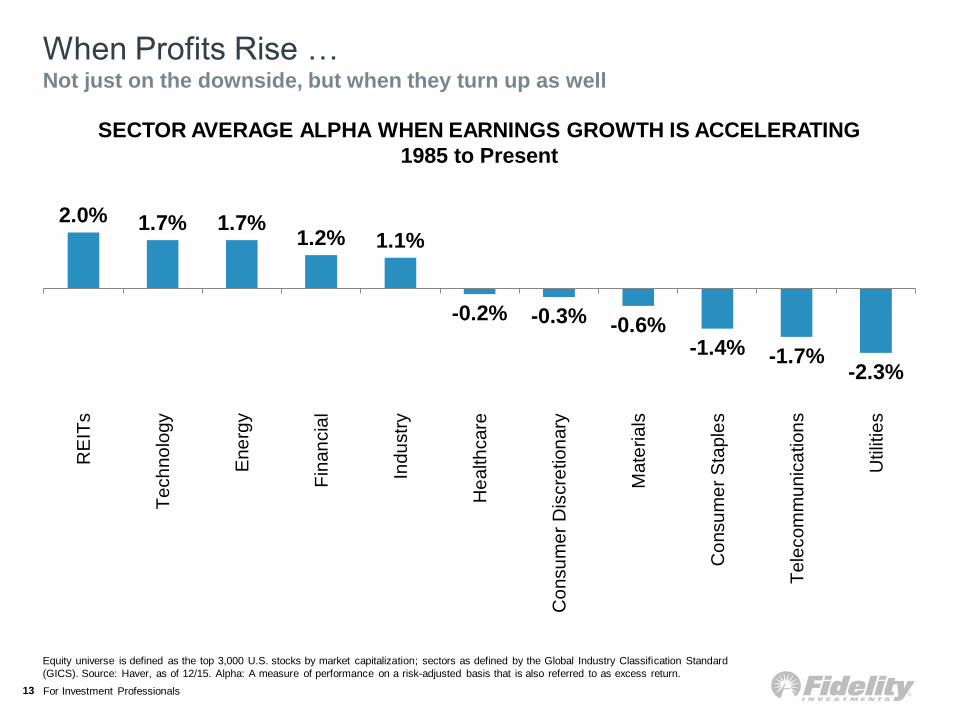
When Profits Rise … Not just on the downside, but when they turn up as well
13
Equity universe is defined as the top 3,000 U.S. stocks by market capitalization; sectors as defined by the Global Industry Classification Standard
(GICS). Source: Haver, as of 12/15. Alpha: A measure of performance on a risk-adjusted basis that is also referred to as excess return.
SECTOR AVERAGE ALPHA WHEN EARNINGS GROWTH IS ACCELERATING
1985 to Present
2.0% 1.7% 1.7% 1.2% 1.1%
-0.2% -0.3% -0.6% -1.4% -1.7%
-2.3%
RE
ITs
Tech
no
logy
Ene
rgy
Fin
an
cia
l
Indu
str
y
He
alth
care
Co
nsu
me
r D
iscre
tion
ary
Mate
rials
Co
nsu
me
r S
taple
s
Tele
com
mu
nic
ation
s
Utilit
ies
For Investment Professionals

Investment Spending Recovery?
14
National Accounts Data in Haver as of 12/31/2016.
REAL GROSS PRIVATE DOMESTIC INVESTMENT (SAAR, CHN.2009$)
% Change–Year to Year
-30.00%
-20.00%
-10.00%
0.00%
10.00%
20.00%
30.00%
40.00%
50.00%
62
163
365
166
368
169
371
172
374
175
377
178
380
181
383
184
386
187
389
190
392
193
395
196
398
199
301
102
304
105
307
108
310
111
313
114
316
1
For Investment Professionals

What about Rates?
15
Source: Bureau of Economic Analysis (BEA), as of 12/16; Haver, as of 12/16.
INTEREST RATES AND PROFITS
Odds of Profit Acceleration
58%
36%
Rates Up Rates Down
For Investment Professionals

Fidelity Factor Research
For Investment Professionals

Agenda
17
1. Overview of Factor Investing
2. Factor Usage
A. Strategic Exposure
B. Cyclical Exposure
C. Portfolio Construction
3. Fidelity Factor ETFs
For Investment Professionals

Overview of Factor Investing
For Investment Professionals

Evolution of Factor Analysis Progression of research into the drivers of asset returns
19
Source: Fidelity Investments.
MULTIPLE SYSTEMATIC
RETURN ANOMALIES
SINGLE SOURCE OF
SYSTEMATIC RISK
ASSORTED STRATEGIC
RISK AND RETURN FACTORS
Fama and French develop model accounting
for additional factors, stock characteristics of
size and style, which also drive performance.
Capital Asset Pricing Model (CAPM) proposes
return on investment driven by exposure to
single factor, market risk or “beta.”
Substantial research and analysis into many
other strategic factors, which can be used to
explain the components of a stock’s return.
Market
Asset Specific
Market
Asset Specific
Size
Style
Market
Asset Specific
Size
Style
PORTFOLIO PORTFOLIO PORTFOLIO
Momentum
Quality
Value
Volatility
Yield
For Investment Professionals

Evolution of Factor Analysis at Fidelity Fidelity has long history of factor investing, which has evolved significantly over
the last decade since the Quantitative Research team was formed.
20
1965
Fidelity hires first
dedicated Quant
analyst
Background
• Fidelity’s quantitative research capabilities were built to provide fundamentally based factor insights to portfolio managers,
research analysts, and CIOs.
• Factor-based stock selection models were built via collaborations between FMR analysts and PMs with the Quant Research team.
• Factor models incorporate the best stock drivers from both fundamental and quantitative perspectives.
• Evolution resulted in a suite of intuitive, fundamentally-driven models for generating investment ideas and monitoring portfolio exposures.
Fidelity launches its
first quant fund,
Disciplined Equity
Quantitative Research team
formally established to
complement fundamental
capabilities
Global Value and
Momentum multifactor
model researched and
launched
First sector factor
model launched in
collaboration with
fundamental research
Quality and Low
Volatility models
researched and
launched
Research,
development, and
launch of stand-alone
factor products
1988
2006
2007
2008 2013
2016
Source: Fidelity Investments.
For Investment Professionals

Factor Usage
For Investment Professionals

Potential Key Uses of Factor Strategies in a Portfolio Investors seek out factor exposures for return/outcome potential and risk management
22
Strategic Exposure Cyclical Exposure Portfolio Construction
Strategic allocations to factors can
enhance risk-adjusted returns.
Investors may consider exposure to
one or a combination of factors to take
advantage of their potential benefits.
Because factor returns can vary through
time, adjusting factor exposures using a
cyclical framework may help investors
express a market or investment view.
Investors and advisors can use
factor-based strategies to fine-tune
their exposures and better align their
broader portfolios with their intended
investment objectives and risk profiles.
INTENDED OBJECTIVES
For Investment Professionals

Factors Matter Research reveals the return potential of these factors over time
23
Returns are cumulative and assume reinvestment of dividends. Returns do not reflect the performance of any Fidelity index or ETF. Past performance is no
guarantee of future results. Value composite is a combined average ranking of stocks in the equal-weighted top quintile (by book/price ratio) and stocks in
the equal-weighted top quintile (by earnings yield) of the Russell 1000 Index. Momentum returns are the equal-weighted top quintile (by trailing 12-month
returns) of the Russell 1000 Index. Quality returns are the equal-weighted top quintile (by return on equity) of the Russell 1000 index. Low-volatility returns
are yearly returns of the equal-weighted bottom quintile (by standard deviation of weekly price returns) of the Russell 1000 Index. For more detail, see
September 2016 Fidelity Leadership Series “An Overview of Factor Investing”.
Source: Fidelity Investments as of 12/31/15.
CUMULATIVE FACTOR RETURNS VS. THE MARKET, 1985–2015
0%
1000%
2000%
3000%
4000%
5000%
6000%
7000%
8000%
De
c-8
5
De
c-8
7
De
c-8
9
De
c-9
1
De
c-9
3
De
c-9
5
De
c-9
7
De
c-9
9
De
c-0
1
De
c-0
3
De
c-0
5
De
c-0
7
De
c-0
9
De
c-1
1
De
c-1
3
De
c-1
5
Value
Quality Momentum
Low Volatility
Russell 1000
Exposure to
these key strategic
factors has
generated market
outperformance
over time
For Investment Professionals

Factor Definitions Matter
24
Value composite is a combined average ranking of stocks in the
equal-weighted top quintile (by book/price ratio) and stocks in the
equal-weighted top quintile (by earnings yield) of the Russell 1000
Index. Returns shown are yearly returns of this value composite. Past
performance is no guarantee of future results. Source: FactSet, as of
3/31/16.
Earnings yield: last 12 months of earnings per share divided by price
per share. Book/price ratio: the ratio of a company’s reported
accumulated profits to its price per share. Returns shown are yearly
returns of the equal-weighted top quintile (based on these two value
metrics) of the Russell 1000 Index. Past performance is no guarantee
of future results. Source: FactSet, as of 3/31/16.
EXCESS RETURNS OF TWO VALUE MEASURES
The performance of a value portfolio can vary
based on how value is defined
EXCESS RETURNS TO A VALUE COMPOSITE
A mix of factors can improve the performance of
a value approach
-30%
-20%
-10%
0%
10%
20%
30%
40%
198
6
198
8
199
0
199
2
199
4
199
6
199
8
200
0
200
2
200
4
200
6
200
8
201
0
201
2
201
4
Book/Price EPLTM
Yearly Excess Return
2015
Avg. Book/Price Avg. Earnings Yield
1.98% 2.91%
-15%
-10%
-5%
0%
5%
10%
15%
20%
25%
30%
35%
40%
198
6
198
8
199
0
199
2
199
4
199
6
199
8
200
0
200
2
200
4
200
6
200
8
201
0
201
2
201
4
Yearly Excess Return
2015
For Investment Professionals

Factor Performance Cyclicality Most factors are not highly correlated, so diversifying among them may improve
risk-adjusted returns over time
25
Rolling Annual Excess Return
-60%
-40%
-20%
0%
20%
40%
60%
80%
100%
Dec-8
6
Dec-8
8
Dec-9
0
Dec-9
2
Dec-9
4
Dec-9
6
Dec-9
8
Dec-0
0
Dec-0
2
Dec-0
4
Dec-0
6
Dec-0
8
Dec-1
0
Dec-1
2
Dec-1
4
Book/Price MomentumValue
Value represented by the equal-weighted top quintile (by book-to price ratio) of the Russell 1000 Index. Momentum represented by the equal-weighted top
quintile (by trailing 12-month returns) of the Russell 1000 Index. Source: FactSet, as of 3/31/16.
For Investment Professionals

Benefits of Factor Diversification Diversifying across multiple factors can help investors achieve more consistent
performance over time
26
Excess Return Tracking Error Info. Ratio
Value 3.4% 5.2% 0.6
Multifactor 1.7% 1.5% 1.2
Yearly Excess Return vs. Broader Market
-10%
-5%
0%
5%
10%
15%
20%
25%
30%
198
6
198
7
198
8
198
9
199
0
199
1
199
2
199
3
199
4
199
5
199
6
199
7
199
8
199
9
200
0
200
1
200
2
200
3
200
4
200
5
200
6
200
7
200
8
200
9
201
0
201
1
201
2
201
3
201
4
201
5
201
6
Value Multifactor
Equal-weighted multifactor portfolio includes five factor portfolios: size, value, momentum, quality, and low volatility. Size returns are yearly returns of the equal-weighted bottom quintile
(by market capitalization) of the Russell 1000 Index. Value composite returns are the combined average ranking of stocks in the equal-weighted top quintile (by book/price ratio) and
stocks in the equal-weighted top quintile (by earnings yield) of the Russell 1000 Index. Momentum returns are the equal-weighted top quintile (by trailing 12-month returns) of the Russell
1000 Index. Quality returns are the equal-weighted top quintile (by return on equity) of the Russell 1000 index. Low-volatility returns are yearly returns of the equal-weighted bottom
quintile (by standard deviation of weekly price returns) of the Russell 1000 Index. Excess return: compound average of yearly excess returns versus the equal-weighted Russell 1000
Index from Jan. 1986 through Mar. 2016. Tracking error: measures the variation of performance relative to the broader market (in this case, the equal-weighted Russell 1000 Index).
Information ratio: measures risk-adjusted return (defined as excess return divided by tracking error).
Past performance is no guarantee of future results.
Source: FactSet, as of 3/31/16.
For Investment Professionals

Factor Performance and the Business Cycle Certain factors have tended to perform well in varying market environments;
active factor tilts can help generate alpha throughout the economic cycle.
27
FACTORS AND THE BUSINESS CYCLE
Objective
• Add excess return potential to a
portfolio
Factor Strategy
• Adjust portfolio allocations over
time to increase exposure to
opportunistic factors
Unshaded (white) portions above suggest no clear pattern of over- or underperformance vs. broader market. Double +/– signs indicate that the sector is showing a consistent signal
across all three metrics: full-phase average performance, median monthly difference, and cycle hit rate. A single +/– indicates a mixed or less consistent signal. Value composite is a
combined average ranking of stocks in the equal-weighted top quintile (by book/price ratio) and stocks in the equal-weighted top quintile (by earnings yield) of the Russell 1000 Index.
Momentum returns are the equal-weighted top quintile (by trailing 12-month returns) of the Russell 1000 Index. Quality returns are the equal-weighted top quintile (by return on equity) of
the Russell 1000 index. Low-volatility returns are yearly returns of the equal-weighted bottom quintile (by standard deviation of weekly price returns) of the Russell 1000 Index. Dividend
Yield composite is the equal-weighted top quintile (by dividend yield) or the equal-weighted Russell 1000 Index. For more detail, see September 2016 Fidelity Leadership Series “Putting
Factors to Work.”
Past performance is no guarantee of future results.
Source: Fidelity Investments (AART).
Factor Early Mid Late Recession
Value ++ ++
Dividend Yield ++ ++
Size + +
Momentum ++ +
Quality + +
Low Volatility – – – ++
For Investment Professionals

Factors as Risk Management Tools Adding allocation to a low volatility strategy can help improve a portfolio’s
risk-adjusted return through decreased volatility.
28
ADDITION OF LOW VOLATILITY: PERFORMANCE AND RISK COMPARISONS
Objective
• Reduce level of risk in a portfolio
while still maintaining return
potential
Factor Strategy
• Factor-based strategies can
complement active funds by
offsetting risk exposures
Large-cap growth fund represented by the median fund by return volatility within the top quintile of 10-year performance in the Morningstar large-cap growth category. Low-volatility
portfolio is the equal-weighted bottom quintile (by standard deviation of weekly price returns) of the Russell 1000 Index. Large-cap growth fund + low vol is an equal-weighted portfolio of
this active large cap growth fund and a low-volatility factor portfolio. Annualized returns from July 2006 through June 2016. Volatility represented by standard deviation (a measure of
return variance). A portfolio with a lower standard deviation exhibits less volatility. For more detail, see September 2016 Fidelity Leadership Series “Putting Factors to Work.”
Past performance is no guarantee of future results.
Source: Fidelity Investments and FactSet, as of 6/30/2016.
Annualized Return and Volatility (%)
July 2006–June 2016
9.2% 8.9%
7.5%
17.2%
14.5% 15.5%
Large-Cap Growth Fund Large-Cap Growth Fund + Low Vol Russell 1000 Index
Annualized Return Volatility
For Investment Professionals

Fidelity Factor ETFs
For Investment Professionals

Fidelity Factor ETFs—Overview Focus on fundamental investment opportunities, leveraging our insights to define
our factor-based strategies
30
FDLO
FDRR
FDMO FQAL
FVAL
FDVV
Aiming to generate higher relative
dividend yield with sector tilts,
subject to constraints, which have
historically delivered higher yield
Targeting higher-yielding
companies with positive correlation
to rising Treasury yields can provide
protection in a rising rate
environment
Focusing on securities, which
generate similar returns as the
broader market over time with less
volatility
Seeking outperforming stocks, which
have had a tendency to continue to
outperform over the medium-term
Prioritizing companies with higher
profitability, stable cash flows, and
good balance sheets, which have
tended to outperform their peers
over time
Capitalizing on cheap stocks, with
low prices relative to fundamentals,
which have historically outperformed
the market over time
Purchase Information
Net Expense Ratio: 0.29%
Stock Exchange: NYSE
Fidelity Brokerage Trading Fees: Commission Free/30-day short-
term trading fee1
Rule-Based Passively Managed Investment Approach
Proprietary Methodology Fidelity Investments
Independent Calculation Agent S&P Dow Jones
Sub-Advisor Geode Capital Management
1 Free commission offer applies to online purchases of Fidelity ETFs in a Fidelity brokerage account with a minimum opening balance of $2,500.
The sale of ETFs on Fidelity’s brokerage platform are subject to an activity assessment fee (of between $0.01 to $0.03 per $1000 of principal) by
Fidelity. Fidelity ETFs traded in Fidelity brokerage accounts are subject to a short-term trading fee by Fidelity, if held less than 30 days.
Source: Fidelity Investments.
FDVV
Fidelity Core
Dividend ETF
FDRR
Fidelity Dividend ETF
for Rising Rates
FDLO
Fidelity Low
Volatility Factor ETF
FDMO
Fidelity Momentum
Factor ETF
FQAL
Fidelity Quality
Factor ETF
FVAL
Fidelity Value
Factor ETF
For Investment Professionals

For financial professional use only. Do not distribute to the public. 31
Questions?
Please submit your questions using the Q&A box.

Glossary
32
Term Definition
12-Month Return Minus 1-Month Return Cumulative 12-month stock return less the prior month’s stock return.
12-Month Earnings Surprise A measure of comparison between the consensus earnings-per-share estimate from 12 months ago and actual
earnings-per-share.
6-Month Average Short Interest A measure of the monthly average number of shares shorted divided by monthly average number of shares traded.
Active Share The percentage of a an index’s weight-adjusted portfolio that differs from another comparison index.
Beta
A historical measure of a fund's sensitivity to market movements and is calculated by comparing the fund's monthly returns,
over 36 months, to those of the market, defined by the fund's benchmark. By definition, the Beta of the market (as measured by
the benchmark) is 1.0. A Beta of less than 1.0 indicates that the fund is less sensitive to the market, while a Beta of more than
1.0 indicates that the fund is more sensitive to the market. The higher the correlation between the fund and the market (as
measured by R-squared), the more meaningful is Beta.
Cash Flow A measure of cash generated by a company, which is calculated adding non-cash charges to net income after taxes.
Correlation to 10-Year Treasury A measure of the correlation of weekly changes in the 10-year Treasury yield with weekly stock returns.
Dividend Growth A measure of growth in dividends per share over the last year.
Dividend Yield A measure of trailing dividends over last 12 months divided by price per share.
Earnings-Per-Share (EPS) Growth Measures the growth in reported earnings per share over the specified past time period.
Enterprise Value (EV)-to-EBITDA Enterprise value divided by earnings before interest, tax, depreciation, and amortization.
Free Cash Flow (FCF)
A measure of financial performance calculated as operating cash flow minus capital expenditures. Free cash flow (FCF)
represents the cash that a company is able to generate after laying out the money required to maintain or expand its asset
base.
Free Cash Flow Margin A measure of cash generated after deducting all investments needed to maintain and expand assets divided by total earnings.
Free Cash Flow Stability A measure of the stability of a company’s free cash flows, calculated as a percentage of the last 20 quarters with positive free
cash flow values.
Free Cash Flow Yield
A valuation measure of a stock, which standardizes a company's free cash flow by its market capitalization. Generally, the
lower the ratio, the less attractive the investment and vice versa, with the logic that investors would like to pay as little a price
as possible for as much free cash flow as possible.
For Investment Professionals

Glossary
33
Term Definition
Information Ratio Measures a fund's active return (fund's average monthly return minus the benchmark's average monthly return)
in relation to the volatility of its active returns.
Market Capitalization The total dollar market value of all of a company’s outstanding shares.
Payout Ratio A measure of trailing dividends per share over the past twelve months divided by earnings per share.
Price-to-Book (P/B) Ratio The ratio of a company's current share price to reported accumulated profits and capital.
Price-to-Cash Flow (P/CF) Ratio The ratio of a company's current share price to its trailing 12-months cash flow per share.
Price-to-Earnings (P/E) Ratio
(IBES 1-Year Forecast) The ratio of a company's current share price to Wall Street analysts' estimates of earnings.
Price-to-Earnings (P/E) Ratio Trailing The ratio of a company's current share price to its trailing 12-months earnings per share.
Price-to-Tangible Book Value (TBV) The ratio of a company’s current share price to its total book value, less the value of any intangible assets.
Return on Invested Capital (ROIC) A measure of how effectively a company uses the money (borrowed or owned) invested in its operations, typically expressed
as net income minus dividends divided by total capital (debt plus equity).
Standard Deviation A measure of dispersion of a set of data from its mean.
Volatility-Adjusted 12-Month Return
Minus 1-Month Return
Cumulative 12-month stock return divided by monthly volatility, as measured by standard deviation, less the
prior month’s stock return.
For Investment Professionals
Important Information
For Investment Professionals
Not FDIC Insured. May Lose Value. No Bank Guarantee.
Not NCUA or NCUSIF insured. May lose value. No credit union guarantee.
Unless otherwise disclosed to you, in providing this information, Fidelity is not undertaking to provide impartial investment advice, or to give advice
in a fiduciary capacity, in connection with any investment or transaction described herein. Fiduciaries are solely responsible for exercising
independent judgment in evaluating any transaction(s) and are assumed to be capable of evaluating investment risks independently, both in
general and with regard to particular transactions and investment strategies. Fidelity has a financial interest in any transaction(s) that fiduciaries,
and if applicable, their clients, may enter into involving Fidelity’s products or services.
Views expressed are as of the date indicated, based on the information available at that time, and may change based on market or other
conditions. Unless otherwise noted, the opinions provided are those of the authors and not necessarily those of Fidelity Investments or its affiliates.
Fidelity does not assume any duty to update any of the information.
References to specific investment themes are for illustrative purposes only and should not be construed as recommendations or investment advice.
Investment decisions should be based on an individual’s own goals, time horizon, and tolerance for risk.
This piece may contain assumptions that are “forward-looking statements,” which are based on certain assumptions of future events. Actual events
are difficult to predict and may differ from those assumed. There can be no assurance that forward-looking statements will materialize or that actual
returns or results will not be materially different from those described here.
Past performance is no guarantee of future results.
Investing involves risk, including risk of loss.
Diversification does not ensure a profit or guarantee against loss.
All indices are unmanaged. You cannot invest directly in an index.
Business Cycle Definition
The typical business cycle depicts the general pattern of economic cycles throughout history, though each cycle is different. In general, the typical
business cycle demonstrates the following:
Market Indices
The S&P 500® Index is a market capitalization-weighted index of 500 common stocks chosen for market size, liquidity, and industry group
representation to represent U.S. equity performance. S&P 500 is a registered service mark of Standard & Poor’s Financial Serv ices LLC. Sectors
and industries are defined by the Global Industry Classification Standard (GICS).
34 For Investment Professionals

Important Information
The S&P 500 sector indices include the standard GICS sectors that make up the S&P 500 Index. The market capitalization of all S&P 500 sector
indices together composes the market capitalization of the parent S&P 500 Index; each member of the S&P 500 Index is assigned to one (and only
one) sector.
Barclays U.S. Corporate High Yield Bond Index is a market value-weighted index that covers the universe of dollar-denominated, fixed-rate,
non-investment-grade debt.
The Russell 3000® Index measures the performance of the largest 3,000 U.S. companies, representing approximately 98% of the investable U.S.
equity market.
Sectors are defined as follows: Consumer Discretionary: companies that provide goods and services that people want but don’t necessarily need,
such as televisions, cars, and sporting goods; these businesses tend to be the most sensitive to economic cycles. Consumer Staples: companies
that provide goods and services that people use on a daily basis, like food, household products, and personal-care products; these businesses tend
to be less sensitive to economic cycles. Energy: companies whose businesses are dominated by either of the following activities: the construction
or provision of oil rigs, drilling equipment, or other energy-related services and equipment, including seismic data collection; or the exploration,
production, marketing, refining, and/or transportation of oil and gas products, coal, and consumable fuels. Financials: companies involved in
activities such as banking, consumer finance, investment banking and brokerage, asset management, insurance and investments, and real estate,
including REITs. Health Care: companies in two main industry groups: health care equipment suppliers and manufacturers, and providers of health
care services; and companies involved in the research, development, production, and marketing of pharmaceuticals and biotechnology products.
Industrials: companies whose businesses manufacture and distribute capital goods, provide commercial services and supplies, or provide
transportation services. Technology: companies in technology software and services and technology hardware and equipment. Materials:
companies that are engaged in a wide range of commodity-related manufacturing. Telecommunication Services: companies that provide
communications services primarily through fixed-line, cellular, wireless, high bandwidth, and/or fiber-optic cable networks. Utilities: companies
considered to be electric, gas, or water utilities, or companies that operate as independent producers and/or distributors of power.
Information presented herein is for discussion and illustrative purposes only and is not a recommendation or an offer or solicitation to buy or sell
any securities. The views and opinions expressed by the Fidelity speaker are those of their own as of the date of the recording, and do not
necessarily represent the views of Fidelity Investments or its affiliates. Any such views are subject to change at any time based upon market or
other conditions and Fidelity disclaims any responsibility to update such views. These views should not be relied on as investment advice, and
because investment decisions are based on numerous factors, may not be relied on as an indication of trading intent on behalf of any Fidelity
product. Neither Fidelity nor the Fidelity speaker can be held responsible for any direct or incidental loss incurred by applying any of the information
offered. Please consult your tax or financial advisor for additional information concerning your specific situation.
The S&P 500 Index is a market capitalization-weighted index of 500 common stocks chosen for market size, liquidity, and industry group
representation to represent U.S. equity performance.
Global Industry Classification Standard (GICS) is a standardized classification system for equities developed jointly by Morgan Stanley Capital
International (MSCI) and Standard & Poor's. The GICS hierarchy begins with 10 sectors and is followed by 24 industry groups, 67 industries, and
147 sub-industries. Each stock that is classified will have a coding at all four of these levels.
35 For Investment Professionals

Important Information
Because of their narrow focus, sector funds tend to be more volatile than funds that diversify across many sectors and companies. Nondiversified
sector funds may have additional volatility because they can invest a significant portion of assets in securities of a small number of individual
issuers. The funds are considered nondiversified and can invest a greater portion of assets in securities of individual issuers than a diversified fund;
thus changes in the market value of a single investment could cause greater fluctuations in share price than would occur in a more diversified fund.
General—Fidelity Factor ETF Risk Disclosure: Stock markets, especially foreign markets, are volatile and can decline significantly in response
to adverse issuer, political, regulatory, market, or economic developments. Foreign securities are subject to interest rate, currency exchange rate,
economic, and political risks. The securities of smaller, less well-known companies can be more volatile than those of larger companies. There is
no guarantee that a factor-based investing strategy will enhance performance or reduce risk. Before investing, make sure you understand how the
fund’s factor investment strategy may differ from more traditional index products. Depending on market conditions, fund performance may
underperform compared to products that seek to track a more traditional index. The return of an index ETF is usually different from that of the index
it tracks because of fees, expenses and tracking error. An ETF may trade at a premium or discount to its Net Asset Value (NAV).
Fidelity Core Dividend ETF: Stock markets, especially foreign markets, are volatile and can decline significantly in response to adverse issuer,
political, regulatory, market, or economic developments. Foreign securities are subject to interest rate, currency exchange rate, economic, and
political risks. The securities of smaller, less well-known companies can be more volatile than those of larger companies. There is no guarantee
that a factor-based investing strategy will enhance performance or reduce risk. Before investing, make sure you understand how the fund’s factor
investment strategy may differ from more traditional index funds. Depending on market conditions, fund performance may underperform compared
to funds that seek to track a market capitalization-weighted index. The return of an index ETF is usually different from that of the index it tracks
because of fees, expenses and tracking error. An ETF may trade at a premium or discount to its Net Asset Value (NAV).
Fidelity Dividend ETF for Rising Rates: Stock markets, especially foreign markets, are volatile and can decline significantly in response to
adverse issuer, political, regulatory, market, or economic developments. Foreign securities are subject to interest rate, currency exchange rate,
economic, and political risks. The securities of smaller, less well-known companies can be more volatile than those of larger companies. There is
no guarantee that a factor-based investing strategy will enhance performance or reduce risk. Before investing, make sure you understand how the
fund’s factor investment strategy may differ from more traditional index funds. Depending on market conditions, fund performance may
underperform compared to funds that seek to track a market-capitalization weighted index. The return of an index ETF is usually different from that
of the index it tracks because of fees, expenses and tracking error. An ETF may trade at a premium or discount to its Net Asset Value (NAV).
Fidelity Low Volatility Factor ETF: Stock markets, especially foreign markets, are volatile and can decline significantly in response to adverse
issuer, political, regulatory, market, or economic developments. The securities of smaller, less well-known companies can be more volatile than
those of larger companies. There is no guarantee that a factor-based investing strategy will enhance performance or reduce risk. Before investing,
make sure you understand how the fund’s factor investment strategy may differ from more traditional index funds. Depending on market conditions,
fund performance may underperform compared to funds that seek to track a market capitalization-weighted index. The return of an index ETF is
usually different from that of the index it tracks because of fees, expenses, and tracking error. An ETF may trade at a premium or discount to its Net
Asset Value (NAV).
36 For Investment Professionals

Important Information
Fidelity Momentum Factor ETF: Stock markets, especially foreign markets, are volatile and can decline significantly in response to adverse issuer,
political, regulatory, market, or economic developments. The securities of smaller, less well-known companies can be more volatile than those of larger
companies. There is no guarantee that a factor-based investing strategy will enhance performance or reduce risk. Before investing, make sure you
understand how the fund’s factor investment strategy may differ from more traditional index funds. Depending on market conditions, fund performance
may underperform compared to funds that seek to track a market capitalization-weighted index. The return of an index ETF is usually different from that
of the index it tracks because of fees, expenses, and tracking error. An ETF may trade at a premium or discount to its Net Asset Value (NAV).
Fidelity Quality Factor ETF: Stock markets, especially foreign markets, are volatile and can decline significantly in response to adverse issuer,
political, regulatory, market, or economic developments. The securities of smaller, less well-known companies can be more volatile than those of larger
companies. There is no guarantee that a factor-based investing strategy will enhance performance or reduce risk. Before investing, make sure you
understand how the fund’s factor investment strategy may differ from more traditional index funds. Depending on market conditions, fund performance
may underperform compared to funds that seek to track a market-capitalization weighted index. The return of an index ETF is usually different from that
of the index it tracks because of fees, expenses, and tracking error. An ETF may trade at a premium or discount to its Net Asset Value (NAV).
Fidelity Value Factor ETF: Stock markets, especially foreign markets, are volatile and can decline significantly in response to adverse issuer, political,
regulatory, market, or economic developments. The securities of smaller, less well-known companies can be more volatile than those of larger
companies. Value stocks can perform differently than other types of stocks and can continue to be undervalued by the market for long periods of time.
There is no guarantee that a factor-based investing strategy will enhance performance or reduce risk. Before investing, make sure you understand how
the fund’s factor investment strategy may differ from more traditional index funds. Depending on market conditions, fund performance may
underperform compared to funds that seek to track a market-capitalization weighted index. The return of an index ETF is usually different from that of
the index it tracks because of fees, expenses, and tracking error. An ETF may trade at a premium or discount to its Net Asset Value (NAV).
© 2016 Morningstar, Inc. All rights reserved. The information contained herein: (1) is proprietary to Morningstar and/or its affiliates; (2) may not be
copied or distributed; (3) is not warranted to be accurate, complete, or timely. Neither Morningstar nor its content providers are responsible for any
damages or losses arising from any use of this information. Morningstar is a registered trademark of Morningstar, Inc., and is not affiliated with Fidelity
Investments.
Third-party trademarks and service marks are the property of their respective owners. All other trademarks and service marks are the property of FMR
LLC or an affiliated company.
Before investing in any mutual fund or exchange traded product, have your client consider its investment objectives, risks, charges, and
expenses. Contact Fidelity for a prospectus, or a summary prospectus if available, containing this information. Have your client read it
carefully.
Fidelity Investments Institutional Services Company, Inc., 500 Salem St., Smithfield, RI 02917.
794494.2.0
37 For Investment Professionals
For financial professional use only. Do not distribute to the public. 38
Thank You