fine-scale vertical structure and dynamics of dryline boundaries observed in ihop qun miao bart...
Post on 19-Dec-2015
213 views
TRANSCRIPT

Fine-scale vertical structure and dynamics of dryline boundaries observed
in IHOP
Qun Miao Bart Geerts
Department of Atmospheric ScienceUniversity of Wyoming

IHOP_2002 (International H2O Project)
13 May and 30 June 2002 in Kansas-Oklahoma
Kingair Probes
measure air motion, state variables, and fluxes
The Wyoming Cloud Radar (WCR)
95 GHz Doppler radar
BLH and CI missions
Clear-Air Echoes
Echoes observed by radars in atmosphere with no clouds or precipitation, mostly from spring to autumn.
Insects in the well-mixed convective boundary layer (CBL)
(Wilson et al. 1994, Russell and Wilson 1997, Riley 1999, Kusunoki 2002 )

Patterns of Clear-air echoes
polygonal cells -- light wind, little wind shear, and strong surface heat fluxes
banded echo structures -- helical roll circulations in a sheared CBL
Less well-defined patterns are observed more commonly
The most striking feature: thin lines of stronger radar echoes – radar “fine-line”.

The convective boundary layer
Thermals are buoyantly driven convective eddies which generate most of the turbulence in the unstable atmospheric BL.
Thermals transport energy from the surface up to the overlaying CBL.
They also contribute to the mixing (entrainment) of free-tropospheric air with the CBL.
The properties of thermals are important
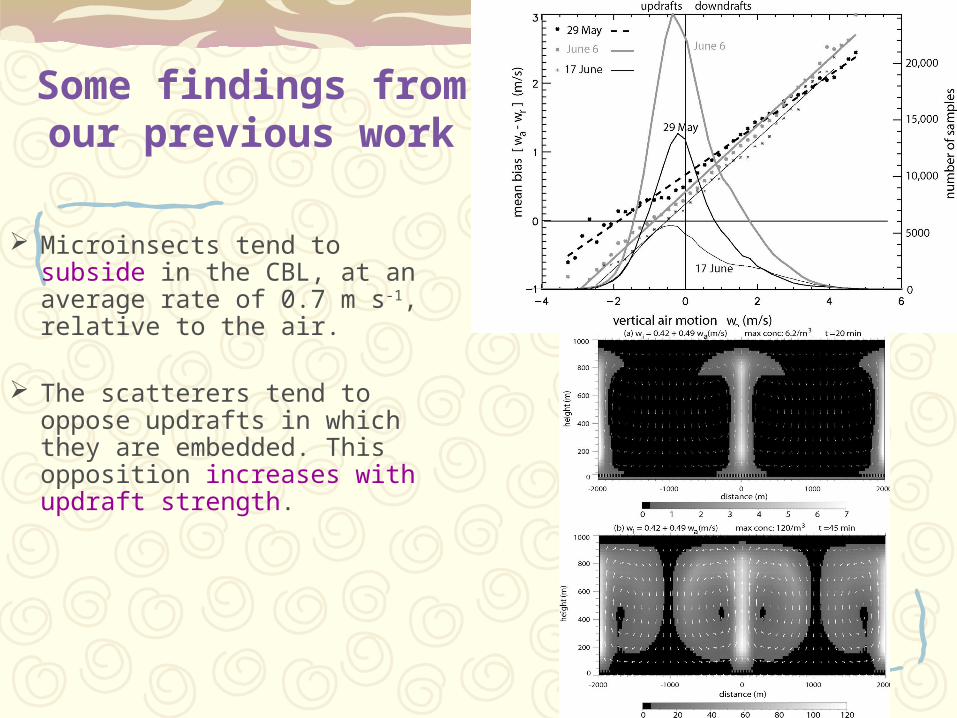
Some findings from our previous work
Microinsects tend to subside in the CBL, at an average rate of 0.7 m s-1, relative to the air.
The scatterers tend to oppose updrafts in which they are embedded. This opposition increases with updraft strength.

Some findings from our previous work
The CBL depth and its local variations are captured well by the radar reflectivity profiles.
Echo plumes are generally rising and buoyant.
The key implication is that spatial patterns of clear-air echoes within the weakly-sheared CBL depict the distribution of rising, convective plumes.
References
Geerts, B., and Q. Miao, 2005: Vertical velocity bias of echo plumes in the convective boundary layer, detected by an airborne mm-wave radar. J. Atmos. Ocean. Tech., 22, 225-246.
Geerts, B., and Q. Miao, 2005: A simple numerical model of the flight behavior of small insects in the atmospheric convective boundary layer. Environ. Entomol., 34, 353-360.
Miao, Q., B. Geerts, and M. LeMone, 2006: Vertical velocity and buoyancy characteristics of coherent echo plumes in the convective boundary layer, detected by a profiling airborne radar. J. Appl. Meteor. Climat., 45, 838–855.

Drylines
The dryline in the Great Plains
Origins of the air masses
The orientation of drylines is generally meridional and approximately normal to the terrain gradient.
It is believed that drylines are observed on more than 40% of the days from late spring to early summer (Schaefer 1974, Hoch and Markowski 2005).
Local severe thunderstorms often initiate in the vicinity of the dryline (e.g. Fujita 1958, Ziegler and Rasmussen, 1998).

What causes the convergence that gives rise to
the dryline and radar fine-line?
symmetric instability (McGinley and Sasaki 1975; Sun 1987),
solenoidal forcing due to a horizontal gradient of virtual potential temperature or the inland sea-breeze effect (Sun and Ogura 1979; Ziegler and Hane 1993),
vertical transport of westerly momentum (Danielsen 1974; McCarthy and Koch 1982)
waves (Koch and McCarthy 1982; Davies-Jones and Zacharias 1988).

The scale examined here is O (1-10 km), and the focus is on the cross-fine-line vertical circulation in the afternoon, when the CBL is well-developed.
This study examines the fine-scale radar vertical structure and flight-level data of the drylines in IHOP_2002, with as goal to gain an insight in the dynamic forcing of the fine-scale convergence.
The central hypothesis of this work is that this convergence primarily results from a horizontal difference in buoyancy and thus in virtual potential temperature (θv).
Methodology
Two methods are used to estimate the meso- scale convergence near a baroclinic boundary.
A steady solenoidal circulation
A density current
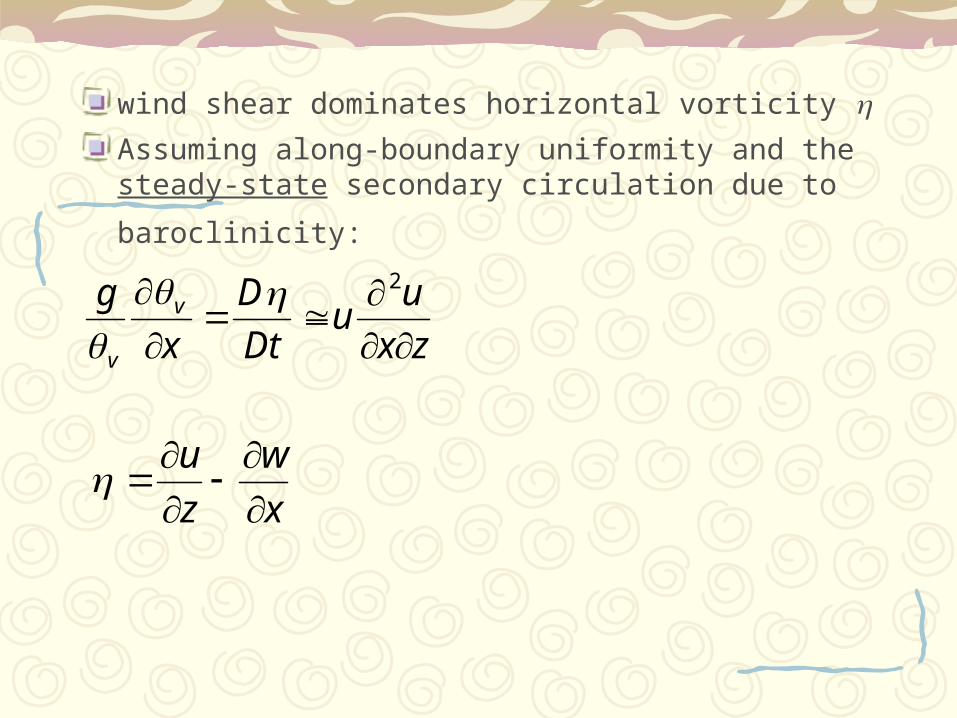
wind shear dominates horizontal vorticity Assuming along-boundary uniformity and the steady-state
secondary circulation due to baroclinicity:
zx
uu
Dt
D
x
g v
v
2
x
w
z
u

The θv driving this circulation is largest near the ground (where it is referred to as θv,o) and decreases with height.
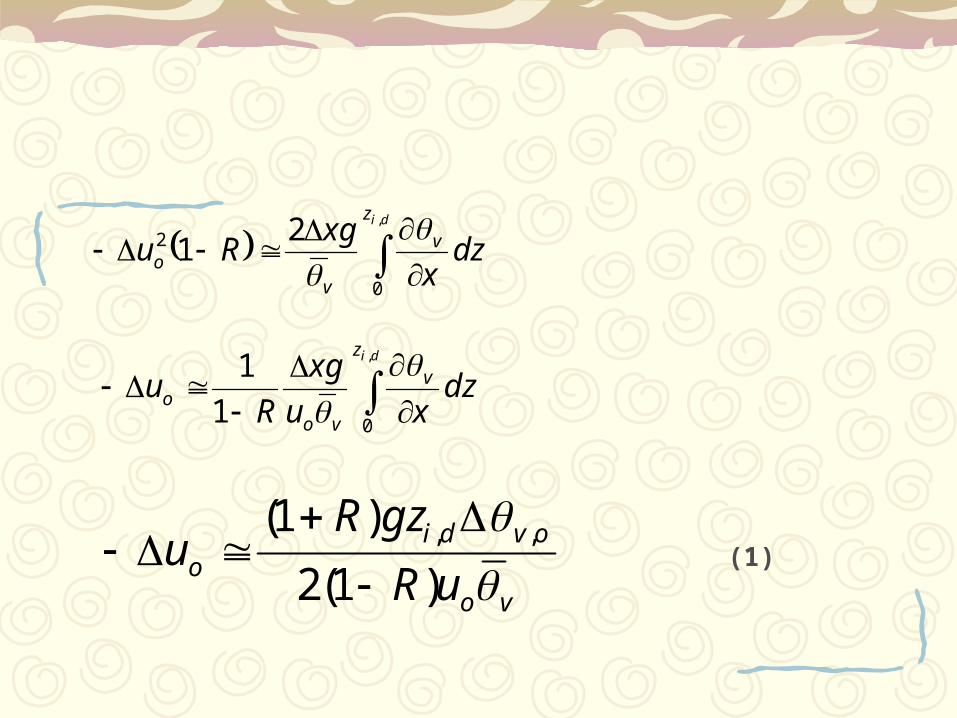
where R is the ratio of θv at zi,d to θv,o
For simplicity we use the same slope R for the profiles of θv, u, and u2.
diovv z
zR
,, )1(1

1300 m

20020522
2207-2350 UTC
diz
v
vo dz
x
xgRu
,
0
2 21
diz
v
voo dz
xu
xg
Ru
,
01
1
vo
ovdio uR
gzRu
)1(2
)1( ,,
(1)

Speed of a density current (Udc) based on laboratory experiments (Simpson and Britter 1980) ,
envv
vdcdc bU
gDKU
dcUU 4.1max
v
ovdienvdc
gzUUU
,,
max 19.1
(2)
(Simpson et al. 1977)

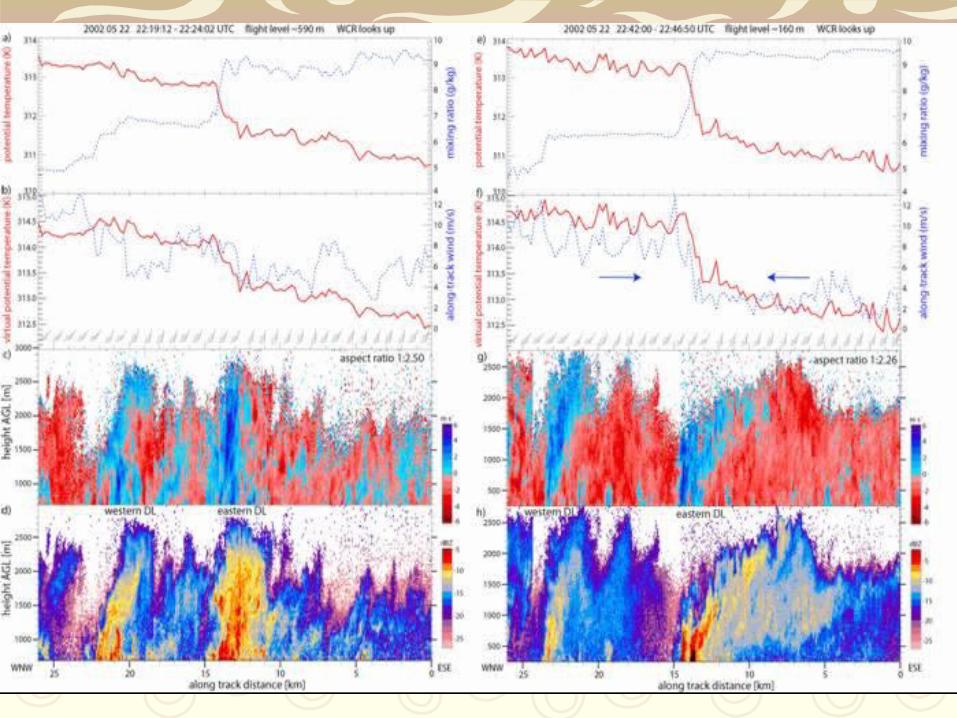
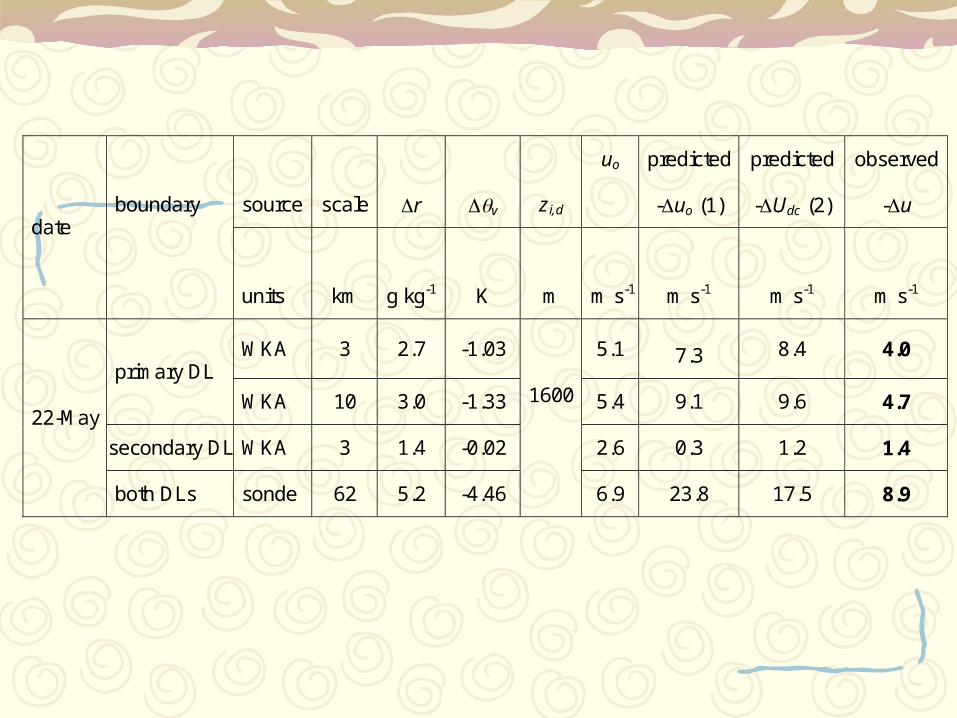
22 May
Oklahoma Panhandle
2 fine-lines, the primary dryline to the east
No convections on May 22.


source scale r v zi,d
uo predicted
-uo (1)
predicted
-Udc (2)
observed
-u date
boundary
units km
g kg-1 K m
m s-1
m s-1 m s-1 m s-1
WKA 3 2.7 -1.03 5.1 7.3 8.4 4.0 primary DL
WKA 10 3.0 -1.33 5.4 9.1 9.6 4.7
secondary DL WKA 3 1.4 -0.02 2.6 0.3 1.2 1.4
22-May
both DLs sonde 62 5.2 -4.46
1600
6.9 23.8 17.5 8.9

19 June
a prefrontal dryline in NW Kansas
clear skies, no deep convection before 20:30 Z. The dryline progresses from west to east.
after 2135 UTC, the dryline accelerated towards the northwest. Thunderstorms erupted just east of the dryline in the vicinity of
misocyclones .


date boundary source scale r v zi,d uo predicted -uo (1)
predicted -Udc (2)
observed -U
WKA 3 1.2 0.32 2.4 4.7 4.7 6.1
WKA 10 1.4 0.75 2.9 9.4 7.2 7.2
early phase DL (dry side cooler)
sonde 18 2.0 0.59
1610
3.2 6.6 6.4 7.7
WKA 3 1.5 -0.49 3.7 4.1 5.4 7.1
WKA 10 2.9 -0.66 2.8 7.2 6.3 8.3
19-Jun
late phase DL (moist side cooler)
sonde 38 3.8 -0.89
1380
6.0 4.6 7.3 9.1

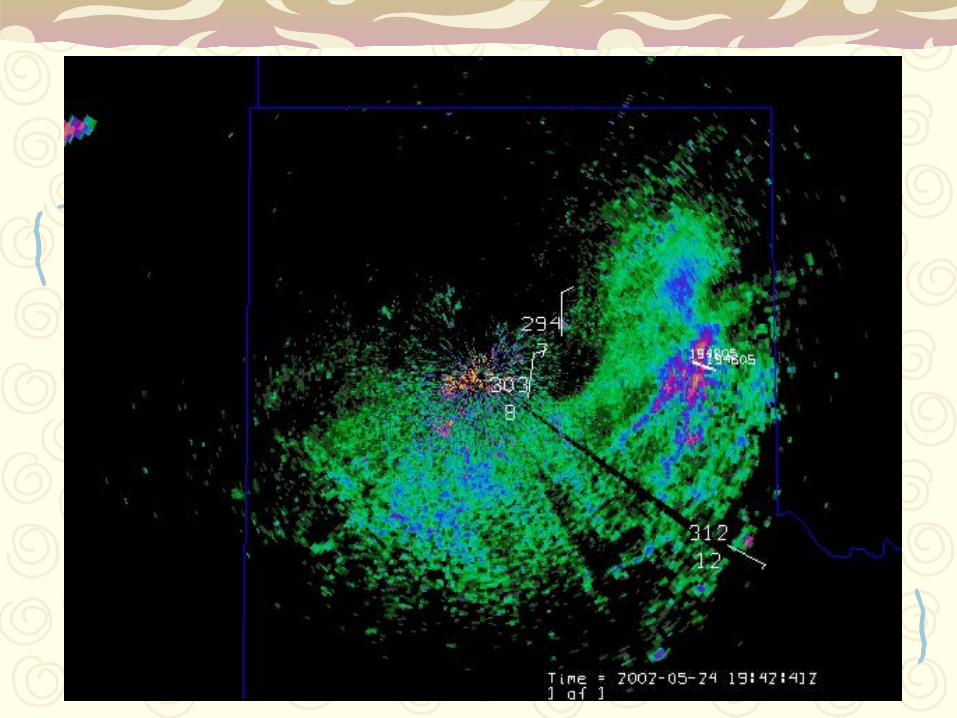
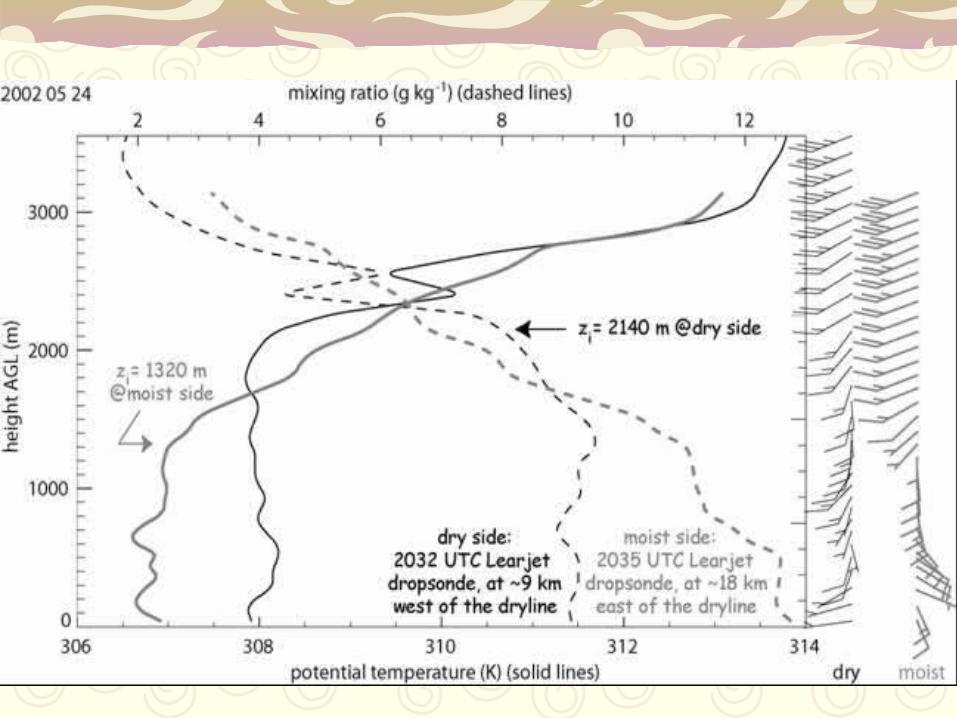
24 May
Texas Panhandle
erased by a cold front


source scale r v zi,d uo predicted
-uo (1) predicted -Udc (2)
observed -u date
boundary
units km
g kg-1 K m
m s-1
m s-1 m s-1 m s-1
WKA 3 1.7 -0.29 2.5 3.7 4.1 3.9 western DL
WKA 10 1.3
-0.24 1320
4.3 1.8 3.7 3.3
WKA 3 1.9
-0.46 2.5 5.2 4.9 4.3
WKA 10 2.2
-0.54 2.6 5.9 5.3 4.8 eastern DL
sonde 27 3.3
-0.72
1200
4.2 5.3 6.4 4.9
WKA 3 - 2.90 4.8 11.3 10.0 7.8
WKA 10 - 4.11 5.7 13.4 11.9 9.1
24-May
cold front
sonde 19 -
6.14
800
6.9 16.6 14.5 10.6

18 June
southwest Kansas
A belt of cumulus clouds developed around 2130 UTC.

source scale r v zi,d uo predicted
-uo (1) predicted -Udc (2)
observed -u date
boundary (DL=dryline)
units km
g kg-1 K m
m s-1
m s-1 m s-1 m s-1
WKA 3 2.1 -0.35 3.0 2.8 3.9 2.5
WKA 10 2.8 -0.84 3.3 5.9 6.1 3.0 early phase
sonde 32 3.1 -1.94
1020
5.2 8.6 9.2 3.9
WKA 3 2.4 -0.41 6 2.4 5.1 1.7
WKA 10 3.1 -0.87 6.8 4.3 7.5 2.2 late phase primary DL
sonde 15 2.3 -1.05
1500
6.4 5.6 8.2 3.0
WKA 3 2.2 -0.19 3.6 1.8
3.5 5.5
18-Jun
late phase secondary DL
WKA 10 2.6 -0.46 1500
4.2 3.7
5.4 5.7

date boundary source scale r v zi,d uo predicted -
uo (1) predicted -Udc (2)
observed -U
7-Jun 1994
VORTEX DL NOAA P-3 10 4.7 -1.9 1500 5.5 11.8 11.1 9.4
6-May 1995
VORTEX DL NOAA P-3 10 5.7 -1.8 1300 5.3 8.8 8.2 7.0
all, x=3 km 3 1.9 -0.3 3.6 ( 88%) 4.6 (113%) 4.1
all, x=10km 10 3.0 -0.8 6.8 (122%) 7.0 (127%) 5.6
all, sondes 15-62 3.3 -1.4 9.1 (145%) 9.2 (147%) 6.3
average
all scales 6.2 (119%) 6.7 (129%) 5.2

4 days
below 0.5zi,d
5 legs on 22 May
3 on 24 May
9 on 18 June
4 on 19 June
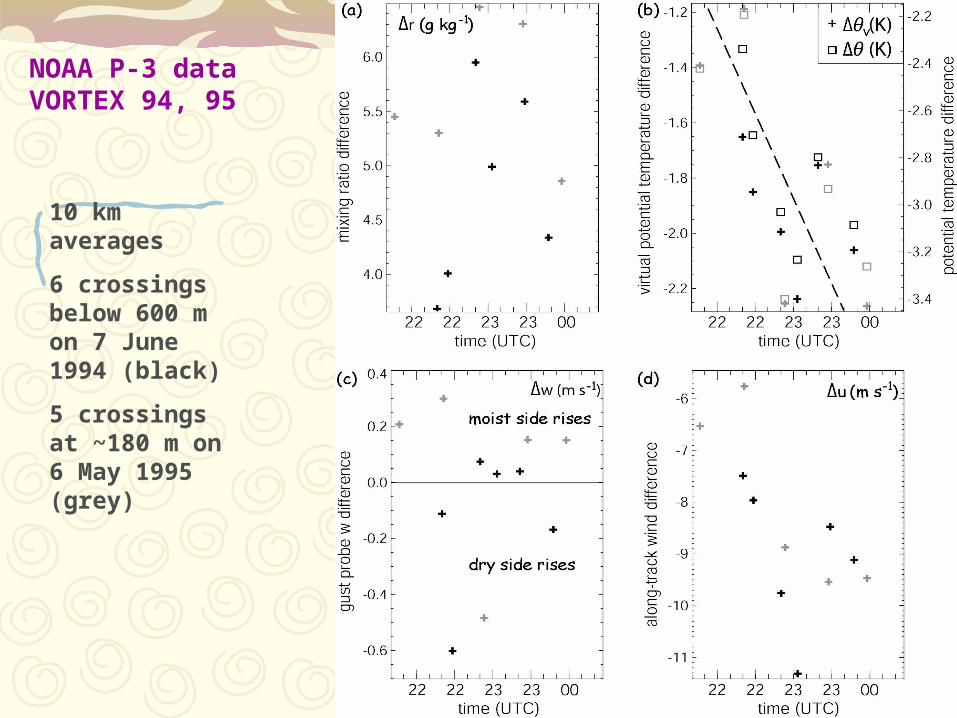
NOAA P-3 data VORTEX 94, 95
10 km averages
6 crossings below 600 m on 7 June 1994 (black)
5 crossings at ~180 m on 6 May 1995 (grey)

Conclusions
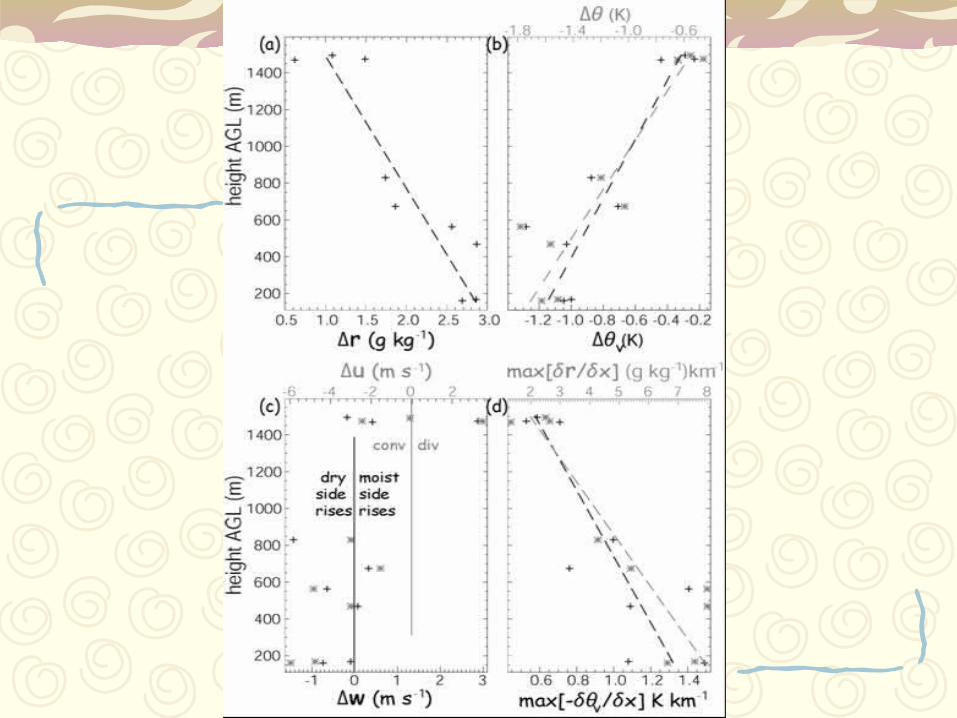
The 22 May primary dryline, a clearly sloping WCR echo and updraft plume, a secondary circulation with a denser moist airmass a θv of 1.3K over 10 km, decreasing with height in the CBL.
sufficient to explain the observed fine-scale confluence, in terms of a baroclinically-induced circulation.
Other fine-lines all convergent, and all are marked by some low-level θv, but less
than 1.0K over 10 km. In some cases the fine-scale confluence exceeds that expected from
baroclinicity alone. Some slope in the echo plume, towards the denser airmass, but no
solenoidal circulation.

A steady solenoidal circulation and density current theory, are used to estimate the meso- scale convergence near a baroclinic boundary. Both methods tend to overestimate confluence, especially for well-defined boundaries (large θv). The optimal scale at which θv and u are measured is close to 3 km.
In most cases a mesoscale θv gradient is present. A threshold gradient may exist for the development of one or more radar fine-lines.
θv exceeds 0.5K over 10 km.Similarly, fine-line boundaries may assume density-current properties once their θv exceeds a threshold.
θv exceeds 1.0K over 10 km.

Future work
More field measurements with multiple observational platforms
Vegetation, soil moisture, and terrain through both observation and land surface models
Comparison with the results of some high-resolution modeling work (e.g. Ziegler et al. 1997, Peckham et al. 2004, Xue and Martin 2006).

Questions?