fingerprint enhancement revisited and the effects …...fingerprint enhancement revisited and the...
TRANSCRIPT

REFERENCE: Frégeau CJ, Germain O, Fourney RM. Fingerprintenhancement revisited and the effects of blood enhancement chem-icals on subsequent Profiler Plus™ fluorescent short tandem repeatDNA analysis of fresh and aged bloody fingerprints. J Forensic Sci2000;45(2):354–380.
ABSTRACT: This study was aimed at determining the effect ofseven blood enhancement reagents on the subsequent ProfilerPlus™ fluorescent STR DNA analysis of fresh or aged bloody fin-gerprints deposited on various porous and nonporous surfaces.Amido Black, Crowle’s Double Stain, 1,8-diazafluoren-9-one(DFO), Hungarian Red, leucomalachite green, luminol and ninhy-drin were tested on linoleum, glass, metal, wood (pine, paintedwhite), clothing (85% polyester /15% cotton, 65% polyester /35%cotton, and blue denim) and paper (Scott® 2-ply and Xerox-grade).Preliminary experiments were designed to determine the optimalblood dilutions to use to ensure a DNA typing result followingchemical enhancement. A 1:200 blood dilution deposited onlinoleum and enhanced with Crowle’s Double Stain generatedenough DNA for one to two rounds of Profiler Plus™ PCR ampli-fication. A comparative study of the DNA yields before and aftertreatment indicated that the quantity of DNA recovered from bloodyfingerprints following enhancement was reduced by a factor of 2 to12. Such a reduction in the DNA yields could potentially compro-mise DNA typing analysis in the case of small stains. The blood en-hancement chemicals selected were also evaluated for their capabil-ity to reveal bloodmarks on the various porous and nonporoussurfaces chosen in this study. Luminol, Amido Black and Crowle’sDouble Stain showed the highest sensitivity of all seven chemicalstested and revealed highly diluted (1:200) bloody fingerprints. Bothluminol and Amido Black produced excellent results on both porousand nonporous surfaces, but Crowle’s Double Stain failed to pro-duce any results on porous substrates. Hungarian Red, DFO, leuco-malachite green and ninhydrin showed lower sensitivities. En-hancement of bloodmarks using any of the chemicals selected, andshort-term exposure to these same chemicals (i.e., less than 54days), had no adverse effects on the PCR amplification of the nineSTR systems surveyed (D3S1358, HumvWA, HumFGA, D8S1179,D21S11, D18S51, D5S818, D13S317, D7S820) or of the gender de-termination marker Amelogenin. The intensity of the fluorescentsignals was very similar and the allele size measurements remainedconstant and identical to those of untreated bloody fingerprints. Noadditional background fluorescence was noted. Continuous expo-sure (for 54 days) to two of the seven enhancement chemicals se-
lected (i.e., Crowle’s Double Stain and Hungarian Red) slightly re-duced the amplification efficiency of the longer STR loci in profilesof fresh and 7 to 14-day-old bloodprints. This suggests that long-term exposure to these chemicals possibly affects the integrity of theDNA molecules. This study indicates that significant evidence canbe obtained from fresh or aged bloody fingerprints applied to a va-riety of absorbent and nonabsorbent surfaces which are exposed todifferent enhancement chemicals for short or long periods of time.It also reaffirms that PCR STR DNA typing procedures are robustand provide excellent results when used in concert with fluores-cence-based detection assays after fingerprint identification hastaken place.
KEYWORDS: forensic science, fingermark, fingerprint, bloodenhancement chemicals, short tandem repeat (STR), multiplex, flu-orescence, polymerase chain reaction (PCR), sequencer, DNA anal-ysis, presumptive test reagents, Amido Black, Crowle’s DoubleStain, 1,8-diazafluoren-9-one (DFO), Hungarian Red, leucomala-chite green, luminol, ninhydrin
Fingerprint detection and analysis for individual identificationhas undergone tremendous changes since its introduction to the in-vestigation of crimes in 1892. In the beginning, latent fingerprintswere revealed by dusting with powder such as amorphous carbon,fuming with iodine vapor, or using silver nitrate (1,2). Later on,chemicals such as ninhydrin, capable of developing latent finger-prints on paper, were identified (3). More research culminated inthe characterization and development of many different methods tochemically reveal and further enhance latent fingerprints on a vari-ety of porous and nonporous surfaces. The use of ninhydrin ana-logues (4), a combination of ninhydrin and trypsin (5), ninhydrinand metal salts (6,7), glues containing cyanoacrylate ester (8,9),different types of lasers (10,11) in combination with fluorescentdyes, luminescent dusting powders or conventional latent print en-hancing chemicals (9,12–15) are some of the more recent develop-ments in latent fingerprint identification. In parallel to these ad-vancements, progress was recorded in the field of serology wherea number of effective reagents were identified and used to detectthe possible presence of blood on a variety of substrates at a crimescene or in the laboratory. Interestingly, luminol, which was firstutilized in 1939 as a screening test for blood (16), remains one ofthe most popular compounds for blood detection along with phe-nolphthalein, leucomalachite green, and tetramethylbenzidine(17–26). Other protein stains such as Amido Black, leucocrystal vi-olet, Coomassie Brilliant Blue R250, Crowle’s Double Stain, DFO
354
Chantal J. Frégeau,1 Ph.D.; Olivier Germain,2 B.S.; and Ron M. Fourney,1 Ph.D.
Fingerprint Enhancement Revisited and theEffects of Blood Enhancement Chemicals onSubsequent Profiler Plus™ Fluorescent ShortTandem Repeat DNA Analysis of Fresh and AgedBloody Fingerprints
1 Royal Canadian Mounted Police, Central Forensic Laboratory, NationalDNA Data Bank, Ottawa, Ontario, Canada.
2 Département de chimie-biologie, Université du Québec à Trois-Rivières,Trois-Rivières, Québec, Canada
Received 19 April 1999; and in revised form 9 July 1999; accepted 12 July1999.
Copyright © 2000 by ASTM International

and Hungarian Red can also be included in the list of chemicalscurrently employed as good indicators for the possible presence ofblood (26–31). Benzidine and ortho-tolidine, routinely used in theearly days of fingerprint analysis, have been banned by many lab-oratories because of their potential carcinogenic properties. Sincefingerprints in blood were frequently encountered at crime scenes,it became pertinent to determine the effects of enhancing chemicalsor latent fingerprint detection procedures on subsequent serologi-cal tests to be performed on the exhibits collected. Earlier reportsdemonstrated that the direct treatment of dried bloodstains withseveral presumptive test reagents or with fingerprint enhancingchemicals could have significant detrimental and destructive ef-fects on subsequent serological tests using ABO typing or poly-morphic enzymes as genetic markers (2,32–34). More recent in-vestigations using modern technologies to analyze body fluidstains, such as the restriction fragment length polymorphism(RFLP) variable number of tandem repeat (VNTR) analysis(35–37), have indicated that some presumptive test reagents (e.g.,silver nitrate, benzidine dissolved in glacial acetic acid, leucomala-chite green, o-tolidine) could have an adverse effect on the recov-ery of high molecular weight DNA which could compromise typ-ing results (32,38). In contrast, successful RFLP DNA typing wasachieved from bloodstains on white cotton cloth exposed to laserlight, alternate light sources (i.e., nonlaser high-energy lightsources such as Omniprint 1000), cyanoacrylate ester (“SuperGlue”) fuming, acetone, iodine fumes, Rhodamine 6G and crystalviolet (32,39). Hochmeister et al. (38) also reported successfulRFLP typing from blood deposited on glass and 100% cotton sub-strates treated with luminol, benzidine dissolved in ethanol, andphenolphthalein. A study by Stein et al. (40) indicated that expo-sure to cyanoacrylate ester fuming, ninhydrin, and gentian violetfor up to 14 days did not have any deleterious effect on the suit-ability of bloodstains on metal, paper and adhesive tape for typingusing the RFLP procedure. The advent of the polymerase chain re-action (PCR; 41) targetting smaller size range VNTR loci such asthe short tandem repeats (STRs; 42–44) offers new and more sen-sitive strategies for the analysis of challenging samples found atcrime scenes. Smaller size samples can be used for typing andDNA profiles have been generated from highly degraded material(45–51).
One of the latest developments in PCR STR DNA typing tech-nology has been the simultaneous PCR amplification of multipleSTR loci in a single reaction tube (i.e., multiplex reaction), furtherreducing the quantity of genetic material required for a DNA anal-ysis (52–55). This major advancement combined with the highlysensitive four-color fluorescence-based detection technology, hasenabled reliable identifications from challenging forensic speci-mens presenting minute amounts of genetic material (56–59).Three independent research groups have investigated the effects ofenhancement reagents on subsequent PCR-based typing of treatedbloodstains. Hochmeister et al. (60) reported successful PCR-basedtyping of bloodstains on razor blades and plastic foil that had beenenhanced using cyanoacrylate, Rhodamine 6G and Ardrox™, al-ternate light source and argon laser. Stein et al. (40) tested amor-phous carbon on glass slides, cyanoacrylate on razor blades andplastic foils, gentian violet on sticky surfaces of adhesive tapes, andninhydrin on white paper; no deleterious effects on the subsequentanalysis of STRs were noted even 56 days post-treatment. A studyby Andersen and Bramble (61) focused on the effects of finger-mark enhancement light sources on PCR STR DNA analysis offresh blood smears. These authors found that four of the five lightsources had no appreciable effect on the PCR analysis. However,
exposure of the bloodstains to shortwave UV light for more than 30seconds had an adverse effect on the recovery of DNA which wasclearly evident from the lack of significant PCR typing results.
To complement these studies and expand the spectrum of sub-strates and blood enhancement reagents examined in previous in-vestigations, as well as take advantage of the latest developmentsin the field of DNA profiling, seven enhancement chemicals(Amido Black, Crowle’s Double Stain, DFO, Hungarian Red, leu-comalachite green, luminol and ninhydrin) were tested on blood-stains and blood drops applied to nonporous (linoleum, glass andmetal) and porous substrates [wood (pine, painted white), clothing(85% polyester/15% cotton; 65% polyester/35% cotton; bluedenim) and paper ( Scott® 2-ply; Xerox-grade)]. The first phase ofthe study established the optimal blood dilutions required to obtainsufficient genetic material to ensure typing results in the subse-quent phases of the study. In addition, Phase 1 evaluated the effectof one preselected chemical enhancement agent (e.g., Crowle’sDouble Stain) on the DNA yield from bloodstains deposited on anonporous surface such as linoleum. The second phase of the studydefined the limit of blood detection of the seven enhancementchemicals applied to various porous and nonporous surfaces. Theshort-term and long-term exposure effects of enhancement on thesubsequent Profiler Plus™ fluorescent STR DNA analysis of freshand aged bloody fingerprints were determined in the third andfourth phases of the study, respectively. This recently developedcommercial multiplex amplification system (62) surveys nine STRloci simultaneously consisting of D3S1358, HumvWA, HumFGA,D8S1179, D21S11, D18S51, D5S818, D13S317 and D7S820, aswell as the gender determination marker, Amelogenin.
Materials and Methods
Substrates—The selection of substrates for this study was basedon those most commonly encountered at crime scenes. This in-cluded linoleum, glass and metal as the nonporous surfaces andwood (pine, painted white), clothing (85% polyester/15% cotton;65% polyester/35% cotton; blue denim) and paper (Scott® 2-ply,Xerox-grade) as the porous substrates. In Phase 1, linoleum was se-lected from all surfaces because of its nonporous nature which, incombination with Crowle’s Double Stain, represented one of theworst scenarios for recovering DNA from bloody fingerprints. InPhase 2 of the study, seven of the nine substrates were evaluated;the 65% polyester/35% cotton blend fabric and the Xerox-gradepaper were not used. Phases 3 and 4 tested five of the nine selectedsubstrates: linoleum, glass, wood (pine, painted white), clothing(65% polyester/35% cotton) and paper (Xerox-grade).
All selected substrates were cut in a 15 3 8 cm size and each sur-face was cleaned, whenever possible, using ethanol prior to the ap-plication of blood.
Blood Samples—Blood samples from two individuals (one fe-male, one male) were collected in 7 mL Vacutainers™ (containingthe anticoagulant EDTA). The blood from the female individual isreferred to as blood A and the blood from the male individual asblood B. Blood was applied to the various surfaces as drops or fin-gerprints; the aliquots used in each phase of the project are listed inTable 1. Dilutions of whole blood were prepared using filtered, au-toclaved and deionized (FAD) water. Using an Eppendorf pipet tip,the bloodprints were made by placing the undiluted or dilutedblood of donors A or B on a fingertip, cleaned with ethanol, mak-ing an effort to spread the blood over the surface of the fingertip.Then by applying some pressure on the fingertip the blood was
FRÉGEAU ET AL. • BLOOD ENHANCEMENT AGENTS AND DNA ANALYSIS 355

356 JOURNAL OF FORENSIC SCIENCES
transferred onto each different surface. The bloodprints were driedovernight at room temperature, in a laminar flow hood, then wereimmediately subjected to enhancement procedures or were left atroom temperature on a bench or in the laminar flow hood for fur-ther periods of time before enhancement (see Phase 4).
Enhancement of Blood Drops or Bloody Fingerprints—Detec-tion and enhancement of blood drops and fingerprints mixed withblood were performed using seven different chemicals. AmidoBlack (methanol based), Crowle’s Double Stain, Hungarian Red(fuchsin acid), leucomalachite green and luminol were tested onseven of the nine surfaces selected (Table 2); the 65%polyester /35% cotton clothing and Xerox-grade paper were nottreated with these blood reagents. Ninhydrin and 1,8-diazafluoren-9-one were used solely on the porous surfaces (i.e., blue denim,85% polyester /15% cotton clothing, and paper [Scott® 2-ply andXerox-grade]).
The preparation of each reagent and components of the stainingand destaining (washing) solutions are detailed in Table 3. Experi-ments were designed to mimic procedures adopted by the RoyalCanadian Mounted Police (RCMP) forensic identification officersand, as none of these protocols use fixative solutions in the field, thebloodmarks were not fixed to the substrate prior to enhancement(63). The blood drops or bloody fingerprints were treated for 1 to 5min with the staining solution (depending on the surface/reagentcombination), using a dropper for application in the case of AmidoBlack, Crowle’s Double Stain and Hungarian Red, a spray bottle forleucomalachite green and luminol, or immersing the substrate in so-lution in a beaker for DFO and ninhydrin. In the case of AmidoBlack, Crowle’s Double Stain and Hungarian Red, an identicaldropper was used to apply a destaining solution to eliminate thebackground staining and better reveal the bloodmarks.
In Phases 1, 2 and 3 of the project, treatment of the blood dropsor bloody fingerprints with the reagents was performed immedi-ately after they were allowed to dry. In Phase 4, the bloodprintswere allowed to dry for different periods of time (overnight, 7 daysand 14 days) prior to their chemical treatment. All enhanced blooddrops or bloody fingerprints were left to dry at room temperature ina laminar flow hood for a few minutes up to 18 hours prior to be-ing photographed. Bloodprints were then visually inspected to as-sess the limit of detection of each chemical reagent (Phase 2) orwere directly processed for DNA extraction (Phases 1, 3 and 4).
DNA Extraction—Dried bloodprints (3 3 1.5 cm) on linoleum,glass, metal or painted wood were swabbed with 1 cm2 pieces ofVWR 238 blotting paper (VWR Scientific, Ville Mont-Royal,Québec; manufactured by Ahlström Filtration Inc., Mt. HollySprings, PA) moistened with FAD water. For clothing, denim orpaper, bloodprints were cut into 1 cm2 pieces of material. The en-tire bloodprints were used up in the process. All samples were sub-jected to a one-step organic DNA extraction protocol (64). Essen-tially, the swabs or the cuttings (up to three pieces per bloodprint incertain cases) were incubated at 56°C for a minimum of 6 h and amaximum of 18 h in the presence of stain extraction buffer (10 mMTris, pH 8.0, 10 mM EDTA, 100 mM NaCl, 40 mM DTT, 2% SDS)and proteinase K solution (20 mg/mL). Following centrifugation,the stain extract was mixed with equal volumes of phenol and chlo-roform/isoamyl alcohol 24:1 (v/v). The aqueous phase containingthe DNA was then transferred to a membrane-based microconcen-trator device (Microcon®-100, cut off at 100 basepairs or 300 basesfor DNA/RNA; Amicon® Inc., Beverly, MA) for further purifica-tion and concentration following recommendations by the manu-facturer. DNA extracts in a final volume of 50 mL were stored at4°C until required.
DNA Quantitation—Quantitation of human genomic DNA ex-tracted from blood drops or bloodprints was determined using achemiluminescence-based detection slot blot hybridization proce-dure (65). A biotinylated primate-specific D17Z1 a-satellite probewas used to hybridize to the “unknown” and reference samples(i.e., twofold serial dilutions of the control cell line GM9947A, (66;NIST Standard Reference Material #2391 PCR-based DNA Profil-ing Kit), immobilized on the membrane.
PCR Primers—The Profiler Plus™ PCR amplification multi-plex recently developed by Applied Biosystems Division of PerkinElmer and evaluated in Phases 3 and 4 of this study, is comprisedof nine STR systems and the gender determination system, Amel-ogenin. These genetic markers are listed in Table 4 and are pre-
TABLE 1—Quantities and dilutions of blood used in this study.
Phase Quantities of Bloodof Used for Making
Study Drops or Fingerprints Tested Dilutions
A 20 mL; blood drops undiluted, 1:2, 1:5, 1:10, 1:20,1:50, 1:100, 1:200
1 B 5 mL, 10 mL, 15 mL undiluted, 1:10, 1:5020 mL; bloodprints
C 20 mL; bloodprints undiluted, 1:2, 1:5, 1:10, 1:20,1:50, 1:100, 1:200
A 20 mL; blood drops undiluted, 1:2, 1:5, 1:10, 1:20,2 1:50, 1:100, 1:200
B 20 mL; bloodprints undiluted, 1:2, 1:5, 1:10, 1:20,1:50, 1:100, 1:200
3 10 mL; bloodprints undiluted, 1:204 10 mL; bloodprints undiluted
TABLE 2—Substrates and blood enhancement regimen used in eachphase of the project.
Phase Blood EnhancementSubstrate Chemical
1 Linoleum Crowle’s Double Stain2 Linoleum Amido Black,
Clear glass Crowle’s Double Stain,Metal Hungarian Red,White painted wood leucomalachite green,Blue denim luminol85% polyester/15% cottonPaper towel (Scott® 2-ply)
Blue denim 1,8-diazafluoren-9-one,85% polyester/15% cotton ninhydrinPaper towel (Scott® 2-ply)
3 & 4 Linoleum Amido Black,Clear glass Crowle’s Double Stain,White painted wood Hungarian Red,
leucomalachite green,luminol
65% polyester/35% cotton luminol
White paper (Xerox-grade) 1,8-diazafluoren-9-one,ninhydrin
{{

FRÉGEAU ET AL. • BLOOD ENHANCEMENT AGENTS AND DNA ANALYSIS 357
TABLE 3—Enhancement chemicals and their preparation.
Blood Enhancement Reagent Recipe
Amido Black Staining: 0.2 g Amido Black (Naphthalene Black 12B; BDH Chemicals)10 mL glacial acetic acid90 mL methanol
Destaining: 90 mL methanol, 10 mL glacial acetic acid
Crowle’s Double Stain Staining: 2.5 g Crocein Scarlet 7B (Brilliant Crocein; Aldrich Chemical)150 mg Coomassie Brilliant Blue R250 (Merck)50 mL glacial acetic acid30 mL trichloroacetic acidDiluted to 1 L with distilled water
Destaining: 3 mL glacial acetic acid in 1 L of distilled water
DFO (1,8-diazafluoren-9-one) Staining: 0.25 g DFO (Lumichem)20 mL glacial acetic acid100 mL ethanol
Complete to 1 L with heptane
Hungarian Red Staining: Commercial solution of Hungarian Red (BVDA International)Glacial acetic acidSulfosalicylic acid
Destaining: distilled water/glacial acetic acid (19:1 v/v)
Leucomalachite green Staining: 0.2 g leucomalachite green (Aldrich Chemical Co.)0.67 g sodium perborate66.6 mL methanol33.3 mL glacial acetic acid300 mL freon (1-1-2-trichlorotrifluorethane)
The reagent has no shelf life and must be prepared just prior to use.
Luminol Staining: 0.5 g luminol (Aldrich Chemical Co.)25 g sodium carbonate500 mL distilled water3.5 g sodium perborate (added immediately prior to use)
The reagent has no shelf life and must be prepared just prior to use.
Ninhydrin Staining: Ninhydrin stock solution:25 g ninhydrin (Lumichem)50 mL glacial acetic acid100 mL ethanol
Ninhydrin working solution:30 mL stock solution50 mL ethanolComplete to 1 L with heptane
TABLE 4—Genetic markers surveyed in the study.
Locus Chromosome Size Range DyeDesignation Location Common Sequence Motif (bases)* Label†
D3S1358 3p TCTA(TCTG)1–3(TCTA)n 113–144 FAM (B)HumvWA‡ 12p12-pter TCTA(TCTG)3–4(TCTA)n 156–198 FAM (B)HumFGA‡ 4q28 (TTTC)3 TTTTTTCT(CTTT)nCTCC(TTCC)2 218–265 FAM (B)Amelogenin X: p22.1-p22.3 N/A 106 JOE (G)
Y: p11.2 N/A 112D8S1179§ 8 (TCTR)n
| 126–169 JOE (G)D21S11 21q21 (TCTA)n(TCTG)n[(TCTA)3TA(TCTA)3TCA(TCTA)2TCCATA] 188–245 JOE (G)
(TCTA)n
D18S51 18q21.3 (AGAA)n 273–343 JOE (G)D5S818 5q21-q31 (AGAT)n 134–172 NED (Y)D13S317 13q22-q31 (GATA)n 206–236 NED (Y)D7S820 7q (GATA)n 258–295 NED (Y)
* As defined by the AmpF,STR Profiler Plus™ Allelic Ladder. Includes the 39 nucleotide addition (n 1 1).† FAM: 5-carboxyfluorescein (absorbance at 495 nm, emission at 525 nm); JOE: 29,79-dimethoxy-49,59-dichloro-6-carboxyfluorescein (525 nm,
555nm); NED: proprietary. Letters in parentheses correspond to the color of product: B 5 blue, G 5 green, Y 5 yellow.‡ vWA31/A, von Willebrand factor gene; FGA (FIBRA), alpha fibrinogen.§ In some literature references, this locus is designated as D6S502.| R can represent either an A or G nucleotide.

358 JOURNAL OF FORENSIC SCIENCES
sented according to their locus designations, chromosomal loca-tions, repeat units, amplicon size ranges and dye labels. Due topending patent, the primer sequences remain proprietary to thecompany and are unavailable for publication.
Amplification Conditions—Simultaneous amplification of thenine STR systems described in Table 4 as well as the gender de-termination marker, Amelogenin, was conducted in a 25 mL finalreaction volume containing 1 ng to 2.5 ng of genomic DNA (in atotal volume of 10 mL with FAD water completing the volume),9.5 mL of the AmpF,STR PCR Reaction Mix, 5 mL of theAmpF,STR Profiler Plus™ Primer Set Solution and 0.5 mL ofAmpliTaq Gold™ DNA Polymerase (5 U/mL stock). The reac-tion mixtures were subjected to a hot start at 95°C for 11 min toactivate the AmpliTaq Gold™ DNA Polymerase. Amplificationswere carried out for 28 cycles using the following parameters: de-naturation for 60 s at 94°C, annealing of primers for 90 s at 59°Cand extension for 90 s at 72°C. A final extension at 60°C for 45min, followed by an overnight incubation at room temperature,were also included as these conditions were found necessary topromote the 39 terminal transferase activity of the AmpliTaqGold™ DNA Polymerase. All amplifications were conducted in aPerkin Elmer GeneAmp™ PCR System 9600 thermal cycler us-ing thin-walled 0.2 mL MicroAmp™ Reaction Tubes.
The control cell line GM9947A (66; NIST Standard ReferenceMaterial #2391 PCR-based DNA Profiling Kit) served as the posi-tive amplification control and FAD water as the negative amplifi-cation control.
Analysis of Amplification Products—Analysis of the ProfilerPlus™ fluorescent amplified products was performed as follows:an aliquot of 2 mL of each PCR reaction was mixed with 0.5 mL ofABI GeneScan™-350 Internal Lane Size Standard (labeled with 6-carboxy-X-rhodamine [ROX, a fluorescent dye from ABI]) and 4mL of denaturing loading buffer (20 mg/mL blue dextran, 7.3 Murea, 2X TBE, 20 mM EDTA). Following denaturation at 95°C for2 to 3 min, samples were snap-cooled in ice cold water and 1.6 mLaliquots were loaded on a 4% (19:1) acrylamide:bisacrylamide gelcontaining 6 M urea (36 cm well-to-read glass plate format), whichhad been prerun at constant voltage (1000 V) for 30 min and equi-librated to 51°C. Electrophoresis was conducted for 2 h at constantvoltage (3000 V) in 1X TBE using an ABI PRISM® 377 DNA Se-quencer with the laser set at 40 mW. Allele sizes were determinedusing the GeneScan® Analysis v.2.1 software and the Local South-ern size calling method. Automatic allele designation was achievedusing the Genotyper® v.2.1 software (Applied Biosystems Divi-sion of Perkin Elmer).
Experimental Designs
Phase 1—A comparative study was undertaken to determine theyield of DNA retrievable from blood drops and bloodprints (pre-pared with different concentrations of blood) before and after en-hancement. One series of blood dilutions from individual B wasprepared in FAD water and ranged in concentration from 1:2 to1:200. Aliquots of 20 mL of these dilutions were then deposited asdrops on linoleum and allowed to air dry at room temperature priorto collection and processing for DNA extraction and quantitation.A series of bloody fingerprints was produced on linoleum usingdifferent aliquots (5,10,15, and 20 mL) of undiluted blood from in-dividual B, as well as two different blood dilutions (1:10 and 1:50).
Fingerprints were left to air dry at room temperature before beingprocessed for DNA extraction and DNA quantitation. Finally, a se-ries of bloody fingerprints was prepared using 20 mL aliquots of di-luted blood from individual B (dilutions ranging from 1:2 to 1:200)and was applied to linoleum, allowed to air dry completely at roomtemperature prior to enhancement with Crowle’s Double Stain.Following treatment with Crowle’s Double Stain, the bloody fin-gerprints were swabbed and processed for DNA extraction andquantitation as outlined in previous sections.
Linoleum and Crowle’s Double Stain were selected from allpossible substrate /chemical combinations because this combina-tion represented one of the most challenging scenarios for recov-ering DNA from bloody fingerprints. Indeed, a series of destain-ing steps is required following enhancement with Crowle’sDouble Stain, Amido Black and Hungarian Red to eliminate thebackground staining prior to detection of the fingerprints. Bloodmay be washed off the surface during these steps which would re-sult in a significant reduction in DNA yields. It was anticipatedthat any other combination of substrate and chemical reagentwould provide better, or at least equivalent, DNA yields as thoserecorded for bloodmarks on linoleum enhanced with Crowle’sDouble Stain.
Phase 1 was the determinant for providing the range of dilutionsto use for Phase 2. Phase 2 was set up with the largest blood dilu-tion suitable for obtaining sufficient DNA for Profiler Plus™ anal-ysis. It was deemed important to detect the fingerprints but morecrucial to retrieve sufficient DNA for subsequent analysis.
Phase 2—To define the limit of detection of the seven chemicalsselected in this study and set the experimental parameters to beused in Phases 3 and 4, two different types of bloodstains weremade on various nonporous and porous surfaces (Table 2). One setof stains was composed of 20 mL drops of diluted blood from indi-vidual B (1:2 to 1:200, see Table 1) and the second set consisted ofbloodprints made with 20 mL aliquots of the same set of blood di-lutions. The range of blood dilutions used in this phase was di-rected by the results obtained in Phase 1. The quantity of DNA re-trieved from enhanced bloodprints prepared with 20 mL aliquots ofthe 1:200 diluted blood was sufficient for one round of ProfilerPlus™ analysis. Under our experimental conditions, this dilutionrepresented the limit for the evaluation of the sensitivity of thechemical reagents.
Bloodprints were photographed immediately after drying, beforeand after enhancement, and a semi-qualitative evaluation of thecolor intensity of the bloodprints was performed. No efforts weremade to establish whether visualized fingerprints presented cleardetails of ridges or other interesting features for identification.
Phase 3—To determine the effects of blood enhancement onsubsequent Prof iler Plus™ typing analysis, bloodprints (10 mLaliquots) from individuals A and B were prepared in duplicate (onfive different substrates) using undiluted blood and blood diluted1:20 (see Table 2). As clothing (85% polyester/15% cotton) did notallow for good chemical penetration during Phase 2, this substratewas not selected in this phase of the study; clothing (65% polyester/35% cotton) was used instead. Likewise, the paper towel (Scott® 2-ply) disintegrated during enhancement with Crowle’s Double Stainwhen tested in Phase 2, so was exchanged for the Xerox-grade pa-per in this phase of the study. Blue denim and the metal surfacewere not used in Phase 3. Once dried, the bloodprints on linoleum,glass and painted wood were treated with Amido Black, Crowle’s
Double Stain, Hungarian Red, luminol and leucomalachite green.The bloodprints on clothing (65% polyester 35% cotton) weretreated with luminol and those applied to laser photocopy paper(Xerox-grade) were treated with DFO and ninhydrin. All bloodyfingerprints were either swabbed or cut out of the substrate andDNA was extracted, quantitated, amplified and detected by fluo-rescence on denaturing polyacrylamide gels as detailed in Materi-als and Methods. Duplicates were processed as separate samples.
Many controls were included in this phase of the study. Un-treated areas from the five surfaces examined (linoleum, glass,wood, clothing and paper) were swabbed and processed for DNAextraction, quantitation and DNA typing analysis. In addition, non-bloody fingerprints from individuals A and B were applied to allfive nonporous and porous surfaces tested, swabbed and also pro-cessed for DNA extraction and DNA profiling. As well, all bloodenhancement reagents were applied to bare surfaces (linoleum,glass, wood, clothing, and paper) and were further processed forDNA extraction and DNA typing.
Phase 4—Bloodprints (10 mL aliquots of undiluted blood)from individuals A and B were prepared in duplicate on the samefive surfaces used in Phase 3. Once dried, the bloodprints were ei-ther immediately treated with the same seven chemicals used inPhase 3 or were left to air dry in a laminar flow hood or on abench for another 7 days or 14 days before being chemically en-hanced. In order to determine the effect of long-term exposure toenhancing chemicals on subsequent PCR STR analysis, chemi-cally treated fresh and aged bloody fingerprints were stored atroom temperature in a laminar flow hood or on a bench for 7, 14or 54 days before being processed for Profiler Plus™ typing anal-ysis. The bloody fingerprints were swabbed and the DNA was ex-tracted, quantitated, amplified and detected by fluorescence as de-scribed earlier.
Results and Discussion
Phase 1
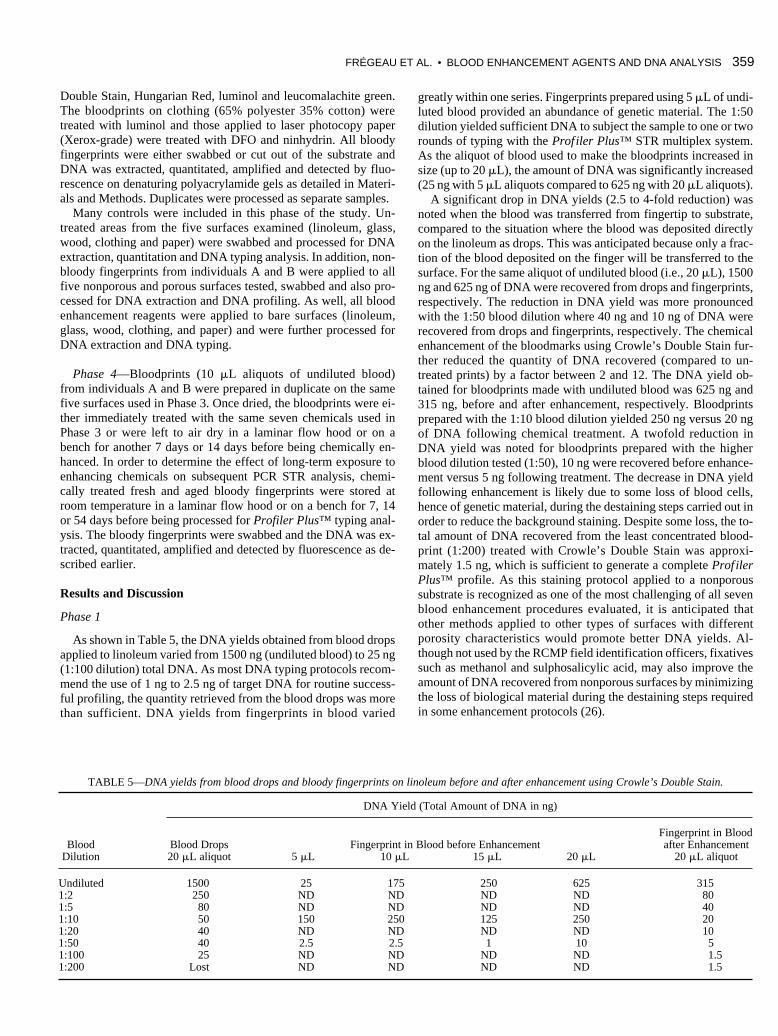
As shown in Table 5, the DNA yields obtained from blood dropsapplied to linoleum varied from 1500 ng (undiluted blood) to 25 ng(1:100 dilution) total DNA. As most DNA typing protocols recom-mend the use of 1 ng to 2.5 ng of target DNA for routine success-ful profiling, the quantity retrieved from the blood drops was morethan sufficient. DNA yields from fingerprints in blood varied
greatly within one series. Fingerprints prepared using 5 mL of undi-luted blood provided an abundance of genetic material. The 1:50dilution yielded sufficient DNA to subject the sample to one or tworounds of typing with the Profiler Plus™ STR multiplex system.As the aliquot of blood used to make the bloodprints increased insize (up to 20 mL), the amount of DNA was significantly increased(25 ng with 5 mL aliquots compared to 625 ng with 20 mL aliquots).
A significant drop in DNA yields (2.5 to 4-fold reduction) wasnoted when the blood was transferred from fingertip to substrate,compared to the situation where the blood was deposited directlyon the linoleum as drops. This was anticipated because only a frac-tion of the blood deposited on the finger will be transferred to thesurface. For the same aliquot of undiluted blood (i.e., 20 mL), 1500ng and 625 ng of DNA were recovered from drops and fingerprints,respectively. The reduction in DNA yield was more pronouncedwith the 1:50 blood dilution where 40 ng and 10 ng of DNA wererecovered from drops and fingerprints, respectively. The chemicalenhancement of the bloodmarks using Crowle’s Double Stain fur-ther reduced the quantity of DNA recovered (compared to un-treated prints) by a factor between 2 and 12. The DNA yield ob-tained for bloodprints made with undiluted blood was 625 ng and315 ng, before and after enhancement, respectively. Bloodprintsprepared with the 1:10 blood dilution yielded 250 ng versus 20 ngof DNA following chemical treatment. A twofold reduction inDNA yield was noted for bloodprints prepared with the higherblood dilution tested (1:50), 10 ng were recovered before enhance-ment versus 5 ng following treatment. The decrease in DNA yieldfollowing enhancement is likely due to some loss of blood cells,hence of genetic material, during the destaining steps carried out inorder to reduce the background staining. Despite some loss, the to-tal amount of DNA recovered from the least concentrated blood-print (1:200) treated with Crowle’s Double Stain was approxi-mately 1.5 ng, which is sufficient to generate a complete ProfilerPlus™ profile. As this staining protocol applied to a nonporoussubstrate is recognized as one of the most challenging of all sevenblood enhancement procedures evaluated, it is anticipated thatother methods applied to other types of surfaces with differentporosity characteristics would promote better DNA yields. Al-though not used by the RCMP field identification officers, fixativessuch as methanol and sulphosalicylic acid, may also improve theamount of DNA recovered from nonporous surfaces by minimizingthe loss of biological material during the destaining steps requiredin some enhancement protocols (26).
FRÉGEAU ET AL. • BLOOD ENHANCEMENT AGENTS AND DNA ANALYSIS 359
TABLE 5—DNA yields from blood drops and bloody fingerprints on linoleum before and after enhancement using Crowle’s Double Stain.
DNA Yield (Total Amount of DNA in ng)
Fingerprint in BloodBlood Blood Drops Fingerprint in Blood before Enhancement after Enhancement
Dilution 20 mL aliquot 5 mL 10 mL 15 mL 20 mL 20 mL aliquot
Undiluted 1500 25 175 250 625 3151:2 250 ND ND ND ND 801:5 80 ND ND ND ND 401:10 50 150 250 125 250 201:20 40 ND ND ND ND 101:50 40 2.5 2.5 1 10 51:100 25 ND ND ND ND 1.51:200 Lost ND ND ND ND 1.5

360 JOURNAL OF FORENSIC SCIENCES
TABLE 6—Sensitivity limit of blood enhancement reagents tested on 20 mL blood drops or bloodprints made with undiluted and diluted blood appliedon surfaces with different porosity.
Blood Drops Bloodprints
Surface Undil. 1:2 1:5 1:10 1:20 1:50 1:100 1:200 Undil. 1:2 1:5 1:10 1:20 1:50 1:100 1:200
Control in analogous position as Amido Black and other reagentLinoleum 4 3 2 2 2 1 1 0 3 2 1 1 1 1 0 0Clear glass 4 3 3 2 2 1 1 0 2 2 1 1 1 0 0 0Metal 2 2 1 1 1 0 0 0 2 2 1 1 1 0 0 0White-painted 4 3 3 2 0 0 0 0 3 2 2 2 1 1 1 0
woodBlue denim 4 3 3 2 1 0 0 0 3 3 2 1 1 0 0 085% polyester/ 3 3 3 2 2 1 1 1 2 2 1 1 1 0 0 0
15% cottonPaper towel 3 3 3 2 2 1 1 0 3 3 2 1 1 1 1 1
(Scott® 2-ply)Amido Black
Linoleum 4 3 3 3 3 3 2 2 4 3 2 2 1 1 1 0Clear glass 4 4 4 4 4 4 4 3 4 4 3 1 2 1 1 1Metal 4 4 4 4 4 3 3 3 4 4 3 2 1 1 1 0White-painted 4 4 4 4 4 4 3 3 4 3 3 3 2 1 1 1
woodBlue denim 4 4 4 4 3 3 2 1 4 4 3 3 1 1 1 085% polyester/ 4 3 3 3 2 2 1 1 4 3 2 1 1 1 1 1
15% cottonPaper towel 4 4 4 3 3 2 1 1 4 3 3 2 1 1 1 1(Scott® 2-ply)
Crowle’s Double StainLinoleum 4 4 4 4 3 3 3 2 4 4 3 2 2 1 1 1Clear glass 4 4 3 3 3 3 3 2 3 3 2 1 1 1 1 1Metal 4 0 3 0 3 3 3 3 3 3 2 2 1 1 1 1White-painted 4 4 4 3 3 3 3 3 3 3 3 2 2 1 1 1
woodBlue denim 1 1 0 0 0 0 0 0 1 1 0 0 0 0 0 085% polyester/ 4 4 3 3 3 2 2 1 2 2 1 1 1 0 0 0
15% cottonPaper towel 2 1 1 0 0 0 0 0 1 1 1 0 0 0 0 0
(Scott® 2-ply)1,8-diazafluoren-9-one
Blue denim 0 0 0 0 1 1 0 0 0 0 1 2 2 1 1 185% polyester/ 0 0 0 0 0 0 0 0 0 0 0 1 1 0 0 0
15% cottonPaper towel 0 0 2 2 2 1 0 0 0 1 2 3 3 2 1 1
(Scott® 2-ply)Hungarian Red
Linoleum 2 3 3 4 3 3 2 2 4 4 4 3 2 1 1 1Clear glass 4 4 4 4 4 3 2 1 4 4 4 2 2 1 1 1Metal 4 4 3 3 3 2 2 2 4 2 1 1 1 1 0 0White-painted 4 4 3 2 4 3 2 1 4 3 2 2 1 1 1 1
woodBlue denim 0 0 0 0 0 0 0 0 0 0 0 0 0 0 0 085% polyester/ 4 4 3 2 2 2 2 2 3 2 1 1 1 1 0 0
15% cottonPaper towel 3 0 0 0 ND ND ND ND 4 4 2 1 2 1 1 1
(Scott® 2-ply)Leucomalachite green
Linoleum 0 4 4 3 3 3 1 1 3 4 3 2 2 1 1 0Clear glass 4 4 4 3 2 1 1 1 3 4 3 1 1 1 1 0Metal 4 4 4 3 3 1 0 0 1 1 1 0 0 0 0 0White-painted 4 4 4 4 3 2 1 1 3 3 3 2 2 1 1 1
woodBlue denim 4 4 4 4 4 3 2 1 4 4 4 4 3 2 2 185% polyester/ 4 3 2 2 2 1 0 0 3 3 3 1 2 1 1 1
15% cottonPaper towel 4 4 3 3 3 2 2 1 4 4 4 4 3 2 2 1
(Scott® 2-ply)
(continued)

FRÉGEAU ET AL. • BLOOD ENHANCEMENT AGENTS AND DNA ANALYSIS 361
Phase 2
Tables 6 and 7 present the results of the sensitivity study per-formed using the seven chemicals routinely used as indicators ofblood in the laboratory or at crime scenes. The designations used inthe assessment of the color intensity of the enhanced blood dropsand fingerprints in blood ranged from a value of 4 (very intenseprints) to a value of 0 (drops or fingerprints that were not visible).Table 6 provides the details of the color spectrum observed for eachcombination of reagent and surface used. Table 7 reveals the limitof blood detection of the seven chemicals for all of the surfacestested. As shown, enhancement was successful in the majority ofcombinations, as the bloodmarks (drops and fingerprints) withoutchemical treatment were visible only when more concentratedaliquots of blood were applied to the surfaces. Blood drops weremore easily detected than bloody fingerprints. This was especiallytrue at the highest blood dilution tested (1:200). This observationwas anticipated as the blood in drops is concentrated in a very re-stricted area; a very different situation prevails for bloody finger-prints. Examples where treatment did not improve detection of thebloodmarks included those combinations involving fingerprints onmetal treated with leucomalachite green (see Table 7; 1:20 blooddilution visible before treatment versus 1:5 after treatment), dropsor fingerprints on blue denim treated with Crowle’s Double Stain(1:20 blood dilution visible before treatment versus 1:2 after treat-ment), drops on 85% polyester/15% cotton blend fabric treatedwith leucomalachite green or ninhydrin (1:200 blood dilution visi-ble before treatment versus 1:50 after treatment), fingerprints onpaper towel treated with Crowle’s Double Stain or Hungarian Red(1:200 blood dilution visible before treatment versus 1:5 and 1:10,respectively, after treatment).
The most sensitive blood enhancement chemical was luminolwhich revealed highly diluted (1:200) blood drops and bloody fin-gerprints on all porous and nonporous surfaces selected. The nextbest reagent was Amido Black. Crowle’s Double Stain workedvery well on nonporous surfaces revealing highly diluted (1:200)
blood drops and bloody fingerprints but performed poorly on theporous substrates selected (particularly in the case of blue denimand paper towel). Hungarian Red gave very good results for non-porous surfaces, with the exception of metal, but performedpoorly on two of the three porous surfaces selected (i.e., bluedenim and paper towel). These two latter substrates presented amajor challenge when tested with enhancement procedures re-quiring destaining steps, such as Hungarian Red and Crowle’sDouble Stain. Indeed, the background staining on blue denim wasvery intense and could not be easily eliminated which preventedthe visualization of the bloodmarks. In many instances, the papertowel totally disintegrated in the process which prevented furtherdetection and analysis. Interestingly, enhancement using AmidoBlack provided much better results with the same surfaces eventhough destaining steps were also included to visualize the blood-marks. The reagent DFO, which was only tested on porous sur-faces, revealed highly diluted (1:200) blood prints on blue denimand paper towel. However, these surfaces did not permit the vi-sualization of highly diluted blood drops. The limit of detectionof blood drops using DFO was a 1:50 blood dilution. The 85%polyester /15% cotton blend fabric, with its shiny characteristics,did not allow good penetration of the chemicals and compromisedthe blood enhancement process. Overall, combinations involvingblue denim, the 85% polyester / 15% cotton blend fabric or papertowel and DFO did not give the full color spectrum observed us-ing other combinations such as Amido Black and any of the sur-faces tested. Leucomalachite green gave very good results forbloodprints on porous surfaces and nonporous substrates, with theexception of metal. Ninhydrin, which was used to enhance blood-marks on porous surfaces, showed good results only with the 85%polyester /15% cotton blend fabric and paper towel. Bloodmarkson these surfaces were visible using the 1:200 blood dilution,whereas the limit of blood detection on blue denim was 1:20 fordrops and 1:50 for fingerprints.
The sensitivity levels established in our study differ somewhatfrom those reported by Olsen (24) who used clear glass and white
TABLE 6—(continued)
Blood Drops Bloodprints
Surface Undil. 1:2 1:5 1:10 1:20 1:50 1:100 1:200 Undil. 1:2 1:5 1:10 1:20 1:50 1:100 1:200
LuminolLinoleum 0 0 0 1 1 2 3 4 4 4 4 3 3 1 2 1Clear glass 0 0 0 1 2 2 3 4 3 3 4 4 4 4 2 2Metal 0 0 0 1 1 2 3 2 3 3 4 4 4 3 2 2White-painted 0 0 0 0 0 1 1 1 3 4 4 4 4 3 2 1
woodBlue denim 1 1 2 4 4 3 3 1 2 3 4 4 3 3 2 185% polyester/ 0 1 1 2 1 1 1 1 4 3 4 4 2 1 1 1
15% cottonPaper towel 1 1 2 4 4 3 2 1 2 3 4 4 4 4 2 1
(Scott® 2-ply)Ninhydrin
Blue denim 4 4 3 2 1 0 0 0 4 4 2 1 1 1 0 085% polyester/ 4 3 3 2 2 1 0 0 3 2 2 1 2 1 1 1
15% cottonPaper towel 4 4 4 2 1 1 1 0 4 4 4 3 4 2 1 1
(Scott® 2-ply)

362 JOURNAL OF FORENSIC SCIENCEST
AB
LE
7—
Blo
od d
ilut
ions
for
whi
ch b
lood
mar
ks w
ere
stil
l vi
sibl
e fo
llow
ing
seve
n di
ffer
ent
chem
ical
enh
ance
men
t pr
oced
ures
.
Blo
od D
rops
Blo
odpr
ints
No
No
Surf
ace
Tre
atm
ent
AB
CD
SD
FOH
RL
GL
UM
NIN
Tre
atm
ent
AB
CD
SD
FOH
RL
GL
UM
NIN
Lin
oleu
m1:
100
1:20
01:
200
ND
1:20
01:
200
1:20
0N
D1:
501:
100
1:20
0N
D1:
200
1:10
01:
200
ND
Cle
ar g
lass
1:10
01:
200
1:20
0N
D1:
200
1:20
01:
200
ND
1:20
1:20
01:
200
ND
1:20
01:
100
1:20
0N
DM
etal
1:20
1:20
01:
200
ND
1:20
01:
501:
200
ND
1:20
1:10
01:
200
ND
1:50
1:5
1:20
0N
DW
hite
pai
nted
1:10
1:20
01:
200
ND
1:20
01:
200
1:20
0N
D1:
100
1:20
01:
200
ND
1:20
01:
200
1:20
0N
Dw
ood
Blu
e de
nim
1:20
1:20
01:
21:
500*
1:20
01:
200
1:20
1:20
1:10
01:
21:
200
1:50
1:20
01:
200
1:50
85%
pol
yest
er/
1:20
01:
200
1:20
00†
1:20
01:
501:
200
1:50
1:20
1:20
01:
201:
201:
200
1:20
01:
200
1:20
015
% c
otto
nPa
per
tow
el1:
100
1:20
01:
51:
500‡
1:20
01:
200
1:10
01:
200
1:20
01:
51:
200
1:10
1:20
01:
200
1:20
0(S
cott®
2-pl
y)
AB
5A
mid
o B
lack
, CD
S 5
Cro
wle
's D
oubl
e St
ain,
DFC
51,
8-di
azaf
luor
en-9
-one
, HR
5H
unga
rian
Red
, LG
5le
ucom
alac
hite
gre
en, L
UM
5lu
min
ol, N
IN 5
ninh
ydri
n.*H
igh
back
grou
nd s
tain
ing
that
cou
ld n
ot b
e re
mov
ed p
reve
nted
vis
ualiz
atio
n of
blo
od d
rops
.†S
hiny
cha
ract
eris
tics
of th
e fa
bric
pre
vent
ed g
ood
pene
trat
ion
of th
e ch
emic
als.
‡The
sub
stra
te to
tally
dis
inte
grat
ed d
urin
g th
e pr
oces
s.
TABLE 8—Most effective enhancement protocols for nonporous andporous surfaces as established under the present experimental
conditions.
Nonporous Surfaces Porous Surfaces
Blood Drops Bloodprints Blood Drops Bloodprints
Amido BlackCrowle's Crowle's Amido Black Leucomalachite
Double Stain Double Stain greenLuminol Luminol Luminol LuminolHungarian Red
bond paper, and those presented by Theeuwen et al. (26) who usedwhite opaque glass, white paper and white cotton fabric. These au-thors found that many of the reagents used in our study were muchmore sensitive and allowed extremely diluted bloodmarks to be en-hanced and visualized (up to 1:16 000 blood dilution). Many rea-sons may account for this variation: (1) the selection of differentporous and nonporous material, (2) enhancement of blood dropsversus bloody fingerprints, (3) enhancement of wet bloodmarksversus dried bloodmarks, and (4) different qualification criteria toassess what constitutes a positive result. Furthermore, our sensitiv-ity study was unique in the sense that the upper boundary for theblood dilutions was set at 1:200 so that enough DNA could be re-covered to ensure subsequent STR DNA typing analyses. Many ofthe chemicals included in this study such as Amido Black,Crowle’s Double Stain, Hungarian Red, leucomalachite green andluminol would have exhibited higher levels of sensitivity based onthe qualification criteria used to assess the color intensity (seeTable 6). At 1:200 dilution, the bloody fingerprints or blood dropswere still detected in many cases. The actual sensitivity levels forthe seven reagents used in our study have been recently reported byGermain and Miller (63).
Table 8 summarizes observations made during this phase of thestudy and illustrates the most effective enhancement chemical onporous and nonporous substrates following our experimental con-ditions. This table provides an indication only of the performanceof the reagents as other types of porous and nonporous materialwill have different absorption and diffusion capabilities and showdifferent characteristics for the enhancement chemicals. Our studyalready indicated that blue denim, the 85% polyester /15% cottonblend fabric and paper towel (Scott® 2-ply) were challenging sub-strates for many of the enhancement procedures evaluated.Theeuwen et al. (26) recently presented their classification ofreagents as best performers for a variety of surfaces. Many of theblood enhancement reagents used in our study were also selectedby this group of investigators to reveal bloodmarks on three sur-faces showing characteristics that differed from the substrates weselected. These authors used white opaque glass, white paper andwhite cotton fabric, while clear glass, white paper towel (Scott®
2-ply) and polyester/cotton blend fabric were tested in our study,along with linoleum, metal, white painted wood and blue denim.In addition, luminol was not evaluated in their study, whereas itwas shown to be the most sensitive reagent of all seven chemicalssurveyed in our evaluation. As a result, Theeuwen’s final classifi-cation of reagents as best performers for nonporous surfaces wasvery similar to ours but their list of best performers for porousmaterial differed greatly with the one established in the presentstudy.

lele size measurements remained relatively constant, balancedacross the nine STR loci and essentially identical to those of the un-treated blood fingerprints (also see Tables 9 and 10). No inhibitoryeffect on the PCR process or interference with the fluorescence-based detection procedure was observed. No allele dropout or ex-traneous bands were detected in profiles generated from the DNAof enhanced bloodprints.
Interestingly, although no inhibitory effect on the PCR processwas noted, many of the DNA extracts showed a strong colorationfollowing the one-step organic extraction protocol. In most in-stances, the purification step on the Microcon® -100 exclusioncolumns was successful in removing the pigments but the time re-quired to process these DNA extracts on the columns was signif-icantly increased compared to the untreated bloodmarks. Indeed,17 to 32 min were necessary to allow the extracts to pass through
FRÉGEAU ET AL. • BLOOD ENHANCEMENT AGENTS AND DNA ANALYSIS 363
FIG. 1—Profiler Plus™ profiles from bloodprints of individual B produced on linoleum and enhanced using a variety of chemicals. PCR amplificationswere performed using 2.5 ng of template DNA in a 25 mL PCR reaction volume as detailed in Materials and Methods. (A) Control, no enhancement; (B)Amido Black; (C) Crowle’s Double Stain; (D) Hungarian Red; (E) Leucomalachite green; (F) Luminol. Each panel depicts the relative fluorescence in-tensity (RFU, left margin) and the size estimate in bases (top margin) derived from the internal lane size standard GeneScan-350 [ROX ] using the ABIGeneScan® Analysis version 2.1 software. The genetic markers observed from left to right, in order of size, are: Amelogenin, D3S1358, D8S1179, D5S818,HumvWA, D21S11, D13S317, HumFGA, D7S820, and D18S51.
Phase 3
In this series of experiments, fingerprints prepared using the 1:20blood dilution did not yield sufficient DNA to permit PCR analysisand these samples were not processed any further. Loss of biologi-cal material likely took place during the application of the blood-marks to the various surfaces, during the chemical enhancementprocedure and/or during DNA extraction of the blood collectedfrom the surfaces. Therefore, results presented are those of thebloodmarks prepared using undiluted blood.
As noted in Figs. 1 to 4, none of the seven chemical enhancementprocedures, tested on a variety of surfaces, had detrimental effectson the PCR amplification of the genetic markers surveyed in theProfiler Plus™ multiplex STR system. Regardless of the reagentand the surface examined, the fluorescent signals as well as the al-

364 JOURNAL OF FORENSIC SCIENCES
the membrane for the enhanced bloodmarks compared to 10 minfor untreated samples. Routinely, two Microcon® -100 columnswere used to obtain the final DNA extracts that would be used forPCR amplification. Samples centrifuged for 10 min had a ten-dency to saturate the Microcon® -100 membranes with someunidentified agents, preventing the rest of the extracts to passthrough them. In these instances, the remaining aqueous solutionswere transferred onto new Microcon® -100 columns and spun foranother 10 min or longer to isolate the DNA from any potentialcontaminants. The DNA recovered from both columns for eachsample was then pooled. In light of the excellent Profiler Plus™STR typing results that were obtained using the DNAs from theenhanced samples, the difficulties encountered during theextraction process did not impact on their subsequent PCRamplification.
No quantifiable DNA was recovered from any of the control
samples included in this phase of the study (see Experimental De-sign Section; Phase 3 for details) as revealed by the lack of de-tectable signals on the chemiluminescent slot blot membrane (datanot shown). Nevertheless, all controls were subjected to PCR am-plification using the Profiler Plus™ multiplex to ensure that nofluorescent background signals would be detected. As shown inFig. 5, seven controls showed minor signals. These included un-treated clothing, luminol-treated wood, and untreated nonbloodyfingerprints from individuals A and B produced on glass, woodand clothing. In all instances, incomplete Profiler Plus™ profileswere observed. The intensity of the signals ranged between 40 rel-ative fluorescent units (RFU) to 150 RFU, i.e., above the thresh-old limit of detection of alleles set at 40 RFU during our extensiveSTR validation studies performed at the RCMP forensic laboratoryusing the Profiler Plus™ multiplex STR system. Three samplesshowed signals for Amelogenin only (panels E, F and G; non-
FIG. 2—Profiler Plus™ profiles from bloodprints of individual B produced on white painted wood and enhanced using five different reagents. PCR am-plifications were performed using 2.5 ng of template DNA in a 25 mL PCR reaction volume as detailed in Materials and Methods. (A) Control, no en-hancement; (B) Amido Black; (C) Crowle’s Double Stain; (D) Hungarian Red; (E) Leucomalachite green; (F) Luminol. Each panel depicts the relativefluorescence intensity (RFU, left margin) and the size estimate in bases (top margin) derived from the internal lane size standard GeneScan-350 [ROX ]using the ABI GeneScan® Analysis version 2.1 software. The genetic markers observed from left to right, in order of size, are: Amelogenin, D3S1358,D8S1179, D5S818, HumvWA, D21S11, D13S317, HumFGA, D7S820, and D18S51.

bloody fingerprints from individual A on clothing, nonbloody fin-gerprints from individual B on wood, and luminol-treated wood).The four remaining samples (panels A to D) showed signals above40 RFU for the STR systems labeled with FAM (blue dye;D3S1358, HumvWA, HumFGA) or with JOE (green dye;D8S1179, D21S11, D18S51). None of these control samplesshowed alleles above 40 RFU for the STR systems labeled withNED (yellow dye; D5S818, D13S317, D7S820). Interestingly, inthe two situations where excessive pressure was applied by fingersduring the preparation of the nonbloody fingerprints (e.g., thoseapplied to glass), the Profiler Plus™ profiles observed were al-most complete and were consistent with the profiles of the con-tributor of the fingerprint (panels B and C). These results are inagreement with a recent report by Van Oorschot and Jones (67)which indicated that STR profiles, under some circumstances,could be obtained from epithelial cells left on pens, car keys, tele-phone receivers, and briefcases. These results further reiterate thatcaution should be exercised when handling materials or samplesthat could potentially be submitted to a forensic laboratory forDNA typing analysis. With the judicious use of gloves at crimescenes, evidentiary samples will not show contamination.
Phase 4
Figure 6 presents the Profiler Plus™ STR profiles generated us-ing DNA recovered from untreated bloodprints produced onlinoleum which was then left at room temperature for 7 days, 14days and 54 days before DNA extraction and amplification. Thefour panels show profiles with no allele drop out or additionalbands, demonstrating the long-term stability of blood in this par-ticular context. Similar results were obtained using DNA fromaged untreated bloodprints produced on wood, clear glass, Xerox-grade paper, and 65% polyester/35% cotton blend fabric (data notshown). Differences noted in the fluorescence intensity originatedfrom differences in the amount of input DNA used for PCR ampli-fication and subtle differences in pipetting during the quantitationstep and/or preparation of the DNA samples for PCR amplificationand/or preparation of the amplified DNA aliquots for gel elec-trophoresis and analysis.
Figures 7 and 8 show the Profiler Plus™ STR profiles gener-ated using DNA recovered from fresh and aged bloodprints pro-duced on linoleum and subjected to DNA extraction following 7days, 14 days or 54 days post-enhancement using Amido Black
FRÉGEAU ET AL. • BLOOD ENHANCEMENT AGENTS AND DNA ANALYSIS 365
FIG. 3—Profiler Plus™ profiles from bloodprints of individual A produced on clear glass and enhanced using a variety of chemicals. PCR amplifica-tions were performed using 2.5 ng of template DNA in a 25 mL PCR reaction volume as detailed in Materials and Methods. (A) Control, no enhancement;(B) Crowle’s Double Stain; (C) Hungarian Red; (D) Leucomalachite green; (E) Luminol. Each panel depicts the relative fluorescence intensity (RFU, leftmargin) and the size estimate in bases (top margin) derived from the internal lane size standard GeneScan-350 [ROX ] using the ABI GeneScan® Analysisversion 2.1 software. The genetic markers observed from left to right, in order of size, are: Amelogenin, D3S1358, D8S1179, D5S818, HumvWA, D21S11,D13S317, HumFGA, D7S820, and D18S51.

FIG. 4—Profiler Plus™ profiles from bloodprints of individual A produced on Xerox-grade paper or 65% polyester/35% cotton blend fabric and en-hanced using a variety of chemicals. PCR amplifications were performed using 2.5 ng of template DNA in a 25 mL PCR reaction volume as detailed in Ma-terials and Methods. (A) Control sample on paper, no enhancement; (B) Paper, DFO; (C) Paper, ninhydrin; (D) Control sample on clothing, no en-hancement; (E) Clothing, luminol. Each panel depicts the relative fluorescence intensity (RFU, left margin) and the size estimate in bases (top margin)derived from the internal lane size standard GeneScan-350 [ROX ] using the ABI GeneScan® Analysis version 2.1 software. The genetic markers observedfrom left to right, in order of size, are: Amelogenin, D3S1358, D8S1179, D5S818, HumvWA, D21S11, D13S317, HumFGA, D7S820, and D18S51.
TABLE 9—Allele size measurements for fresh bloodprints from individual A applied to any of five surfaces (before and following enhancement usingany of seven chemical reagents).
Untreated Bloodprints Enhanced Bloodprints
Average AverageSize Standard Size Standard
Profiler Plus Loci (bases) Deviation n* (bases) Deviation n†
D3S1358 126.47 0.14 19 126.42 0.18 92134.66 0.06 19 134.65 0.09 92
HumvWA 176.65 0.18 19 176.75 0.18 92184.70 0.14 19 184.78 0.16 92
HumFGA 231.86 0.11 19 231.84 0.14 92235.95 0.12 19 235.95 0.13 92
Amelogenin 106.46 0.10 19 106.46 0.12 92D8S1179 144.11 0.05 19 144.13 0.08 92
152.59 0.10 19 152.60 0.09 92D21S11 203.29 0.04 19 203.30 0.06 92
215.60 0.09 19 215.59 0.10 92D18S51 289.50 0.12 19 289.54 0.11 92
313.47 0.07 19 313.51 0.10 92D5S818 155.44 0.18 19 155.47 0.12 92
159.32 0.10 19 159.32 0.10 92D13S317 206.66 0.08 19 206.66 0.11 92
223.04 0.08 19 223.02 0.12 92D7S820 274.59 0.11 19 274.67 0.17 92
278.49 0.13 19 278.52 0.14 92
* n represents the number of data points originating from 9 different gels.† n represents the number of data points originating from 11 different gels.
366

and luminol, respectively. Figures 9 and 10 present the elec-trophoretic tracings obtained using DNA from fresh and agedbloodprints produced on paper and submitted for DNA analysis 7days, 14 days or 54 days after enhancement using DFO and nin-hydrin, respectively. Figures 11 to 14 focus strictly on the long-term exposure to the enhancing chemicals and present the Pro-f iler Plus™ profiles generated using DNA from bloodprintsproduced on linoleum, glass, wood, paper, and clothing, subjectedto DNA extraction and amplification 54 days post-enhancement.For all samples examined, the nine STR systems present in theProfiler Plus™ multiplex were efficiently amplified, and the flu-orescent profiles produced from the chemically treated blood-prints showed no allele drop out or additional bands when com-pared to profiles obtained from untreated samples. Differencesnoted in the fluorescence intensity originated from differences inthe amount of input DNA used for PCR amplification (1 ng to 2.5ng) and subtle differences in pipetting during the quantitation stepand/or preparation of the DNA samples for PCR amplificationand/or preparation of the amplified DNA aliquots for gel elec-trophoresis and analysis. Clearly, a continuous exposure (up to 54days) to any of the seven reagents tested did not compromise theSTR typing analysis of fresh, 7- and 14-day-old bloodprints.None of the enhancement procedures resulted in alterations in theallele profiles of the two individuals that donated blood for thisstudy. This point is well illustrated in Tables 11 and 12 in whichall allele size measurements generated during this phase of thestudy are compiled.
Although complete Profiler Plus™ profiles were generatedfrom blood exposed to chemicals for 54 days, a slight descendinggradient in fluorescent signal (i.e., a decrease in intensity from
left to right in the electrophoretic tracings) was observed whenbloodprints produced on linoleum or glass were enhanced usingCrowle’s Double Stain and Hungarian Red (Figs. 11 and 12, pan-els C and D). A similar trend was noted for both individuals in-volved in the study. Untreated bloodprints also showed a slightimbalance of signal from the smallest to largest STR loci but itwas not as pronounced as that noted for the enhanced bloodprints.This pattern implies DNA degradation which results in more effi-cient amplification of the smaller STR loci than the larger STRloci. These results suggest that a longer exposure (i.e., over 54days) to the chemicals may eventually lead to STR locus drop outwhich, in turn, would result in the generation of partial profiles orno profiles depending on the surface type and actual exposuretime period. This phenomenon appears to be surface- and chemi-cal-dependent as the same reagents on a different surface did notshow the same trend (compare Figs. 11 and 12, panels C and Dwith Fig. 13, panels C and D).
Our results complement those of Hochmeister et al. (60) whosestudy employed a totally different set of enhancement reagents(cyanoacrylate, Rhodamine 6G and Ardrox™) and surfaces (razorblade and plastic foil), and showed no adverse effects on the PCRamplification of the D1S80 marker system. Our long-term expo-sure data also complement results reported by Stein et al. (40) in-dicating that successful STR analysis could be performed on nin-hydrin-treated white paper stored at room temperature for apost-enhancement period of 56 days. These authors also testedlong-term exposure to other agents such as cyanoacrylate (on razorblades and plastic foils) and gentian violet (on the sticky surfacesof adhesive tapes) and found no deleterious effects on the subse-quent analysis of STRs.
FRÉGEAU ET AL. • BLOOD ENHANCEMENT AGENTS AND DNA ANALYSIS 367
TABLE 10—Allele size measurements for fresh bloodprints from individual B applied to any of five surfaces (before and following enhancement usingany of seven chemical reagents).
Untreated Bloodprints Enhanced Bloodprints
Average AverageSize Standard Size Standard
Prolifer Plus Loci (bases) Deviation n* (bases) Deviation n†
D3S1358 126.38 0.16 19 126.37 0.19 102130.52 0.12 19 130.51 0.15 102
HumvWA 176.63 0.18 19 176.71 0.17 102184.68 0.14 19 184.76 0.15 102
HumFGA 227.81 0.10 19 227.75 0.13 102231.90 0.09 19 231.84 0.13 102
Amelogenin 106.46 0.11 19 106.45 0.12 102112.19 0.15 19 112.17 0.18 102
D8S1179 144.14 0.10 19 144.14 0.09 102152.62 0.08 19 152.61 0.08 102
D21S11 203.30 0.05 19 203.30 0.04 102207.41 0.08 19 207.39 0.06 102
D18S51 297.44 0.07 19 297.41 0.12 102301.37 0.12 19 301.37 0.09 102
D5S818 143.10 0.09 19 143.11 0.08 102155.52 0.12 19 155.50 0.07 102
D13S317 219.07 0.15 19 219.01 0.15 102227.16 0.08 19 227.11 0.11 102
D7S820 266.84 0.11 19 266.83 0.14 102270.77 0.13 19 270.77 0.16 102
* n represents the number of data points originating from 9 different gels.† n represents the number of data points originating from 12 different gels.

368 JOURNAL OF FORENSIC SCIENCES
FIG. 5—Fluorescent signals observed using the Profiler Plus™ STR amplification system on control samples. PCR amplifications were carried out de-spite the lack of human DNA signals on the slot blot membrane during DNA quantitation. Ten mL aliquots of DNA extracts were used in a 25 mL PCR re-action volume as detailed in Materials and Methods. (A) Clothing, no enhancement; (B) Nonbloody fingerprint from individual A on clear glass, no en-hancement; (C) Nonbloody fingerprint from individual B on clear glass, no enhancement; (D) Nonbloody fingerprint from individual A on white paintedwood, no enhancement; (E) Nonbloody fingerprint from individual B on white painted wood, no enhancement; (F) Nonbloody fingerprint from individualA on 65% polyester/35% cotton blend fabric, no enhancement; (G) White painted wood, luminol treatment. Each panel depicts the relative fluorescenceintensity (RFU, left margin) and the size estimate in bases (top margin) derived from the internal lane size standard GeneScan-350 [ROX ] using the ABIGeneScan® Analysis version 2.1 software. Peaks labeled with an asterisk (see panel G) represent the internal lane size standard GeneScan-350 [ROX ]which show up in the NED (yellow) spectrum because of the incapability of the matrix to correct for the overlap at this low fluorescence intensity. Thesepeaks can be observed in the same positions in all panels.

FRÉGEAU ET AL. • BLOOD ENHANCEMENT AGENTS AND DNA ANALYSIS 369
FIG. 6—Profiler Plus™ profiles from untreated fresh and aged bloodprints of individual B produced on linoleum. PCR amplifications were performedusing 1 ng to 2.5 ng of template DNA in a 25 mL PCR reaction volume as detailed in Materials and Methods. (A) Fresh bloodprint; (B) 7-day-old blood-print; (C) 14-day-old bloodprint; (D) 54-day-old bloodprint. Each panel depicts the relative fluorescence intensity (RFU, left margin) and the size estimatein bases (top margin) derived from the internal lane size standard GeneScan-350 [ROX ] using the ABI GeneScan® Analysis version 2.1 software. The ge-netic markers observed from left to right, in order of size, are: Amelogenin, D3S1358, D8S1179, D5S818, HumvWA, D21S11, D13S317, HumFGA, D7S820,and D18S51.
Conclusion
Crime scene investigators now have access to a wide variety ofchemicals for the enhancement of latent fingerprints in blood. AsDNA typing technologies became more sophisticated and moresensitive, much smaller bloodmarks have been submitted for ge-netic analysis. As casework exhibits are often shared betweenforensic identification specialists and forensic DNA specialists,we sought to determine the effects of seven enhancement chemi-cals on the subsequent STR DNA typing of bloody fingerprintsprepared on five different surfaces. The results presented in thisreport indicate that none of the chemicals examined had a delete-rious effect, on a short-term basis, on the PCR amplification ofnine STR systems plus the gender determination marker, Amelo-genin. In all instances, the fluorescent signals were similar and thesize measurements of all alleles remained constant and identical tothose of the untreated blood. No allele dropout or extraneousbands were detected in profiles generated from the DNA of en-hanced bloodprints. Aged bloodprints (7-days-old and 14-days-old) enhanced and exposed to the blood reagents for up to 54 daysyielded accurate and reliable results using the Profiler Plus™multiplex system. Only two enhancement chemicals (Crowle’sDouble Stain and Hungarian Red) indicated a possible negativeeffect on DNA typing analysis when in contact with samples for54 days. Forensic identification specialists can therefore utilizeenhancement in order to reveal latent fingerprints without fear of
compromising subsequent DNA typing results. However, the de-cision as to which enhancement method is selected in any partic-ular case may impact on the possibility of future submission forDNA analysis. Our study revealed that some loss of biologicalmaterial will take place with enhancement, specifically with pro-cedures that require destaining steps, such as Crowle’s DoubleStain, Hungarian Red and Amido Black. In situations where thebloodprints are very small, the loss of blood cells during en-hancement may result in insufficient amounts of DNA which, inturn, would jeopardize the DNA analysis. Although enhancementdoes not preclude the obtention of excellent STR results, it may,when employed on limited samples, have dire consequences andcompromise crucial and limited evidentiary samples. Caution istherefore recommended when using an enhancement technique onbloodprints to ensure that sufficient biological material is retainedby the substrate for possible future DNA submissions.
Acknowledgments
The authors would like to thank Dr. Brian Yamashita and Sgt.Kevin Miller from the RCMP Forensic Identification Research andReview Section in Ottawa, Ontario, for their help regarding generalenhancement procedures and references. We also thank Dr. BrianYamashita and Kathy Bowen for their critical evaluation of thismanuscript.

370 JOURNAL OF FORENSIC SCIENCES
FIG. 7—Profiler Plus™ profiles from fresh and aged bloodprints of individual B produced on linoleum and submitted for DNA analysis 7 days, 14 daysor 54 days post-enhancement with Amido Black. PCR amplifications were performed using 1 ng to 2.5 ng of template DNA in a 25 mL PCR reaction vol-ume as detailed in Materials and Methods. Panels A to G, as noted in the figure captions. Each panel depicts the relative fluorescence intensity (RFU, leftmargin) and the size estimate in bases (top margin) derived from the internal lane size standard GeneScan-350 [ROX] using the ABI GeneScan® Analysisversion 2.1 software. The genetic markers observed from left to right, in order of size, are: Amelogenin, D3S1358, D8S1179, D5S818, HumvWA, D21S11,D13S317, HumFGA, D7S820, and D18S51.

FRÉGEAU ET AL. • BLOOD ENHANCEMENT AGENTS AND DNA ANALYSIS 371
FIG. 8—Profiler Plus™ profiles from fresh and aged bloodprints of individual A produced on linoleum and submitted for DNA analysis 7 days, 14 daysor 54 days post-enhancement with luminol. PCR amplifications were performed using 1 ng to 2.5 ng of template DNA in a 25 mL PCR reaction volume asdetailed in Materials and Methods. Panels A to H, as noted in the figure captions. Each panel depicts the relative fluorescence intensity (RFU, left margin)and the size estimate in bases (top margin) derived from the internal lane size standard GeneScan-350 [ROX ] using the ABI GeneScan® Analysis version2.1 software. The genetic markers observed from left to right, in order of size, are: Amelogenin, D3S1358, D8S1179, D5S818, HumvWA, D21S11, D13S317,HumFGA, D7S820, and D18S51.
372 JOURNAL OF FORENSIC SCIENCES
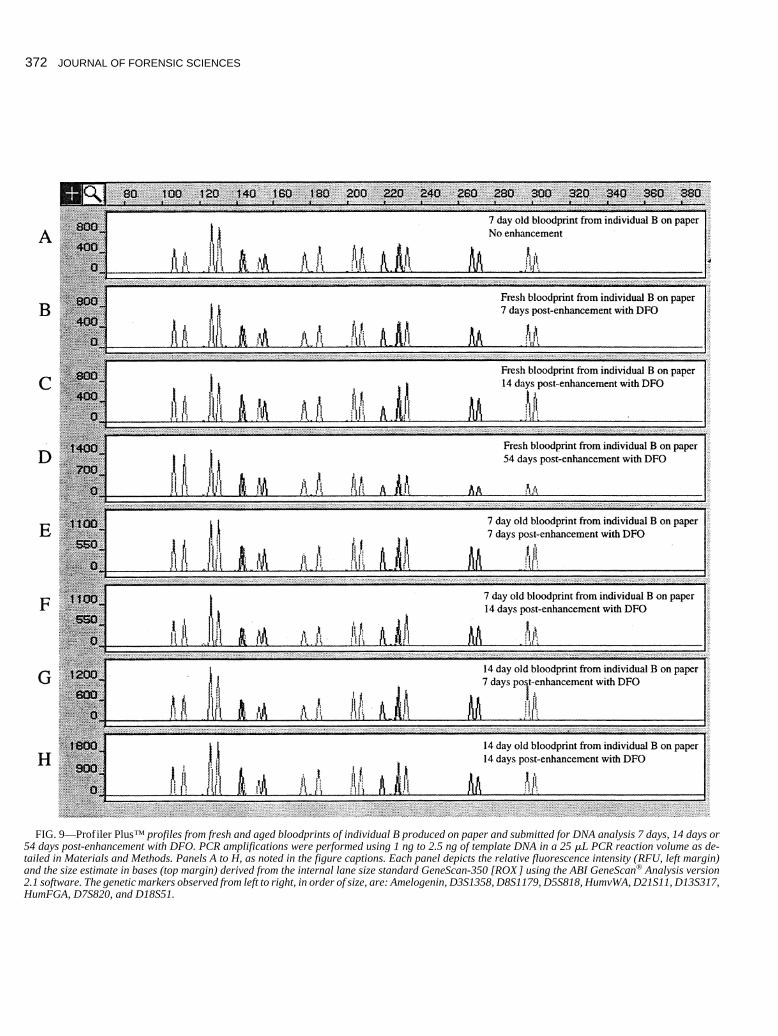
FIG. 9—Profiler Plus™ profiles from fresh and aged bloodprints of individual B produced on paper and submitted for DNA analysis 7 days, 14 days or54 days post-enhancement with DFO. PCR amplifications were performed using 1 ng to 2.5 ng of template DNA in a 25 mL PCR reaction volume as de-tailed in Materials and Methods. Panels A to H, as noted in the figure captions. Each panel depicts the relative fluorescence intensity (RFU, left margin)and the size estimate in bases (top margin) derived from the internal lane size standard GeneScan-350 [ROX ] using the ABI GeneScan® Analysis version2.1 software. The genetic markers observed from left to right, in order of size, are: Amelogenin, D3S1358, D8S1179, D5S818, HumvWA, D21S11, D13S317,HumFGA, D7S820, and D18S51.

FRÉGEAU ET AL. • BLOOD ENHANCEMENT AGENTS AND DNA ANALYSIS 373
FIG. 10—Profiler Plus™ profiles from fresh and aged bloodprints of individual A produced on paper and submitted for DNA analysis 7 days or 14 dayspost-enhancement with ninhydrin. PCR amplifications were performed using 1 ng to 2.5 ng of template DNA in a 25 mL PCR reaction volume as detailedin Materials and Methods. Panels A to G, as noted in the figure captions. Each panel depicts the relative fluorescence intensity (RFU, left margin) and thesize estimate in bases (top margin) derived from the internal lane size standard GeneScan-350 [ROX ] using the ABI GeneScan® Analysis version 2.1 soft-ware. The genetic markers observed from left to right, in order of size, are: Amelogenin, D3S1358, D8S1179, D5S818, HumvWA, D21S11, D13S317, Hum-FGA, D7S820, and D18S51.

374 JOURNAL OF FORENSIC SCIENCES
FIG. 11—Profiler Plus™ profiles from fresh bloodprints of individual B produced on linoleum and subjected to continuous exposure (54 days) to fivedifferent enhancing chemicals. PCR amplifications were performed using 1 ng to 2.5 ng of template DNA, with the exception of bloodprints enhanced withCrowle’s Double Stain where 0.3 ng of DNA was used. All PCR reactions were done in 25 mL volume as detailed in Materials and Methods. (A) Freshbloodprint, no enhancement; (B) Amido Black; (C) Crowle’s Double Stain; (D) Hungarian Red; (E) Leucomalachite green; (F) Luminol. Each panel de-picts the relative fluorescence intensity (RFU, left margin) and the size estimate in bases (top margin) derived from the internal lane size standard Gene-Scan-350 [ROX ] using the ABI GeneScan® Analysis version 2.1 software. The genetic markers observed from left to right, in order of size, are: Amelo-genin, D3S1358, D8S1179, D5S818, HumvWA, D21S11, D13S317, HumFGA, D7S820, and D18S51.

FRÉGEAU ET AL. • BLOOD ENHANCEMENT AGENTS AND DNA ANALYSIS 375
FIG. 12—Profiler Plus™ profiles from fresh bloodprints of individual A produced on clear glass and subjected to continuous exposure (54 days) to fivedifferent enhancing chemicals. PCR amplifications were performed using 2 ng to 2.5 ng of template DNA, with the exception of bloodprints enhanced withCrowle’s Double Stain where 0.6 ng of DNA was used. All PCR reactions were done in 25 mL volume as detailed in Materials and Methods. (A) Freshbloodprint, no enhancement; (B) Amido Black; (C) Crowle’s Double Stain; (D) Hungarian Red; (E) Leucomalachite green; (F) Luminol. Each panel de-picts the relative fluorescence intensity (RFU, left margin) and the size estimate in bases (top margin) derived from the internal lane size standard Gene-Scan-350 [ROX ] using the ABI GeneScan® Analysis version 2.1 software. The genetic markers observed from left to right, in order of size, are: Amelo-genin, D3S1358, D8S1179, D5S818, HumvWA, D21S11, D13S317, HumFGA, D7S820, and D18S51.

376 JOURNAL OF FORENSIC SCIENCES
FIG. 13—Profiler Plus™ profiles from fresh bloodprints of individual A produced on white painted wood and subjected to continuous exposure (54 days)to five different enhancing chemicals. PCR amplifications were performed using 1 ng to 2.5 ng of template DNA in 25 mL PCR reaction volume as detailedin Materials and Methods. (A) Fresh bloodprint, no enhancement; (B) Amido Black; (C) Crowle’s Double Stain; (D) Hungarian Red; (E) Leucomalachitegreen; (F) Luminol. Each panel depicts the relative fluorescence intensity (RFU, left margin) and the size estimate in bases (top margin) derived from theinternal lane size standard GeneScan-350 [ROX ] using the ABI GeneScan® Analysis version 2.1 software. The genetic markers observed from left to right,in order of size, are: Amelogenin, D3S1358, D8S1179, D5S818, HumvWA, D21S11, D13S317, HumFGA, D7S820, and D18S51.

FRÉGEAU ET AL. • BLOOD ENHANCEMENT AGENTS AND DNA ANALYSIS 377
FIG. 14—Profiler Plus™ profiles from fresh bloodprints of individuals A and B produced on 65% polyester/35% cotton blend fabric or Xerox-grade pa-per and subjected to continuous exposure (54 days) to two different enhancing reagents. PCR amplifications were performed using 2 ng to 2.5 ng of tem-plate DNA in 25 mL PCR reaction volume as detailed in Materials and Methods. Panels A to F, as noted in the figure captions. Each panel depicts the rel-ative fluorescence intensity (RFU, left margin) and the size estimate in bases (top margin) derived from the internal lane size standard GeneScan-350[ROX ] using the ABI GeneScan® Analysis version 2.1 software. The genetic markers observed from left to right, in order of size, are: Amelogenin,D3S1358, D8S1179, D5S818, HumvWA, D21S11, D13S317, HumFGA, D7S820, and D18S51.

378 JOURNAL OF FORENSIC SCIENCES
TABLE 12—Allele size measurements for aged (7- and 14-day-old) bloodprints from individual B applied to any of five surfaces following long-termexposure (7, 14 or 54 days) to any of seven blood enhancement chemicals.
Untreated Bloodprints Enhanced Bloodprints
Average AverageSize Standard Size Standard
Profile Plus Loci (bases) Deviation n* (bases) Deviation n†
D3S1358 126.51 0.11 31 126.46 0.17 151130.66 0.12 31 130.59 0.14 151
HumvWA 176.83 0.06 31 176.83 0.10 151184.85 0.06 31 184.87 0.08 151
HumFGA 227.64 0.21 31 227.70 0.18 151231.76 0.20 31 231.80 0.18 151
Amelogenin 106.58 0.10 31 106.55 0.15 151112.29 0.05 31 112.29 0.19 151
D8S1179 144.14 0.06 31 144.16 0.07 151152.63 0.04 31 152.63 0.07 151
D21S11 203.32 0.05 31 203.32 0.06 151207.41 0.06 31 207.41 0.08 151
D18S51 297.35 0.08 31 297.38 0.11 151301.31 0.08 31 301.37 0.12 151
D5S818 143.13 0.06 31 143.15 0.06 151155.52 0.04 31 155.53 0.06 151
D13S317 218.92 0.14 31 218.96 0.14 151227.06 0.15 31 227.10 0.16 151
D7S820 266.76 0.09 31 266.79 0.16 151270.70 0.09 31 270.72 0.17 151
* n represents the number of data points originating from 6 different gels.† n represents the number of data points originating from 10 different gels.
TABLE 11—Allele size measurements for aged (7- and 14-day-old) bloodprints from individual A applied to any of five surfaces following long-termexposure (7, 14 or 54 days) to any of seven blood enhancement chemicals.
Untreated Bloodprints Enhanced Bloodprints
Average AverageSize Standard Size Standard
Profile Plus Loci (bases) Deviation n* (bases) Deviation n†
D3S1358 126.54 0.09 28 126.51 0.17 130134.67 0.07 28 134.69 0.10 130
HumvWA 176.82 0.08 28 176.82 0.11 130184.84 0.06 28 184.86 0.09 130
HumFGA 231.77 0.21 28 231.80 0.17 130235.87 0.19 28 235.86 0.23 130
Amelogenin 106.57 0.10 28 106.56 0.16 130D8S1179 144.13 0.04 28 144.15 0.07 130
152.63 0.05 28 152.64 0.08 130D21S11 203.32 0.05 28 203.32 0.05 130
215.59 0.05 28 215.58 0.09 130D18S51 289.52 0.11 28 289.53 0.13 130
313.43 0.19 28 313.48 0.17 130D5S818 155.52 0.04 28 155.53 0.06 130
159.34 0.06 28 159.34 0.07 130D13S317 206.65 0.07 28 206.66 0.08 130
222.96 0.16 28 223.00 0.14 130D7S820 274.60 0.10 28 274.64 0.15 130
278.46 0.10 28 278.49 0.13 130
* n represents the number of data points originating from 7 different gels.† n represents the number of data points originating from 10 different gels.

References
1. Menzel ER. A perspective of the fingerprint field. Ident News 1983;XXXIII:5–7.
2. Shutler GG. A study on the inter-relationship between fingerprint devel-oping techniques and bloodstain identification and typing methods. CanSoc Forensic Sci J 1980;13:1–8.
3. Oden S, von Hofsten B. Detection of fingerprints by the ninhydrin reac-tion. Nature 1954;173:449–50.
4. Almog J, Hirshfeld A, Klug JT. Reagents for the chemical developmentof latent fingerprints: Synthesis and properties of some ninhydrin ana-logues. J Forensic Sci 1982;27:912–7.
5. Menzel ER, Everse J, Everse K, Sinor TW, Burt JA. Room light and laserdevelopment of latent fingerprints with enzymes. J Forensic Sci 1984;29:99–109.
6. Stoilovic M, Kobus HJ, Margot PA, Warrener RN. Improved enhance-ment of ninhydrin developed fingerprints by cadmium complexation us-ing low temperature photoluminescence techniques. J Forensic Sci 1986;31:432–45.
7. Everse KE, Menzel ER. Sensitivity enhancement of ninhydrin-treated la-tent fingerprints by enzymes and metal salts. J Forensic Sci 1986;31:446–54.
8. Kendall FG. Super Glue fuming for the development of latent finger-prints. Ident News 1982;XXXII:3–5.
9. Menzel ER, Burt JA, Sinor TW, Tubach-Ley WB, Jordan KJ. Laser de-tection of latent fingerprints: Treatment with glue containing cyanoacry-late ester. J Forensic Sci 1983;28:307–17.
10. Dalrymple BE, Duff JM, Menzel ER. Inherent fingerprint lumines-cence—Detection by laser. J Forensic Sci 1977;22:106–15.
11. Menzel ER, Almog J. Latent fingerprint development by frequency-dou-bled neodymium: Yttrium aluminum garnet (Nd:YAG) laser: Benzo(ƒ )ninhydrin. J Forensic Sci 1985;30:371–82.
12. Herod DW, Menzel ER. Laser detection of latent fingerprints: Ninhydrinfollowed by zinc chloride. J Forensic Sci 1982;27:513–8.
13. Burt JA, Menzel ER. Laser detection of latent fingerprints: Difficult sur-faces. J Forensic Sci 1985;13:364–70.
14. Mazzella WD, Lennard CJ. An additional study of cyanoacrylate stains.J Forensic Ident 1995;45:5–9.
15. Taylor EM, Douglas BD. A dry fluorescent magnetic particle for usewith magnetic fingerprint powders. J Forensic Ident 1997;47:395–9.
16. Proescher F, Moody AM. Detection of blood by means of chemilumi-nescence. J Lab Clin Med 1939;24:1183–9.
17. Ballou SM. Moves of murder. J Forensic Sci 1995;40:677–80.18. Waldoch TL. Chemical detection of blood after dilution by rain over a
72 day period. J Forensic Ident 1996;46:173–7.19. Lytle LT, Hedgecock DG. Chemiluminescence in the visualization of
forensic bloodstains. J Forensic Sci 1978;23:550–62.20. Hunt AC, Corby C, Dodd BE, Camps FE. The identification of human
blood stains. A critical survey. J Forensic Med 1960;7:112–30.21. Patty JR, Giberson M. Safer bloody fingerprint spray. Ident News 1985;
7,11.22. Hansen TA. Presumptive blood test used for statement corroboration. J
Forensic Ident 1994;44:517–21.23. Garner DD, Cano KM, Peimer RS, Yeshion TE. An evaluation of tetra-
methylbenzidine as a presumptive test for blood. J Forensic Sci 1976;21:816–21.
24. Olsen RD. Sensitivity comparison of blood enhancement techniques.Ident News 1985;10–4.
25. Cox M. A study of the sensitivity and specificity of four presumptivetests for blood. J Forensic Sci 1991;36:1503–11.
26. Theeuwen ABE, van Barneveld S, Drok JW, Keereweer I, LimborghJCM, Naber WM, et al. Enhancement of footwear impressions in blood.Forensic Sci Int 1998;95:133–51.
27. McCarthy MM, Grieve DL. Preprocessing with cyanoacrylate ester fum-ing for fingerprint impressions in blood. J Forensic Ident 1988;39:23–31.
28. Norkus P, Noppinger K. New reagent for the enhancement of bloodprints. Fingerprint Whorld 1986;12:15–6.
29. Becraft M, Heintzman M. Applications of Crowle’s stain in the en-hancement of bloody fingerprints. Fingerprint Whorld 1987;12:65–6.
30. McComiskey P. DFO—A simple and quick method for the developmentof latent fingerprints. Fingerprint Whorld 1990;16:64–5.
31. Puchtler H, Sweat F. Histochemical specificity of staining methods forconnective tissue fiber. Resorcib fuchsin and Van Giesons picrofuchsin.Histochem 1964;4:24–34.
32. Lee HC, Gaensslen RE, Pagliaro EM, Guman MB, Berka KM, Keith TP,et al. The effect of presumptive test, latent fingerprint and some other
reagents and materials on subsequent serological identification, geneticmarker and DNA testing in bloodstains. J Forensic Ident 1989;39:339–57.
33. Duncan GT, Seiden H, Vallee L, Ferraro D. Effects of superglue, otherfingerprint developing agents, and luminol on bloodstain analysis. J As-soc Off Anal Chem 1986;69:677–80.
34. Laux DL. Effects of luminol on the subsequent analysis of bloodstains. JForensic Sci 1991;36:1512–20.
35. Wyman AR, White R. A highly polymorphic locus in human DNA. ProcNatl Acad Sci USA 1980;77:6754–8.
36. Nakamura Y, Leppert M, O’Connell P, Wolff R, Holm T, Culver M, etal. Variable number of tandem repeat (VNTR) markers for human genemapping. Science 1987;235:1616–22.
37. Waye JS, Fourney RM. Forensic DNA typing of highly polymorphicVNTR loci. In: Forensic Science Handbook, Vol. III, R. Saferstein, edi-tor, New Jersey: Regents/Prentice-Hall, 358–97.
38. Hochmeister MN, Budowle B, Baechtel FS. Effects of presumptive testreagents on the ability to obtain restriction fragment length polymor-phism (RFLP) patterns from human blood and semen stains. J ForensicSci 1991;36:656–61.
39. Shipp E, Roelofs R, Togneri E, Wright R, Atkinson D, Henry B. Effectsof argon laser light, alternate source light, and cyanoacrylate fuming onDNA typing of human bloodstains. J Forensic Sci 1993;38:184–91.
40. Stein C, Kyeck SH, Henssge C. DNA typing of fingerprint reagenttreated biological stains. J Forensic Sci 1996;41:1012–7.
41. Saiki RK, Scharf S, Faloona F, Mullis KB, Horn GT, Erlich HA, et al.Enzymatic amplification of beta-globin genomic sequences and restric-tion analysis for diagnosis of sickle cell anemia. Science 1985;230:1350–4.
42. Weber JL, May PE. Abundant class of human DNA polymorphismswhich can be typed using the polymerase chain reaction. Am J HumGenet 1989;44:388–96.
43. Edwards A, Civitello A, Hammond HA, Caskey CT. DNA typing andgenetic mapping with trimeric and tetrameric tandem repeats. Am J HumGenet 1991;49:746–56.
44. Beckmann JS, Weber JL. Survey of human and rat microsatellites. Ge-nomics 1992;12:627–31.
45. Zierdt H, Hummel S, Herrmann B. Amplification of human short tandemrepeats from medieval teeth and bone samples. Hum Biol 1996;68:185–99.
46. Strom CM, Rechitsky S. Use of nested PCR to identify charred humanremains and minute amounts of blood. J Forensic Sci 1998;43:696–700.
47. Sanchez-Hanke M, Püschel K, Augustin C, Wiegand P, Brinkmann B.PCR-typing of DNA extracted from epidermal particles won by scratch-ing. In: Carracedo A, Brinkmann B, Bär W, editors. Advances in Foren-sic Haemogenetics. Proceedings of the Sixteenth Congress of the Inter-national Society for Forensic Haemogenetics; 12–16 Sept. 1995;Santiago de Compostela. Spain:Springer-Verlag, 1996;316–8.
48. Garofano L, Lago G, Zanon C, Virgili A, D’Errico G, Vespi G, et al. PCR-based analyses of epidermal cells found on adhesive tape. In: CarracedoA, Brinkmann B, Bär W, editors. Advances in Forensic Haemogenetics.Proceedings of the Sixteenth Congress of the International Society forForensic Haemogenetics; 12–16 Sept. 1995; Santiago de Compostela.Spain: Springer-Verlag, 1996;281–3.
49. Wiegand P, Kleiber M. DNA typing of epithelial cells after strangula-tion. Int J Leg Med 1997;110:181–3.
50. Sweet D, Lorente JA, Valenzuela A, Lorente M, Villanueva E. PCR-based DNA typing of saliva stains recovered from human skin. J Foren-sic Sci 1997;42:447–51.
51. Herber B, Herold K. DNA typing of human dandruff. J Forensic Sci1998;43:648–56.
52. Lins AM, Sprecher CJ, Puers C, Schumm JW. Multiplex sets for the am-plification of polymorphic short tandem repeat loci-Silver stain and flu-orescence detection. Bio Techniques 1996;20:882–9.
53. Hochmeister MN, Budowle B, Eisenberg A, Borer UV, Dirnhofer R. Us-ing multiplex PCR amplification and typing kits for the analysis of DNAevidence in a serial killer case. J Forensic Sci 1996;41:155–62.
54. Corach D, Sala A, Penacino G, Sotelo A. Mass disasters: Rapid molecu-lar screening of human remains by means of short tandem repeats typing.Electrophoresis 1995;16:1617–23.
55. Yamamoto T, Uchihi R, Kojima T, Nozawa H, Huang X-L, Tamaki K,et al. Maternal identification from skeletal remains of an infant kept bythe alleged mother for 16 years with DNA typing. J Forensic Sci1998;43:701–5.
56. Frégeau CJ, Fourney RM. DNA typing with fluorescently tagged short
FRÉGEAU ET AL. • BLOOD ENHANCEMENT AGENTS AND DNA ANALYSIS 379
380 JOURNAL OF FORENSIC SCIENCES
tandem repeats: A sensitive and accurate approach to human identifica-tion. Bio Techniques 1993;15:100–19.
57. Gill P, Ivanov PL, Kimpton C, Piercy R, Benson N, Tully G, et al.Identification of the remains of the Romanov family by DNA analysis.Nature Genet 1994;6:130–5.
58. Whitaker JP, Clayton TM, Urquhart AJ, Millican ES, Downes TJ, Kimp-ton CP, et al. Short tandem repeat typing of bodies from a mass disaster:High success rate and characteristic amplification patterns in highly de-graded samples. Bio Techniques 1995;18:670–7.
59. Frégeau CJ, Bowen KL, Fourney RM. Validation of highly polymorphicfluorescent multiplex short tandem repeat systems using two generationsof DNA sequencers. J Forensic Sci 1999;44:133–66.
60. Hochmeister M, Cordier A, Rudin O, Borer U. Typisierung von blut-spuren auf basis der polymerase chain reaction (PCR) nach bedampfungdes spurenträgers mit cyanacrylatester (“Super Glue”). Archiv Kriminol1993;192:153–8.
61. Andersen J, Bramble S. The effects of fingermark enhancement lightsources on subsequent PCR-STR DNA analysis of fresh bloodstains. JForensic Sci 1997;42:303–6.
62. AmpF,STR Profiler Plus™ PCR Amplification Kit User’s Manual1997. Perkin Elmer Applied Biosystems, Human Identification Depart-ment, San Jose, CA.
63. Germain O, Miller K. Blood reagents—Their use and their effect on
DNA. Ottawa (ON) Royal Canadian Mounted Police Forensic Identifica-tion Research and Review Section; 1998 Nov, Bulletin No. 42.
64. Royal Canadian Mounted Police, Forensic Laboratory Services Direc-torate. Biology Section Methods Guide. Rev. ed. Ottawa, ON, RCMP,1998.
65. Waye JS, Presley LA, Budowle B, Shutler GG, Fourney RM. A simple andsensitive method for quantifying human genomic DNA in forensic speci-men extracts. BioTechniques 1989;7:852–5.
66. Frégeau CJ, Aubin RA, Elliott JC, Gill SS, Fourney RM. Characterizationof human lymphoid cell lines GM9947 and GM9948 as intra- and interlab-oratory reference standards for DNA typing. Genomics 1995;28:184–97.
67. Van Oorschot RAH, Jones MK. DNA fingerprints from fingerprints. Na-ture 1997;387:767.
Additional information and reprint requests:Ron Fourney, Ph.D.i /c National DNA Data BankRoyal Canadian Mounted Police Central Forensic Laboratory1200 Vanier ParkwayOttawa, OntarioCANADA KIG 3M8