finite difference model of subgrade reinforcement using
TRANSCRIPT
Geosynthetics 2015 February 15-18, Portland, Oregon
Finite Difference Model of Subgrade Reinforcement Using Geosynthetics Rajan Ramya, CTI and Associates, Inc., USA, [email protected] Kevin C. Foye, Ph.D., P.E., CTI and Associates, Inc., USA, [email protected] Mohammad Kabalan, CTI and Associates, Inc., USA, [email protected] Te-Yang Soong, Ph.D., P.E., CTI and Associates, Inc., USA, [email protected]
ABSTRACT Several civil, geotechnical, and geoenvironmental applications have benefited from the inclusion of geosynthetic reinforcement to control subgrade deformation and differential settlement. The inclusion of this reinforcement can greatly enhance the durability and longevity of constructed facilities. However, engineers’ ability to quantify effect of reinforcement on deformation under load is limited due to the complicated nature of the geosynthetic-soil interaction mechanism. This paper presents a finite-difference-based analysis method to model the effects of geosynthetic subgrade reinforcement on cross-plane deformation. This method was developed specifically for use in performance assessments of landfill final covers, where larger areas need to be modeled with computationally-efficient algorithms. Accordingly, the methods presented in this paper could be integrated into design analyses of large areas. The method draws from previous analytical studies as well as experimental models of landfill covers, road subgrade and sinkhole bridging reinforcement. Example results are presented to show how the method can be implemented for a representative design scenario.
1. INTRODUCTION Geosynthetics have been successfully incorporated as geosynthetic reinforcement in design of roads, tunnels and sinkhole remediation to control subgrade deformation, mitigate differential settlement and increase stability. For an efficient, reliable and safe design, it is crucial to model the reinforced soil realistically. A three-parameter model, named the Tension-Shear-Spring (TSS) model, was developed to study the impact of various external and internal parameters on the performance of reinforced soil. The TSS model allows the consideration of reinforcement effects on differential settlement. The basic differential equation governing the TSS model was implemented using the method of finite differences (FD) and set up in Microsoft Excel 2010 as spreadsheets. Example problems from selected case histories were modeled using the developed methodology. The results from the TSS model were then compared against experimental results obtained from the case histories.
2. THEORY 2.1 Assumptions
Certain assumptions were made while formulating the TSS model. These assumptions greatly simplified the analysis of the TSS model, while allowing for a conservative engineering approach to the problem.
The subgrade is an elastic, isotropic and homogenous continuum. This assumption is acceptable for non-linear values of modulus of subgrade reaction implemented in this study.
The geosynthetic layer experienced no slip during loading. As a result, sufficient embedment of the geosynthetic reinforcement is required outside of depression-susceptible areas.
All depressions and cavities underlying the geosynthetic reinforcement were modeled in two dimensions, as infinitely long depressions or cavities into the plane of paper.
The tension in the geosynthetic was assumed to be uniform. 2.2 Model Development The plane-strain, cross-sectional profile of the problem studied is presented in Figure 1. Upon creation of a cavity or depression in the subgrade, the soil above would tend to deflect downward. Since soil has negligible stiffness or strength in tension, the soil directly above the depression or cavity would fail in tension and cave into the cavity or depression (Galloway et al. 1999). The geosynthetic provides the reinforcement required to resist tensile stresses generated due to the depression in the subgrade.
1009
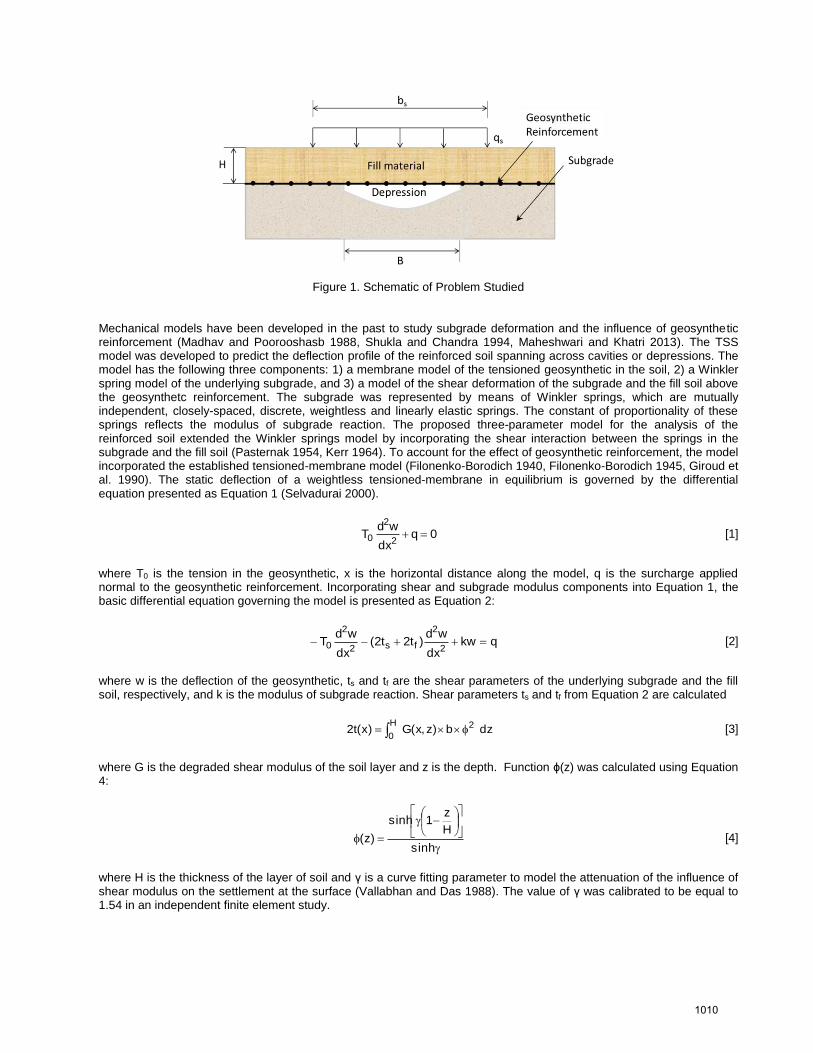
Figure 1. Schematic of Problem Studied Mechanical models have been developed in the past to study subgrade deformation and the influence of geosynthetic reinforcement (Madhav and Poorooshasb 1988, Shukla and Chandra 1994, Maheshwari and Khatri 2013). The TSS model was developed to predict the deflection profile of the reinforced soil spanning across cavities or depressions. The model has the following three components: 1) a membrane model of the tensioned geosynthetic in the soil, 2) a Winkler spring model of the underlying subgrade, and 3) a model of the shear deformation of the subgrade and the fill soil above the geosynthetc reinforcement. The subgrade was represented by means of Winkler springs, which are mutually independent, closely-spaced, discrete, weightless and linearly elastic springs. The constant of proportionality of these springs reflects the modulus of subgrade reaction. The proposed three-parameter model for the analysis of the reinforced soil extended the Winkler springs model by incorporating the shear interaction between the springs in the subgrade and the fill soil (Pasternak 1954, Kerr 1964). To account for the effect of geosynthetic reinforcement, the model incorporated the established tensioned-membrane model (Filonenko-Borodich 1940, Filonenko-Borodich 1945, Giroud et al. 1990). The static deflection of a weightless tensioned-membrane in equilibrium is governed by the differential equation presented as Equation 1 (Selvadurai 2000).
0qdx
wdT
2
2
0 [1]
where T0 is the tension in the geosynthetic, x is the horizontal distance along the model, q is the surcharge applied normal to the geosynthetic reinforcement. Incorporating shear and subgrade modulus components into Equation 1, the basic differential equation governing the model is presented as Equation 2:
qkwdx
wd)t2t2(
dx
wdT
2
2
fs2
2
0 [2]
where w is the deflection of the geosynthetic, ts and tf are the shear parameters of the underlying subgrade and the fill soil, respectively, and k is the modulus of subgrade reaction. Shear parameters ts and tf from Equation 2 are calculated
dzb)z,x(G)x(t2H
0
2 [3]
where G is the degraded shear modulus of the soil layer and z is the depth. Function ϕ(z) was calculated using Equation 4:
sinh
H
z1sinh
)z( [4]
where H is the thickness of the layer of soil and γ is a curve fitting parameter to model the attenuation of the influence of shear modulus on the settlement at the surface (Vallabhan and Das 1988). The value of γ was calibrated to be equal to 1.54 in an independent finite element study.
1010
Degraded shear modulus G from Equation 3 is calculated by multiplying the initial shear modulus by a secant stiffness ratio. The initial shear modulus (Gmax) for a normally consolidated layer of soil was estimated by the empirical relationship proposed by Hardin and Drnevich (1972):
e1
e97.2
p
'321
p
G 25.0
a
m
a
max
[5]
where pa is atmospheric pressure, σ′m is the mean effective stress and e is the void ratio. When the deflection profile of the geosynthetic was obtained, strains up to 10% were calculated. The degradation in the stiffness of the soil was accordingly taken into account. Figures presented in Atkinson (2000) give an approximate reduction in soil stiffness at high strains for different degrees of non-linearity. For this problem, a secant stiffness ratio of 0.001 was selected from results presented by Atkinson (2000) for strains = 10%. Modulus of subgrade reaction k from Equation 2 is calculated
dzdz
db)z,x(M)x(k
H
0 2
2
[6]
where M(x, z) is the constrained modulus of the subgrade estimated from soil properties, b is the width of model into plane of the analysis and ϕ is the function that describes the mode shape to characterize the vertical distribution in the subgrade (Vlasov and Leontiev 1966), given previously by Equation 4. Using Equations 2 through 6, the tension developed in the geosynthetic over the depression was calculated as follows. An initial value of tension was assumed and the strain in the geosynthetic and the corresponding tensile modulus of the geosynthetic were calculated. The tensile force in the geosynthetic was then computed by iteratively minimizing the error between the calculated and actual tensile modulus of the geosynthetic. 3. METHODOLOGY 3.1 Calculation The second order differential term in Equation 2 was approximated using the explicit central difference method shown in Equation 7:
22
2
h
)hx(w)x(w2)hx(w
dx
wd [7]
A matrix solution similar to that presented by Nikodym and Frydrysek (2010) was developed to solve the system of equations for each node in the model, given a set of material properties and boundary conditions. Equation 2 was rewritten as Equation 8 using matrices and the central difference method.
[q(x)] = [k(x)]×[w(x)] – 2
0
h
T[Tx]×[w(x)] –
2h
1[2t(x)]×[Gx]×[w(x)] [8]
The load matrix, [q(x)] and the deflection matrix, [w(x)] are column matrices spanning the length of the model. The stiffness model, [k(x)] and the shear matrix, [2t(x)] are diagonal matrices with each diagonal element representing the subgrade stiffness and shear resistance, respectively, at the corresponding node along the model. The matrices [Gx] and [Tx] are both coefficient matrices of the deflection matrix for shear and tension in the geosynthetic, respectively. The
coefficient matrices are square matrices introduced to implement the central difference approximations of the second order differential terms. The coefficient matrices were also used to incorporate the boundary conditions for the model. Using distributive properties of matrices, Equation 8 was simplified into Equation 9.
[q(x)] = { [k(x)] – 2
0
h
T[Tx] –
2h
1[2t(x)]×[Gx] } × [w(x)] = [Ux]×[w(x)] [9]
1011
where [Ux] is the sum total matrix defined by Equation 9. With appropriate boundary conditions, the matrix [Ux] was made definite. The matrix [Ux] was thus invertible and Equation 10 was used to compute the deflection matrix.
[w(x)] = [Ux]
-1×[q(x)] [10]
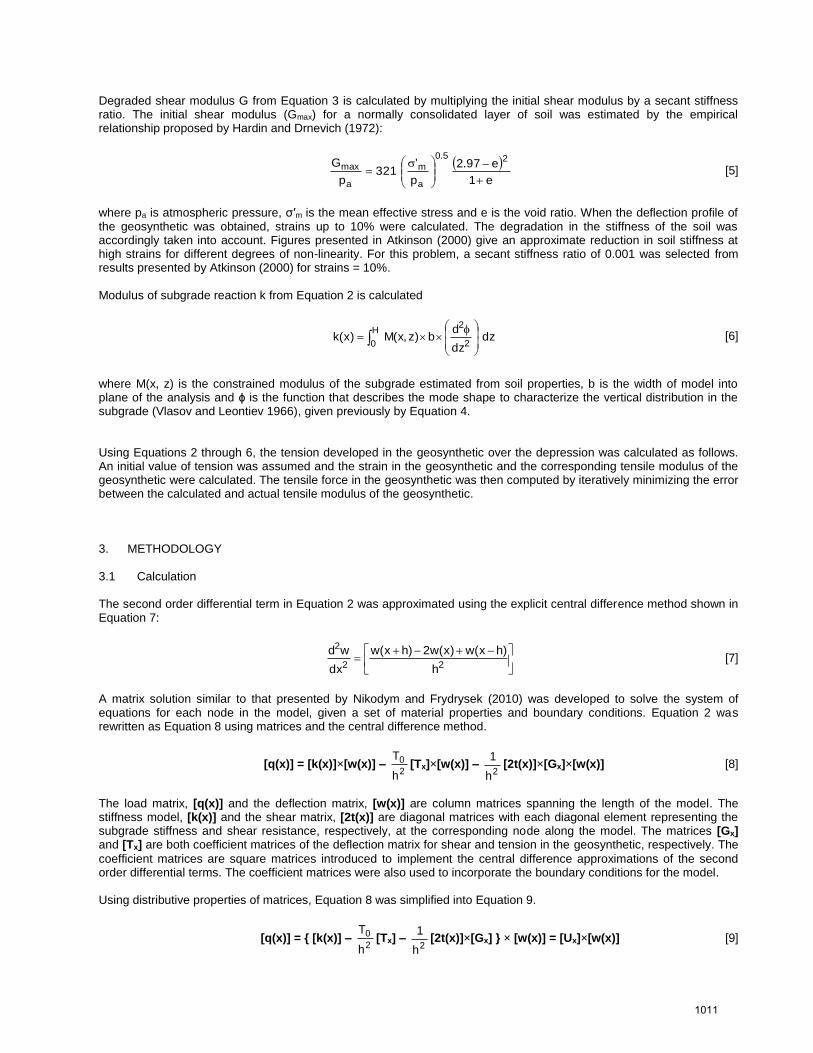
3.2 Validation Experimental case histories were modeled with the proposed TSS model. The schematic of the problem studied is presented in Figure 1. B is the width of the depression created, H the thickness of the fill material above the depression, J the tensile stiffness of the geosynthetic in the direction of reinforcement, and qs the surcharge applied during the experiment over length bs on the surface of the fill material. The key input values from each case history are presented in Table 1. The height of the fill soil was used to compute the total surcharge applied and to model the shear contribution of the fill soil layer. The boundary conditions were determined individually for each case history based on the test setup information.
Table 1. Test Characteristics from Case Histories
Case History H (m) B (m) bs (m) qs (kPa) J (kN/m) Type of subgrade
material
Neogi (1991) 0.6 1.8 0.15 0-80 875-4553 Wooden Box Villard et al. (2000) 1.5 2-4 N/A 0 455-3636 Coarse Alluvium Blivet et al. (2000) 1 2 N/A 0 938-3600 Rigid Base
Leng (2002) 0.15-0.25 N/A1
0.3 137 284-653 Kaolinite 1No depression was induced prior to loading
3.2.1 Case Histories Neogi (1991) conducted experiments with a 24-foot long, 2-foot wide and 2-foot deep wooden box and used a 6-foot wide trap door at the bottom of the box. A layer of geogrid was placed at the bottom and then the box was filled with sand and compacted. The soil was loaded by a hydraulic jack with a loading plate, centrally located over the trap door. The trap door was then lowered, thus simulating the creation of a 6-foot wide cavity. These experiments were performed with single and multiple layers of geogrids. Villard et al. (2000) conducted full-scale experiments on reinforced fills over sinkhole formations using a geosynthetic sheet for reinforcement. Expanded clay beads were used to initially fill the proposed space for the cavity underlying the geosynthetic sheet. When the sinkholes were to be simulated, the clay beads were pumped out. The geosynthetic sheet over the cavity was fitted with vertical displacement sensors to measure the deflection of the geosynthetic layer. Full-scale tests were conducted at the Road Testing Centre (CER) in Rouen, France by Blivet et al. (2000). The subsurface cavity was covered with a metal plate that was held up with jacks during the placement of the geosynthetic layer and fill material. The sinkhole under the geosynthetic sheet was simulated by letting the metal plate covering the cavity fall. Leng (2002) performed experiments to study the load-deformation response of reinforced soil using different types of geogrids. However during these experiments no cavity or void was created. In the absence of a cavity, lower deformations were observed in the geogrid. Due to low strains, the tensioned membrane effect of the geogrid was much less significant than in the other case histories. 4. RESULTS 4.1 Case Histories Examples In general, the proposed model shows good agreement with the published case histories, exhibiting both the same magnitude and the same trend in deformation as the experimental results as test conditions were varied. The results from the case histories along with the results from the TSS model are presented below in Table 2 and Figure 2.
1012

Table 2. TSS Model and Published Experimental Results Summary
Case History Tests Max. Deflection of Geosynthetic (m)
bias TSS Model Published Results
Blivet et al. (2000)
SCER1 0.23 0.20 0.88 SCER2 0.12 0.14 1.21 SCER3 0.12 0.15 1.31 SCER4 0.25 0.20 0.79
Villard et al. (2000)
SCET1 0.28 0.21 0.75 SCET2 0.71 >0.60 0.85 SCET3 0.59 0.46 0.78 SNCF1 0.36 0.26 0.72 SNCF2 0.71 >0.51 0.72 SNCF3 0.57 >0.51 0.90 SNCF4 0.28 0.20 0.71
Neogi (1991)
Test 1: Single layer TNX-5001
0 kN 0.15 0.16 1.11 2.22 kN 0.17 0.19 1.11 4.45 kN 0.19 0.22 1.20 6.67 kN 0.20 0.25 1.26
Test 2: Double layer
TNX-5001
0 kN 0.12 0.14 1.21 2.22 kN 0.13 0.16 1.21 4.45 kN 0.15 0.20 1.35 6.67 kN 0.16 0.23 1.44
Test 3: Double layer
BX-1200
0 kN 0.20 0.21 1.02 2.22 kN 0.24 0.23 0.95 4.45 kN 0.26 0.25 0.94 6.67 kN 0.29 0.28 0.97
Test 4: Triple layer BX-1200
0 kN 0.18 0.18 0.99 2.22 kN 0.21 0.21 1.00 4.45 kN 0.23 0.23 1.03 6.67 kN 0.25 0.26 1.07
Leng (2002)
6-3, 6-4 0.0059 0.0077 1.29 10-2, 10-3 0.0049 0.0041 0.83 10-4, 10-5 0.0049 0.0037 0.75
10-6 0.0049 0.0040 0.83 10-7 0.0049 0.0036 0.74
Mean 1.00 Median 0.98 Standard Deviation 0.21
The accuracy of TSS model predictions can be quantified in terms of the bias factor :
deflection predicted
deflection measured [11]
The bias factor was computed for each of the results presented in Table 2. Variation in the bias factor was summarized through the standard deviation, which was calculated to be 0.21. This result exhibits the typical accuracy for a model predicting the behavior of a geological material as follows. The computed standard deviation of bias factor can be compared to the coefficient of variation (COV) for the compressibility of subgrade materials. This comparison is useful since the ability to accurately describe the compressibility of the subgrade directly affects predictions of differential settlement. The variability of measurements of subgrade properties also affects the ability to accurately back-analyze the deflection of the subgrade, as is being demonstrated with the TSS model. A typical value of COV for tests of compressibility in soils is 30% as suggested by Baecher and Chrisitan (2003). Since the standard deviation of the bias factor is smaller than 30% (21% < 30%), the accuracy of the TSS model to reproduce experimental results is within the variability expected for tests of subgrade material. Also, the mean and median values of bias factor, 1.00 and 0.98, respectively, show that the TSS model has little overall bias and may tend to slightly over predict deflection. This result validates the use of the TSS model in this application. Using the experimental data from case histories, input parameters were grouped to simulate a parametric study. The different trends in the behavior of the geosynthetic reinforcement using the TSS model were then observed. The
1013
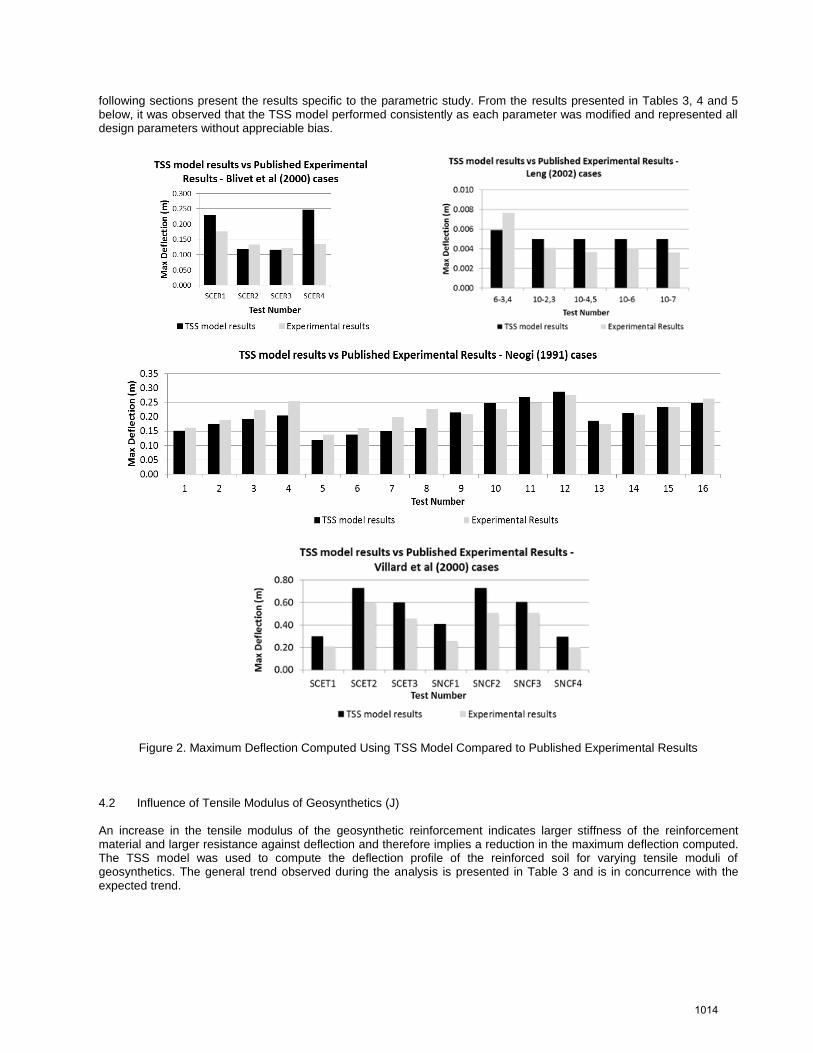
following sections present the results specific to the parametric study. From the results presented in Tables 3, 4 and 5 below, it was observed that the TSS model performed consistently as each parameter was modified and represented all design parameters without appreciable bias.
Figure 2. Maximum Deflection Computed Using TSS Model Compared to Published Experimental Results
4.2 Influence of Tensile Modulus of Geosynthetics (J) An increase in the tensile modulus of the geosynthetic reinforcement indicates larger stiffness of the reinforcement material and larger resistance against deflection and therefore implies a reduction in the maximum deflection computed. The TSS model was used to compute the deflection profile of the reinforced soil for varying tensile moduli of geosynthetics. The general trend observed during the analysis is presented in Table 3 and is in concurrence with the expected trend.
1014

Table 3. Influence of Geosynthetic Tensile Modulus on Geosynthetic Deflection
Case History Test B (m) H (m) J (kN/m) Max Deflection of
Geosynthetic – TSS Model (m)
Villard et al. (2000)
SNCF1 2 1.5 455 0.36
SCET1 2 1.5 1,818 0.28
SCET2 4 1.5 1,818 0.71
SCET3 4 1.5 3,600 0.59
SNCF3 4 1.5 3,636 0.57
Neogi (1991)
Test 1 – 0 kN 1.83 0.61 875 0.20
Test 2 – 0 kN 1.83 0.61 1,313 0.18
Test 3 – 0 kN 1.83 0.61 2,277 0.15
Test 4 – 0 kN 1.83 0.61 4,553 0.12
4.3 Influence of Surcharge (qs) Table 4 presents the variation in deflection profile of the geosynthetic reinforcement for different values of surcharge, without varying the other parameters. It was observed that with an increase in surcharge, the maximum deflection of the geosynthetic reinforcement increased.
Table 4. Influence of Surcharge on Geosynthetic Deflection
Case History Test B (m) qs (kPa) J (kN/m) Max Deflection of
geosynthetic reinforcement – TSS model (m)
Blivet et al. (2000)
SCER1 2.07 18.7 938 0.231 SCER4 2.07 22.9 938 0.247
SCER2 2.07 14.7 3600 0.116 SCER3 2.07 15.7 3600 0.118
Neogi (1991)
Test 1
1.83 11.6 875 0.15
1.83 37.7 875 0.17
1.83 63.8 875 0.19
1.83 89.9 875 0.20
Test 3
1.83 11.6 2,277 0.20
1.83 37.7 2,277 0.24
1.83 63.8 2,277 0.26
1.83 89.9 2,277 0.29
4.4 Influence of Width of Depression An increase in the width of depression indicates reduction in the rigidity of the geosynthetic reinforcement and therefore implies an increase in the maximum deflection of geosynthetic reinforcement, provided the other parameters are not varied. Villard et al. (2000) performed full-scale experiments with varying widths of depressions. Table 5 presents the general trend observed with varying depression widths.
Table 5. Influence of Depression Width on Geosynthetic Deflection
Case History Test B (m) H (m) J (kN/m) Max Deflection of
Geosynthetic – TSS model (m)
Villard et al. (2000)
SCET1 2 1.5 1818 0.28 SCET2 4 1.5 1818 0.71
SNCF1 2 1.5 455 0.36 SCET3 4 1.5 3600 0.59
1015
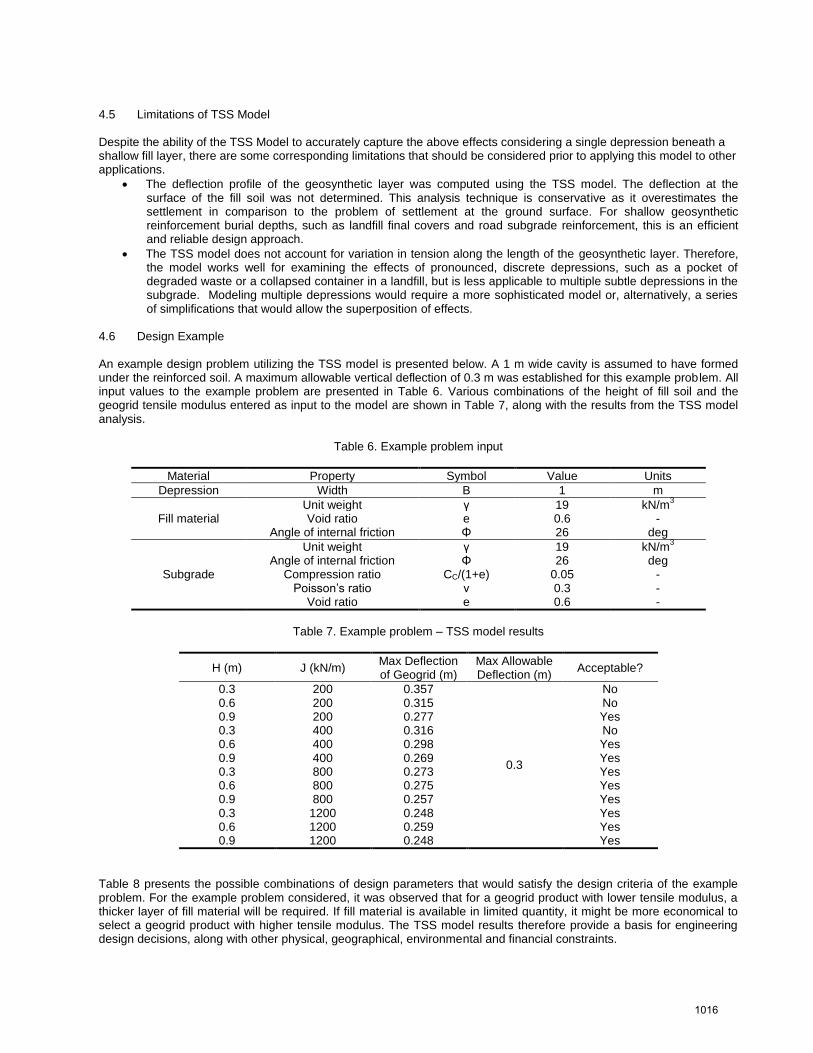
4.5 Limitations of TSS Model Despite the ability of the TSS Model to accurately capture the above effects considering a single depression beneath a shallow fill layer, there are some corresponding limitations that should be considered prior to applying this model to other applications.
The deflection profile of the geosynthetic layer was computed using the TSS model. The deflection at the surface of the fill soil was not determined. This analysis technique is conservative as it overestimates the settlement in comparison to the problem of settlement at the ground surface. For shallow geosynthetic reinforcement burial depths, such as landfill final covers and road subgrade reinforcement, this is an efficient and reliable design approach.
The TSS model does not account for variation in tension along the length of the geosynthetic layer. Therefore, the model works well for examining the effects of pronounced, discrete depressions, such as a pocket of degraded waste or a collapsed container in a landfill, but is less applicable to multiple subtle depressions in the subgrade. Modeling multiple depressions would require a more sophisticated model or, alternatively, a series of simplifications that would allow the superposition of effects.
4.6 Design Example An example design problem utilizing the TSS model is presented below. A 1 m wide cavity is assumed to have formed under the reinforced soil. A maximum allowable vertical deflection of 0.3 m was established for this example problem. All input values to the example problem are presented in Table 6. Various combinations of the height of fill soil and the geogrid tensile modulus entered as input to the model are shown in Table 7, along with the results from the TSS model analysis.
Table 6. Example problem input
Material Property Symbol Value Units
Depression Width B 1 m
Fill material Unit weight γ 19 kN/m
3
Void ratio e 0.6 - Angle of internal friction Φ 26 deg
Subgrade
Unit weight γ 19 kN/m3
Angle of internal friction Φ 26 deg Compression ratio CC/(1+e) 0.05 -
Poisson’s ratio ν 0.3 - Void ratio e 0.6 -
Table 7. Example problem – TSS model results
H (m) J (kN/m) Max Deflection of Geogrid (m)
Max Allowable Deflection (m)
Acceptable?
0.3 200 0.357
0.3
No 0.6 200 0.315 No 0.9 200 0.277 Yes 0.3 400 0.316 No 0.6 400 0.298 Yes 0.9 400 0.269 Yes 0.3 800 0.273 Yes 0.6 800 0.275 Yes 0.9 800 0.257 Yes 0.3 1200 0.248 Yes 0.6 1200 0.259 Yes 0.9 1200 0.248 Yes
Table 8 presents the possible combinations of design parameters that would satisfy the design criteria of the example problem. For the example problem considered, it was observed that for a geogrid product with lower tensile modulus, a thicker layer of fill material will be required. If fill material is available in limited quantity, it might be more economical to select a geogrid product with higher tensile modulus. The TSS model results therefore provide a basis for engineering design decisions, along with other physical, geographical, environmental and financial constraints.
1016

Table 8. Example Problem – Acceptable Combinations of Design Parameters
H (m) J (kN/m)
0.3 800 0.6 400 0.9 200
5. CONCLUSIONS In the present study, a simplified model has been proposed to predict the behavior of geosynthetically-reinforced soil resting on top of subgrade susceptible to depressions or cavities. The solution of the governing differential equation of the TSS model was set up using spreadsheets in Microsoft Excel 2010. The FD methodology was successfully employed to analyze example problems from published case histories and compare the proposed model against experimental results. In general, the TSS model results show good agreement with published experimental results, exhibiting minimal bias and less error than in predictions of subgrade compressibility. Therefore, the TSS model can be used to analyze the settlement profile of cross-sections of geosynthetically-reinforced soil, especially shallow fill applications such as landfill final covers. An example problem was also presented to demonstrate how the TSS model can be used for the design of geosynthetically-reinforced soil. REFERENCES
Atkinson, J. H. (2000). Non-linear soil stiffness in routine design, Géotechnique, ICE, 50(5): 487-508
Baecher, G. B. and Christian, J. T. (2003). Reliability and Statistics in Geotechnical Engineering, Wiley, Hoboken, New
Jersey, USA, 605 p.
Blivet J.C., Khay M., Villard P. and Gourc J.P. (2000). Experiment and Design of Geosynthetic Reinforcement to Prevent
Localised Sinkholes, GeoEngg 2000, Melbourne, Australia
Filonenko-Borodich, M.M. (1940). Some Approximate Theories of the Elastic Foundation, (in Russian) Uchenyie Zapiski
Moskovskogo Gosudarstvennogo Universiteta (Mekhanika), 46: 3-18
Filonenko-Borodich, M.M. (1945). A Very Simple Model of an Elastic Foundation Capable of Spreading the Load, Sb. Tr.
Mosk. Elektro. Inst. Inzh., Trans. No: 53, Transzheldorizdat (in Russian)
Galloway, Devin, Jones, David R. and Ingebritsen, S.E. (1999). Land Subsidence in the United States, U.S. Department
of the Interior, U.S. Geological Survey, Circular 1182, Reston, Virginia, USA
Giroud, J.P., Bonaparte, R., Beech, J.F. and Gross, B.A. (1990). Design of Soil Layer-Geosynthetic Systems Overlying
Voids, Geotextiles and Geomembranes, International Geosynthetics Society, 9(1): 11-50
Hardin, B.O. and Drnevich, V. P. (1972). Shear modulus and damping in soils: Design equations and curves, Journal of
Soil Mechanics and Foundation Engineering Division, ASCE, 98(7): 667-692
Kerr, A.D. (1964). Elastic and Viscoelastic Foundation Models, Journal of Applied Mechanics, ASME, 31(3): 491-498
Koerner, R.M. (2005). Designing with Geosynthetics, Fifth Edition, Pearson Prentice Hall, New Jersey, USA
Leng, J. (2002). Characteristics and Behavior of Geogrid-Reinforced Aggregate under Cyclic Load, North Carolina State
University, Raleigh, North Carolina, USA
Madhav, M.R. and Poorooshasb, H.B. (1988). A New Model for Geosynthetic Reinforced Soil, Computers and
Geotechnics, Elsevier Science Publishers Ltd, 6(4): 277-290
1017
Maheshwari, P. and Khatri, S. (2013). Response of Infinite Beams on Geosynthetic-Reinforced Granular Bed over Soft
Soil with Stone Columns under Moving Loads, International Journal of Geomechanics, ASCE, 13(6): 713-728
Neogi, D. (1991). Geosynthetics Used to Support Embankments over Voids, University of Alaska, Fairbanks, Alaska
Nikodým, M. and Frydrýšek, K. (2010). Finite Difference Method Applied for the Beams on Elastic Foundation –
Examples, International Scientific Conference MSFE 2010, Technical University of Ostrava, Ostrava, Czech Republic
Pasternak, P.L. (1954). On a New Method of Analysis of an Elastic Foundation by Means of Two Foundation Constants.
(in Russian) Gosudarstvennoe Izdatelstvo Literaturi po Stroitelstvu i Arkhitekture, Moscow.
Selvadurai, A.P.S. (1979). Elastic Analysis of Soil-Foundation Interaction, Developments in Geotechnical Engineering
Vol.17, Elsevier, New York, USA
Selvadurai, A.P.S. (2000). Partial Differential Equations in Mechanics 1, Springer Berlin Heidelberg, New York, USA
Shukla, S.K. and Chandra, S. (1994). A Generalized Mechanical Model for Geosynthetic-Reinforced Foundation Soil,
Geotextiles and Geomembranes, International Geosynthetic Society, 13(12): 813-825
Vallabhan, C.V. Girija and Das, Y.C. (1988). An Improved Model for Beams on Elastic Foundations, ASME Pressure
Vessel and Piping Conference, Pittsburgh, Pennsylvania, USA
Vallabhan, C.V.G. and Das, Y.C. (1991). Modified Vlasov Model for Beams on Elastic Foundations, Journal of
Geotechnical Engineering, ASCE, 117(6): 956-966
Villard P., Gourc J.P. and Giraud H. (2000). A Geosynthetic Reinforcement Solution to Prevent the Formation of
Localized Sinkholes, Canadian Geotechnical Journal, NRC Research Press, 37(5): 987-999
Vlasov, V.Z. and Leontiev, U.N. (1966). Beams, Plates and Shells on Elastic Foundation, Israel Program for Scientific
Translations, Jerusalem
Winkler, E. (1867). Die Lehhre von der Eiastizitat und Festigkeit. Dominicus, Prague
1018