finite element analysis of a nose gear during landing
TRANSCRIPT
UNF Digital Commons
UNF Theses and Dissertations Student Scholarship
2010
Finite Element Analysis of a Nose Gear DuringLandingThoai D. NguyenUniversity of North Florida
This Master's Thesis is brought to you for free and open access by theStudent Scholarship at UNF Digital Commons. It has been accepted forinclusion in UNF Theses and Dissertations by an authorized administratorof UNF Digital Commons. For more information, please [email protected].
Recommended CitationNguyen, Thoai D., "Finite Element Analysis of a Nose Gear During Landing" (2010). UNF Theses and Dissertations. Paper 215.http://digitalcommons.unf.edu/etd/215
FINITE ELEMENT ANALYSIS OF A NOSE GEAR DURING LANDING
by
Thoai D. Nguyen
A thesis submitted to the School of Engineering
in partial fulfillment of the requirements for the degree of
Master of Science in Mechanical Engineering
UNIVERSITY OF NORTH FLORIDA COLLEGE OF COMPUTING, ENGINEERING AND CONSTRUCTION
April 2010
The thesis "Finite element analysis of a nose gear during landing" submitted by Thoai Nguyen in partial fulfillment of the requirements for the degree of Master of Science in Mechanical Engineering has been
Approved by the thesis committee:
Dr. Alexandra Schonning Thesis Advisor
Committee member
Committee member
Acce ted for the School of Engineering:
Director of School of Engineeling
Dr. Pet r Braza Dean of College of Computing, Engineenng and Construction
D·.Le~ Dean of Graduate School
ii
(Date)
~/q/ro
Signature Deleted
Signature Deleted
Signature Deleted
Signature Deleted
Signature Deleted
Signature Deleted
iii
ACKNOWLEDGEMENTS
I would like to express my deepest appreciation to my advisor, Dr. Alexandra
Schonning. Thank you so much for your support and guidance during my graduate
studies at the University of North Florida.
I would like to thank my family for their encouragement and support. I also would
like to thank Team Jas Aviation for sharing some of the Twin Otter data and experiences.
This thesis would not have been possible without the help, support, and guidance from
Dr. Schonning, my family, Team Jas, and my co-advisers Dr. Nicholson and Dr. Eason.
iv
TABLE OF CONTENTS
LIST OF FIGURES ............................................................................................................ v
LIST OF TABLES............................................................................................................. vi
ABSTRACT...................................................................................................................... vii
SYMBOLS AND ABBREVIATIONS............................................................................ viii
Chapter 1: INTRODUCTION............................................................................................. 1
Chapter 2: LITERATURE REVIEW................................................................................. 4
2.1 BACKGROUND.......................................................................................................... 4 2.2 EYE-BAR THEORY.................................................................................................... 5 2.3 TIRE/WHEEL INTERFACE........................................................................................... 6 2.4 SHOCK ABSORBER.................................................................................................... 8 2.5 MATERIALS............................................................................................................ 10 2.6 FINITE ELEMENT METHOD (FEM) ......................................................................... 11
Chapter 3: MODELING AND LOADING ANALYSIS................................................. 13
3.0 MODELING OVERVIEW ........................................................................................... 13 3.1 COMPUTER AIDED DESIGN .................................................................................... 13 3.2 FORCE DETERMINATION ........................................................................................ 14
3.2.1 Ground forces................................................................................................... 14 3.2 SHOCK ABSORBER FORCES .................................................................................... 18
Chapter 4: FINITE ELEMENT ANALYSIS................................................................... 22
4.0 BOUNDARY CONDITIONS........................................................................................ 22 4.1 CONTACTS ............................................................................................................. 24 4.2 LOADING................................................................................................................ 25 4.3 MESHING ............................................................................................................... 28 4.4 MATERIAL SELECTION ........................................................................................... 32
Chapter 5: RESULTS ....................................................................................................... 34
Chapter 6: DISCUSSION AND CONCLUSIONS .......................................................... 40
REFERENCES................................................................................................................ 41
APPENDIX A................................................................................................................... 44
BASIC LANDING CONDITIONS ........................................................................................ 44
v
LIST OF FIGURES
FIGURE 1: TWIN OTTER AIRCRAFT SHOWING THE LOCATIONS OF LANDING GEARS.............. 3 FIGURE 2: BREAKDOWN OF THE NOSE GEAR......................................................................... 3 FIGURE 3: EYE-BAR LOADING ............................................................................................. 5 FIGURE 4: NOSE GEAR PARTS FOR FEM ............................................................................. 13 FIGURE 5: LANDING CONFIGURATION ................................................................................ 15 FIGURE 6: DIMENSIONAL SCHEMATIC................................................................................ 15 FIGURE 7: CROSS SECTION OF TIRE/WHEEL ........................................................................ 17 FIGURE 8: CONTACT PATCH REGION .................................................................................. 17 FIGURE 9: SHOCK ABSORBER CROSS SECTION .................................................................... 19 FIGURE 10: FRICTIONAL FORCE FROM SEALS ..................................................................... 21 FIGURE 11: FIXED BOUNDARY CONDITION AT HIGHLIGHTED SURFACES............................. 22 FIGURE 12: BOUNDARY CONDITION .................................................................................. 23 FIGURE 13: CONTACTS OPTIONS ........................................................................................ 24 FIGURE 14: INFLATION PRESSURE DISTRIBUTION AROUND THE WHEEL .............................. 26 FIGURE 15: BEAD SEAT PRESSURE CAUSED BY VERTICAL FORCE ....................................... 26 FIGURE 16: DRAG FORCE AT THE POINT OF CONTACT WITH GROUND ................................. 27 FIGURE 17: SHOCK ABSORBER FORCE AT PISTON ............................................................... 28 FIGURE 18: DIFFERENT TYPES OF BRICK ELEMENT............................................................. 30 FIGURE 19: NOSE GEAR MESH ............................................................................................ 31 FIGURE 20: SURFACE MATCHING ....................................................................................... 31 FIGURE 21: SURFACE NOT MATCHING ................................................................................ 32 FIGURE 22: WHEEL ASSEMBLY - STRESS CONCENTRATION ................................................ 34 FIGURE 23: STRESS AND DISPLACEMENT ........................................................................... 35 FIGURE 24: STRESS AND DISPLACEMENT OF THE CYLINDER .............................................. 36 FIGURE 25: STRESS AND DISPLACEMENT OF THE FORK ...................................................... 37 FIGURE 26: STRESS AND DISPLACEMENT OF THE WHEEL ASSEMBLY .................................. 38 FIGURE 27: STRESS RESULTS OF THE PISTON TUBE, LOCKNUT AND AXLE ........................... 38
vi
LIST OF TABLES
TABLE 1: BOUNDARY CONDITIONS.................................................................................... 23 TABLE 2: USES OF EACH CONTACT IN LINEAR STATIC STRESS ............................................ 24 TABLE 3: CONTACT SURFACES........................................................................................... 25 TABLE 4: ELEMENT DESCRIPTIONS .................................................................................... 29 TABLE 5: ELEMENT TYPES AND QUANTITIES ...................................................................... 30 TABLE 6: MATERIAL IDENTIFICATION................................................................................ 33 TABLE 7: MATERIAL PROPERTIES ...................................................................................... 33 TABLE 8: STRESS AND DISPLACEMENT RESULTS................................................................ 35 TABLE 9: FACTORS OF SAFETY .......................................................................................... 37
vii
ABSTRACT
Nose gear failure is a high concern in the aviation industries. According to the
Federal Aviation Administration reports, 55% of aircraft failures occur during takeoff and
landing while 45% of failures occur during flight. The objective of this thesis is to
determine the stress behavior and the displacement of a nose gear of an aircraft during
landing using structural finite element analysis. The nose gear was first modeled using
computer-aided design software and then imported into finite element software. The
external forces were determined analytically and the interactions between components
were carefully modeled using contact analysis. The tire was modeled using the eye-bar
theory. The results obtained in this work are consistent with the Federal Aviation
Administration’s recommendations for physical testing.

viii
SYMBOLS AND ABBREVIATIONS
oA : Orifice area
pA : Piston area
a : Tire radius of the wheel
b : Bead seat of the wheel
b’ : Distance from the center of gravity of the airplane to the main wheel
d’ : Distance from the nose wheel to the main wheel
cg : Center of Gravity
dC : Discharge coefficient
od : Orifice diameter
pd : Piston diameter
E : Young modulus
aF : Pneumatic force
fF : Friction force
hF : Hydraulic force
L : Wing lift to weight ratio M : Bending moment
1N : Normal force at location 1
2N : Normal force at location 2
n : Limit inertia load factor g : Gas constant
op : Inflation pressure
ap : Air pressure
Vf : Reaction force at the nose wheel W : Gross weight of the aircraft
sy : Piston stroke height
sy : Piston stroke velocity
o : Oil density
a : Air density
u : Ultimate tensile strength
v : Von mises stress
y : Yield stress
FAA : Federal Aviation Administration
1
Chapter 1: INTRODUCTION
Prior to 1942, the National Advisory Committee for Aeronautics (NACA) spent
several years studying the characteristics of the landing gears during landing. Many
aircrafts ranging from 1000 lbs. to 50,000 lbs. were used in the study. Until September
1942, the NACA technical note 863 came out to report the results and formulas for all
external forces on the nose, main and rear landing gear [1]. Until August 1, 1950,
Aeronautical Standard AS227C was used as the guidance to test all the wheels and brakes
before installation onto the aircrafts.
Approximately a decade after the introduction of AS277C, Technical Standard
Order (TSO) C26a was implemented on June 1, 1961. Today TSO C26 is at revision D.
There are two required TSO’s in the nose landing gear: TSO C26 for the wheel and
brakes and TSO C62 for the tire. Any other components in the nose gear besides the
wheel, brakes and tire do not require any physical testing specifications. Many
manufacturers do not use FEM to test the nose landing gear because the FAA does not
require FEM as part of the approval process. This thesis will help landing gear
manufacturers answer many questions related to the nose gear during landing, and these
answers can be used in the early stage of future the designs.
For example, this analysis will help manufacturers determine what part in the
nose gear will yield the highest stresses and at what location. It will help determine how
to design, analyze and optimize the nose gear properly so physical testing can be used for
verification instead of trial and error. The cost for physical testing of the wheel assembly
is as approximately $85,000 and can take up to 6 months; therefore, optimizing the
design to its best performance before physical testing is very important. The main focus
2
of the analysis in this thesis is the moment during landing; however, the model is set to be
used for other load case scenarios.
Since the birth of Aviation, aircraft landing gears have been essential components
of every aircraft. They are used during takeoff, landing and ground operation to support
the aircraft. One hundred and ten records have been found related to landing gears in the
Service Difficulty Report in the United States in 2009 [2]. All reports have been recorded
due to some level of difficulties to the landing gears. The difficulties vary from a nose
gear to a main gear to a tail gear.
Aircrafts have several landing gear configurations, such as tricycle gear with nose
wheel and two main wheels, or conventional gear with one tail and two main wheels.
Different configurations will result in the different load paths and stress behaviors. This
thesis focuses on the nose gear of the Twin Otter. Twin Otter aircraft was originally
manufactured by DeHavilland Canada and today is owned by Viking Air.
Although the finite element analysis (FEA) theory was first introduced in 1943 by
Richard Courant, the study of the nose gear using FEA is not heavily studied and
published. Most of the studies have been performed by physical testing by landing gear
manufacturers. In order to perform FEA, many steps have to be completed in order to
obtain accurate results, including the application of the parts, and the appropriate
assumptions. All components making up the nose gear must be modeled in three-
dimensional (3-D) computer-aided design (CAD) software. In this study, the SolidWorks
CAD software was used. Once 3-D modeling is accomplished, calculations are performed
to obtain the load on the nose gear during landing. Then kinematic analysis is performed
and modeling decisions are then made on how to transfer the loads into the finite element
3
model (FEM). The FEM is then used in predicting the stress behavior during landing. The
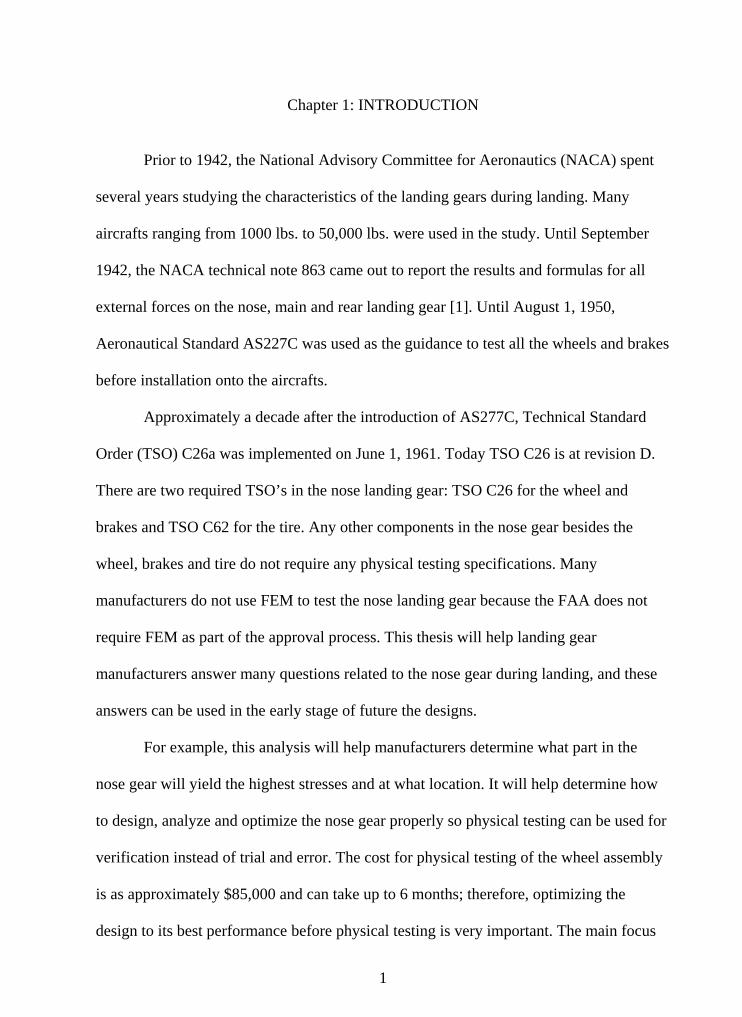
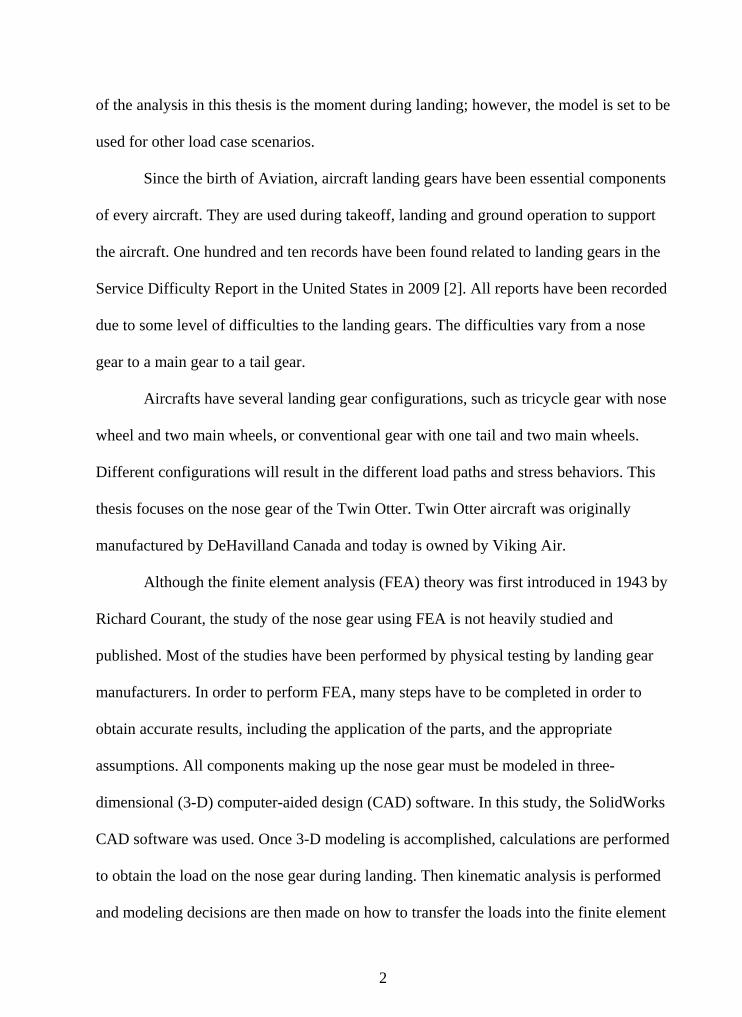
FEA software used in this analysis is Algor by Autodesk. Figure 1 shows the Twin Otter
aircraft with the nose gear and main gear configuration. Figure 2 shows the breakdown of
all the components within the nose gear.
Figure 1: Twin Otter Aircraft showing the locations of landing gears
Figure 2: Breakdown of the nose gear
4
Chapter 2: LITERATURE REVIEW
2.1 Background
The development of finite element analysis was traced back to the 1940s when
Courant used the Ritz method of numerical analysis and minimization of variational
calculus to approximate vibration systems [3].
Finite element analysis is a tried and trusted method in studying stresses,
displacements, fluid flow, vibration and more. It is used early in the design stage to
predict the life cycle of a product. Linear static stress analysis is defined as {f} =
[K]*{x}. Where {f} is the applied load vector, {x} is the displacement vector, and [K] is
the assemblage of all individual element stiffnesses [4]. Since the individual element
stiffness is defined by the user based on the material property, and the applied load is
defined based on the application, the only unknown left to calculate is the displacement
vector {x}. Once the displacements and strains are determined, stresses can be obtained
using Constitutive equations. Finite element analysis generally breaks down into three
processes: the pre-processor, processor, and post-processor. During pre-processing, a
CAD model is typically discretized into a mesh, loads and boundary conditions are
applied, and material properties are assigned. The next process is to perform the analysis,
and finally the post-processor allows the analyst to review, analyze, and record the
results.
In this thesis, the nose landing of the Twin Otter aircraft is selected for study.
Twin Otter was manufactured by De Havilland Canada. Over 800 aircrafts were built
between 1965 and 1988. It was designed with the short takeoff and landing (STOL)
5
capability. The landing gear configuration is fix tricycle with a main gear and a nose
gear. (Refer to Figure 1 for more details). In commercial aviation, aircrafts often are
divided into several classifications. For instance, Part 23 Aircraft has the maximum gross
landing weight of no more than 12,500 lbs. Part 25 Aircraft has the maximum landing
weight beyond 12,500 lbs. Part 27 is for rotorcraft, which has a maximum landing weight
of no more than 7000 lbs. Other classifications exist. The Twin Otter aircraft is classified
under Part 23 Aircraft because its maximum landing weight is 12,300 lbs.
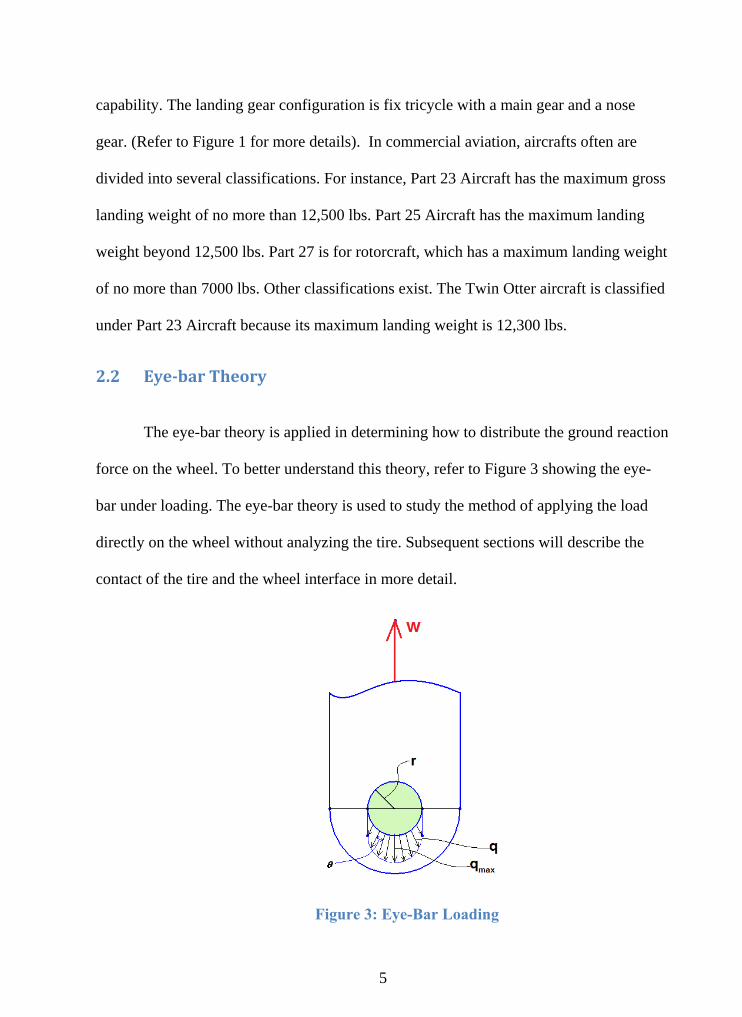
2.2 Eyebar Theory
The eye-bar theory is applied in determining how to distribute the ground reaction
force on the wheel. To better understand this theory, refer to Figure 3 showing the eye-
bar under loading. The eye-bar theory is used to study the method of applying the load
directly on the wheel without analyzing the tire. Subsequent sections will describe the
contact of the tire and the wheel interface in more detail.
Figure 3: Eye-Bar Loading
6
From Figure 3, the maximum unit load qmax on the eye-bar can be calculated from
equation 2.2.1:
2
0
)cos(2
dqrW (2.2.1)
Where W is the applied load, r is the radius of the pin. After the integration, the result of
equation 2.2.1 is 2max rqW
.
A similar method can be applied for the tire and wheel interface, where the
pressure on the bead seat is calculated based on the ground reaction force on the tire. This
eye-bar theory has been applied to tire/wheel interfaces before. For example, Stearns
derived the applied pressure (W) at the bead seat region to be as follow:
o
o
drWbW br
(2.2.2)
Where
oor WW
2cos ; giving
obo rbWW
4
or ob
o rbWW
4,where Wo
is the maximum pressure, Wr is the distributive pressure, rb is the radius of the wheel, b is
the width of the bead seat, and θo is the contact patch angle.
2.3 Tire/wheel interface
In an effort to not model the tire, the wheel/tire interface has been carefully
studied and appropriate loads have been applied to the wheel directly. Similar
simplifications of tire/wheels have been used in analysis by other researchers. Many have
performed tire/wheel interface analysis to automotive wheels, where the authors study the

7
stress and displacement of the automotive wheel without modeling and performing the
non-linear material analysis of a tire [5], [6].
Stearns used the eye-bar analogy similar to Blake [9] to determine pressure
distribution at the contact areas of the tire bead seat and the wheel. Stearns used Algor
finite element analysis software to study the stresses and displacements. The analytical
results showed a good correlation with the physical testing results. Although Stearns’
work focuses on the automotive wheel, the concept is still the same for aircraft wheel.
The study of the tire-wheel interface is a continued effort for many tire/wheel
manufacturers and researchers in order to meet the goal of continued improvement and
quality products.
Kandarpa, Spencer Jr., Schudt, and Kirkner developed a numerical tool to
determine the pressure distribution at the tire-wheel interface of an aircraft wheel [7], [8],
while Tielking used FEM to determine the tire/pavement pressure distribution [10],[11].
Several strain gauges were used to obtain the strain measurements along the bead seat
region. Fourier series and a least square fit to back calculate the pressure exerted by the
tire onto the wheel at the tire/wheel interface was used. The computer code ANTWIL
was developed to compare the results with the Fourier method.
Another method of calculating the pressure distribution at the tire/wheel interface
was studied by Sherwood [12]. Sherwood used piezoelectric film to measure the pressure
at the interface. Piezoelectric film was installed along the tire/wheel contact surface.
When the pressure was applied, the film started to deform. As the pressure changed, the
voltage started to change. The changes in the voltages were calibrated to correlate to the
strain. To study the displacement of the tire/wheel interface, Sherwood used holographic
8
interferometry to take the measurement. This same method was also studied by former
researchers. In addition to the experimental results, Sherwood performed a three-
dimensional finite element analysis using Adina. Three different methods were analyzed
and discussed. FEA at the tire/wheel interface was widely used.
The earlier works from Jeusette and Theves (1992) and Tseng, Pelle, and Chang
(1989) used FEA element analysis to study different loading scenarios such as braking,
cornering, and the combination of braking and cornering [13], [14]. Tseng, Pelle, and
Chang modeled the tire using the nonlinear incompressible elements with the cord-rubber
composite element. The finite element analysis approach was divided into three
categories as followed: modeling of rubber compounds, modeling of cord-rubber
composites and modeling for the gap.
Rubber compound was assumed to have the nonlinear elastic material property
without considering viscoelastic characteristics. Young’s modulus was determined from
the experimental data using )(6 0110 CCE where Cij are material constants. The cord-
rubber composite was modeled using orthotropic material. Finally, the gap was modeled
to study the tire and wheel at no inflation pressure [15]. In addition to the literature
review of the tire/wheel interface described previously, FEM of the tire and wheel
analysis were heavily reviewed [16],[18],[30][31].
2.4 Shock absorber
The shock absorber analyzed in this thesis is the most current and modern type of
shock absorber available. It provides the highest efficiency in absorbing energy during
landing compared to other types of conventional shock absorbers. This type of absorber is
9
called “oleo-pneumatic.” It works inside an enclosed system where oil and air are being
used.
Wang, Xing, Price, and Li (2008) developed the mathematical model to control the
vibration caused by landing impacts and runway excitation where the authors described
the three forces from the shock absorber similar to those studied in this thesis [35]. A
similar method of deriving the shock absorber forces was performed by Dong-Su, Hong-
bin, and Hui (2007) [24]. Dong-Su, Hong-bin, and Hui (2007) derived the frictional force
as the function of internal pneumatic force and the coefficient of kinetic friction.
Due to the non-linear behavior of the oleo-pneumatic shock absorber, there are many
different factors to take into consideration during the design stage to achieve the highest
efficiency. Those factors include the total stroke, compression ratio, air and fluid volume
[19]. In 1965, the military specification (MIL-L-8552) for the air-oil shock absorber was
implemented to require certain materials, protective treatment, process, and efficiency to
be used on the oleo-pneumatic shock absorbers.
Many academic institutions, government agencies, and aircraft manufacturers have
studied and continued to improve the efficiency of the shock absorber over many years.
In addition to the analytical approach of analyzing the shock absorber, Walls performed
the experimental study of the internal strut pressure and loads on the small shock
absorber [34]. His experiment only focused on a specific range of shock strut velocity
and strokes. Walls concluded that the orifice coefficient increased slightly with increasing
the velocity for the Reynolds number ranging from 9,500 to 66,500. The change of
orifice coefficient due to the chamfer length was very small. Forces from the internal
10
pressure correlated well with the computation forces from accelerometer and
dynamometer measurement.
Another similar work was done by Milwitzky and Cook to study the behavior of
the landing gear [20]. The author described the three shock absorber forces more in
depth, and similar forces are studied in this thesis. The drop test was performed to
compare the analytical to the experimental results. Milwitzky and Cook concluded that
both results were to be in good agreement. The method of obtaining the frictional,
hydraulic and pneumatic forces from the shock absorber was a proven method to use;
therefore, this thesis will use this method to extend the study of those forces.
2.5 Materials Aluminum and alloy steel are the most common materials used in the nose gear
assembly. Aluminum provides a high corrosion resistance property while maintaining the
structural integrity to support the aircraft. Some of the parts in the nose gear assembly are
forged before the final products are machined.
For this particular aircraft, the fork and the main cylinder are forged while the
nose wheel is cast. The benefit of casting is the ability to achieve the complexity in the
shape of the part; however during the solidification of the material, porosity, cracks and
segregations might develop; therefore the mechanical properties sometimes are not as
good as forging.
Due to the limited availability of 2014 aluminum vs. 7075 aluminum, many of the
nose gear parts are made using 7075 aluminum as the alternative to 2014. When
compared to 2014, 7075 has better mechanical properties and stress corrosion resistance
while both materials have approximately the same weight.

11
Appropriate materials selection during the design stage of the landing gear is very
important. A material guideline was created by Curry to assist the designers and
engineers when selecting the materials [23]. His guidelines include the inspection
method, strength requirement, material samples, hardness, and surface finishes.
2.6 Finite Element Method (FEM) In 1943, the mathematician Richard Courant published the paper, “Variational
methods for the solution of problems of equilibrium and vibrations,” describing the
equation for solving torsion problems using the finite element method. His paper was the
introduction of the finite element method. Until late 1950s and early 1960s, computer
codes were used in the aircraft industry to perform structural analysis, which was similar
to what is now called FEA.
In 1965, the Wright-Patterson Air Force Base in Dayton, Ohio, held the first conference
with the FEA topic called “Matrix Methods in Structural Mechanics”. Over many
decades of implementing for better software, FEA courses are today widely used and
taught. The book “What every engineer should know about finite element analysis,” by
John Brauer describes the history, development and basic concepts of the FEA. The
author describes who, when, what and why FEA was developed, then introduces
structural, thermal, electromagnetic and fluid analysis. It is one of the starting points for
basic understanding of FEA.
In addition to Brauer’s book, there is much more literature discussing the subject of FEA.
The work in this thesis requires the understanding of the aircraft, the simplification of the
tire, the modeling method and the shock absorber behavior.
12
As previously mentioned, Stearns used Algor to study the stress and displacement
distribution in the automotive rim [5]. Stearns performed the analysis using axisymmetric
element, one-quarter of the wheel, half of the wheel and the full wheel. Hexahedral, brick
and wedge elements were chosen. The analysis indicated the half and full model
produced exact results.
In addition to Algor, another software, ANTWIL (Analysis of Tire-Wheel Interface
Loads), was used for the aircraft wheel analysis. ANTWIL was developed more
specifically to the tire/wheel interface application. Other FEA software programs that are
similar to Algor include Adina, Abaqus and Nastran.
Although tire analysis is not necessary when studying the stress or displacement
of the wheel and other parts of the nose gear, it is worth mentioning that it can be done.
Dilley and Wallerstein used MSC/Nastran to predict the tire behavior using a radial tire
with three-dimensional shell FEM constructed from two dimensional plate elements [17].
Dilley and Wallerstein used anisotropic plate elements for the plies, BAR elements for
the bead, GAP elements for the tread and tread/ground contact and torsion spring for the
stiffness of the rubber in the bead region. In 1984, NASA conducted a tire-modeling
workshop to explore the area of tire analysis. Many reports related to the tire modeling
were presented during the workshop included finite element modeling and analysis of
tires by Noor and Andersen [21]. The authors specified different modeling methods such
as membrane, laminated, and two-dimensional axisymmetric. A tire contact solution
technique by Tielking described a method based on the orthotropic, nonlinear shell
elements.
13
Chapter 3: MODELING AND LOADING ANALYSIS
3.0 Modeling overview
Modeling consists of the following steps: CAD modeling, determination of forces,
determination of interactions between components, and FEA. This chapter discuses the
CAD modeling but focuses on determination of stresses and interactions. Chapter 4
provides a detailed overview of the FEA, and the results and discussion are presented in
subsequent chapters.
3.1 Computer Aided Design
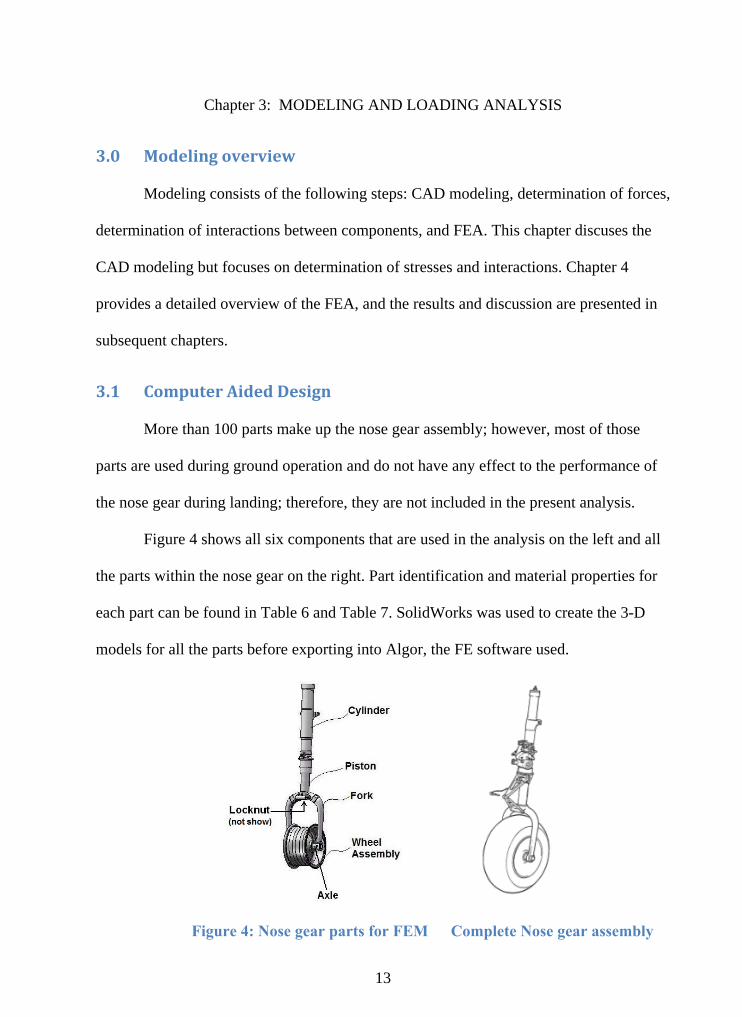
More than 100 parts make up the nose gear assembly; however, most of those
parts are used during ground operation and do not have any effect to the performance of
the nose gear during landing; therefore, they are not included in the present analysis.
Figure 4 shows all six components that are used in the analysis on the left and all
the parts within the nose gear on the right. Part identification and material properties for
each part can be found in Table 6 and Table 7. SolidWorks was used to create the 3-D
models for all the parts before exporting into Algor, the FE software used.
Figure 4: Nose gear parts for FEM Complete Nose gear assembly
14
A CAD model of the tire was not generated, as there are other ways to model the
behavior of the tire on the wheel that do not require non-linear analysis. In this work, the
eye-bar theory was applied, as it has been a proven method by the Blake [9] and Stearns
[5] where Stearns used it in his automotive analysis. To best approximate the tires
behavior on the wheel, the bead seat (the contact surface between the tire and wheel as
shown in Figure 7) dimensions of the tire were measured and incorporated into the
tire/wheel interface. The inflation pressure from the tire was applied to the wheel all
around the wheel as discussed in more detail in section 3.2.1 Ground forces.
3.2 Force Determination In order to properly analyze the aircraft, a variety of forces needed to be determined.
These include the ground forces acting on the tire and how these forces are transferred
into the wheel; the forces exerted by the shock absorber, and the inflation pressure
applied around the wheel.
3.2.1 Ground forces
The ground reaction force is determined when the aircraft initially makes contact
with the runway. The landing configuration is illustrated in Figure 5 where the contact
between the nose gear and ground is impending. The linear dimensions a, b, and d were
found from the Twin Otter data book and therefore, a', b', and d' (at an incline) could be
determined. The center of gravity of the aircraft is shown in Figure 5 at inclined angle to
indicate the motion at 1g down and .33g forward [29].
15
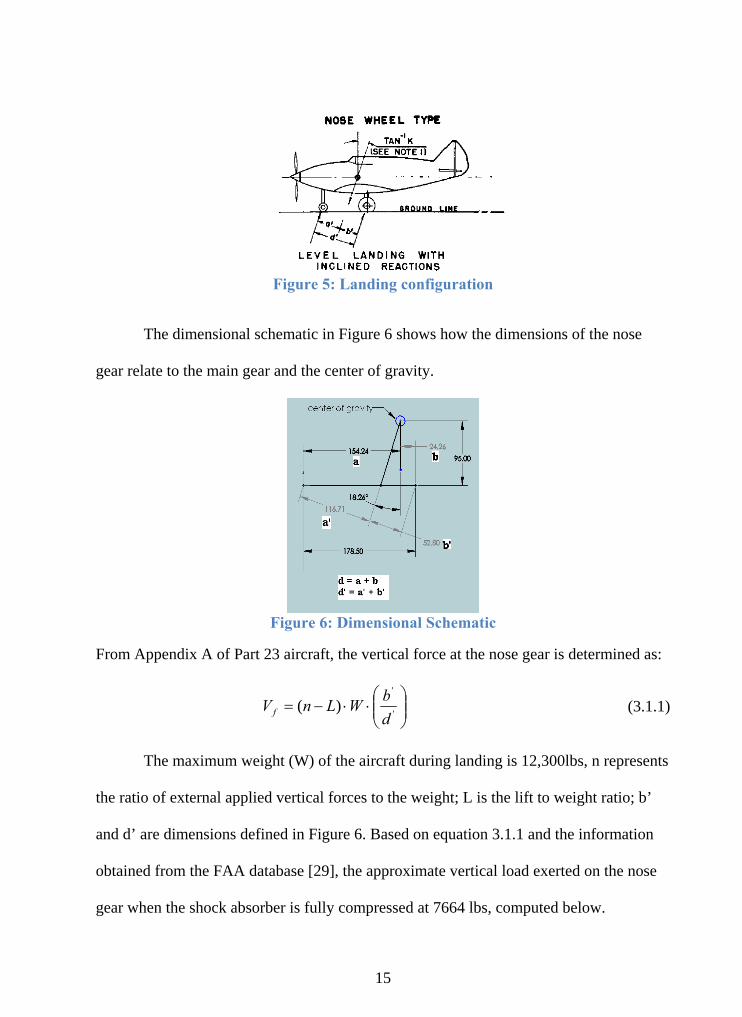
Figure 5: Landing configuration
The dimensional schematic in Figure 6 shows how the dimensions of the nose
gear relate to the main gear and the center of gravity.
Figure 6: Dimensional Schematic
From Appendix A of Part 23 aircraft, the vertical force at the nose gear is determined as:
'
'
)(dbWLnV f (3.1.1)
The maximum weight (W) of the aircraft during landing is 12,300lbs, n represents
the ratio of external applied vertical forces to the weight; L is the lift to weight ratio; b’
and d’ are dimensions defined in Figure 6. Based on equation 3.1.1 and the information
obtained from the FAA database [29], the approximate vertical load exerted on the nose
gear when the shock absorber is fully compressed at 7664 lbs, computed below.

16
lbV f
7664
51.169
81.5212300)67.67.2( (3.1.2)
The vertical force (Vf) is then converted into pressure using the eye-bar theory to
apply at the bead seat location, previously studied by Blake, Sherwood, Tseng and
Stearns, and is shown in equation 3.1.3.
4b
fo rb
VW (3.1.3)
Where b is the bead seat width, Rb is the radius of the wheel, and α is the patch
angle. Another force exerted onto the nose gear of the aircraft is the drag force at the
instant following touchdown. At this instant, the wheel does not yet spin. The drag force
was determined based on the inertia load factor (n), force at the nose gear, coefficient of
friction of the tire and other variations. Drag force is defined in equation 3.1.4.
dbWnkDf (3.1.4)
Where Df is the drag force, k is the linear variation constant, b’ and d’ is the
distant between the center of gravity to the nose gear and main gear, and W is the
maximum weight during landing. Based on the information was obtained from the FAA
database and the aircraft manufacturer for the values of k, n, W, b’, and d’, Df is
calculated to be 3376 lbs.
When the wheel assembly starts to rotate, the drag force is calculated based on the
kinetic coefficient of friction µk and the vertical force Vf. This new drag force is a lot
smaller than the drag force during the spin up and spring back. Figure 7 shows a cross-
section of the tire/wheel interface.
17
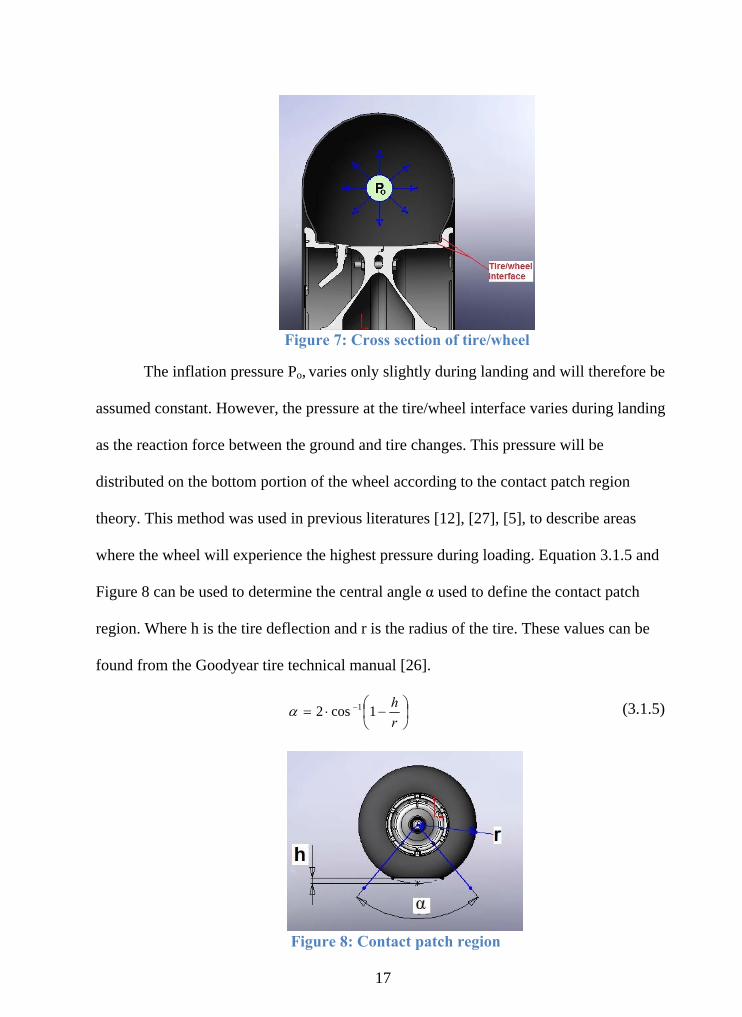
Figure 7: Cross section of tire/wheel
The inflation pressure Po, varies only slightly during landing and will therefore be
assumed constant. However, the pressure at the tire/wheel interface varies during landing
as the reaction force between the ground and tire changes. This pressure will be
distributed on the bottom portion of the wheel according to the contact patch region
theory. This method was used in previous literatures [12], [27], [5], to describe areas
where the wheel will experience the highest pressure during loading. Equation 3.1.5 and
Figure 8 can be used to determine the central angle α used to define the contact patch
region. Where h is the tire deflection and r is the radius of the tire. These values can be
found from the Goodyear tire technical manual [26].
rh
1cos2 1 (3.1.5)
Figure 8: Contact patch region
18
Once the angle, α, is determine, the load can be applied on the bead seat region along
with the inflation pressure around the wheel.
3.2 Shock Absorber forces
An oleo-pneumatic shock absorber is used in the Twin Otter aircraft. This shock
absorber consists of pneumatic air is compressed inside the upper portion of the main
cylinder. Oleo-pneumatic shock absorbers are used in most modern aircrafts because they
provide the highest efficiency of all available shock absorbers. There are two chambers
inside the main cylinder of the nose gear. The lower chamber contains MIL-H-5606
hydraulic oil [29], while the upper chamber is filled with compressed air or nitrogen.
During the time of the impact, the piston tube is compressed and forces the oil to flow
from the lower chamber into the upper chamber (refer to Figure 9). During the
compressed stage, hydraulic, pneumatic and friction forces exist. The hydraulics
dissipates the energy during landing while the pneumatics provides cushioning during
ground operation [33].
A shock absorber is used in the nose gear to absorb and dissipate energy during
landing and taxiing. The oleo-pneumatic shock absorber force is a combination of
pneumatic force, hydraulic force, and frictional force. When the nose gear is in the air,
the shock absorber is fully extended. At the moment when the tire is in contact with the
runway, the shock absorber forces start to increase until 100% compression is reached.
When the nose gear is fully extended, the only force inside the cylinder is the pneumatic
force caused by the initial pressure.
At the fully compressed position, there is an equal and opposite force with the
vertical force to prevent the piston from continuing to compress. Figure 9 shows a cross
19
section of the shock absorber located inside the main cylinder. The right side of the
cylinder sees compressed internal pressure at approximately 95 psi. The left side of the
cylinder sees the hydraulic fluid. During landing, the piston extends, causing the fluid to
flow to the right (up in the application) through an orifice. When the piston extends, the
volume inside the cylinder reduces. As a result of decreasing the volume, the internal
pressure increases to create pneumatic, hydraulic and frictional forces between the seal
and its contact surface.
Figure 9: Shock absorber cross section
Pneumatic force
The pneumatic force is the force created when air is compressed under a closed
volume. It is determined by the initial air pressure (Pa), the area subjected to the air
pressure, and the compression ratio according to the polytrophic law for compression of
gases PVg = Constant or as shown in equation 3.2.1.
g
o
a
o
VV
PP
(3.2.1)
Where g is the gas constant and approximately 1.1 [35]. In general, force is
defined as the product of pressure and the area on which it acts. Where aF is the
20
pneumatic force acting on the piston, A is the cross-sectional area of the piston and
remains constant. The new volume V is the difference between the initial volume and the
product of the pneumatic area and the stroke. The equation above can be written as:
AVV
PAPFg
ooaa
(3.2.2)
Equation 3.2.2 was also derived by [24], [20], [35]. In FEM, either pneumatic pressure or
pneumatic force can be applied to the model. In this thesis, pressure is applied to the
model. The air pressure from the shock absorber was calculated at 5.5-inch extension and
compared with the required value from the Twin Otter maintenance training manual. The
result of the calculated value is 144 psi, which fell within the required value from 143 to
147psi. .
Hydraulic force As the piston tube compresses, the fluid flows through the orifice under
compressed air at an initial pressure of 95 psi. As the fluid is forced to flow through the
orifice, it creates a hydraulic force. This force is calculated as a function of fluid density
( o ), fluid velocity ( sy ), area of the orifice (Ao), cylinder bore hole (Ah), and coefficient
of discharge ( dC ) according to equation 3.2.3.
2
2
3
2s
od
hoh y
ACAF
(3.2.3)
The surface areas of the orifice and the cylinder bore hole were determined from
the CAD models. Fluid density was found using the MIL-H-5606 aircraft fluid
specification. The hydraulic force was calculated from values of full extension to full
compression. It was determined that the hydraulic force was small compared to the
pneumatic force and was therefore not included in the FEA.
21
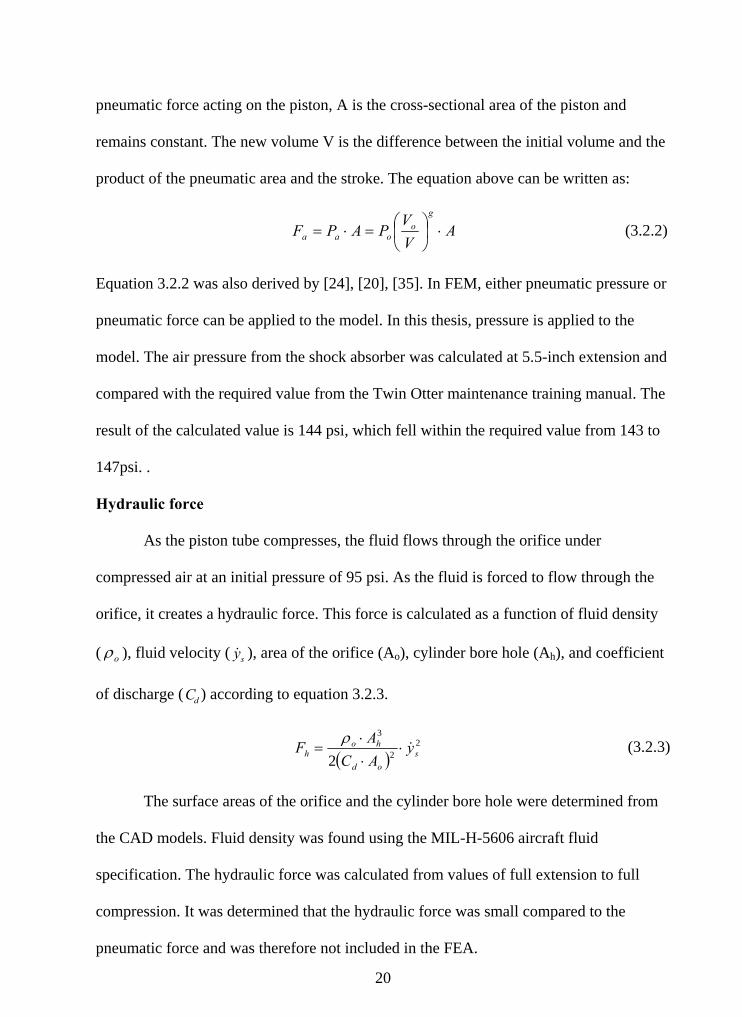
Frictional force The piston tube is supported by the seals located inside of the cylinder. During
landing operation, the piston tube compresses from fully extended to fully compressed.
The frictional force is caused by the contact between the seals and the piston tube. There
are two frictional forces acting on the piston tube. As seen in Figure 10, one occurs at the
mating contact between the seal and the upper piston tube (upper normal force1N ) and the
other between the cylinder bearing and the lower piston tube (lower normal force2N ). The
coefficient of frictions, 1 and
2 , are depended on the contact surface between the seal
and piston tube and between the cylinder and the piston tube. Since both seals have the
same material properties and in contact with the same surfaces, the coefficient of frictions
and the normal forces can be assumed to be the same.
The frictional force is calculated as the product of coefficient of friction and the
normal force. Here, the total frictional force is the sum of the frictional forces caused by
each of the two normal forces shown in equation 3.2.4. This equation was also derived by
[23], [24], [35].
2211 NNFf (3.2.4)
Figure 10: Frictional force from seals
22
Chapter 4: FINITE ELEMENT ANALYSIS
Having determined the forces acting on the nose landing gear and having created CAD
models of the critical components, a finite element (FE) model was developed and
analyzed. In developing the FE model, boundary conditions, contact conditions, loads,
materials properties, and the mesh were defined.
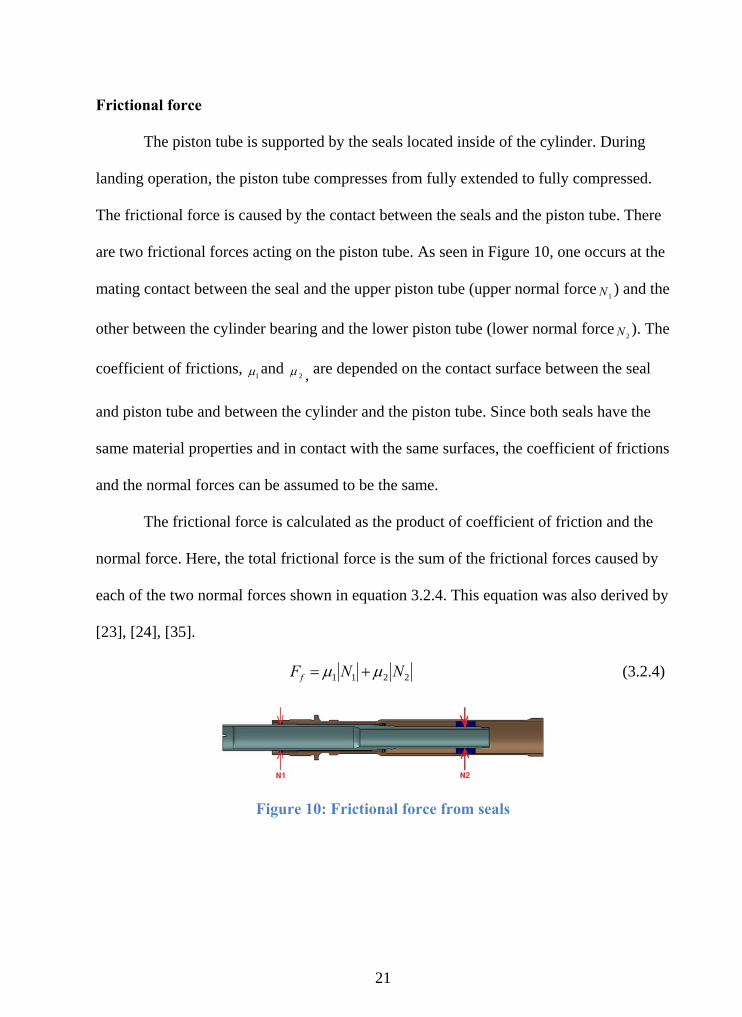
4.0 Boundary conditions Boundary conditions are applied to model what is not included in the analysis. As such,
boundary conditions were applied where the nose gear is connected to the bulkhead of the
aircraft. This connection consists of two bolts and a protrusion between the mounting
holes, as seen in Figure 11. The protrusion is used as the anti-rotation feature. This
connection is modeled by applying boundary conditions on the circular surfaces of the
bolt holes and the protrusion. All degrees of freedom were removed at these boundary
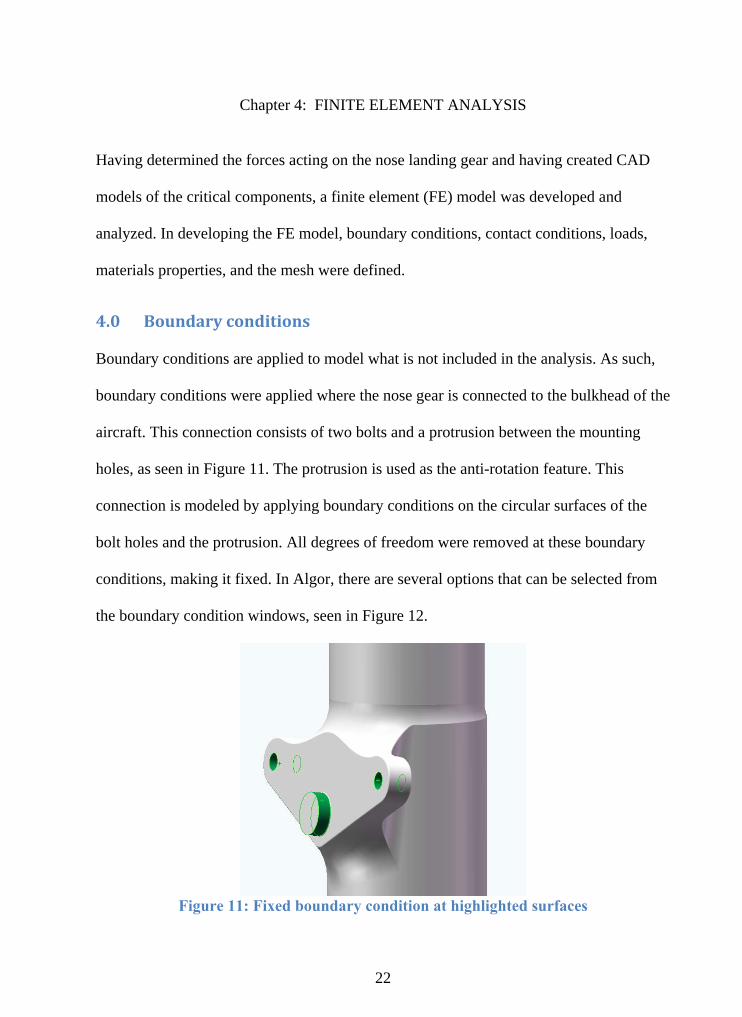
conditions, making it fixed. In Algor, there are several options that can be selected from
the boundary condition windows, seen in Figure 12.
Figure 11: Fixed boundary condition at highlighted surfaces
23
Figure 12: Boundary Condition
This figure shows different options that can be selected base on the application of the
parts. The first three constraints on the left side, Tx, Ty, and Tz, indicate translational
constraints, whereas Rx, Ry, and Rz indicate the rotational constraints. Table 1 shows
other possible boundary conditions, and the degrees of freedom that they remove are
indicated with an “x” in the appropriate cell.
Tx Ty Tz Rx Ry Rz
Fixed x x x x x x
Pinned x x x
No Rotation x x x
X symmetry x x x
Y symmetry x x x
Z symmetry x x x
X antisymmetric x x x
Y antisymmetric x x x
Z antisymmetric x x x
Table 1: Boundary Conditions

24
4.1 Contacts
One way to transfer forces or pressures from one part to another in the FE
model is to model the contact surface between the parts. In this analysis, contacts were
modeled at various locations. The coefficients of frictions were obtained from the bearing
and seal manufacturers. Different types of contacts can be modeled as shown in Table 2.
Type of Contact When to use
Bonded/Welded 1. Two surfaces will be in perfect contact 2. Loads are transmitted from one part to another 3. One node on a surface deflects, the node on adjoining surface will deflect
Free/No contact 1. Nodes on two surfaces will not be collapsed to one node 2. Nodes will not transmit loads between parts 3. Nodes will be free to move relative to nodes on other surfaces
Surface contact
1. Nodes will be free to move away from each other but cannot pass through each other when they contact 2. Friction can be added 3. Commonly use for rotation or allowing relative motion between objects
Edge contact 1. Nodes from one edge will move relative to nodes from the other edge 2. Similar to surface contact but applied to edges
Table 2: Uses of each contact in linear static stress
Figure 13 shows how contact is chosen in the software.
Figure 13: Contacts options
25
For the present analysis only surface contact and bonded were used. All connections
between 3-D CAD components in this thesis were modeled using exact-fit dimensions
where no gap occurs between the components. For example, the hole diameter is the
same as the bolt diameter. Table 3 shows all contact connections and how they were
modeled.
Surfaces Contact Coefficient of friction
Comments
Fork/axle bonded N/A Axle is bolted into the fork to prevent it from rotating
Wheel/axle Surface/surface 0.0018 [32] Wheels rotate about the axle Locknut/fork bonded N/A Locknut is mounted onto the
fork to hold the piston Locknut/piston bonded N/A Locknut prevents the piston
from coming loose Bearing/piston Surface/surface 0.04 [28] Piston slides up/down during
ground, take-off and landing operations
Bearing/cylinder bonded N/A Bearing is pressed fit into the cylinder’s inside diameter to
hold the piston and to allow it to extend/retract
Table 3: Contact surfaces
4.2 Loading
Three different loading conditions are applied to the nose gear. They are the
inflation pressure, ground vertical force, horizontal forces (due to spin up and spring back
drag), and shock absorber forces. The vertical force is applied based on the eye-bar
theory and using the tire/wheel interface. The inflation pressure is applied 360 degrees
around the wheel. The shock absorber force is applied at the top of the piston with a
downward force and applied to the top of the cylinder in the opposite direction.
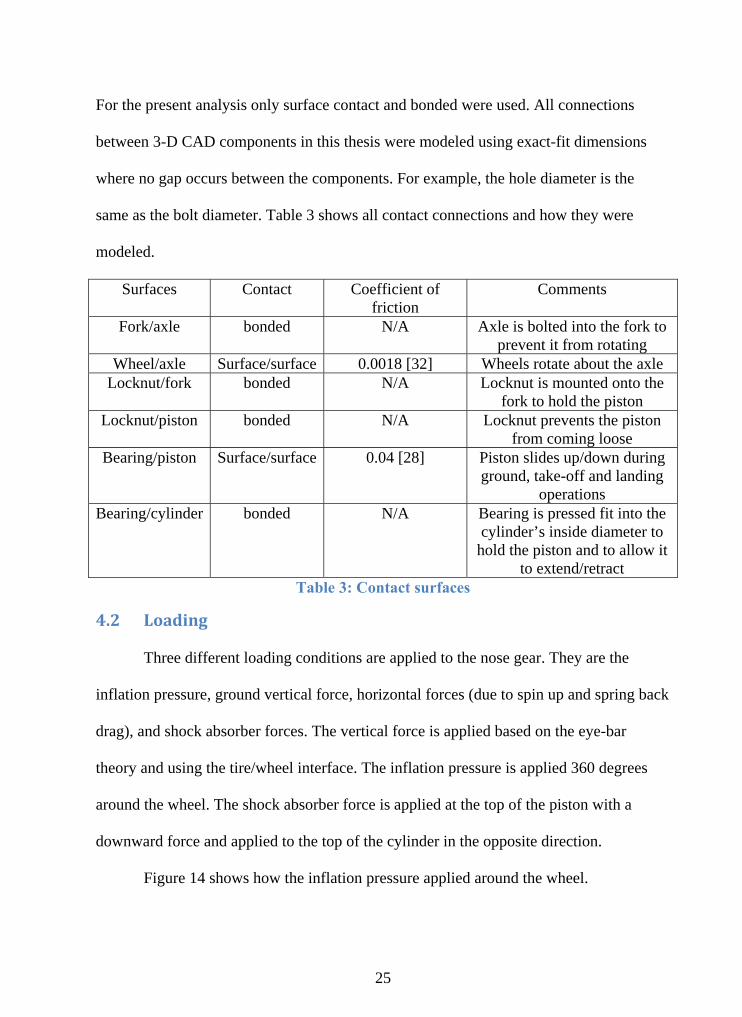
Figure 14 shows how the inflation pressure applied around the wheel.
26
Figure 14: Inflation pressure distribution around the wheel
The inflation pressure around the wheel was assumed to remain constant since the
change of the tire volume is minimal during landing.
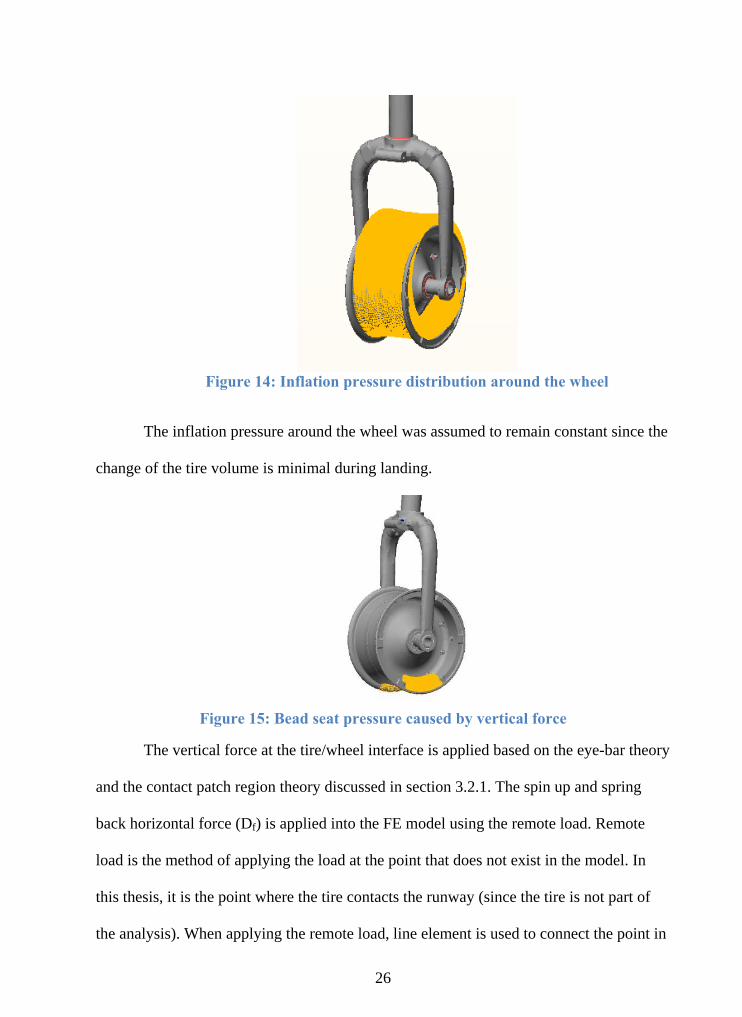
Figure 15: Bead seat pressure caused by vertical force
The vertical force at the tire/wheel interface is applied based on the eye-bar theory
and the contact patch region theory discussed in section 3.2.1. The spin up and spring
back horizontal force (Df) is applied into the FE model using the remote load. Remote
load is the method of applying the load at the point that does not exist in the model. In
this thesis, it is the point where the tire contacts the runway (since the tire is not part of
the analysis). When applying the remote load, line element is used to connect the point in
27
space (point of the tire/runway) back into the model to allow the load to transfer into the
model without adding stiffness to the assembly. The drag force is applied in the x
direction parallel to the ground. Figure 16 illustrates the drag force and all the stiffness
elements connected onto the tire/wheel interface region.
Figure 16: Drag force at the point of contact with ground
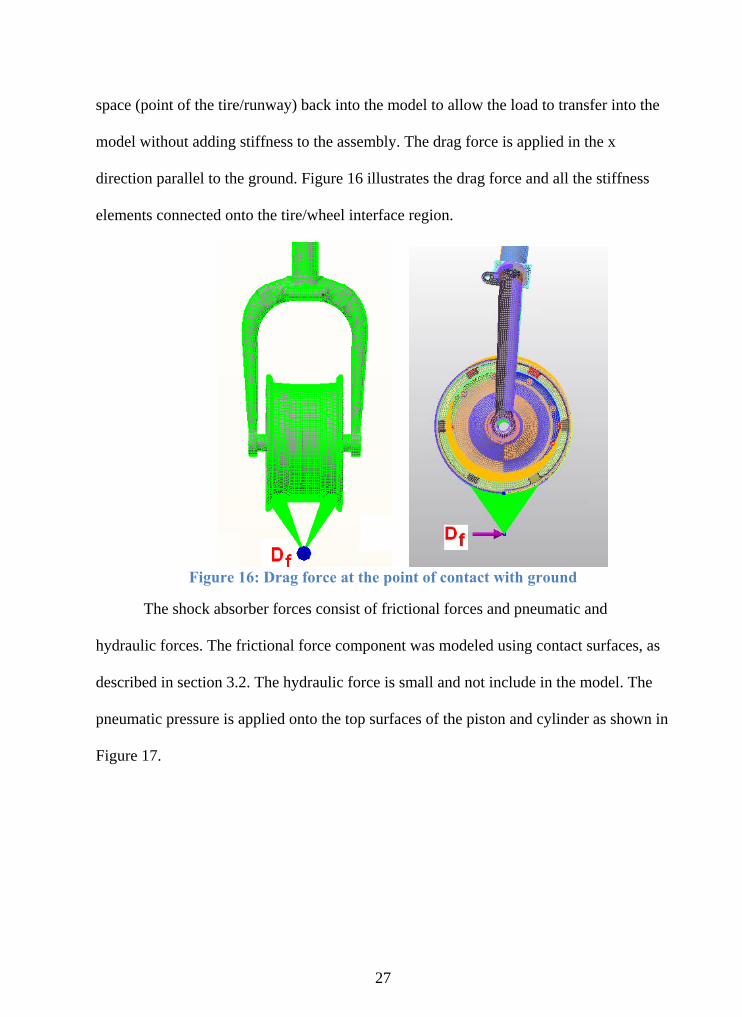
The shock absorber forces consist of frictional forces and pneumatic and
hydraulic forces. The frictional force component was modeled using contact surfaces, as
described in section 3.2. The hydraulic force is small and not include in the model. The
pneumatic pressure is applied onto the top surfaces of the piston and cylinder as shown in
Figure 17.
28
Figure 17: Shock absorber force at piston
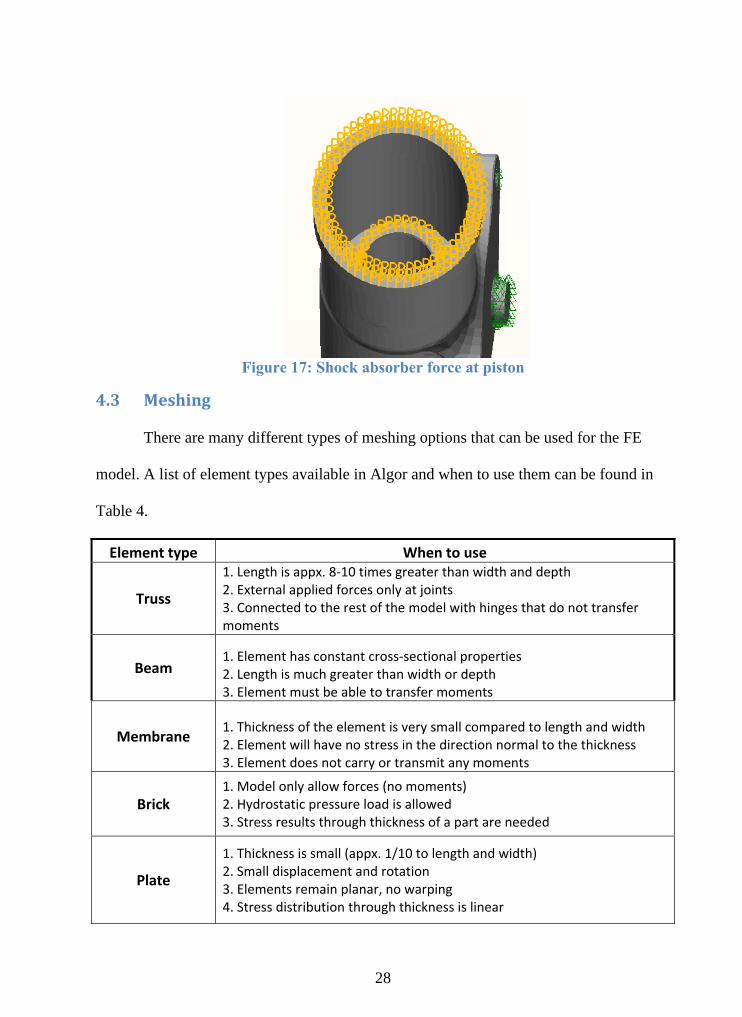
4.3 Meshing There are many different types of meshing options that can be used for the FE
model. A list of element types available in Algor and when to use them can be found in
Table 4.
Element type When to use
Truss
1. Length is appx. 8‐10 times greater than width and depth 2. External applied forces only at joints 3. Connected to the rest of the model with hinges that do not transfer moments
Beam 1. Element has constant cross‐sectional properties 2. Length is much greater than width or depth 3. Element must be able to transfer moments
Membrane 1. Thickness of the element is very small compared to length and width 2. Element will have no stress in the direction normal to the thickness 3. Element does not carry or transmit any moments
Brick 1. Model only allow forces (no moments) 2. Hydrostatic pressure load is allowed 3. Stress results through thickness of a part are needed
Plate
1. Thickness is small (appx. 1/10 to length and width) 2. Small displacement and rotation 3. Elements remain planar, no warping 4. Stress distribution through thickness is linear
29
Tetrahedron
1. Model only allow forces (no moments) 2. Hydrostatic pressure load allowed 3. Stress results through thickness of a part
Spring 1. Two parts are connected by a spring with a known stiffness value 2. Two part are connected by a part that will only transmit an axial force
Rigid 1. Two parts are connected by rigid connection 2. Model the effect of a part without modeling the entire part
Gap 1. To determine contact force between two parts under load 2. To model effects of spring or cable when stiffness is not present
Thin Composite 1. Model by many thin layers 2. Length and width at least 5 to 10 times the thickness 3. Elements are initially flat
Thick Composite 1. Model by layers with 1 layer much thicker than others 2. Length and width at least 2 to 3 times the thickness 3. Elements are initially flat
Table 4: Element Descriptions
Based on the shape and geometry of all parts in the nose gear assembly, brick,
tetrahedral and wedge elements are the most appropriate for this application. The size of
the elements ranges from 10% to 150%, where 100% is considered as the nominal or
default mesh size. Algor has the capability to automatically re-mesh the model if it is
determined that the model has water tightness problems (missing edges), negative
Jacobian or other meshing incompatibilities. The number of iterations and the mesh size
reductions can be defined by the user. A convergence check was performed by meshing
the models with different size elements until the stress converged.
Table 5 indicates the total number of elements and element types used in
modeling each component. Brick element was chosen for the analysis, but since element
types such as tetrahedral elements, pyramids, and wedges were toggled on inside the
mesh engine, the meshing routine chose the most appropriate combination of these
elements in meshing the components. Figure 18 shows some of the examples of different
30
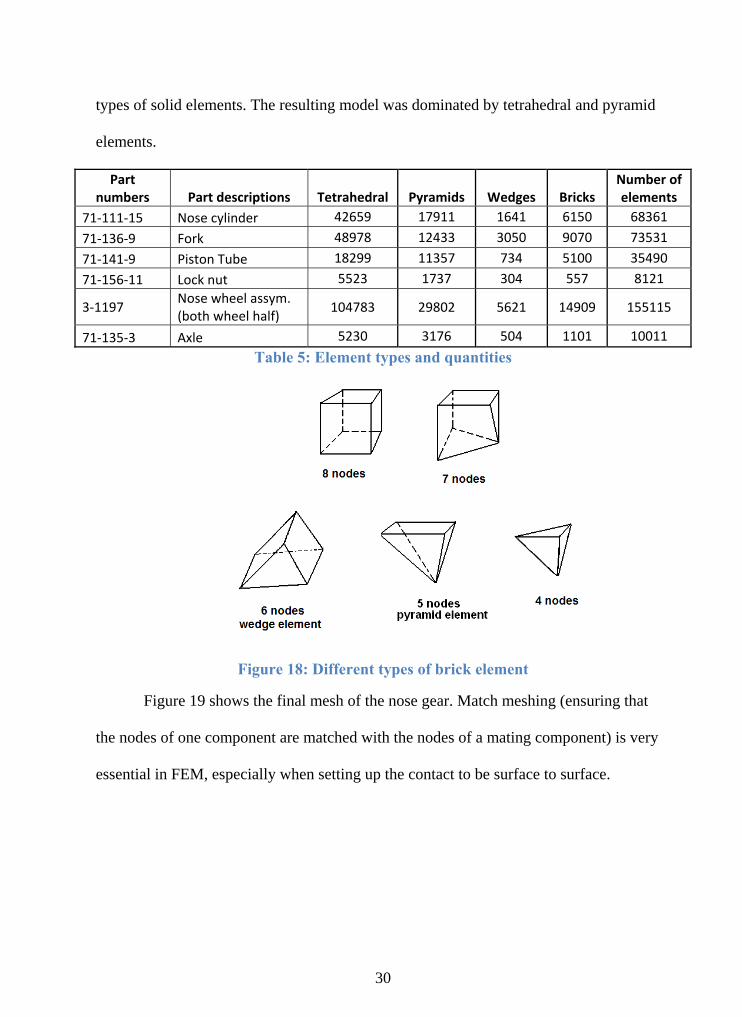
types of solid elements. The resulting model was dominated by tetrahedral and pyramid
elements.
Part numbers Part descriptions Tetrahedral Pyramids Wedges Bricks
Number of elements
71‐111‐15 Nose cylinder 42659 17911 1641 6150 68361
71‐136‐9 Fork 48978 12433 3050 9070 73531
71‐141‐9 Piston Tube 18299 11357 734 5100 35490
71‐156‐11 Lock nut 5523 1737 304 557 8121
3‐1197 Nose wheel assym. (both wheel half)
104783 29802 5621 14909 155115
71‐135‐3 Axle 5230 3176 504 1101 10011
Table 5: Element types and quantities
Figure 18: Different types of brick element
Figure 19 shows the final mesh of the nose gear. Match meshing (ensuring that
the nodes of one component are matched with the nodes of a mating component) is very
essential in FEM, especially when setting up the contact to be surface to surface.

31
Figure 19: Nose gear mesh
There are several locations within the nose gear that requires surface-to-surface
contact as described in Section 4.1. Figure 20 shows how the seal and piston meshes are
matched.
Figure 20: Surface matching
Each element from the seal is matching well with each element from the piston to
allow the piston to move as the force is applied. If surfaces from the seal and the piston
do not match, the piston can move through the seal. Figure 21 shows an example of
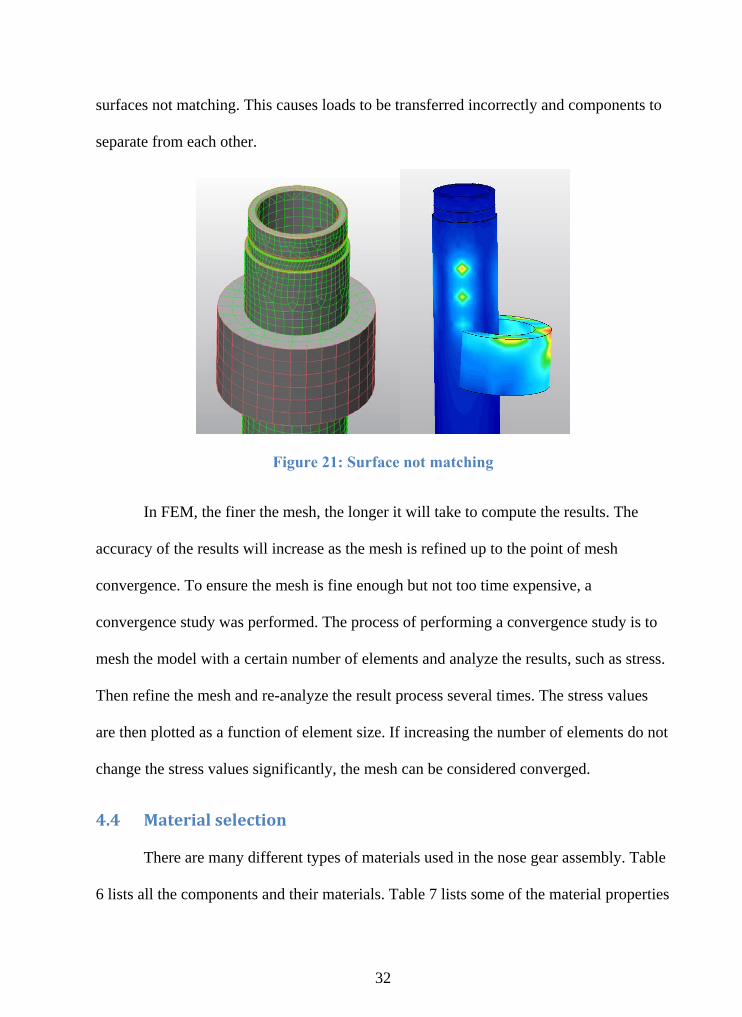
32
surfaces not matching. This causes loads to be transferred incorrectly and components to
separate from each other.
Figure 21: Surface not matching
In FEM, the finer the mesh, the longer it will take to compute the results. The
accuracy of the results will increase as the mesh is refined up to the point of mesh
convergence. To ensure the mesh is fine enough but not too time expensive, a
convergence study was performed. The process of performing a convergence study is to
mesh the model with a certain number of elements and analyze the results, such as stress.
Then refine the mesh and re-analyze the result process several times. The stress values
are then plotted as a function of element size. If increasing the number of elements do not
change the stress values significantly, the mesh can be considered converged.
4.4 Material selection
There are many different types of materials used in the nose gear assembly. Table
6 lists all the components and their materials. Table 7 lists some of the material properties
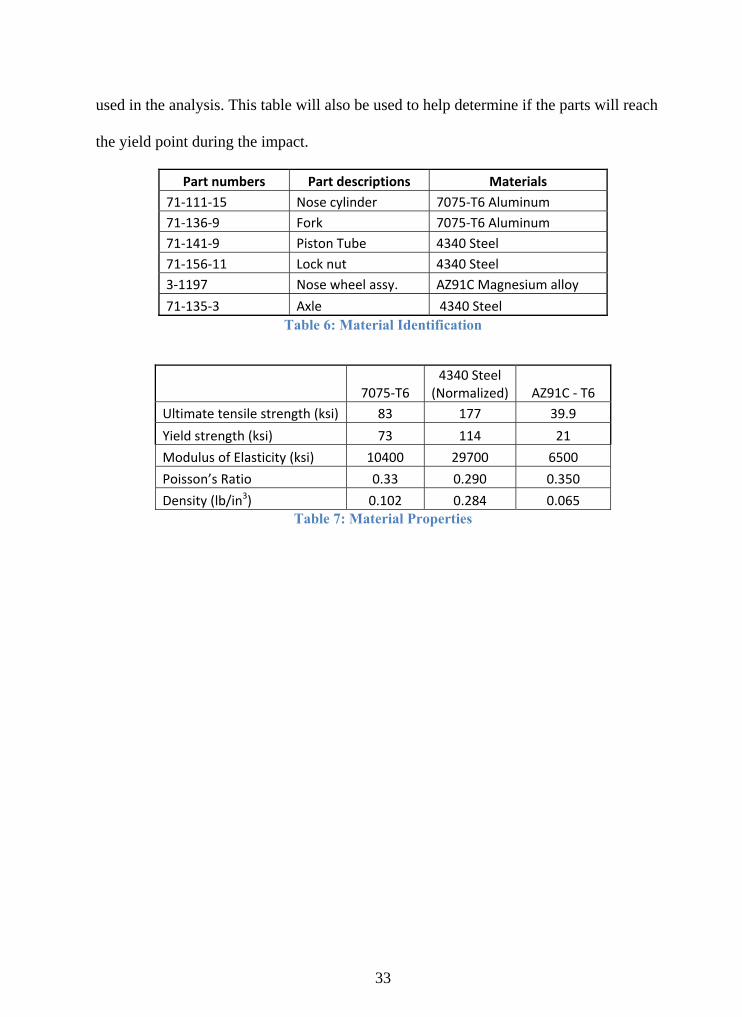
33
used in the analysis. This table will also be used to help determine if the parts will reach
the yield point during the impact.
Part numbers Part descriptions Materials
71‐111‐15 Nose cylinder 7075‐T6 Aluminum
71‐136‐9 Fork 7075‐T6 Aluminum
71‐141‐9 Piston Tube 4340 Steel
71‐156‐11 Lock nut 4340 Steel
3‐1197 Nose wheel assy. AZ91C Magnesium alloy
71‐135‐3 Axle 4340 Steel Table 6: Material Identification
7075‐T6 4340 Steel
(Normalized) AZ91C ‐ T6
Ultimate tensile strength (ksi) 83 177 39.9
Yield strength (ksi) 73 114 21
Modulus of Elasticity (ksi) 10400 29700 6500
Poisson’s Ratio 0.33 0.290 0.350
Density (lb/in3) 0.102 0.284 0.065 Table 7: Material Properties
34
Chapter 5: RESULTS
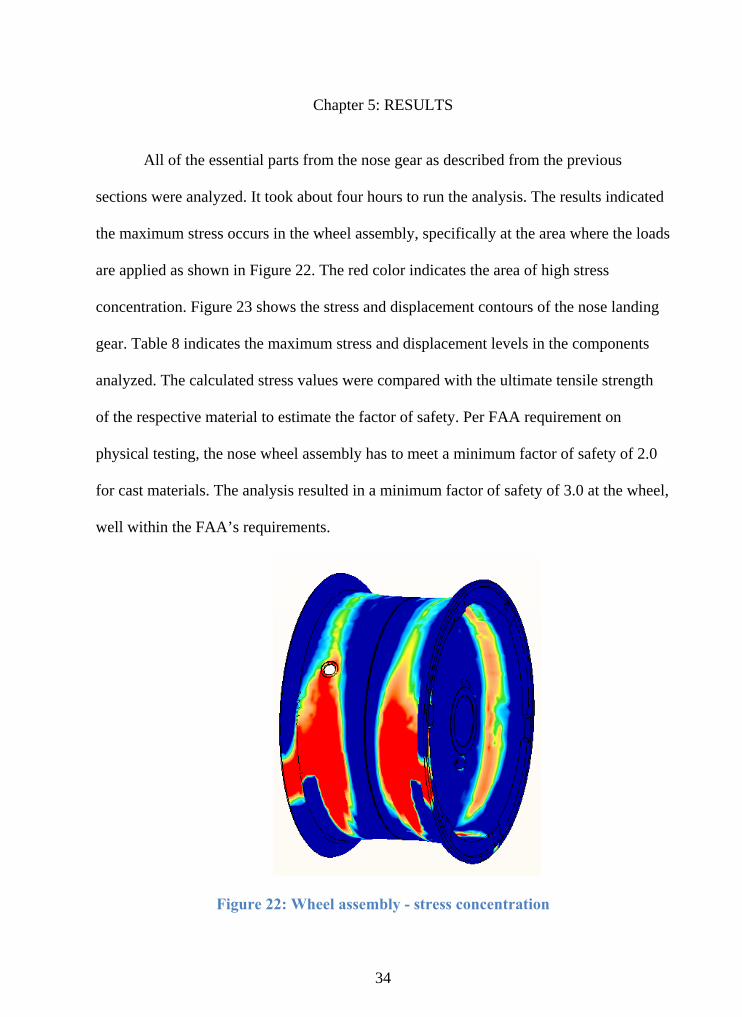
All of the essential parts from the nose gear as described from the previous
sections were analyzed. It took about four hours to run the analysis. The results indicated
the maximum stress occurs in the wheel assembly, specifically at the area where the loads
are applied as shown in Figure 22. The red color indicates the area of high stress
concentration. Figure 23 shows the stress and displacement contours of the nose landing
gear. Table 8 indicates the maximum stress and displacement levels in the components
analyzed. The calculated stress values were compared with the ultimate tensile strength
of the respective material to estimate the factor of safety. Per FAA requirement on
physical testing, the nose wheel assembly has to meet a minimum factor of safety of 2.0
for cast materials. The analysis resulted in a minimum factor of safety of 3.0 at the wheel,
well within the FAA’s requirements.
Figure 22: Wheel assembly - stress concentration
35
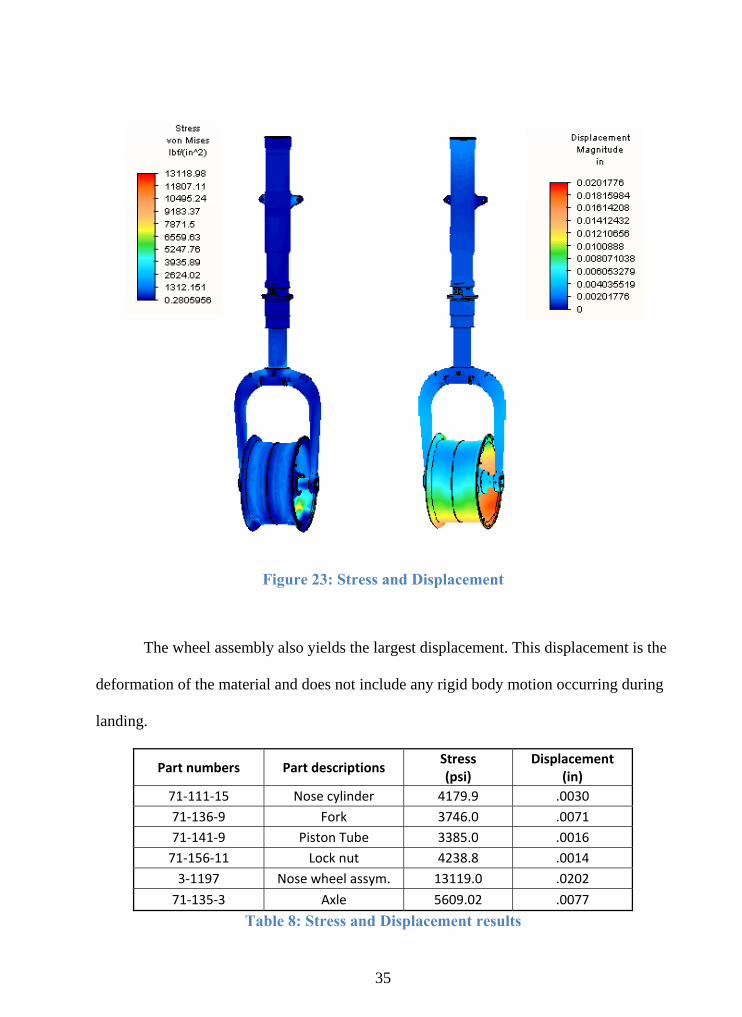
Figure 23: Stress and Displacement
The wheel assembly also yields the largest displacement. This displacement is the
deformation of the material and does not include any rigid body motion occurring during
landing.
Part numbers Part descriptions Stress (psi)
Displacement (in)
71‐111‐15 Nose cylinder 4179.9 .0030
71‐136‐9 Fork 3746.0 .0071
71‐141‐9 Piston Tube 3385.0 .0016
71‐156‐11 Lock nut 4238.8 .0014
3‐1197 Nose wheel assym. 13119.0 .0202
71‐135‐3 Axle 5609.02 .0077
Table 8: Stress and Displacement results
36
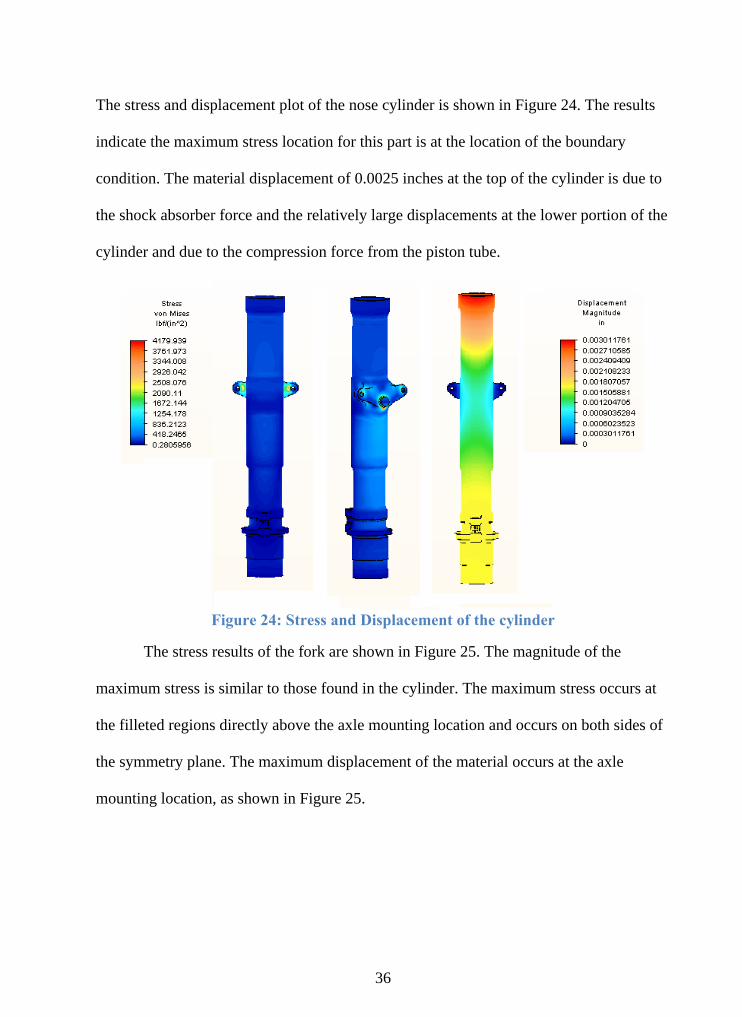
The stress and displacement plot of the nose cylinder is shown in Figure 24. The results
indicate the maximum stress location for this part is at the location of the boundary
condition. The material displacement of 0.0025 inches at the top of the cylinder is due to
the shock absorber force and the relatively large displacements at the lower portion of the
cylinder and due to the compression force from the piston tube.
Figure 24: Stress and Displacement of the cylinder
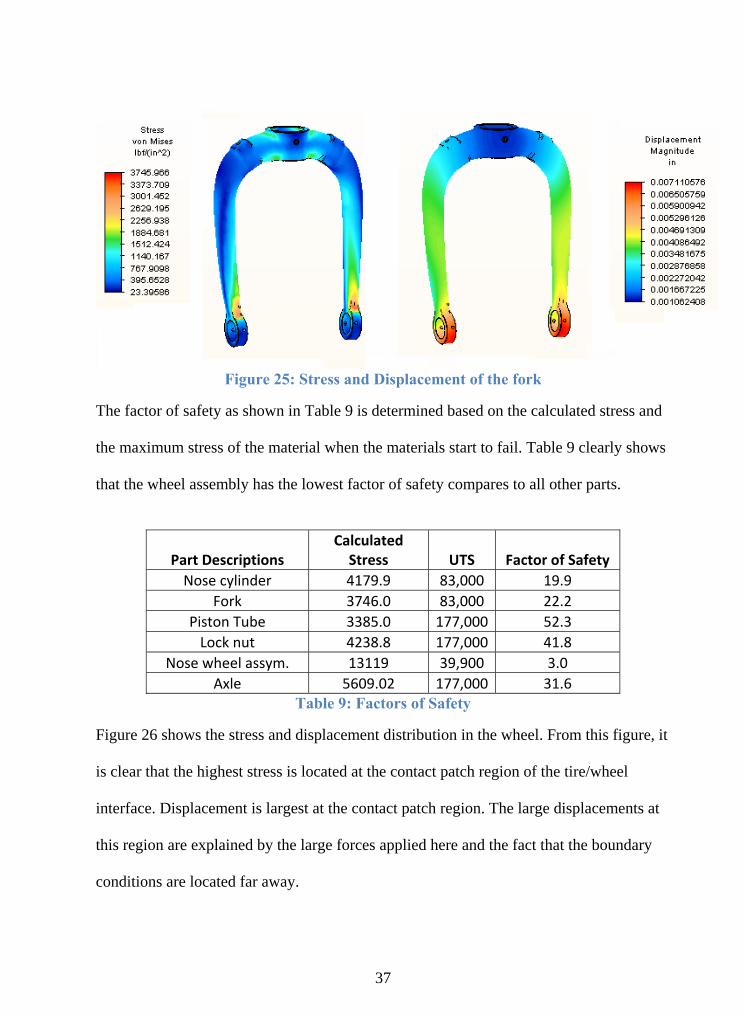
The stress results of the fork are shown in Figure 25. The magnitude of the
maximum stress is similar to those found in the cylinder. The maximum stress occurs at
the filleted regions directly above the axle mounting location and occurs on both sides of
the symmetry plane. The maximum displacement of the material occurs at the axle
mounting location, as shown in Figure 25.
37
Figure 25: Stress and Displacement of the fork
The factor of safety as shown in Table 9 is determined based on the calculated stress and
the maximum stress of the material when the materials start to fail. Table 9 clearly shows
that the wheel assembly has the lowest factor of safety compares to all other parts.
Part Descriptions Calculated Stress UTS Factor of Safety
Nose cylinder 4179.9 83,000 19.9
Fork 3746.0 83,000 22.2
Piston Tube 3385.0 177,000 52.3
Lock nut 4238.8 177,000 41.8
Nose wheel assym. 13119 39,900 3.0
Axle 5609.02 177,000 31.6 Table 9: Factors of Safety
Figure 26 shows the stress and displacement distribution in the wheel. From this figure, it
is clear that the highest stress is located at the contact patch region of the tire/wheel
interface. Displacement is largest at the contact patch region. The large displacements at
this region are explained by the large forces applied here and the fact that the boundary
conditions are located far away.
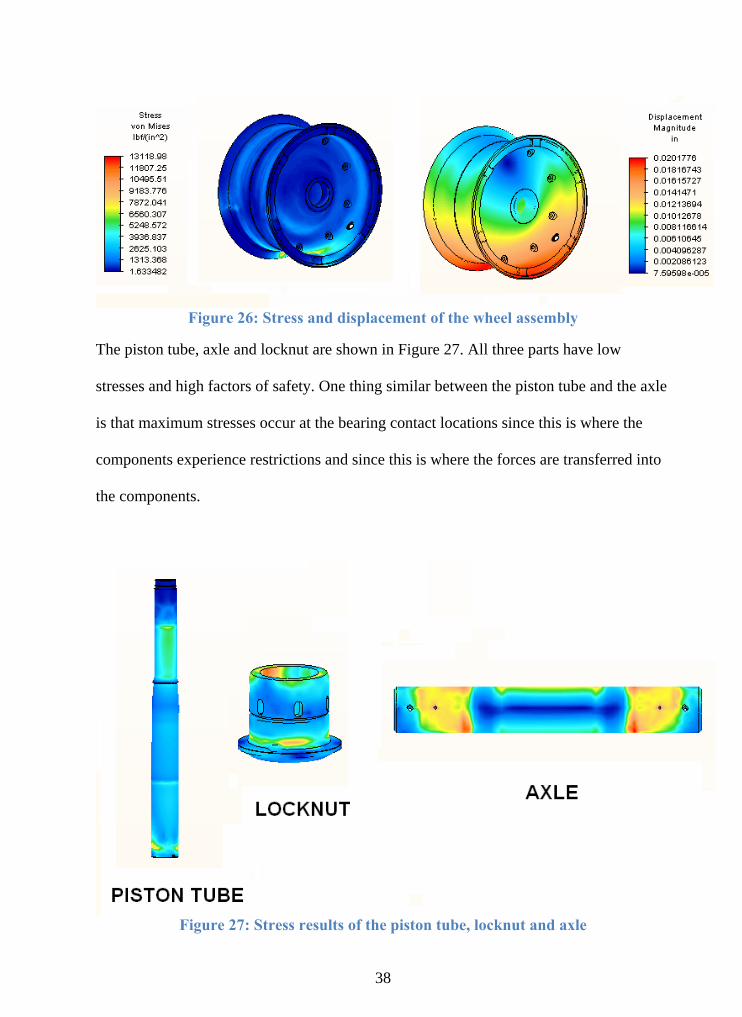
38
Figure 26: Stress and displacement of the wheel assembly
The piston tube, axle and locknut are shown in Figure 27. All three parts have low
stresses and high factors of safety. One thing similar between the piston tube and the axle
is that maximum stresses occur at the bearing contact locations since this is where the
components experience restrictions and since this is where the forces are transferred into
the components.
Figure 27: Stress results of the piston tube, locknut and axle
39
Due to the proprietary information and limited number of publications on the
results of the physical testing of the nose landing gear, a side-by-side comparison of the
results from this thesis and the previous work is not readily available. However, the
similar analysis performed for the automotive wheel is used for comparison. The result
for the displacement of the automotive wheel can reach up to 0.28mm [5] and can be
compared to the result in this thesis where the wheel displaced 0.51mm. The stress of the
automotive wheel gets up to 3190psi compares to 13119psi from this thesis. The stress
from the aircraft wheel is much higher than the automotive wheel due the higher applied
forces. In addition, the material used on the Twin Otter aircraft is magnesium vs.
aluminum in the automotive wheel analysis.
The results obtained for the wheel assembly are acceptable because the 3-D model
was generated from an approved wheel data, which had the factor of safety above 2.0.
The methods used to simplify the model are proven methods such as modeling the wheel
without the tire. All formulas are used in this thesis to determine the forces were from
Federal Aviation Administration. The methods of applying the boundary conditions and
constraints are based on the application of the nose wheel assembly along with literature
reviews.
40
Chapter 6: DISCUSSION AND CONCLUSIONS
This thesis demonstrated several important factors in analyzing a nose landing
gear. First, the function of the nose landing gears must be understood. Second, the time at
which the worst case loading scenarios occurs must be determined. For this analysis, this
worst case was found to occur directly following impact, and this scenario was selected
and analyzed. Third, proper boundary conditions, constraints, and loads must properly be
determined and modeled. Lastly, the results obtained must be studied in detail to
determine their validity.
This analysis shows that finite element analysis can help manufacturers determine
if their designs are safe prior to performing physical testing. FE analysis will allow them
to make design alterations prior to manufacturing and testing, which in turn can save
them time and money. This analysis was performed on the Twin Otter nose landing gear,
but similar analysis can be performed on other landing gears to help predict failure.
Future research can be implemented from this thesis, such as incorporating the
tire into the analysis, performing non-linear and dynamics stress analysis at the time the
tire contacts with the runway until the aircraft stop, and performing physical testing for
validation purposes.

41
REFERENCES
1. Hootman J.A, Jones A.R. Results of Landing tests of various airplanes. Langley Memorial Aeronautical Laboratory, 1942
2. FAA. 2009. <http://av-info.faa.gov/sdrx/Query.aspx>. 3. Courant, R. "Variational methods for the solution of problems of equilibrium and
vibrations." Bulletin of the American Mathematic Society 49.1 (1943): 1-23.
4. Cook, Robert D. Finite element modeling for stress analysis. Madison: John Wiley and Sons, Inc., 1995.
5. Stearns, John C. An Investigation of stress and displacement distribution in a
aluminum alloy automobile rim. Akron: University of Akron, 2000. 6. Ridha, R A. "Finite element stress analysis of automotive wheels." Automotive
engineering congress and exposition (1976). 7. Kandarpa, S, B F Spencer Jr. and D J Kirkner. "Determination of tire-wheel
interface loads for aircraft wheels." Journal of Aircraft 31. No. 2 (1994). 8. Schudt, E E, et al. "Three-Dimensional verification of an axisymmetric algorithm
for tire-wheel interface load recovery." Aerospace Atlantic Conference and Exposition. Dayton: Society of automotive engineers, 1994.
9. Blake, A. Practical stress analysis in engineering design. McGraw-Hill, 1990. 10. Tielking, John T. "A tire contact solution technique." n.d. 11. "Aircraft tire/pavement distributions." Aerospace technology conference and
exposition. Anaheim: Society of Automotive Engineers, 1989. 12. Sherwood, J A, et al. "An Investigation of tire-wheel interface loads using Adina."
Computers and Structures (1995): 377-387. 13. Jeusette, J P and M Theves. "Finite element analysis of tire/rim interface forces
under braking and corner loads." TSTCA. Tire Science and Technology, 1992. 83-105.
14 Tseng, N T, R G Pelle and J P Chang. "Finite element simulation of tire-rim
interface." TSTCA. Tire Science and Technology, 1989. 305-325. 15. Oden, J T, et al. "Finite element methods for nonlinear elastostatic problems in
rubber elasticity." n.d.
42
16. Spencer, B F, et al. "Aircraft wheel life assessment." goverment report. University of Notre Dame, 1993.
17. Dilley, G A and D V Wallerstein. "Finite element analysis and the modeling of
tires." MSC World User's Conference. 1984. 18. Kim, Kyun O, Ahmed K Noor and John A Tanner. "Modeling and analysis of the
space shuttle nose gear tire with semianalytic finite elements." NASA technical paper. 1990.
19. Mason, William H and Sony T Chai. "Landing gear intergration in aicraft
conceptual design." Research topic support by NASA Ames Research Center. 1996.
20. Milwitzky, Benjamin and Frances E Cook. "Analysis of landing gear behavior."
n.d. 21. Noor, Ahmed K and C M Andersen. "Finite element modeling and analysis of
tires." NASA conference publication. n.d. 22. J. Mackerle. "Some remarks on progress with finite elements." 55.6 (1995): 1101-
1106. 23. Curry, Norman S. Aircraft landing gear design: Principles and practices.
Washington: American Institute of Aeronautics and Astronautics, Inc., 1988. 24. Dong-Su, Wu, Gu Hong-bin and Liu Hui. "GA-based bodel predictive control of
semi-active landing gear." Chinese Journal of Aeronautics (2007): 47-54. 25. Seth Russell Anthony, Jr. Landing gear loads analysis. Wichita: Wichita State
University, 1964. 26. Aviation, Goodyear. Aircraft Tire Data Book. Akron, 10, 2002. 27. Sherwood, James A, et al. "Study of the pressure distribution on an aircraft tire-
wheel interface." Journal of Aircraft 32.5 (n.d.). 28. Kamatics . <http://www.kamatics.com>. 29. CFR. FAA title 14, part 23. <http://ecfr.gpoaccess.gov/cgi/t/text/text-
idx?c=ecfr&tpl=/ecfrbrowse/Title14/14cfr23_main_02.tpl>. 30. Fish, Bradley E, Joseph J Pajot and Delbert K Patterson. "FEA cyclic symetric
fatigue analysis of aircraft wheels." World aviation congress and display. Phoenix: Society of Automotive Engineers, 2002.
43
31. Flugrad, Donald R and Bruce A Miller. "Experimental and finite element study of a standing torus under normal and tangential loads." n.d.
32. Timken bearings. <http://www.timken.com>. 33. Jack, Pink. "Structural integrity of landing gears." Tanner, John A, et al.
Emerging technologies in aircraft landing gear. Warrendale: Society of automotive engineers, 1997. 3-14.
34. Walls, James H. An experimental study of orifice coefficients, internal strut
pressures, and loads on a small oleo-pneumatic shock strut. National advisory committee for aeronautics. Langley Fiel: Langley Aeronautical Laboratory, 1955.
35. Wang, Haitao, et al. "An investigation of an active landing gear system to reduce
aircraft vibrations caused by landing impacts and runway excitations." Journal of Sound and Vibration. 2008.

44
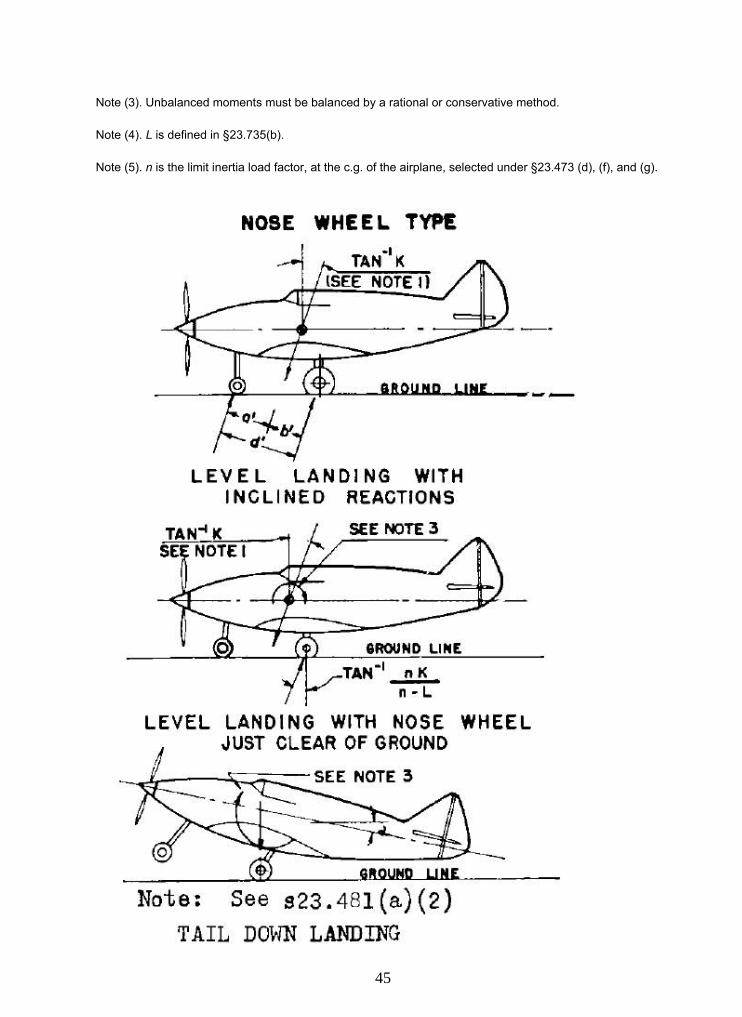
APPENDIX A
Basic Landing Conditions
Nose wheel type
Condition
Level landing with inclined
reactions
Level landing with nose wheel
just clear of ground Tail-down landing
Reference section 23.479(a)(2)(i) 23.479(a)(2)(ii) 23.481(a)(2) and (b).
Vertical component at c. g nW nW nW .
Fore and aft component at c. g
KnW KnW 0.
Lateral component in either direction at c. g
0 0 0.
Shock absorber extension (hydraulic shock absorber)
Note (2) Note (2) Note (2).
Shock absorber deflection (rubber or spring shock absorber), percent
100 100 100.
Tire deflection Static Static Static.
Main wheel loads (both wheels) ( Vr )
( n-L ) W a′/d′ ( n-L ) W ( n-L ) W.
Main wheel loads (both wheels) ( Dr )
KnW a′/d′ KnW 0.
Tail (nose) wheel loads ( Vf ) ( n-L ) W b′/d′ 0 0.
Tail (nose) wheel loads ( Df )
KnW b′/d′ 0 0.
Notes (1) (1), (3), and (4) (3) and (4).
Note (1). K may be determined as follows: K =0.25 for W =3,000 pounds or less; K =0.33 for W =6,000 pounds or greater, with linear variation of K between these weights.
Note (2). For the purpose of design, the maximum load factor is assumed to occur throughout the shock absorber stroke from 25 percent deflection to 100 percent deflection unless otherwise shown and the load factor must be used with whatever shock absorber extension is most critical for each element of the landing gear.
45
Note (3). Unbalanced moments must be balanced by a rational or conservative method.
Note (4). L is defined in §23.735(b).
Note (5). n is the limit inertia load factor, at the c.g. of the airplane, selected under §23.473 (d), (f), and (g).
NOSE WHEEL TYP£ .,
TAN K ISEE NOTE I)
LEVEL LANDING WITH INCLINED REACTIONS
SEE NOTE 3
'ROUNO LIN£
LEVEL LANDING WITH NOSE WHEEL JUST CLEAR OF GROUND
SEE NOTE 3
ftOUNO UN[
Note: See s23.481(a)(2) TAIL DOvlN LANDING