finite element model for failure study of two … li and wieslaw k. binienda the university of...
TRANSCRIPT
Xuetao Li and Wieslaw K. BiniendaThe University of Akron, Akron, Ohio
Robert K. Goldberg Glenn Research Center, Cleveland, Ohio
Finite Element Model for Failure Study of Two-Dimensional Triaxially Braided Composite
NASA/TM—2010-216372
July 2010
https://ntrs.nasa.gov/search.jsp?R=20100026659 2018-06-11T09:41:24+00:00Z

NASA STI Program . . . in Profi le
Since its founding, NASA has been dedicated to the advancement of aeronautics and space science. The NASA Scientifi c and Technical Information (STI) program plays a key part in helping NASA maintain this important role.
The NASA STI Program operates under the auspices of the Agency Chief Information Offi cer. It collects, organizes, provides for archiving, and disseminates NASA’s STI. The NASA STI program provides access to the NASA Aeronautics and Space Database and its public interface, the NASA Technical Reports Server, thus providing one of the largest collections of aeronautical and space science STI in the world. Results are published in both non-NASA channels and by NASA in the NASA STI Report Series, which includes the following report types: • TECHNICAL PUBLICATION. Reports of
completed research or a major signifi cant phase of research that present the results of NASA programs and include extensive data or theoretical analysis. Includes compilations of signifi cant scientifi c and technical data and information deemed to be of continuing reference value. NASA counterpart of peer-reviewed formal professional papers but has less stringent limitations on manuscript length and extent of graphic presentations.
• TECHNICAL MEMORANDUM. Scientifi c
and technical fi ndings that are preliminary or of specialized interest, e.g., quick release reports, working papers, and bibliographies that contain minimal annotation. Does not contain extensive analysis.
• CONTRACTOR REPORT. Scientifi c and
technical fi ndings by NASA-sponsored contractors and grantees.
• CONFERENCE PUBLICATION. Collected papers from scientifi c and technical conferences, symposia, seminars, or other meetings sponsored or cosponsored by NASA.
• SPECIAL PUBLICATION. Scientifi c,
technical, or historical information from NASA programs, projects, and missions, often concerned with subjects having substantial public interest.
• TECHNICAL TRANSLATION. English-
language translations of foreign scientifi c and technical material pertinent to NASA’s mission.
Specialized services also include creating custom thesauri, building customized databases, organizing and publishing research results.
For more information about the NASA STI program, see the following:
• Access the NASA STI program home page at http://www.sti.nasa.gov
• E-mail your question via the Internet to help@
sti.nasa.gov • Fax your question to the NASA STI Help Desk
at 443–757–5803 • Telephone the NASA STI Help Desk at 443–757–5802 • Write to:
NASA Center for AeroSpace Information (CASI) 7115 Standard Drive Hanover, MD 21076–1320
Xuetao Li and Wieslaw K. BiniendaThe University of Akron, Akron, Ohio
Robert K. Goldberg Glenn Research Center, Cleveland, Ohio
Finite Element Model for Failure Study of Two-Dimensional Triaxially Braided Composite
NASA/TM—2010-216372
July 2010
National Aeronautics andSpace Administration
Glenn Research CenterCleveland, Ohio 44135

Acknowledgments
The fi rst two authors acknowledge the support of the National Aeronautics and Space Administration and associated Glenn Research Center, grant number NNX07AV60A and technical monitor Mr. Dale Hopkins. Dr. Justin Littell is acknowledged for performing the experimental tests described in this report. This work was funded by the Aging Aircraft and Durability Project of the Aviation Safety Program.
Available from
NASA Center for Aerospace Information7115 Standard DriveHanover, MD 21076–1320
National Technical Information Service5301 Shawnee Road
Alexandria, VA 22312
Available electronically at http://gltrs.grc.nasa.gov
Trade names and trademarks are used in this report for identifi cation only. Their usage does not constitute an offi cial endorsement, either expressed or implied, by the National Aeronautics and
Space Administration.
Level of Review: This material has been technically reviewed by technical management.
Finite Element Model for Failure Study of Two-Dimensional Triaxially Braided Composite
Xuetao Li and Wieslaw K. Binienda
The University of Akron Akron, Ohio 44325
Robert K. Goldberg
National Aeronautics and Space Administration Glenn Research Center Cleveland, Ohio 44135
Abstract A new three-dimensional finite element model of two-dimensional triaxially braided composites is
presented in this paper. This meso-scale modeling technique is used to examine and predict the deformation and damage observed in tests of straight sided specimens. A unit cell based approach is used to take into account the braiding architecture as well as the mechanical properties of the fiber tows, the matrix and the fiber tow-matrix interface. A 0°/±60° braiding configuration has been investigated by conducting static finite element analyses. Failure initiation and progressive degradation has been simulated in the fiber tows by use of the Hashin failure criteria and a damage evolution law. The fiber tow-matrix interface was modeled by using a cohesive zone approach to capture any fiber-matrix debonding. By comparing the analytical results to those obtained experimentally, the applicability of the developed model was assessed and the failure process was investigated.
1.0 Introduction Carbon fiber/polymer composites have been heavily utilized in recent years due to their excellent
mechanical properties, such as high strength and stiffness, with a corresponding low weight. These properties make them particularly popular in aerospace applications. Classically, laminated composites are used when in-plane properties are of primary importance. However, laminated composites generally have poor through thickness properties which will cause delamination under low level of load. To avoid these difficulties, textile architectures, such as braided composites, have been developed to improve the through-thickness behavior.
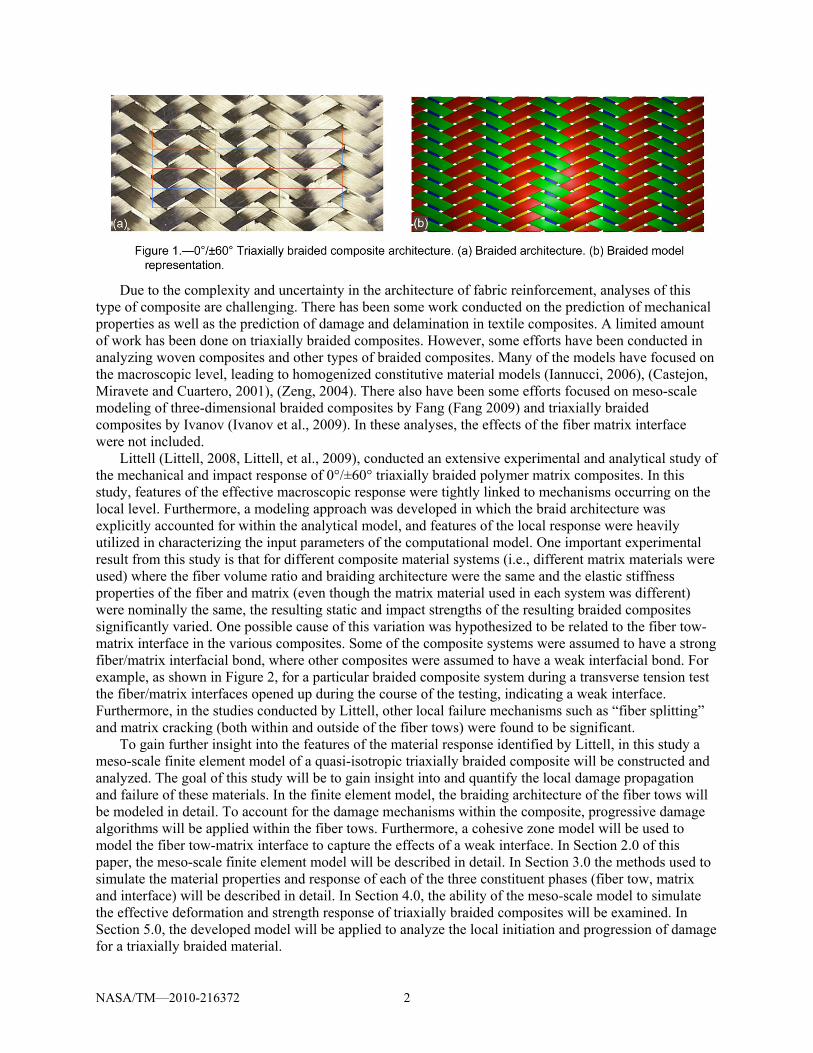
In particular, in two-dimensionally triaxially braided composites, three sets of fiber tows with different orientations are intertwined to form a single layer of 0°/±θ° material. Bias tows alternatively undulate over and under each other while 0° tows (also called axial tows) are straight and define the axial direction of the composite. In particular, braided composites with a bias fiber orientation angle of ±60° fiber architecture are often utilized due to the nonlinear quasi isotropic nature of the material. Furthermore, it has been reported that braided composites with a 60° braiding angle, as shown in Figure 1, can resist crack initiation and propagation as well as formation of delaminations during impact (Roberts et al., 2003). In this work, when a flat panel was impacted by a soft projectile, the damage area on the braided panel was observed to be arrested and only slightly larger than the initial impact area, compared with a damage area on aluminum plates which extended to the panel boundaries as a result of dynamic crack propagation. A state-of-the-art review of the application of two dimensional braided composites in structural components has been conducted by Ayranci and Carey (2008).
NASA/TM—2010-216372 1
Due to the complexity and uncertainty in the architecture of fabric reinforcement, analyses of this
type of composite are challenging. There has been some work conducted on the prediction of mechanical properties as well as the prediction of damage and delamination in textile composites. A limited amount of work has been done on triaxially braided composites. However, some efforts have been conducted in analyzing woven composites and other types of braided composites. Many of the models have focused on the macroscopic level, leading to homogenized constitutive material models (Iannucci, 2006), (Castejon, Miravete and Cuartero, 2001), (Zeng, 2004). There also have been some efforts focused on meso-scale modeling of three-dimensional braided composites by Fang (Fang 2009) and triaxially braided composites by Ivanov (Ivanov et al., 2009). In these analyses, the effects of the fiber matrix interface were not included.
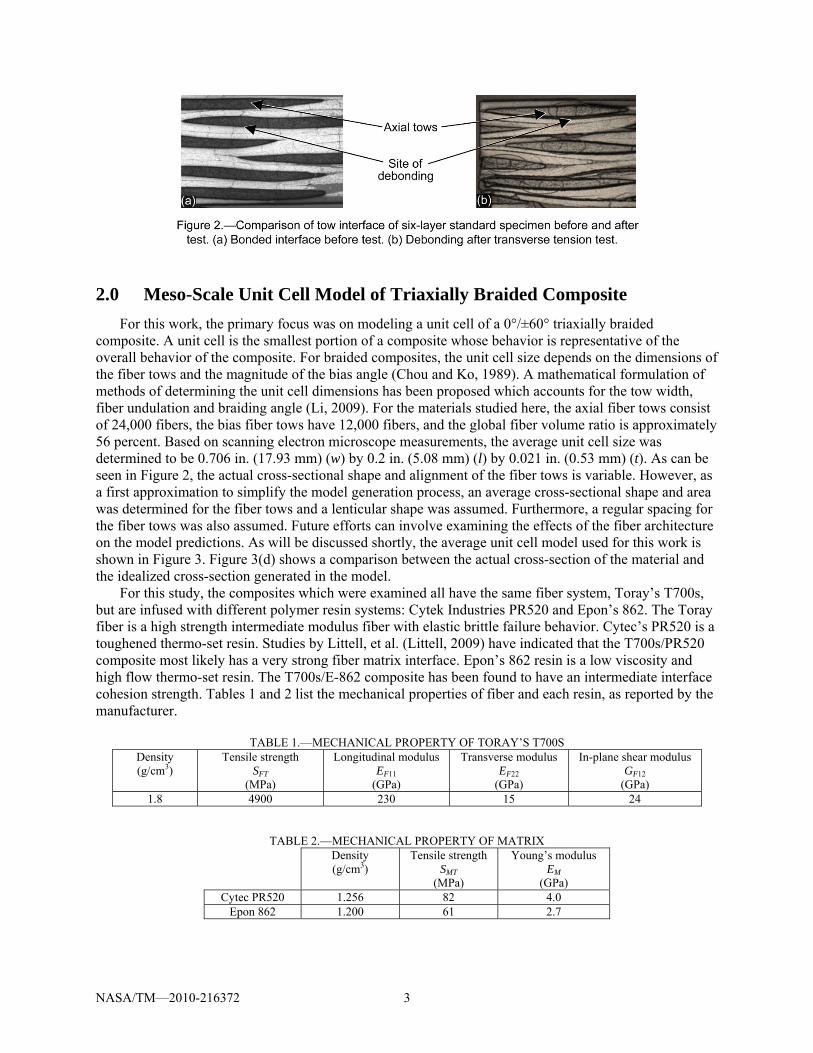
Littell (Littell, 2008, Littell, et al., 2009), conducted an extensive experimental and analytical study of the mechanical and impact response of 0°/±60° triaxially braided polymer matrix composites. In this study, features of the effective macroscopic response were tightly linked to mechanisms occurring on the local level. Furthermore, a modeling approach was developed in which the braid architecture was explicitly accounted for within the analytical model, and features of the local response were heavily utilized in characterizing the input parameters of the computational model. One important experimental result from this study is that for different composite material systems (i.e., different matrix materials were used) where the fiber volume ratio and braiding architecture were the same and the elastic stiffness properties of the fiber and matrix (even though the matrix material used in each system was different) were nominally the same, the resulting static and impact strengths of the resulting braided composites significantly varied. One possible cause of this variation was hypothesized to be related to the fiber tow-matrix interface in the various composites. Some of the composite systems were assumed to have a strong fiber/matrix interfacial bond, where other composites were assumed to have a weak interfacial bond. For example, as shown in Figure 2, for a particular braided composite system during a transverse tension test the fiber/matrix interfaces opened up during the course of the testing, indicating a weak interface. Furthermore, in the studies conducted by Littell, other local failure mechanisms such as “fiber splitting” and matrix cracking (both within and outside of the fiber tows) were found to be significant.
To gain further insight into the features of the material response identified by Littell, in this study a meso-scale finite element model of a quasi-isotropic triaxially braided composite will be constructed and analyzed. The goal of this study will be to gain insight into and quantify the local damage propagation and failure of these materials. In the finite element model, the braiding architecture of the fiber tows will be modeled in detail. To account for the damage mechanisms within the composite, progressive damage algorithms will be applied within the fiber tows. Furthermore, a cohesive zone model will be used to model the fiber tow-matrix interface to capture the effects of a weak interface. In Section 2.0 of this paper, the meso-scale finite element model will be described in detail. In Section 3.0 the methods used to simulate the material properties and response of each of the three constituent phases (fiber tow, matrix and interface) will be described in detail. In Section 4.0, the ability of the meso-scale model to simulate the effective deformation and strength response of triaxially braided composites will be examined. In Section 5.0, the developed model will be applied to analyze the local initiation and progression of damage for a triaxially braided material.
NASA/TM—2010-216372 2
2.0 Meso-Scale Unit Cell Model of Triaxially Braided Composite For this work, the primary focus was on modeling a unit cell of a 0°/±60° triaxially braided
composite. A unit cell is the smallest portion of a composite whose behavior is representative of the overall behavior of the composite. For braided composites, the unit cell size depends on the dimensions of the fiber tows and the magnitude of the bias angle (Chou and Ko, 1989). A mathematical formulation of methods of determining the unit cell dimensions has been proposed which accounts for the tow width, fiber undulation and braiding angle (Li, 2009). For the materials studied here, the axial fiber tows consist of 24,000 fibers, the bias fiber tows have 12,000 fibers, and the global fiber volume ratio is approximately 56 percent. Based on scanning electron microscope measurements, the average unit cell size was determined to be 0.706 in. (17.93 mm) (w) by 0.2 in. (5.08 mm) (l) by 0.021 in. (0.53 mm) (t). As can be seen in Figure 2, the actual cross-sectional shape and alignment of the fiber tows is variable. However, as a first approximation to simplify the model generation process, an average cross-sectional shape and area was determined for the fiber tows and a lenticular shape was assumed. Furthermore, a regular spacing for the fiber tows was also assumed. Future efforts can involve examining the effects of the fiber architecture on the model predictions. As will be discussed shortly, the average unit cell model used for this work is shown in Figure 3. Figure 3(d) shows a comparison between the actual cross-section of the material and the idealized cross-section generated in the model.
For this study, the composites which were examined all have the same fiber system, Toray’s T700s, but are infused with different polymer resin systems: Cytek Industries PR520 and Epon’s 862. The Toray fiber is a high strength intermediate modulus fiber with elastic brittle failure behavior. Cytec’s PR520 is a toughened thermo-set resin. Studies by Littell, et al. (Littell, 2009) have indicated that the T700s/PR520 composite most likely has a very strong fiber matrix interface. Epon’s 862 resin is a low viscosity and high flow thermo-set resin. The T700s/E-862 composite has been found to have an intermediate interface cohesion strength. Tables 1 and 2 list the mechanical properties of fiber and each resin, as reported by the manufacturer.
TABLE 1.—MECHANICAL PROPERTY OF TORAY’S T700S
Density (g/cm3)
Tensile strength SFT
(MPa)
Longitudinal modulus EF11
(GPa)
Transverse modulus EF22
(GPa)
In-plane shear modulus GF12
(GPa) 1.8 4900 230 15 24
TABLE 2.—MECHANICAL PROPERTY OF MATRIX Density
(g/cm3) Tensile strength
SMT (MPa)
Young’s modulus EM
(GPa) Cytec PR520 1.256 82 4.0
Epon 862 1.200 61 2.7
NASA/TM—2010-216372 3
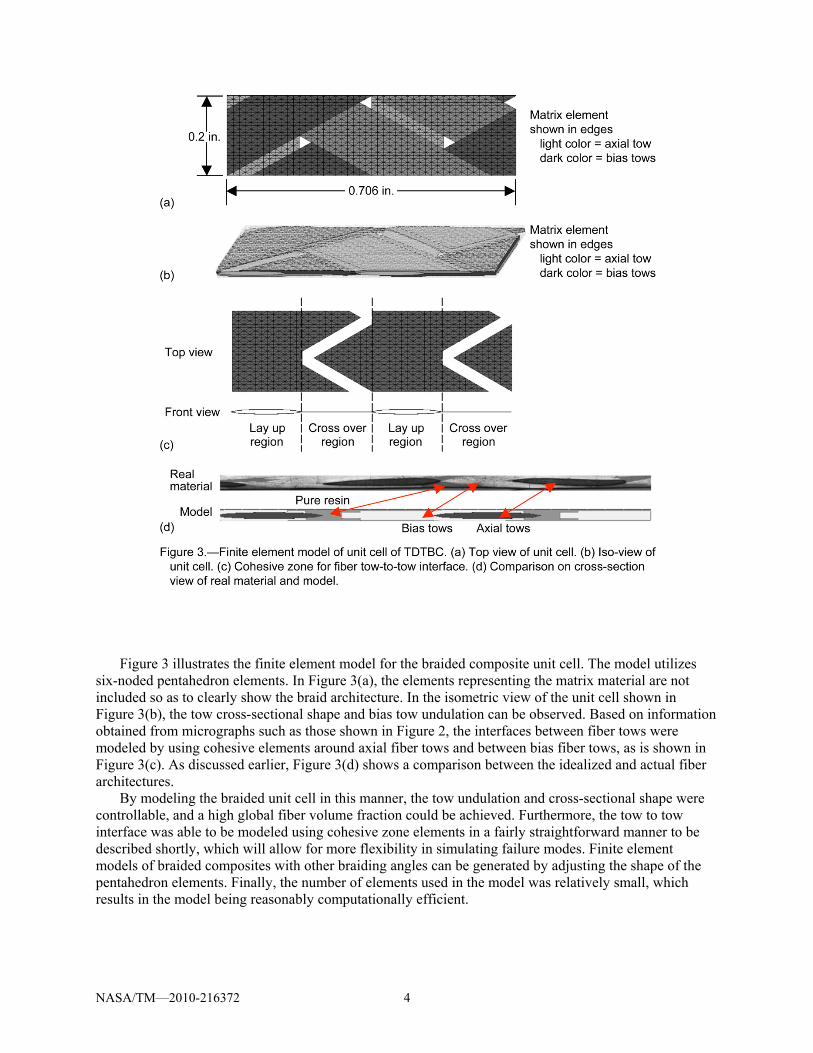
Figure 3 illustrates the finite element model for the braided composite unit cell. The model utilizes six-noded pentahedron elements. In Figure 3(a), the elements representing the matrix material are not included so as to clearly show the braid architecture. In the isometric view of the unit cell shown in Figure 3(b), the tow cross-sectional shape and bias tow undulation can be observed. Based on information obtained from micrographs such as those shown in Figure 2, the interfaces between fiber tows were modeled by using cohesive elements around axial fiber tows and between bias fiber tows, as is shown in Figure 3(c). As discussed earlier, Figure 3(d) shows a comparison between the idealized and actual fiber architectures.
By modeling the braided unit cell in this manner, the tow undulation and cross-sectional shape were controllable, and a high global fiber volume fraction could be achieved. Furthermore, the tow to tow interface was able to be modeled using cohesive zone elements in a fairly straightforward manner to be described shortly, which will allow for more flexibility in simulating failure modes. Finite element models of braided composites with other braiding angles can be generated by adjusting the shape of the pentahedron elements. Finally, the number of elements used in the model was relatively small, which results in the model being reasonably computationally efficient.
NASA/TM—2010-216372 4
3.0 Material Property Characterization 3.1 Phase I: Fiber Tows
The resin transfer molding (RTM) technique is widely used during resin impregnation of fiber tows, in such a way that consistency in fiber volume fractions and hence mechanical properties may be achieved. Therefore, in this paper, the material properties are assumed to be uniform within all fiber tows. The fiber tows are further assumed to be unidirectional transversely isotropic material under plane stress conditions. The fiber tows are assumed to behave linear elastically before damage initiation. As will be discussed later, the onset of damage and its subsequent evolution can be modeled by using a combination of a failure criteria (for example that developed by Hashin (Hashin, 1973)) and an anisotropic damage evolution law (for example that developed by Matzenmiller (Matzenmiller, 1995)). Plane stress continuum shell elements with a three-dimensional geometry are used to model the fiber tows. Due to the presence of matrix only regions in the composite, the fiber volume fraction of the composite
CfV is lower than the fiber volume fractions within the fiber tows tow
fV . The tow fiber volume fraction towfV is calculated based on the geometry of the unit cell model by using Equation (1),
Unitcell
tow Cf f tows
VolumeV VVolume
= × (1)
where VolumeUnitcell and Volumetows are the volume of the unit cell and the volume of the fiber tows in the unit cell, respectively. tow
fV is calculated to be about 80 percent, which will be further used to calculate the effective mechanical properties of the fiber tows based on a micromechanical model.
To compute the effective stiffness properties of the fiber tows, the Generalized Method of Cells (GMC) developed by Aboudi (Aboudi, 1991) was utilized. In this micromechanical model, the assumed representative volume element (RVE) used a four subcell model, with one subcell for the fiber and three subcells for the matrix. In this model, traction and displacement continuity conditions are applied over the unit cell and combined with the constituent material properties to obtain effective stiffness values. The strength parameters were much more difficult to determine since they may be related to local defects, local variations and fiber matrix interface bond quality. The simplified micromechanics formulations, Equation (2), included in Chamis’s Model (Chamis, 1984) were used to obtain a first approximation of the required strength values.
111
(1 ) MT FT F F
F
EF S V VE
⎡ ⎤= + −⎢ ⎥
⎣ ⎦ (2.1)
(1)1
11(1 ) M
C FC F FF
EF S V VE
⎡ ⎤= + −⎢ ⎥
⎣ ⎦ (2.2.1)
(2)1
121 1
MC
MF
F
GFGVG
=⎛ ⎞
− −⎜ ⎟⎝ ⎠
(2.2.2)
12(3)1
1213 1 M
CF M
G GMS MCF S S
G G⎛ ⎞
= β α − + +⎜ ⎟ α ⋅⎝ ⎠ (2.2.3)
NASA/TM—2010-216372 5
( ) 22 222
22 221 F
T FM F F
E EMTF V S
E E V E= β −
− (2.3)
( ) 22 222
22 22
1 FC F
M F F
E EMCF V S
E E V E= β −
− (2.4)
( ) 12 12
12 121 F
S FM F F
G GMSF V
G G V G= β −
−S (2.5)
where F1T, F1C, F2T, F2C and Fs are the computed composite longitudinal tension and compression, transverse tension and compression, and shear strengths, respectively, Vf is the fiber volume ratio, EM and GM define the matrix Young’s modulus and shear modulus, EF11, EF22 and GF12 define the fiber longitudinal, transverse and shear moduli; E22 and G12 define the effective composite transverse and shear moduli (computed based on GMC), SFT and SFC are the fiber tensile and compressive strengths (assumed to be same), and SMT, SMC and SMS are the matrix tensile, compressive and shear strengths (determined by Littell (2008)). Additionally, two
coefficients are calculated as 4 FVπ
α =⋅
and
2222
11
1 1
M
MF F
F
EEE V
E
⎛ ⎞⎜ ⎟⎜ ⎟β = α −⎜ ⎟α − ⎡ ⎤⎛ ⎞⎜ ⎟− −⎢ ⎥⎜ ⎟⎜ ⎟⎝ ⎠⎣ ⎦⎝ ⎠
.
To help in determining the accuracy and applicability of these values, later in this paper a sensitivity study which examined the sensitivity of the composite global behavior to the values of the fiber tow strength parameters will be described. The effective stiffness values determined for the fiber tows (for both of the composite systems examined in this study) are shown in Table 3, and the effective strength values for the fiber tows are given in Table 4. The failure mechanisms of unidirectional composites under longitudinal compression are complicated. Chamis (Chamis, 1984) hypothesized that there are three primary compressive failure modes, and thus three compressive failure strengths that need to be determined: 1) fiber rupture under compression, computed using Equation (2.2.1); 2) buckling or kinking, computed using Equation (2.2.2); and 3) fiber matrix debonding or matrix cracking, computed using Equation (2.2.3). Strong interfacial bonding between the fiber and matrix has been hypothesized to lead to compressive failure due to fiber rupture (Madhukar, 1992), while weak bonding leads to failure due to debonding or matrix cracking. The failure stresses due to each of these failure modes can be predicted by using the Chamis equations shown above. The fiber tow longitudinal compression strengths shown in Table 4 were first approximated by averaging the values predicted using Equations (2.2.1), (2.2.2) and (2.2.3) for each of the three failure modes, and then further refined by correlating the values using the results of experimental coupon tests (using a process to be described later). The values of F1C listed in Table 4, for the two different composite systems examined in this study, were determined using this procedure.
TABLE 3.—FIBER TOW MODULUS
E1 (GPa)
E2 (GPa)
G12 (GPa)
v12 G23 (GPa)
T700s/E862 184.5 10.13 6.95 0.296 2.77 T700s/PR520 184.8 11.63 9.16 0.296 3.39
TABLE 4.—FIBER TOW STRENGTHS
F1T (MPa)
F1C (MPa)
F2T (MPa)
F2C (MPa)
FS (MPa)
T700s/E862 3931.5 1250 61 152 61 T700s/PR520 3937.2 1500 82 205 82
Note: Subscript ‘1’ is for fiber longitudinal direction, ‘2’ for transverse direction, and ‘T’ for tension, ‘C’ for compression, ‘S’ for shear.
NASA/TM—2010-216372 6

3.1.1 Failure Criteria For the elements which compose the fiber tows, developing methods to predict the initiation and
propagation of damage are required. An existing ABAQUS fiber-reinforced composite material model was used in this paper to predict the damage and failure of the fiber tows. The details of this ABAQUS material model are summarized below. Complete details concerning the material model can be found in the ABAQUS user documentation (ABAQUS, 2005). To predict the initiation of damage, the plane stress two-dimensional Hashin failure criterion (Hashin, 1973) was utilized. As listed in Table 5, in the Hashin criterion four different failure modes are considered, which correspond to tensile or compressive failure of the fiber and matrix. The material strength parameters used in the equations listed in the table were computed by the equations of Chamis’s Model shown in Equation (2). The material degradation is assumed to begin once one of the Hashin failure criteria functions identified in Table 5 reaches a value greater than or equal to one.
TABLE 5.—FAILURE CRITERIA FOR FIBER TOWS
Tensile fiber mode 11 0σ > 22
11 12
1
tf
T Se
F F⎛ ⎞⎛ ⎞σ σ
= + α⎜ ⎟⎜ ⎟⎝ ⎠ ⎝ ⎠
Compressive fiber mode 11 0σ < 2
11
1
cf
Ce
F⎛ ⎞σ
= ⎜ ⎟⎝ ⎠
Tensile matrix mode 22 0σ > 22
22 12
2
tm
T Se
F F⎛ ⎞⎛ ⎞σ σ
= + ⎜ ⎟⎜ ⎟⎝ ⎠ ⎝ ⎠
Compressive matrix mode 22 0σ < 2 2
22 2 22 12
21
2 2Cc
mS S C
FeF F F F
⎡ ⎤⎛ ⎞ ⎛ ⎞ ⎛ ⎞ ⎛σ σ⎢ ⎥= + − +⎜ ⎟ ⎜ ⎟ ⎜ ⎟ ⎜⎢ ⎥⎝ ⎠ ⎝ ⎠ ⎝ ⎠ ⎝⎣ ⎦
2
S
⎞σ⎟⎠
When value of ‘em,f’ equals to ‘1’ triggers the damage initiation.
3.1.2 Progressive Degradation Model After the initiation of damage, the progression of damage is characterized by material stiffness
degradation, leading to material failure (Matzenmiller, 1995). Imposing stiffness degradation over a range of increasing strain, representing softening and fracture energy dissipation, as opposed to an abrupt failure of the elements, has been found to be a more reasonable approach (Hufner, 2009), since the implementation of a degradation model is designed to more accurately simulate the process of failure and to improve the convergence of the numerical analysis by the implicit finite element solver.
An anisotropic damage evolution law is used to take into account the four different failure modes (fiber- or matrix-driven tensile or compressive failure). It can model damage evolution for elastic brittle materials with anisotropic behavior, such as fiber-reinforced materials. Four damage variables, t
fd , cfd ,
and , describe damage for each failure mode based on energy dissipation. The stiffness matrix for the damaged material is computed as follows
tmd c
md
1 21 1
12 2 2
(1 ) (1 )(1 ) 01 (1 )(1 ) (1 ) 0
0 0 (1
f f m
d f m m
s
d E d d v EC d d v E d E
Dd GD
− − −⎡ ⎤⎢ ⎥= − − −⎢ ⎥⎢ ⎥−⎣ ⎦)
(3)
where 21 121 (1 )(1 )f mD d d v v= − − − , and df, dm and ds are the internal variables characterizing fiber, matrix and shear damage, respectively. The values of these variables can be computed using the expressions shown below, based on the fact that there are assumed to be four failure modes (fiber tensile
NASA/TM—2010-216372 7
and compressive failure, matrix tensile and compressive failure) possible for the composite. Once damage occurs for at least one mode, it will affect the criteria for damage initiation of other modes.
⎪⎩
⎪⎨⎧
cf
tf
f dd
d 11
11
00
σ >σ <
(4.1)
22
22
0
0
tm
m cm
dd
d
⎧ σ >⎪= ⎨σ <⎪⎩
(4.2)
1 (1 )(1 )(1 )(1 )t c t cs f f md d d d d= − − − − − m (4.3)
The damage variable for a particular mode is computed by using the following expression:
( )( )
0
0
feq eq eq
feq eq eq
dδ δ − δ
=δ δ − δ
(5)
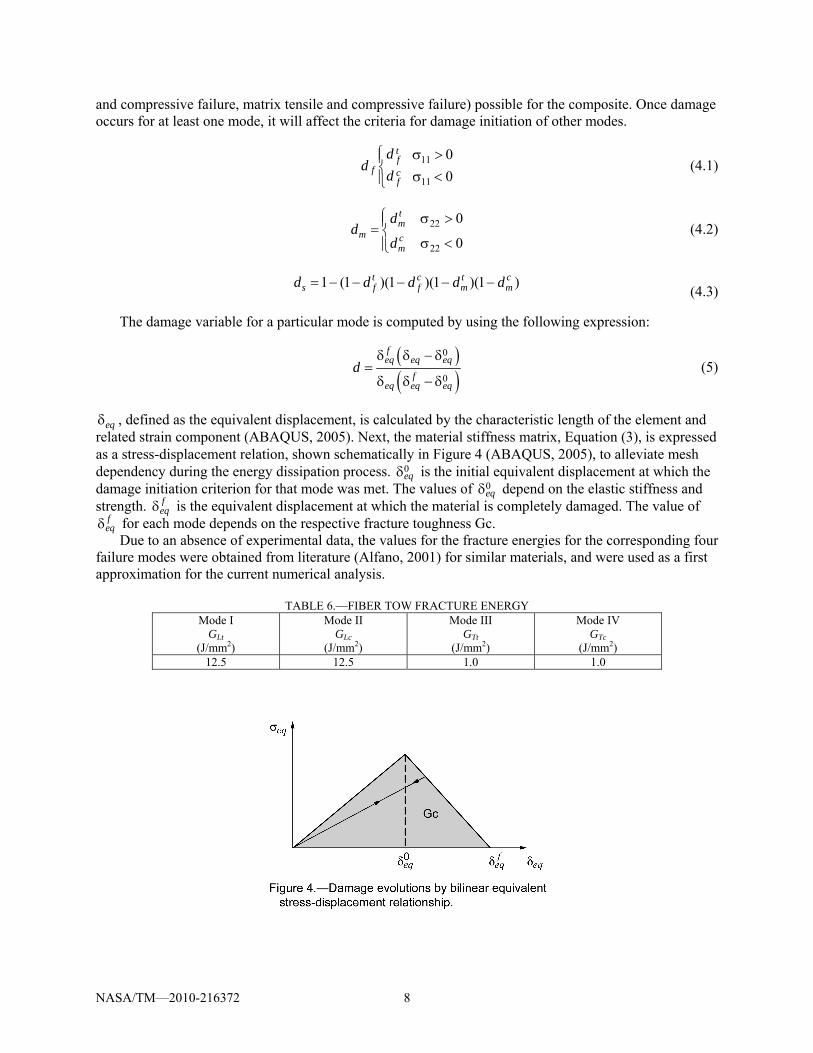
eq , defined as the equivalent displacement, is calculated by the characteristic length of the element and related strain component (ABAQUS, 2005). Next, the material stiffness matrix, Equation (3), is expressed as a stress-displacement relation, shown schematically in Figure 4 (ABAQUS, 2005), to alleviate mesh dependency during the energy dissipation process.
δ
0eqδ is the initial equivalent displacement at which the
damage initiation criterion for that mode was met. The values of 0eqδ depend on the elastic stiffness and
strength. feqδ is the equivalent displacement at which the material is completely damaged. The value of
feqδ for each mode depends on the respective fracture toughness Gc.
Due to an absence of experimental data, the values for the fracture energies for the corresponding four failure modes were obtained from literature (Alfano, 2001) for similar materials, and were used as a first approximation for the current numerical analysis.
TABLE 6.—FIBER TOW FRACTURE ENERGY Mode I
GLt (J/mm2)
Mode II GLc
(J/mm2)
Mode III GTt
(J/mm2)
Mode IV GTc
(J/mm2) 12.5 12.5 1.0 1.0
NASA/TM—2010-216372 8
3.2 Phase II: Matrix
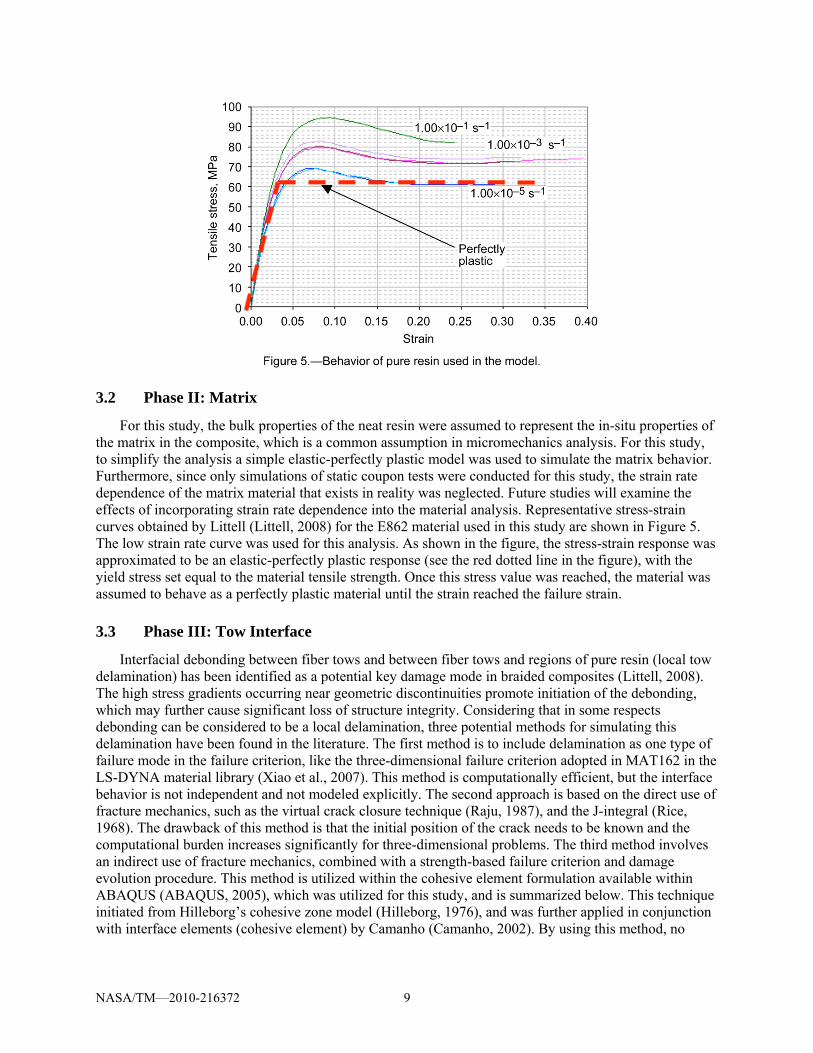
For this study, the bulk properties of the neat resin were assumed to represent the in-situ properties of the matrix in the composite, which is a common assumption in micromechanics analysis. For this study, to simplify the analysis a simple elastic-perfectly plastic model was used to simulate the matrix behavior. Furthermore, since only simulations of static coupon tests were conducted for this study, the strain rate dependence of the matrix material that exists in reality was neglected. Future studies will examine the effects of incorporating strain rate dependence into the material analysis. Representative stress-strain curves obtained by Littell (Littell, 2008) for the E862 material used in this study are shown in Figure 5. The low strain rate curve was used for this analysis. As shown in the figure, the stress-strain response was approximated to be an elastic-perfectly plastic response (see the red dotted line in the figure), with the yield stress set equal to the material tensile strength. Once this stress value was reached, the material was assumed to behave as a perfectly plastic material until the strain reached the failure strain.
3.3 Phase III: Tow Interface
Interfacial debonding between fiber tows and between fiber tows and regions of pure resin (local tow delamination) has been identified as a potential key damage mode in braided composites (Littell, 2008). The high stress gradients occurring near geometric discontinuities promote initiation of the debonding, which may further cause significant loss of structure integrity. Considering that in some respects debonding can be considered to be a local delamination, three potential methods for simulating this delamination have been found in the literature. The first method is to include delamination as one type of failure mode in the failure criterion, like the three-dimensional failure criterion adopted in MAT162 in the LS-DYNA material library (Xiao et al., 2007). This method is computationally efficient, but the interface behavior is not independent and not modeled explicitly. The second approach is based on the direct use of fracture mechanics, such as the virtual crack closure technique (Raju, 1987), and the J-integral (Rice, 1968). The drawback of this method is that the initial position of the crack needs to be known and the computational burden increases significantly for three-dimensional problems. The third method involves an indirect use of fracture mechanics, combined with a strength-based failure criterion and damage evolution procedure. This method is utilized within the cohesive element formulation available within ABAQUS (ABAQUS, 2005), which was utilized for this study, and is summarized below. This technique initiated from Hilleborg’s cohesive zone model (Hilleborg, 1976), and was further applied in conjunction with interface elements (cohesive element) by Camanho (Camanho, 2002). By using this method, no
NASA/TM—2010-216372 9
information on an initial crack needs to be known, and the onset of crack initiation can be predicted within a preset cohesive zone, which is considered to be a potential crack propagation path. This method is particularly suitable to problems such as braided composites, where the fiber tow interface is relatively weak when compared with the adjoining material.
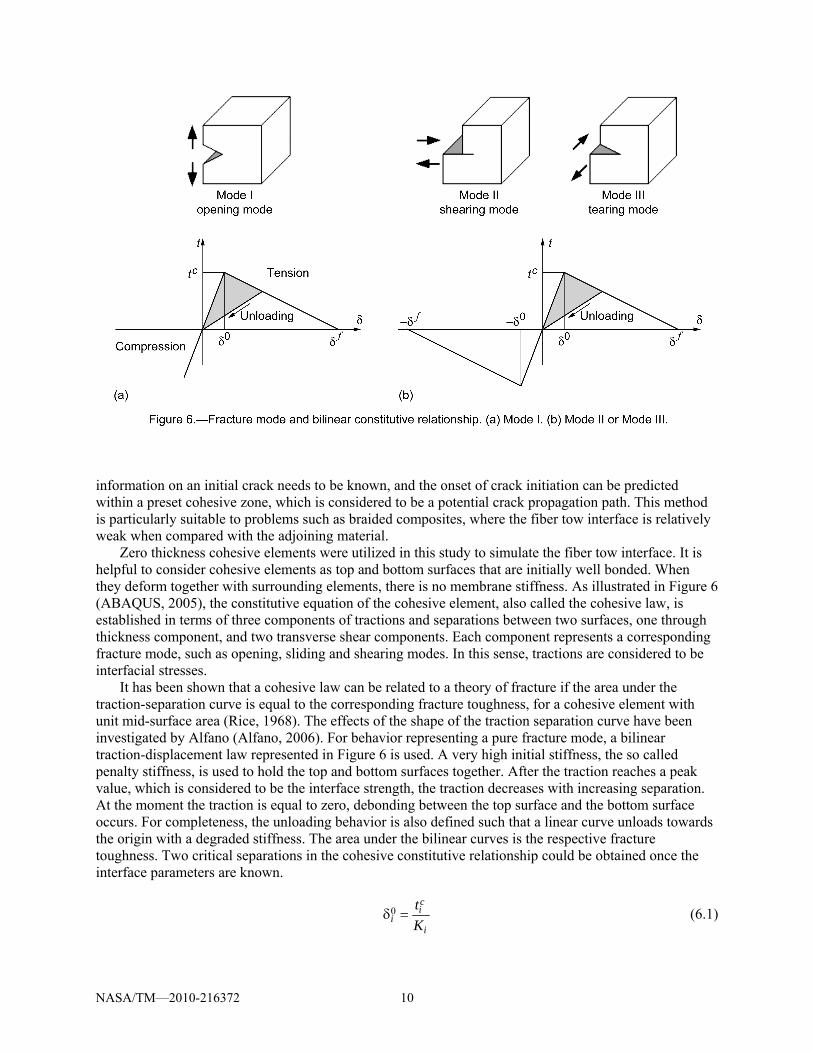
Zero thickness cohesive elements were utilized in this study to simulate the fiber tow interface. It is helpful to consider cohesive elements as top and bottom surfaces that are initially well bonded. When they deform together with surrounding elements, there is no membrane stiffness. As illustrated in Figure 6 (ABAQUS, 2005), the constitutive equation of the cohesive element, also called the cohesive law, is established in terms of three components of tractions and separations between two surfaces, one through thickness component, and two transverse shear components. Each component represents a corresponding fracture mode, such as opening, sliding and shearing modes. In this sense, tractions are considered to be interfacial stresses.
It has been shown that a cohesive law can be related to a theory of fracture if the area under the traction-separation curve is equal to the corresponding fracture toughness, for a cohesive element with unit mid-surface area (Rice, 1968). The effects of the shape of the traction separation curve have been investigated by Alfano (Alfano, 2006). For behavior representing a pure fracture mode, a bilinear traction-displacement law represented in Figure 6 is used. A very high initial stiffness, the so called penalty stiffness, is used to hold the top and bottom surfaces together. After the traction reaches a peak value, which is considered to be the interface strength, the traction decreases with increasing separation. At the moment the traction is equal to zero, debonding between the top surface and the bottom surface occurs. For completeness, the unloading behavior is also defined such that a linear curve unloads towards the origin with a degraded stiffness. The area under the bilinear curves is the respective fracture toughness. Two critical separations in the cohesive constitutive relationship could be obtained once the interface parameters are known.
0ci
ii
tK
δ = (6.1)
NASA/TM—2010-216372 10
2f ii c
i
Gt
δ =c
(6.2)
where is the interfacial strength, cit iK is the penalty stiffness and is the interface fracture toughness. iG
For the triaxially braided composite being investigated in this study, the three interfacial strengths are assumed to be equal to the respective fiber tow transverse strengths shown in Table 4. A very large value was used for the penalty stiffness K (106) to keep the top and bottom faces together in the elastic region. The fracture toughness can be measured by a single-mode fracture test carried out on simple specimens, such as a double cantilever beam test (DCB) for the opening mode, an end-notched flexure test (ENF) for the sliding mode and a splitted DCB test (SDCB) for tearing mode. Due to lack of the relevant experimental data for this material, literature values in Table 7 obtained by Alfano (Alfano 2006), for a composite composed of a carbon fiber impregnated by an epoxy resin, were used for this study.
TABLE 7.—INTERFACE FRACTURE TOUGHNESS (J/mm2) Mode I
Gn Mode II
Gs Mode III
Gt 0.268 1.45 1.45
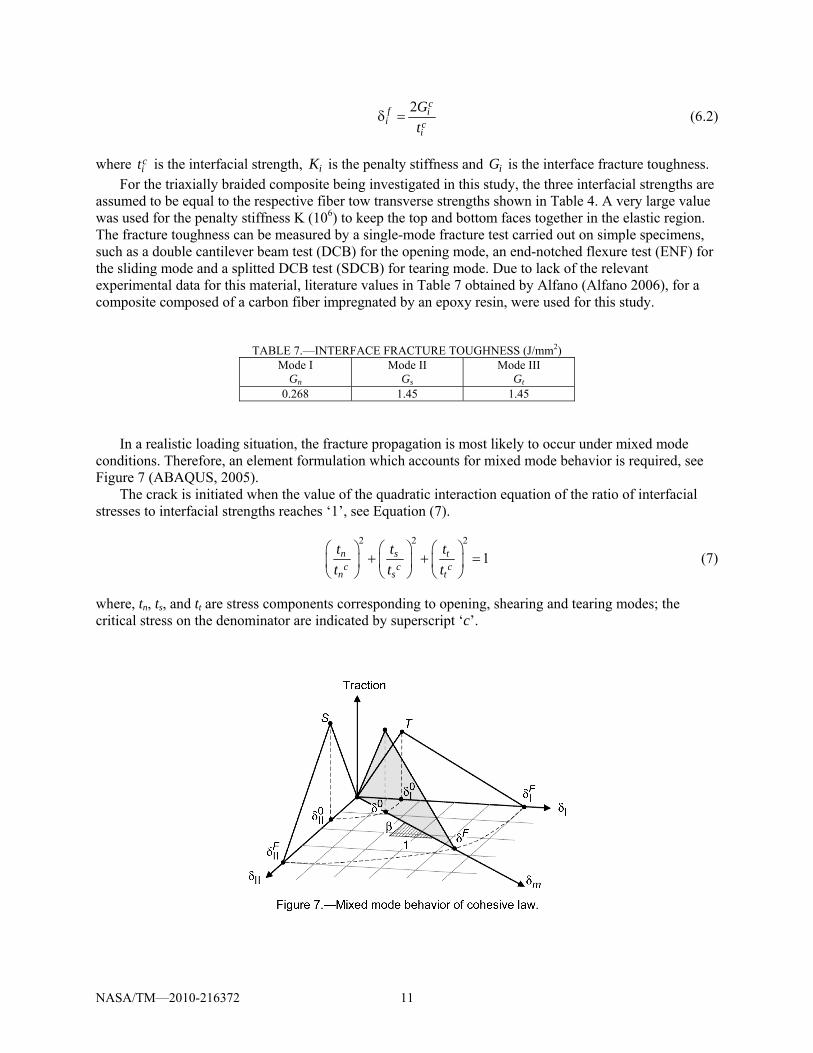
In a realistic loading situation, the fracture propagation is most likely to occur under mixed mode conditions. Therefore, an element formulation which accounts for mixed mode behavior is required, see Figure 7 (ABAQUS, 2005).
The crack is initiated when the value of the quadratic interaction equation of the ratio of interfacial stresses to interfacial strengths reaches ‘1’, see Equation (7).
2 2 2
1n s tc c c
n s t
t t tt t t
⎛ ⎞ ⎛ ⎞ ⎛ ⎞+ + =⎜ ⎟ ⎜ ⎟ ⎜ ⎟
⎝ ⎠ ⎝ ⎠ ⎝ ⎠ (7)
where, tn, ts, and tt are stress components corresponding to opening, shearing and tearing modes; the critical stress on the denominator are indicated by superscript ‘c’.
NASA/TM—2010-216372 11
Damage evolution is defined based on fracture energy. Linear softening behavior is utilized. The dependency of fracture energy on mixed fracture modes is expressed by the widely used BK formulation (Benzeggagh and Kenane, 1996), which gives an analytical formula shown in Equation (8).
( )C Cs tC C C C
n s n C C Cn s t
G GG G G GG G G
η⎧ ⎫+
= + − ⎨ ⎬+ +⎩ ⎭
(8)
where, Gn, Gs and Gt are the work done by tractions and their conjugate relative displacements corresponding to opening, shearing and tearing modes respectively. The power, η, is a material parameter, here selected to 1.45 for a carbon fiber composite (Benzeggagh and Kenane, 1996).
4.0 Specimen Test for 60°/0°/–60° Braided Composite Static tensile tests on 0°/±60° braided composite specimens for both material systems considered in
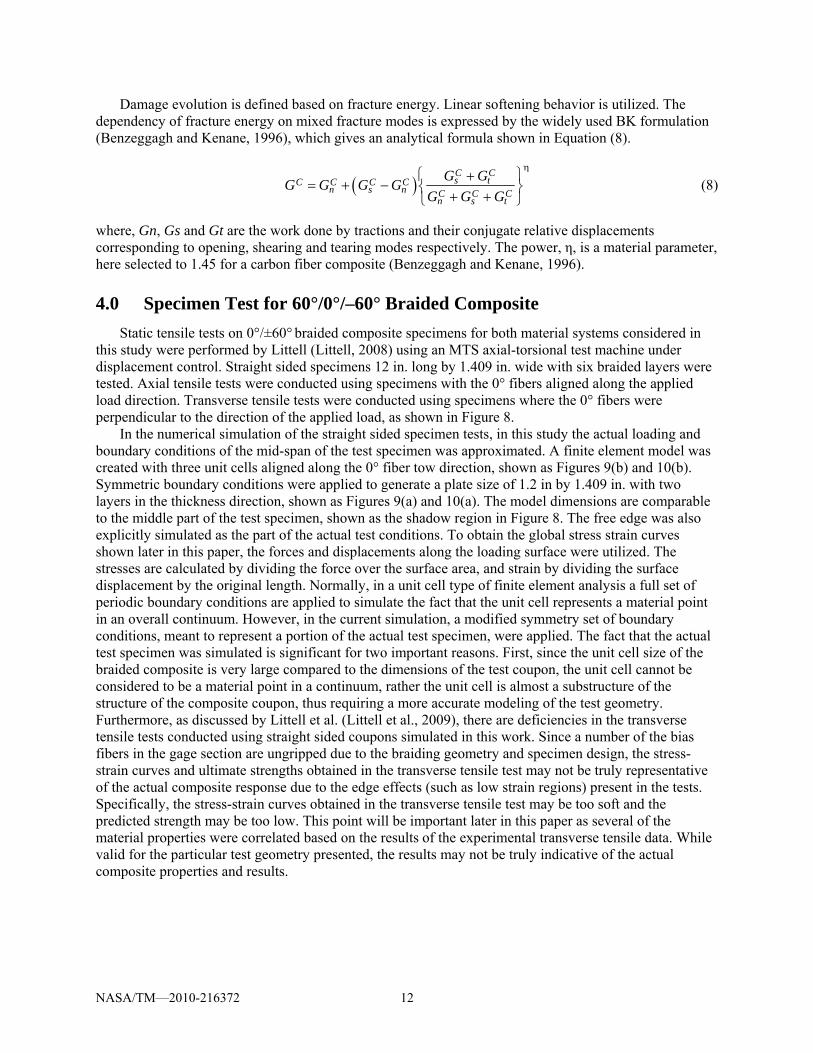
this study were performed by Littell (Littell, 2008) using an MTS axial-torsional test machine under displacement control. Straight sided specimens 12 in. long by 1.409 in. wide with six braided layers were tested. Axial tensile tests were conducted using specimens with the 0° fibers aligned along the applied load direction. Transverse tensile tests were conducted using specimens where the 0° fibers were perpendicular to the direction of the applied load, as shown in Figure 8.
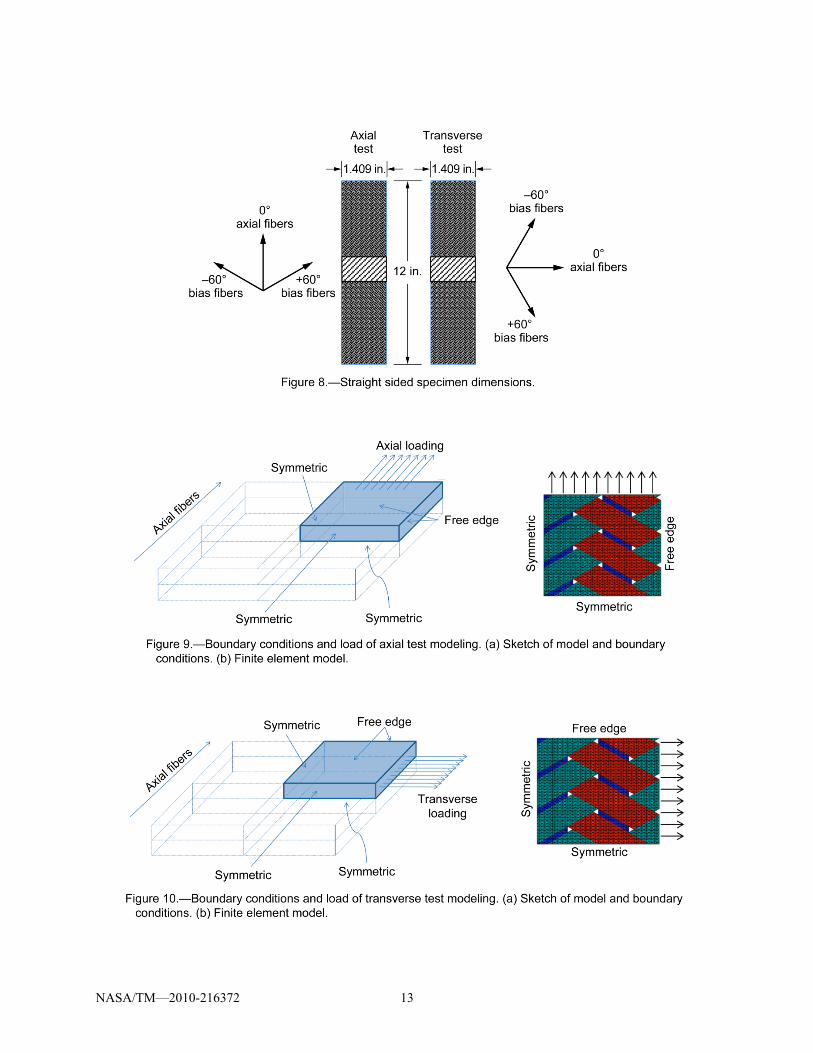
In the numerical simulation of the straight sided specimen tests, in this study the actual loading and boundary conditions of the mid-span of the test specimen was approximated. A finite element model was created with three unit cells aligned along the 0° fiber tow direction, shown as Figures 9(b) and 10(b). Symmetric boundary conditions were applied to generate a plate size of 1.2 in by 1.409 in. with two layers in the thickness direction, shown as Figures 9(a) and 10(a). The model dimensions are comparable to the middle part of the test specimen, shown as the shadow region in Figure 8. The free edge was also explicitly simulated as the part of the actual test conditions. To obtain the global stress strain curves shown later in this paper, the forces and displacements along the loading surface were utilized. The stresses are calculated by dividing the force over the surface area, and strain by dividing the surface displacement by the original length. Normally, in a unit cell type of finite element analysis a full set of periodic boundary conditions are applied to simulate the fact that the unit cell represents a material point in an overall continuum. However, in the current simulation, a modified symmetry set of boundary conditions, meant to represent a portion of the actual test specimen, were applied. The fact that the actual test specimen was simulated is significant for two important reasons. First, since the unit cell size of the braided composite is very large compared to the dimensions of the test coupon, the unit cell cannot be considered to be a material point in a continuum, rather the unit cell is almost a substructure of the structure of the composite coupon, thus requiring a more accurate modeling of the test geometry. Furthermore, as discussed by Littell et al. (Littell et al., 2009), there are deficiencies in the transverse tensile tests conducted using straight sided coupons simulated in this work. Since a number of the bias fibers in the gage section are ungripped due to the braiding geometry and specimen design, the stress-strain curves and ultimate strengths obtained in the transverse tensile test may not be truly representative of the actual composite response due to the edge effects (such as low strain regions) present in the tests. Specifically, the stress-strain curves obtained in the transverse tensile test may be too soft and the predicted strength may be too low. This point will be important later in this paper as several of the material properties were correlated based on the results of the experimental transverse tensile data. While valid for the particular test geometry presented, the results may not be truly indicative of the actual composite properties and results.
NASA/TM—2010-216372 12
NASA/TM—2010-216372 13
To investigate the effects of the interface on the effective response of the model, three different interfacial conditions were simulated; perfect, moderate and weak interfaces. The moderate and weak interfaces were designed to investigate the effects of a non-perfect bond, and are differentiated by the interfacial strengths of the cohesive elements. The strength of the weak interface was assumed to be equal to the transverse strength of the fiber tows, as computed in Table 4. Since both the interface strengths and the fiber tow transverse strengths are matrix dominated, they would be of the same order-of-magnitude, thus they were initially assumed to be the same for the case of a weak interface. The interfacial strength of the model with a “moderate” interface was set to be double the value used for the weak interface model, to investigate the effects of varying interfacial strength. In the perfect interface model, meant to simulate the case of a perfect bond, there were no cohesive elements or interface zone applied; instead node sharing was used on the contacting surfaces of the fiber tows.
The goal of the model correlation was to match the experimental effective stress-strain curves and the sequence of damage. The study was separated into two parts. In the first part, model correlation was conducted on the T700s/E862 composite, which experimental evidence indicated (Littell, 2008) has a moderate interface. By simulating the axial and transverse tensile response of this material, the interface effect was also investigated by comparing the results obtained by applying all three of the previously discussed interfacial conditions. In the second part of the study, the axial and transverse tensile response of the T700s/PR520 system, which experimental evidence indicated had a strong interfacial bond (Littell 2008), was simulated by using the “perfect” interface model.
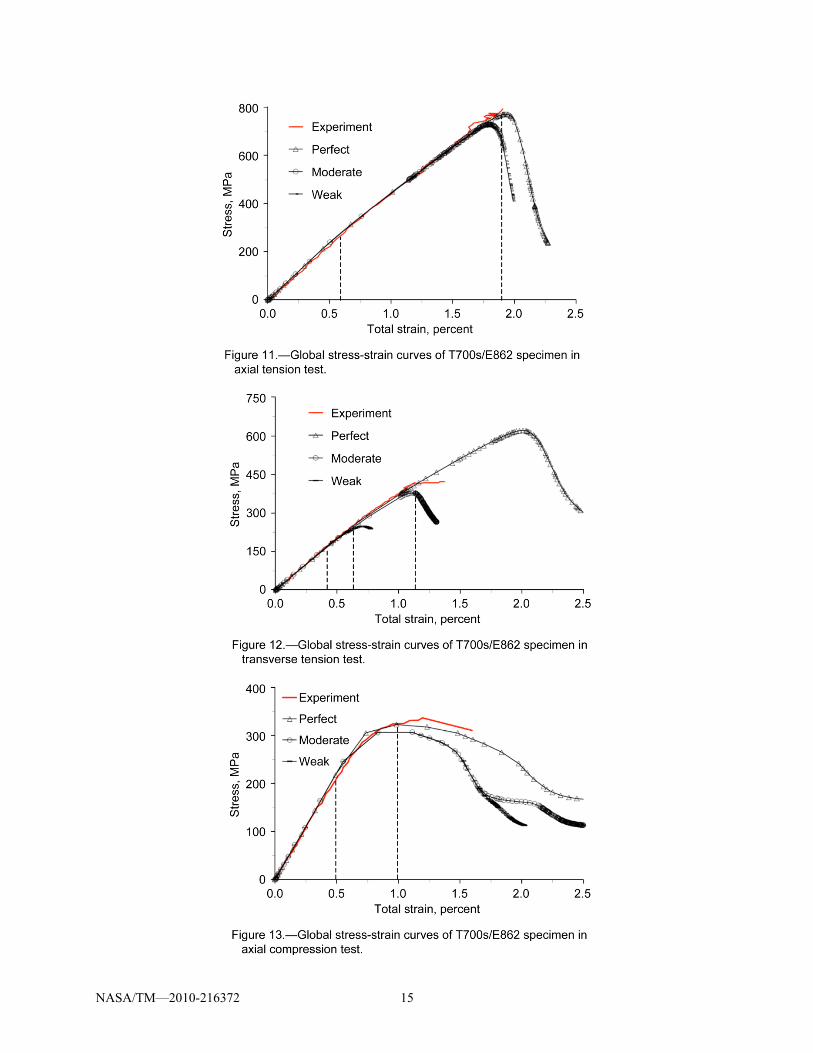
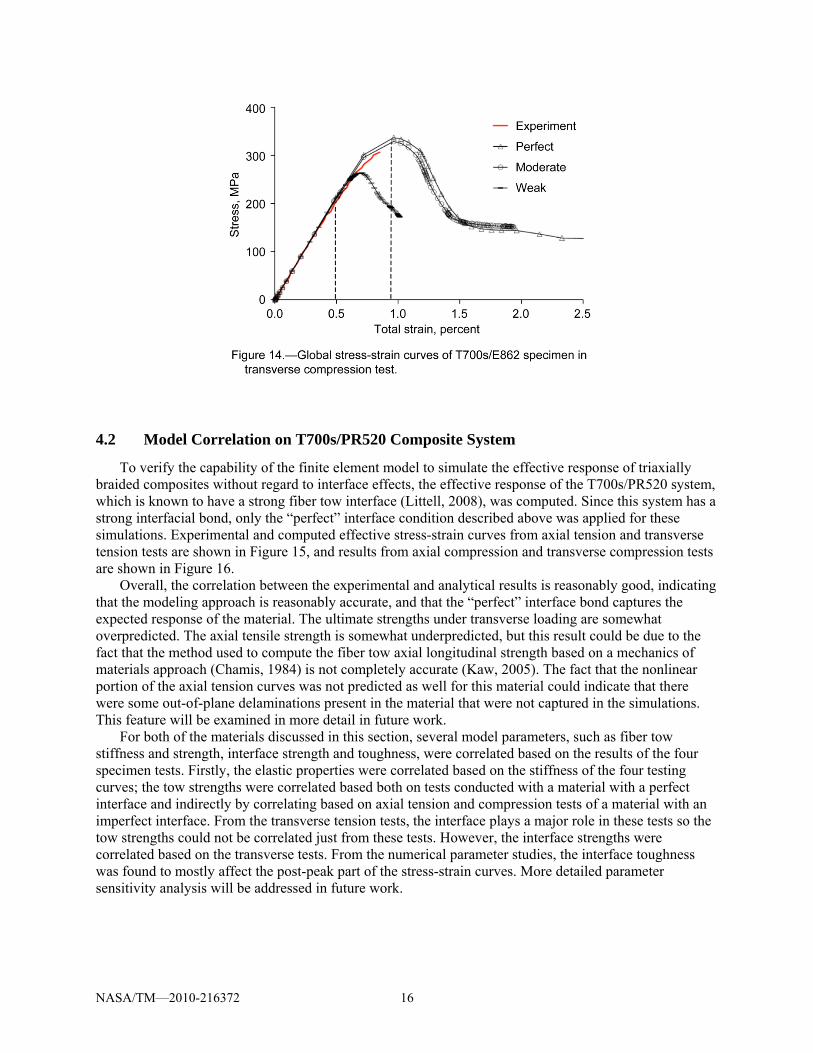
4.1 Model Correlation of the T700s/E862 Composite
The model correlations for the T700s/E862 composite are shown in Figures 11 to 14. Figure 11 shows the experimental results and computed values from an axial tension test, Figure 12 shows the results from a transverse tension test, Figure 13 shows the results from an axial compression test and Figure 14 shows the results from a transverse compression test. For all of the conditions shown in Figures 11 to 14, the linear portions of the simulated curves correlate very well with the experimental results.
For the axial tension tests shown in Figure 11 and the axial compression tests shown in Figure 13, the nonlinear portion of the computed stress-strain curves and the computed ultimate strength correlated well with the experimental results, indicating that the damage and failure model applied for the fiber tows was reasonably accurate. Further discussions on the simulated nonlinearity in the stress-strain curves will be given in the next section. The extended unloading observed in the computed stress-strain curves is most likely a numerical artifact, as the experimental specimens most likely had a more brittle fiber failure, while the computed curves had a more gradual unloading to promote numerical stability. Varying the interfacial conditions also had a negligible effect on the computed results, which is reasonable since under axial loading conditions the 0° fibers should take the majority of the load, and interfacial effects should not be significant when 0° fibers are loaded axially.
For the transverse tension tests shown in Figure 12 and the transverse compression tests shown in Figure 14, the nonlinearity in the stress-strain curves observed in the experimental results was once again captured reasonably well in the simulations. In these tests, varying the strength of the interface had a significant effect on the predicted ultimate strength of the composite, with lower interfacial strengths resulting in a weaker ultimate strength of the material. These results are reasonable since under a transverse loading condition both the axial and bias fibers carry significant portions of the load transverse to the fiber axis, which would result in the interface playing a significant role in the material response, with a stronger interface being able to carry more load. The results computed using the “moderate” interface appeared to correlate the best with the experimental values, which is reasonable since this material has been identified as having a moderately strong interface through experimental investigations (Littell, 2008). Overall, the developed model appears to have the capability to capture the effects of varying interfacial strength on the global stress-strain response of a braided composite.
NASA/TM—2010-216372 14
NASA/TM—2010-216372 15
4.2 Model Correlation on T700s/PR520 Composite System
To verify the capability of the finite element model to simulate the effective response of triaxially braided composites without regard to interface effects, the effective response of the T700s/PR520 system, which is known to have a strong fiber tow interface (Littell, 2008), was computed. Since this system has a strong interfacial bond, only the “perfect” interface condition described above was applied for these simulations. Experimental and computed effective stress-strain curves from axial tension and transverse tension tests are shown in Figure 15, and results from axial compression and transverse compression tests are shown in Figure 16.
Overall, the correlation between the experimental and analytical results is reasonably good, indicating that the modeling approach is reasonably accurate, and that the “perfect” interface bond captures the expected response of the material. The ultimate strengths under transverse loading are somewhat overpredicted. The axial tensile strength is somewhat underpredicted, but this result could be due to the fact that the method used to compute the fiber tow axial longitudinal strength based on a mechanics of materials approach (Chamis, 1984) is not completely accurate (Kaw, 2005). The fact that the nonlinear portion of the axial tension curves was not predicted as well for this material could indicate that there were some out-of-plane delaminations present in the material that were not captured in the simulations. This feature will be examined in more detail in future work.
For both of the materials discussed in this section, several model parameters, such as fiber tow stiffness and strength, interface strength and toughness, were correlated based on the results of the four specimen tests. Firstly, the elastic properties were correlated based on the stiffness of the four testing curves; the tow strengths were correlated based both on tests conducted with a material with a perfect interface and indirectly by correlating based on axial tension and compression tests of a material with an imperfect interface. From the transverse tension tests, the interface plays a major role in these tests so the tow strengths could not be correlated just from these tests. However, the interface strengths were correlated based on the transverse tests. From the numerical parameter studies, the interface toughness was found to mostly affect the post-peak part of the stress-strain curves. More detailed parameter sensitivity analysis will be addressed in future work.
NASA/TM—2010-216372 16
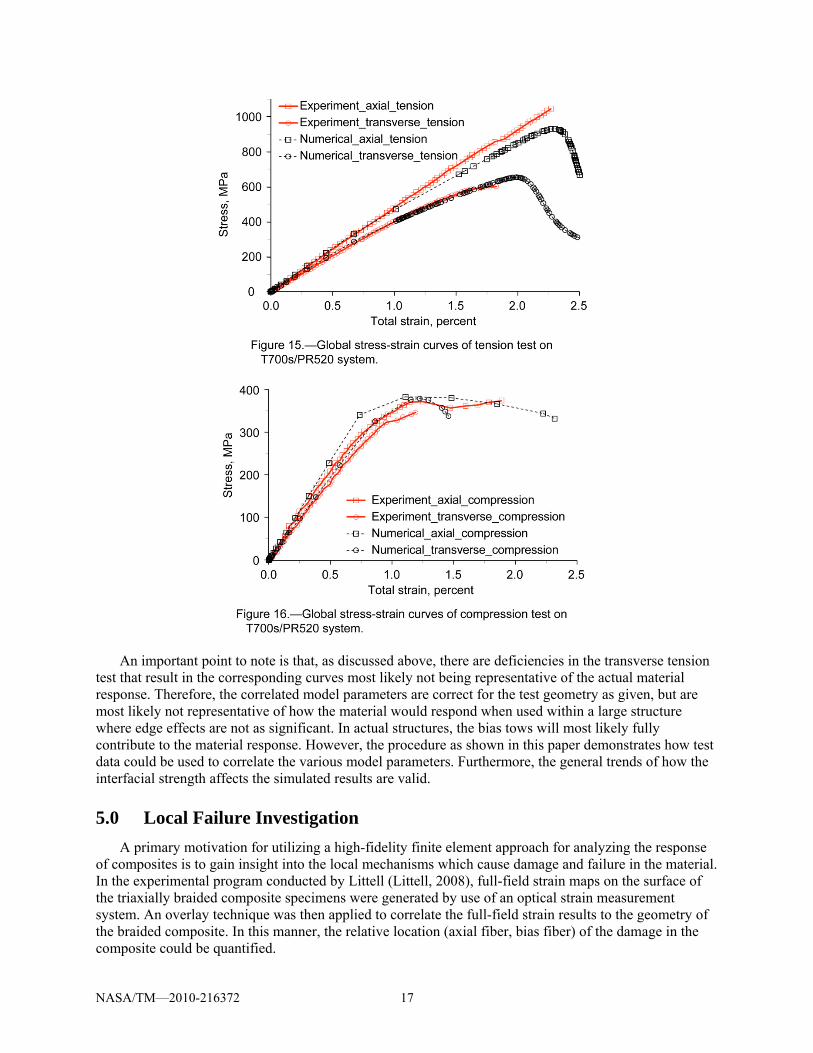
An important point to note is that, as discussed above, there are deficiencies in the transverse tension test that result in the corresponding curves most likely not being representative of the actual material response. Therefore, the correlated model parameters are correct for the test geometry as given, but are most likely not representative of how the material would respond when used within a large structure where edge effects are not as significant. In actual structures, the bias tows will most likely fully contribute to the material response. However, the procedure as shown in this paper demonstrates how test data could be used to correlate the various model parameters. Furthermore, the general trends of how the interfacial strength affects the simulated results are valid.
5.0 Local Failure Investigation A primary motivation for utilizing a high-fidelity finite element approach for analyzing the response
of composites is to gain insight into the local mechanisms which cause damage and failure in the material. In the experimental program conducted by Littell (Littell, 2008), full-field strain maps on the surface of the triaxially braided composite specimens were generated by use of an optical strain measurement system. An overlay technique was then applied to correlate the full-field strain results to the geometry of the braided composite. In this manner, the relative location (axial fiber, bias fiber) of the damage in the composite could be quantified.
NASA/TM—2010-216372 17

The numerical model developed in this study, due to its explicit modeling of the composite architecture, has the capacity to capture damage mechanisms such as fiber tow failure, matrix cracking and interfacial failure. Since the individual failure variable corresponding to a certain failure mode can be reported for each element, with the assistance of the post-processing function of ABAQUS, contour plots can be generated as field information for all elements at each computational step for different global stress or strain levels. To correlate the identified failure modes to particular damage mechanisms, the contour plots relating to failure patterns are overlaid on the undamaged mesh (Fig. 9(b) and Fig. 10(b)).
For all the contour plots in Figures 17 to 22, each plot represents one particular failure mode, which is indicated under the plot; the darkness of the color defines the status of damage, which corresponds to the value of the particular damage variable ranging from 0 to 1, shown in the left picture in Figure 16. A value of ‘0’ means damage has not occurred yet, while a value of ‘1’ means the element is totally damaged. Meanwhile, the global strain and stress values at which the contour plots were generated are shown.
For this study, the T700s/E862 material was investigated. The “moderate” interface was utilized in the numerical simulations since this interfacial condition resulted in the best correlation with the experimental results. Furthermore, by investigating a system with an imperfect interface the capability of the model to capture interfacial failure events could be quantified. Axial tension, axial compression, transverse tension and transverse compression tests were simulated.
5.1 Axial Tension Test
In the simulations of the axial tension tests shown in Figure 17, at a global strain level of 0.6 percent, failure in the bias fiber tows, indicated by the Hashin criteria to be due to matrix failure (due to large transverse tensile and shear stresses), was observed. These results correlate to observations made in the experiments, Figure 18(b), in which high strains in the bias fibers were identified at the corresponding global strain level (representing local matrix cracking within the fiber tows). These results appear to confirm that the high strains in the bias fiber identified experimentally are due to fiber splitting (local matrix cracking) within the fiber tows. As seen in the experimental axial tensile stress-strain curve shown in Figure 11, at this global strain level the stress-strain curve became nonlinear, which appears to indicate and confirm that the nonlinearity observed in the experimental global stress strain curve (and predicted numerically) is due to fiber splitting within the bias fiber tows. At a global strain level of 1.9 percent, fiber tow failure due to tensile fiber failure, as well as failure of the interface elements was identified. As observed in Figure 11, in the experimental axial tensile test the composite failure was identified as occurring at a global strain level of 1.9 percent. The results obtained here indicate that the ultimate failure of the composite is a result of failure of the axial fibers followed by a corresponding failure in the interface, which was also reflected in the computed effective composite response reaching its ultimate strength at this global strain level. These results are reasonable since for an axial tension test one would expect the ultimate failure of the composite to be governed by the failure of the axial fibers.
NASA/TM—2010-216372 18
5.2 Axial Compression Test
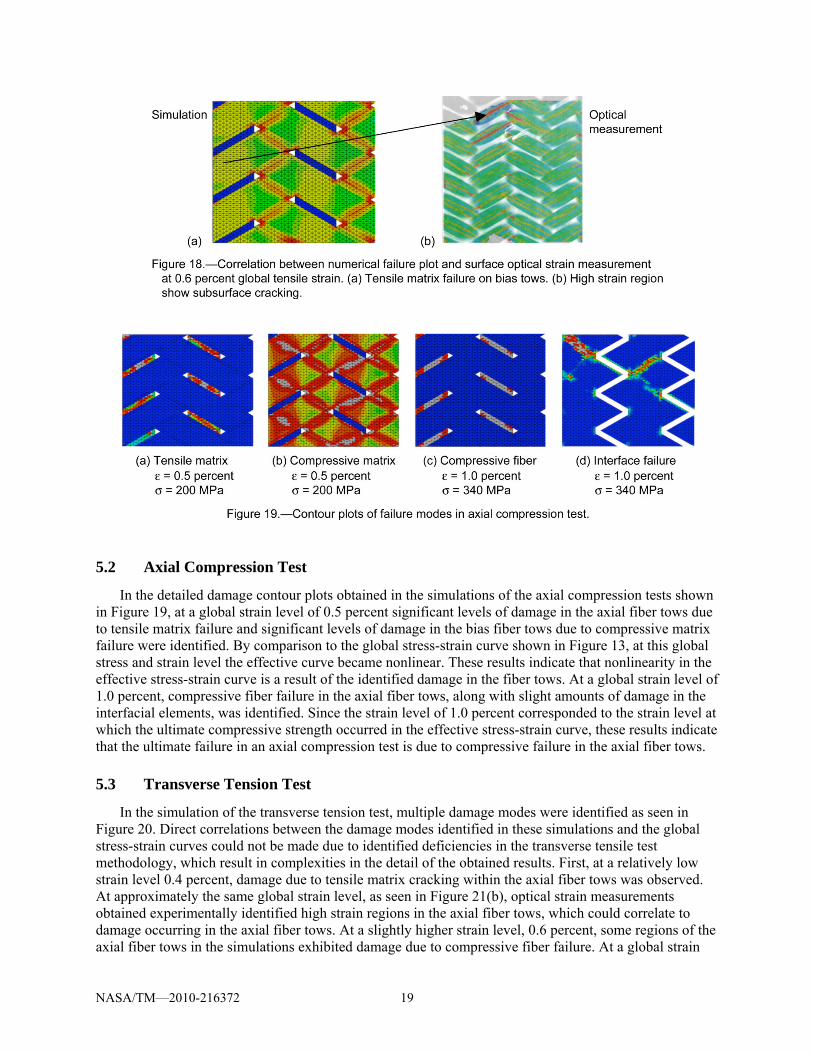
In the detailed damage contour plots obtained in the simulations of the axial compression tests shown in Figure 19, at a global strain level of 0.5 percent significant levels of damage in the axial fiber tows due to tensile matrix failure and significant levels of damage in the bias fiber tows due to compressive matrix failure were identified. By comparison to the global stress-strain curve shown in Figure 13, at this global stress and strain level the effective curve became nonlinear. These results indicate that nonlinearity in the effective stress-strain curve is a result of the identified damage in the fiber tows. At a global strain level of 1.0 percent, compressive fiber failure in the axial fiber tows, along with slight amounts of damage in the interfacial elements, was identified. Since the strain level of 1.0 percent corresponded to the strain level at which the ultimate compressive strength occurred in the effective stress-strain curve, these results indicate that the ultimate failure in an axial compression test is due to compressive failure in the axial fiber tows.
5.3 Transverse Tension Test
In the simulation of the transverse tension test, multiple damage modes were identified as seen in Figure 20. Direct correlations between the damage modes identified in these simulations and the global stress-strain curves could not be made due to identified deficiencies in the transverse tensile test methodology, which result in complexities in the detail of the obtained results. First, at a relatively low strain level 0.4 percent, damage due to tensile matrix cracking within the axial fiber tows was observed. At approximately the same global strain level, as seen in Figure 21(b), optical strain measurements obtained experimentally identified high strain regions in the axial fiber tows, which could correlate to damage occurring in the axial fiber tows. At a slightly higher strain level, 0.6 percent, some regions of the axial fiber tows in the simulations exhibited damage due to compressive fiber failure. At a global strain
NASA/TM—2010-216372 19

level of 1.2 percent, failure occurred in the simulations, which according to the damage contour plots was due to a combination of tensile matrix cracking in the all of the fiber tows, which would be expected in a transverse tensile test, and interfacial failure, which would be expected in a material with a weaker interfacial bond.
5.4 Transverse Compression Test
In the simulations of a transverse compression test shown in Figure 22, damage due to matrix compressive failure in the fiber tows was identified as occurring first, followed by compressive failure in the fiber tows at the point of ultimate failure. Some interfacial failure was identified as occurring along the edges of the specimen.
NASA/TM—2010-216372 20
From the detailed analysis of failure process for each test, together with the section of this report describing the correlation of the global stress-strain curves, the results indicate that the presented model gives a good local failure prediction and can be used to explain, and correlate with, experimental measurements.
6.0 Conclusions A finite element based approach has been developed for examining the behavior of triaxially braided
polymer matrix composites. The architecture of the braided composite unit cell has been explicitly modeled. A transversely isotropic constitutive, damage and failure model has been utilized for the fiber tows. A cohesive element approach has been applied to model the imperfect interfaces between fiber tows and between the fiber tows and regions of pure matrix.
The global stress-strain response of two representative triaxially braided composite systems has been simulated, with reasonably good correlations obtained with experimentally obtained results. The effects of varying the strength of the interface on the simulations of the global response have been identified. By examining detailed contour plots of the simulated damage and failure within the composite, the progression of damage and failure within the composite has been identified, and in many cases correlations between the local damage mechanisms and details of the effective stress-strain response could be made.
By utilizing a modeling approach of this type, numerical experiments could be performed on a braided composite system for situations where experimental data is not available, such as tests at high strain rates. Furthermore, by studying the details of the local damage and failure within the finite element model, significant insight could be gained into the details of the material response, which could be extremely useful in understanding the behavior of the material and developing more approximate numerical models of the material behavior.
References Aboudi J., Mechanics of Composite Materials: A Unified Micromechanical Approach, Elsevier, New
York, 1991. Aboudi J., “Micromechanical Analysis of Composites by the Method of Cells—Update,” Applied
Mechanics Reviews, Vol. 49, pp. 83–91, 1996. ABAQUS version 6.7 User’s Manual. ABAQUS Inc., Pawtucket, RI, USA, 2005. Alfano G. and Crisfield M.A., “Finite Element Interface Models for the Delamination Analysis of
Laminated Composites: Mechanical and Computational Issues,” International Journal for Numerical Methods in Engineering, Vol. 50, pp. 1701–1736, 2001.
Alfano G. “On the influence of the shape of the interface law on the application of cohesive-zone models.” Composite Science and Technology, Vol. 66, pp. 723–730, 2006.
Ayranci C. and Carey J., “2D Braided Composites: A Review for Stiffness Critical Applications,” Composite Structures, Vol. 85, pp. 43–58, 2008.
Benzeggagh, M.L. and Kenane M., “Measurement of Mixed-Mode Delamination Fracture Toughness of Unidirectional Glass/Epoxy Composites with Mixed-Mode Bending Apparatus,” Composites Science and Technology, Vol. 56, pp. 439–449, 1996.
Castejon L., Miravete A. and Cuartero J., “Analytical Formulation of (0°, ±α°) Braided Composites and Its Application in Crashworthiness Simulations,” Mechanics of Composite Material and Structures, Vol. 8, pp. 219–229, 2001.
Chamis, C.C., “Simplified Composite Micromechanics Equations for Strength, Fracture Toughness, and Environmental Effects,” SAMPE Q., 15(4), pp. 41–55, July 1984.
Chou T.W. and Ko F.K., Textile Structural Composites, Elsevier, 1989.
NASA/TM—2010-216372 21
NASA/TM—2010-216372 22
Fang G.D., Liang J. and Wang B.L., “Progressive Damage and Nonlinear Analysis of 3D Four Directional Braided Composites under Unidirectional Tension,” Composite Structures, Vol. 89, pp. 126–133, 2009.
Camanho P.P. and Davila C.G., “Mixed-Mode Decohesion Finite Elements for the Simulation of Delamination in Composite Materials,” NASA/TM—2002-211737, 2002.
Hashin Z. and Rotem A., “A Fatigue Criterion for Fiber Reinforced Materials,” Journal of Composite Materials, Vol. 7, pp. 448–464. 1973.
Hilleborg A., Modeer M., and Peterson P.E., “Analysis of Crack Formation and Growth in Concrete by means of Fracture Mechanics and Finite Elements,” Cement and Concrete Research, Vol. 6, pp. 773–782, 1976.
Iannucci L., “Progressive Failure Modeling of Woven Carbon Composite under Impact,” International Journal of Impact Engineering. Vol. 32, pp. 1013–1043. 2006.
Ivanov D.S. et al., “Failure Analysis of Triaxially Braided Composite,” Composite Science and Technology, Vol. 69, pp. 1372–1380, 2009.
Kaw A.K., Mechanics of Composite Materials, 2nd edition, Taylor & Francis Group, 2006. Li X., Binienda W., and Littell J.D., “Methodology for Impact Modeling of Triaxial Braided Composites
Using Shell Elements,” Journal of Aerospace Engineering, Vol. 22, pp. 310–317, 2009. Littell J.D., et al., “Characterization of Triaxial Braided Composites using Optical Measurement
Techniques,” Journal of Aerospace Engineering, Vol. 22, pp. 270–279, 2009. Littell J.D., “The Experimental and Analytical Characterization of the Macromechanical Response for
Triaxially Braided Composite,” Ph.D dissertation, University of Akron, 2008. Lomov S.V., at el., “Meso-FE Modeling of Textile Composite: Road Map, Data Flow and Algorithms,”
Composites Science and Technology, Vol. 67, pp. 1870–1891, 2007. Madhukar M.S. and Drzal, L.T., “Fiber-Matrix Adhesion and Its Effect on Composite Properties III—
Longitudinal Compressive Properties of Graphite/Epoxy Composites,” Journal of Composite Materials, Vol. 26, pp. 310–333, 1992.
Matzenmiller A., Lubliner J. and Taylor R.L., “A Constitutive Model for Anisotropic Damage in Fiber Composites,” Mechanics of Materials, Vol. 20, pp. 125–152, 1995.
Murthy P.L.N. and Chamis C.C., “ICAN: Integrated Composite Analyzer,” AIAA Paper 84–0974, May 1984.
Raju I.S., “Calculation of Strain Energy Release Rates with Higher Order and Singular Finite Elements. Engineering Fracture Mechanics,” Vol. 28, pp. 251–274, 1987.
Rice J.R., “A Path Independent Integral and the Approximate Analysis of Strain Concentration by Notes and Cracks,” Journal of Applied Mechanics, Vol. 35, pp. 379–386, 1968.
Roberts G.D., Pereira J.M., Revilock D.M., Binienda W.K., Xie M., and Braley M., “Ballistic Impact of Composite Plates and Half-Rings with Soft Projects,” Journal of Aerospace Engineering, Vol. 18, pp. 3–7, 2005.
Xiao J.R., Gama B.A., and Gillespie Jr. J.W., “Progressive Damage and Delamination in Plain Weave S-2 Glass/SC-15 Composites under Quasi-Static Punch-Shear Loading,” Composite Structures, Vol. 78, pp. 182–196, 2007.
Zeng T., Wu L.Z. and Guo L.C., “Mechanical analysis of 3D Braided Composites: A Finite Element Model,” Composite Structures, Vol. 64, pp. 399–404, 2004.
REPORT DOCUMENTATION PAGE Form Approved OMB No. 0704-0188
The public reporting burden for this collection of information is estimated to average 1 hour per response, including the time for reviewing instructions, searching existing data sources, gathering and maintaining the data needed, and completing and reviewing the collection of information. Send comments regarding this burden estimate or any other aspect of this collection of information, including suggestions for reducing this burden, to Department of Defense, Washington Headquarters Services, Directorate for Information Operations and Reports (0704-0188), 1215 Jefferson Davis Highway, Suite 1204, Arlington, VA 22202-4302. Respondents should be aware that notwithstanding any other provision of law, no person shall be subject to any penalty for failing to comply with a collection of information if it does not display a currently valid OMB control number. PLEASE DO NOT RETURN YOUR FORM TO THE ABOVE ADDRESS. 1. REPORT DATE (DD-MM-YYYY) 01-07-2010
2. REPORT TYPE Technical Memorandum
3. DATES COVERED (From - To)
4. TITLE AND SUBTITLE Finite Element Model for Failure Study of Two-Dimensional Triaxially Braided Composite
5a. CONTRACT NUMBER
5b. GRANT NUMBER
5c. PROGRAM ELEMENT NUMBER
6. AUTHOR(S) Li, Xuetao; Binienda, Wieslaw, K.; Goldberg, Robert, K.
5d. PROJECT NUMBER
5e. TASK NUMBER
5f. WORK UNIT NUMBER WBS 698259.02.07.03.03.01
7. PERFORMING ORGANIZATION NAME(S) AND ADDRESS(ES) National Aeronautics and Space Administration John H. Glenn Research Center at Lewis Field Cleveland, Ohio 44135-3191
8. PERFORMING ORGANIZATION REPORT NUMBER E-17308
9. SPONSORING/MONITORING AGENCY NAME(S) AND ADDRESS(ES) National Aeronautics and Space Administration Washington, DC 20546-0001
10. SPONSORING/MONITOR'S ACRONYM(S) NASA
11. SPONSORING/MONITORING REPORT NUMBER NASA/TM-2010-216372
12. DISTRIBUTION/AVAILABILITY STATEMENT Unclassified-Unlimited Subject Categories: 24 and 39 Available electronically at http://gltrs.grc.nasa.gov This publication is available from the NASA Center for AeroSpace Information, 443-757-5802
13. SUPPLEMENTARY NOTES
14. ABSTRACT A new three-dimensional finite element model of two-dimensional triaxially braided composites is presented in this paper. This meso-scale modeling technique is used to examine and predict the deformation and damage observed in tests of straight sided specimens. A unit cell based approach is used to take into account the braiding architecture as well as the mechanical properties of the fiber tows, the matrix and the fiber tow-matrix interface. A 0°/±60° braiding configuration has been investigated by conducting static finite element analyses. Failure initiation and progressive degradation has been simulated in the fiber tows by use of the Hashin failure criteria and a damage evolution law. The fiber tow-matrix interface was modeled by using a cohesive zone approach to capture any fiber-matrix debonding. By comparing the analytical results to those obtained experimentally, the applicability of the developed model was assessed and the failure process was investigated. 15. SUBJECT TERMS Polymer matrix composites; Braided composites; Finite element method; Micromechanics
16. SECURITY CLASSIFICATION OF: 17. LIMITATION OF ABSTRACT UU
18. NUMBER OF PAGES
28
19a. NAME OF RESPONSIBLE PERSON STI Help Desk (email:[email protected])
a. REPORT U
b. ABSTRACT U
c. THIS PAGE U
19b. TELEPHONE NUMBER (include area code) 443-757-5802
Standard Form 298 (Rev. 8-98)Prescribed by ANSI Std. Z39-18

