finolex industries limited q3fy18 results · krishi sinchai yojana, 48 ... sindhu exhibition (agri)...
TRANSCRIPT
Q3FY18 RESULTS
FINOLEX INDUSTRIES LIMITED
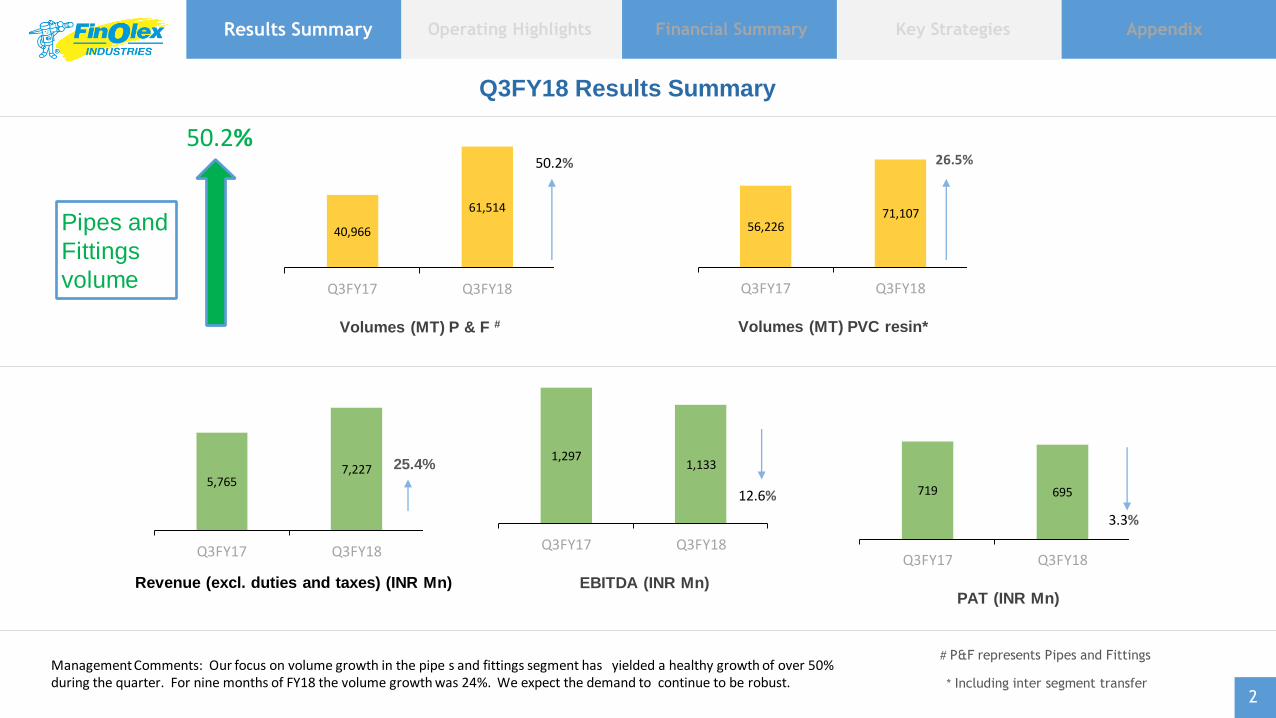
Q3FY18 Results Summary
# P&F represents Pipes and Fittings
* Including inter segment transfer
Volumes (MT) P & F #
40,966
61,514
Q3FY17 Q3FY18
50.2%
Results Summary Financial Summary Appendix Operating Highlights Key Strategies
Volumes (MT) PVC resin*
56,226 71,107
Q3FY17 Q3FY18
26.5%
5,765 7,227
Q3FY17 Q3FY18
EBITDA (INR Mn)
1,297 1,133
Q3FY17 Q3FY18
12.6%
PAT (INR Mn)
719 695
Q3FY17 Q3FY18
3.3%
25.4%
Revenue (excl. duties and taxes) (INR Mn)
Management Comments: Our focus on volume growth in the pipe s and fittings segment has yielded a healthy growth of over 50% during the quarter. For nine months of FY18 the volume growth was 24%. We expect the demand to continue to be robust.
2
Pipes and
Fittings
volume
50.2%
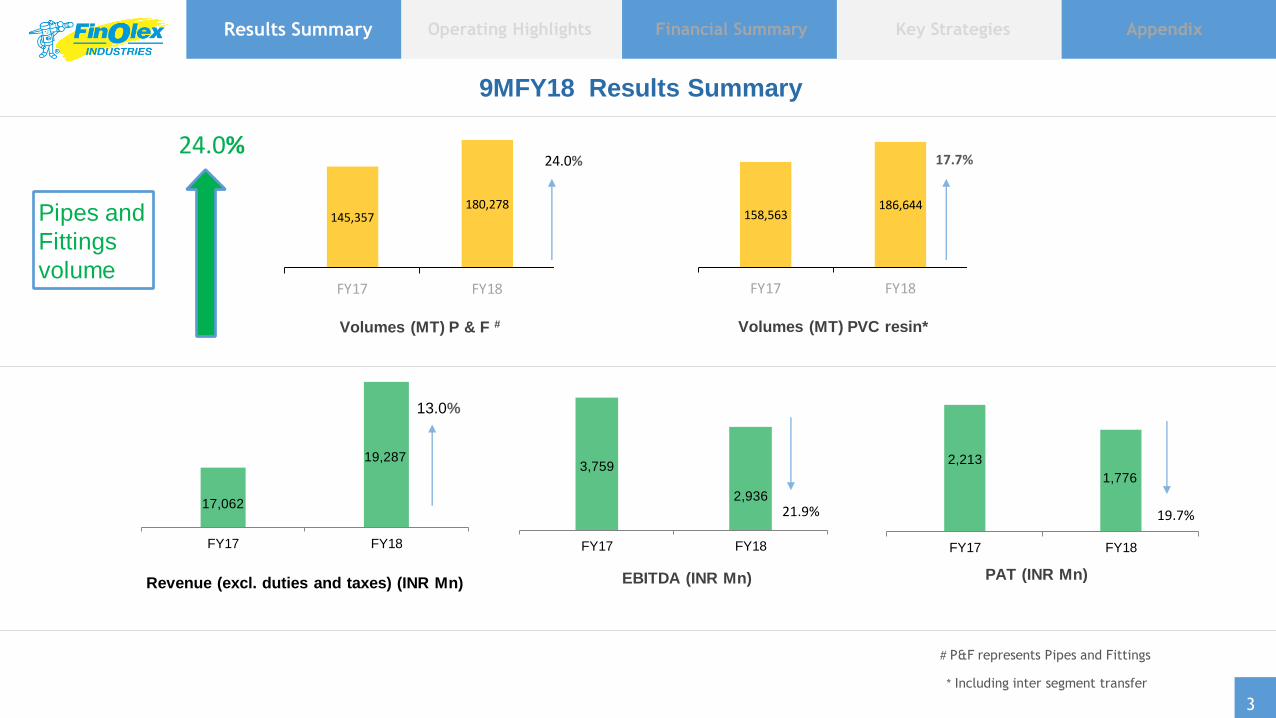
9MFY18 Results Summary
# P&F represents Pipes and Fittings
* Including inter segment transfer
Volumes (MT) P & F #
145,357 180,278
FY17 FY18
24.0%
Results Summary Financial Summary Appendix Operating Highlights Key Strategies
Volumes (MT) PVC resin*
158,563 186,644
FY17 FY18
17.7%
3
3,759
2,936
FY17 FY18
EBITDA (INR Mn)
21.9% 17,062
19,287
FY17 FY18
Revenue (excl. duties and taxes) (INR Mn)
13.0%
2,213
1,776
FY17 FY18
PAT (INR Mn)
19.7%
Pipes and
Fittings
volume
24.0%
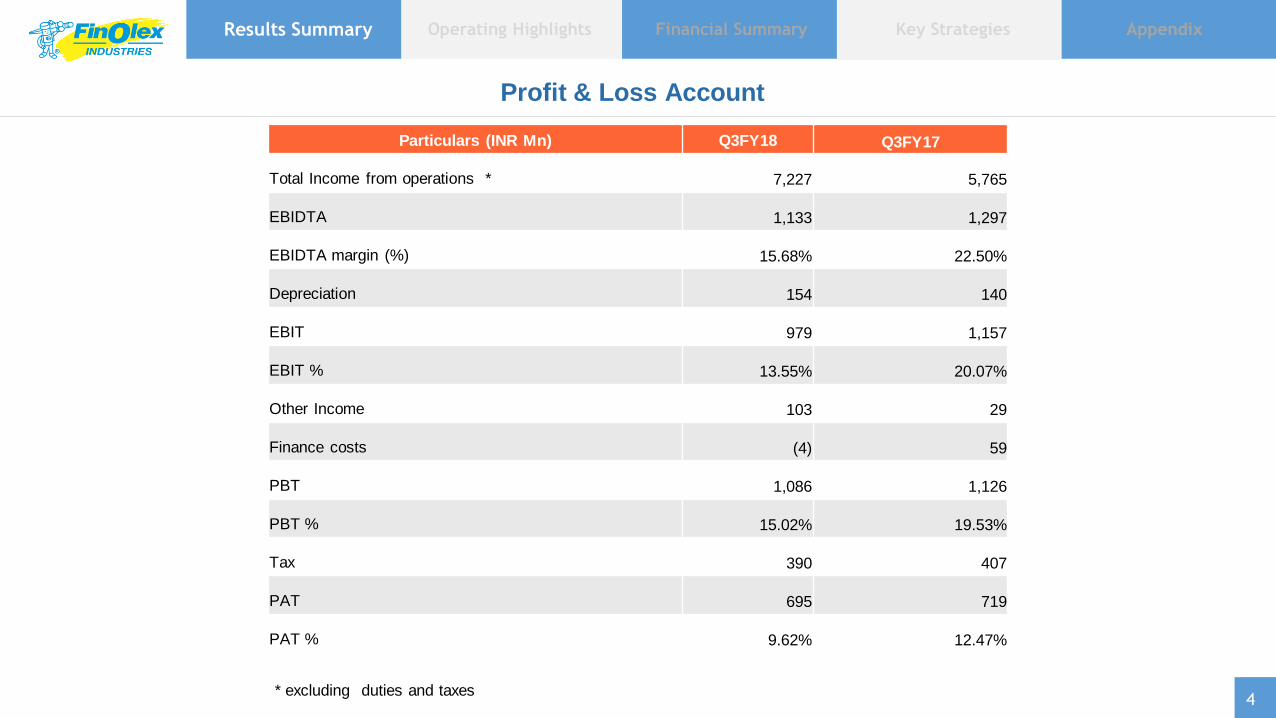
Particulars (INR Mn) Q3FY18 Q3FY17
Total Income from operations * 7,227 5,765
EBIDTA 1,133 1,297
EBIDTA margin (%) 15.68% 22.50%
Depreciation 154 140
EBIT 979 1,157
EBIT % 13.55% 20.07%
Other Income 103 29
Finance costs (4) 59
PBT 1,086 1,126
PBT % 15.02% 19.53%
Tax 390 407
PAT 695 719
PAT % 9.62% 12.47%
Results Summary Financial Summary Appendix Operating Highlights Key Strategies
Profit & Loss Account
* excluding duties and taxes 4

Particulars (INR Mn) 9MFY18 9MFY17
Total Income from operations * 19,287 17,062
EBIDTA 2,936 3,759
EBIDTA margin (%) 15.22% 22.03%
Depreciation 450 412
EBIT 2,486 3,347
EBIT % 12.89% 19.62%
Other Income 250 150
Finance costs 65 142
PBT 2,671 3,355
PBT % 13.85% 19.66%
Tax 895 1,142
PAT 1,776 2,213
PAT % 9.21% 12.97%
Results Summary Financial Summary Appendix Operating Highlights Key Strategies
Profit & Loss Account
* excluding duties and taxes 5
(INR Mn)
IND AS
Results Summary Financial Summary Appendix Operating Highlights Key Strategies
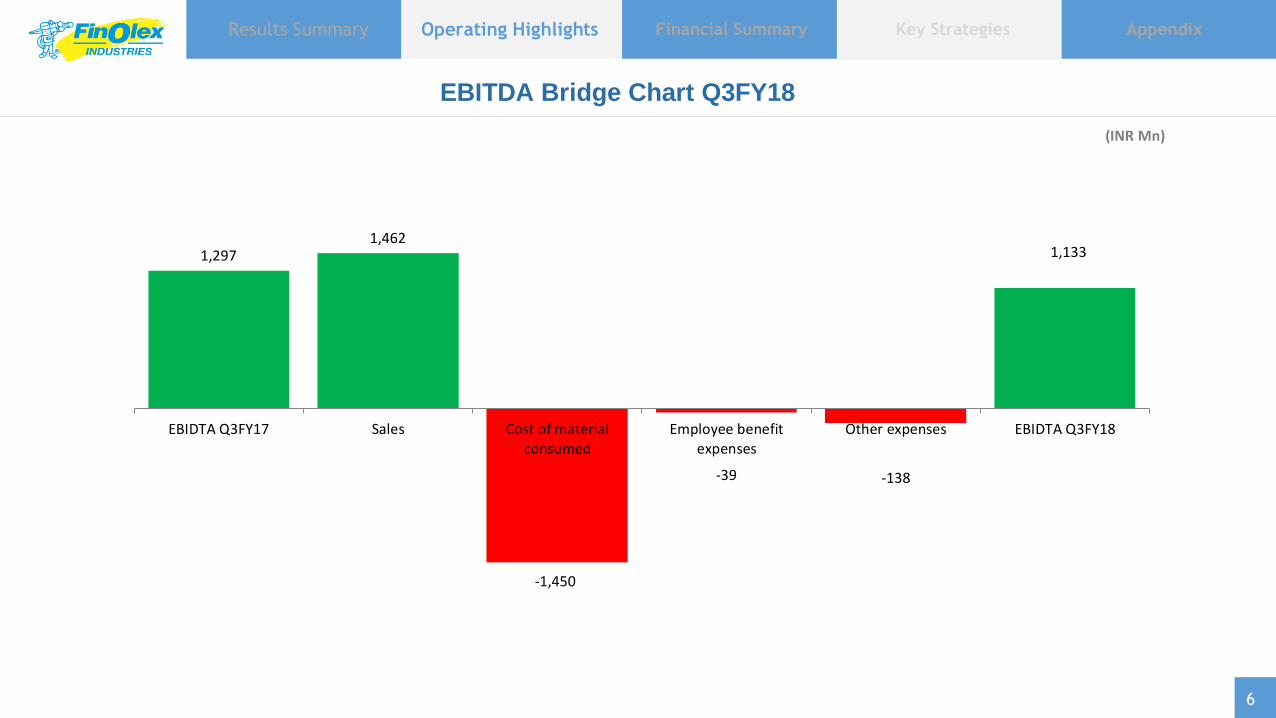
EBITDA Bridge Chart Q3FY18
6
1,297 1,462
-1,450
-39 -138
1,133
EBIDTA Q3FY17 Sales Cost of materialconsumed
Employee benefitexpenses
Other expenses EBIDTA Q3FY18
So
urc
e: P
latt
s P
oly
me
rsca
n w
ee
kly
re
po
rts
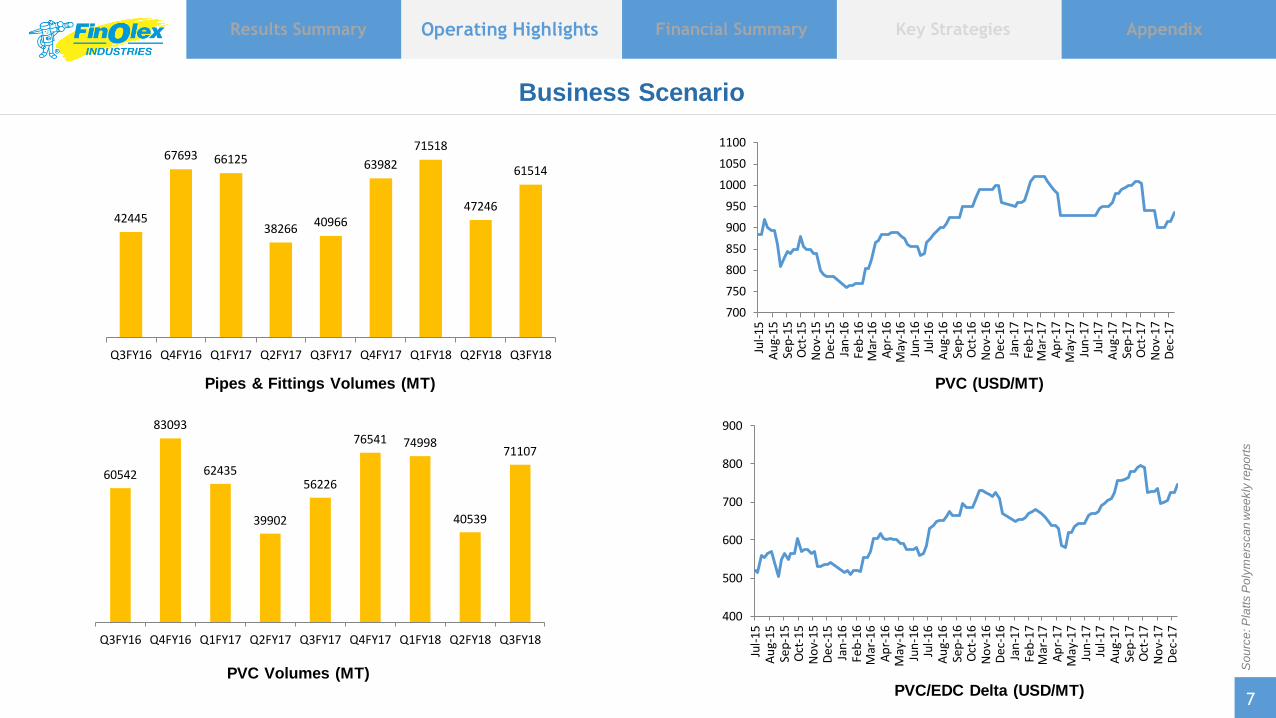
PVC/EDC Delta (USD/MT)
Pipes & Fittings Volumes (MT) PVC (USD/MT)
PVC Volumes (MT)
Results Summary Financial Summary Appendix Operating Highlights Key Strategies
Business Scenario
7
42445
67693 66125
38266 40966
63982
71518
47246
61514
Q3FY16 Q4FY16 Q1FY17 Q2FY17 Q3FY17 Q4FY17 Q1FY18 Q2FY18 Q3FY18
60542
83093
62435
39902
56226
76541 74998
40539
71107
Q3FY16 Q4FY16 Q1FY17 Q2FY17 Q3FY17 Q4FY17 Q1FY18 Q2FY18 Q3FY18
400
500
600
700
800
900
Jul-
15A
ug-
15Se
p-1
5O
ct-1
5N
ov-
15D
ec-1
5Ja
n-1
6Fe
b-1
6M
ar-1
6A
pr-
16M
ay-1
6Ju
n-1
6Ju
l-16
Au
g-16
Sep
-16
Oct
-16
No
v-16
Dec
-16
Jan
-17
Feb
-17
Mar
-17
Ap
r-17
May
-17
Jun
-17
Jul-
17A
ug-
17Se
p-1
7O
ct-1
7N
ov-
17D
ec-1
7
700
750
800
850
900
950
1000
1050
1100
Jul-
15
Au
g-1
5Se
p-15
Oct
-15
No
v-15
Dec
-15
Jan
-16
Feb
-16
Mar
-16
Ap
r-1
6M
ay-1
6Ju
n-1
6Ju
l-1
6A
ug-
16
Sep
-16
Oct
-16
No
v-1
6D
ec-1
6Ja
n-1
7Fe
b-1
7M
ar-1
7A
pr-
17
May
-17
Jun
-17
Jul-
17
Au
g-1
7Se
p-1
7O
ct-1
7N
ov-
17
Dec
-17
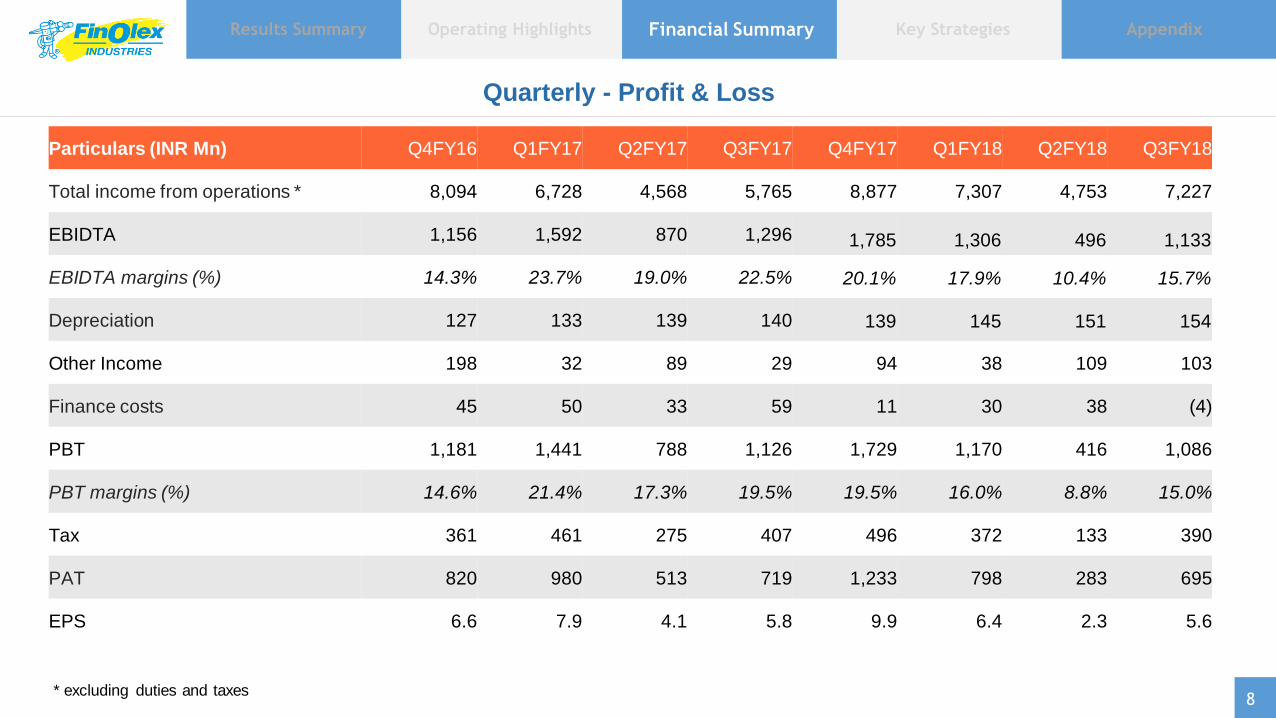
Particulars (INR Mn) Q4FY16 Q1FY17 Q2FY17 Q3FY17 Q4FY17 Q1FY18 Q2FY18 Q3FY18
Total income from operations * 8,094 6,728 4,568 5,765 8,877 7,307 4,753 7,227
EBIDTA 1,156 1,592 870 1,296 1,785 1,306 496 1,133
EBIDTA margins (%) 14.3% 23.7% 19.0% 22.5% 20.1% 17.9% 10.4% 15.7%
Depreciation 127 133 139 140 139 145 151 154
Other Income 198 32 89 29 94 38 109 103
Finance costs 45 50 33 59 11 30 38 (4)
PBT 1,181 1,441 788 1,126 1,729 1,170 416 1,086
PBT margins (%) 14.6% 21.4% 17.3% 19.5% 19.5% 16.0% 8.8% 15.0%
Tax 361 461 275 407 496 372 133 390
PAT 820 980 513 719 1,233 798 283 695
EPS 6.6 7.9 4.1 5.8 9.9 6.4 2.3 5.6
Results Summary Financial Summary Appendix Operating Highlights Key Strategies
Quarterly - Profit & Loss
* excluding duties and taxes 8
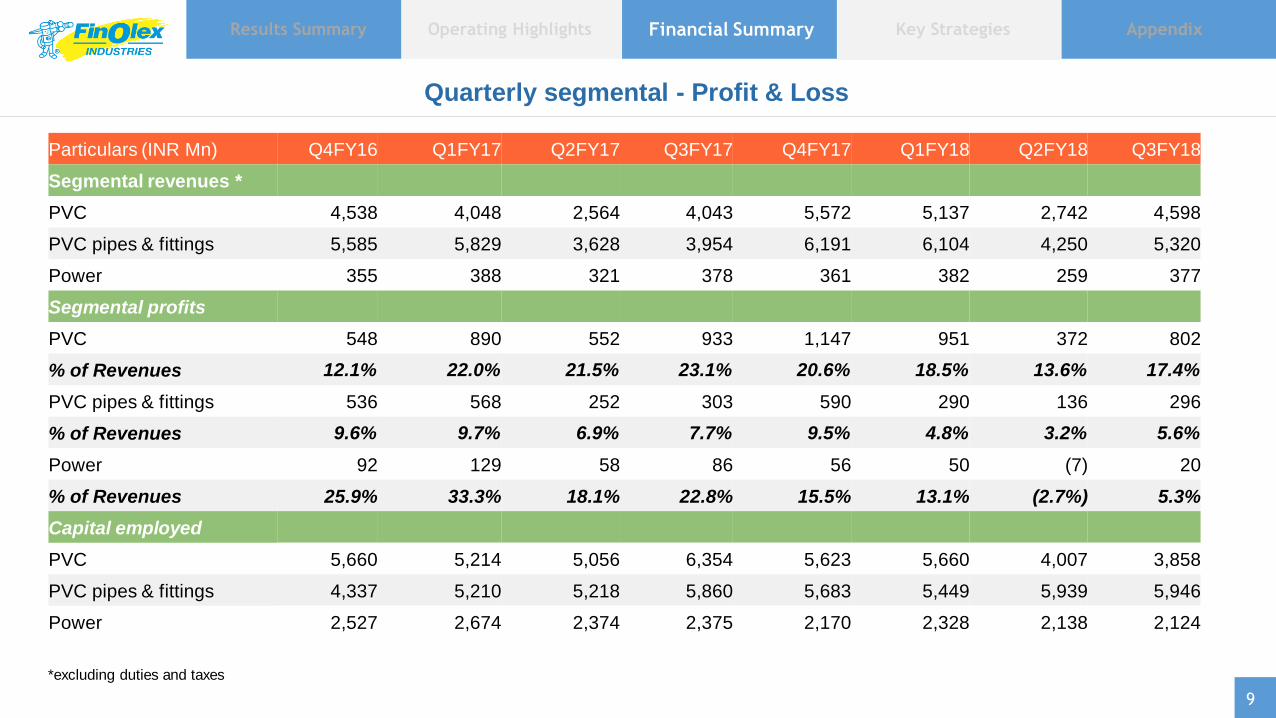
Particulars (INR Mn) Q4FY16 Q1FY17 Q2FY17 Q3FY17 Q4FY17 Q1FY18 Q2FY18 Q3FY18
Segmental revenues *
PVC 4,538 4,048 2,564 4,043 5,572 5,137 2,742 4,598
PVC pipes & fittings 5,585 5,829 3,628 3,954 6,191 6,104 4,250 5,320
Power 355 388 321 378 361 382 259 377
Segmental profits
PVC 548 890 552 933 1,147 951 372 802
% of Revenues 12.1% 22.0% 21.5% 23.1% 20.6% 18.5% 13.6% 17.4%
PVC pipes & fittings 536 568 252 303 590 290 136 296
% of Revenues 9.6% 9.7% 6.9% 7.7% 9.5% 4.8% 3.2% 5.6%
Power 92 129 58 86 56 50 (7) 20
% of Revenues 25.9% 33.3% 18.1% 22.8% 15.5% 13.1% (2.7%) 5.3%
Capital employed
PVC 5,660 5,214 5,056 6,354 5,623 5,660 4,007 3,858
PVC pipes & fittings 4,337 5,210 5,218 5,860 5,683 5,449 5,939 5,946
Power 2,527 2,674 2,374 2,375 2,170 2,328 2,138 2,124
*excluding duties and taxes
Results Summary Financial Summary Appendix Operating Highlights Key Strategies
Quarterly segmental - Profit & Loss
9
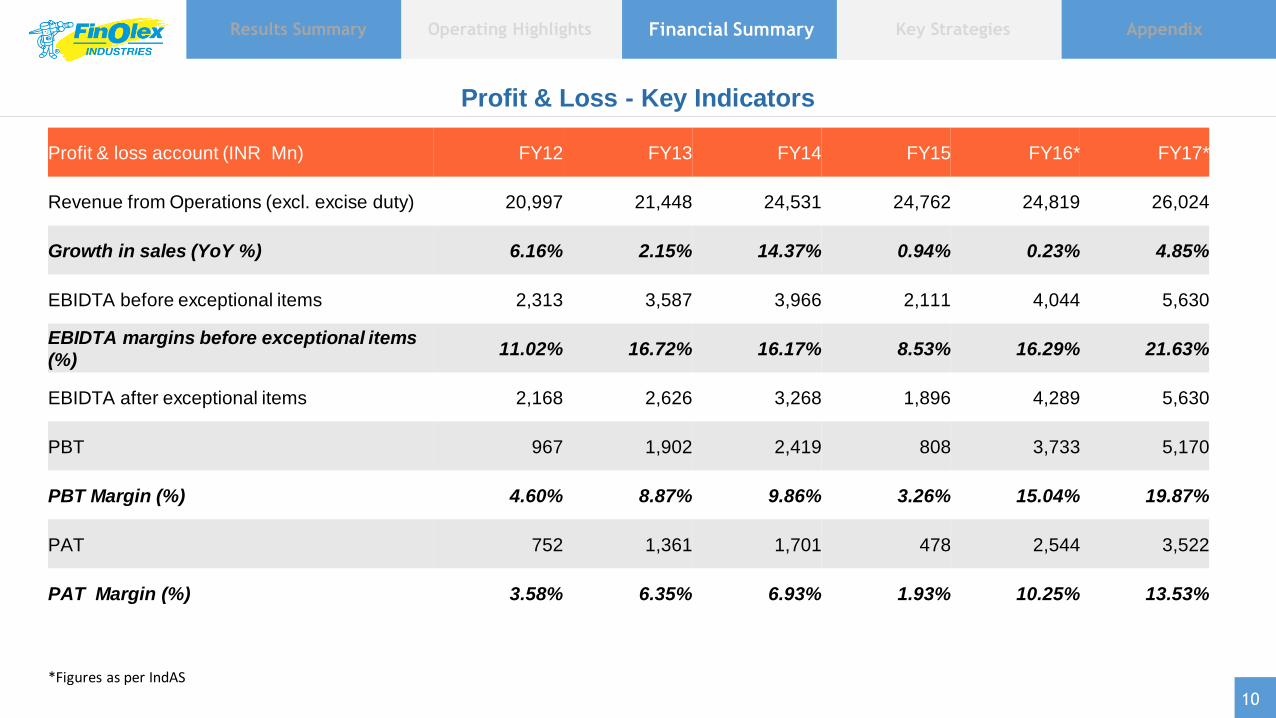
Profit & loss account (INR Mn) FY12 FY13 FY14 FY15 FY16* FY17*
Revenue from Operations (excl. excise duty) 20,997 21,448 24,531 24,762 24,819 26,024
Growth in sales (YoY %) 6.16% 2.15% 14.37% 0.94% 0.23% 4.85%
EBIDTA before exceptional items 2,313 3,587 3,966 2,111 4,044 5,630
EBIDTA margins before exceptional items
(%) 11.02% 16.72% 16.17% 8.53% 16.29% 21.63%
EBIDTA after exceptional items 2,168 2,626 3,268 1,896 4,289 5,630
PBT 967 1,902 2,419 808 3,733 5,170
PBT Margin (%) 4.60% 8.87% 9.86% 3.26% 15.04% 19.87%
PAT 752 1,361 1,701 478 2,544 3,522
PAT Margin (%) 3.58% 6.35% 6.93% 1.93% 10.25% 13.53%
*Figures as per IndAS
Results Summary Financial Summary Appendix Operating Highlights Key Strategies
Profit & Loss - Key Indicators
10
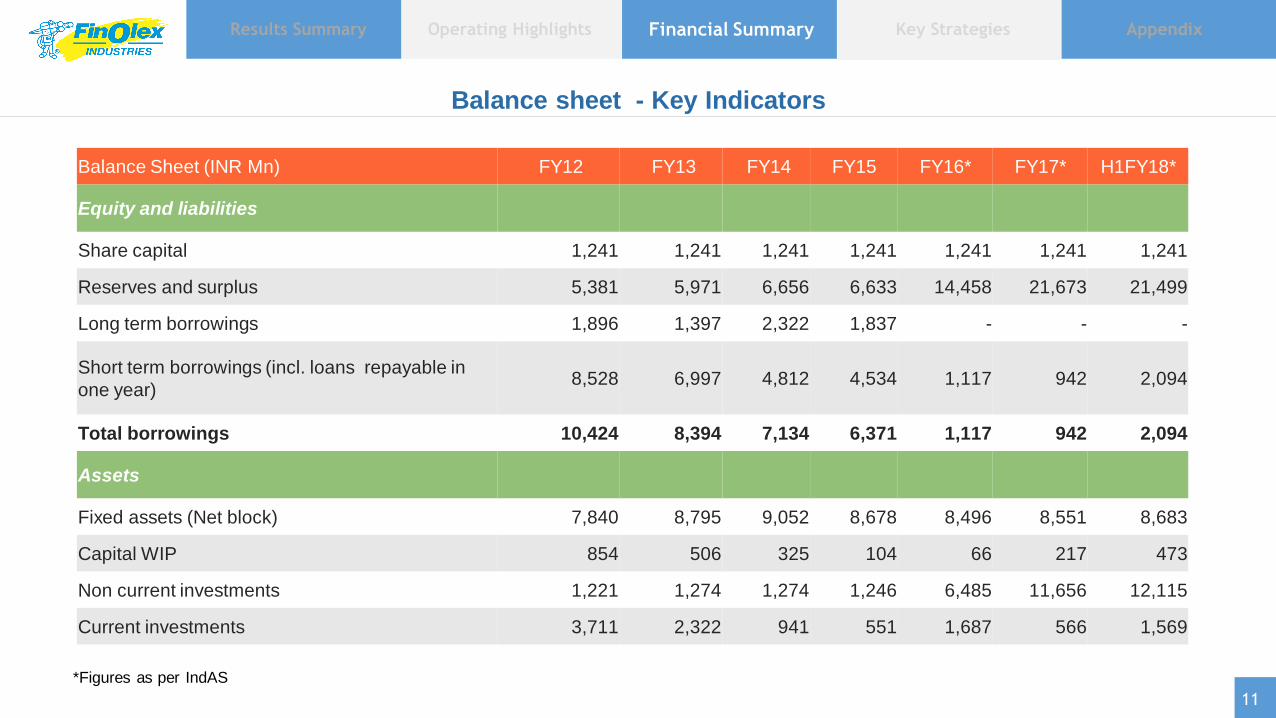
*Figures as per IndAS
Balance sheet - Key Indicators
Results Summary Financial Summary Appendix Operating Highlights Key Strategies
Balance Sheet (INR Mn) FY12 FY13 FY14 FY15 FY16* FY17* H1FY18*
Equity and liabilities
Share capital 1,241 1,241 1,241 1,241 1,241 1,241 1,241
Reserves and surplus 5,381 5,971 6,656 6,633 14,458 21,673 21,499
Long term borrowings 1,896 1,397 2,322 1,837 - - -
Short term borrowings (incl. loans repayable in
one year) 8,528 6,997 4,812 4,534 1,117 942 2,094
Total borrowings 10,424 8,394 7,134 6,371 1,117 942 2,094
Assets
Fixed assets (Net block) 7,840 8,795 9,052 8,678 8,496 8,551 8,683
Capital WIP 854 506 325 104 66 217 473
Non current investments 1,221 1,274 1,274 1,246 6,485 11,656 12,115
Current investments 3,711 2,322 941 551 1,687 566 1,569
11
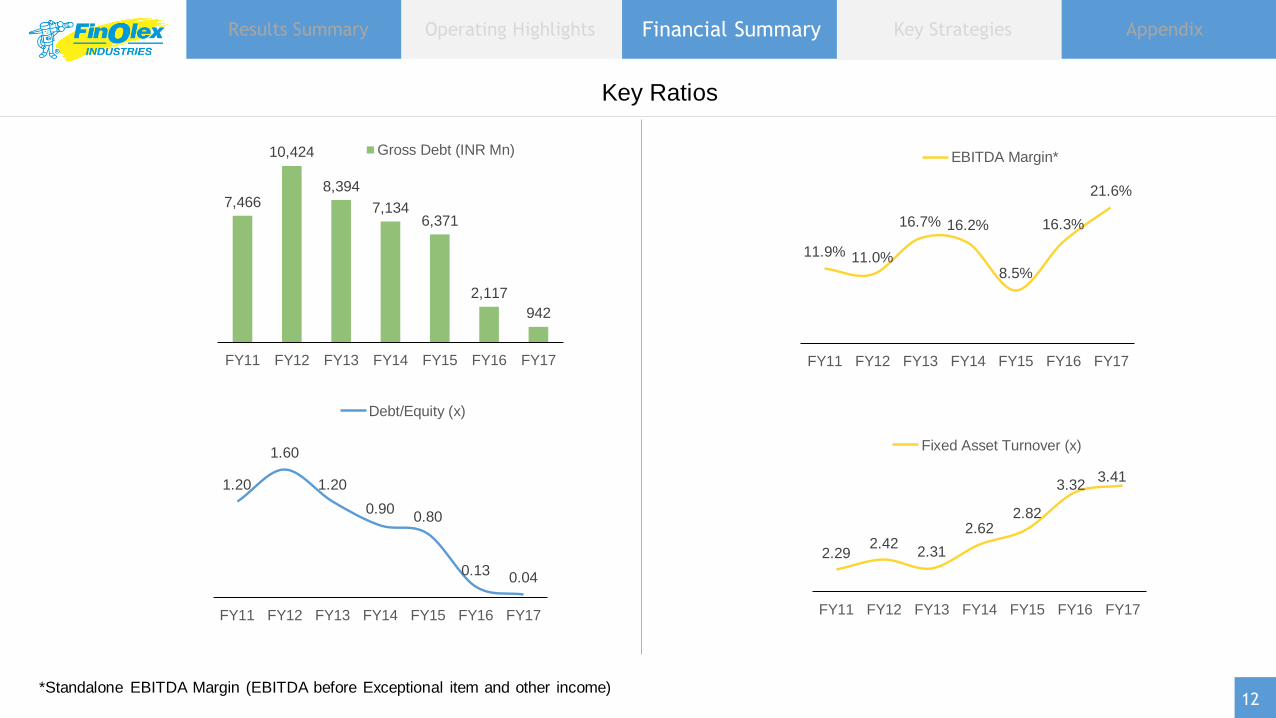
11.9% 11.0%
16.7% 16.2%
8.5%
16.3%
21.6%
FY11 FY12 FY13 FY14 FY15 FY16 FY17
EBITDA Margin*
1.20
1.60
1.20
0.90 0.80
0.13 0.04
FY11 FY12 FY13 FY14 FY15 FY16 FY17
Debt/Equity (x)
2.29 2.42
2.31
2.62 2.82
3.32 3.41
FY11 FY12 FY13 FY14 FY15 FY16 FY17
Fixed Asset Turnover (x)
*Standalone EBITDA Margin (EBITDA before Exceptional item and other income)
7,466
10,424
8,394
7,134 6,371
2,117
942
FY11 FY12 FY13 FY14 FY15 FY16 FY17
Gross Debt (INR Mn)
Key Ratios
Results Summary Financial Summary Appendix Operating Highlights Key Strategies
12
Results Summary Financial Summary Appendix Operating Highlights Key Strategies
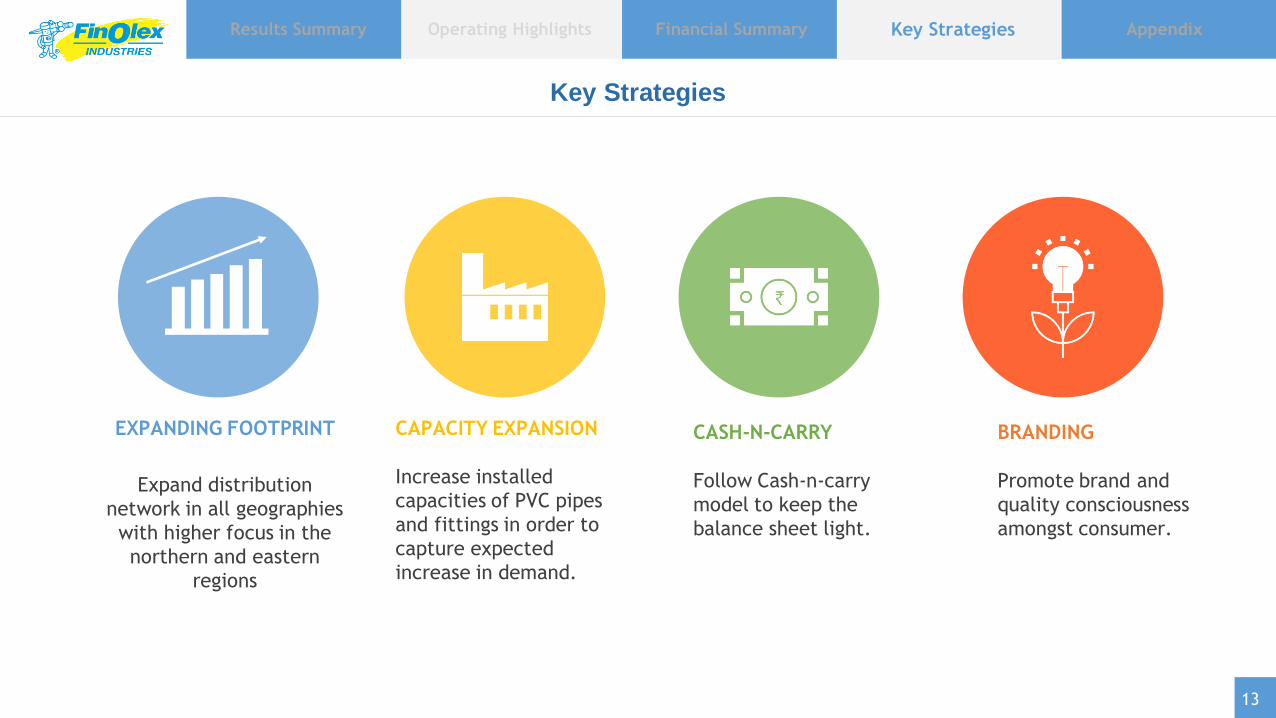
Key Strategies
EXPANDING FOOTPRINT
Expand distribution
network in all geographies
with higher focus in the
northern and eastern
regions
CAPACITY EXPANSION Increase installed
capacities of PVC pipes
and fittings in order to
capture expected
increase in demand.
CASH-N-CARRY Follow Cash-n-carry
model to keep the
balance sheet light.
BRANDING Promote brand and
quality consciousness
amongst consumer.
13
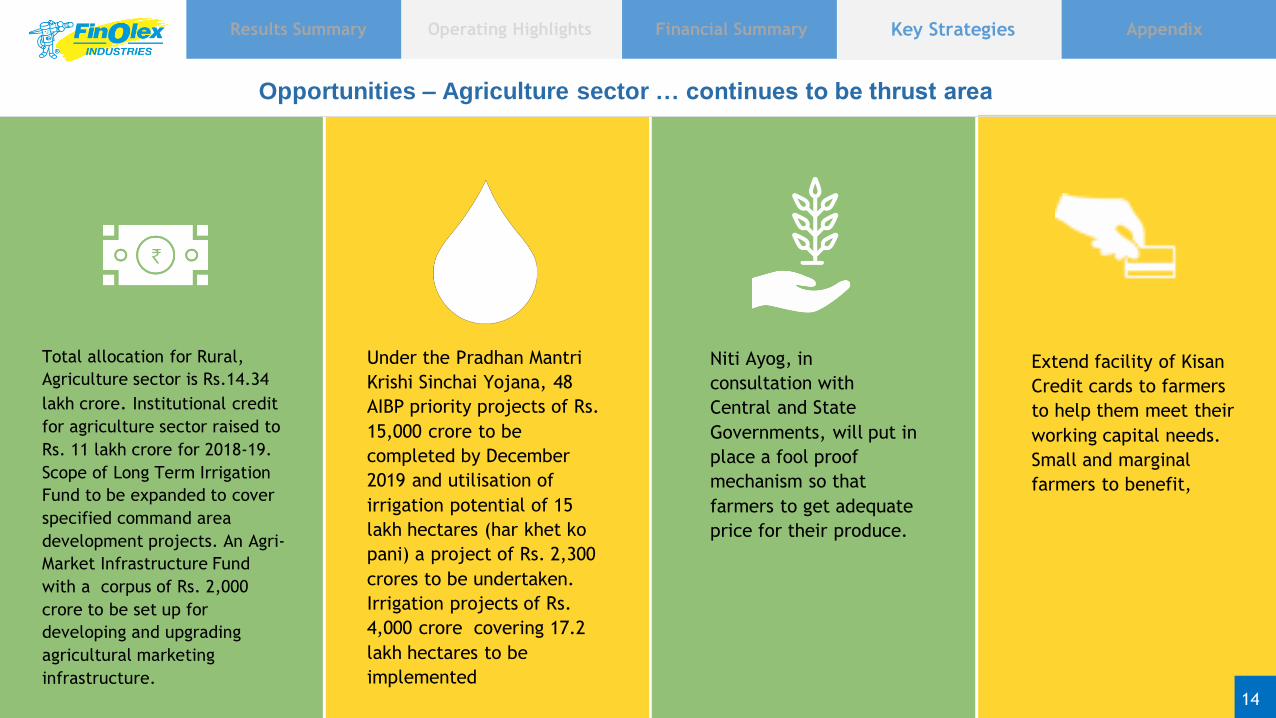
Opportunities – Agriculture sector … continues to be thrust area
Results Summary Financial Summary Appendix Operating Highlights Key Strategies
Total allocation for Rural,
Agriculture sector is Rs.14.34
lakh crore. Institutional credit
for agriculture sector raised to
Rs. 11 lakh crore for 2018-19.
Scope of Long Term Irrigation
Fund to be expanded to cover
specified command area
development projects. An Agri-
Market Infrastructure Fund
with a corpus of Rs. 2,000
crore to be set up for
developing and upgrading
agricultural marketing
infrastructure.
Under the Pradhan Mantri
Krishi Sinchai Yojana, 48
AIBP priority projects of Rs.
15,000 crore to be
completed by December
2019 and utilisation of
irrigation potential of 15
lakh hectares (har khet ko
pani) a project of Rs. 2,300
crores to be undertaken.
Irrigation projects of Rs.
4,000 crore covering 17.2
lakh hectares to be
implemented
Extend facility of Kisan
Credit cards to farmers
to help them meet their
working capital needs.
Small and marginal
farmers to benefit,
14
Niti Ayog, in
consultation with
Central and State
Governments, will put in
place a fool proof
mechanism so that
farmers to get adequate
price for their produce.
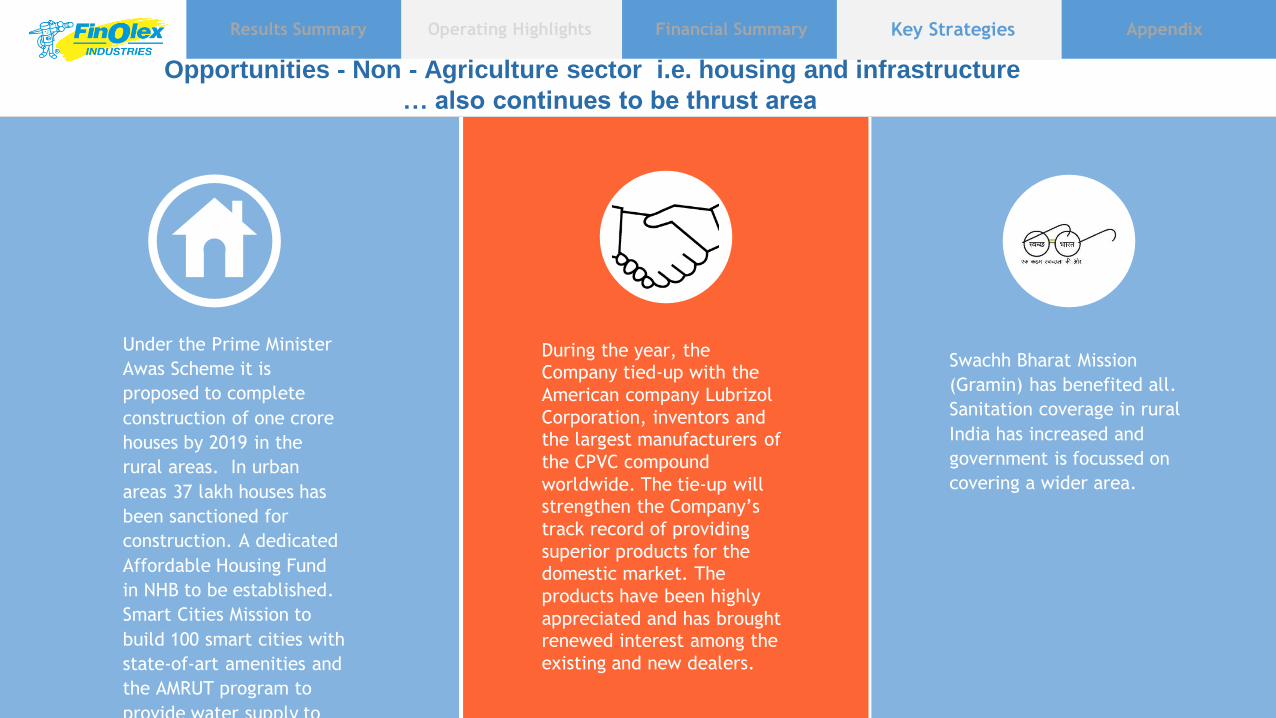
Opportunities - Non - Agriculture sector i.e. housing and infrastructure
… also continues to be thrust area
Under the Prime Minister
Awas Scheme it is
proposed to complete
construction of one crore
houses by 2019 in the
rural areas. In urban
areas 37 lakh houses has
been sanctioned for
construction. A dedicated
Affordable Housing Fund
in NHB to be established.
Smart Cities Mission to
build 100 smart cities with
state-of-art amenities and
the AMRUT program to
provide water supply to
all households in 500
cities.
Swachh Bharat Mission
(Gramin) has benefited all.
Sanitation coverage in rural
India has increased and
government is focussed on
covering a wider area.
Results Summary Financial Summary Appendix Operating Highlights Key Strategies
During the year, the
Company tied-up with the
American company Lubrizol
Corporation, inventors and
the largest manufacturers of
the CPVC compound
worldwide. The tie-up will strengthen the Company’s
track record of providing
superior products for the
domestic market. The
products have been highly
appreciated and has brought renewed interest among the
existing and new dealers.
15
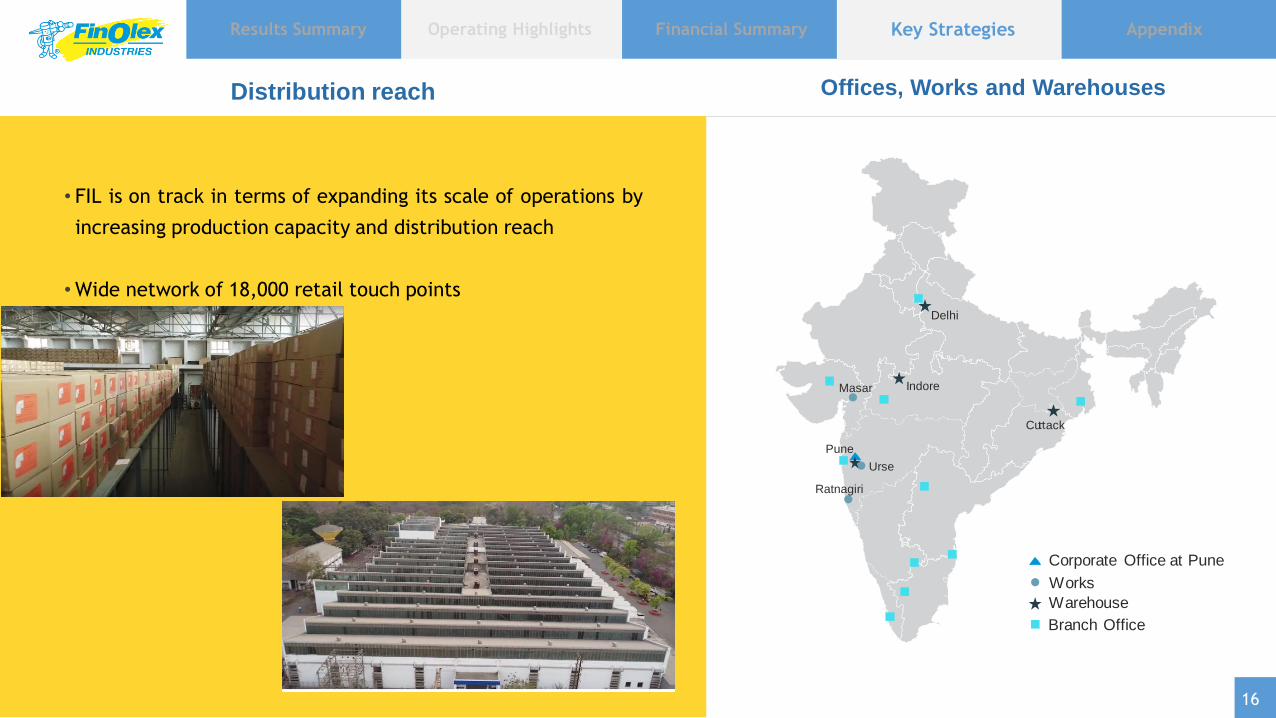
Distribution reach
• FIL is on track in terms of expanding its scale of operations by
increasing production capacity and distribution reach
•Wide network of 18,000 retail touch points
Offices, Works and Warehouses
Results Summary Financial Summary Appendix Operating Highlights Key Strategies
Branch Office
Works
Corporate Office at Pune
Warehouse
Delhi
Indore
Cu ack
Pune
Ratnagiri
Urse
Masar
16
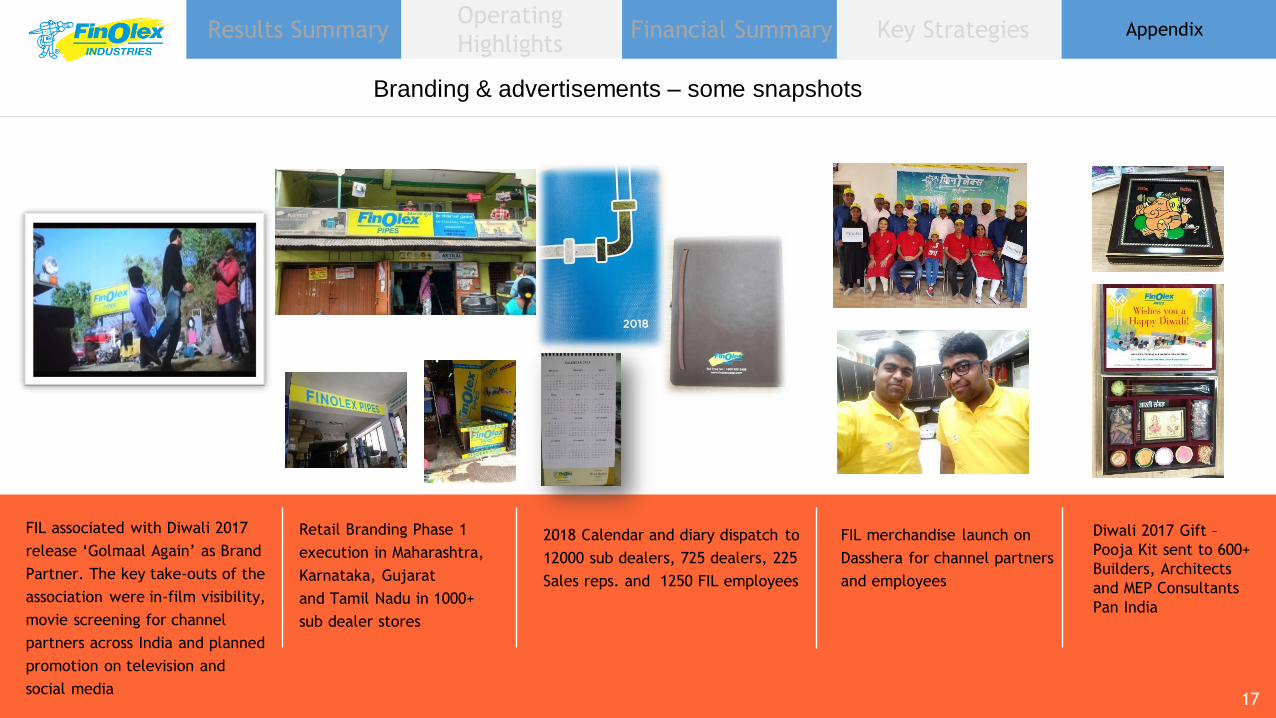
Branding & advertisements – some snapshots
Results Summary Financial Summary Appendix Operating
Highlights Key Strategies
FIL associated with Diwali 2017
release ‘Golmaal Again’ as Brand
Partner. The key take-outs of the
association were in-film visibility,
movie screening for channel
partners across India and planned
promotion on television and
social media
2018 Calendar and diary dispatch to
12000 sub dealers, 725 dealers, 225
Sales reps. and 1250 FIL employees
Retail Branding Phase 1
execution in Maharashtra,
Karnataka, Gujarat
and Tamil Nadu in 1000+
sub dealer stores
FIL merchandise launch on
Dasshera for channel partners
and employees
Diwali 2017 Gift –
Pooja Kit sent to 600+
Builders, Architects
and MEP Consultants
Pan India
17
18
Results Summary Financial Summary Appendix Operating
Highlights Key Strategies
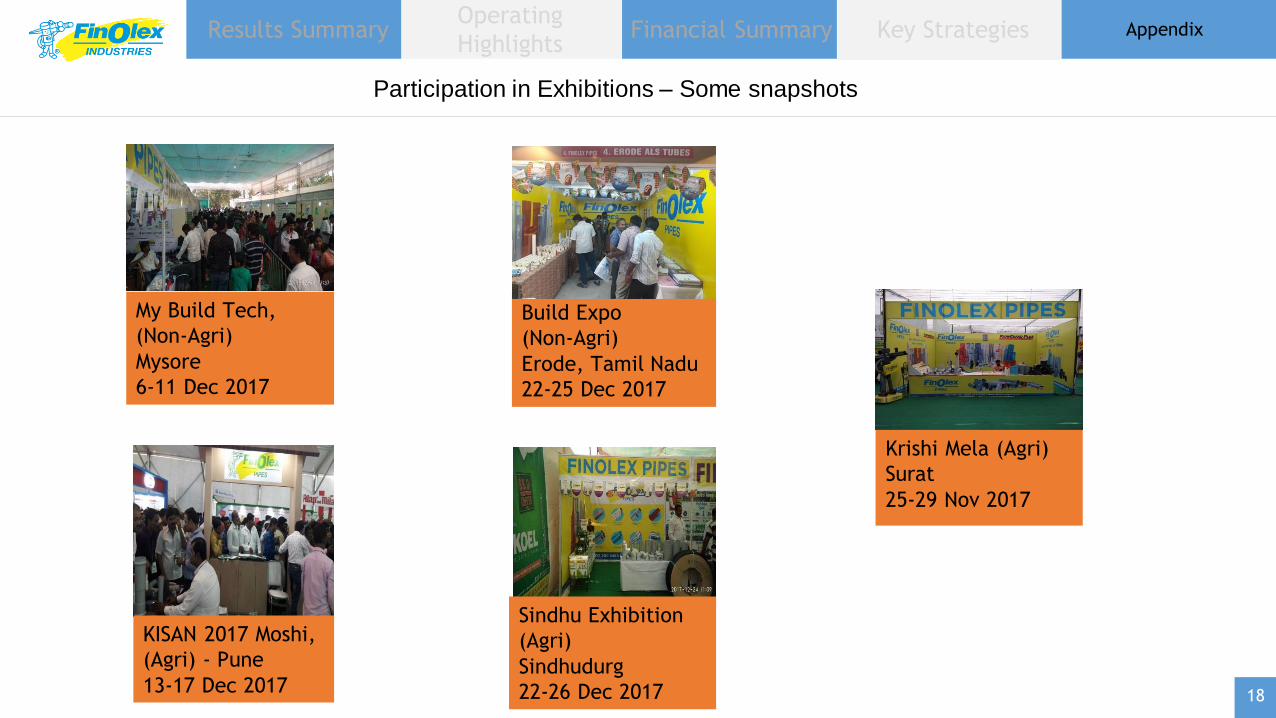
Participation in Exhibitions – Some snapshots
My Build Tech,
(Non-Agri)
Mysore
6-11 Dec 2017
Sindhu Exhibition
(Agri)
Sindhudurg
22-26 Dec 2017
KISAN 2017 Moshi,
(Agri) - Pune
13-17 Dec 2017
Build Expo
(Non-Agri)
Erode, Tamil Nadu
22-25 Dec 2017
Krishi Mela (Agri)
Surat
25-29 Nov 2017
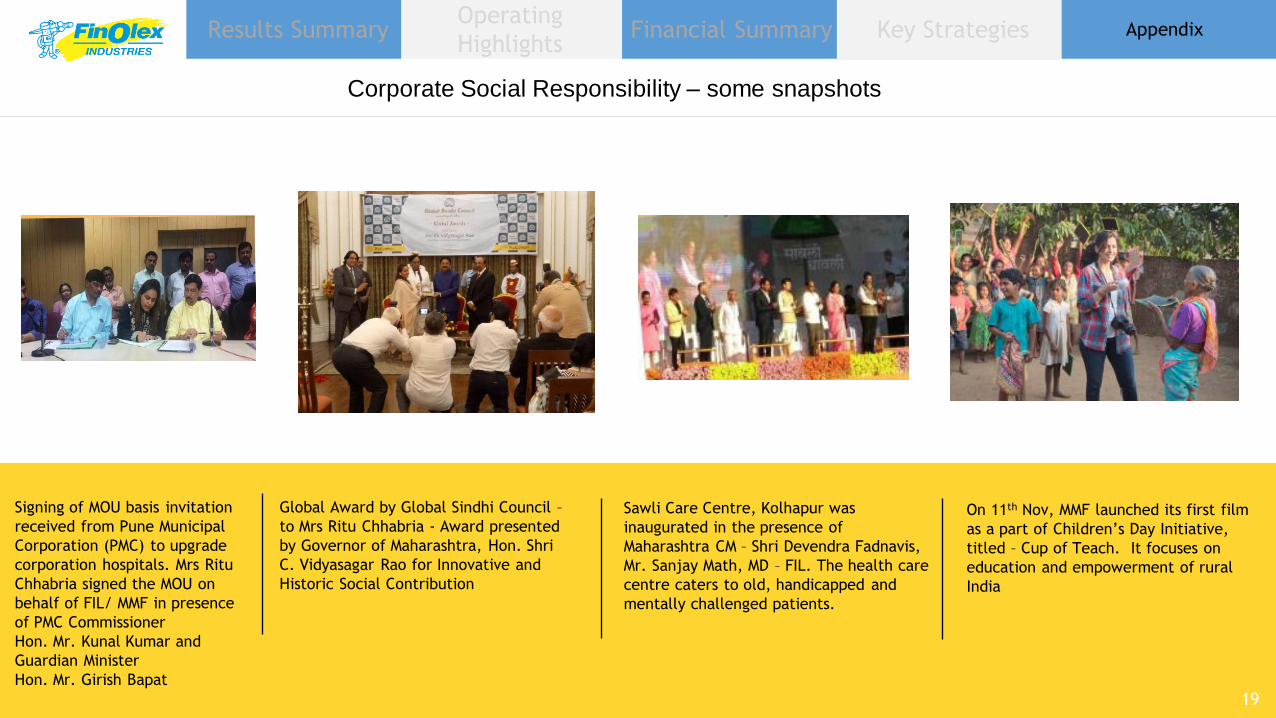
Corporate Social Responsibility – some snapshots
Results Summary Financial Summary Appendix Operating
Highlights Key Strategies
Signing of MOU basis invitation
received from Pune Municipal
Corporation (PMC) to upgrade
corporation hospitals. Mrs Ritu
Chhabria signed the MOU on
behalf of FIL/ MMF in presence
of PMC Commissioner
Hon. Mr. Kunal Kumar and
Guardian Minister
Hon. Mr. Girish Bapat
Global Award by Global Sindhi Council –
to Mrs Ritu Chhabria - Award presented
by Governor of Maharashtra, Hon. Shri
C. Vidyasagar Rao for Innovative and
Historic Social Contribution
Sawli Care Centre, Kolhapur was
inaugurated in the presence of
Maharashtra CM – Shri Devendra Fadnavis,
Mr. Sanjay Math, MD – FIL. The health care
centre caters to old, handicapped and
mentally challenged patients.
On 11th Nov, MMF launched its first film
as a part of Children’s Day Initiative,
titled – Cup of Teach. It focuses on
education and empowerment of rural
India
19
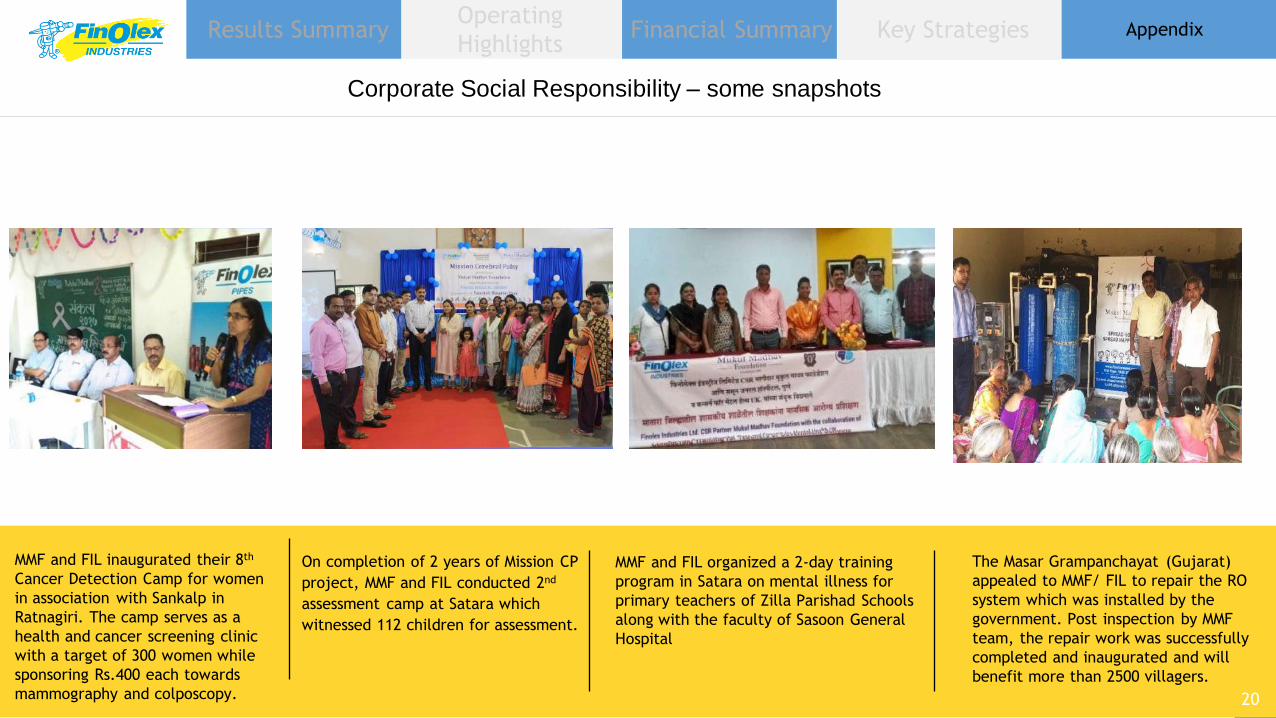
Corporate Social Responsibility – some snapshots
Results Summary Financial Summary Appendix Operating
Highlights Key Strategies
MMF and FIL inaugurated their 8th
Cancer Detection Camp for women
in association with Sankalp in
Ratnagiri. The camp serves as a
health and cancer screening clinic
with a target of 300 women while
sponsoring Rs.400 each towards
mammography and colposcopy.
On completion of 2 years of Mission CP
project, MMF and FIL conducted 2nd
assessment camp at Satara which
witnessed 112 children for assessment.
MMF and FIL organized a 2-day training
program in Satara on mental illness for
primary teachers of Zilla Parishad Schools
along with the faculty of Sasoon General
Hospital
The Masar Grampanchayat (Gujarat)
appealed to MMF/ FIL to repair the RO
system which was installed by the
government. Post inspection by MMF
team, the repair work was successfully
completed and inaugurated and will
benefit more than 2500 villagers.
20
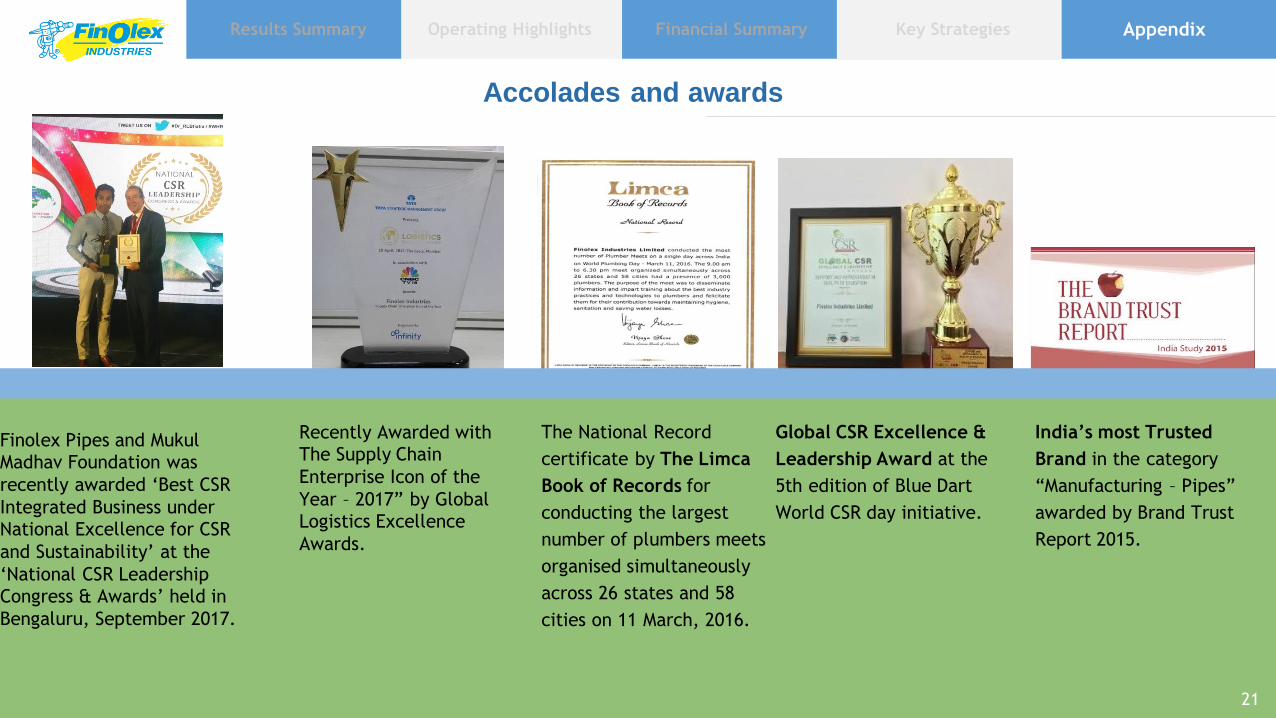
Accolades and awards
India’s most Trusted
Brand in the category
“Manufacturing – Pipes”
awarded by Brand Trust
Report 2015.
The National Record
certificate by The Limca
Book of Records for
conducting the largest
number of plumbers meets
organised simultaneously
across 26 states and 58
cities on 11 March, 2016.
Global CSR Excellence &
Leadership Award at the
5th edition of Blue Dart
World CSR day initiative.
Results Summary Financial Summary Appendix Operating Highlights Key Strategies
Recently Awarded with
The Supply Chain
Enterprise Icon of the
Year – 2017” by Global
Logistics Excellence
Awards.
Finolex Pipes and Mukul Madhav Foundation was
recently awarded ‘Best CSR
Integrated Business under
National Excellence for CSR
and Sustainability’ at the
‘National CSR Leadership
Congress & Awards’ held in
Bengaluru, September 2017.
21
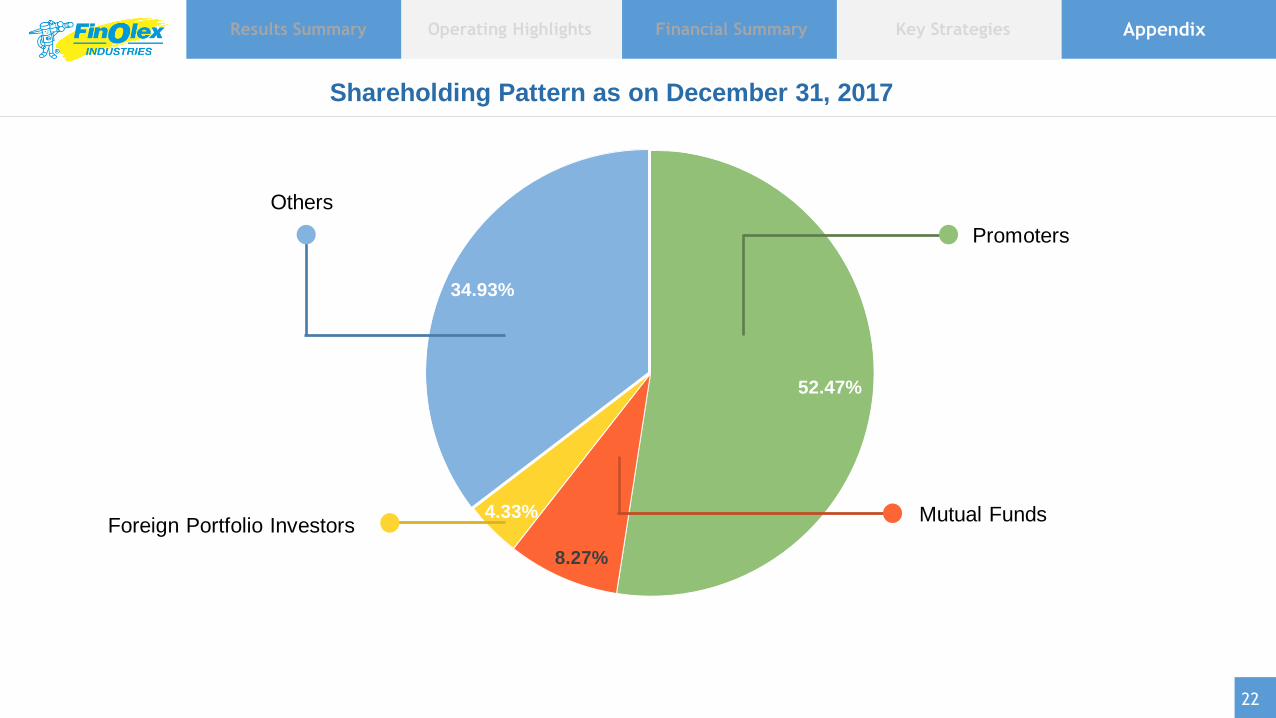
Shareholding Pattern as on December 31, 2017
Results Summary Financial Summary Appendix Operating Highlights Key Strategies
4.02%
52.47%
8.27%
4.33%
34.93%
Promoters
Mutual Funds
Others
Foreign Portfolio Investors
22
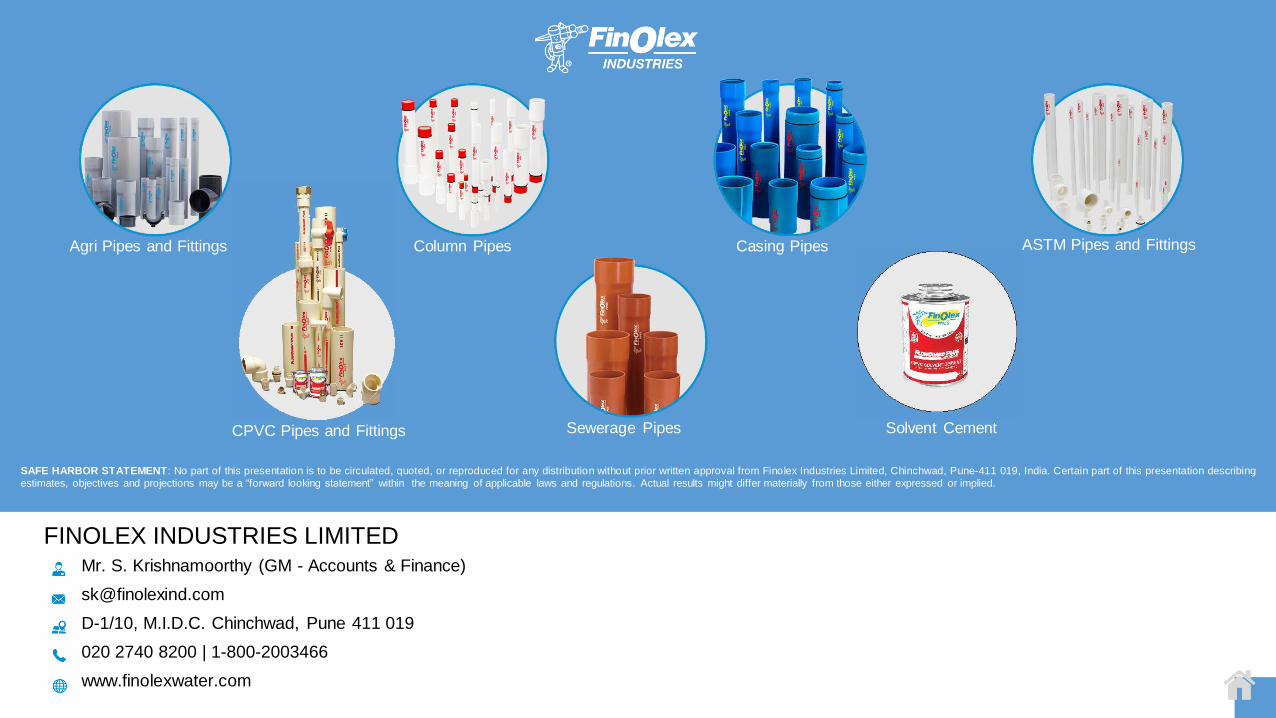
FINOLEX INDUSTRIES LIMITED Mr. S. Krishnamoorthy (GM - Accounts & Finance)
D-1/10, M.I.D.C. Chinchwad, Pune 411 019
020 2740 8200 | 1-800-2003466
www.finolexwater.com
SAFE HARBOR STATEMENT: No part of this presentation is to be circulated, quoted, or reproduced for any distribution without prior written approval from Finolex Industries Limited, Chinchwad, Pune-411 019, India. Certain part of this presentation describing
estimates, objectives and projections may be a “forward looking statement” within the meaning of applicable laws and regulations. Actual results might differ materially from those either expressed or implied.
Agri Pipes and Fittings Column Pipes Casing Pipes ASTM Pipes and Fittings
CPVC Pipes and Fittings Sewerage Pipes Solvent Cement