fintech sector report - gca altium · 2016 2017 2018 2019e fintech public company valuation...
TRANSCRIPT

FINTECHSECTOR REPORT
February 2019

2
Real Estate & Mortgage Technology
Payments / Billing / Money Transfer
Investment & Wealth Technology
Banking Technology
Real Estate & Mortgage Technology
Blockchain / Crypto
Insurance Technology
BUSINESS MODEL COVERAGE
GCA has created a unique, interdisciplinary team of senior bankers across FinTech, Software, Private Capital and M&A to serve
virtually all sub-sectors and business models across the FinTech market
BROAD AND DEEP FINTECH PRACTICE
KEY STATS SECTOR COVERAGESELECTED BLUE CHIP STRATEGIC
& FINANCIAL CONTACTS
Regulatory Technology
Trading & Capital Markets Technology
SaaS and
Enterprise
Software
Information
Services /
Data &
Analytics
Tech-
Enabled
Services
Transaction
Processing
400+ Bankers globally
21
375+Transactions in the last
three years
Strategic Acquirers
Private Equity / VC
Offices globally
3Continents – America, Asia and Europe
33%+Cross-border transactions
Insurance Technology
Online / Alternative Lending
3
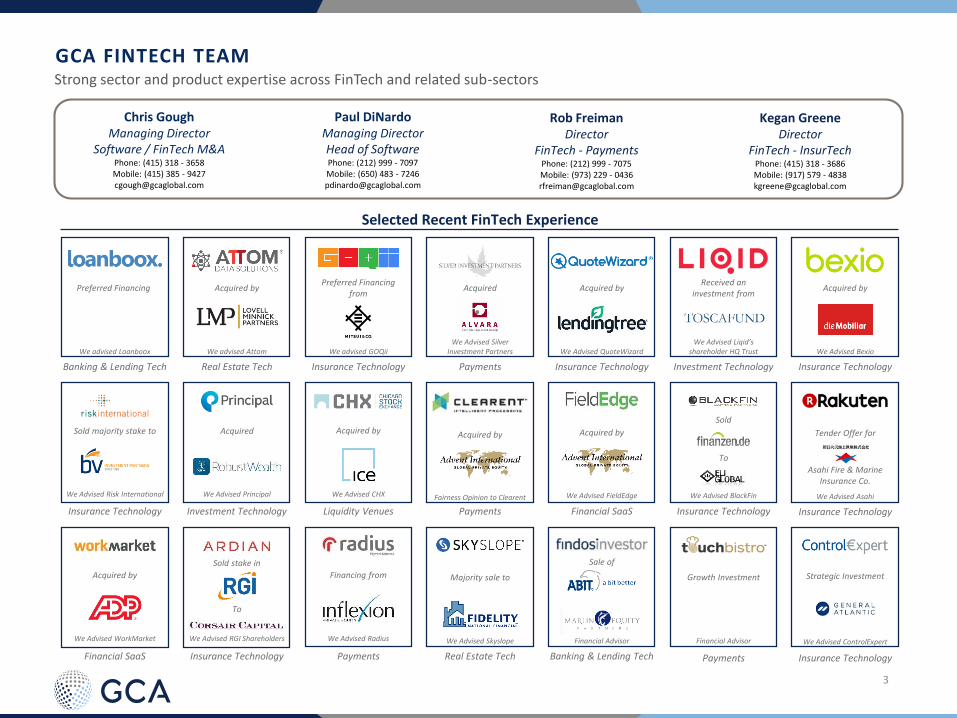
Strong sector and product expertise across FinTech and related sub-sectors
GCA FINTECH TEAM
Rob FreimanDirector
FinTech - PaymentsPhone: (212) 999 - 7075Mobile: (973) 229 - 0436 [email protected]
Kegan GreeneDirector
FinTech - InsurTechPhone: (415) 318 - 3686Mobile: (917) 579 - 4838 [email protected]
Paul DiNardoManaging DirectorHead of SoftwarePhone: (212) 999 - 7097Mobile: (650) 483 - [email protected]
Chris GoughManaging Director
Software / FinTech M&APhone: (415) 318 - 3658Mobile: (415) 385 - [email protected]
Selected Recent FinTech Experience
Sale of
Financial Advisor
Real Estate Tech
Financial Advisor
Growth Investment
Banking & Lending Tech
We Advised Skyslope
Majority sale to
Payments
We Advised Radius
Financing fromAcquired by
We Advised WorkMarket
Financial SaaS
To
We Advised RGI Shareholders
Insurance Technology
Tender Offer for
Asahi Fire & MarineInsurance Co.
We Advised Asahi
Insurance Technology
We Advised BlackFin
Sold
Insurance Technology
To
Payments
Acquired by
Fairness Opinion to Clearent
Strategic Investment
We Advised ControlExpert
Payments Insurance Technology
We Advised CHX
Acquired by
Liquidity Venues Financial SaaS
Acquired by
We Advised FieldEdgeWe Advised Principal
Acquired
Investment Technology
We Advised Risk International
Sold majority stake to
Insurance Technology
We Advised Bexio
Acquired by
Insurance Technology
We Advised Liqid’s shareholder HQ Trust
Received an investment from
Investment Technology
We Advised QuoteWizard
Acquired by
Insurance Technology
Sold stake in
We Advised Silver Investment Partners
Acquired
Payments
Preferred Financingfrom
We advised GOQii
Insurance Technology
Acquired by
We advised Attom
Real Estate Tech
Preferred Financing
We advised Loanboox
Banking & Lending Tech
4
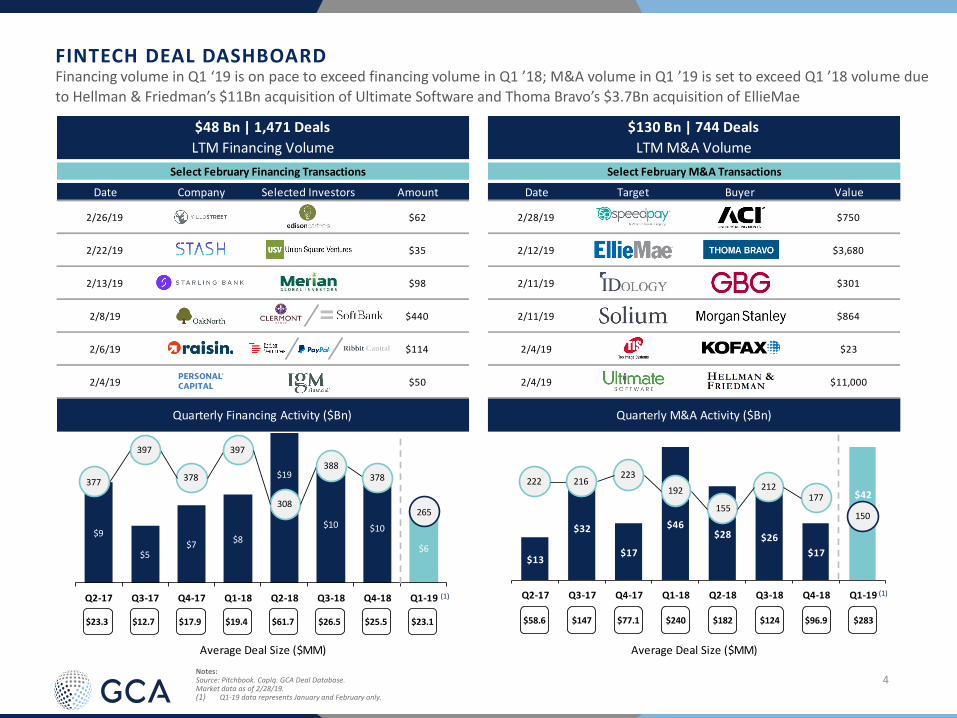
Select February Financing Transactions Select February M&A Transactions
Date Company Selected Investors Amount Date Target Buyer Value
2/26/19 $62 2/28/19 $750
2/22/19 $35 2/12/19 $3,680
2/13/19 $98 2/11/19 $301
2/8/19 $440 2/11/19 $864
2/6/19 $114 2/4/19 $23
2/4/19 $50 2/4/19 $11,000
Quarterly Financing Activity ($Bn) Quarterly M&A Activity ($Bn)
Average Deal Size ($MM) Average Deal Size ($MM)
$130 Bn | 744 Deals
LTM M&A Volume
$48 Bn | 1,471 Deals
LTM Financing Volume
$13
$32
$17
$46 $28 $26
$17
$42
Q2-17 Q3-17 Q4-17 Q1-18 Q2-18 Q3-18 Q4-18 Q1-19
$9
$5 $7
$8
$19
$10 $10
$6
Q2-17 Q3-17 Q4-17 Q1-18 Q2-18 Q3-18 Q4-18 Q1-19
$283
378377
397 397
222223
192
308
$17.9$12.7$23.3 $25.5$19.4
155
$77.1$147$58.6 $96.9$240$61.7
212
$182$26.5
177
$124
150265
$23.1
388378 216
FINTECH DEAL DASHBOARD
Notes:Source: Pitchbook. CapIq. GCA Deal Database.Market data as of 2/28/19. (1) Q1-19 data represents January and February only.
Financing volume in Q1 ‘19 is on pace to exceed financing volume in Q1 ’18; M&A volume in Q1 ’19 is set to exceed Q1 ’18 volume due
to Hellman & Friedman’s $11Bn acquisition of Ultimate Software and Thoma Bravo’s $3.7Bn acquisition of EllieMae
(1) (1)
5
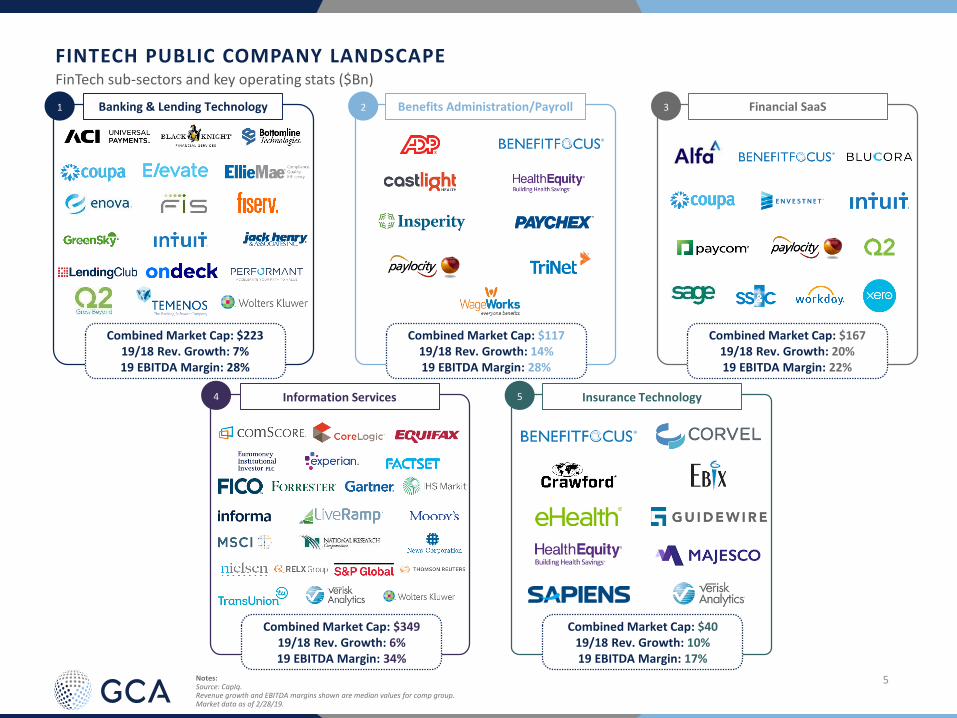
FINTECH PUBLIC COMPANY LANDSCAPEFinTech sub-sectors and key operating stats ($Bn)
Notes:Source: CapIq.Revenue growth and EBITDA margins shown are median values for comp group.Market data as of 2/28/19.
Information Services
Combined Market Cap: $34919/18 Rev. Growth: 6% 19 EBITDA Margin: 34%
4
Benefits Administration/Payroll
Combined Market Cap: $11719/18 Rev. Growth: 14%19 EBITDA Margin: 28%
2
Insurance Technology
Combined Market Cap: $4019/18 Rev. Growth: 10% 19 EBITDA Margin: 17%
5
Financial SaaS
Combined Market Cap: $16719/18 Rev. Growth: 20%19 EBITDA Margin: 22%
3Banking & Lending Technology
Combined Market Cap: $22319/18 Rev. Growth: 7% 19 EBITDA Margin: 28%
1

6
Liquidity Venues
Combined Market Cap: $28019/18 Rev. Growth: 7%19 EBITDA Margin: 59%
7Investment Technology
Combined Market Cap: $24419/18 Rev. Growth: 8% 19 EBITDA Margin: 28%
6
Trading Technology
Combined Market Cap: $11319/18 Rev. Growth: 5% 19 EBITDA Margin: 54%
10Real Estate & Mortgage Tech.
Combined Market Cap: $20819/18 Rev. Growth: 10% 19 EBITDA Margin: 17%
9
FINTECH PUBLIC COMPANY LANDSCAPEFinTech sub-sectors and key operating stats ($Bn)
Notes:Source: CapIq.Revenue growth and EBITDA margins shown are median values for comp group.Market data as of 2/28/19.
Payments
Combined Market Cap: $1,05219/18 Rev. Growth: 10% 19 EBITDA Margin: 28%
8
7
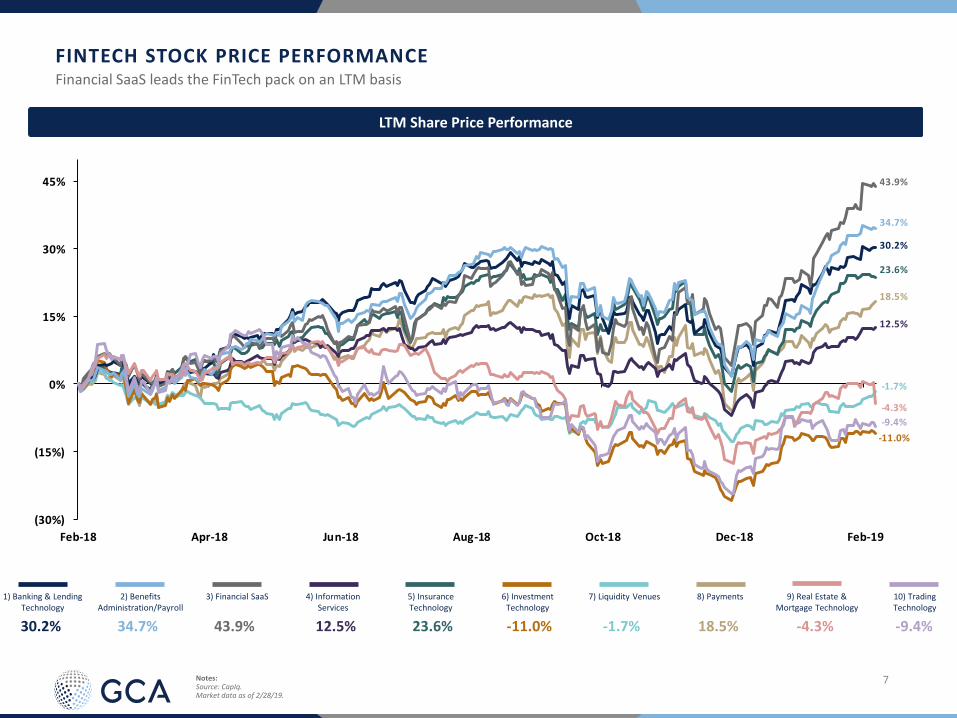
(30%)
(15%)
0%
15%
30%
45%
Feb-18 Apr-18 Jun-18 Aug-18 Oct-18 Dec-18 Feb-19
-11.0%
43.9%
18.5%
23.6%
30.2%
34.7%
-1.7%
12.5%
-4.3%
-9.4%
FINTECH STOCK PRICE PERFORMANCE
LTM Share Price Performance
Notes:Source: CapIq. Market data as of 2/28/19.
Financial SaaS leads the FinTech pack on an LTM basis
6) Investment Technology
10) Trading Technology
1) Banking & Lending Technology
2) Benefits Administration/Payroll
3) Financial SaaS 5) Insurance Technology
4) Information Services
7) Liquidity Venues 8) Payments 9) Real Estate & Mortgage Technology
30.2% 34.7% 43.9% 12.5% 23.6% -11.0% -1.7% 18.5% -4.3% -9.4%

8
0%
5%
10%
15%
20%
25%
0.0x 2.0x 4.0x 6.0x 8.0x 10.0x
0.0x
2.5x
5.0x
7.5x
10.0x
Feb-18 Apr-18 Jun-18 Aug-18 Oct-18 Dec-18 Feb-19
9.1x
4.7x4.7x
7.3x
3.9x
5.1x5.1x
3.4x3.2x3.0x
0.0%
10.0%
20.0%
30.0%
40.0%
50.0%
15A / 16A 16A / 17A 17A / 18E 18E / 19E
0.0x
2.0x
4.0x
6.0x
8.0x
10.0x
2016 2017 2018 2019E
FINTECH PUBLIC COMPANY VALUATIONFinancial SaaS outperforms the FinTech market on a revenue growth and EV / ’19E Revenue basis
Notes:Source: CapIq.Market data as of 2/28/19.Lines display median multiples across comp groups for given year.
EV / ‘19E RevenueEV / Revenue
Median 18E/19E Revenue Growth to EV/’19E Revenue MultipleRevenue Growth
3.1x
4.7x
9.1%1
2
3
4
56
7
89
10
1) Banking & Lending Technology
7.4%
2) Benefits Administration/Payroll
13.8%
3) Financial SaaS
20.2%
4) Information Services
6.0%
5) Insurance Technology
9.9%
6) Investment Technology
8.3%
7) Liquidity Venues
7.3%
8) Payments
9.9%
9) Real Estate & Mortgage Technology
10.0%
10) Trading Technology
4.9%18
E /
19
E R
ev.
Gro
wth
4.4x
3.9x
9.5%
15.6%9.7%

9
0%
5%
10%
15%
20%
25%
0.0x 6.0x 12.0x 18.0x 24.0x 30.0x
0.0x
5.0x
10.0x
15.0x
20.0x
25.0x
30.0x
35.0x
Feb-18 Apr-18 Jun-18 Aug-18 Oct-18 Dec-18 Feb-19
18.3x
12.7x
5.7x
14.3x14.6x15.4x
12.4x
13.0x
16.3x
25.4x
0.0%
15.0%
30.0%
45.0%
60.0%
75.0%
15A / 16A 16A / 17A 17A / 18E 18E / 19E
0.0x
6.0x
12.0x
18.0x
24.0x
30.0x
2016 2017 2018 2019E
FINTECH PUBLIC COMPANY VALUATION (CONT’D)Financial SaaS outperforms the FinTech market on an EBITDA growth and EV / ‘19E EBITDA basis
Notes:Source: CapIq.Market data as of 2/28/19.Lines display median multiples across comp groups for given year.
EV / ‘19E EBITDAEV / EBITDA
Median 18E/19E EBITDA Growth to EV/’19E EBITDA MultipleEBITDA Growth
14.4x
1
2
3
4
56
7
89
10
14.0% 12.2%
18
E /
19
E
EBIT
DA
Gro
wth
1) Banking & Lending Technology
10.6%
2) Benefits Administration/Payroll
14.3%
3) Financial SaaS
20.4%
4) Information Services
6.2%
5) Insurance Technology
15.0%
6) Investment Technology
14.0%
7) Liquidity Venues
9.0%
8) Payments
13.0%
9) Real Estate & Mortgage Technology
12.7%
10) Trading Technology
8.9%
12.1x
15.7x14.3x
9.8%11.9%
10
14.0x
16.4x
18.2x
19.4x
20.3x
22.1x
24.5x
24.6x
27.2x
29.0x
0.0x 5.0x 10.0x 15.0x 20.0x 25.0x 30.0x 35.0x
Investment Technology6
Real Estate & Mort. Tech9
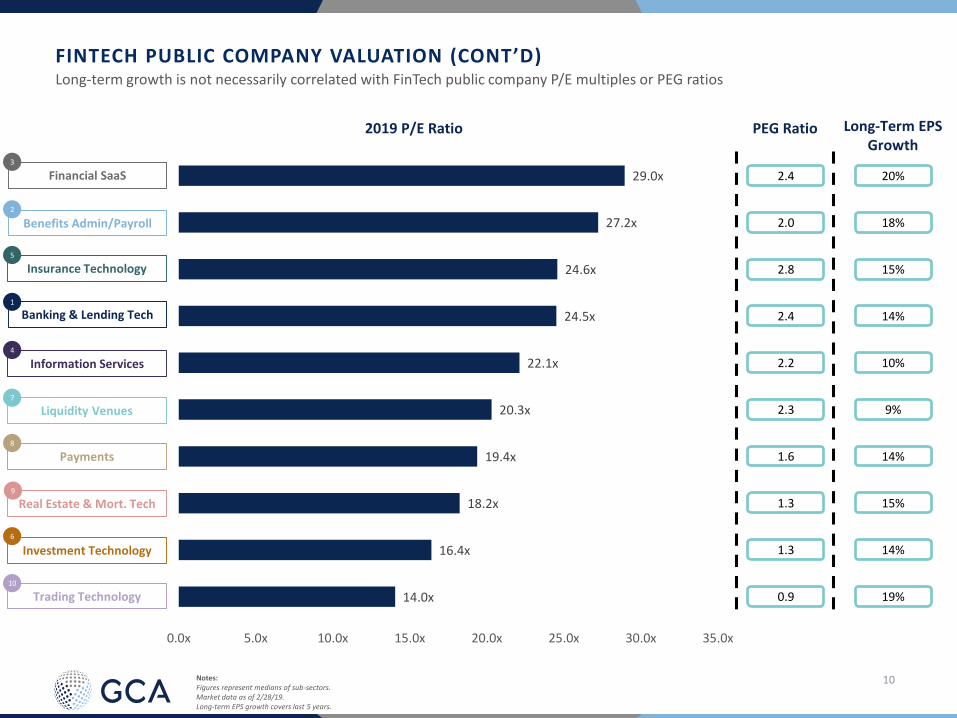
Long-term growth is not necessarily correlated with FinTech public company P/E multiples or PEG ratios
FINTECH PUBLIC COMPANY VALUATION (CONT’D)
Notes: Figures represent medians of sub-sectors.Market data as of 2/28/19.Long-term EPS growth covers last 5 years.
20%
18%
15%
14%
10%
9%
14%
15%
14%
19%
2.4
2.0
2.8
2.4
2.2
2.3
1.6
1.3
1.3
0.9
2019 P/E Ratio PEG Ratio Long-Term EPS Growth
Banking & Lending Tech1
Financial SaaS3
Information Services4
Insurance Technology5
Liquidity Venues7
Payments8
Trading Technology10
Benefits Admin/Payroll2
11
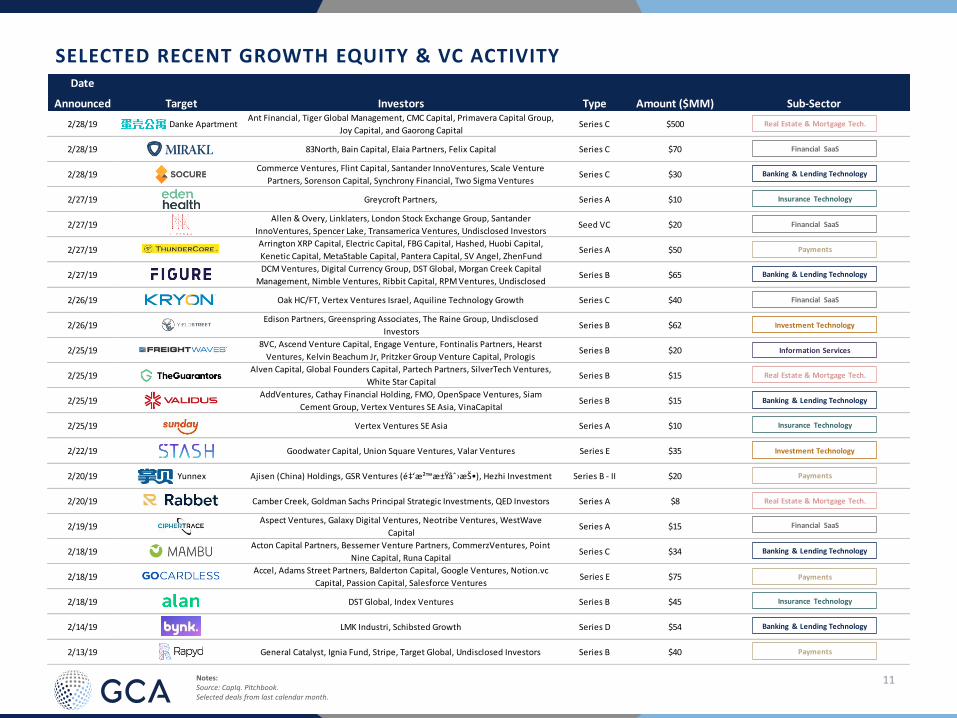
2/28/19 Danke ApartmentAnt Financial, Tiger Global Management, CMC Capital, Primavera Capital Group,
Joy Capital, and Gaorong CapitalSeries C $500
2/28/19 83North, Bain Capital, Elaia Partners, Felix Capital Series C $70
2/28/19Commerce Ventures, Flint Capital, Santander InnoVentures, Scale Venture
Partners, Sorenson Capital, Synchrony Financial, Two Sigma VenturesSeries C $30
2/27/19 Greycroft Partners, Series A $10
2/27/19Allen & Overy, Linklaters, London Stock Exchange Group, Santander
InnoVentures, Spencer Lake, Transamerica Ventures, Undisclosed InvestorsSeed VC $20
2/27/19Arrington XRP Capital, Electric Capital, FBG Capital, Hashed, Huobi Capital,
Kenetic Capital, MetaStable Capital, Pantera Capital, SV Angel, ZhenFundSeries A $50
2/27/19DCM Ventures, Digital Currency Group, DST Global, Morgan Creek Capital
Management, Nimble Ventures, Ribbit Capital, RPM Ventures, Undisclosed Series B $65
2/26/19 Oak HC/FT, Vertex Ventures Israel, Aquiline Technology Growth Series C $40
2/26/19Edison Partners, Greenspring Associates, The Raine Group, Undisclosed
InvestorsSeries B $62
2/25/198VC, Ascend Venture Capital, Engage Venture, Fontinalis Partners, Hearst
Ventures, Kelvin Beachum Jr, Pritzker Group Venture Capital, Prologis Series B $20
2/25/19Alven Capital, Global Founders Capital, Partech Partners, SilverTech Ventures,
White Star CapitalSeries B $15
2/25/19AddVentures, Cathay Financial Holding, FMO, OpenSpace Ventures, Siam
Cement Group, Vertex Ventures SE Asia, VinaCapitalSeries B $15
2/25/19 Vertex Ventures SE Asia Series A $10
2/22/19 Goodwater Capital, Union Square Ventures, Valar Ventures Series E $35
2/20/19 Yunnex Ajisen (China) Holdings, GSR Ventures (金沙江创投), Hezhi Investment Series B - II $20
2/20/19 Camber Creek, Goldman Sachs Principal Strategic Investments, QED Investors Series A $8
2/19/19Aspect Ventures, Galaxy Digital Ventures, Neotribe Ventures, WestWave
CapitalSeries A $15
2/18/19Acton Capital Partners, Bessemer Venture Partners, CommerzVentures, Point
Nine Capital, Runa CapitalSeries C $34
2/18/19Accel, Adams Street Partners, Balderton Capital, Google Ventures, Notion.vc
Capital, Passion Capital, Salesforce VenturesSeries E $75
2/18/19 DST Global, Index Ventures Series B $45
2/14/19 LMK Industri, Schibsted Growth Series D $54
2/13/19 General Catalyst, Ignia Fund, Stripe, Target Global, Undisclosed Investors Series B $40
Investment Technology
Payments
Banking & Lending Technology
Financial SaaS
Banking & Lending Technology
Financial SaaS
Payments
Banking & Lending Technology
Investment Technology
Information Services
Real Estate & Mortgage Tech.
Banking & Lending Technology
Insurance Technology
Payments
Real Estate & Mortgage Tech.
Financial SaaS
Insurance Technology
Banking & Lending Technology
Payments
Real Estate & Mortgage Tech.
Financial SaaS
Insurance Technology
SELECTED RECENT GROWTH EQUITY & VC ACTIVITY
Notes: Source: CapIq. Pitchbook.Selected deals from last calendar month.
Date
Announced Target Investors Type Amount ($MM) Sub-Sector

12
2/13/19 Harald McPike, Merian Chrysalis Investment Company, Merian Global Investors Series C $98
2/13/19 Cota Capital, NRD Capital, Bobby Cov Companies Series B $10
2/12/19 FTV Capital Growth Equity - II $10
2/12/19BEENEXT, Blume Ventures, DSP Adiko, Sequoia Capital India, Straddle Capital,
WEH VenturesSeries A $8
2/12/19 Accel, Benchmark Series B $30
2/12/19Bessemer Venture Partners, Citi Ventures, Goldman Sachs Principal Strategic
InvestmentsSeries A $20
2/11/19 Stripes Group Series A $30
2/11/19Goldman Sachs Principal Strategic Investments, Experian Ventures, Aries
Capital Partners, Incite Ventures (Burlingame), Hack VC, Incite Ventures, Series C $45
2/11/19 Greyhound Capital, SEED Capital, Socii Capital, Undisclosed Angel Investors Series A $15
2/8/19 Softbank Vision Fund, Clermont Group Unattributed VC $440
2/7/19 TVC Capital, Undisclosed Investors Series C $9
2/7/19 Insight Venture Partners, Skandinaviska Enskilda Banken, Nordea Funds, ABN
AMRO Bank and Sunstone Technology Ventures on February 7, 2019. Christian Growth Equity - II $65
2/7/19Polaris Partners, Ignition Partners, Mindset Ventures, Osage University
Partners, UL VenturesSeries B $22
2/7/19 DIGITAL+ PARTNERS Series B $17
2/6/19 Khosla Ventures, Ribbit Capital, Valar Ventures Series B $25
2/6/19 Index Ventures, PayPal, Ribbit Capital, Thrive Capital Series D $114
2/5/19 Daphni, IDInvest Partners, Index Ventures, Kima Ventures Series B $34
2/4/19Benhamou Global Ventures, Corsair Capital Management, Crosslink Capital,
IGM Financial, Institutional Venture Partners, VenrockSeries F $50
2/4/19 J.P. Morgan Asset Management Series C $42
2/4/19 True Ventures Unattributed VC $9
2/4/19Crane Venture Partners, Experian Ventures, Orange Digital Ventures, Sunstone
Capital, White Star CapitalSeries B $11
2/4/199yards capital, Australia and New Zealand Banking Group, Banco Sabadell,
Goldman Sachs, HSBC, InnoCells, Investec, Stanley FinkSeries A $20
Financial SaaS
Insurance Technology
Payments
Financial SaaS
Banking & Lending Technology
Investment Technology
Financial SaaS
Information Services
Banking & Lending Technology
Financial SaaS
Investment Technology
Payments
Financial SaaS
Benefits Administration/Payroll
Insurance Technology
Information Services
Banking & Lending Technology
Financial SaaS
Financial SaaS
Financial SaaS
Real Estate & Mortgage Tech.
Financial SaaS
SELECTED RECENT GROWTH EQUITY & VC ACTIVITY (CONT’D)
Notes: Source: CapIq. Pitchbook.Selected deals from last calendar month.
Date
Announced Target Investors Type Amount ($MM) Sub-Sector
13
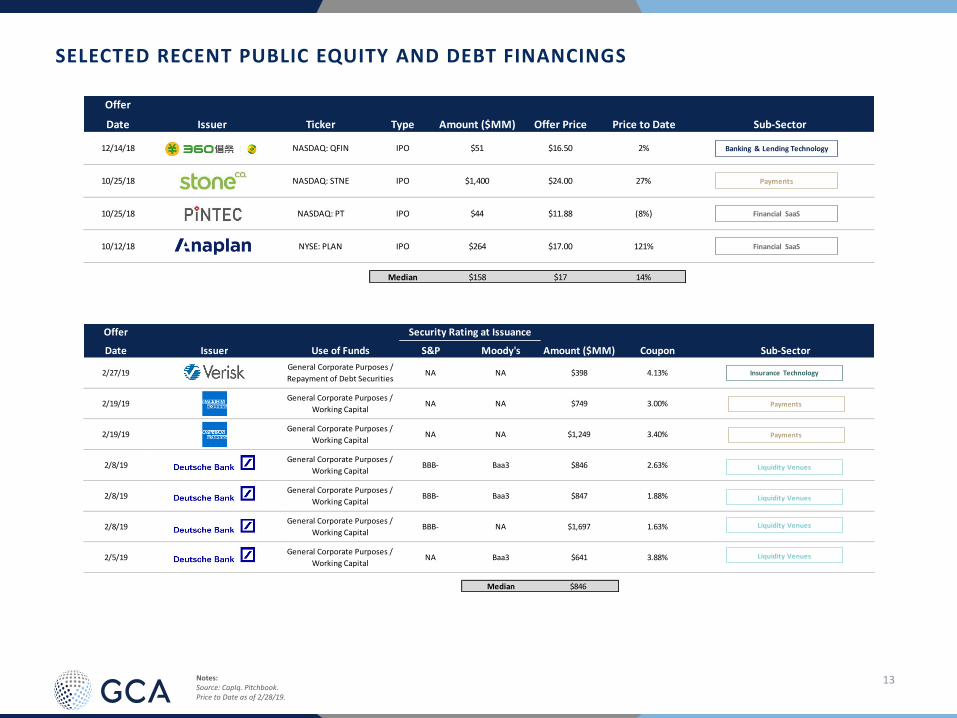
Offer
Date Issuer Ticker Type Amount ($MM) Offer Price Price to Date Sub-Sector
12/14/18 NASDAQ: QFIN IPO $51 $16.50 2%
10/25/18 NASDAQ: STNE IPO $1,400 $24.00 27%
10/25/18 NASDAQ: PT IPO $44 $11.88 (8%)
10/12/18 NYSE: PLAN IPO $264 $17.00 121%
Median $158 $17 14%
Financial SaaS
Financial SaaS
Payments
Banking & Lending Technology
SELECTED RECENT PUBLIC EQUITY AND DEBT FINANCINGS
Notes: Source: CapIq. Pitchbook.Price to Date as of 2/28/19.
Offer
Date Issuer Use of Funds S&P Moody's Amount ($MM) Coupon Sub-Sector
2/27/19General Corporate Purposes /
Repayment of Debt SecuritiesNA NA $398 4.13%
2/19/19General Corporate Purposes /
Working CapitalNA NA $749 3.00%
2/19/19General Corporate Purposes /
Working CapitalNA NA $1,249 3.40%
2/8/19General Corporate Purposes /
Working CapitalBBB- Baa3 $846 2.63%
2/8/19General Corporate Purposes /
Working CapitalBBB- Baa3 $847 1.88%
2/8/19General Corporate Purposes /
Working CapitalBBB- NA $1,697 1.63%
2/5/19General Corporate Purposes /
Working CapitalNA Baa3 $641 3.88%
Median $846
Security Rating at Issuance
Insurance Technology
Payments
Payments
Liquidity Venues
Liquidity Venues
Liquidity Venues
Liquidity Venues
14
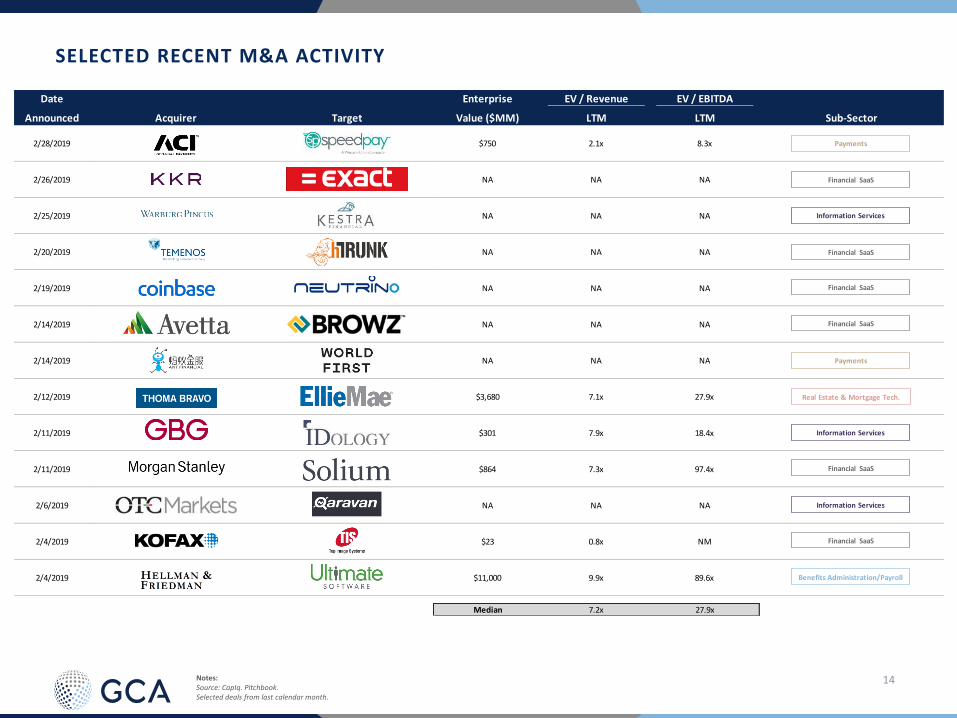
Date Enterprise EV / Revenue EV / EBITDA
Announced Acquirer Target Value ($MM) LTM LTM Sub-Sector
2/28/2019 $750 2.1x 8.3x
2/26/2019 NA NA NA
2/25/2019 NA NA NA
2/20/2019 NA NA NA
2/19/2019 NA NA NA
2/14/2019 NA NA NA
2/14/2019 NA NA NA
2/12/2019 $3,680 7.1x 27.9x
2/11/2019 $301 7.9x 18.4x
2/11/2019 $864 7.3x 97.4x
2/6/2019 NA NA NA
2/4/2019 $23 0.8x NM
2/4/2019 $11,000 9.9x 89.6x
Median 7.2x 27.9x
Financial SaaS
Payments
Information Services
Benefits Administration/Payroll
Real Estate & Mortgage Tech.
Payments
Financial SaaS
Financial SaaS
Financial SaaS
Information Services
Financial SaaS
Information Services
Financial SaaS
SELECTED RECENT M&A ACTIVITY
Notes: Source: CapIq. Pitchbook.Selected deals from last calendar month.

15
PUBLIC COMPANY VALUATIONS
Ben
efit
s A
dm
in/P
ayro
llB
anki
ng
& L
en
din
g Te
chn
olo
gy
Notes: Source: CapIq. Pitchbook.Multiples based on CapIq Consensus Estimates. Multiples <0 and >100 considered NM.
($MM, except per share data)Stock EPS Operating Metrics Trading Metrics
Price Equity Enterprise Long Term Revenue Growth EBITDA Growth EBITDA Margin EV / Revenue EV / EBITDA Price / EPS
Company 2/28/19 Value Value Growth PEG 19E/18A 20E/19E 19E/18A 20E/19E 19E 19E 20E 19E 20E 19E 20E
Banking & Lending Technology
Intuit Inc. $247.13 $64,025 $63,105 15% 2.5 7% 11% 1% 13% 36% 9.1x 8.3x 25.4x 22.5x 37.4x 31.3x
Fidelity National Information Services, Inc. $108.15 $34,924 $43,206 11% 1.3 (0%) 4% 5% 6% 39% 5.1x 5.0x 13.2x 12.4x 14.5x 13.2x
First Data Corporation $25.14 $23,564 $40,608 14% 1.1 5% 5% 8% 5% 39% 4.5x 4.3x 11.3x 10.7x 15.1x 13.1x
Fiserv, Inc. $84.69 $33,164 $38,708 12% 2.0 6% 5% 8% 6% 38% 6.3x 6.0x 16.3x 15.4x 24.5x 21.9x
Wolters Kluwer N.V. $66.03 $17,968 $20,287 9% 2.4 6% 4% 6% 5% 28% 3.9x 3.8x 13.9x 13.2x 21.5x 20.0x
Temenos AG $145.13 $10,074 $10,601 17% 2.6 17% 11% 19% 14% 38% 10.7x 9.7x 28.5x 24.9x 42.2x 36.0x
Jack Henry & Associates, Inc. $132.63 $10,236 $10,210 11% 3.2 2% 7% (2%) 11% 33% 6.3x 5.9x 18.9x 17.1x 36.4x 31.8x
Black Knight, Inc. $52.25 $7,730 $9,050 12% 2.2 7% 8% 9% 10% 50% 7.6x 7.1x 15.3x 14.0x 26.8x 23.2x
Coupa Software Incorporated $94.19 $5,599 $5,364 NA NM 36% 21% NA 17% 8% 21.2x 17.4x NM NM NM NM
ACI Worldwide, Inc. $31.87 $3,696 $4,220 12% 2.7 9% 4% 22% 9% 28% 3.8x 3.7x 13.8x 12.7x 33.2x 26.8x
Ellie Mae, Inc. $99.49 $3,471 $3,168 15% 3.5 6% 9% 19% 13% 29% 6.2x 5.7x 21.7x 19.3x 51.8x 44.7x
Q2 Holdings, Inc. $68.82 $2,999 $3,005 24% NM 28% 23% 11% 86% 7% 9.8x 8.0x NM 76.9x NM 145.9x
Bottomline Technologies (de), Inc. $49.88 $2,032 $2,045 15% 2.4 5% 11% 5% 14% 24% 4.7x 4.2x 19.5x 17.2x 35.4x 29.3x
Enova International, Inc. $25.52 $855 $1,660 NA NM 16% 15% 12% 10% 18% 1.3x 1.1x 7.0x 6.4x 8.2x 7.0x
LendingClub Corporation $2.97 $1,276 $1,619 36% NM 13% 13% 31% 40% 16% 2.1x 1.8x 12.7x 9.0x NM 56.9x
On Deck Capital, Inc. $6.14 $463 $1,219 NA NM 14% 11% 14% 33% 10% 2.7x 2.4x 25.9x 19.5x 12.0x 11.0x
GreenSky, Inc. $11.30 $649 $742 17% 0.9 28% 24% 22% 27% 40% 1.4x 1.1x 3.5x 2.8x 15.4x 12.0x
Elevate Credit, Inc. $4.38 $189 $693 NA NM 5% 11% 14% 14% 16% 0.8x 0.8x 5.2x 4.6x 7.6x 5.5x
Performant Financial Corporation $2.30 $122 $157 NA NM 27% 20% NA NM 0% 1.0x 0.8x NM 9.9x NM NM
Median 14% 2.4 7% 11% 11% 13% 28% 4.7x 4.3x 14.6x 13.6x 24.5x 23.2x
Benefits Administration/Payroll
Automatic Data Processing, Inc. $153.03 $66,664 $67,084 15% 1.9 6% 7% 12% 13% 24% 4.6x 4.3x 19.0x 16.8x 27.2x 23.8x
Paychex, Inc. $77.02 $27,657 $26,956 9% 2.9 17% 6% 12% 8% 39% 6.7x 6.3x 17.0x 15.7x 26.1x 24.1x
Insperity, Inc. $126.27 $5,169 $4,926 17% 1.7 14% 12% 16% 20% 6% 1.1x 1.0x 17.7x 14.8x 27.5x 23.1x
HealthEquity, Inc. $80.48 $5,021 $4,691 30% 2.1 18% 17% 18% 17% 40% 13.9x 11.9x 34.8x 29.6x 61.2x 50.5x
Paylocity Holding Corporation $87.57 $4,634 $4,530 24% 2.6 20% 23% 57% 28% 28% 10.0x 8.1x 35.6x 27.8x 63.0x 48.9x
TriNet Group, Inc. $61.29 $4,301 $4,432 NA NM 7% 11% 4% 11% 38% 4.7x 4.2x 12.5x 11.2x 19.0x 16.8x
Benefitfocus, Inc. $49.12 $1,574 $1,621 20% NM 17% 19% 156% 85% 7% 5.4x 4.5x 74.4x 40.2x NM 106.8x
WageWorks, Inc. $32.90 $1,304 $656 15% 0.9 3% 3% 7% 6% 31% 1.3x 1.3x 4.1x 3.9x 14.1x 13.1x
Castlight Health, Inc. $3.19 $446 $372 28% NM (1%) NA NA NA 2% 2.4x NM NM NM NM NM
Median 18% 2.0 14% 11% 14% 15% 28% 4.7x 4.4x 18.3x 16.3x 27.2x 24.0x

16
PUBLIC COMPANY VALUATIONS (CONT’D)
Info
rmat
ion
Ser
vice
s
Notes: Source: CapIq. Pitchbook.Multiples based on CapIq Consensus Estimates. Multiples <0 and >100 considered NM.
Fin
anci
al S
aaS
Financial SaaS
Intuit Inc. $247.13 $64,025 $63,105 15% 2.5 7% 11% 1% 13% 36% 9.1x 8.3x 25.4x 22.5x 37.4x 31.3x
Workday, Inc. $197.93 $43,545 $42,971 35% 3.5 25% 23% 31% 38% 18% 12.2x 9.9x 67.1x 48.5x 122.7x 91.1x
SS&C Technologies Holdings, Inc. $61.58 $15,445 $23,534 15% 1.1 36% 4% 46% 7% 39% 5.0x 4.8x 12.6x 11.7x 16.2x 14.7x
Paycom Software, Inc. $181.73 $10,649 $10,638 26% 2.2 26% 22% 20% 26% 41% 14.9x 12.2x 36.7x 29.2x 57.5x 45.4x
The Sage Group plc $8.79 $9,540 $10,387 4% 5.7 12% 7% 1% 8% 26% 3.9x 3.7x 15.3x 14.2x 21.5x 19.6x
Coupa Software Incorporated $94.19 $5,599 $5,364 NA NM 36% 21% NA 17% 8% 21.2x 17.4x NM NM NM NM
Xero Limited $33.76 $4,724 $4,967 NA NM 34% 27% 99% 52% 20% 10.7x 8.4x 54.0x 35.5x NM 90.3x
Paylocity Holding Corporation $87.57 $4,634 $4,530 24% 2.6 20% 23% 57% 28% 28% 10.0x 8.1x 35.6x 27.8x 63.0x 48.9x
Q2 Holdings, Inc. $68.82 $2,999 $3,005 24% NM 28% 23% 11% 86% 7% 9.8x 8.0x NM 76.9x NM 145.9x
Envestnet, Inc. $61.01 $2,790 $2,961 16% 1.8 8% 14% 11% 19% 20% 3.4x 2.9x 16.9x 14.3x 29.0x 24.6x
Benefitfocus, Inc. $49.12 $1,574 $1,621 20% NM 17% 19% NM 85% 7% 5.4x 4.5x 74.4x 40.2x NM 106.8x
Blucora, Inc. $26.89 $1,292 $1,468 20% 0.7 6% 7% 8% 12% 22% 2.5x 2.3x 11.4x 10.2x 13.1x 11.4x
Alfa Financial Software Holdings PLC $1.63 $489 $441 NA NM 15% 10% 29% 16% 36% 3.9x 3.5x 10.9x 9.4x 0.2x 0.1x
Median 20% 2.4 20% 19% 20% 19% 22% 9.1x 8.0x 25.4x 25.2x 29.0x 38.3x
Information Services
RELX PLC $22.98 $45,031 $53,018 9% 2.2 10% 5% 12% 3% 36% 5.1x 4.8x 14.1x 13.7x 19.0x 17.7x
S&P Global Inc. $200.37 $49,812 $51,539 13% 1.8 4% 6% 6% 7% 51% 7.9x 7.4x 15.6x 14.5x 22.1x 20.0x
Moody's Corporation $173.12 $33,118 $36,982 11% 2.1 5% 6% 5% 7% 48% 7.9x 7.5x 16.6x 15.5x 22.0x 19.8x
Thomson Reuters Corporation $54.35 $27,264 $27,698 10% 4.6 8% 3% 8% 28% 24% 4.7x 4.5x 19.8x 15.5x 46.1x 30.0x
Experian plc $26.10 $23,518 $26,948 9% 2.6 4% 9% 4% 11% 34% 5.4x 4.9x 15.7x 14.1x 24.2x 21.8x
IHS Markit Ltd. $53.17 $21,236 $26,796 10% 2.0 11% 6% 12% 8% 39% 6.0x 5.7x 15.3x 14.1x 20.8x 18.5x
Verisk Analytics, Inc. $126.43 $20,673 $23,253 10% 2.8 7% 7% 9% 8% 48% 9.1x 8.5x 18.9x 17.5x 28.5x 25.7x
Wolters Kluwer N.V. $66.03 $17,968 $20,287 9% 2.4 6% 4% 6% 5% 28% 3.9x 3.8x 13.9x 13.2x 21.5x 20.0x
MSCI Inc. $184.72 $15,576 $17,248 10% 3.1 7% 10% 8% 11% 55% 11.3x 10.3x 20.6x 18.5x 30.6x 26.3x
Nielsen Holdings plc $26.20 $9,313 $17,176 8% 1.7 (1%) 2% (0%) 10% 28% 2.7x 2.6x 9.3x 8.5x 14.2x 11.6x
TransUnion $64.56 $11,989 $15,834 18% 1.4 11% 8% 12% 10% 39% 6.1x 5.6x 15.4x 14.0x 24.6x 21.3x
Equifax Inc. $109.51 $13,218 $15,630 8% 2.4 2% 6% 2% 10% 34% 4.5x 4.2x 13.3x 12.1x 19.3x 17.5x
Informa plc $9.37 $11,730 $15,308 6% 2.3 27% 3% 31% 6% 34% 4.0x 3.9x 11.8x 11.1x 13.6x 12.8x
Gartner, Inc. $142.30 $12,766 $14,891 14% 2.5 7% 11% 3% 12% 17% 3.5x 3.1x 20.2x 18.0x 35.8x 30.5x
FactSet Research Systems Inc. $235.17 $8,945 $9,322 11% 2.1 6% 6% 10% 9% 35% 6.4x 6.0x 18.3x 16.8x 24.1x 21.7x
Fair Isaac Corporation $247.82 $7,204 $7,957 10% 3.4 8% 7% NA NA NA 6.9x 6.5x NM NM 34.5x 31.1x
News Corporation $13.02 $7,619 $7,655 (34%) (1.0) 3% 1% 6% 8% 13% 0.7x 0.7x 5.9x 5.5x 34.5x 28.0x
CoreLogic, Inc. $36.67 $2,937 $4,645 8% 1.8 (7%) 2% (6%) 8% 28% 2.8x 2.8x 10.0x 9.3x 15.1x 13.1x
LiveRamp Holdings, Inc. $53.75 $3,668 $2,121 25% NM (56%) 29% (135%) NA (12%) 6.2x 4.8x NM NM NM NM
Euromoney Institutional Investor PLC $17.02 $1,830 $1,728 7% 2.2 4% 5% 3% 6% 28% 3.1x 3.0x 11.4x 10.7x 16.4x 15.5x
comScore, Inc. $21.81 $1,295 $1,432 6% NM 5% 11% 119% 115% 6% 3.3x 3.0x 56.8x 26.5x NM NM
National Research Corporation $38.93 $965 $998 NA NM 6% NA NA NA NA 7.9x NM NM NM 9.1x NM
Forrester Research, Inc. $50.20 $917 $772 16% 1.9 29% NA 21% NA 11% 1.7x 1.5x 14.6x 11.9x 31.2x 24.9x
Median 10% 2.2 6% 6% 6% 8% 34% 5.1x 4.7x 15.4x 14.0x 22.1x 20.7x
($MM, except per share data)Stock EPS Operating Metrics Trading Metrics
Price Equity Enterprise Long Term Revenue Growth EBITDA Growth EBITDA Margin EV / Revenue EV / EBITDA Price / EPS
Company 2/28/19 Value Value Growth PEG 19E/18A 20E/19E 19E/18A 20E/19E 19E 19E 20E 19E 20E 19E 20E

17
PUBLIC COMPANY VALUATIONS (CONT’D)
Inve
stm
ent
Tech
no
logy
Notes: Source: CapIq. Pitchbook.Multiples based on CapIq Consensus Estimates. Multiples <0 and >100 considered NM.
Insu
ran
ce T
ech
no
logy
Insurance Technology
Verisk Analytics, Inc. $126.43 $20,673 $23,253 10% 2.8 7% 7% 9% 8% 48% 9.1x 8.5x 18.9x 17.5x 28.5x 25.7x
Guidewire Software, Inc. $91.74 $7,434 $6,651 14% 5.8 27% 20% 12% 19% 22% 10.2x 8.5x 46.2x 38.9x 83.4x 70.6x
HealthEquity, Inc. $80.48 $5,021 $4,691 30% 2.1 18% 17% 18% 17% 40% 13.9x 11.9x 34.8x 29.6x 61.2x 50.5x
Ebix, Inc. $58.27 $1,822 $2,379 15% 0.9 25% 39% 22% 24% 32% 3.9x 2.8x 11.9x 9.6x 13.0x 10.4x
Benefitfocus, Inc. $49.12 $1,574 $1,621 20% NM 9% 12% 94% 97% 4% 6.3x 5.6x NM 84.9x NM NM
eHealth, Inc. $53.41 $1,166 $1,158 NA NM 31% 13% NA 139% 5% 5.1x 4.5x NM 46.1x NM 78.5x
CorVel Corporation $67.30 $1,254 $1,158 NA NM 8% NA 2% NA 12% 1.9x NM 16.3x NM NM NM
Sapiens International Corporation N.V. $13.70 $683 $697 5% 4.1 10% 8% 24% 12% 17% 2.2x 2.0x 13.0x 11.6x 20.6x 16.9x
Crawford & Company $10.28 $551 $688 NA NM 3% 4% (1%) 3% 11% 0.6x 0.6x 5.5x 5.3x 12.1x 10.9x
Majesco $7.28 $312 $311 NA NM NA NA NA NA NA NM NM NM NM NM NM
Median 15% 2.8 10% 13% 15% 18% 17% 5.1x 5.1x 16.3x 23.6x 24.6x 25.7x
Investment Technology
The Bank of New York Mellon Corporation $52.48 $50,110 $73,176 10% 1.3 6% 3% NA NA NA 4.4x 4.3x NM NM 12.3x 11.9x
State Street Corporation $71.87 $27,214 $34,413 14% 0.7 8% 5% NA NA NA 2.9x 2.7x NM NM 9.6x 8.8x
The Charles Schwab Corporation $46.01 $61,326 $27,348 19% 0.9 9% 6% 14% 4% 50% 2.5x 2.3x 4.9x 4.7x 16.5x 14.9x
TD Ameritrade Holding Corporation $56.33 $31,565 $26,680 23% 0.6 5% 8% 19% 11% 54% 4.4x 4.1x 8.2x 7.4x 13.9x 12.3x
Northern Trust Corporation $93.20 $20,356 $23,751 11% 1.3 12% 12% NA NA NA 4.0x 3.6x NM NM 14.1x 12.8x
SS&C Technologies Holdings, Inc. $61.58 $15,445 $23,534 15% 1.1 36% 4% 46% 7% 39% 5.0x 4.8x 12.6x 11.7x 16.2x 14.7x
Broadridge Financial Solutions, Inc. $101.25 $11,713 $12,657 10% 2.1 6% 5% 14% 5% 20% 2.8x 2.7x 13.6x 13.0x 21.0x 19.3x
Computershare Limited $12.26 $6,657 $8,105 10% 1.7 4% 1% 11% 6% 31% 3.4x 3.4x 11.0x 10.4x 16.4x 15.5x
SEI Investments Co. $52.75 $8,107 $7,353 12% 1.4 1% 6% 11% 10% 35% 4.5x 4.2x 12.7x 11.6x 17.0x 15.0x
SimCorp A/S $90.13 $3,579 $3,525 15% 2.3 10% 8% 12% 7% 29% 7.3x 6.8x 25.1x 23.5x 35.4x 32.5x
Envestnet, Inc. $61.01 $2,790 $2,961 16% 1.8 8% 14% 11% 19% 20% 3.4x 2.9x 16.9x 14.3x 29.0x 24.6x
IRESS Limited $8.53 $1,459 $1,581 10% 2.5 8% 6% 18% 9% 28% 4.5x 4.2x 16.2x 14.8x 24.8x 22.2x
Blucora, Inc. $26.89 $1,292 $1,468 20% 0.7 6% 7% 8% 12% 22% 2.5x 2.3x 11.4x 10.2x 13.1x 11.4x
Equiniti Group plc $2.67 $956 $1,361 NA NM 9% 4% 13% 7% 25% 1.9x 1.8x 7.7x 7.2x 10.1x 9.6x
Sanne Group plc $6.85 $981 $1,031 NA NM 20% 12% 24% 13% 34% 4.7x 4.2x 13.9x 12.3x 17.3x 15.4x
First Derivatives plc $29.11 $762 $793 NA NM 17% 11% 16% 11% 18% 2.6x 2.3x 14.2x 12.8x 25.1x 22.5x
StatPro Group plc $1.52 $100 $130 NA NM 10% 5% 16% 8% 17% 1.7x 1.6x 9.7x 9.0x 13.6x 12.2x
Median 14% 1.3 8% 6% 14% 9% 28% 3.4x 3.4x 12.7x 11.7x 16.4x 14.9x
($MM, except per share data)Stock EPS Operating Metrics Trading Metrics
Price Equity Enterprise Long Term Revenue Growth EBITDA Growth EBITDA Margin EV / Revenue EV / EBITDA Price / EPS
Company 2/28/19 Value Value Growth PEG 19E/18A 20E/19E 19E/18A 20E/19E 19E 19E 20E 19E 20E 19E 20E

18
PUBLIC COMPANY VALUATIONS (CONT’D)
Notes: Source: CapIq. Pitchbook.Multiples based on CapIq Consensus Estimates. Multiples <0 and >100 considered NM.
Liq
uid
ity
Ve
nu
es
Liquidity Venues
CME Group Inc. $181.91 $65,087 $68,040 10% 2.6 17% 7% 9% 9% 66% 13.5x 12.6x 20.4x 18.7x 25.8x 23.4x
Intercontinental Exchange, Inc. $77.15 $43,860 $50,577 9% 2.3 5% 6% 6% 7% 65% 9.6x 9.1x 14.9x 13.9x 20.3x 18.1x
Hong Kong Exchanges and Clearing Limited $34.47 $43,012 $40,040 10% 3.3 9% 12% 12% 12% 76% 18.1x 16.2x 23.8x 21.3x 32.5x 28.6x
Deutsche Börse Aktiengesellschaft $126.52 $23,189 $24,679 11% 1.6 6% 7% 7% 8% 61% 7.3x 6.9x 12.0x 11.1x 18.5x 16.9x
London Stock Exchange Group plc $59.91 $20,718 $21,593 12% 1.9 12% 6% 20% 9% 53% 7.1x 6.7x 13.5x 12.4x 22.8x 20.1x
Nasdaq, Inc. $91.57 $15,148 $18,332 8% 2.5 4% 4% 3% 12% 51% 7.3x 7.0x 14.3x 12.8x 19.0x 16.7x
B3 S.A. - Brasil, Bolsa, Balcão $8.74 $17,876 $17,367 15% 1.5 15% 11% 20% 10% 73% 12.1x 10.9x 16.4x 15.0x 22.5x 20.0x
Cboe Global Markets, Inc. $95.91 $10,703 $11,608 12% 1.7 20% (0%) 23% (0%) 68% 9.7x 9.8x 14.3x 14.3x 20.1x 19.9x
MarketAxess Holdings Inc. $243.88 $9,898 $9,563 NA NM 12% 11% 12% 13% 56% 19.7x 17.7x 35.4x 31.3x 47.9x 42.2x
ASX Limited $49.59 $9,600 $8,797 5% 5.8 6% 4% 6% 4% 75% 14.0x 13.4x 18.6x 17.9x 28.0x 26.9x
Singapore Exchange Limited $5.80 $6,210 $5,693 5% 3.9 7% 4% 10% 5% 59% 8.3x 8.0x 14.2x 13.5x 21.0x 20.2x
Euronext N.V. $61.10 $4,245 $4,356 8% 1.9 3% 4% 4% 7% 58% 6.0x 5.7x 10.4x 9.7x 15.1x 14.0x
TMX Group Limited $62.75 $3,501 $4,142 NA NM 7% 5% 12% 7% 56% 6.5x 6.2x 11.5x 10.7x 15.1x 13.7x
Bolsas y Mercados Españoles, Sociedad Holding de Mercados y Sistemas Financieros, S.A.$28.56 $2,375 $2,013 4% 3.8 2% 2% 3% 2% 61% 5.6x 5.5x 9.2x 9.0x 15.0x 14.6x
Bursa Malaysia Berhad $1.74 $1,406 $1,314 7% 3.5 4% 4% 2% 4% 59% 9.5x 9.1x 16.1x 15.6x 25.0x 24.0x
Bolsa Mexicana de Valores, S.A.B. de C.V. $2.09 $1,237 $1,099 9% 1.8 9% 8% 9% 16% 55% 5.6x 5.2x 10.2x 8.8x 16.6x 15.3x
JSE Limited $11.49 $983 $804 NA NM 14% 9% 19% 9% 50% 4.6x 4.2x 9.3x 8.5x 13.4x 12.5x
Gielda Papierów Wartosciowych w Warszawie S.A. $10.64 $447 $361 NA NM (5%) (1%) (9%) (3%) 56% 4.1x 4.1x 7.3x 7.6x 13.0x 14.1x
Hellenic Exchanges - Athens Stock Exchange SA $4.76 $287 $202 47% 0.8 17% 16% 55% 36% 38% 5.6x 4.9x 14.9x 11.0x 37.8x 26.0x
Median 9% 2.3 7% 6% 9% 8% 59% 7.3x 7.0x 14.3x 12.8x 20.3x 19.9x
($MM, except per share data)Stock EPS Operating Metrics Trading Metrics
Price Equity Enterprise Long Term Revenue Growth EBITDA Growth EBITDA Margin EV / Revenue EV / EBITDA Price / EPS
Company 2/28/19 Value Value Growth PEG 19E/18A 20E/19E 19E/18A 20E/19E 19E 19E 20E 19E 20E 19E 20E
19
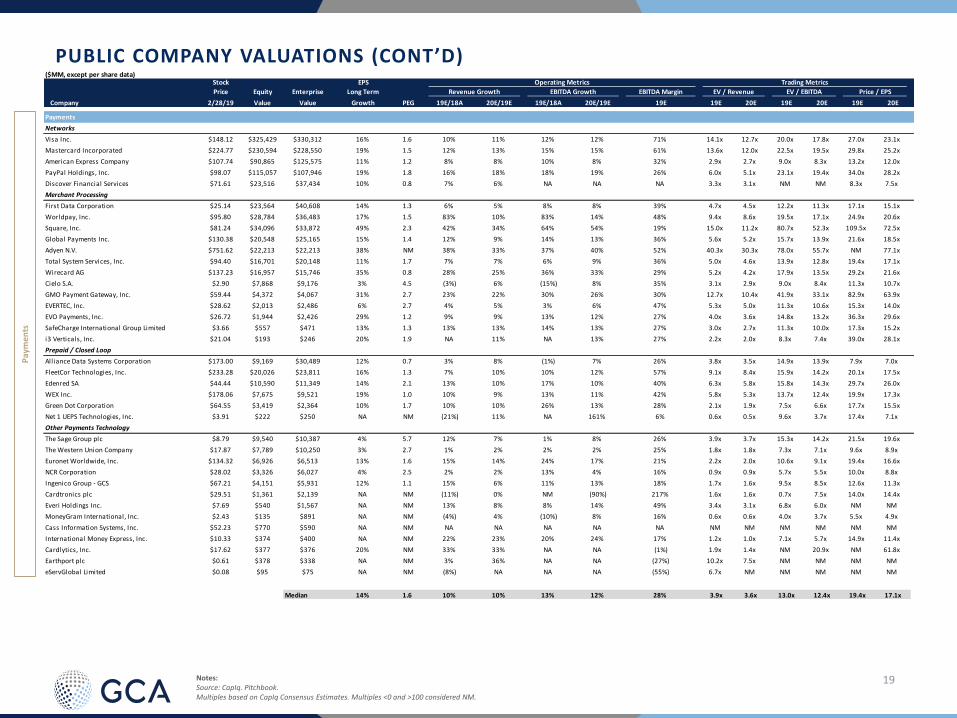
PUBLIC COMPANY VALUATIONS (CONT’D)
Notes: Source: CapIq. Pitchbook.Multiples based on CapIq Consensus Estimates. Multiples <0 and >100 considered NM.
Pa
ymen
ts
Payments
Networks
Visa Inc. $148.12 $325,429 $330,312 16% 1.6 10% 11% 12% 12% 71% 14.1x 12.7x 20.0x 17.8x 27.0x 23.1x
Mastercard Incorporated $224.77 $230,594 $228,550 19% 1.5 12% 13% 15% 15% 61% 13.6x 12.0x 22.5x 19.5x 29.8x 25.2x
American Express Company $107.74 $90,865 $125,575 11% 1.2 8% 8% 10% 8% 32% 2.9x 2.7x 9.0x 8.3x 13.2x 12.0x
PayPal Holdings, Inc. $98.07 $115,057 $107,946 19% 1.8 16% 18% 18% 19% 26% 6.0x 5.1x 23.1x 19.4x 34.0x 28.2x
Discover Financial Services $71.61 $23,516 $37,434 10% 0.8 7% 6% NA NA NA 3.3x 3.1x NM NM 8.3x 7.5x
Merchant Processing
First Data Corporation $25.14 $23,564 $40,608 14% 1.3 6% 5% 8% 8% 39% 4.7x 4.5x 12.2x 11.3x 17.1x 15.1x
Worldpay, Inc. $95.80 $28,784 $36,483 17% 1.5 83% 10% 83% 14% 48% 9.4x 8.6x 19.5x 17.1x 24.9x 20.6x
Square, Inc. $81.24 $34,096 $33,872 49% 2.3 42% 34% 64% 54% 19% 15.0x 11.2x 80.7x 52.3x 109.5x 72.5x
Global Payments Inc. $130.38 $20,548 $25,165 15% 1.4 12% 9% 14% 13% 36% 5.6x 5.2x 15.7x 13.9x 21.6x 18.5x
Adyen N.V. $751.62 $22,213 $22,213 38% NM 38% 33% 37% 40% 52% 40.3x 30.3x 78.0x 55.7x NM 77.1x
Total System Services, Inc. $94.40 $16,701 $20,148 11% 1.7 7% 7% 6% 9% 36% 5.0x 4.6x 13.9x 12.8x 19.4x 17.1x
Wirecard AG $137.23 $16,957 $15,746 35% 0.8 28% 25% 36% 33% 29% 5.2x 4.2x 17.9x 13.5x 29.2x 21.6x
Cielo S.A. $2.90 $7,868 $9,176 3% 4.5 (3%) 6% (15%) 8% 35% 3.1x 2.9x 9.0x 8.4x 11.3x 10.7x
GMO Payment Gateway, Inc. $59.44 $4,372 $4,067 31% 2.7 23% 22% 30% 26% 30% 12.7x 10.4x 41.9x 33.1x 82.9x 63.9x
EVERTEC, Inc. $28.62 $2,013 $2,486 6% 2.7 4% 5% 3% 6% 47% 5.3x 5.0x 11.3x 10.6x 15.3x 14.0x
EVO Payments, Inc. $26.72 $1,944 $2,426 29% 1.2 9% 9% 13% 12% 27% 4.0x 3.6x 14.8x 13.2x 36.3x 29.6x
SafeCharge International Group Limited $3.66 $557 $471 13% 1.3 13% 13% 14% 13% 27% 3.0x 2.7x 11.3x 10.0x 17.3x 15.2x
i3 Verticals, Inc. $21.04 $193 $246 20% 1.9 NA 11% NA 13% 27% 2.2x 2.0x 8.3x 7.4x 39.0x 28.1x
Prepaid / Closed Loop
Alliance Data Systems Corporation $173.00 $9,169 $30,489 12% 0.7 3% 8% (1%) 7% 26% 3.8x 3.5x 14.9x 13.9x 7.9x 7.0x
FleetCor Technologies, Inc. $233.28 $20,026 $23,811 16% 1.3 7% 10% 10% 12% 57% 9.1x 8.4x 15.9x 14.2x 20.1x 17.5x
Edenred SA $44.44 $10,590 $11,349 14% 2.1 13% 10% 17% 10% 40% 6.3x 5.8x 15.8x 14.3x 29.7x 26.0x
WEX Inc. $178.06 $7,675 $9,521 19% 1.0 10% 9% 13% 11% 42% 5.8x 5.3x 13.7x 12.4x 19.9x 17.3x
Green Dot Corporation $64.55 $3,419 $2,364 10% 1.7 10% 10% 26% 13% 28% 2.1x 1.9x 7.5x 6.6x 17.7x 15.5x
Net 1 UEPS Technologies, Inc. $3.91 $222 $250 NA NM (21%) 11% NA 161% 6% 0.6x 0.5x 9.6x 3.7x 17.4x 7.1x
Other Payments Technology
The Sage Group plc $8.79 $9,540 $10,387 4% 5.7 12% 7% 1% 8% 26% 3.9x 3.7x 15.3x 14.2x 21.5x 19.6x
The Western Union Company $17.87 $7,789 $10,250 3% 2.7 1% 2% 2% 2% 25% 1.8x 1.8x 7.3x 7.1x 9.6x 8.9x
Euronet Worldwide, Inc. $134.32 $6,926 $6,513 13% 1.6 15% 14% 24% 17% 21% 2.2x 2.0x 10.6x 9.1x 19.4x 16.6x
NCR Corporation $28.02 $3,326 $6,027 4% 2.5 2% 2% 13% 4% 16% 0.9x 0.9x 5.7x 5.5x 10.0x 8.8x
Ingenico Group - GCS $67.21 $4,151 $5,931 12% 1.1 15% 6% 11% 13% 18% 1.7x 1.6x 9.5x 8.5x 12.6x 11.3x
Cardtronics plc $29.51 $1,361 $2,139 NA NM (11%) 0% NM (90%) 217% 1.6x 1.6x 0.7x 7.5x 14.0x 14.4x
Everi Holdings Inc. $7.69 $540 $1,567 NA NM 13% 8% 8% 14% 49% 3.4x 3.1x 6.8x 6.0x NM NM
MoneyGram International, Inc. $2.43 $135 $891 NA NM (4%) 4% (10%) 8% 16% 0.6x 0.6x 4.0x 3.7x 5.5x 4.9x
Cass Information Systems, Inc. $52.23 $770 $590 NA NM NA NA NA NA NA NM NM NM NM NM NM
International Money Express, Inc. $10.33 $374 $400 NA NM 22% 23% 20% 24% 17% 1.2x 1.0x 7.1x 5.7x 14.9x 11.4x
Cardlytics, Inc. $17.62 $377 $376 20% NM 33% 33% NA NA (1%) 1.9x 1.4x NM 20.9x NM 61.8x
Earthport plc $0.61 $378 $338 NA NM 3% 36% NA NA (27%) 10.2x 7.5x NM NM NM NM
eServGlobal Limited $0.08 $95 $75 NA NM (8%) NA NA NA (55%) 6.7x NM NM NM NM NM
Median 14% 1.6 10% 10% 13% 12% 28% 3.9x 3.6x 13.0x 12.4x 19.4x 17.1x
($MM, except per share data)Stock EPS Operating Metrics Trading Metrics
Price Equity Enterprise Long Term Revenue Growth EBITDA Growth EBITDA Margin EV / Revenue EV / EBITDA Price / EPS
Company 2/28/19 Value Value Growth PEG 19E/18A 20E/19E 19E/18A 20E/19E 19E 19E 20E 19E 20E 19E 20E

20
PUBLIC COMPANY VALUATIONS (CONT’D)
Notes: Source: CapIq. Pitchbook.Multiples based on CapIq Consensus Estimates. Multiples <0 and >100 considered NM.
Rea
l Est
ate
& M
ort
gage
Te
ch.
Trad
ing
Tech
.
Real Estate & Mortgage Technology
Booking Holdings Inc. $1,697.04 $76,388 $78,778 15% 1.1 7% 11% 5% 10% 39% 5.1x 4.6x 13.1x 11.9x 16.8x 15.1x
Expedia Group, Inc. $123.31 $18,150 $19,396 19% 0.9 10% 10% 14% 12% 18% 1.6x 1.4x 8.7x 7.7x 17.8x 15.2x
CoStar Group, Inc. $457.53 $16,678 $15,577 17% 2.7 16% 15% 19% 19% 36% 11.3x 9.8x 31.3x 26.3x 45.9x 39.0x
Fidelity National Financial, Inc. $35.09 $9,661 $9,180 NA NM (2%) 2% 12% 4% 15% 1.2x 1.2x 8.4x 8.1x 12.9x 11.9x
Black Knight, Inc. $52.25 $7,730 $9,050 12% 2.2 7% 8% 9% 10% 50% 7.6x 7.1x 15.3x 14.0x 26.8x 23.2x
Ocwen Financial Corporation $2.14 $287 $8,074 NA NM 13% 7% NA NA NA 6.7x 6.3x NM NM NM NM
Jones Lang LaSalle Incorporated $165.12 $7,533 $8,058 13% 1.2 3% 3% (4%) 10% 10% 0.9x 0.8x 8.8x 7.9x 14.5x 13.3x
REA Group Limited $57.96 $7,634 $7,810 13% 2.3 12% 11% 15% 14% 58% 11.3x 10.2x 19.5x 17.1x 30.3x 26.3x
Zillow Group, Inc. $41.43 $8,476 $7,770 5% NM 51% 32% (74%) 123% 3% 3.9x 2.9x NM 67.0x NM NM
TripAdvisor, Inc. $53.17 $7,345 $6,758 13% 2.1 8% 9% 12% 12% 27% 3.9x 3.6x 14.3x 12.7x 27.5x 23.9x
RealPage, Inc. $61.21 $5,587 $5,956 NA NM 14% 11% 22% 16% 28% 6.0x 5.4x 21.2x 18.2x 35.0x 30.1x
Rightmove plc $6.41 $5,699 $5,690 13% 1.8 13% 8% 13% 8% 76% 14.8x 13.8x 19.4x 18.1x 24.4x 22.2x
Radian Group Inc. $20.36 $4,346 $5,281 6% 1.3 11% 6% NA NA NA 3.7x 3.5x NM NM 7.3x 6.7x
Realogy Holdings Corp. $13.60 $1,543 $5,113 NA NM (1%) 4% (8%) 6% 10% 0.9x 0.8x 8.4x 7.9x 9.8x 8.1x
First American Financial Corporation $50.79 $5,662 $4,967 11% 1.0 0% 2% 11% 5% 15% 0.9x 0.8x 5.8x 5.5x 11.2x 10.7x
CoreLogic, Inc. $36.67 $2,937 $4,645 8% 1.8 (7%) 2% (6%) 8% 28% 2.8x 2.8x 10.0x 9.3x 15.1x 13.1x
LendingTree, Inc. $318.95 $4,086 $4,357 32% 1.3 35% 18% 37% 23% 20% 4.2x 3.6x 20.7x 16.8x 41.5x 31.7x
Colliers International Group Inc. $68.28 $2,687 $3,232 19% 0.8 10% 7% 20% 8% 12% 1.0x 1.0x 8.7x 8.0x 14.6x 13.6x
Ellie Mae, Inc. $99.49 $3,471 $3,168 15% 3.5 6% 9% 19% 13% 29% 6.2x 5.7x 21.7x 19.3x 51.8x 44.7x
Moneysupermarket.com Group PLC $4.58 $2,458 $2,420 NA NM 14% 4% 13% 7% 36% 4.7x 4.5x 12.9x 12.1x 18.7x 17.1x
AppFolio, Inc. $72.28 $2,451 $2,410 18% 3.2 26% 24% 57% 34% 27% 10.1x 8.1x 37.8x 28.3x 58.3x 40.7x
Redfin Corporation $19.97 $1,807 $1,493 NA NM 30% 27% 63% NM 1% 3.1x 2.5x NM 53.9x NM NM
Marcus & Mill ichap, Inc. $38.62 $1,499 $1,155 6% 2.8 3% 3% (2%) 5% 15% 1.4x 1.3x 9.1x 8.7x 16.6x 16.0x
Stewart Information Services Corporation $42.93 $1,019 $912 NA NM 1% 2% 15% 19% 7% 0.5x 0.5x 6.8x 5.7x 15.3x 12.4x
RE/MAX Holdings, Inc. $39.23 $697 $864 150% 0.1 21% 3% 2% 6% 41% 3.3x 3.2x 8.1x 7.7x 17.5x 16.4x
Lifull Co., Ltd. $5.71 $766 $729 21% 1.1 19% 14% 18% 17% 16% 1.9x 1.7x 11.9x 10.2x 22.3x 17.9x
Altisource Portfolio Solutions S.A. $25.07 $409 $651 NA NM (14%) NA (24%) NA 8% 0.8x NM 10.1x NM 11.9x NM
QuinStreet, Inc. $13.39 $667 $604 25% 1.2 9% 16% 27% 32% 11% 1.2x 1.1x 11.6x 8.8x 29.1x 19.2x
Agilysys, Inc. $20.90 $482 $445 NA NM 13% 15% (12%) 74% 6% 2.9x 2.5x 46.1x 26.5x NM NM
Real Matters Inc. $3.75 $327 $257 59% 0.9 (7%) 2% (38%) 109% 2% 0.9x 0.9x 44.4x 21.2x 53.6x 46.9x
$30
Median 15% 1.3 10% 8% 13% 12% 17% 3.2x 2.9x 12.4x 12.1x 18.2x 17.1x
Trading Technology
The Charles Schwab Corporation $46.01 $61,326 $27,348 19% 0.9 9% 6% 14% 4% 50% 2.5x 2.3x 4.9x 4.7x 16.5x 14.9x
TD Ameritrade Holding Corporation $56.33 $31,565 $26,680 23% 0.6 5% 8% 19% 11% 54% 4.4x 4.1x 8.2x 7.4x 13.9x 12.3x
E*TRADE Financial Corporation $48.99 $11,969 $12,029 19% 0.6 4% 4% 4% 6% 54% 4.0x 3.9x 7.4x 7.0x 11.8x 10.6x
Virtu Financial, Inc. $25.14 $2,669 $3,560 NA NM (1%) 4% (12%) 18% 55% 3.5x 3.4x 6.5x 5.5x 14.2x 11.7x
Interactive Brokers Group, Inc. $55.23 $4,148 $2,416 20% 1.1 8% 12% 61% 11% 97% 1.2x 1.0x 1.2x 1.1x 22.8x 20.2x
GAIN Capital Holdings, Inc. $6.90 $306 $211 8% 1.8 (6%) 6% (4%) NA 25% 0.6x 0.6x 2.5x NM 13.3x 10.1x
INTL FCStone Inc. $43.50 $830 ($909) NA NM NA NA NA NA NA NM NM NM NM NM NM
Median 19% 0.9 5% 6% 9% 11% 54% 3.0x 2.9x 5.7x 5.5x 14.0x 12.0x
($MM, except per share data)Stock EPS Operating Metrics Trading Metrics
Price Equity Enterprise Long Term Revenue Growth EBITDA Growth EBITDA Margin EV / Revenue EV / EBITDA Price / EPS
Company 2/28/19 Value Value Growth PEG 19E/18A 20E/19E 19E/18A 20E/19E 19E 19E 20E 19E 20E 19E 20E

Global investment bank that provides strategic M&A and capital markets advisory services to growth companies and market leaders
GCA: A LEADING INDEPENDENT GLOBAL INVESTMENT BANK
GCA operates as GCA in America and Asia, and GCA Altium in Europe
NEW YORK
ZURICH
MILAN
FRANKFURT
MUNICH
TEL AVIVSAN FRANCISCO
LONDON
MANCHESTER
MUMBAI
OSAKA
SHANGHAI
SINGAPORE
TOKYO
NEW DELHI
NAGOYA
HO CHI MINH CITY
TAIPEI
Globally integrated
platform with 21
offices across
America, Asia and
Europe
Geographically balanced,
synergistic and complementary
sector focus areas
across the firm
Strong in key
growth sectors
such as Technology and Industrials
Strong cross-border
capabilities and
deal flow with 35%
of all transactions
cross-border
400+professionals
375+ deals closed in the last 3 years
PARISLEEDS
FUKUOKA