fire in your hands: understanding thermal behavior of...
TRANSCRIPT
Fire in Your Hands: Understanding Thermal Behaviorof Smartphones
Soowon Kang∗, Hyeonwoo Choi†, Sooyoung Park∗, Chunjong Park‡, Jemin Lee§,Uichin Lee∗, Sung-Ju Lee∗
∗KAIST †Samsung Electronics ‡University of Washington §ETRI
ABSTRACTOverheating smartphones could hamper user experiences.While there have been numerous reports on smartphoneoverheating, a systematic measurement and user experiencestudy on the thermal aspect of smartphones is missing. Us-ing thermal imaging cameras, we measure and analyze thetemperatures of various smartphones running diverse ap-plication workloads such as voice calling, video recording,video chatting, and 3D online gaming. Our experiments showthat running popular applications such as video chat, couldraise the smartphone’s surface temperature to over 50◦Cin only 10 minutes, which could easily cause thermal painto users. Recent ubiquitous scenarios such as augmentedreality and mobile deep learning also have considerable ther-mal issues. We then perform a user study to examine whenthe users perceive heat discomfort from the smartphonesand how they react to overheating. Most of our user studyparticipants reported considerable thermal discomfort whileplaying a mobile game, and that overheating disrupted in-teraction flows. With this in mind, we devise a smartphonesurface temperature prediction model, by using only systemstatistics and internal sensor values. Our evaluation showedhigh prediction accuracy with root-mean-square errors ofless than 2◦C. We discuss several insights from our findingsand recommendations for user experience, OS design, anddeveloper support for better user-thermal interactions.
CCS CONCEPTS• Hardware → Thermal issues; Analysis and design ofemerging devices and systems; • Human-centered com-puting→ Smartphones; User studies; • General and ref-erence → Measurement.
KEYWORDSSmartphones; Thermal characteristics; Thermal imaging cam-era; Thermal modeling; User guidance
1 INTRODUCTIONElectronic devices, including smartphones contain electricelements that generate heat. In a competitive smartphones
market, the manufacturers constantly enhance the comput-ing performance and diversify functionalities, which couldresult in generating a great amount of heat. Users have recog-nized the smartphone thermal problem, as many reviews andarticles [4, 38] empirically highlight the smartphone over-heating issues. Heat, if not handled properly, can not onlydegrade the processors’ performance and damage the battery,but also degrade user experiences [57], aggravate a thermal-regulatory disorder [65], and pose health threats (e.g., ther-mal pain [37], skin burns [33], skin aging [54]).Overheating problem is well-known in the field of elec-
tronic devices and various cooling technologies have beenproposed (e.g., using proper thermal conductivity materials,dynamic voltage and frequency scaling (DVFS), etc.). Despitesuch techniques, overheating in smartphones is challengingdue to small form factors, high power density, and close phys-ical contact with the human body [53], and thus needs carefulinvestigation. Prior work highlighted the importance andchallenges of thermal management in mobile and wearabledevices [53]: thermal models of smartphones [27], thermalmanagement schemes [24], and thermal characteristics ofsmart glasses [39]. However, what is missing is systemati-cally exploring when and how much heat smartphones (andeach of their components) generate in practical scenariosand what impact thermal issues have on user experiences.We aim to deepen our understanding of the thermal issues ofsmartphones with systematic thermal measurements undervarious usage scenarios.
Using thermographic cameras [3], we first investigate thethermal characteristics of recent smartphones. We measurethe surface temperature of a wide range of smartphones suchas Android reference phones (Nexus 5, Nexus 5X, Nexus 6,Pixel, and Pixel 2), iOS phones (iPhone 7, iPhone 7+, andiPhone 8), and Android phones (Galaxy S7 and Huawei P20)by considering representative workloads such as video chat-ting, video recording, voice calling, and gaming. We believeour extensive measurement is the first of its kind on smart-phones. We discover that our test smartphones easily reachover 45◦C, which can cause thermal pain. The temperature

Soowon Kang∗, Hyeonwoo Choi†, Sooyoung Park∗, Chunjong Park‡, Jemin Lee§, Uichin Lee∗, Sung-Ju Lee∗
rises in short duration, especially for the camera usage sce-narios; e.g., only 6 minutes for video chat. Applications thatrequire video encoding especially generate excessive heatquickly.
Our component-specific analyses reveal that intensive AP(Application Processor), powermanagement circuit, and cam-era usage are the major heat sources. An AP generates themost heat as it houses multiple sub-components such as CPU,GPU, and multimedia codec, whereas GPS does not generatemuch heat despite its relatively high power consumption.Furthermore, we report that recent ubiquitous scenarios suchas augmented reality, virtual reality andmobile deep learninghave considerable thermal issues.
In addition to systematic measurements, we analyze howsmartphone overheating affects user experiences through auser study. A majority of our participants (75%) reported con-siderable thermal discomfort while playing a mobile gameand complained that overheating disrupted interaction flowsand caused interaction errors. We find the major reasons forthermal discomfort are concerns on health risks and sweat-ing related issues, including sensor malfunction and userinput errors due to slip caused by sweat.With the understanding of thermal issues in user experi-
ences, we propose a model that estimates the surface temper-ature of a smartphone using only system statistics (e.g., CPUusage) and internal sensors (e.g., battery temperature), with-out kernel-level hardware usage information (e.g., currentvideo recording resolution, clock frequency information).After selecting the dominant features, we train a time-seriesregression model each for Nexus 5X and Galaxy S7. For eachsmartphone, our model shows high accuracy (less than 1.2◦Croot-mean-square error (RMSE) for Nexus 5X and 0.523◦CRMSE for Galaxy S7) in both real-time and one minute look-ahead predictions. Our model requires only one-time train-ing, and thus is easily applicable to other smartphone models.We stress that no prior studies systematically examine
the overheating patterns under various workloads and theirimpact on user experiences. Our experiments show that var-ious real-world workloads generate excessive heat, and ouruser study confirm that overheating degrades user experi-ences. Furthermore, emerging ubiquitous applications suchas AR/VR and mobile deep learning also have significantthermal issues. Our results indicate that DVFS alone is notsufficient for managing smartphone surface temperature.There should be a holistic thermal management frameworkthat simultaneously considers multiple components’ thermalcharacteristics (e.g., PMIC, cameras, sensors, and wirelesschipsets). We call for further studies on this important anddifficult thermal problem.
2 BACKGROUND2.1 Thermal Concerns on Mobile DevicesThermal concerns are broadly classified as follows: perfor-mance degradation, negative user experiences, and healthrisks. System performance degrades as the temperature in-creases as mobile thermal management algorithms throttleoperating CPU clock frequencies and switch off cores whendevices overheat. In addition, overheating could hamper userexperience and might even result in skin damage. Discomfortdue to overheating is a concern that smartphone users oftencomplain [4]. A recent user experience research [57] showedthat user burdens, including physical discomfort and pain,negatively influence overall user experiences. Prior humanperception studies showed that a person’s thermal thresholdfor warm sensation is in the range of 33.0◦C to 35.0◦C [28].At a temperature higher than this threshold, a user is likely tofeel discomfort and starts to feel pain at around 42–45◦C [37].Beside such discomfort, there are several health concerns.Heat can accelerate premature skin aging, which graduallyhappens over time due to lack of awareness [54]. In addi-tion, long-term exposure to such thermal condition of mildheating could lead to erythema ab igne, known as the toastedskin syndrome [33]. These temperature thresholds are alsoused in the European Standard (EN563) that provides theergonomic temperature limits for surfaces [17].
2.2 Heat Transfer BasicsIn electric devices, there are two major heat transfer routes:conduction and convection depending on whether heat trans-fer happens through a solid medium or a fluid (e.g., liq-uid/gas). According to thermodynamics principles [19], theheat transfer rates of conduction and convection (q̇) can bemodeled as: kAd ×∆T , andhA×∆T , respectively. Here, k is themedium’s conductivity, and h is the convection heat transfercoefficient, which are dependent on material/fluid properties(e.g., copper’s conductivity is 10,000 times larger than that ofplastic). A is the area, ∆T is the temperature difference (e.g.,between the phone body and its surroundings), and d is thethickness of the medium. According to these equations, theheat transfer rate between two points is proportional to thetemperature difference, the area through which heat transferoccurs, and the heat transfer coefficient of the material/fluid.Smartphones are comprised of multiple layers of elec-
tric components (integrated circuits and wires) with differ-ent thermal conductivities that generate heat due to powerdissipation and Joule heating. Because of the layers’ widesurface area and thinness, heat transfer mostly occurs invertical directions across multiple layers, while relatively mi-nor transfer occurs in horizontal directions. This means thatmore heat transfer occurs via conduction than convection,and the air gap between layers acts as an insulator. Overall,

Fire in Your Hands: Understanding Thermal Behavior of Smartphones
the heat generated from a number of heat sources is trans-ferred through the adjacent materials and is finally releasedto the atmosphere. Typically, the rate of temperature changesteadily decreases and reaches the steady-state (called thesteady-state temperature).
2.3 Mobile Thermal ManagementsVarious cooling methods have been proposed that are gener-ally categorized into passive and active cooling. Passive cool-ing [59] includes the techniques that use the heat pipe [26],heat sink [22], and thermal-interface materials. Active cool-ing [45] includes forced air and forced liquid cooling tech-niques. However, the small form factor and light weight re-quirements of smartphones prevent adopting active coolingand smartphones thus mostly rely on passive cooling.Besides these cooling techniques, thermal management
also happens at an electronic component level. Modern ap-plication processors (APs) support DVFS and CPU hot-plugto manage power consumption and protect devices fromoverheating [16, 58, 61] . A thermal protection mechanismsuppresses temperature increase by reducing power con-sumption via lowering operating voltage/frequency of a CPU,or turning off CPU cores.
The thermal management in Android smartphones is car-ried out by the Linux kernel’s thermal engine. This enginemonitors CPU temperatures from on-die sensors and con-trols the temperature by mainly using two algorithms: dy-namic control and threshold control. The dynamic controlalgorithm checks whether the core temperatures exceedsthe threshold values and determines whether to throttleclock frequency or turn off cores. The threshold values aremanufacturer-dependent and set by the threshold controlalgorithm. Android also implements an additional thermalprotection mechanism by which a device is shut down whenthe battery temperature exceeds the threshold (e.g., 68◦C). Inpractice, device manufactures may configure different thresh-olds owing to the heterogeneity of temperature sensors anddevice characteristics (e.g., Qualcomm DragonBoard 410c’sthreshold of 70◦C for dynamic controlling [50]).
3 PRELIMINARY STUDYWe performed a preliminary measurement study to evalu-ate whether smartphones show thermal issues that couldinfluence user experiences and even cause health problems.
3.1 Measurement SetupWe used FLIR ONE [3], a thermographic camera (also knownas infrared (IR) camera or thermal imaging camera) as thetemperature measurement device. An IR camera is popularlyused in research communities [14, 36, 44, 52] as it shows
Target smartphone
Thermographic camera
Cradle
Figure 1: Measurement setup.
comparable accuracy and precision to those of thermocou-ple, which is known to provide the most accurate tempera-ture measurements. We used FLIR ONE’s Android SDK toimplement an app for automated data collection.
We conducted experiments to investigate the thermal char-acteristics of the smartphones, shown through the surfaceof both the front and back. We fastened a cradle on thetarget smartphone and the distance between the thermalcamera and the target smartphone was fixed, as shown inFigure 1. The main goal of this preliminary study is to iden-tify whether well-known use cases of smartphones couldgenerate significant amount of heat, which could providethermal discomfort, or even skin damage to the users; recallthat users start to feel heat pain at 42–45◦C [37].
To check thermal issues across different phones, we choseAndroid reference phones (Nexus 5, Nexus 5X, Nexus 6, Pixel,and Pixel 2), iOS phones (iPhone 7, iPhone 7+, and iPhone8), and Android phones (Galaxy S7 and Huawei P20 lite). Weconsidered experimental applications often used in our dailylives, ranging from instant messaging to cameras and mobilegames. Our focus was on the major use scenarios that utilizevarious hardware components, such as the application pro-cessor, camera, and wireless network chipset: real-time videoconversations, video recording, mobile gaming, and voicecalling. For video conversations, we chose Google Hang-outs [5] and Microsoft Skype [11], as they are two of themost popular video chat apps. For mobile gaming, we se-lected Abyssrium [12] and PUBG MOBILE (PUBG) [10], twoof the popular games in recent years. For video recording andvoice calling, we used the default app on the smartphones.
We considered the mobile operating systems of Android6.0.1 and iOS 10.2. Note that Galaxy S7 uses Android 7.0,Pixel and P20 lite use Android 8.0.0, Pixel 2 uses Android8.1.0, and iPhone 8 uses iOS 11.4.1; these are the defaultoperating systems shipped. We controlled the running envi-ronments as follows. There were no background processes.All experiments started with the battery fully charged. Auto-update, battery saving, and adaptive screen brightness con-trol modes were disabled. For video recording, we set thesame video resolution (1080p) across multiple devices. For

Soowon Kang∗, Hyeonwoo Choi†, Sooyoung Park∗, Chunjong Park‡, Jemin Lee§, Uichin Lee∗, Sung-Ju Lee∗
25
45
65
0 1000 2000 3000
Tem
pera
ture
(℃
)
Time (sec)
Nexus6
Nexus5X
Pixel2
GalaxyS7
P20
iPhone7
iPhone8
(a) Video chat - Hangouts.
25
45
65
0 1000 2000 3000
Tem
pera
ture
(℃
)
Time (sec)
Nexus6
Nexus5X
Pixel2
GalaxyS7
P20
iPhone7
iPhone8
(b) Video chat - Skype.
25
45
65
0 1000 2000 3000
Tem
pera
ture
(℃
)
Time (sec)
Nexus6
Nexus5X
Pixel2
GalaxyS7
P20
iPhone7
iPhone8
(c) Game - Abyssrium.
25
45
65
0 1000 2000 3000
Tem
pera
ture
(℃
)
Time (sec)
Nexus6
Nexus5X
Pixel2
GalaxyS7
P20
iPhone7
iPhone8
(d) Game - PUBG.
25
45
65
0 1000 2000 3000
Tem
pera
ture
(℃
)
Time (sec)
Nexus6
Nexus5X
Pixel2
GalaxyS7
P20
iPhone7
iPhone8
(e) Video recording.
25
45
65
0 1000 2000 3000
Tem
pera
ture
(℃
)
Time (sec)
Nexus6
Nexus5X
Pixel2
GalaxyS7
P20
iPhone7
iPhone8
(f) Voice calling.
Figure 2: Temperature changes of the hottest regionon each phone while running various target apps.
wireless connectivity, we used Wi-Fi unless otherwise noted.We restricted touch interactions, which happen only whenstarting or ending an app. The mobile gaming scenarios re-quired more touch interactions than others, but we made ourbest effort to minimize the interactions (e.g., by leveragingautoplay modes). The ambient temperature of the labora-tory was maintained between 24◦C and 28◦C. As the heattransfer equation shows, the amount of heat transferred dueto convection (air cooling) is much smaller than that due todirect conduction across multiple components from the heatsources. Thus, a 4◦C variation of room temperature had anegligible effect on our measurement result.We ran each app for 30 minutes, because all our tested
smartphones reached steady-state temperature within 30minutes. The steady-state temperature is considered as themean value of the samples measured for 2 minutes startingfrom the peak temperature in each 30-minute experiment (atotal of 3 measurements performed). Since our measurementtool indicates a 0.3 Hz sampling rate on average, every steady-state temperature is calculated from at least 100 samples.
3.2 ResultsFigure 2 presents the overall thermal characteristics of thesmartphones under various use cases. The apps for each cate-gory show similar temperature change tendencies. After theinitial temperature ramp-up, a smartphone quickly reachesits steady-state. After the running app is closed, it then grad-ually dissipates its heat. The smartphones under considera-tion converged to their steady-state temperatures within 20minutes. Table 1 summarizes the steady-state temperaturefor each smartphone while running various scenarios. Our
Table 1: Steady-state temperature (◦C) for each smart-phone while running various target scenarios (stan-dard Deviation in parenthesis).
Temp. (◦C) Skype Hangouts Abyssrium PUBG Video rec. Voice call
Nexus 5 56.30 (2.76) 53.30 (0.67) 43.90 (0.53) 46.20 (0.62) 49.44 (1.77) 36.86 (1.83)Nexus 6 51.88 (2.66) 49.34 (2.95) 44.13 (1.96) 40.66 (0.08) 47.64 (1.31) 36.88 (0.39)Nexus 5X 58.13 (3.10) 62.28 (3.50) 45.94 (1.18) 45.19 (0.76) 50.79 (0.52) 33.02 (1.61)Pixel 49.90 (1.45) 50.02 (1.19) 45.58 (0.25) 43.74 (1.52) 46.61 (2.51) 38.78 (2.54)Pixel 2 51.12 (0.62) 52.65 (0.12) 36.16 (0.44) 38.27 (0.76) 51.64 (0.75) 36.63 (0.72)Galaxy S7 46.93 (1.44) 45.69 (0.59) 42.68 (0.90) 40.69 (0.51) 45.12 (1.63) 36.52 (0.96)P20 lite 43.36 (0.56) 47.33 (0.46) 37.63 (0.63) 41.48 (1.33) 43.12 (0.94) 36.94 (0.51)iPhone 7 45.85 (2.10) 44.29 (0.89) 39.52 (0.46) 42.32 (0.52) 45.72 (1.21) 35.61 (2.32)iPhone 7+ 46.53 (2.99) 44.34 (0.92) 36.16 (0.71) 41.92 (0.81) 46.57 (1.32) 36.39 (1.32)iPhone 8 39.69 (0.27) 45.30 (0.36) 33.59 (0.42) 38.27 (0.76) 40.05 (0.90) 31.86 (0.23)
APFingerprintSensor
RearCamera
(a) Visible light image.
APFingerprintSensor
RearCamera
(b) Infrared image.
Figure 3: The relative positions of the rear camera, thefingerprint sensor, and the AP of Nexus 5X.
tested smartphones reached the steady-state temperaturesthat were even higher than 45◦C in some cases (i.e., videochatting, video recording, and mobile gaming). The resultsclearly show that thermal issues are prevalent in modernsmartphones, and users could be exposed to high tempera-tures that lead to considerable thermal discomfort.
4 IN-DEPTH THERMAL MEASUREMENTWe learned from Section 3 that thermal concerns are notconfined to specific smartphone models, as all tested smart-phones exhibit thermal issues. To deepen our understandingon thermal characteristics of smartphones, we performedin-depth thermal measurements by focusing on an Androidreference phone (i.e., Nexus 5X). This model has hardwareinformation provided by the kernel, and it is one of the re-cent reference phones with modern thermal managementtechniques. We also performed measurements at the compo-nent level (e.g., AP, power management IC, camera modules)to identify the root causes of excessive heat generation. Inaddition, we measure the surface temperature of variousubiquitous usage scenarios.
4.1 Surface Temperature AnalysisFigure 3 shows the rear side of Nexus 5X including an ex-ample thermographic image captured by the IR camera. Wemeasured the temperature of the surface, both front and back,when running a video chat (Hangouts [5], Skype [11]), video

Fire in Your Hands: Understanding Thermal Behavior of Smartphones
25
45
65
0 1000 2000 3000
Te
mp
era
ture
(℃
)
Time (sec)
Hangouts
Skype
Video rec.
Abyssrium
PUBG
Fast charging
Voice call.
Figure 4: The temperature changes at the fingerprintsensor while running each application.
0
20
40
60
80
Hangouts Skype Video recording Abyssrium PUBG Voice calling Display on
Tem
per
atu
re (℃
)
Figure 5: Mean steady-state temperatures of each sce-nario with three Nexus 5X phones. The error barshows standard deviation.
recording, voice calling, or 3Dmobile games (Abyssrium [12],PUBG [10]), and when charging the battery.
Figure 4 shows the temperature change of the smartphonesurface while running each application. For each experiment,once the temperature reaches the maximum, it stabilizes.When the application is closed, it slowly cools down. Ingeneral, the areas near the fingerprint sensor show highertemperatures than the other regions, as the fingerprint sen-sor has lower thermal resistance than its surroundings. Wemeasured the surface temperature changes of three differ-ent Nexus 5X phones for all the cases to check whether theyshowed consistent trends. Our results in Figure 5 confirmedthat steady-state temperature differences were within theerror range, and only minor temperature variations wereobserved among different phones of the same model.Video chat: It took only 6 minutes to exceed the thermalpain threshold, with Hangouts reaching 62◦C (SD: 3.50) andSkype 58◦C (SD: 3.10) in 30 minutes. When we used the frontcamera during a video chat, the surface temperature slightlydecreased to 55◦C (SD: 1.59). Since the rear-side camera islocated near the fingerprint sensor, the heat from the rearcamera affects the temperature measured at the fingerprintsensor more than that from the front camera. For this rea-son, the video chat using the rear camera showed a highertemperature than that of using the front camera. Regardless,the temperatures in both cases far exceeded the thermal painthreshold. Note that when we turned off the cameras, thetemperature was only 38◦C during a 30-minute experiment.We additionally ran Skype over LTE, and it showed similartemperature changes (58◦C, SD: 1.04) as Skype over Wi-Fi.
Video recording: Video recording showed the second high-est temperature in our experiment. The temperature took 8minutes to exceed the thermal pain threshold, and the valuereached 51◦C (SD: 0.52) in 20 minutes. We examined videorecording with different resolutions. Since higher resolutionrequires more computation, it shows slightly higher tempera-tures than a lower resolution. According to a prior study [41],video encoding typically requires more computation thandecoding. When we simply turned on the built-in camerawithout recording, the temperature reached approximately46◦C in 15 minutes, which is almost similar to that of thevideo recording (48◦C at the 15th minute). In contrast, play-ing a 1080p video (39◦C) or turning on the screen withoutrunning any apps (34◦C) showed a much lower temperaturethan in the camera-enabled case.Game: We tested Abyssrium and PUBG. As the 3D gamesshow diverse graphic effects, the processors must handle var-ious graphic rendering operations. The results revealed thatthe temperatures settle around 45◦C (SD: 0.76), with severalminor peaks and valleys, depending on the occurrence of in-game events. As 45◦C is the pain threshold temperature, thisresult demonstrates that game playing on smartphones for along duration can also be a source of thermal discomfort.Voice call: Voice calling generated the least amount of heatin our experiment, approaching only 33◦C (SD: 1.61), whichis lower than when we only turned on the screen withoutrunning any applications (34◦C). However, unlike other us-age scenarios, the skin contact region for voice calling is theuser’s cheek, which is known to have a high level of thermalsensation [46].Charging: Simply charging the battery also showed mod-erate temperature (about 37◦C), even when we applied fastcharging until the smartphone is fully charged (100 minsfrom 2% to 100%). Therefore, battery charging by itself wouldlikely not cause thermal problems.
However, in our experiment, we found an interesting phe-nomenon in the usage scenarios while charging, i.e., runningvideo chat or video recording at a low battery level. In thebeginning phase of the experiment (only 7% battery level),the temperature at the fingerprint sensor showed similarchanges to that of the non-charging experiment. At this mo-ment, the rate of discharging due to app usage was fasterthan the rate of charging, so the battery level was falling.Interestingly, when the battery level reached 0%, it suddenlyaccelerated the rate of charging and in consequence, the rateof heat generation significantly increased. In the end, thetemperature of the fingerprint sensor rose to 72◦C, whichwas 14◦C higher than that of the non-charging experiment.
We observed a similar pattern when we ran video record-ing while charging at 5% battery level. According to its tech-nical manual, Nexus 5X uses a special charging algorithm [8]that selects the charging rate based on the remaining battery

Soowon Kang∗, Hyeonwoo Choi†, Sooyoung Park∗, Chunjong Park‡, Jemin Lee§, Uichin Lee∗, Sung-Ju Lee∗
0
2
4
6
8
25
35
45
55
65
0 600 1200 1800
Po
wer
(W)
Tem
pera
ture
(℃
)
Time (sec)
TemperaturePower
(a) Hangouts.
0
2
4
6
8
25
35
45
55
65
0 600 1200 1800
Po
wer
(W)
Tem
pera
ture
(℃
)
Time (sec)
TemperaturePower
(b) Skype.
℃
0
2
4
6
8
25
35
45
55
65
0 600 1200 1800
Po
wer
(W)
Tem
pera
ture
(℃
)
Time (sec)
TemperaturePower
(c) Abyssrium.
0
2
4
6
8
25
35
45
55
65
0 600 1200 1800
Po
wer
(W)
Tem
pera
ture
(℃
)
Time (sec)
TemperaturePower
(d) PUBG.
Figure 6: Temperature and power consumption.
level and the computational intensity of the running appli-cation. This phenomenon shows that charging algorithmscould be another heating factor that influences thermal char-acteristics of smartphones.Cooling down: Although each app converges at differenttemperatures at different heating phases, they tend to showsimilar cooling down trends. After the heating phase ends,the smartphone enters the sleep mode, consuming minimalenergy. The heat energy then spreads from the high temper-ature regions to nearby low temperature materials. The rateof heat dispersion into the nearby solid object is faster thanthat into the air, and thus the hottest object shares the heatenergy with the neighboring solid materials. As the objectis cooling off, it finally arrives at the same temperature asthe surrounding materials. Afterward, it loses the remainingheat energy at the same rate until the temperature becomesthe same as the ambient temperature.Energy vs. surface temperature: In order to examine howenergy consumption patterns are related to correspondingthermal behaviors, we recorded the power consumption andtemperature values simultaneously while running four mostheat generating apps (i.e., Skype, Hangouts, Abyssrium andPUBG). We developed a measurement app that records volt-age and current values at an approximately 0.3 Hz samplingrate by accessing the Android system’s proc files [42].
The results in Figure 6 show two interesting observations.There was a surge of power consumption in the beginning,possibly due to app initialization (e.g., data fetching and con-tent loading). Furthermore, there is a tendency of increasingpower consumption even with proactive thermal manage-ment (e.g., DVFS). This phenomenon might be attributed tothe fact that the power leakage increases as the temperaturerises [23, 53].
Figure 7 shows the relationship between energy consump-tion and surface temperature. It shows that four apps con-sumed different amount of energy to reach the same tem-perature, but similar apps showed resembling energy con-sumption patterns. While the amount of heat generated is
25
30
35
40
45
50
55
60
0 2000 4000 6000 8000 10000 12000
Tem
pe
ratu
re (℃
)
Energy (J)
HangoutsSkypeAbyssriumPUBG
Figure 7: Energy vs. surface temperature.
generally proportional to energy consumption, surface tem-perature increment before reaching the steady state is closelyrelated to the heat transfer rate, which is proportional tothe temperature difference (or ∆T ) as shown in Section 2.2.This means that high power consumption associated with aspecific hardware component (e.g., AP) can significantly in-crease a component’s temperature and thus expedite surfaceoverheating due to large temperature differences.Impact of app restarting: The power graphs in Figure 6hint that app restarting may result in different temperatureincrement trends due to high power consumption during theinitialization phase. To validate this intuition, we measuredthe temperature changes of two apps (i.e., video recordingand PUBG) by restarting the apps when the surface temper-ature dropped by 50% of the temperature difference betweenthe steady-state temperature and the baseline temperature.As discussed in Section 2.2, we can model the temperatureat time t as follows [39]: T (t ) = T∞ − (T∞ −T0)e
−τ t whereT∞ is the peak temperature,T0 is the initial temperature, andτ is a coefficient that represents how fast the temperaturechanges. The curve fitting results showed that restarting hasa larger coefficient τ : video (45 vs. 62) and PUBG (61 vs. 73)(in units of 10−4/s).Impact of a protection case: We measured the tempera-ture changes of Skype with and without a plastic protectioncase, which is made of Thermoplastic Poly-Urethane (TPU)and Polycarbonate (PC) (thickness=1.5mm). Heat transferprinciples hint that the thicker the medium, the slower theheat propagation. Our measurement results confirmed thatsurface temperature rose slowly; e.g., to reach 45◦C, it took418 seconds (SD: 22) without the case and 643 seconds (SD:46) with the case. Furthermore, the steady-state temperaturewith the case (48◦C, SD: 2.13) was slightly lower than thatwithout the case (54◦C, SD: 0.21).Performance implications: Figure 8a shows the AnTuTubenchmark [2] performance at different ambient tempera-tures. The AnTuTu benchmark score represents the overallperformance of the smartphone as it measures computationcapability, video frame variance, etc. The result shows thatthe performance is significantly influenced by the temper-ature. The key reason for performance degradation is fre-quency scaling as shown in Figure 8b. The clock frequenciesof two cores vary in accordance with the increase of CPU

Fire in Your Hands: Understanding Thermal Behavior of Smartphones
30000
40000
50000
60000
70000
0 10 20 30 40 50 60
Pe
rfo
rma
nce
Sco
re
Temperature (℃)
AnTuTu benchmark
(a) AnTuTu benchmark per-formance vs. ambient tem-perature.
20
35
50
65
80
0
0.5
1
1.5
2
0
20
40
60
80
100
12
0
14
0
160
18
0
20
0
22
0
240
26
0
28
0
300
32
0
34
0
360
Tem
pe
ratu
re (℃
)
Clo
ck F
reque
ncy (
GH
z)
Time (sec)
1.4GHz Core 1.8GHz Core Surface Temp. CPU Temp.
(b) Clock frequency scalingbehaviors (with an ambienttemperature of 28◦C).
Figure 8: AnTuTu benchmark test results of Nexus 5X.
25
40
55
70
85
100
Video chat - Skype Video recording Game - Abyssrium
Te
mp
era
ture
(℃
)
AP PMIC: Bat. Charger PMIC: Regulator Wi-Fi Chip Rear Camera Battery
Figure 9: The steady-state temperature of each compo-nent while running each application.
Table 2: Utilization statistics of each component whenrunning each application.
Utilization (%) Video chat - Skype Video recording Game - Abyssrium
CPU 69 (SD: 5) 32 (SD: 2) 20 (SD: 11)GPU 4 (SD: 2) 0 (SD: 1) 58 (SD: 17)
temperature. The 1.8 GHz cores are switched off when thetemperature exceeds the threshold as determined by DVFS.
4.2 Component-specific AnalysisWe next focus on analyzing the component-specific tem-perature characteristics of smartphones to identify whichcomponents contribute to heat generation. There are severalheat sinks, and each covers one or more components. Toidentify the main heat source in each scenario, we removedthe heat sinks and measured the temperature changes onboth the front and back of the printed circuit board (PCB),by using two IR cameras. We ran video chat (Skype), videorecording, and a 3D mobile game (Abyssrium), and theseapplications combined with fast charging. We also measuredthe component usages, such as CPU and GPU utilization, aswell as the network data rate and clock frequency changes.
Figure 9 illustrates the steady-state temperature of thecomponents while running each application and Table 2summarizes the corresponding CPU/GPU utilization. Thecomponents include application processor (AP), power man-agement integrated circuits (PMICs), rear camera, and bat-tery. Here, PMIC refers to a class of integrated circuits thatinclude various functions related to power requirements such
0% Battery
20
40
60
80
100
0 500 1000 1500
Tem
pera
ture
(℃
)
Time (sec)
[Charging] AP [Non-charging] AP
[Charging] PMIC: Bat. Charger [Non-charging] PMIC: Bat. Charger
0% Battery
Figure 10: The AP and PMIC temperature changeswhile video recording, with and without charging.
as DC to DC conversion, battery charging, power-source se-lection, and voltage scaling. Nexus 5X has two PMICs; one isa regulator for power supply to other components, and theother is a battery charger for controlling the charging rate.Figure 9 shows that AP and PMIC are generally the maincontributors of heat generation.
In Nexus 5X, the fingerprint sensor is located on top of theAP and PMIC. The fingerprint sensor directly connects intothe PCB, and there is no air gap in between. Other regionshave additional plastic shields to isolate the heat sources andthe smartphone surface. The fingerprint sensor thereforeshows a higher temperature than other regions.Video chatting and recording: Both video chatting andrecording display high temperatures as they involve heavycomputation and camera usage. With Skype, CPU utilizationwas 69% on average, and the AP generated the most heat(91◦C). Video recording also generated considerable heatsimilar to Skype on the AP, even though CPU utilizationwas about 30%. This is because the multimedia codec builtinto the AP, which encodes/decodes videos, generates sig-nificant heat. Regardless of Wi-Fi or LTE, the networkingcomponents did not show notable temperature changes. Wemeasured the data rates of Skype using the Android monitor,and they were Tx: 698 kb/s and Rx: 396 kb/s on average.Game: Similar to the camera-based applications, AP is themain source of heat generation in mobile gaming. Duringthe game play, the CPU usage rate was only 20% on average,while the GPU usage rate increased to 58%. As both GPUand CPU are built into the AP, the AP remains a main heatsource. Due to adaptive thermal management, the heat wasmuch lower than other application usage scenarios.Running applications while charging: Figure 10 showsthat the temperature changes of both AP and PMIC whilecharging look similar to when non-charging. We started theexperiment at 10% battery level and the discharging rate wasfaster than the charging rate. When the battery level droppedto 0%, the charging rate increased, causing the temperatures

Soowon Kang∗, Hyeonwoo Choi†, Sooyoung Park∗, Chunjong Park‡, Jemin Lee§, Uichin Lee∗, Sung-Ju Lee∗
40
60
80
100
0 20 40 60 80 100
Tem
pera
ture
(℃
)
Tx data rate (Mbps)
Wi-Fi Temp. AP Temp.
Figure 11: The steady-state temperatures of AP andWi-Fi chip during 10 minute network transmissions.
25
35
45
55
65
0
0.5
1
1.5
2
0 500 1000 1500
Te
mp
era
ture
(℃
)
Clo
ck F
req
uen
cy (
GH
z)
Time (sec)
1.4GHz core 1.8GHz core Surface temp.
(a) CPU-intensive workload.
25
35
45
55
65
0
0.5
1
1.5
2
0 500 1000 1500
Te
mp
era
ture
(℃
)
Clo
ck F
req
uen
cy (
GH
z)
Time (sec)
1.4GHz core 1.8GHz core Surface temp.
(b) Video rec. workload.
Figure 12: Nexus 5X’s surface temperature vs. fre-quency scaling behaviors.
of both AP and PMIC to suddenly leap to nearly 100◦C. Un-like other scenarios, PMIC exhibits a higher temperaturethan the AP. The charging IC and its paired PMIC modulatethe voltage and the current. It appears that these compo-nents can be overloaded when we simultaneously use andcharge the smartphone. This may be attributed to a chargingalgorithm controlled by the PMIC when the battery levelreaches 0% [8].Wi-Fi communication:Wemeasured the temperature changesof the application processor (AP) and the Wi-Fi chip whiletransmitting UDP data packets with iPerf. Figure 11 revealsthe higher the Tx data rate, the higher the temperature. TheWi-Fi chip showed a higher temperature than the AP, sug-gesting that theWi-Fi chip could be a main heat source whenthe smartphone uses high-speed wireless communication.CPU intensive vs. video processing workload: APs typ-ically contain multiple modules such as CPUs, GPUs, mul-timedia codec, and memory. This means that simultaneoususe of multiple modules would likely cause surface over-heating. To check this, we conducted two experiments: CPU-intensive workload (90% CPU utilization), and high-qualityvideo recording. The results are presented in Figure 12.
Interestingly, CPU intensive workload alone did not causesignificant overheating. The surface temperature did notexceed 46◦C due to frequency scaling and core disabling.During video recording, however, the surface temperaturecontinued to rise and reached 60◦C in 20 minutes, despite
70 °C
20 °C
Figure 13: Dashboard navigation measurement.
frequency scaling and core disabling. This overheating orig-inates largely from the video codec in the multimedia pro-cessing component built into recent mobile APs such asQualcomm Snapdragon 808 in Nexus 5X. A hardware accel-erator, such as a video codec in a mobile AP typically doesnot have its own thermal management capability as it simplyruns the required workload. Thus, the higher the workload,the more heat it generates.
4.3 Ubiquitous Usage AnalysisOur smartphone temperature measurement studies helpedus to characterize the surface temperature of well-knownapp usage scenarios and to identify the major heat sources.Beyond these scenarios, we measured the surface tempera-ture in a variety of mobile and ubiquitous scenarios: virtualreality (VR) gaming, mobile, augmented reality (AR) gaming,GPS driving navigation, high-speed wireless data transfer,and mobile deep learning. Note that for VR gaming andhigh-speed wireless data transfer scenarios, we use Sam-sung Galaxy S7, because Gear VR only supports Samsungphones, and Nexus 5X’s Wi-Fi Direct does not fully supporthigh-speed data transfer (i.e., 300 Mb/s).Virtual reality:We measured the temperature changes ofGalaxy S7 connected to a Gear VR headset. We considered ascenario of playing a 3D runner game, called Temple Run 3.We measured the temperature of the air confined in the VRheadset by using a K-type thermocouple attached inside theheadset. After 30 minutes of game playing, the temperatureof the smartphone surface rose to 42◦C, and the air tempera-ture reached 38◦C. Although this level of temperature is lessconcerning than that of other scenarios, the confined spacebetween the face and the device got wet with sweat due tothe heat and the lack of ventilation, causing considerablethermal discomfort.Augmented reality gaming: Pokémon Go [9], a location-based augmented reality game was considered for measure-ment due to its popularity. This game consistently uses di-verse hardware components, such as AP, Wi-Fi, LTE, GPS,and camera, which could generate considerable heat. In par-ticular, the AR mode displays the image captured by thecamera and renders 3D objects over the background. If this

Fire in Your Hands: Understanding Thermal Behavior of Smartphones
mode was enabled, our measurement showed that the tem-perature quickly reached 53◦C at the hot-spot of the surface.In addition, over half of the surface reached higher than45◦C. When the temperature was over 51◦C in the AR mode,we observed unnatural and discontinuous rendering of 3Dgraphics due to thermal throttling. When the AR mode wasdisabled, the surface temperature was around 46◦C.GPS navigation: Navigation is one of the most popularvehicular smartphone applications. Since GPS is one of themain sources of energy consumption in smartphones [18],we hypothesized that continuous use of GPS and map ren-dering could generate considerable heat. Furthermore, dueto direct sunlight exposure, there could be significant envi-ronmental influence on the surface temperature. To inspectthe temperature/power relationship and an environmentalfactor, we considered the following GPS navigation applica-tions: KakaoNavi [6], NaverMap [7], and Waze [13]. Notethat Google and Apple Maps do not provide turn-by-turnnavigation services in the locations where the experimentswere performed.
We conducted an experiment by measuring the tempera-ture of three smartphones (Fig. 13), each running a differentnavigation app mentioned above, using thermal camerasmounted on the dashboard in a car with air conditioning(22–24◦C). We drove about 12 km for 30 minutes at four dif-ferent times in the evening.Waze, KakaoNavi, and NaverMapreached on average 44◦C, 42◦C, and 41◦C, respectively. Simi-lar to the Pokémon Go results without the AR mode, theseresults show that running the navigation applications doesnot appear to cause serious thermal concerns, and GPS, whileconsuming a lot of energy, does not generate excessive heat.
We then examine the effect of sunlight, by measuring thesurface temperature of the smartphones mounted on thedashboard under direct sunlight without air conditioningduring the daytime. In this case, the temperature quicklyrose up to 64◦C in just 15 minutes. It appears that in-vehicleusage of GPS navigation can cause considerable thermalissues mainly due to the sunlight rather than the workload.High-speed wireless communication: High-speed wire-less networking scenarios such as local file sharing are be-coming common as wireless networking technologies evolvesuch as Wi-Fi Device-to-Device (D2D). We examine howhigh speed data transmission affects the smartphone surfacetemperature. For accurate temperature measurement, weexchange a large video file using Galaxy S7 with the maxi-mum throughput of 300 Mb/s. When transmitting the file,the temperature of Galaxy S7 using Wi-Fi Direct quicklyrose to 51◦C. The location where the Wi-Fi module residesshowed the highest temperature, which is different fromwhen video chatting using Wi-Fi, where the application pro-cessor generated the most heat. As discussed in Section 4.2,the network throughput of Skype was less than 1 Mb/s. We
thus infer that the temperature of Wi-Fi module increasesconsiderably as network throughput increases. Furthermore,the transmitter exhibits higher temperature (51◦C) than thereceiver (41◦C). This can be partly explained based on thefact that the transmitter consumes more energy than thereceiver [15].GPU-based mobile deep learning: There is a growingdemand of building deep learning platforms in mobile de-vices (e.g., Caffe2Go [25] and DeepMon [30]) to support con-tinuous vision applications such as real-time style transferand image recognition. As deep learning requires intensivecomputation, we measure how much heat deep learningapplications generate.
For this measurement, we considered DeepMon, a mobiledeep learning inference system that runs various deep learn-ing algorithms on a mobile device and supports mobile GPUacceleration [30]. Using the DeepMon framework, we builtand ran a simple deep neural network (DNN) based imageprocessing app. We used Galaxy S7 for this measurement asthe DeepMon framework is optimized for Galaxy S7’s GPUs.Our app continuously captures and classifies images for ob-ject detection from the camera using the You Only LookOnce (YOLO) model [51]. Our test app runs the DNN imageprocessing method every three seconds, and the processingtime of single instance takes about a second.Our results showed that running this deep learning al-
gorithm generated a temperature (54◦C) that is 9◦C higherthan simply capturing images from the rear camera (45◦C).While it took 21 minutes to reach this temperature, it eas-ily exceeds the highest temperature that we measured fromGalaxy S7 (47◦C when running video chat). Given that theprocessing time of the DNN algorithm is less than about 33%of the total processing time, we expect that more heat couldbe generated depending on the GPU workload. Our resultsclearly show that the chipset vendors and smartphone man-ufacturers should pay more attention to overheating issuesparticularly when GPUs are highly utilized as in the deeplearning scenarios.
5 USER EXPERIENCE STUDY ON HEATSENSATION AND DISCOMFORT
We conducted a user experience study to understand howsurface heat affects user experiences: (i) how much heatand discomfort users feel when they use a smartphone fora prolonged time (e.g., 20 minutes of a game play), and (ii)what are user reaction patterns due to the surface heat.
5.1 Experiment DesignWe recruited 20 participants (10 male and 10 female), withthe average age of 21.45 (min=19, max=26). We asked the

Soowon Kang∗, Hyeonwoo Choi†, Sooyoung Park∗, Chunjong Park‡, Jemin Lee§, Uichin Lee∗, Sung-Ju Lee∗
46℃
23℃
25
30
35
40
45
50
0 4 8 12 16 20
Tem
pera
ture
(℃)
Time (min)
The hottest pointIntermediate point
(a) Nexus 5X.
39℃
23℃
25
30
35
40
45
50
0 4 8 12 16 20
Tem
pera
ture
(℃)
Time (min)
The hottest pointIntermediate point
(b) Galaxy S7.
Figure 14: Surface temperature during a gameplay.
participants to play Yokai Saga [1], a popular 3D mobile ac-tion game. This game was chosen because (i) it received agood user rating (i.e., fun to play), (ii) its controls are intuitiveand simple to handle, (iii) it requires frequent screen touches,and (iv) it caused smartphone surface heating with consis-tent trends. We used Nexus 5X and Galaxy S7 smartphonesto account for variations on heat sensation and discomfortacross different devices. As shown earlier, Nexus 5X had aslightly higher surface temperature (44.33◦C) than GalaxyS7 (39.14◦C), and took much shorter time (352 sec) thanGalaxy S7 (606 sec) to reach the steady-state temperature(see Figure 14). When participants played the game, we rec-ommended them to hold the phone in the landscape-modewith their hands; this recommendation was made to avoidthe case of laying the phone on the desk.We conducted an IRB-approved within-subjects experi-
ment. The participants performed in two conditions, chang-ing the smartphone models (i.e., Nexus 5X and Galaxy S7). Toreduce the order effect, we counter-balanced the order suchthat a half of them used Nexus 5X first, and the other halfused Galaxy S7 first. Each participant was rewarded with a$10 gift voucher.We asked the participants to rate the level of heat sensa-
tion and discomfort every 4 minutes on a 5-point Likert scale:1: Not at all, 2: Little, 3: Somewhat, 4: Very much, and 5: Ex-tremely. These questions have been widely used in the fieldof ergonomics [62, 63]. While heat sensation and discomfortlevels were known to be correlated [63, 64], it is interestingto study the overall user experiences with smartphone usagescenarios. During the experiment, we video recorded thegrabbing patterns to investigate their reactions to surfaceheat. After game plays, we conducted a follow-up interview.
5.2 User Study ResultsFigure 15 shows the mean levels of heat sensation and dis-comfort during gameplay. The level of heat sensation in-creased at a similar rate to the temperature increase shownin Figure 14. A few participants indicated that the smart-phone was very hot for the first 8 minutes during which thetemperature rapidly increased. As the temperature increasedso did the heat sensation and discomfort levels. Unlike heatsensation, we observed that the discomfort level increased
12345
0 4 8 12 16 20
Lik
ert
scale
Time (min)
(a) Heat sensation.
12345
0 4 8 12 16 20
Lik
ert
scale
Time (min)
(b) Heat discomfort.
Figure 15:Heat sensation anddiscomfort during game-play (error bars denote standard deviation).
almost linearly. As a result, 75% of the participants respondedthat they felt discomfort due to surface heat (levels 3 to 5 inFig. 15b). P1 commented “Because the smartphone was hot,my fingers became numb just like when the electricity flowed”and P20 mentioned “It was uncomfortable to keep holding thesmartphone as it got slippery.”To verify the time-series differences, we applied paired
samples t-tests between two consecutive measurements (e.g.,the 0-th minute and the 4-th minute measurements). Thelevels of heat and discomfort from the 0-th minute to the 16-th minute were significantly different. However, at the 16-thand the 20-th minutes, the levels of heat sensation were notdifferent (p=0.159, Cohen’s d=0.143), whereas the levels ofthermal discomfort were different (p=0.003, Cohen’s d=0.323).This shows that the participants did not perceive a significantdifference in heat sensation at the 16th minute mark, butfelt more discomfort as time passed. Despite slightly lowertemperature, prolonged usage still can cause considerablediscomfort, thereby negatively influencing user experiences.In the post-interview, the participants reported thermal
discomfort for various reasons: (i) heat sensation, (ii) con-cerns on skin burn, (iii) sweating, (iv) sensor malfunctioncaused by sweat, and (v) slip caused by sweat. Most partic-ipants said that Galaxy S7 was especially slippery becauseof its glass-based surface material. While discomfort levelswere not significantly different, our participants consistentlyreported that using Galaxy S7 was more uncomfortable thanNexus 5X even though Nexus 5X showed a higher tempera-ture during the experiments. Participants mentioned that thewhole surface of Galaxy S7 was heated, whereas only oneside of the surface (near the fingerprint sensor) of Nexus 5Xwas heated.
Our video recording analysis showed that as this gamerequires landscape-mode user interaction, 75% of the partici-pants grabbed the smartphone with both hands, but someusers played with one hand (left: 20%, right: 5%). All partici-pants were hence exposed to the hottest areas of each deviceduring gameplay. We observed that most (95%) participantsrepeatedly changed their grips and stretched their hands. Atthe end of the experiment, we asked them why they changedthe grip and 35% said that it was because the smartphone wastoo hot or their hands were sweaty. The other participants(65%) responded that it was a less conscious behavior and

Fire in Your Hands: Understanding Thermal Behavior of Smartphones
Table 3: Measured data types for prediction modeling.
System Statistics (21)
CPUStatistics
(17)
(1) Time spent on un-niced user processes, (2) Time spent onniced user processes (UserTime), (3) Time spent on kernel pro-cesses (SysTime), (4) Time spent in kernel idle handler, (5) Timewaiting for I/O completion, (6/7) Time spent servicing HW/SWinterrupts, (8) Total elapsed time for above seven items, (9) Per-centage of time running user space (User%), (10) Percentageof time running kernel space (System%), (11) Percentage oftime running I/O completion, (12) Percentage of time runningHW interrupts, (13) Percentage of total CPU time (CPU%), (14)CPU’s clock freq. (CPUfreq), (15) Total accessible address spaceof a process, (16) Total memory held in RAM for a process, (17)Number of threads
On-deviceSensors (2) (1) CPU temp. (cpuTemp), (2) Battery temp. (batTemp)
Network (2) (1) Tx data rate (netTx), (2) Rx data rate (netRx)
they wanted to resolve the discomfort in keep holding thesmartphone.
6 INFERRING SURFACE TEMPERATUREOur experiments have shown that smartphones could quicklyoverheat during popular usage scenarios and cause user dis-comfort or even injury. Estimating and predicting high sur-face temperatures could be a first step in lowering user dis-comfort due to heat. However, current smartphones onlymonitor the temperature of specific components and do notprovide surface temperature measurement. We explore thefeasibility of estimating surface temperature by using onlyAndroid system statistics and internal sensors (e.g., CPU andbattery temperature).
6.1 Model DesignWe collected two datasets from Nexus 5X and Galaxy S7:the surface temperature of each device and system statisticswhile running several usage scenarios. We selected featuresto identify the dominant factors that relate to surface temper-ature. We ran pre-processing to handle the time correlationfactor to better predict upcoming temperature changes.We present a prediction model for each device by means
of smartphone system statistics without any additional hard-ware. We collected 21 system statistics by using the top com-mand of the Android debug bridge and the Android systemAPI (see Table 3) and measured the corresponding surfacetemperature every 5 seconds. The maximum CPU utiliza-tion of the logging app was about 3% for both Nexus 5Xand Galaxy S7, suggesting that the logging process has anegligible overhead to collect proper amount of data.To collect a dataset, we categorized a variety of popular
smartphone usage scenarios and selected 11 representativescenarios. We selected six apps to cover the usage scenar-ios for training: games (HIT, Yokai Saga), cameras (Skype,video recording), networking (iPerf), and video streaming
Table 4: The dominant features for each smartphonein descending order of correlation coefficient.
Selected Features
Nexus 5X batTemp, cpuTemp, CPUfreq, System%, User%, UserTime, SysTime, CPU%Galaxy S7 batTemp, cpuTemp, CPU%, SysTime, UserTime, User%, System%, netTx
(YouTube). Each dataset was collected as follows. For eachscenario, we performed temperature measurements fourtimes, 30 minutes each. After removing erroneous measure-ments in some scenarios, the number of total measurementswas 40 instances, and thus the total duration was 1,200minutes. For evaluation, we used a leave-one-scenario-outmethod, by randomly choosing one scenario for testing andthe rest for training.
Different smartphones might have different thermal man-agement methods and their heat dissipation could be dif-ferent due to the differences in internal components. Foreach phone, we thus must obtain representative features thatcould best predict temperature changes. For feature selec-tion, we used the correlation-based feature selection (CFS)method [29], which selects the features that are highly cor-related with the predictive variable but are less correlatedwith one another. We used CorrelationAttributeEval in Weka3.8.2 for feature selection and chose the top 8 features eachfor Nexus 5X and Galaxy S7.For prediction, while multiple regression could be a vi-
able choice, it is known that simple multiple regression isless accurate when there is time correlation of neighboringdata rows [20]. To address this concern, we performed pre-processing called time lagging (i.e., attaching neighboringdata pairs) to make our data attain time dependency informa-tion as follows: yt = α⃗TXt + β⃗
TXt−L + ϵt where yt denotesthe temperature at time t , Xt denotes the system log vectorat time t , L is a lag number, α⃗ and β⃗ are regression coefficientvectors, and ϵt denotes the corresponding error term. Notethat L = 0 represents a regular multiple regression.
6.2 EvaluationThe dominant features are listed in Table 4. There are sevencommon features (e.g., the percentage of time running user/kernelspace, total CPU utilization, CPU time spent in user/kernelspace, CPU temperature, and battery temperature) for bothsmartphone models, and one distinct feature for each smart-phone. The high utilization and run-time means that theCPU is intensively working and hence, the temperature willrise. The clock frequency has negatively correlated with thesurface temperature due to DVFS. While Nexus 5X activelymanipulated the clock frequency as shown in Figure 12b,Galaxy S7 did not show such frequency scaling behavior.Thus, the clock frequency feature was not included in Galaxy
Soowon Kang∗, Hyeonwoo Choi†, Sooyoung Park∗, Chunjong Park‡, Jemin Lee§, Uichin Lee∗, Sung-Ju Lee∗
0
1
2
Real-time 30 sec. ahead 60 sec. ahead
RM
SE
(℃
)
Base Lag 1min Lag 2min Lag 3min
(a) Nexus 5X.
0
1
2
Real-time 30 sec. ahead 60 sec. ahead
RM
SE
(℃
)
Base Lag 1min Lag 2min Lag 3min
(b) Galaxy S7.
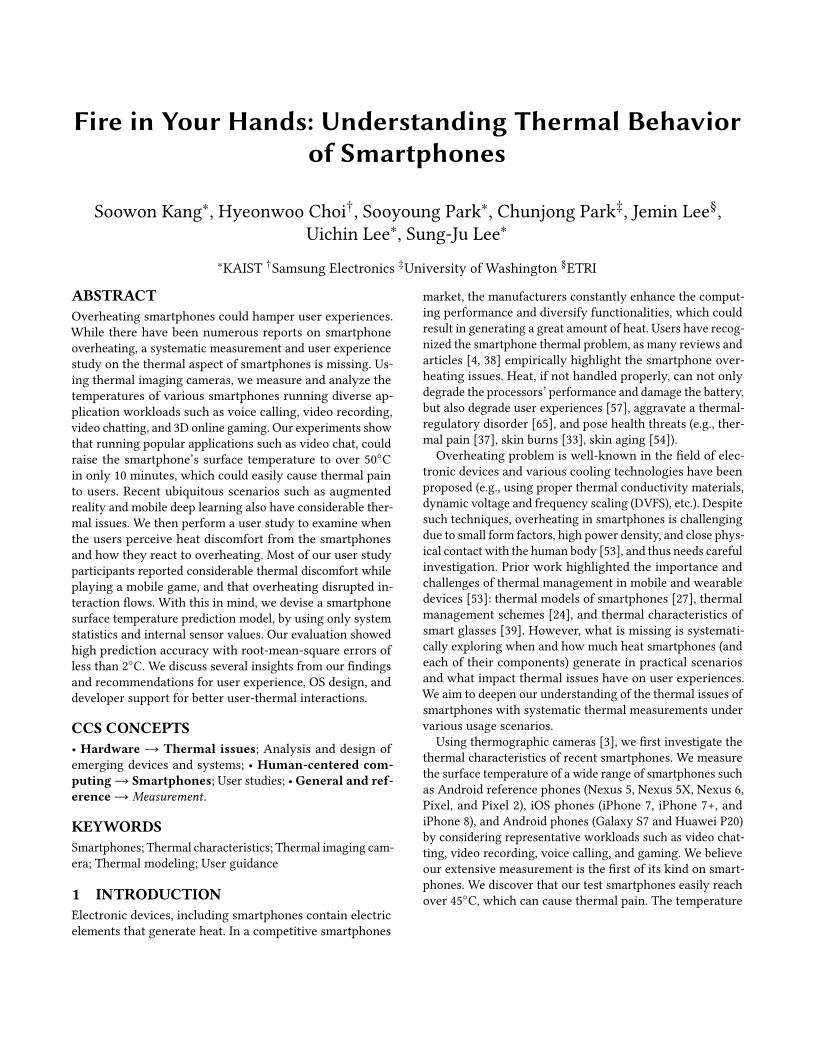
Figure 16: Prediction accuracy with time lagging.
S7. Instead, the data transmission rate showed a high corre-lation with the surface temperature.With these dominant factors as shown in Table 4, we
trained our model for each smartphone to estimate the sur-face temperature. To do this, we assembled all training datafrom multiple apps to build a single model for each smart-phone. The real-time prediction performance of our multipleregression model is shown in Figure 16. As an accuracy mea-sure we used RMSE that denotes the root mean square error.Our model accurately predicts the surface temperature, witherrors less than 2◦C in most cases. This performance is su-perior to the model that uses only internal thermometers;a model using only cpuTemp and batTemp showed R2: 0.87and RMSE: 3.81◦C for Nexus 5X. This pattern is also truefor Galaxy S7: R2: 0.82 and RMSE: 1.51◦C. Since our mea-surement tool, the IR camera, has approximately 2◦C errorbounds at most, we conclude that our prediction methodestimates the temperature changes accurately.Figure 17 summarizes the model performance of predict-
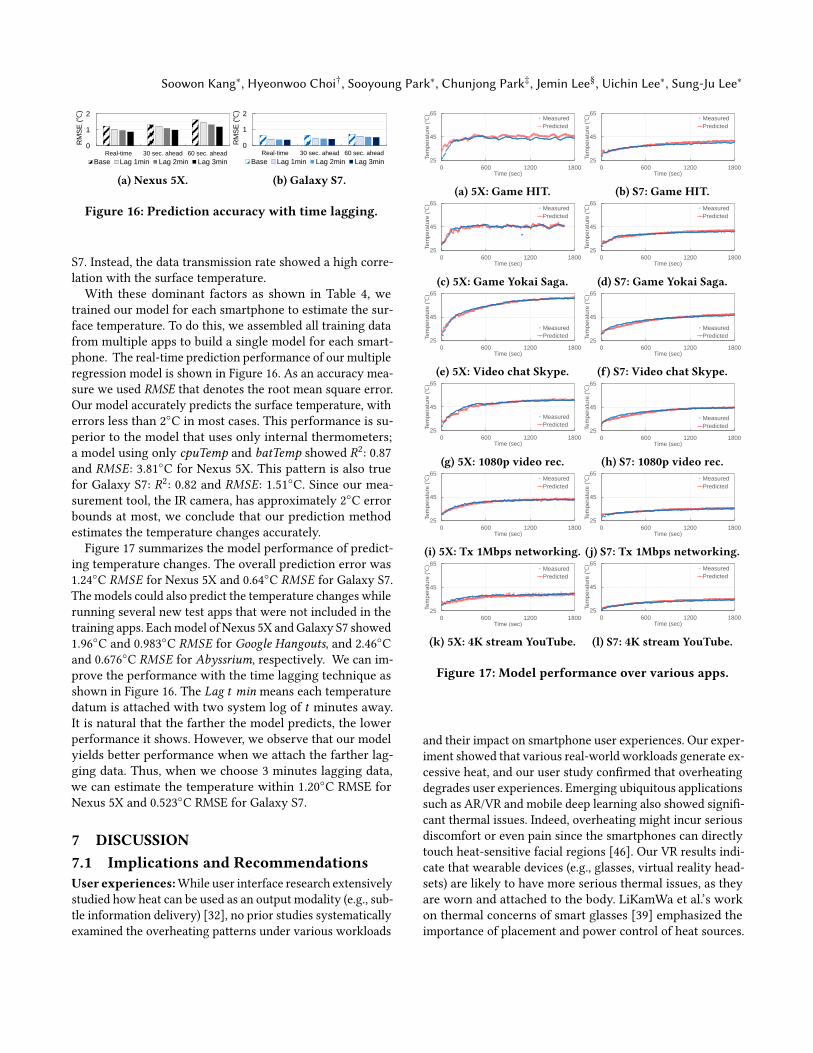
ing temperature changes. The overall prediction error was1.24◦C RMSE for Nexus 5X and 0.64◦C RMSE for Galaxy S7.The models could also predict the temperature changes whilerunning several new test apps that were not included in thetraining apps. Eachmodel of Nexus 5X andGalaxy S7 showed1.96◦C and 0.983◦C RMSE for Google Hangouts, and 2.46◦Cand 0.676◦C RMSE for Abyssrium, respectively. We can im-prove the performance with the time lagging technique asshown in Figure 16. The Lag t min means each temperaturedatum is attached with two system log of t minutes away.It is natural that the farther the model predicts, the lowerperformance it shows. However, we observe that our modelyields better performance when we attach the farther lag-ging data. Thus, when we choose 3 minutes lagging data,we can estimate the temperature within 1.20◦C RMSE forNexus 5X and 0.523◦C RMSE for Galaxy S7.
7 DISCUSSION7.1 Implications and RecommendationsUser experiences:While user interface research extensivelystudied how heat can be used as an output modality (e.g., sub-tle information delivery) [32], no prior studies systematicallyexamined the overheating patterns under various workloads
25
45
65
0 600 1200 1800
Tem
pe
ratu
re (℃
)
Time (sec)
Measured
Predicted
(a) 5X: Game HIT.
25
45
65
0 600 1200 1800
Tem
pe
ratu
re (℃
)
Time (sec)
Measured
Predicted
(b) S7: Game HIT.
25
45
65
0 600 1200 1800
Tem
pe
ratu
re (℃
)
Time (sec)
Measured
Predicted
(c) 5X: Game Yokai Saga.
25
45
65
0 600 1200 1800
Tem
pe
ratu
re (℃
)
Time (sec)
Measured
Predicted
(d) S7: Game Yokai Saga.
25
45
65
0 600 1200 1800
Tem
pe
ratu
re (℃
)
Time (sec)
Measured
Predicted
(e) 5X: Video chat Skype.
25
45
65
0 600 1200 1800
Tem
pe
ratu
re (℃
)
Time (sec)
Measured
Predicted
(f) S7: Video chat Skype.
25
45
65
0 600 1200 1800
Tem
pe
ratu
re (℃
)
Time (sec)
Measured
Predicted
(g) 5X: 1080p video rec.
25
45
65
0 600 1200 1800
Tem
pe
ratu
re (℃
)
Time (sec)
Measured
Predicted
(h) S7: 1080p video rec.
25
45
65
0 600 1200 1800
Tem
pe
ratu
re (℃
)
Time (sec)
Measured
Predicted
(i) 5X: Tx 1Mbps networking.
25
45
65
0 600 1200 1800
Tem
pe
ratu
re (℃
)
Time (sec)
Measured
Predicted
(j) S7: Tx 1Mbps networking.
25
45
65
0 600 1200 1800
Tem
pe
ratu
re (℃
)
Time (sec)
Measured
Predicted
(k) 5X: 4K stream YouTube.
25
45
65
0 600 1200 1800
Tem
pe
ratu
re (℃
)
Time (sec)
Measured
Predicted
(l) S7: 4K stream YouTube.
Figure 17: Model performance over various apps.
and their impact on smartphone user experiences. Our exper-iment showed that various real-world workloads generate ex-cessive heat, and our user study confirmed that overheatingdegrades user experiences. Emerging ubiquitous applicationssuch as AR/VR and mobile deep learning also showed signifi-cant thermal issues. Indeed, overheating might incur seriousdiscomfort or even pain since the smartphones can directlytouch heat-sensitive facial regions [46]. Our VR results indi-cate that wearable devices (e.g., glasses, virtual reality head-sets) are likely to have more serious thermal issues, as theyare worn and attached to the body. LiKamWa et al.’s workon thermal concerns of smart glasses [39] emphasized theimportance of placement and power control of heat sources.

Fire in Your Hands: Understanding Thermal Behavior of Smartphones
OS design: Mobile operating systems can provide optionsfor users: system-forced regulation that the device cannotexceed the temperature threshold, and user-imposed regula-tion whether to take a (mildly) high temperature per user’ssetting. Currently only few phones show warning messagesbefore they turn off due to high temperature; others switchoff even without any warning. It would be helpful for usersto be notified and make them respond in advance beforetheir smartphones shut down. Our prediction model wouldbe very useful to enable these options. Furthermore, we sug-gest a new evaluation criterion of smartphones and apps forthermal awareness. As in PowerForecaster [43] that allowsusers to check power efficiency before app downloading, wecan display thermal ratings for informed app downloading.There was an attempt to consider a smartphone’s sur-
face temperature for DVFS based thermal management [24].However, our results demonstrated that DVFS alone is notsufficient for managing surface temperature. There shouldbe a holistic thermal management framework that simulta-neously considers multiple components’ thermal character-istics (e.g., PMIC, cameras, sensors, and wireless chipsets).Our prediction model can be integrated into this framework.Developer support:Our participants commented that over-heating disrupted interaction flows and degraded interactionperformance (e.g., input errors due to sweat). We recommendthat app developers systematically consider user interactionas well as user reaction patterns (e.g., phone grab patterns,body part contact patterns). Overall, our thermal model canbe useful for understanding the thermal impacts of their apps,including user interaction patterns. Our prediction modelonly requires one-time training per phone model and worksin a real-time system without using external thermometers.As in several power profilers (e.g., Eprof [49] and PowerFore-caster [43]), our model can track which components generateheat and also can be integrated into the Android IDE. Thisallows app developers to simulate the thermal characteristicsof their apps. Besides such profilers, OS-level API supportsfor real-time surface temperature measurement will enablean array of user level applications including temperaturewarning.
7.2 Limitations and Future WorkFor generalizability of our findings, we need further mea-surement studies on a wide range of recent phones and ap-plication workloads. We believe that our measurement of tenrecent phones provided ample evidence of thermal issues insmartphones. Our deep learning results demand further stud-ies on emerging mobile AI applications (e.g., real-time imageprocessing and intelligent assistants) [35, 40] as they also re-quire high computation power and large data transfer. Notethat 3D gaming requires careful measurement considerations
because various in-game events may cause heterogeneousCPU/GPU workloads. In this case, surface heating happensover a longer period of time (say at least several minutes)as opposed to temporal variations of in-game events. Thus,we hypothesize that the impact of in-game events and theirvariations would not be significant. Nonetheless, furthermea-surements are required to accurately understand the impactof diverse in-game events.Our prediction model is device-dependent and requires
new model building with new phones. This model can be ap-plicable to Android smartphone models, and it only requiresone-time training per model. The model can be extendedto predict multiple points by adding more measured pointsduring the training stage. In our work, we have not consid-ered running multiple apps at the same time, as the Androidsystem prioritizes resource allocation to the foreground app.It is likely that background apps are mostly CPU-intensiveworkloads. According to our results, their thermal issuesmay not be significant. However, examining diverse coexis-tent scenarios including app restarting would still be a veryinteresting direction for future work. Furthermore, it wouldbe interesting to explore various methods of improving pre-diction accuracy, by considering diverse hardware stats (e.g.,GPU utilization), and leveraging advanced prediction algo-rithms (e.g., recurrent neural networks).
8 RELATEDWORKA number of studies proposed thermal models and manage-ment methods for mobile and wearable devices. Sekar [53]discussed major challenges in power and thermal manage-ment of mobile devices and emphasized the critical role ofheat in the power context, calling for further studies onthermal measurement, modeling, management, and user ex-perience research.
Singla et al. [55] presented a dynamic thermal and powermanagement algorithm for heterogeneous multiprocessorsystems-on-chip (MPSoCs) powering mobile platforms. Imet al. [31] designed a circuit-level temperature predictionmethod for electronic devices. Kwon et al. [34] proposed athermal prediction method for N-App N-Screen (NANS) ser-vices on smartphones by considering the multi-core CPU andthe display interface chipsets. All of these studies focusedon measuring and predicting the temperature changes ofAPs, and none of the studies measured the surface tempera-tures, which could directly impact user experiences. Egilmezet al. [24] showed the feasibility of surface temperature es-timation using CPU usage and CPU/battery temperatureand proposed a novel DVFS method that considers surfacetemperature. This work however did not consider varioussystem statistics information, and only basic linear regres-sion was considered for modeling. Our model includes the

Soowon Kang∗, Hyeonwoo Choi†, Sooyoung Park∗, Chunjong Park‡, Jemin Lee§, Uichin Lee∗, Sung-Ju Lee∗
basic regression model as well (i.e., no lagging case). Ourresults showed that the temporal series modeling with lag-ging considerably improves the prediction accuracy, whencompared with the basic regression case. Park et al. [47, 48]considered power consumption characteristics of hardwarecomponents to predict surface temperature, but this model re-quires kernel-level hardware usage information (e.g., currentvideo recording resolution, clock frequency information) formodel construction. Our prediction model differs from theseprior studies in that we use a variety of system stats andon-device sensors that are accessible at user-level processesto train time-series regression models, and we validate theaccuracy of our real-time prediction model by consideringdiverse application workloads with different smartphones.Xie et al. [60] developed a compact-thermal-modeling-
based thermal simulator that simulates how heat is dissipatedfrom its source to the surface. This work focused onmodelingthe thermal resistance network of smartphones, while ourwork mainly investigates how different applications affectthe thermal conditions of the smartphones and the impacton user experiences. Chiriac et al. [21] developed a heatspreading metric, namely coefficient of thermal spreadingthat quantifies how well the generated heat is spread onsmartphone surface. This metric helps hardware designers tobetter analyze the thermal design effectiveness. The authorsused surface temperature data to estimate the spreadingmetric, but they did not report comprehensive measurementresults with diverse workloads.
Several studies investigated the relationship between vari-ous thermal conditions of mobile/wearable devices and userexperiences. Suh et al. [57] proposed the user burden scalethat quantifies how user burdens including physical discom-fort affect user experiences. In practice, physical burdens dueto overheating can result in a negative effect on initial adop-tion, retention, and overall user experience. Zhang et al. [63]studied how laptop temperature is related to user discomfortby conducting thermal measurements of laptops at differentrelative positions. LiKamWa et al. [39] measured the energyand thermal characteristics of Google Glass. They found thatvideo chatting reached around 50◦C in 10 minutes, which farexceeded the thermal pain threshold. Thus, they suggestedthat head-mounted devices carefully regulate surface tem-perature. Straume et al. [56] analyzed the health risks ofmobile phone use due to RF radiation and heat exposure bymeasuring a user’s skin temperature in the head.While these studies emphasized the effect of thermal is-
sues in mobile/wearable devices on user experiences andhealth risks, there is still a lack of systematic analyses ofsurface and component-specific temperature measurementsof various recent smartphones under various applicationworkloads, and the overall impact of surface temperature onuser experiences.
9 CONCLUSIONSWith emerging energy demanding applications, smartphoneswith powerful processors are being introduced, thereby chal-lenging thermal management practices. Our research pro-vides a first step towards investigating thermal issues as-sociated with smartphones under various workloads. Weperformed extensive measurements and analyzed whetherpractical smartphone use gives rise to thermal concerns. Wediscovered that many applications, especially those usingthe camera, generated excessive heat, often surpassing thethermal pain threshold. The major heat sources include appli-cation processors, camera, and power management modules.Furthermore, we conducted a user study to examine howusers perceive heat and discomfort while using smartphones.75% of our study participants reported discomfort due to heatwhile playing a mobile game. Overheating disrupted userinteraction flows and sometimes caused interaction errors.We also built a system statistics-based smartphone surfacetemperature prediction model and showed that our modelyielded a mean squared error less than 2◦C.
Many of us use smartphones often and for long duration.We make direct physical contact with smartphones, and thusthermal problems affect user experiences. We believe that thethermal issue associated with smartphones is an importantand difficult problem. We hope our study raises awarenessof this topic, and the mobile computing communities, bothresearch and industry, actively work together to improvesmartphone thermal computing.
10 ACKNOWLEDGMENTSThis work was supported by the National Research Founda-tion of Korea (NRF) grant funded by the Korea government(MSIP) (No.2016R1A2B4014068) and the Next-GenerationInformation Computing Development Program through theNational Research Foundation of Korea (NRF) funded by theMinistry of Science and ICT (NRF-2017M3C4A7065960).

Fire in Your Hands: Understanding Thermal Behavior of Smartphones
REFERENCES[1] Yokai saga, 2017. https://goo.gl/pjGMd9.[2] Antutu benchmark - know your android better, 2018.
https://goo.gl/vEagph.[3] Flir one, 2018. https://goo.gl/gdvO2Q.[4] Google pixel 2, pixel 2 xl owners complain of overheating and poor
battery life, 2018. https://goo.gl/viiYhq.[5] Hangouts - android apps on google play, 2018. https://goo.gl/rpLL8W.[6] Kakaonavi - apps on google play, 2018. https://goo.gl/YajfPM.[7] Naver map - android apps on google play, 2018. https://goo.gl/h0iymG.[8] Nexus 5x, 2018. https://goo.gl/UbuosR.[9] Pokémon go - android apps on google play, 2018.
https://goo.gl/xo7oBb.[10] Pubg mobile - android apps on google play, 2018.
https://goo.gl/6bHv1o.[11] Skype - free im & video calls - android apps on google play, 2018.
https://goo.gl/gBKjl6.[12] Tap tap fish - abyssrium - android apps on google play, 2018.
https://goo.gl/CxP5wp.[13] Waze - gps, maps & traffic - android apps on google play, 2018.
https://goo.gl/dtWUuL.[14] Y. Abdelrahman, M. Khamis, S. Schneegass, and F. Alt. Stay cool!
understanding thermal attacks on mobile-based user authentication.In Proceedings of the 35th Annual ACM Conference on Human Factorsin Computing Systems, ser. CHI, volume 17.
[15] M. Anand, E. B. Nightingale, and J. Flinn. Self-tuning wireless networkpower management. Wireless Networks, 11(4):451–469, 2005.
[16] D. Brooks and M. Martonosi. Dynamic thermal management forhigh-performance microprocessors. In High-Performance ComputerArchitecture, 2001. HPCA. The Seventh International Symposium on,pages 171–182. IEEE, 2001.
[17] Safety of machinery – Temperatures of touchable surfaces – Er-gonomics data to establish temperature limit values for hot surfaces.Standard, British-Standard-Institution, 1994.
[18] A. Carroll, G. Heiser, et al. An analysis of power consumption in asmartphone. In USENIX annual technical conference, volume 14, pages21–21. Boston, MA, 2010.
[19] Y. A. Cengel. Heat transfer : a practical approach. McGraw-Hill NewYork, NY, 2004.
[20] C. Chatfield. The analysis of time series: an introduction. CRC press,2016.
[21] V. Chiriac, S. Molloy, J. Anderson, and K. Goodson. A figure of meritfor smart phone thermal management. Electronics COOLING, 2015.
[22] J. R. Culham, W. A. Khan, M. M. Yovanovich, and Y. S. Muzychka.The influence of material properties and spreading resistance in thethermal design of plate fin heat sinks. Journal of electronic packaging,129(1):76–81, 2007.
[23] K. DeVogeleer, G. Memmi, P. Jouvelot, and F. Coelho. Modeling thetemperature bias of power consumption for nanometer-scale cpus inapplication processors. In Embedded Computer Systems: Architectures,Modeling, and Simulation (SAMOS XIV), 2014 International Conferenceon, pages 172–180. IEEE, 2014.
[24] B. Egilmez, G. Memik, S. Ogrenci-Memik, and O. Ergin. User-specificskin temperature-aware dvfs for smartphones. In Proceedings of the2015 Design, Automation & Test in Europe Conference & Exhibition,pages 1217–1220. EDA Consortium, 2015.
[25] I. Facebook. Delivering real-time ai in the palm of your hand., 2016.https://goo.gl/M37BSs.
[26] A. Faghri. Heat pipe science and technology. Global Digital Press, 1995.[27] S. P. Gurrum, D. R. Edwards, T. Marchand-Golder, J. Akiyama,
S. Yokoya, J.-F. Drouard, and F. Dahan. Generic thermal analysis
for phone and tablet systems. In Electronic Components and TechnologyConference (ECTC), 2012 IEEE 62nd, pages 1488–1492. IEEE, 2012.
[28] L. G. Hagander, H. A. Midani, M. A. Kuskowski, and G. J. Parry. Quan-titative sensory testing: effect of site and skin temperature on thermalthresholds. Clinical neurophysiology, 111(1):17–22, 2000.
[29] M. A. Hall. Correlation-based feature selection for machine learning.1999.
[30] L. N. Huynh, R. K. Balan, and Y. Lee. Deepmon: Building mobile gpudeep learning models for continuous vision applications. In Proceed-ings of the 15th Annual International Conference on Mobile Systems,Applications, and Services, pages 186–186. ACM, 2017.
[31] Y.-H. Im, P. Kyol, and T.-J. Cho. System and method for predicting thetemperature of a device, Nov. 1 2016. US Patent 9,482,584.
[32] L. A. Jones and M. Berris. The psychophysics of temperature per-ception and thermal-interface design. In Haptic Interfaces for VirtualEnvironment and Teleoperator Systems, 2002. HAPTICS 2002. Proceedings.10th Symposium on, pages 137–142. IEEE, 2002.
[33] A.-G. Kibbi and Z. Tannous. Skin diseases caused by heat and cold.Clinics in dermatology, 16(1):91–98, 1998.
[34] O. Kwon, W. Jang, G. Kim, and C.-G. Lee. Accurate thermal predictionfor nans (n-app n-screen) services on a smart phone. In 2018 IEEE 13thInternational Symposium on Industrial Embedded Systems (SIES), pages1–10. IEEE, 2018.
[35] N. D. Lane, P. Georgiev, and L. Qendro. Deepear: robust smartphoneaudio sensing in unconstrained acoustic environments using deeplearning. In Proceedings of the 2015 ACM International Joint Conferenceon Pervasive and Ubiquitous Computing, pages 283–294. ACM, 2015.
[36] E. Larson, G. Cohn, S. Gupta, X. Ren, B. Harrison, D. Fox, and S. Patel.Heatwave: thermal imaging for surface user interaction. In Proceedingsof the SIGCHI Conference on Human Factors in Computing Systems,pages 2565–2574. ACM, 2011.
[37] J. Lawrence and J. Bull. Thermal conditions which cause skin burns.Engineering in Medicine, 5(3):61–63, 1976.
[38] R. M. Leith Huffadine. Pregnant woman suffers burns after fallingasleep on her iphone, 2016. https://goo.gl/FQAcnq.
[39] R. LiKamWa, Z. Wang, A. Carroll, F. X. Lin, and L. Zhong. Drainingour glass: An energy and heat characterization of google glass. InProceedings of 5th Asia-Pacific Workshop on Systems, page 10. ACM,2014.
[40] C. Liu, L. Zhang, Z. Liu, K. Liu, X. Li, and Y. Liu. Lasagna: towardsdeep hierarchical understanding and searching over mobile sensingdata. In Proceedings of the 22nd Annual International Conference onMobile Computing and Networking, pages 334–347. ACM, 2016.
[41] C. X. Mavromoustakis, E. Pallis, G. Mastorakis, et al. Resource man-agement in mobile computing environments, volume 3. Springer, 2014.
[42] Y. Michalevsky, A. Schulman, G. A. Veerapandian, D. Boneh, andG. Nakibly. Powerspy: Location tracking using mobile device poweranalysis. In 24th USENIX Security Symposium (USENIX Security 15),pages 785–800, Washington, D.C., 2015. USENIX Association.
[43] C. Min, Y. Lee, C. Yoo, S. Kang, S. Choi, P. Park, I. Hwang, Y. Ju, S. Choi,and J. Song. Powerforecaster: Predicting smartphone power impact ofcontinuous sensing applications at pre-installation time. In Proceedingsof the 13th ACM Conference on Embedded Networked Sensor Systems,pages 31–44. ACM, 2015.
[44] K. Mowery, S. Meiklejohn, and S. Savage. Heat of the moment: charac-terizing the efficacy of thermal camera-based attacks. In Proceedings ofthe 5th USENIX conference on Offensive technologies, pages 6–6. USENIXAssociation, 2011.
[45] B. Nagendran, A. Raghupathy, and W. Maltz. Thermal managementchallenges in forced convection tablets. In Thermal Measurement,Modeling & Management Symposium (SEMI-THERM), 2015 31st, pages37–40. IEEE, 2015.

Soowon Kang∗, Hyeonwoo Choi†, Sooyoung Park∗, Chunjong Park‡, Jemin Lee§, Uichin Lee∗, Sung-Ju Lee∗
[46] M. Nakamura, T. Yoda, L. I. Crawshaw, S. Yasuhara, Y. Saito, M. Kasuga,K. Nagashima, and K. Kanosue. Regional differences in temperaturesensation and thermal comfort in humans. Journal of Applied Physiol-ogy, 105(6):1897–1906, 2008.
[47] J. Park, S. Lee, and H. Cha. Accurate prediction of smartphones’skin temperature by considering exothermic components. In Design,Automation & Test in Europe Conference & Exhibition (DATE), 2018,pages 1500–1503. IEEE, 2018.
[48] J. Park, S. Lee, and H. Cha. App-oriented thermal management ofmobile devices. In Proceedings of the International Symposium on LowPower Electronics and Design, page 36. ACM, 2018.
[49] A. Pathak, Y. C. Hu, and M. Zhang. Where is the energy spent insidemy app?: fine grained energy accounting on smartphones with eprof.In Proceedings of the 7th ACM european conference on Computer Systems,pages 29–42. ACM, 2012.
[50] Qualcomm Technologies, Inc. Dragonboard™ 410c based on qual-comm® snapdragon™ 410e processor thermal debugging guide. 2016.https://goo.gl/2Xfzg1.
[51] J. Redmon, S. Divvala, R. Girshick, and A. Farhadi. You only lookonce: Unified, real-time object detection. In Proceedings of the IEEEConference on Computer Vision and Pattern Recognition, pages 779–788,2016.
[52] A. Sahami Shirazi, Y. Abdelrahman, N. Henze, S. Schneegass, M. Khalil-beigi, and A. Schmidt. Exploiting thermal reflection for interactivesystems. In Proceedings of the 32nd annual ACM conference on Humanfactors in computing systems, pages 3483–3492. ACM, 2014.
[53] K. Sekar. Power and thermal challenges in mobile devices. In Proceed-ings of the 19th annual international conference on Mobile computing &networking, pages 363–368. ACM, 2013.
[54] J. Y. Seo and J. H. Chung. Thermal aging: a new concept of skin aging.Journal of Dermatological Science Supplement, 2(1):S13–S22, 2006.
[55] G. Singla, G. Kaur, A. K. Unver, and U. Y. Ogras. Predictive dynamicthermal and power management for heterogeneous mobile platforms.In Proceedings of the 2015 Design, Automation & Test in Europe Confer-ence & Exhibition, pages 960–965. EDA Consortium, 2015.
[56] A. Straume, G. Oftedal, and A. Johnsson. Skin temperature increasecaused by a mobile phone: a methodological infrared camera study.Bioelectromagnetics, 26(6):510–519, 2005.
[57] H. Suh, N. Shahriaree, E. B. Hekler, and J. A. Kientz. Developing andvalidating the user burden scale: A tool for assessing user burdenin computing systems. In Proceedings of the 2016 CHI Conference onHuman Factors in Computing Systems, pages 3988–3999. ACM, 2016.
[58] D. Suleiman, M. Ibrahim, and I. Hamarash. Dynamic voltage frequencyscaling (dvfs) for microprocessors power and energy reduction. 2005.
[59] G. Wagner and W. Maltz. Thermal management challenges in thepassive cooling of handheld devices. In Thermal Investigations of ICsand Systems (THERMINIC), 2013 19th International Workshop on, pages344–347. IEEE, 2013.
[60] Q. Xie, M. J. Dousti, and M. Pedram. Therminator: a thermal simula-tor for smartphones producing accurate chip and skin temperaturemaps. In Low Power Electronics and Design (ISLPED), 2014 IEEE/ACMInternational Symposium on, pages 117–122. IEEE, 2014.
[61] Q. Xie, J. Kim, Y. Wang, D. Shin, N. Chang, and M. Pedram. Dynamicthermal management in mobile devices considering the thermal cou-pling between battery and application processor. In Computer-AidedDesign (ICCAD), 2013 IEEE/ACM International Conference on, pages242–247. IEEE, 2013.
[62] H. Zhang, E. Arens, C. Huizenga, and T. Han. Thermal sensation andcomfort models for non-uniform and transient environments, partii: local comfort of individual body parts. Building and Environment,45(2):389–398, 2010.
[63] H. Zhang and A. Hedge. Laptop heat and models of user thermaldiscomfort. In Proceedings of the Human Factors and Ergonomics SocietyAnnual Meeting, volume 58, pages 1456–1460. Sage Publications SageCA: Los Angeles, CA, 2014.
[64] H. Zhang, A. Hedge, and D. Cosley. Thermal sensation, rate of tem-perature change, and the heat dissipation design for tablet computers.Applied Ergonomics, 62:197–203, 2017.
[65] L. Zhong, A. Bellemer, H. Yan, K. Honjo, J. Robertson, R. Y. Hwang,G. S. Pitt, and W. D. Tracey. Thermosensory and nonthermosensoryisoforms of drosophila melanogaster trpa1 reveal heat-sensor domainsof a thermotrp channel. Cell reports, 1(1):43–55, 2012.