fire performance of candidate materials for a next ... · fire performance of candidate materials...
TRANSCRIPT

Page 1 of 99
Fire Performance of Candidate Materials for a Next
Generation Fire Attack Hose
Major Qualifying Project Report
Submitted to the Faculty of WORCESTER POLYTECHNIC INSTITUTE In partial fulfilment of the requirements for the
Degree of Bachelor of Science in Chemical Engineering
By: Andrea Boxell
Meghan Goodwin
Date: April 28th, 2016
Approved by: Kathy Notarianni, Associate Professor
Raymond Ranellone, Research Engineer
This report represents the work of two WPI undergraduate students submitted to the faculty as evidence of
completion of a degree requirement. WPI routinely publishes these reports on its website without editorial or peer
review. For more information about the projects program at WPI, please see
http://www.wpi.edu/academics/ugradstudies/project-learning.html

Page 2 of 99
Abstract
This research documents the thermal performance of fire-resistant materials for use in the outer
jacket of a next generation fire attack hose. Current hose materials, polyester and nylon 6,6, have
decomposition temperatures lower than those seen on the fireground. A unique test procedure was
developed by the team using a cone calorimeter for its steady state radiative heat source that can simulate
conditions seen on the fireground. Ten materials used in other high heat applications were identified and
tested using this testing procedure. Results showed that materials can survive flashover and post-flashover
conditions while current materials fail prior to flashover. This project is a stepping stone in the discovery
and development of material testing for a next generation fire attack hose.

Page 3 of 99
Acknowledgements
We would like to thank the following people and organizations for their support in the completion of
this project:
• Rebecca Ziino
• Tahar El-Korchi
• Last Call Foundation
• Boston Fire Department
• PBI Performance Products, Inc.
• Teijin Limited
• ZOLTEKTM
• Waubridge Specialty Fabrics
• Toho Tenax America, Inc.

Page 4 of 99
Table of Contents
Abstract ................................................................................................................................................... 2 Acknowledgements ................................................................................................................................. 3 Table of Contents .................................................................................................................................... 4 Table of Figures ...................................................................................................................................... 6 List of Tables .......................................................................................................................................... 6 Definitions .............................................................................................................................................. 7 1. Introduction ..................................................................................................................................... 8
1.1 The Problem ............................................................................................................................ 8 1.2 Next Generation Fire Attack Hose Research Project ................................................................. 8 1.3 Investigation of Fire Performance of Candidate Materials - Project Goals ............................... 10
2. Background ................................................................................................................................... 10 2.1 Fireground Conditions ............................................................................................................ 10 2.2 Modern Day Fire Attack Hoses .............................................................................................. 11 2.3 Research to Date on Candidate Materials ................................................................................ 13
3. Researching Candidate Materials ................................................................................................... 13 3.1 Research Method ................................................................................................................... 14 3.2 Fire-Resistant Materials ......................................................................................................... 15 3.3 Candidate Materials ............................................................................................................... 16
3.3.1 Personal Protective Equipment ....................................................................................... 16 3.3.2 Thermal Protection ......................................................................................................... 18 3.3.3 Home Goods .................................................................................................................. 19 3.3.4 Automotive/Aerospace ................................................................................................... 20 3.3.5 Other .............................................................................................................................. 21
4. Screening of Candidate Materials ................................................................................................... 22 5. Development of a Test Method for Radiative Heat Testing of Materials ......................................... 24
5.1 Identification of a Radiative Heat Source ................................................................................ 24 5.2 Testing Procedure for Candidate Materials ............................................................................. 26 5.3 Pass/Fail Criteria .................................................................................................................... 28
6. Testing of Candidate Materials ...................................................................................................... 28 7. Results and Discussion .................................................................................................................. 30
7.1 Heat Flux of 20 kW/m2 .......................................................................................................... 30 7.1.1 Observations ......................................................................................................................... 31 7.1.2 Quantitative Measurements ................................................................................................... 34
7.2 Heat Flux of 30 kW/m2 .......................................................................................................... 35 7.2.1 Observations ......................................................................................................................... 35 7.2.2 Quantitative Measurements ................................................................................................... 38
7.3 Heat Flux of 40 kW/m2 .......................................................................................................... 40 7.3.1 Observations ......................................................................................................................... 40 7.3.2 Quantitative Measurements ................................................................................................... 41
7.4 Summary of Results ............................................................................................................... 43 8. Evaluation of Methodology ............................................................................................................ 44
8.1 Lessons Learned..................................................................................................................... 44 8.2 Study Limitations ................................................................................................................... 45
9. Conclusions and Recommendations ............................................................................................... 45 9.1 Project Conclusions ................................................................................................................ 45 9.2 Recommendations for Future Research ................................................................................... 46
10. References ................................................................................................................................. 47 Appendices............................................................................................................................................ 52

Page 5 of 99
Appendix A: Material Properties and Company Information .............................................................. 52 Appendix B: The Cone Calorimeter ................................................................................................... 60
History and Uses............................................................................................................................ 60 Design ........................................................................................................................................... 60 Standards ....................................................................................................................................... 61
Appendix C: Cone Calorimeter Calibration Curve.............................................................................. 63 Appendix D: Step By Step Test Procedure for Candidate Materials .................................................... 64 Appendix E: Temperature Profiles Obtained During Testing .............................................................. 66
Heat Flux of 20 kW/m2 .................................................................................................................. 67 Heat Flux of 30 kW/m2 .................................................................................................................. 76 Heat Flux of 40 kW/m2 .................................................................................................................. 87
Appendix F: Average Percent Mass Loss, Average Ignition Time, and Standard Deviation ................ 97

Page 6 of 99
Table of Figures
Figure 1: Types of Materials .................................................................................................................. 15 Figure 2: Cone Calorimeter Diagram ..................................................................................................... 25 Figure 3: Example of Sample after Exposure to 40 kW/m2 ..................................................................... 40
List of Tables
Table 1: Material Properties of Nylon 6,6 and Polyester ......................................................................... 12 Table 2: Completed Test Matrix ............................................................................................................ 29 Table 3: Current Material Performance .................................................................................................. 30 Table 4: Before and After Photos of Materials Passed at 20 kW/m2 ........................................................ 31 Table 5: Before and After Photos of Materials Passed at 20 kW/m2 ........................................................ 33 Table 6: Data Recorded at 20 kW/m2 ..................................................................................................... 34 Table 7: Before and After Photos of Candidate Materials that Passed at 30 kW/m2................................. 36 Table 8: Before and After Photos of Candidate Materials that Failed at 30 kW/m2 ................................. 37 Table 9: Data Recorded at 30 kW/m2 ..................................................................................................... 39 Table 10: Data Recorded at 40 kW/m2 ................................................................................................... 41 Table 11: Summary of Testing Results .................................................................................................. 43 Table 12: Material Properties for Use in Narrowing Down Materials List .............................................. 52 Table 13: Materials and Companies ....................................................................................................... 59 Table 14: Average Percent Mass Loss at 20 kW/m2 ............................................................................... 97 Table 15: Average Percent Mass Loss and Ignition Time at 30 kW/m2 ................................................... 98 Table 16: Average Percent Mass Loss and Ignition Time at 40 kW/m2 ................................................... 99

Page 7 of 99
Definitions (Oxford English Dictionary, N.D.)
Burn-through n. A hole formed in a material due to exposure to heat
Fire-resistant adj. able to withstand fire without damage or without structural failure
Fire-retardant (a) n.
(b) adj.
(a) a substance or treatment that confers the property of slowing or
halting the spread of fire
(b) (usually with hyphen) that slows or halts the spread of fire
Flame-resistant adj. not readily flammable
Flame-retardant adj. See flame-resistant

Page 8 of 99
1. Introduction
This section outlines and discusses the significance of this Major Qualifying Project (MQP) and the
potential impact it may have on the fire industry.
1.1 The Problem
On March 26, 2014 a nine-alarm fire broke out in a four-story brick home in the Back Bay of
Boston, Massachusetts. Strong winds drove an intense fire that continued to grow, tearing through
the brownstone and resulting in unpredictable conditions. In the basement of the building were two
Boston Fire Department officials, Lieutenant Edward Walsh and Firefighter Michael Kennedy. They
entered the building with the intent of rescuing a possible victim from the basement. Upon reaching
the bottom of the stairs, Lieutenant Walsh was recorded calling Command to request water. At this
point, the Engine 33 pump operator charged the line. However, “the 1 ¾-inch hoseline used by
Engine 33 was burned through during the initial fire-fighting operations. The 2 ½-inch hoseline that
Engine 7 stretched to the first floor was severely damaged as well” (The National Institute for
Occupational Safety and Health (NIOSH), 2016). Tragically, neither firefighter survived the incident.
1.2 Next Generation Fire Attack Hose Research Project
Professor Notarianni, in WPI’s Fire Protection Engineering (FPE) Department, is the lead advisor
for the Next Generation Fire Attack Hose Project whose objective is to facilitate the development of a fire
hose that can withstand the rigors of the fireground. Fire Performance of Candidate Materials For a Next
Generation Fire Attack Hose is one key part of this multi-year project in which, to date, six distinct
student research teams are working on one or more key parts of this important research. The overall
project has achieved several advancements in the areas of:
1) Incident Documentation/Creation of a National Database
2) Review of National and International Standards

Page 9 of 99
3) Determining and Documenting the Needs of the Fire Service
4) Development of Taxonomy of Performance Metrics
5) Manufacturing
6) Engagement of Stakeholders
7) Documenting Heat Resistance of Current Hose Materials
8). Identification and Testing of Higher Performing Materials
9). Development of Standardized Testing Apparatus for Conduction
10) Development of a Standardized Testing Apparatus for Convection and Radiation
The Next Generation Fire Attack Hose Research Project has developed a database which tracks
burn-throughs and has also determined that the current standards for the fire hose do not accurately reflect
modern day fireground conditions. The number of incidents now documented in the database show that
the Boston Back Bay tragedy is not a lone event and the database shows that burn-throughs are occurring
more often than researchers thought.
Teams have analyzed NFPA 1961 Standard on Fire Hose and NFPA 1971 Standard on
Protective Ensembles for Structural Fire Fighting and Proximity Fire Fighting. Through this analysis,
students determined that fire hoses are tested less vigorously than Personal Protective Equipment (PPE),
even though they face the same conditions on the fireground. Research has also been conducted in
relation to other standards, both internationally as well as within the United States. Communication with
the fire service facilitated the creation of a taxonomy of metrics that a fire hose needs to meet.
Research on materials used to manufacture hoses was also conducted by another WPI MQP
team. This team conducted initial tests on some candidate materials for use in hoses. In order to facilitate
testing of fire attack hoses in a way that more accurately depicts fireground conditions hoses must
withstand, the Fire Attack Hose Research Project is in the process of developing new test methods. Two
teams are currently working to develop apparatuses to test hoses using conductive and convective heat
transfer. These teams are working to develop and patent the apparatus and present the testing methods to
the NFPA 1961 Technical Committee.

Page 10 of 99
1.3 Investigation of Fire Performance of Candidate Materials - Project Goals
This project aims to investigate the thermal performance of materials that are currently used in
other high heat environments as candidates for the outer jacket of a next generation fire attack hose. It
was hypothesized that several candidate materials were available that could outperform current materials
in terms of radiative heat performance.
2. Background
The following section highlights important information needed to convey how burn-throughs
occur on the fireground and how this affects firefighters and the fire service industry. It also details
pertinent conclusions from previous research on candidate materials.
2.1 Fireground Conditions
Modern day fireground environments have evolved over the past several decades, resulting in
more intense fire conditions. Residential structures are becoming larger, allowing for increased fuel loads.
Also, open floor plans, which lack passive containment, are becoming more common. Newly-engineered
glued beams and synthetic building materials, which ignite more easily and promote faster flame spread,
have replaced traditional wooden frames. These new beams are more unstable and unpredictable
compared to dimensional lumber when under thermal attack. Household items are more abundant and are
now constructed from more combustible synthetic materials. These new structure designs, building
materials, and household commodities have led to rapid fire growth and intense fire conditions. As a
result, modern structures are reaching flashover conditions at a rate eight times faster than structures built
fifty years ago.
These decreased times to flashover and more unstable structures have led to changes in
firefighting techniques but not in hose material. Firefighters are arriving at more unpredictable fire scenes
and it is imperative that they have the tools appropriate to perform under such conditions. Firefighters’

Page 11 of 99
first line of defense, PPE, has developed continuously over the years. As fireground conditions change
and develop a firefighter’s second line of defense, the fire attack hose, should also develop, however,
these hoses are still being manufactured from the same materials they were fifty years ago. Synthetic fiber
and rubber hoses can still be found in fire departments’ trucks and storage, but previous research has
shown that these materials can burn-through. Therefore, this places firefighters at a higher risk of injury
or death. According to Analysis of Changing Residential Fire Dynamics published by UL, residential fire
room temperatures often reach temperatures of 400°C (750°F), and can even get as hot as 1200°C
(2190°F). Popular fire hose materials, such as polyester, nylon 6,6, or a blend of each, have thermal
failure temperatures of about 190°C (374°F) through 260°C (500°F) (Barolli et al, 2016). This
discrepancy between fire hose thermal performance capabilities and the actual thermal environment
encountered on the fireground has led to equipment failure. The evolution of the fireground gives insight
on modern day conditions candidate materials will need to withstand.
2.2 Modern Day Fire Attack Hoses
Municipal fire attack hoses are designed in two different configurations: single or double jackets.
Single jacket hoses are used for mostly forestry or industrial applications and they tend to be more
lightweight. Double jacket industrial hoses tend to experience harsher conditions in structures and were
more often seen when WPI MQP teams were collecting used hoses from U.S. Fire Departments. Hoses
are constructed with an inner liner and outer jacket which are bonded together through the manufacturing
process. Candidate materials discussed in this report are being investigated for use in the outer jacket of a
fire attack hose.
Modern day municipal fire attack hoses are designed and manufactured according to NFPA 1961
Standard on Fire Hose. This standard explains the design requirements for several performance metrics
such as flexibility, abrasion resistance, moisture resistance, pressure, and heat resistance. Municipal fire
attack hoses are often rolled up for storage, dragged across rough surfaces, and exposed to high pressure,
water, and heat. Due to these exposures, it is important that standards for fire attack hoses test hoses at the

Page 12 of 99
same rigor that they will be exposed to on the fireground. NFPA 1961 calls for testing significantly above
the normal operating conditions for a majority of key properties. One example of this can be seen in
pressure testing. The maximum operating pressure for a fire attack hose is 275 psi. Hoses are required to
have a minimum design service pressure of 300 psi and all testing occurs at pressures of at least 1.5 times
the design service pressure (450 psi). Some tests, like the burst test, require the hose to withstand at least
3 times the service pressure (900 psi).
In contrast to the rigorous pressure testing a fire attack hose must undergo, heat resistance testing
is significantly less extensive. Although there are several modes of heat transfer that hoses will be
exposed to, currently fire attack hose is solely tested for conduction and the level of conductive heat in
this conduction test is below the level of conductive heat it will be subjected to on the fireground. NFPA
1961 only requires a conductive heat test to be performed. This test entails placing a solid steel block at
260℃ on the hose for 60 seconds. As explained in the previous section, residential fire room temperatures
can reach anywhere between 400°C and 1200°C. The two most common outer jacket materials currently
used, nylon 6,6 and polyester, have melting points around 255°C and 195°C respectively and decompose
near 255°C as stated in Table 1. It is clear that these two materials decompose around 255°C are well
below the temperatures that they would be exposed to on the fireground.
Table 1: Material Properties of Nylon 6,6 and Polyester (Handbook of Fire Resistant Textiles, 2013)
Material Melting
Point (℃)
Decomposition Temperature
(℃)
Max Service Temperature Short
Term (℃)
Max Service Temperature Long
Term (℃)
Nylon 6,6 255 254 180 80 - 95
Polyester 195 256 --- 89.1

Page 13 of 99
2.3 Research to Date on Candidate Materials
This project builds off of previous WPI research that concluded that current hose jacket materials
do not withstand pre-flashover conditions. Previous research also initiated some testing of higher
performing materials and proved that there are materials being manufactured that perform better in high
heat environments than current materials, and certain candidate materials do not ignite until heat fluxes
higher than those indicative of flashover. The previous project tested nylon 6,6, polyester, Kevlar,
Nomex, PBI Max, PBI Kombat Flex, and Pyrovatex fr Cotton using a cone calorimeter. The radiative heat
tests were performed for 15 minutes (900 seconds) at heat fluxes of 11.9 kW/m2, 18 kW/m2, and 24.2
kW/m2. From their testing, they “determined that there are other materials currently being manufactured that
are better suited for the high heat environment of the fireground than the current materials being used in fire
hose jackets today” (Barolli et al, 2016). This work expands the research by testing more candidate materials
and different heat fluxes.
3. Researching Candidate Materials
In order to identify existing materials currently used in other high heat applications that could
potentially be used in the municipal fire hose industry, the team conducted research and gathered the
following information. Nylon 6,6 and polyester, currently being used in outer jackets of municipal fire
attack hoses, were selected for their properties such as rot and mold resistance, not their thermal
resistance. However, there are other industries which utilize newly engineered fire-resistant and flame-
retardant materials. These industries include personal protective equipment (PPE), thermal protection,
home goods, and automotive/aerospace applications. These categories are further explained in
Section 3.2.
Page 14 of 99
3.1 Research Method
A literature review was conducted to uncover and investigate materials that may be better suited for
use in the outer jacket of a fire attack hose than current materials. This literature review began with
generating a list of keywords that could be used to search through technical databases. Some keywords
that were used include:
- Fire Resistant Materials
- Fire Retardant Materials
- Fire Resistant Textiles
- Fire Retardant Textiles
- Fire Resistant Fibers
- Fire Retardant Fibers
- Heat Resistant Materials
- Heat Resistant Textiles
- Heat Resistant Fibers
These keywords were used to locate several trade journals, technical papers, and material handbooks.
From these sources, a wide variety of fire and heat resistant materials were discovered. It was then
possible to collect more information on each material using company websites and technical data sheets.
A summary of the important aspects of a fire-resistant material as well as a brief description of each
material found is provided in the following two sections. The team created a complex spreadsheet after
obtaining the material names and company information. This can be found in Appendix A. These
materials were then grouped by industry/application. Section 3.2 describes general characteristics and
chemistry of fire-resistant and fire-retardant materials and Section 3.3 provides a brief description of each
candidate material.

Page 15 of 99
3.2 Fire-Resistant Materials
Many fire-resistant or fire-retardant materials are made of synthetic fibers. The Handbook of Fire
Resistant Textiles states that the two most common classes of these fibers are the aramid family and the
poly-benzazole family. The most common aramids are based on an aromatic amide meta-structure. This
structure consists of amide linkages located in the meta position (substituents at the 1 and 3 position in the
aromatic structure). Meta- aramids have excellent heat resistance and high temperature resistance. They
also have moderate tenacity and low elasticity. Another type of aramid is the para-aramid in which the
amide linkages are located in the para position (substituents at the 1 and 4 position in the aromatic
structure). Para-aramids are typically the basis for protective clothing due to their high strength, non-
flammability, and high temperature resistance. Blending meta-aramid fibers with para-aramid fibers can
further improve their performance.
Figure 1: Types of Materials (Handbook of Fire Resistant Textiles, 2013)
The second family of fire-resistant fibers, poly-benzazoles, is also often found as the basis of
protective clothing. These fabrics are puncture, tear, and rip resistant in addition to heat resistant. They
also have excellent strength and elastic modulus. Poly-benzazole fibers are typically much more
expensive than aramids so they are often blended with other materials to reduce cost. (Handbook of Fire
Resistant Textiles, 2013)

Page 16 of 99
3.3 Candidate Materials
The following paragraphs provide brief descriptions of the materials that were identified in the
literature review described above. Candidate materials are used in multiple real world applications and
they are presented here by their primary application. Further technical details for each material can be
seen in Appendix A.
3.3.1 Personal Protective Equipment
The materials listed in this category have their primary application in PPE which consists of
firefighter turnout gear such as jackets, pants, and gloves, as well as other thermal protective clothing.
Apyeil and Fenilon – These candidate materials were mentioned in the Handbook of Fire
Resistant Textiles, which explains that these materials are used in the outer shell of firefighters’ protective
ensemble. They are a type of aramid fiber and Apyeil is produced by Unitika (Handbook of Fire Resistant
Textiles, 2013).
Celiox – Celiox is produced by Celanese and is a semicarbon fiber used in the outer shell of
firefighter protective ensembles (Handbook of Fire Resistant Textiles, 2013).
Gladiator – This material is also used in the outer shell of firefighter protective ensembles and is
a blend of Kevlar and Basofil (Handbook of Fire Resistant Textiles, 2013).
Kermel – Kermel is a polyimide-amide fiber produced by Kermel. It is flexible and chemical
resistant. In addition, it has very good resistance to abrasion. The primary applications of Kermel are in
firefighter garments and industrial work wear ("Kermel Tech: High performance at the service of gas
filtration," 2009).
Kombat Flex – Kombat Flex is a blend of PBI and Kevlar produced by TenCate. It is flexible and
lightweight. In addition, Kombat Flex is abrasion and flame resistant ("TenCate Kombat Flex," 2014).

Page 17 of 99
Kovenex – Kovenex is a heat and flame resistant fabric produced by Waubridge Specialty
Fabrics. It is tear proof and is also certified by NFPA as a thermal barrier for firefighting gloves. Kovenex
has applications in personal protective equipment like gloves and shirts, as well as in outdoor equipment
and home/office furnishings ("Kovenex," N.D.).
Lenzing FR – Lenzing FR is a cellulose fiber produced from beech wood by the Lenzing Group.
It protects from fires, radiant heat, electric arcs, and molten metals. The primary application for Lenzing
FR is in protective clothing ("Lenzing FR," N.D.).
Nytox – Nytox is a thermo-oxidized polyacrylonitrile fiber produced in Russia by NPTs Uvikom.
This material is fire resistant and chemically stable. It is also relatively inexpensive. The main application
of Nytox is in protective clothing (Lavrent’eva, 2013).
P84 Aramid – P84 Aramid is a polyimide based fiber with an aromatic backbone. It is produced
by Evonik Industries in Germany. This fiber is stable with most organic solvents but is sensitive to strong
oxidizers. P84 Aramid meets all the typical requirements for common textile processing steps. It is
commonly used in protective clothing, high temperature filtration, sealing materials for spacecraft, and
heat insulation ("P84 Polyimide Fibres," N.D.).
Pavenex – Pavenex is produced by Waubridge Specialty Fabrics and is lightweight, durable, and
abrasion resistant. It provides direct contact protection from arc flash, spark, extreme heat, and flame. It is
a blend of carbon-based fibers which results in its flame-resistance. Pavenex is manufactured without
many of the chemical treatments commonly used that may be potentially harmful ("Pavenex," 2010).
PBI Fiber – PBI Fiber is a fire resistant material produced by PBI Performance Products, Inc.
PBI Fiber is lightweight and durable. It also has a high strength and good abrasion resistance. PBI Fiber
has its applications in firefighter jackets and other personal protective equipment ("Gold," N.D.).

Page 18 of 99
Teijinconex – Teijinconex is a meta-linked aromatic polyamide fiber that is produced by Teijin, a
Japanese company. It does not stick to skin. Teijinconex is strong, light, soft, and self-lubricating. It is
used primarily in clothing, filters, and copy cleaners. Company literature indicates that it is also used in
hoses but the application of the hose was not stated ("Twaron - a versatile high-performance fiber," 2012).
Twaron – Twaron is a heat, cut, and chemical resistant material that is manufactured by Teijin. It
has high strength as well as a high modulus. It also has high dimensional stability and is nonconductive.
This material is available with a specialty finishes such as water blocking. Twaron can have some
problems when exposed to sunlight. It is commonly used in protective clothing ("Twaron - a versatile
high-performance fiber," 2012).
Zylon – Zylon is available in two grades: As Spun (AS) and High Modulus (HM) and is produced
by Toyobo. It also comes in two types of fabrics: filament and spun yarn. Zylon is chemical, flame, and
heat resistant, however it does experience some decrease in strength with exposure to light. Zylon is
commonly used in firefighting garments, safety gloves, heat resistant garments, sports equipment, cable
coverings, and speaker cones ("PBO Fiber Zylon," 2005).
3.3.2 Thermal Protection
Materials included in this category have applications in general thermal protection meaning that
they are designed and manufactured to be used in environments where they would be exposed to a high
heat flux. Examples of these include, but are not limited to, fire blankets, flame barriers, or protective
fabrics.
Kynol Novoloid – Kynol Novoloid is a crosslinked phenolic resin that was developed in the
United States and is now produced in Germany by Kynol GmbH. Kynol Novoloid has high flexibility and
workability which is very good for production. It also has high flame and chemical resistance. In addition,
it is a thermoset polymer which means that it will not melt or drip. Primary uses for Kynol Novoloid are
Page 19 of 99
in fire blankets, flame barriers, protective curtains, seat linings, and shoe soles ("GCI Gunei Chemical
Industry," N.D.).
Millenia XT – Millenia XT is a para-aramid and PBO fiber blend produced by TenCate. It has
good flame and abrasion resistance. In addition, Milenia XT has good durability, making it a viable
option for thermal protection ("The Toughest Outer Shell Available in TenCate Millenia XT," 2016).
Nomex – Nomex is a heat and flame resistant material produced by DuPont USA. It is
lightweight and has good chemical resistance for many chemical types. Nomex tends to lose some of its
properties with prolonged exposure to sunlight ("Technical Guide for NOMEX Brand Fiber," 2001).
Ultra – Ultra is a Kevlar blend produced by TenCate in America. It has good flame and abrasion
resistance. It also has good strength and is thermally stable. In addition, Ultra is competitively priced
("TenCate Ultra," 2014).
Technora – Technora is a para-aramid fiber produced by Teijin. It is made from copolymers.
Technora has good fatigue resistance and long term stability. It also has good resistance to corrosion,
heat, chemicals, and seawater ("Twaron - a versatile high-performance fiber," 2012).
3.3.3 Home Goods
This category includes items that are used in the manufacturing of commonly purchased items for
the average household, including upholstery and mattresses.
Basofil – Basofil is an advanced technology melamine fiber produced by Basofil. It blends well
with commodity fibers and other high temperature fibers to improve their properties. Basofil is
competitively priced and has a low thermal conductivity. It has applications in filtration and can be found
in bedding as well as in protective apparel ("Basofil Fibers, LLC," 2009).
Panox – Panox is an oxidized polyacrylonitrile fiber produced by SGL Group: The Carbon
Company. This material is chemical resistant and a good electrical insulator. It is also thermally

Page 20 of 99
stabilized. Panox does not burn, melt, soften, or drip. Common applications for Panox include flame
retardant mattresses, protective clothing, spark protection, fire blocking fabrics, and car disk brake pads
("SGL Group The Carbon Company," N.D.).
Protex – Protex is a modacrylic fiber manufactured by Kaneka Corporation and blends well with
other fibers like cotton, rayon, or polyester. One important characteristic of Protex is that it can self-
extinguish. Protex can be found in bedding, upholstery, drapery, carpet, faux fur, plush toys, and
protective clothing ("Kaneka," 2016).
3.3.4 Automotive/Aerospace
Several materials have their primary application in the automotive or aerospace industries. These
materials are used in high heat aspects of these vehicles, especially in brake systems.
Arselon – Arselon is a polyoxadiazole fiber produced by Heat Resistant Articles Production
Company. This material is easy to produce and is manufactured in Russia for applications in special
protective clothing, occupational safety and rescue equipment, aircraft and motor vehicle interiors, high
temperature filter cloths, electrical insulation and brake composites. Arselon is stable under cyclic and
static loads and has a high chemical and electrical resistance. At high temperatures it experiences low
shrinkage. It is also wear resistant and non-abrasive. Arselon can experience some decrease in strength in
the presence of water ("Arselon Withstanding Fiber," 2016).
Pyromex – Pyromex is an oxidized acrylonitrile fabric that is manufactured by Toho Tenax
America, Inc. It is a non-flammable and heat resistant fabric In addition, Pyromex is non-melting and
chemical resistant. It is also a good electrical insulator. Common uses for Pyromex are in protective
clothing, fire-proof ceilings, nozzle sealing, heat insulation, and automobile/aerospace heat protection
("Pyromex," N.D.).

Page 21 of 99
Pyron – Pyron is an oxidized acrylonitrile fiber. It is produced by Zoltek in America. Pyron is a
thermoset, meaning it does not burn, melt, or drip. Instead, the material will char and self-extinguish.
Pyron has its main application in aircraft brakes ("Technical Datasheet Pyron Continuous Tow," N.D.).
3.3.5 Other
Unlike the materials presented above that share common and widespread applications, this
category includes candidate materials not related to those categories or to each other. Their applications
are more unique and are being used in specialty markets.
Armatex SBN 13-602 Robotex - Armatex SBN 13-602 Robotex is a high temperature resistant
material produced by Mid-Mountains Materials, Inc. It has a high strength and is chemical resistant. In
addition it exhibits good abrasion resistance. Its primary applications are in welding, kiln seals, and
expansion joints ("Mid-Mountain Materials Incorporated," 2016).
Grafil O – Grafil O is a polyacrylonitrile based carbon fiber produced by Mitsubishi Rayon
Carbon Fiber & Composites, Inc. It has a high strength and has its primary application in tape production
("Mitsubishi Rayon Carbon Fiber & Composites," 2010).
Kevlar – Kevlar is produced by DuPont USA for use in ballistics and stab resistant body armor. It
is lightweight and cut resistant. In addition, it has a good resistance to moisture ("Kevlar Aramid
Fiber," N.D.).
M5 Fiber – M5 Fiber is produced by Magellan Systems International in partnership with DuPont
for ballistics and armor systems in vehicles as well as flame and thermal protection. Ballistics testing was
conducted on the material by the U.S. Army Natick Soldier Center (Body Armor News, 2005).
Nextel – Nextel is a ceramic oxide fiber produced in America by 3M Ceramic Textiles and
Composites. This material has low shrinkage at high temperatures and has good chemical resistance.

Page 22 of 99
Nextel also has a low thermal conductivity and provides good resistance to thermal shock ("Nextel
Ceramic Textiles Technical Notebook," 2004).
Sigrafil O – Sigrafil O is an electrically conductive material produced by SGL Group: The
Carbon Company. It is a free-flowing material that works well in the injection molding process. Common
applications of this material are in adhesives, specialty paper, floorings, and cement reinforcements.
Sigrafil O is often used to improve chemical resistance of materials ("Sigrafil Short Carbon
Fibers," 2016).
Wool – Wool is available from many manufacturers. It is a good electrical insulator. On the other
hand, it has poor chemical resistance against bases ("Wool," 2016).
4. Screening of Candidate Materials
Each of the 33 candidate materials identified from the literature was further screened to eliminate
those that either had little information available, did not meet one or more of the performance metrics of
fire hoses, or could not be ordered from companies. The criteria for the first round of elimination was
whether or not the team could find company contact information for the material. M5 Fiber was
eliminated in this initial round because Magellan Systems International was purchased by DuPont and
DuPont stopped manufacturing the product in 2005. The companies for Arselon, Kynol Novoloid,
Lenzing FR, and Nytox were unable to be contacted because they are located outside of the U.S. therefore
these materials were eliminated from the candidate material list. Basofil was also excluded because it is
no longer manufactured. All other candidate materials’ company information was found and at the end of
the first round, the team had a total of 27 candidate materials left.
The second round of elimination was based on material properties and the fire attack hose
performance metrics discussed in Section 2.2. The properties investigated were tensile strength, elastic
modulus, elongation at break, density, thermal conductivity, melting point, decomposition temperature,
Page 23 of 99
maximum service temperature, abrasion resistance, and moisture regain. These properties were chosen
because they represented some aspect of the conditions that a fire hose would be exposed to as explained
in NFPA 1961. Unfortunately, not all ten of these material properties could be found in the literature
review for every candidate material. All but 11 of the 27 candidate materials had information about their
heat resistance, specifically their melting point. These 11 materials were Armatex SBN 13-602 Robotex,
Grafil O, Kermel, Kombat Flex, Lenzing FR, Millenia XT, Sigrafil O, Ultra, Zylon AS, and Zylon HM.
After the second round of elimination, the team still had 16 materials for candidacy.
The third round of elimination was based on the given melting point of the candidate materials.
Many of the candidate materials had no melting point so the team was able to eliminate materials that had
melting points. Wool and Nextel were eliminated because they both have melting points lower than
common fire temperatures. The team’s list of candidacy now had a total of 14 materials.
Once this list of materials was compiled, the team eliminated the last round of candidate materials
based on their availability from their respective manufacturing companies. The team began contacting
companies to order samples but the companies that manufacture Kevlar, Nomex, P84 Aramid, Panox,
Protex, and Technora were unable to provide samples of their materials. Because samples were not able to
be obtained, these materials were excluded from the candidate material list as well. PBI Performance
Products was able to provide two different PBI fibers, namely PBI Gold and PBI Matrix. Teijin was also
able to provide two types of samples for Twaron. These were a knit Twaron and a woven Twaron. Two
types of Pyron were able to be obtained as well. These were Pyron fabric and Pyron felt.
The final list of candidate materials for testing was as follows: PBI Gold, PBI Matrix, Twaron
Knit, Twaron Woven, Teijinconex Neo, Kovenex, Pyron Fabric, Pyron Felt, Pavenex, and Pyromex, thus
10 of the 33 candidate materials were tested. The team also checked to be sure these 10 candidate
materials spanned across the applications discussed in Section 3.3. The materials are from the personal
protective equipment, thermal protection, and automotive/aerospace categories.

Page 24 of 99
5. Development of a Test Method for Radiative Heat Testing of Materials
There are currently no standardized or accepted radiative heat tests required for fire attack hoses
in the municipal fire hose industry. As discussed in Section 2.2, hoses are only subjected to a conductive
heat transfer test before they are approved for use even though it is known that fire hoses are exposed to
multiple sources of radiative heat on the fireground. An example is the radiative heat produced by objects
in the burning compartment. Because no radiative heat test currently exists, the team needed to develop a
procedure for radiative heat testing of candidate materials. The following sections describe the process of
developing the test procedure. The selection of a radiative heat source is explained followed by an
overview of the testing procedure and pass/fail criteria that were developed.
5.1 Identification of a Radiative Heat Source
Several requirements were considered in selecting a radiative heat source to be used as the basis
of the test procedure. The heat source needed to be able to be set and maintained at a steady heat flux. It
was necessary that heat flux could remain consistent between trials. The heat source also needed to be
able to be used for small scale testing. Many candidate materials were only available as small samples so
an apparatus that used a small sample size was desirable. The cone calorimeter, a widely known and
accepted apparatus, was selected to meet these requirements.
The cone calorimeter was first developed after the importance of a reliable bench scale test
method for heat release rate (HRR) was realized in the late 1970s and early 1980s and was the first
apparatus that could accurately reflect the conditions of the fireground for testing. The cone calorimeter
was first announced in a 1982 National Bureau of Standards (NBS) report (Society of Fire Protection
Engineers, 2008).
The cone calorimeter is based on the oxygen consumption principle which states that in general
the net heat of combustion of any organic material is directly proportional to the amount of oxygen
consumed during combustion. Every kilogram of oxygen consumed releases approximately 13.1 MJ of

Page 25 of 99
heat. The cone calorimeter uses the oxygen combustion principle and a measurement of the oxygen
depletion to provide the user with the heat release rate. The cone can also provide information on the heat
flux, combustion products, and other parameters of combustion (Worcester Polytechnic Institute, 2015).
Cone calorimeters rely on a sensing element that is sensitive to the partial pressure of oxygen in the cell
and is designed for testing in ambient air.
The heating element for the cone calorimeter is an electrical radiant heater. This heater is located
in the cone shaped element of the apparatus. The apparatus is depicted in the following schematic
diagram. The cone shape was chosen because it allows for a hole in the middle of the heater to prevent a
hot spot from developing in the center of the sample which is easy to verify with a heat flux gauge. The
shape also prevents flames from the specimen from splashing onto the heater coil. The radiant heater is
able to produce a uniform heat flux across the sample. In addition to the radiant heater, a spark plug is
located above the center of the specimen to assist in ignition.
Figure 2: Cone Calorimeter Diagram

Page 26 of 99
Several standards exist which should be followed to ensure proper use of the cone calorimeter.
The most common of these standards are the Society of Fire Protection Engineers (SFPE) Handbook,
ASTM E1354 - 15a Standard Test Method for Heat and Visible Smoke Release Rates for Materials and
Products Using an Oxygen Consumption Calorimeter, ISO 5660 Reaction-to-fire tests - Heat release,
smoke production, and mass loss rate, and the User’s Guide for the Cone Calorimeter. These standards
were used as a guideline while developing the methodology described in the following section. An
elaboration on the history, use, design, and standards for the cone calorimeter can be found in
Appendix B.
5.2 Testing Procedure for Candidate Materials
Once the cone calorimeter was selected as the radiative heat source, time to ignition and percent
mass loss were selected as values measurable in a laboratory test that would provide an indication of the
materials’ performance on the fireground. Time to ignition was defined as the length of time it takes from
the start of the test to the time a visible ember or flame is observed. Time to ignition is useful to determine
each material’s ability to withstand a set heat flux. Time to decomposition temperature was considered as
a parameter; however decomposition temperatures were unavailable for the candidate materials and were
unable to be measured in the limited timeframe of this project. Because decomposition causes mass loss,
the overall percent mass loss was used instead. Temperature at the top and bottom surface of each sample
was also recorded over the course of the experiment. If decomposition temperatures of the candidate
materials are studied in the future, then time to decomposition can be determined from the raw data
collected during the radiative heat tests shown in Appendix E. In addition to these quantitative
measurements, qualitative observations such as burn-through, color changes, size changes, fiber changes,
etc. were also recorded.
Before any testing could begin, samples needed to be prepared. All candidate materials were cut
into 10 cm by 10 cm squares and weighed on a balance that had been previously calibrated. These masses
were recorded for later use in calculating percent mass loss. Every material was able to be cut using
Page 27 of 99
kitchen shears. The samples were then wrapped with aluminum foil and two thermocouples were held in
place between the foil and the sample with insulative cement. The cement ensured that thermocouples
would not be able to shift during sample rig assembly or testing. A cardboard template was used to ensure
that thermocouples were consistently placed in the same location for each test. The foil wrapped sample
was then placed in a metal edge frame. Together, the foil and edge frame were used to prevent ignition
and disproportionate burning at the sample edges as well as to contain any dripping during combustion. A
fiberglass substrate was placed below each sample in the edge frame and a wire grid was placed on top.
The wire grid was used to contain any swelling in the event that a material experienced intumescence.
Two thermocouples were placed on top of the sample directly above the bottom thermocouples. Care was
taken to make sure the thermocouples did not touch the wire grid as that would skew temperature
readings.
To set the heat flux for the cone calorimeter, a calibration curve, shown in Appendix C, was used
to estimate a temperature that corresponded to the desired heat flux. The cone was set to this temperature
and allowed to stabilize before a heat flux gauge was used to confirm that the delivered heat flux
corresponded to the desired heat flux. A trial and error method was used to set the cone to a temperature
that provided the desired heat flux. Measuring the heat flux was crucial in ensuring that each material was
exposed to the correct heat flux.
Once the sample rig was fully assembled and the heat flux was set, the sample was placed on the
load cell for the calorimeter. The sample height was adjusted so that it sat 13 mm below the spark plug
which was 13 mm below the heat source. This set-up ensured consistency across all trials of this study.
Temperature recording and stop watches were started simultaneously with opening the shutter for the
cone. Each sample was exposed to the radiative heat source until it was fully consumed or fifteen minutes
(900 seconds) had elapsed, whichever occurred first. If a material extinguished after a period of ignition,
the test continued so that it could be seen if the sample would reignite. At the end of the test, temperature
recording was stopped and the shutters were closed. The sample was removed from the cone using

Page 28 of 99
protective gloves and allowed to cool under a nearby exhaust hood. The sample rig was disassembled and
the sample was reweighed after it was cool. A step by step procedure can be found in Appendix D.
5.3 Pass/Fail Criteria
To pass the radiative heat test, the material needed to withstand the full 15 minute (900 second)
exposure time with no ignition or observed burn-through. A burn-through is defined in this study as a
hole formed in a material due to exposure to heat. Any material that ignited or burned through was
considered to have failed the test. Percent mass loss was not considered in determining whether a material
passed or failed because without additional testing it is not known how much percent mass loss can be
accepted without altering other mechanical properties. Percent mass loss was, however, used to compare
candidate materials to each other. Lower percent mass losses were characteristic of more desirable
materials.
6. Testing of Candidate Materials
The team decided to test at three heat fluxes for this study, 20 kW/m2, 30 kW/m2, and 40 kW/m2.
The first heat flux, 20 kW/m2 represents flashover conditions. The team hypothesized the candidate
materials would withstand this vital fireground condition where current materials did not (Barolli, et al.,
2016). The team chose the other two heat fluxes because 30 kW/m2 is one and a half times flashover and
40 kW/m2 is twice flashover conditions.
In order to provide an indicator of repeatability, each candidate material was tested twice at each
of the three heat fluxes. The team wanted to ensure reproducibility of the results obtained through testing
as well as explore how consistent the data points would be. The team completed all tests at a given heat
flux before proceeding to the next heat flux. This helped to ensure that the heat flux remained consistent
throughout testing. The heat flux was also checked every five trials during each testing period to further
ensure that there had been no drift throughout the course of the experiment. It was necessary to ensure

Page 29 of 99
consistency and accuracy in the heat fluxes being used so care was taken to accurately measure them
using a heat flux gauge.
Table 2: Completed Test Matrix
Material 20 kW/m2 20 kW/m2 30 kW/m2 30 kW/m2 40 kW/m2 40 kW/m2 PBI Gold X X X X X X PBI Matrix X X X X X X Twaron Knit X X X X X X Twaron Weave X X X X X X Teijinconex Neo X X X X X X Kovenex X X X X X X Pyron Fabric X X X X X X Pyron Felt X X X X X X Pavenex X X X X X X Pyromex X X X X X X
Table 2 above shows the matrix of completed tests. Testing the materials in the order shown
allowed for comparisons to be made early in the experimental process between materials that were
expected to perform similarly. Materials were grouped by industry/application and were tested in the
following order: personal protective equipment, thermal protection, and automotive/aerospace. This
allowed materials that were likely to be the most promising candidates to be tested earlier in the
experimental process. Each material’s data was stored in a subfolder on the lab computer as well as on a
flash drive for backup.
Throughout the testing process, observations for materials such as burn-through, color changes,
and stability were recorded in addition to temperature, time to ignition, and percent mass loss as
previously stated. Temperature profiles obtained during testing can be found in Appendix E.

Page 30 of 99
7. Results and Discussion
The results of this study are presented below. As a reminder, the test procedure is discussed in
Section 5.2 and the pass/fail criteria in Section 5.3. Time to ignition was defined as the time from initial
exposure to when smoldering or flaming was observed. To pass the test the candidate material must have
withstood the full 15 minute (900 seconds) exposure time with no ignition or burn-through. A burn-
through is defined as a hole formed in a material due to exposure to heat.
Previous research on current materials has shown that polyester and nylon 6,6 fail at a heat flux at
which pre-flashover occurs, shown in Table 3 below. The data presented in the following sections clearly
demonstrates that there are candidate materials available with higher levels of heat resistance than what is
currently used. These materials may be suitable for a next generation fire attack hose and should be
evaluated for the full range of performance metrics such as abrasion, strength, etc. per NFPA
Standard 1961.
Table 3: Current Material Performance (adapted from Barolli et. al., 2016)
Material
11.9 kW/m2 18 kW/m2 Decomposition Ignition Decomposition Ignition
Polyester Yes No Yes Yes Nylon 6,6 Yes No Yes Yes
7.1 Heat Flux of 20 kW/m2
Every candidate material investigated in this project was able to pass the radiative heat test at a
heat flux of 20 kW/m2, a widely accepted value as an indicator of flashover (National Institute of
Standards and Technology, 2010). This project has demonstrated that each of the ten candidate materials
tested is able to withstand flashover conditions for a full 15 minute (900 seconds) exposure without
burning through or igniting.

Page 31 of 99
7.1.1 Observations
The team documented observations before and after each test for each candidate material.
Although each material passed the tests performed at 20 kW/m2, it is nonetheless important to observe
changes the materials underwent. Trials were observed throughout the full time span of the test in order to
document important visual observations. In addition, photographs were taken to document physical and
chemical changes the team observed during the radiative heat tests, shown in Table 4 below. The team
compared each material’s before and after pictures to each other as well as comparing one material to
another. The team observed that thinner materials underwent a drastic color change and decomposition
patterns can be seen on the material. PBI Gold, PBI Matrix, Twaron Knit, and Twaron Weave all change
to a darker color overall and browning is observed in the center of the samples from pyrolysis occurring.
Teijinconex Neo underwent a significant change from a deep blue hue to a light yellow color with
charring.
Table 4: Before and After Photos of Materials Passed at 20 kW/m2
Material Before After
PBI Gold
PBI Matrix

Page 32 of 99
Twaron
Knit
Twaron
Weave
Teijinconex
Neo
The thicker and felt-like materials, Kovenex, Pyron Felt, and Pavenex, became compressed and
more brittle compared to samples that did not undergo testing. These materials were very fragile to handle
when the tests were completed. Pyron Fabric and Pyromex both seem to have “shrunk” and their weaves
look tighter but the materials do not appear to have melted. Individual fibers are still clearly visible. These
pictures are shown in Table 5 below.

Page 33 of 99
Table 5: Before and After Photos of Materials Passed at 20 kW/m2
Material Before After
Kovenex
Pyron
Fabric
Pyron Felt
Pavenex
Pyromex

Page 34 of 99
An impression of the metal grid placed on top of the samples during testing can be seen on all
candidate materials except Pyron Fabric. All materials tested performed similarly in terms of ignition and
burn-through at this heat flux. The other piece of data that was recorded in this investigation was percent
mass loss.
7.1.2 Quantitative Measurements
Percent mass loss was used to provide a relative ranking of the effect of pyrolysis and
decomposition on the candidate materials. Use of a percent mass loss (as opposed to amount of grams
lost) was more meaningful because samples were initially of different weights and thicknesses. The team
calculated the percent mass loss for each trial using Equation 1 below.
% 𝑚𝑙𝑙𝑙𝑙 =
(𝑚𝑏𝑏𝑏𝑙𝑏𝑏 − 𝑚𝑎𝑏𝑎𝑏𝑏)𝑚𝑏𝑏𝑏𝑙𝑏𝑏
∗ 100% (1)
𝑚𝑏𝑏𝑏𝑙𝑏𝑏 – the mass of the material sample before the test [grams] 𝑚𝑎𝑏𝑎𝑏𝑏 – the mass of the material sample after the test [grams]
The percent mass loss data was used to rank the candidate materials by the lowest to highest
percent mass loss at a heat flux of 20 kW/m2 presented in Table 6 below. Because the team performed
two tests of each candidate material, the percent mass losses were averaged. Refer to Appendix F for the
raw data of each trial performed.
Table 6: Data Recorded at 20 kW/m2
Material Burn-Through Ave. Ignition Time (s)
Ave. Percent Mass Loss
Twaron Knit No No 1.48 Twaron Weave No No 2.62
PBI Matrix No No 5.39 Teijinconex Neo No No 7.32
PBI Gold No No 8.25 Pyromex No No 12.40
Pyron Felt No No 16.84 Pavenex No No 17.24
Pyron Fabric No No 17.97 Kovenex No No 27.52

Page 35 of 99
At flashover conditions, these materials lost between about 1.5% up to almost 30% of their mass.
Twaron Knit and Twaron Weave showed the lowest average percent mass losses, at 1.48% and 2.62%
respectively. This indicates that at a heat flux of 20 kW/m2, these two materials experienced the least
amount of pyrolysis. Even though all the materials met the criteria for passing the test, some exhibited
high amounts of percent mass loss. Kovenex exhibited the greatest percent mass loss at this heat flux. Its
average percent mass loss was around 10% higher than the percent mass loss for the next two highest
materials, Pyron Fabric and Pyromex.
7.2 Heat Flux of 30 kW/m2
When the heat flux was increased from 20 kW/m2 to 30 kW/m2 some materials began to fail
according to the pass/fail criteria of this study. A heat flux of 30 kW/m2 corresponds to one and a half
times more than flashover conditions. The candidate materials that passed trials at this heat flux may be
able to survive post-flashover conditions on the fireground.
7.2.1 Observations
The team documented more physical and chemical changes of the candidate materials at a heat
flux of 30 kW/m2 in comparison to the damages seen at heat fluxes of 20 kW/m2. Four materials, Pyron
Fabric, Pyron Felt, Pavenex, and Pyromex, were able to pass the radiative heat test at this heat flux.
Table 7 below shows the before and after pictures of these materials. Pyron Fabric and Pyromex seem to
have “shrunk” more significantly than they did at a heat flux of 20 kW/m2, shown in Table 5. Pavenex
and Pyron Felt are more compressed and brittle than they were after experiencing a heat flux of
20 kW/m2.

Page 36 of 99
Table 7: Before and After Photos of Candidate Materials that Passed at 30 kW/m2
Material Before After
Pyron
Fabric
Pyron Felt
Pavenex
Pyromex
The team observed burn-throughs and smoldering occurring during the radiative tests for some
materials at this heat flux, specifically PBI Gold, PBI Matrix, Twaron Knit, Twaron Weave, Teijinconex
Neo, and Kovenex. Interestingly, a material did not have to ignite to result in a burn-through. PBI Gold,
PBI Matrix, and Teijinconex Neo each experienced a burn-through without showing any signs of ignition.

Page 37 of 99
Twaron Knit, Twaron Weave, and Kovenex each smoldered at this heat flux which resulted in burn-
throughs.
The candidate materials that experienced a burn-through during the radiative test are shown in
Table 8 below. When comparing these materials to each other, PBI Gold experienced a larger burn-
through than PBI Matrix but Twaron Knit, Twaron Weave, and Teijinconex Neo all experienced even
larger burn-throughs. All five of these materials reached a maximum surface temperature in a range of
approximately 500°C - 600°C, as shown in Appendix E. When holding the samples up to a source of
light, such as a fluorescent light, the weaves of PBI Gold, Twaron Knit, Twaron Weave, and Teijinconex
Neo are more “spread out.” The fibers in the weave can still be seen but due to pyrolysis they have
decomposed and appear thinner. Kovenex performed similarly to Pavenex and Pyron Felt because it too
became more compressed and brittle after undergoing the radiative heat test at 30 kW/m2.
Table 8: Before and After Photos of Candidate Materials that Failed at 30 kW/m2
Material Before After
PBI Gold
PBI Matrix

Page 38 of 99
Twaron
Knit
Twaron
Weave
Teijinconex
Neo
Kovenex
7.2.2 Quantitative Measurements
Every material experienced a greater average percent mass loss at 30 kW/m2 when compared to
20 kW/m2 as expected but percent mass loss did not increase by the same amount for each material.
Variations in the chemical make-up and structure of each material could result in different heat resistance
profiles. These material differences could cause the variations in percent mass loss. The average percent
mass losses for each material at 30 kW/m2 are shown in Table 9 below.

Page 39 of 99
Table 9: Data Recorded at 30 kW/m2
Material Burn-Through Ave. Ignition Time (s)
Ave. Percent Mass Loss
PBI Matrix Yes No 26.62 Twaron Knit Yes 542 28.79
PBI Gold Yes No 29.31 Pyron Felt No No 33.85 Pavenex No No 34.39 Pyromex No No 37.77
Pyron Fabric No No 38.65 Teijinconex Neo Yes No 41.35 Twaron Weave Yes 538 54.31
Kovenex Yes 815 56.77
The percent mass loss data was again used to rank the materials in order of lowest to highest
percent mass loss. The highest amount of percent mass lost at 20 kW/m2 was within one percent of the
lowest percent mass lost at 30 kW/m2. Although PBI Matrix, Twaron Knit, and PBI Gold have the lowest
average percent mass losses, they were not able to pass the radiative heat test due to burn-throughs. Pyron
Fabric, Pyron Felt, Pavenex, and Pyromex all passed the radiative heat test and had very similar percent
mass losses ranging from 33% - 40%. These were the next lowest percent mass losses after PBI Matrix,
Twaron Knit, and PBI Gold. Similarly to the lower heat flux test, Kovenex again experienced the highest
percent mass loss out of the ten candidate materials. It experienced 27.52% at 20 kW/m2 and 56.77% at
30 kW/m2. Twaron Weave showed a much larger percent mass loss at 30 kW/m2 than it did at 20 kW/m2,
54.31% and 2.62% respectively.
Table 9 also shows the average time to ignition the team recorded during trials of candidate
materials that ignited. Twaron Knit, Twaron Weave, and Kovenex all experienced smoldering, as
mentioned above. Twaron Knit and Twaron Weave both ignited at approximately 9 minutes, 542 seconds
and 538 seconds, respectively. These two times are within 1% of each other while Kovenex experienced
ignition starting at about 13.5 minutes (815 seconds). Even though Kovenex ignited approximately 4.5
minutes after Twaron Weave, Twaron Weave had a similar average percent mass loss to Kovenex.

Page 40 of 99
7.3 Heat Flux of 40 kW/m2
When subjected to a heat flux of 40 kW/m2, seven materials failed according to the pass/fail
criteria of this study. However, what is more important is that three materials actually withstood the full
15 minute (900 seconds) exposure. A heat flux of 40 kW/m2 corresponds to twice the heat flux at the
onset of flashover. This is more than double the heat flux existing materials were able to pass a radiative
heat test.
7.3.1 Observations
At this heat flux most of the materials burned completely, except for the edges which were
protected by the aluminum foil and edge frame. An example is shown below in Figure 3. After each test
was performed at this heat flux, most of the samples were too delicate to remove from the sample holder
without breaking them apart, even after they had fully cooled to room temperature. Six of the materials
that failed at this heat flux failed due to ignition. Teijinconex Neo, however, did not ignite but instead
disintegrated. Of the materials that ignited, two experienced flaming, Kovenex and Pyron Fabric, while
the others exhibited smoldering. Three materials, Pyron Felt, Pavenex, and Pyromex, passed the radiative
heat test at this high heat flux. These three remained intact and were easily removed from the sample
holder. Pyron Felt and Pavenex again looked compressed and were very brittle. Pyromex looked as if its
fibers had shrunk again.
Figure 3: Example of Sample after Exposure to 40 kW/m2

Page 41 of 99
7.3.2 Quantitative Measurements
Average percent mass losses again increased as heat flux increased from 30 kW/m2 to 40 kW/m2
as expected. Percent mass losses at this heat flux are reported in Table 10 below. Many of the candidate
materials completely decomposed, however, because sample edges were protected by aluminum foil and
a frame, percent mass loss was never 100% for any candidate materials. Some samples had very small
amounts of combustion products stuck to the foil. Other materials had such lightweight combustion
products that upon removal from the cone calorimeter, ash could be seen floating into the air.
Table 10: Data Recorded at 40 kW/m2
Material Burn-Through Ave. Ignition Time (s)
Ave. Percent Mass Loss
Pavenex No No 65.04 Pyron Felt No No 65.18 Pyromex No No 67.72
Pyron Fabric Yes 21 77.90 Twaron Knit Yes 126 79.92
PBI Gold Yes 136 82.91 PBI Matrix Yes 150 88.82
Teijinconex Neo Yes No 89.41 Kovenex Yes 48 91.43
Twaron Weave Yes 149 94.27
The ranking of candidate materials by average percent mass loss is very different than the ranking
at 30 kW/m2. The lowest percent mass loss at 40 kW/m2 was higher than the highest percent mass loss at
30 kW/m2. It is approximately 14% higher as the highest lost at 40 kW/m2 is 65.04% while at 30 kW/m2,
the lowest is 56.77%. Pavenex, Pyron Felt, and Pyromex passed the test and experienced the lowest
percent mass loss at this heat flux even though at 30 kW/m2 they fell into the middle of the ranking
ordered lowest to highest. Kovenex had a very high percent mass loss but it did not experience the highest
percent mass loss as it did at a heat flux of 20 kW/m2 and 30 kW/m2, 27.52% and 56.77% respectively.
Twaron Weave showed the highest average percent mass loss instead. Kovenex lost on average 91.43%
while Twaron Weave lost 94.27%.
Page 42 of 99
The team observed during the radiative heat tests whether or not the material completely
decomposed before the end of the full 15 minute (900 seconds) exposure time. Both PBI Gold and PBI
Matrix decomposed before the full 15 minutes (900 seconds) had elapsed at this heat flux and had
completely burned through around the 12 minute (720 seconds) mark, shown in Appendix F. The other 8
candidate materials did not decompose fully before the full 15 minute (900 seconds) exposure time had
elapsed.
Time to ignition data is also presented in Table 10 above. Four of the six candidate materials all
ignited within a 2 to 2.5 minute (120 seconds to 150 seconds) time range. Pyron Fabric and Kovenex
ignited outside of this range, both under 1 minute. Out of the candidate materials, Pyron Fabric ignited
first but it experienced the lowest percent mass loss of those that ignited. Meanwhile, Kovenex ignited
second but it lost the second highest percent of mass. When comparing ignition time at 40 kW/m2 to 30
kW/m2, all candidate materials that ignited did so much faster at the higher heat flux.

Page 43 of 99
7.4 Summary of Results
Table 11 summarizes the results of this study and depicts which candidate materials passed and
failed according to the criteria at each of the tested heat fluxes.
Table 11: Summary of Testing Results
Material
20 kW/m2 30 kW/m2 40 kW/m2
Ignition Burn-Through Ignition Burn-
Through Ignition Burn-Through
PBI Gold No No No Yes Yes† Yes PBI Matrix No No No Yes Yes† Yes
Twaron Knit No No Yes† Yes Yes† Yes
Twaron Weave No No Yes† Yes Yes† Yes
Teijinconex Neo No No No Yes No Yes
Kovenex No No Yes† Yes Yes* Yes Pyron Fabric No No No No Yes* Yes
Pyron Felt No No No No No No Pavenex No No No No No No Pyromex No No No No No No
†Smoldering *Ignition
As the table shows, more materials began to fail as heat flux increased leaving three materials
able to pass every test: Pyron Felt, Pavenex, and Pyromex. Pavenex is from the PPE category while Pyron
Felt and Pyromex are used in automotive/aerospace applications. Pyron Felt and Pavenex are both thick
materials while Pyromex is a thinner material. Although all ten candidate materials are able to withstand
the onset of flashover, only Pyron Felt, Pavenex, and Pyromex survived post-flashover conditions and
significantly outperform current materials in the municipal fire attack hose industry.

Page 44 of 99
8. Evaluation of Methodology
The following sections address challenges and inconsistencies that arose throughout the testing and
analysis process.
8.1 Lessons Learned
Shake down tests were performed prior to data collection to ensure that the procedure would
effectively meet the measurement goals. During the shake down testing, an unexpected temperature curve
was found. This was traced to a draft in the room that was distorting the temperature profiles recorded by
the thermocouples placed on top of the sample. To prevent this draft from disturbing the sample
environment, the heat shield was lowered around the heat source and sample. In addition, it was found
that the thermocouples on the bottom of the sample were moving during the sample rig assembly process.
This was corrected by using extra thermally insulative cement around the portion of the thermocouple just
below the bead. This allowed the thermocouples to stay in place without interfering with any temperature
readings. In the original test procedure, only one thermocouple was placed on top of the sample and one
thermocouple was placed on the bottom. To check that samples were being evenly heated, a second
thermocouple was added to both the top and bottom of the sample in a different location. A heat flux
gauge was also used to confirm that the cone calorimeter was providing an even heat flux to all areas of
the sample. It was also ensured that thermocouple beads did not touch the metal grid placed on top of the
sample and that all samples were evenly wrapped with aluminum foil.

Page 45 of 99
8.2 Study Limitations
In analyzing the data it is necessary to point out that only two data points were recorded for each
sample due to time constraints. Even though most of the results were reproducible within a certain degree,
more trials would have helped the team identify any outliers in the data. Outliers are important to note
because they may have affected the average values and standard deviations reported in Appendix F..
Additional confidence in the points that varied widely could be obtained by performing additional tests.
9. Conclusions and Recommendations
The following sections outline the team’s conclusions as well as possibilities for further research on
the subject.
9.1 Project Conclusions
This research project was able to show that there are several materials that have better resistance
to a radiative heat flux than nylon 6,6 and polyester. All ten candidate materials were able to pass the
radiative heat test at a heat flux of 20 kW/m2 which exceeds the capabilities of current materials. Three
candidate materials, Pyron Felt, Pavenex, and Pyromex, were the only materials able to pass the heat test
at all three heat fluxes. These materials did not have the lowest average percent mass losses at 20 kW/m2
but overall they performed well at every heat flux.
The radiative heat test procedure developed in this project was successful as a method for
obtaining radiative heat data for candidate materials. Distinct differences in material performance at each
heat flux were observed and can be easily seen in the recorded observations and photos that were
previously presented. The data obtained throughout the course of this project is useful in considering what
materials may be strong candidates for use as a next generation fire attack hose outer jacket.

Page 46 of 99
9.2 Recommendations for Future Research
This project is just one step in the process of solving the fire attack hose burn-through problem. In
order to solve this important issue it is necessary to continue research in several ways. First, it is
recommended that additional tests on the materials analyzed in this report be performed to obtain
additional data points and improve the confidence in the data presented here. It is also recommended that
the search for new material candidates be expanded to locate any lighter weight materials. The ability to
perform all tasks of a fire attack hose is important so it is recommended that the materials that performed
well in the radiative heat test be subjected to other material property tests such as tensile testing, pressure
testing, and abrasion resistance testing. Once materials have been selected as strong candidates for use as
a new outer jacket, they should be combined with an inner liner material and tested. Heat resistant
coatings should also be explored to further improve the heat resistance of potential materials. Lastly, it is
suggested that a prototype of a next generation fire attack hose be developed.
As previously stated, the research presented here is just one step in the process of reaching a next
generation fire attack hose design. Though it is just one step, it has been an important one. A research
process for uncovering potential new materials was created and can be used as a stepping stone for any
future researchers. In addition, a radiative heat test was developed to investigate the heat resistance of
materials and a few materials have been proposed for further research. Combined with future studies, this
project will be able to make the fireground safer for all those working to protect people.

Page 47 of 99
10. References
American National Standards Institute. 19 Lined Fire Hose and Hose Assemblies.
American Society for Testing and Materials. D412: Standard Test Methods for Vulcanized Rubber and
Thermoplastic Elastomers - Tension.
American Society for Testing and Materials. D518-99 Standard Test Method for Rubber Deterioration -
Surface Cracking.
American Society for Testing and Materials. D5181 Standard Test Method for Rubber Deterioration -
Surface Cracking.
American Society for Testing and Materials. E2584-14 Standard Practice for Thermal Conductivity of
Materials Using a Thermal Capacitance (Slug) Calorimeter.
American Society for Testing and Materials. (2015). D573-04 Standard Test Method for Rubber -
Deterioration in an Air Oven.
Barolli, R., Bouvier, J., Brecher, E., Gaudet, B., & Gillespie, C. (2016). Conductive, Convective, and
Radiative Heat Performance Testing of Fire Attack Hoses.
Basofil Fibers, LLC. (2009). Retrieved from
http://www.basofil.com/downloads/BF_097331_CorporateSheet_Comp16.pdf
Body Armor News. (2005). M5 Fiber for Ballistic Protection. Retrieved from
http://www.bodyarmornews.com/m5-fiber/
Bourbigot, S., Flambard, X., Ferreira, M., & Poutch, F. (2002). Blends of Wool with High Performance
Fibers as Heat and Fire Resistant Fabrics. Journal of Fire Sciences, 20(1), 3-22.
Bychkova, E. V., & Panova, L. G. (2014). Sorption of Flame Retardant by Viscose Rayon Fiber in
Manufacture of Flame-Resistant Fibers. Fibre Chemistry, 46(2), 113-117. doi:10.1007/s10692-
014-9572-y
Coatings Technology Handbook. (2006). (A. A. Tracton Ed. Third Edition ed.): CRC Press
Taylor & Francis Group
Committee on Fire, T. (1986). Fire and Smoke: Understanding the Hazards. Washington, DC, USA:
National Academies Press.
Fire Testing Technology. Cone Calorimeter. Retrieved from http://www.fire-testing.com/cone-
calorimeter-dual
Flambard, X., Bourbigot, S., Ferreira, M., Vermeulen, B., & Poutch, F. (2002). Wool/para-aramid fibres
blended in spun yarns as heat and fire resistant fabrics. Polymer Degradation and Stability,
77(2), 279-284. doi:http://dx.doi.org/10.1016/S0141-3910(02)00062-9

Page 48 of 99
Flame Retardants; New Findings from K.R. Fontenot and Co-Authors Describe Advances in Flame
Retardants (Application of a Phosphazene Derivative as a Flame Retardant for Cotton Fabric
using Conventional Method and Supercritical CO2). (2015). Chemicals & Chemistry, 723.
Flame Retardants; Study Findings on Flame Retardants Are Outlined in Reports from Sapienza
University [Flame retardant properties of plasma pre-treated/diamond-like carbon (DLC) coated
cotton fabrics]. (2015). Chemicals & Chemistry, 2585.
GCI Gunei Chemical Industry. Retrieved from http://www.gunei-
chemical.co.jp/eng/product/kynol.html# also http://www.kynol.de/pdf/kynol_flyer_en.pdf
Gold. Retrieved from http://www.pbiproducts.com/fabrics/en/products/gold/
Handbook of Fire Resistant Textiles. (2013). (F. S. Kilinc Ed.): Woodhead Publishing Limited.
Highly heat-resistant polyoxadiazole fibres and arselon filament: principles of manufacture, properties,
and use. An analytical review. (2008). Fibre Chemistry, 40(5), 406-414. doi:10.1007/s10692-
009-9088-z
Horrocks, A. R. (2014). 4 - High performance textiles for heat and fire protection. In C. A. Lawrence
(Ed.), High Performance Textiles and their Applications (pp. 144-175): Woodhead Publishing.
JBG Enterprises Inc. JGB Extruded-Through-The-Weave Hose Technology. Retrieved from
http://www.jgbhose.com/technical-reference-literature/JGB-through-the-weave-hose-
technology.asp
Jelil, R. A. (2015). A review of low-temperature plasma treatment of textile materials. Journal of
Materials Science, 50(18), 5913-5943. doi:10.1007/s10853-015-9152-4
Kaneka. (2016). Protex The preferred solution for fire-resistant fabrics. Retrieved from
http://www.kaneka.com/kaneka-americas/products/protex
Kermel Tech: High performance at the service of gas filtration. (2009). Retrieved from
https://www.kermel.com/medias/fichiers/kermel_tech_brochure_in_english.pdf
Kevlar Aramid Fiber. Retrieved from http://www.dupont.com/content/dam/dupont/products-and-
services/fabrics-fibers-and-
nonwovens/fibers/documents/DPT_Kevlar_Technical_Guide_Revised.pdf
Kovenex. Retrieved from http://kovenex.com/
Lavrent’eva, E. P. (2013). New-generation fire- and heat-resistant textile materials for working clothes.
Fibre Chemistry, 45(2), 107-113. doi:10.1007/s10692-013-9491-3
Lenzing FR. Retrieved from http://www.lenzing-fibers.com/en/lenzing-fr/
Mao, Z., Li, J., Pan, F., Zeng, X., Zhang, L., Zhong, Y., . . . Xu, H. (2015). High-Temperature Auto-
Cross-Linking Cyclotriphosphaznene: Synthesis and Application in Flame Retardance and

Page 49 of 99
Antidripping Poly(ethylene terephthalate). Industrial & Engineering Chemistry Research,
54(15), 3788-3799. doi:10.1021/ie504510t
Mid-Mountain Materials Incorporated. (2016). Retrieved from "http://mid-mountain.com/wp-
content/uploads/2015/03/Armatex-SN-13-602-ROBOTEX.pdf
Mitsubishi Rayon Carbon Fiber & Composites. (2010). Retrieved from
http://mrcfac.com/pdf/cf_tds/34_600_03_2010.pdf
National Fire Protection Agency. (2013a). 1961 Standard on Fire Hose.
National Fire Protection Agency. (2013b). 1971 Standard on Protective Ensembles for Structural Fire
Fighting and Proximity Fire Fighting.
National Institute of Standards and Technology. (2010). Fire Dynamics. Retrieved from
http://www.nist.gov/fire/fire_behavior.cfm
Nextel Ceramic Textiles Technical Notebook. (2004). Retrieved from
http://www.3m.com/market/industrial/ceramics/pdfs/Nextel_Tech_Notebook_11.04.pdf
Noncarboxylic Acids; Research Conducted at Suleyman Demirel University Has Provided New
Information about Noncarboxylic Acids (Investigation on Fire Retardancy Properties of Boric
Acid Doped Textile Materials). (2015). Chemicals & Chemistry, 2103.
Oxford English Dictionary. OED. Retrieved from http://www.oed.com/
P84 Polyimide Fibres. Retrieved from http://www.p84.com/sites/lists/PP-HP/Documents/p84-fibre-
technical-brochure.pdf
Pavenex. (2010). Retrieved from http://pavenex.com/
PBO Fiber Zylon. (2005). Retrieved from http://www.toyobo-global.com/seihin/kc/pbo/zylon-p/bussei-
p/technical.pdf
Pyromex. Retrieved from http://www.tohotenax.com/products/pyromexR/
Rault, F., Giraud, S., & Salaün, F. (2015). Flame Retardant/Resistant Based Nanocomposites in Textile.
In P. M. Visakh & Y. Arao (Eds.), Flame Retardants (pp. 131-165): Springer International
Publishing.
Rosace, G., Migani, V., Guido, E., & Colleoni, C. (2015). Flame Retardant Finishing for Textiles. In P.
M. Visakh & Y. Arao (Eds.), Flame Retardants (pp. 209-246): Springer International Publishing.
SGL Group The Carbon Company. PANOX Thermally Stabilized Textile Fibber. Retrieved from
https://www.sglgroup.com/cms/international/products/product-groups/cf/oxidized-
fiber/index.html?__locale=en
Shayed, M. A., Cherif, C., Hund, R. D., Cheng, T., & Osterod, F. (2010). Carbon and glass fibers
modified by polysilazane based thermal resistant coating. Textile Research Journal, 80(11), 1118
- 1128. doi:10.1177/0040517509357648

Page 50 of 99
Shayed, M. A., Hund, R. D., & Cherif, C. (2012). Polysilazane-based heat- and oxidation-resistant
coatings on carbon fibers. Journal of Applied Polymer Science, 124(3), 2022-2029.
doi:10.1002/app.35228
Sigrafil Short Carbon Fibers. (2016). Retrieved from
https://www.sglgroup.com/cms/_common/downloads/products/product-groups/cf/short-carbon-
fibers/SIGRAFIL_Short_Carbon_Fibers_e.pdf
Society of Fire Protection Engineers. (2008). The Cone Calorimeter Handbook of Fire Protection
Engineering (4th Edition ed.).
Technical Datasheet Pyron Continuous Tow. Retrieved from http://zoltek.com/wp-
content/uploads/2011/07/Pyron-Continuious-Tow1.pdf
Technical Guide for NOMEX Brand Fiber. (2001). Retrieved from
http://www.nakedwhiz.com/gasketsafety/nomextechnicalguide.pdf
TenCate Kombat Flex. (2014). Retrieved from http://tencatefrfabrics.com/wp-
content/uploads/2014/05/Data-Sheet-Kombat-Flex1.pdf
TenCate Ultra. (2014). Retrieved from http://tencatefrfabrics.com/wp-content/uploads/2013/07/Data-
Sheet-Ultra1.pdf
The National Institute for Occupational Safety and Health (NIOSH). (2016). Report F2014-09:
Lieutenant and Fire Fighter Die and 13 Fire Fighters injured in a Wind-driven Fire in a
Brownstone - Massachusetts. (F2014-09). Retrieved from
http://www.cdc.gov/niosh/fire/pdfs/face201409.pdf.
The Toughest Outer Shell Available in TenCate Millenia XT. (2016). Retrieved from
http://tencatefrfabrics.com/fire-service/firefighter-outer-shells/millenia-xt/
Tracton, A. A. (2006). Coatings Technology Handbook.
Twaron - a versatile high-performance fiber. (2012). Retrieved from http://www.teijinaramid.com/wp-
content/uploads/2012/02/1090308_Twaron-productbrochurefinal_051.pdf
University of Massachusetts; Patent Issued for Deoxybenzoin-Derived Anti-Flammable Polymers
(USPTO 9175131). (2015). Chemicals & Chemistry, 5003. Urea; Studies in the Area of Urea Reported from Technical University (Synergistic effects occurring
between water glasses and urea/ammonium dihydrogen phosphate pair for enhancing the flame
retardancy of cotton). (2015). Chemicals & Chemistry, 2488. Arselon Withstanding Fiber. (2016).
Retrieved from http://www.arselon.by/eng/produc/
Wool. (2016). Retrieved from http://www.matbase.com/material-categories/natural-and-synthetic-
polymers/polymer-fibers/animal-fibers/material-properties-of-wool.html#general

Page 51 of 99
Worcester Polytechnic Institute. (2015). WPI Fire Science Laboratory. Retrieved from
https://www.wpi.edu/academics/fpe/firescience.html

Page 52 of 99
Appendices
The following appendices provide additional details regarding materials under consideration,
temperature profiles obtained during testing, and resulting data tables.
Appendix A: Material Properties and Company Information
This Appendix contains all material property data used to determine which materials would be
tested in this research project. The company for each material is also identified.
Table 12: Material Properties for Use in Narrowing Down Materials List
Material Tensile
Strength/Tenacity
Elastic Modulus
Elongation (at break)
Density/weight
Thermal Conductivity
Melting Point
Decomposition Temperature
Nylon 6,6 90 MPa 3450 MPa >40% 1.14 g/cm3 0.28 W/mK 255 C 254 C
Polyester 23.6 MPa 478 MPa 436% 1.15 g/cm3 0.162 W/mK 195 C 256 C
Apyeil Armatex SBN 13-
602 Robotex
100x50 lbs/in
11454x6917 (no units given)
90x73% (warp x weft)
441 g/m2
Arselon 45 cN/tex 10-15% none 500 C
Basofil 2.0-2.3 g/den 15-18% 1.4
g/cm3 0.028 W/mK none Celiox Fenilon
Gladiator
Grafil O 308 ksi x
10 ksi (0x90)
19.89 msi x 1.35 msi
1.80 g/cm3
Kermel 650 N 250 cN/tex 35% low >450 C
Kevlar 2920 MPa 70500 MPa 3.60% 1.44 g/cm3 0.04 W/mK none 427-482 C
Kombat Flex ~1200 N
235 g/m2
Kovenex Kynol
Novoloid 15 cN/tex 3500 N/mm2 10-60%
0.0002 W/mK none gradual/time
Lenzing FR

Page 53 of 99
M5 Fiber Millenia
XT ~2500 N 235
g/m2
Nextel 1700 MPa 150000MPa low 2.70 g/cm3 ~0.11 W/mC 1800 C
Nomex 5 g/den 94 g/den. 30.50% 1.38 g/cm3 0.25 W/mK
none (also no
drip)
Nytox P84 Aramid 650 N "low" 30% 1.41
g/cm3 0.001 W/mK none 450 C
Panox 220 MPa 22% 1.39 g/cm3 low none
PBI Fiber 2.4 dN/tex (320 MPa)
40 dN/tex (5100 MPa) 27% 1.4
g/cm3 0.038 W/mK none >700 C
Protex none Pyromex 1.6
cN/dtex 15% 1.41 g/cm3 none
Pyron 240-300 MPa 22-28% 1.37
g/cm3 none
Sigrafil O 4000 MPa 240000 MPa 1.70% 1.80 g/cm3
Technora 3400 MPa 74000 MPa 4.50% 1.39 g/cm3 none 500 C
Teijinconex 620-690 MPa -- 35-45% 1.38
g/cm3 none 400 C
Twaron 2400-3600 MPa
60000-120000 MPa 2.2-4.4%
1.44-1.45
g/cm3 none 500 C
Ultra 1300-1900 N
255 g/m2
Wool 125-200 MPa 20-40% 570 C
Zylon AS (as spun) 5800 MPa 180000 MPa 3.5% 1.54
g/cm3 650 C
Zylon HM (high
modulus) 5800 MPa 270000 MPa 2.5% 1.56
g/cm3 650 C

Page 54 of 99
Material
Short Term Max
Service Temp
Long Term Max
Service Temp
Abrasion Resistance
Moisture Regain Additional Notes Uses
Nylon 6,6 180C 80-95 C yes 4%
Polyester -- 89.1 C some resistance 0.40% Average values used
Apyeil
Armatex SBN 13-602
Robotex
260 C (fabric) 232 C
(coating)
good
high temperature resistant, high
strength, chemical resistant
applications for welding, kiln seals,
expansion joints
Arselon 400 C 250 C
wear resistant,
non-abrasive
not mentioned
stable under cyclic load and static load,
high chemical resistance, low
shrinkage under high temperatures, high
electrical resistance, some strength
decrease in presence of water,
polyoxadiazole fibers, easy to
produce
special protective clothing, occupational
safety and rescue equipment, aircraft and motor vehicle
interiors, high temperature filter cloths, electrical insulation, brake
composites
Basofil 260-370 C 190 C not
mentioned 5%
advances technology melamine fiber,
blends with commodity fibers/high
temperature fibers, competitively priced,
low thermal conductivity
filtration, bedding, protective apparel
Celiox Fenilon
Gladiator Grafil O
carbon fiber, PAN based, high strength tape production
Kermel 240 C 220 C very good not mentioned
1.1-2.2 dtex, 80-120 mm diameter,
chemical resistance, polyimide-amide
firefighter garments, industrial work wear

Page 55 of 99
fibers, flexible
Kevlar not given
149-177 C
not mentioned
4-8% (good resistance)
Lightweight, cut-resistant
ballistics and stab resistant body armor
Kombat Flex
2500 cycles -
good <2%
good flame resistance,
lightweight, flexible, abrasion resistant, blend of PBI and
Kevlar
Kovenex water
repellant
heat-resistant, flame-resistant, tear-proof, certified by NFPA as
thermal barrier for firefighting gloves
gloves and shirts PPE, home and office furnishings, outdoor
equipment
Kynol Novoloid 1000 C 150 C not
mentioned <6%
high flexibility and workability (low
modulus) , high flame and chemical
resistance, crosslinked phenolic
resin, thermoset, developed in the US,
produced in Japan
fire blankets, flame barriers, protective
curtains, seat linings, shoe soles
Lenzing FR
cellulose fiber produced from
beechwood, protects from fires, radiant heat, electric arcs,
molten metals, flash fires
protective clothing
M5 Fiber
Millenia XT
2500 cylces -
good <1%
good flame resistance, durable, abrasion resistant,
para-aramid & PBO combination

Page 56 of 99
Nextel 1204 C some resistance
absorb very little
moisture
low shriknage at high temperatures, good chemical ersistance,
low thermal conductivity, thermal
shock resistance, ceramic oxide fibers
Nomex
fire fighter gear is good for
many years
204 C good 4% (good
resistance to moisture)
chemical resistance for many chemicals,
not good with prolonged exposure
to sunlight, lightwieght, heat resistant, flame
resistant
firefighter, military personnel, police
officers, auto racing teams, industrial
workers PPE
Nytox
Thermo-oxidized PAN, fire resistant, chemically stable,
inexpensive, withstands open fire
protective clothing
P84 Aramid 260 C not
mentioned 3%
stable with most organic solvents, sensitive to strong
oxidizers, composed of aromatic backbone units only, polyimide based, fibers meet the requirements for all
common textile processing steps
filtration, protective clothing, sealing
materials for space craft, heat insulation
Panox 1000 C not
mentioned 10%
Oxidized thermally stabilized polyacrylic nitrile (PAN) fiber, does not burn, melt,
soften, or drip, chemically resistant,
good electrical insulator
protective clothing, spark protection, fire
blocking fabrics, flame retardant
mattresses, car disk brake pads
PBI Fiber not
mentioned 15% fire resistant firefighter jackets and PPE
Protex
mixes with other fibers like cotton,
rayon, polyester, self-extinguishes
protective clothing, bedding, upholstery, drapery, carpet, faux
fur, plush toys

Page 57 of 99
Pyromex 16%
oxidized PAN fiber, non-flammable, non-
melting, heat, chemical resistant,
good electrical insulator
protective clothing, fire-proof ceilings, nozzle sealing, heat insulation, auto/aero
heat protection
Pyron not
mentioned
oxidized PAN fiber, does not burn, melt or drip, chars and self-
extinguishes
aircraft brakes
Sigrafil O electrically conductive
Technora not
mentioned 1.90%
para-aramid fiber made from
copolymers, good fatigue resistance,
long term dimensional stability,
resistance to corrosion, heat, chemicals, and
seawater
Teijinconex yes 5-5.5%
meta-linked aromatic polyamide fiber, does
not stick to skin, strong, light, soft, self-lubricating
clothing, filters, copy cleaners, hoses
Twaron not
mentioned 3.2-5%
some problems in sunlight, water blocking/other special finishes available, high strength, high modulus, high
dimensional stability, heat, cut and
chemical resistant, nonconductive
Ultra
5000 cycles -
good <1%
good flame resistance, Kevlar blend, competitive
cost, abrasion resistance, thermal
stability, good strength

Page 58 of 99
Wool 400 C 16-18%
good electricity insulator, poor
resistance against bases
Zylon AS (as spun)
much lower than
nylon, polyester
2%
strength decreases with exposure to light, chemical resistant, flame resistant, heat
resistant, flame resistant, 2 types of
woven fabrics: filament and spun
yarn
firefighting garments, safety gloves, heat resistant garments, sports equipment, cable coverings, speaker cones
Zylon HM (high
modulus)
much lower than
nylon, polyester
0.60%
strength decreases with exposure to light, chemical resistant, flame resistant, heat
resistant, flame resistant, 2 types of
woven fabrics: filament and spun
yarn
firefighting garments, safety gloves, heat resistant garments, sports equipment, cable coverings, speaker cones

Page 59 of 99
Table 13: Materials and Companies
Material Company Apyeil Unitika
Armatex SBN 13-602 Robotex Mid-Mountains Materials, Inc.
Arselon Heat Resistant Articles Production Co. (Russia)
Basofil Basofil Celiox Celanese Fenilon - USSR
Gladiator Grafil O Mitsubishi Rayon Carbon Fiber & Composites Kermel Kermel Kevlar DuPont USA
Kombat Flex TenCate Kovenex Waubridge Specialty Fabrics
Kynol Novoloid Kynol - Germany Lenzing FR Lenzing Group
M5 Fiber Millenia XT TenCate
Nextel 3M Ceramic Textiles and Composites Nomex DuPont USA Nytox NPTs Uvikom - Russia
P84 Aramid Evonik Industries - Germany Panox SGL Group: The Carbon Company
PBI Fiber PBI Performance Products, Inc. Protex Kaneka Corporation- Osaka, Japan
Pyromex Toho Tenax America, Inc. Pyron Zoltek
Sigrafil O SGL Group: The Carbon Company Technora Teijin
Teijinconex Teijin Twaron Teijin
Ultra TenCate Wool Zylon AS (as spun) Toyobo
Zylon HM (high modulus) Toyobo

Page 60 of 99
Appendix B: The Cone Calorimeter
The cone calorimeter was the main testing apparatus the team used to analyze the potential materials
for use in a next generation fire attack hose. The following sections provide information on this apparatus
including its history and uses, design, and standards for operation.
History and Uses
The cone calorimeter was first developed after the importance of a reliable bench scale test
method for heat release rate (HRR) was realized in the late 1970s and early 1980s. Several devices were
already in existence at that time to try to measure HRR but had two main problems. These devices were
often difficult to operate or install and had significant errors associated with their measurements. They did
not accurately reflect the conditions of the fireground in testing. The cone calorimeter was first announced
in a 1982 National Bureau of Standards (NBS) report.
The cone calorimeter is based on the oxygen consumption principle which was just discovered as
the cone calorimeter was being developed. The basic principle has not changed since but there have been
many additions and improvements to the design. The modern cone calorimeter barely contains any parts
identical to the original apparatus. Two of the most important additions to the apparatus have been the
ability to measure smoke optically and to measure soot yield gravimetrically. These additions were first
reported in 1987. The cone calorimeter has revolutionized fire testing and is considered to be a good
representation of actual fire conditions.
The earliest application of the cone calorimeter was in the polymer industry where it replaced a
simple Bunsen burner test. From there, the applications of the cone calorimeter have grown to include
providing data for cutting edge fire models, providing data for predicting real-scale fire behavior, rank
ordering materials according to their performance, and pass/fail testing products to a specific criterion
level. The main users of the cone calorimeter include manufacturers, government laboratories,
independent testing laboratories, and universities. As the cone calorimeter continues to grow and develop,
its uses will become even more widespread.
Design
The cone calorimeter has a very unique design which allows it to accurately simulate fireground
conditions. It is designed to operate using only oxygen consumption as its measurement principle.
Although manufacturers may use different measuring schemes, they all rely on the basic principle of a
sensing element that is sensitive to the partial pressure of oxygen in the cell. Additional gas analyzers
other than oxygen may be present as well to provide more extensive data. The cone calorimeter can

Page 61 of 99
achieve high irradiance with an immeasurably small convective heating component, especially when used
in the horizontal orientation. The horizontal sample orientation (where the sample is face up with the
heating element above) is the standard operating orientation. The machine can also be operated with a
vertical sample orientation for special testing. The cone calorimeter is designed for testing in ambient air.
The heating element for the cone calorimeter is an electrical radiant heater. This heater is located
in the cone shaped element of the apparatus. The cone shape was chosen for two reasons. First, this shape
allows for a hole in the middle of the heater to prevent a hot spot from developing in the center of the
sample. Second, it prevents flames from the specimen from splashing onto the heater coil. The radiant
heater is able to produce a uniform heat flux through the sample. Deviations in heat flux over the
thickness of the specimen are small enough that they may be neglected. In addition to the radiant heater, a
spark plug is located 13 mm above the center of the specimen to assist in ignition. The calorimeter also
has a load cell on which the sample is placed to determine mass changes over the course of the test.
Lastly, one important aspect of the cone is the smoke measuring system. It consists of a helium-neon laser
and quasi-dual beam arrangement to take measurements of the smoke.
The specimen for testing in the cone calorimeter has to meet specific requirements. First, it must
have dimensions of 10 cm by 10 cm. In addition it must be between 6 mm and 50 mm thick. Thicknesses
greater than 50 mm are considered thermally thick and are not necessary to test. A substrate should also
be used below samples, especially in the case of thin specimens. Specimens should typically be wrapped
in aluminum foil to limit dripping as the combust. In addition to the aluminum foil, a stainless steel edge
frame is used to prevent ignition at the sample edges and disproportionate burning at the edges. Lastly,
some samples may experience intumescence. Intumescence is the swelling of a material upon heating. A
wire grid can be placed on a specimen to contain the swelling.
Standards
Several standards exist which should be followed to ensure proper use of the cone calorimeter.
The most common of these standards are the Society of Fire Protection Engineers (SFPE) Handbook,
ASTM E1354 - 15a Standard Test Method for Heat and Visible Smoke Release Rates for Materials and
Products Using and Oxygen Consumption Calorimeter, ISO 5660 Reaction-to-fire tests - Heat release,
smoke production, and mass loss rate, and the User’s Guide for the Cone Calorimeter.
The SFPE Handbook provides a detailed explanation of the apparatus along with the reasoning
behind certain design decisions. It also explains the standard specimen design and configuration. The
SFPE Handbook provides a complete explanation of the capabilities of the cone calorimeter while
referencing the other three standards for specific operating procedures.

Page 62 of 99
ASTM E1354 - 15a begins by defining important terminology for understanding the operation of
the cone calorimeter and analyzing the data. It also explains the significance and applications of the test
method. This standard describes the apparatus to be used as well as its hazards. It also provides a detailed
test procedure outlining every step from sample preparation to calibration to the test method. Necessary
calculations and data to be reported are also summarized.
ISO 5660 is very similar to ASTM E1354 and consists of the same sections. The User’s Guide for the
Cone Calorimeter is also very similar to both ISO 5660 and ASTM E1354. This guide is NBS Special
Publication 745. It focuses on the test procedure but places greater emphasis on calibration, maintenance,
and troubleshooting of the cone calorimeter.

Page 63 of 99
Appendix C: Cone Calorimeter Calibration Curve

Page 64 of 99
Appendix D: Step By Step Test Procedure for Candidate Materials
Sample Preparation
1. Gather material to be tested and equipment needed.
2. Ensure equipment is thoroughly cleaned.
3. Using a 10cm X 10cm stencil, cut the material.
4. After cutting, ensure there are no loose ends or fibers that may skew data results.
5. Calibrate the scale using the calibration weights. Weigh the sample.
6. Place four thermocouples on the specimen, two on the top face to the upper right and the bottom
left of the center and two on the bottom face directly below the top thermocouples. Ensure that
the bottom thermocouples will not lift off of the specimen using a small amount of thermally
insulated cement.
7. Wrap material sample with aluminum foil on the bottom and onto the edges of the material
sample to prevent edge burning. Be sure that the shinier side is toward the specimen.
8. Place a retaining grid on top of the sample.
9. Place sample or sample and grid into loading block.
Start Up
1. Log onto computer and open calibration curves and software programs.
2. Turn on cone calorimeter machine.
3. Turn on cooling water flow to the heat flux gauge.
4. Turn on ventilation fan of the cone calorimeter.
5. Set temperature that corresponds to the desired heat flux from the calibration curve. The
calibration curve will be generated weekly to ensure there are no changes in testing conditions.
6. Ensure shutters are closed and igniter is not on.
7. Once the calorimeter has reached an equilibrium state, measure the given heat flux using the heat
flux gauge.

Page 65 of 99
8. Change the temperature of the cone calorimeter if the required heat flux is not set.
9. Repeat steps 7 and 8 as needed.
Testing Procedure
1. Ensure thermocouple data is being read and recorded by the software programs.
2. Place sample block onto load and adjust the height. Ensure 1.3 cm of space will be between the
radiant heat source and igniter. Ensure 1.3 cm of space will be between the sample and igniter.
3. Open the shutters of the cone calorimeter and simultaneously start timer and move igniter into
position.
4. Observe sample material and record the following data.
a. Time to Ignition
b. Percent Mass Loss
5. Repeat testing procedure for heat fluxes of 20, 30, and 40 kW/m2 for each sample material.
6. Each material must be run twice at each heat flux. Ensure data is consistent. If data is not
consistent, repeat the test another two times.
7. Test duration will be 900 seconds for each test
8. After a sample has been tested. Remove the sample and block from the load and place under hood
using tongs. Dissemble sample and sample block and allow to cool under the hood.
9. Reweigh the sample.
10. Repeat procedure for each test.
Shut Down
1. Turn temperature of cone calorimeter down and wait approximately 5 minutes.
2. Turn cone calorimeter heat source off but leave on cooling water flow.
3. After approximately 5 minutes, turn off cone calorimeter completely.
4. Turn off cooling water flow.

Page 66 of 99
Appendix E: Temperature Profiles Obtained During Testing
Temperature profiles for each test are included in this Appendix. For ease of navigation, they are
divided into sections by heat flux. These profiles were intended to be used in conjunction with
decomposition temperature data. The decomposition temperature for each material can be marked on its
respective graph which can then be used to determine the time to decomposition. Time to decomposition
is another parameter useful in determining a material’s ability to withstand a specified heat flux. These
temperature profiles can also be used to determine the maximum temperature each material reached when
exposed to a specified heat flux and the time it took for them to reach this maximum. These graphs are
presented on the following pages. Each of the two trial tests are on the same page.
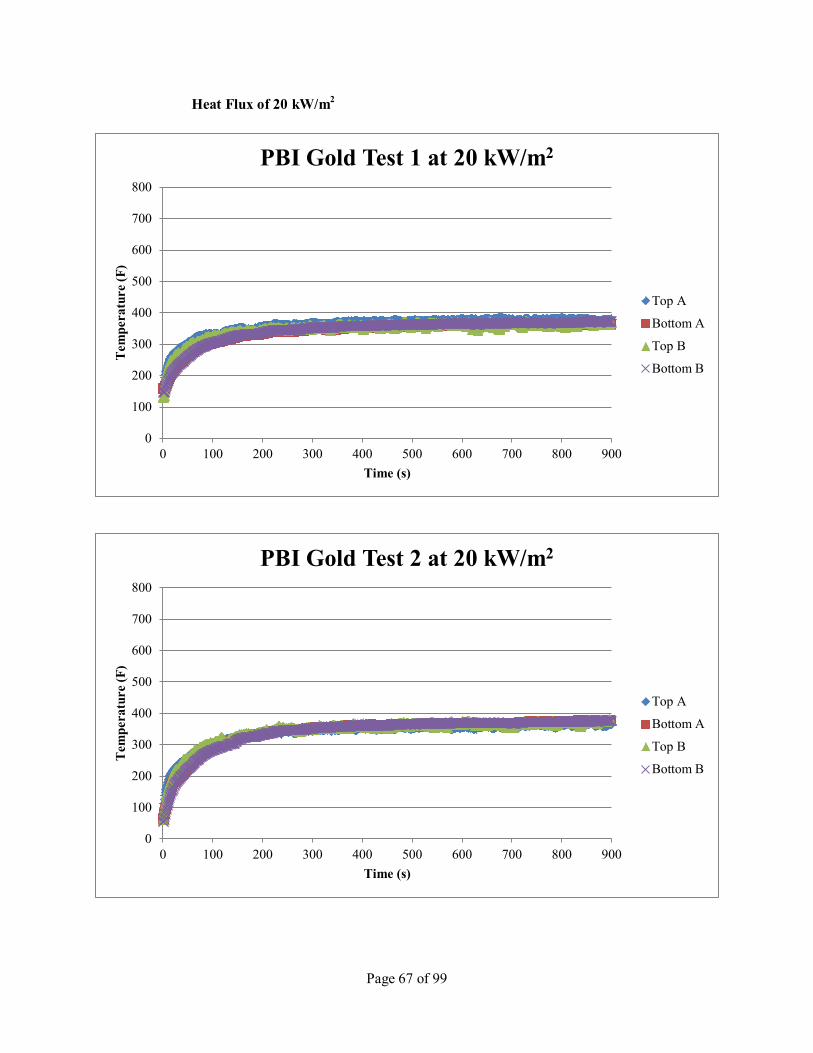
Page 67 of 99
Heat Flux of 20 kW/m2
0
100
200
300
400
500
600
700
800
0 100 200 300 400 500 600 700 800 900
Tem
pera
ture
(F)
Time (s)
PBI Gold Test 1 at 20 kW/m2
Top A
Bottom A
Top B
Bottom B
0
100
200
300
400
500
600
700
800
0 100 200 300 400 500 600 700 800 900
Tem
pera
ture
(F)
Time (s)
PBI Gold Test 2 at 20 kW/m2
Top A
Bottom A
Top B
Bottom B

Page 68 of 99
0
100
200
300
400
500
600
700
800
0 100 200 300 400 500 600 700 800 900
Tem
pera
ture
(F)
Time (s)
PBI Matrix Test 1 at 20 kW/m2
Top A
Bottom A
Top B
Bottom B
0
100
200
300
400
500
600
700
800
0 100 200 300 400 500 600 700 800 900
Tem
pera
ture
(F)
Time (s)
PBI Matrix Test 2 at 20 kW/m2
Top A
Bottom A
Top B
Bottom B

Page 69 of 99
0
100
200
300
400
500
600
700
800
0 100 200 300 400 500 600 700 800 900
Tem
pera
ture
(F)
Time (s)
Twaron Knit Test 1 at 20 kW/m2
Top A
Bottom A
Top B
Bottom B
0
100
200
300
400
500
600
700
800
0 100 200 300 400 500 600 700 800 900
Tem
pera
ture
(F)
Time (s)
Twaron Knit Test 2 at 20 kW/m2
Top A
Bottom A
Top B
Bottom B
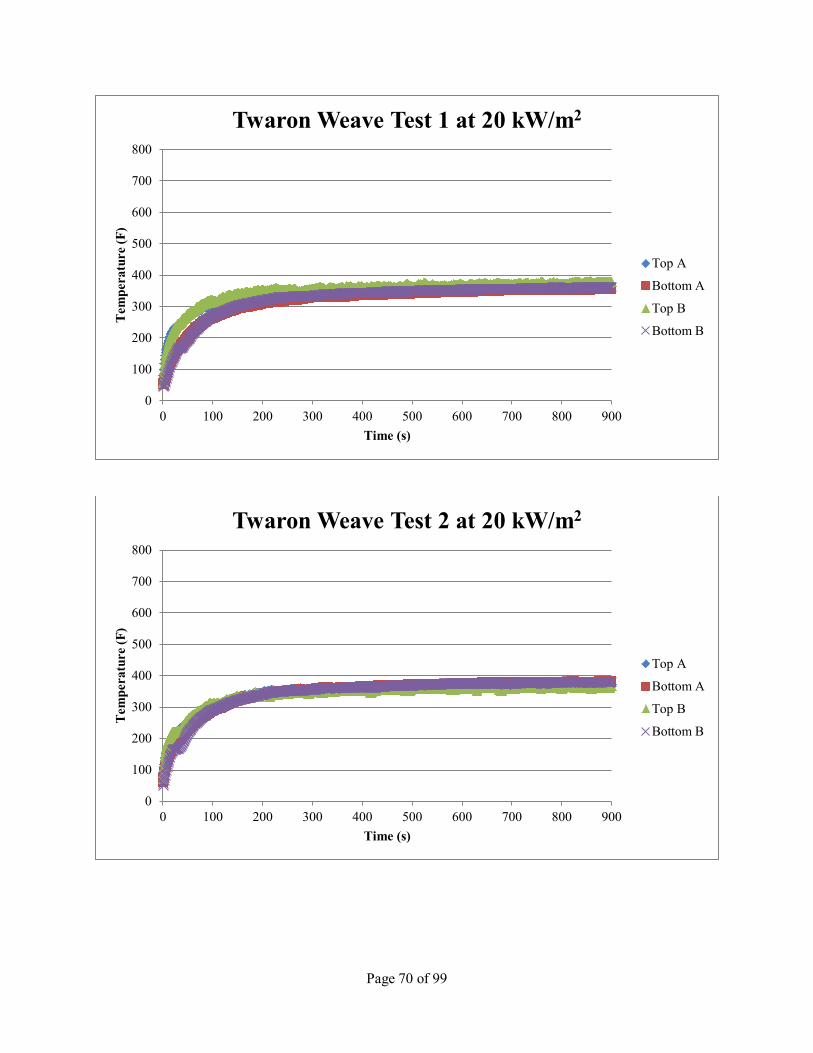
Page 70 of 99
0
100
200
300
400
500
600
700
800
0 100 200 300 400 500 600 700 800 900
Tem
pera
ture
(F)
Time (s)
Twaron Weave Test 1 at 20 kW/m2
Top A
Bottom A
Top B
Bottom B
0
100
200
300
400
500
600
700
800
0 100 200 300 400 500 600 700 800 900
Tem
pera
ture
(F)
Time (s)
Twaron Weave Test 2 at 20 kW/m2
Top A
Bottom A
Top B
Bottom B

Page 71 of 99
0
100
200
300
400
500
600
700
800
0 100 200 300 400 500 600 700 800 900
Tem
pera
ture
(F)
Time (s)
Teijinconex Neo Test 1 at 20 kW/m2
Top A
Bottom A
Top B
Bottom B
0
100
200
300
400
500
600
700
800
0 100 200 300 400 500 600 700 800 900
Tem
pera
ture
(F)
Time (s)
Teijinconex Neo Test 2 at 20 kW/m2
Top A
Bottom A
Top B
Bottom B

Page 72 of 99
0
100
200
300
400
500
600
700
800
0 100 200 300 400 500 600 700 800 900
Tem
pera
ture
(F)
Time (s)
Kovenex Test 1 at 20 kW/m2
Top A
Bottom A
Top B
Bottom B
0
100
200
300
400
500
600
700
800
0 100 200 300 400 500 600 700 800 900
Tem
pera
ture
(F)
Time (s)
Kovenex Test 2 at 20 kW/m2
Top A
Bottom A
Top B
Bottom B

Page 73 of 99
0
100
200
300
400
500
600
700
800
0 100 200 300 400 500 600 700 800 900
Tem
pera
ture
(F)
Time (s)
Pyron Fabric Test 1 at 20 kW/m2
Top A
Bottom A
Top B
Bottom B
0
100
200
300
400
500
600
700
800
0 100 200 300 400 500 600 700 800 900
Tem
pera
ture
(F)
Time (s)
Pyron Fabric Test 2 at 20 kW/m2
Top A
Bottom A
Top B
Bottom B

Page 74 of 99
0
100
200
300
400
500
600
700
800
0 100 200 300 400 500 600 700 800 900
Tem
pera
ture
(F)
Time (s)
Pyron Felt Test 1 at 20 kW/m2
Top A
Bottom A
Top B
Bottom B
0
100
200
300
400
500
600
700
800
0 100 200 300 400 500 600 700 800 900
Tem
pera
ture
(F)
Time (s)
Pyron Felt Test 2 at 20 kW/m2
Top A
Bottom A
Top B
Bottom B

Page 75 of 99
0
100
200
300
400
500
600
700
800
0 100 200 300 400 500 600 700 800 900
Tem
pera
ture
(F)
Time (s)
Pavenex Test 1 at 20 kW/m2
Top A
Bottom A
Top B
Bottom B
0
100
200
300
400
500
600
700
800
0 100 200 300 400 500 600 700 800 900
Tem
pera
ture
(F)
Time (s)
Pavenex Test 2 at 20 kW/m2
Top A
Bottom A
Top B
Bottom B

Page 76 of 99
Heat Flux of 30 kW/m2
0
100
200
300
400
500
600
700
800
0 100 200 300 400 500 600 700 800 900
Tem
pera
ture
(F)
Time (s)
Pyromex Test 1 at 20 kW/m2
Top A
Bottom A
Top B
Bottom B
0
100
200
300
400
500
600
700
800
0 100 200 300 400 500 600 700 800 900
Tem
pera
ture
(F)
Time (s)
Pyromex Test 2 at 20 kW/m2
Top A
Bottom A
Top B
Bottom B

Page 77 of 99
0
100
200
300
400
500
600
700
800
0 100 200 300 400 500 600 700 800 900
Tem
pera
ure
(F)
Time (s)
PBI Gold Test 1 at 30 kW/m2
Top A
Bottom A
Top B
Bottom B
0
100
200
300
400
500
600
700
800
0 100 200 300 400 500 600 700 800 900
Tem
pera
ture
(F)
Time (s)
PBI Gold Test 2 at 30 kW/m2
Top A
Bottom A
Top B
Bottom B

Page 78 of 99
0
100
200
300
400
500
600
700
800
0 100 200 300 400 500 600 700 800 900
Tem
pera
ture
(F)
Time (s)
PBI Matrix Test 1 at 30 kW/m2
Top A
Bottom A
Top B
Bottom B
0
100
200
300
400
500
600
700
800
0 100 200 300 400 500 600 700 800 900
Tem
pera
ture
(F)
Time (s)
PBI Matrix Test 2 at 30 kW/m2
Top A
Bottom A
Top B
Bottom B

Page 79 of 99
0
100
200
300
400
500
600
700
800
0 100 200 300 400 500 600 700 800 900
Tem
pera
ture
(F)
Time (s)
Twaron Knit Test 1 at 30 kW/m2
Bottom A
Top B
Bottom B
0
100
200
300
400
500
600
700
800
0 100 200 300 400 500 600 700 800 900
Tem
pera
ture
(F)
Time (s)
Twaron Knit Test 2 at 30 kW/m2
Bottom A
Top B
Bottom B

Page 80 of 99
0
100
200
300
400
500
600
700
800
0 100 200 300 400 500 600 700 800 900
Tem
pera
ture
(F)
Time (s)
Twaron Weave Test 1 at 30 kW/m2
Top A
Bottom A
Top B
Bottom B
0
100
200
300
400
500
600
700
800
0 100 200 300 400 500 600 700 800 900
Tem
pera
ture
(F)
Time (s)
Twaron Weave Test 2 at 30 kW/m2
Top A
Bottom A
Top B

Page 81 of 99
0
100
200
300
400
500
600
700
800
0 100 200 300 400 500 600 700 800 900
Tem
pera
ture
(F)
Time (s)
Teijinconex Neo Test 1 at 30 kW/m2
Top A
Bottom A
Top B
Bottom B
0
100
200
300
400
500
600
700
800
0 100 200 300 400 500 600 700 800 900
Tem
pera
ture
(F)
Time (s)
Teijinconex Neo Test 2 at 30 kW/m2
Top A
Bottom A
Top B
Bottom B

Page 82 of 99
0
100
200
300
400
500
600
700
800
0 100 200 300 400 500 600 700 800 900
Tem
pera
ture
(F)
Time (s)
Kovenex Test 1 at 30 kW/m2
Top A
Bottom A
Top B
Bottom B
0
100
200
300
400
500
600
700
800
0 100 200 300 400 500 600 700 800 900
Tem
pera
ture
(F)
Time (s)
Kovenex Test 2 at 30 kW/m2
Top A
Bottom A
Top B
Bottom B
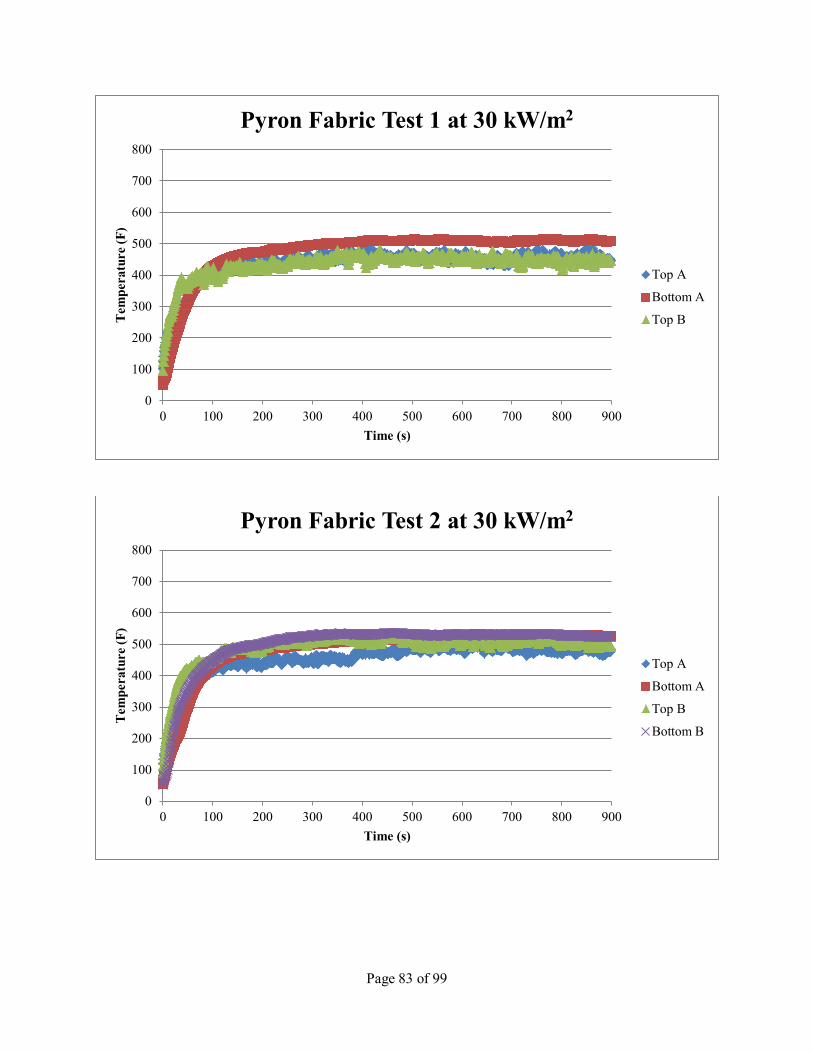
Page 83 of 99
0
100
200
300
400
500
600
700
800
0 100 200 300 400 500 600 700 800 900
Tem
pera
ture
(F)
Time (s)
Pyron Fabric Test 1 at 30 kW/m2
Top A
Bottom A
Top B
0
100
200
300
400
500
600
700
800
0 100 200 300 400 500 600 700 800 900
Tem
pera
ture
(F)
Time (s)
Pyron Fabric Test 2 at 30 kW/m2
Top A
Bottom A
Top B
Bottom B

Page 84 of 99
0
100
200
300
400
500
600
700
800
0 100 200 300 400 500 600 700 800 900
Tem
pera
ture
(F)
Time (s)
Pyron Felt Test 1 at 30 kW/m2
Top A
Bottom A
Top B
Bottom B
0
100
200
300
400
500
600
700
800
0 100 200 300 400 500 600 700 800 900
Tem
pera
ture
(F)
Time (s)
Pyron Felt Test 2 at 30 kW/m2
Top A
Bottom A
Top B
Bottom B

Page 85 of 99
0
100
200
300
400
500
600
700
800
0 100 200 300 400 500 600 700 800 900
Tem
pera
ture
(F)
Time (s)
Pavenex Test 1 at 30 kW/m2
Top A
Bottom A
Top B
Bottom B
0
100
200
300
400
500
600
700
800
0 100 200 300 400 500 600 700 800 900
Tem
pera
ture
(F)
Time (s)
Pavenex Test 2 at 30 kW/m2
Top A
Bottom A
Top B
Bottom B

Page 86 of 99
0
100
200
300
400
500
600
700
800
0 100 200 300 400 500 600 700 800 900
Tem
pera
ture
(F)
Time (s)
Pyromex Test 1 at 30 kW/m2
Top A
Bottom A
Top B
Bottom B
0
100
200
300
400
500
600
700
800
0 100 200 300 400 500 600 700 800 900
Tem
pera
ture
(F)
Time (s)
Pyromex Test 2 at 30 kW/m2
Top A
Bottom A
Top B
Bottom B
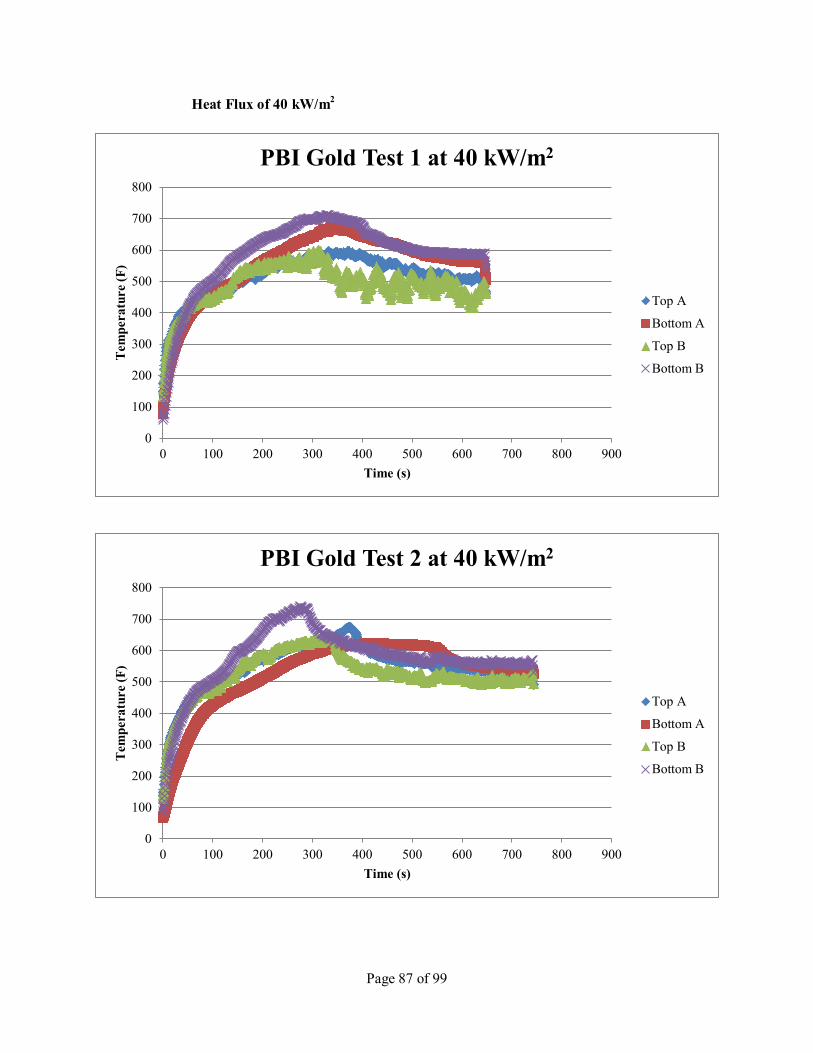
Page 87 of 99
Heat Flux of 40 kW/m2
0
100
200
300
400
500
600
700
800
0 100 200 300 400 500 600 700 800 900
Tem
pera
ture
(F)
Time (s)
PBI Gold Test 1 at 40 kW/m2
Top A
Bottom A
Top B
Bottom B
0
100
200
300
400
500
600
700
800
0 100 200 300 400 500 600 700 800 900
Tem
pera
ture
(F)
Time (s)
PBI Gold Test 2 at 40 kW/m2
Top A
Bottom A
Top B
Bottom B

Page 88 of 99
0
100
200
300
400
500
600
700
800
0 100 200 300 400 500 600 700 800 900
Tem
pera
ture
(F)
Time (s)
PBI Matrix Test 1 at 40 kW/m2
Bottom A
Top B
Bottom B
0
100
200
300
400
500
600
700
800
0 100 200 300 400 500 600 700 800 900
Tem
pera
ture
(F)
Time (s)
PBI Matrix Test 2 at 40 kW/m2
Top A
Bottom A
Top B
Bottom B

Page 89 of 99
0
100
200
300
400
500
600
700
800
0 100 200 300 400 500 600 700 800 900
Tem
pera
ture
(F)
Time (s)
Twaron Knit Test 1 at 40 kW/m2
Top A
Bottom A
Top B
Bottom B
0
100
200
300
400
500
600
700
800
0 100 200 300 400 500 600 700 800 900
Tem
pera
ture
(F)
Time (s)
Twaron Knit Test 2 at 40 kW/m2
Top A
Bottom A
Top B
Bottom B

Page 90 of 99
0
100
200
300
400
500
600
700
800
0 100 200 300 400 500 600 700 800 900
Tem
pera
ture
(F)
Time (s)
Twaron Weave Test 1 at 40 kW/m2
Top A
Bottom A
Top B
Bottom B
0
100
200
300
400
500
600
700
800
0 100 200 300 400 500 600 700 800 900
Tem
pera
ture
(F)
Time (s)
Twaron Weave Test 2 at 40 kW/m2
Top A
Bottom A
Top B
Bottom B

Page 91 of 99
0
100
200
300
400
500
600
700
800
0 100 200 300 400 500 600 700 800 900
Tem
pera
ture
(F)
Time (s)
Teijinconex Neo Test 1 at 40 kW/m2
Top A
Bottom A
Top B
Bottom B
0
100
200
300
400
500
600
700
800
0 100 200 300 400 500 600 700 800 900
Tem
pera
ture
(F)
Time (s)
Teijinconex Neo Test 2 at 40 kW/m2
Top A
Bottom A
Top B
Bottom B

Page 92 of 99
0
100
200
300
400
500
600
700
800
0 100 200 300 400 500 600 700 800 900
Tem
pera
ture
(F)
Time (s)
Kovenex Test 1 at 40 kW/m2
Top A
Bottom A
Top B
Bottom B
0
100
200
300
400
500
600
700
800
0 100 200 300 400 500 600 700 800 900
Tem
pera
ture
(F)
Time (s)
Kovenex Test 2 at 40 kW/m2
Top A
Bottom A
Top B
Bottom B

Page 93 of 99
0
100
200
300
400
500
600
700
800
0 100 200 300 400 500 600 700 800 900
Tem
pera
ture
(F)
Time (s)
Pyron Fabric Test 1 at 40 kW/m2
Top A
Bottom A
Top B
Bottom B
0
100
200
300
400
500
600
700
800
0 100 200 300 400 500 600 700 800 900
Tem
pera
ture
(F)
Time (s)
Pyron Fabric Test 2 at 40 kW/m2
Top A
Bottom A
Top B
Bottom B

Page 94 of 99
0
100
200
300
400
500
600
700
800
0 100 200 300 400 500 600 700 800 900
Tem
pera
ture
(F)
Time (s)
Pyron Felt Test 1 at 40 kW/m2
Top A
Bottom A
Top B
Bottom B
0
100
200
300
400
500
600
700
800
0 100 200 300 400 500 600 700 800 900
Tem
pera
ture
(F)
Time (s)
Pyron Felt Test 2 at 40 kW/m2
Top A
Bottom A
Top B
Bottom B

Page 95 of 99
0
100
200
300
400
500
600
700
800
0 100 200 300 400 500 600 700 800 900
Tem
pera
ture
(F)
Time (s)
Pavenex Test 1 at 40 kW/m2
Top A
Bottom A
Top B
Bottom B
0
100
200
300
400
500
600
700
800
0 100 200 300 400 500 600 700 800 900
Tem
pera
ture
(F)
Time (s)
Pavenex Test 2 at 40 kW/m2
Top A
Bottom A
Top B
Bottom B

Page 96 of 99
0
100
200
300
400
500
600
700
800
0 100 200 300 400 500 600 700 800 900
Tem
pera
ture
(F)
Time (s)
Pyromex Test 1 at 40 kW/m2
Top A
Bottom A
Top B
Bottom B
0
100
200
300
400
500
600
700
800
0 100 200 300 400 500 600 700 800 900
Tem
pera
ture
(F)
Time (s)
Pyromex Test 2 at 40 kW/m2
Top A
Bottom A
Top B
Bottom B

Page 97 of 99
Appendix F: Average Percent Mass Loss, Average Ignition Time, and Standard
Deviation
This Appendix contains all data points recorded along with averages and standard deviations.
Table 14: Average Percent Mass Loss at 20 kW/m2
Material
20 kW/m2
Percent Mass Loss
Test 1 Test 2 Average St. Dev.
PBI Gold 8.03 8.47 8.25 0.31
PBI Matrix 5.10 5.67 5.38 0.40
Twaron Knit 1.44 1.51 1.47 0.05
Twaron Woven 2.12 3.11 2.62 0.70
Teijinconex 7.19 7.45 7.32 0.19
Kovenex 27.01 28.03 27.52 0.72
Pyron Fabric 18.23 17.71 17.97 0.37
Pyron Felt 16.97 16.70 16.83 0.19
Pyromex 11.96 12.84 12.40 0.63
Pavenex 16.94 17.53 17.24 0.41

Page 98 of 99
Table 15: Average Percent Mass Loss and Ignition Time at 30 kW/m2
Material
30 kW/m2
Percent Mass Loss Time to Ignition
Test 1 Test 2 Average St. Dev. Test 1 Test 2 Average St. Dev.
PBI Gold 18.36 40.25 29.30 15.48 None None None None
PBI Matrix 32.68 20.55 26.62 8.58 None None None None
Twaron Knit 30.60 26.98 28.79 2.56 547 537 542 7.07
Twaron Woven 46.15 62.46 54.30 11.53 519 556 538 26.16
Teijinconex 45.35 37.35 41.35 5.66 None None None None
Kovenex 53.90 59.64 56.77 4.06 840 790 815 35.36
Pyron Fabric 37.36 39.94 38.65 1.83 None None None None
Pyron Felt 33.14 34.55 33.84 1.00 None None None None
Pyromex 38.20 37.33 37.76 0.62 None None None None
Pavenex 35.45 33.33 34.39 1.50 None None None None

Page 99 of 99
Table 16: Average Percent Mass Loss and Ignition Time at 40 kW/m2
Material
40 kW/m2
Percent Mass Loss Time to Ignition
Test 1 Test 2 Average St. Dev. Test 1 Test 2 Average St. Dev.
PBI Gold 78.74 87.08 82.91 5.90 127 145 136 12.73
PBI Matrix 90.28 87.35 88.82 2.08 153 146 150 4.95
Twaron Knit 82.38 77.46 79.92 3.48 122 130 126 5.66
Twaron Woven 95.61 92.93 94.27 1.89 163 135 149 19.80
Teijinconex 93.87 84.94 89.40 6.31 None None None None
Kovenex 93.52 89.33 91.43 2.97 54 42 48 8.49
Pyron Fabric 75.79 80.00 77.90 2.98 20 21 21 0.71
Pyron Felt 60.55 69.81 65.18 6.55 None None None None
Pyromex 68.77 66.67 67.72 1.49 None None None None
Pavenex 64.84 65.23 65.03 0.28 None None None None