firm size’s impact on organizational learning: a case
TRANSCRIPT

FIRM SIZE’S IMPACT ON ORGANIZATIONAL LEARNING: A CASE STUDY OF WASTE AND PRODUCTION EFFICIENCY IN PENNSYLVANIA’S OIL
AND GAS INDUSTRY
Tara Christine Nath
An honors thesis submitted to the faculty of the Kenan-Flagler Business School at the University of North Carolina at Chapel Hill
Chapel Hill
2019
Approved by:
________________________
(Dr. Kristin Wilson)
brought to you by COREView metadata, citation and similar papers at core.ac.uk
provided by Carolina Digital Repository

ii
ABSTRACT
Tara Christine Nath
Firm Size’s Impact on Organizational Learning: A Case Study of Waste and Production Efficiency in Pennsylvania’s Oil and Gas Industry
(Under the direction of Dr. Kristin Wilson)
An understanding of organizational learning provides insights into how
companies evolve and remain competitive in an ever-changing environment. Companies
in the Oil Field Services & Equipment (OFSE) sector have to operate under constantly
squeezing profit margins while handling environmental concerns from local communities
where they operate. Companies who are able to learn effectively will likely have greater
financial success in the competitive landscape and bring about less of an environmental
impact, thus satisfying many key stakeholders. My research explores two hypotheses in
the context of Pennsylvania’s oil and gas industry, the second largest natural gas producer
in the United States. First, are large operators are less agile and slower learners due to
size factors like bureaucracy in decision making? Or, second, are small operators less
agile and slower learners because of a lack of economies of scale? This study was
conducted using both multivariate analyses and data charting of raw waste and
production data from 1990 to 2018.
iii
ACKNOWLEDGEMENTS
Several individuals effort and dedication made this thesis possible. From your expertise and breadth of knowledge to your emotional support when I needed it most, thank you for supporting me every step of the way. Dr. Kristin Wilson - thank you for having faith in me throughout this year. Your input and flexibility allowed this paper to take its ultimate form and I could not have done it without you. Dr. Jeremy Moulton - thank you for your patience and willingness to help me learn beyond the scope of the classroom. This data analysis would not have been possible without your guidance. Dr. Olga Hawn - thank you for serving on my committee, providing enriching pieces of prior research, and for making sure I did not go astray with assumptions. Dr. Patricia Harms - thank you for making me realize what I’m capable of and helping me get there. Your genuine thoughtfulness did not go unnoticed. Momma and Daddy - thank you for your endless support and for providing me with every opportunity I have ever dreamed of and more. You are my motivation in all that I do. This is for you.

iv
TABLE OF CONTENTS
ABSTRACT ........................................................................................................................ ii
ACKNOWLEDGEMENTS ............................................................................................... iii
TABLE OF CONTENTS ................................................................................................... iv
LIST OF FIGURES ........................................................................................................... vi
LITERATURE REVIEW ................................................................................................... 1 What is Organizational Learning ........................................................................................ 1
Organizational Learning in the Oil and Gas Industry ......................................................... 2
How Organizational Learning Can Help ............................................................................ 5
Conclusion .......................................................................................................................... 7
METHODOLOGY ........................................................................................................... 10 Selection of the Fracking Industry .................................................................................... 10
Data Selection ................................................................................................................... 14
Data Operationalization .................................................................................................... 15
RESEARCH FINDINGS .................................................................................................. 22 Industry Level Trends Over Time………………………………………………………..22
Industry Level Learning by Quartile................................................................................. 25
Organizational Level Learning by Firm Size.................................................................... 28
DISCUSSION ................................................................................................................... 34 Limitations ........................................................................................................................ 34
Future Research Opportunities ......................................................................................... 35
v
APPENDIX ....................................................................................................................... 37
Appendix A: Final Data Set Variables.............................................................................. 37
Appendix B: Operator Selection Methodology ................................................................ 38
Appendix C: Industry Level Summary Statistics (with outliers) ...................................... 39
Appendix D: Industry Level Summary Statistics (without outliers) ................................ 40
Appendix E: Bottom Quartile Graphs............................................................................... 41
Appendix F: Upper Quartile Graphs ................................................................................. 42
REFERENCES CITED ..................................................................................................... 43
vi
LIST OF FIGURES
Figure 1. Map of shale formations in the northeast. From “Marcellus and Utica Shale
Formation Map,” by Marcellus Shale Coalition, http://marcelluscoalition.org/pa-map/. ................................................................................................................................... 13
Figure 2. Industry level bottom quartile difference in means. .......................................... 23 Figure 3. Industry level upper quartile difference in means ............................................. 24
1
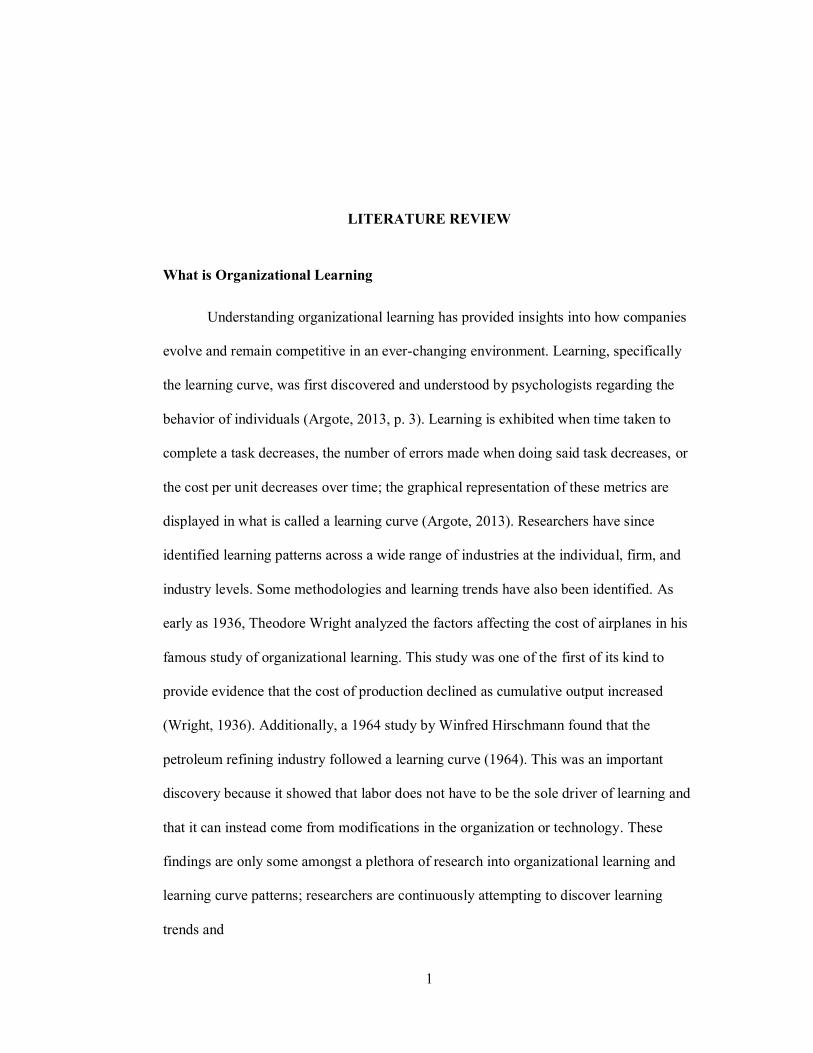
LITERATURE REVIEW
What is Organizational Learning
Understanding organizational learning has provided insights into how companies
evolve and remain competitive in an ever-changing environment. Learning, specifically
the learning curve, was first discovered and understood by psychologists regarding the
behavior of individuals (Argote, 2013, p. 3). Learning is exhibited when time taken to
complete a task decreases, the number of errors made when doing said task decreases, or
the cost per unit decreases over time; the graphical representation of these metrics are
displayed in what is called a learning curve (Argote, 2013). Researchers have since
identified learning patterns across a wide range of industries at the individual, firm, and
industry levels. Some methodologies and learning trends have also been identified. As
early as 1936, Theodore Wright analyzed the factors affecting the cost of airplanes in his
famous study of organizational learning. This study was one of the first of its kind to
provide evidence that the cost of production declined as cumulative output increased
(Wright, 1936). Additionally, a 1964 study by Winfred Hirschmann found that the
petroleum refining industry followed a learning curve (1964). This was an important
discovery because it showed that labor does not have to be the sole driver of learning and
that it can instead come from modifications in the organization or technology. These
findings are only some amongst a plethora of research into organizational learning and
learning curve patterns; researchers are continuously attempting to discover learning
trends and
2
Understanding the determinants of organizational learning and learning curves is
valuable for internal decision makers, policymakers, and investors associated with almost
any industry. Argot points out that internal decision makers can use learning curves and
planning and forecasting tools to make strategic decisions in relation to other firms (2013,
p. 23). She adds that internal uses include creating production schedules, budgeting,
making delivery commitments, and monitoring performance. Externally, uses include
predicting competitor’s costs, how to price products, and whether or not to enter a new
market. Understanding learning curves is also valuable for policymakers as the learning
rate and the ability of firms to transfer knowledge are important considerations for
antitrust and trade policies. Investors can also find value in learning curves as these
graphical representations can give insights into market structure and performance
(Argote, 2013, p, 23).
Organizational Learning in the Oil and Gas Industry
Companies in the Oil Field Services & Equipment (OFSE) sector have to operate
under constantly squeezing profit margins while handling environmental concerns from
local communities where they operate. If any of these companies are able to realize the
benefits of organizational learning, such as improved efficiency, budgeting, and
performance monitoring regarding waste outputs, they will likely have greater financial
success in the competitive landscape and bring about less of an environmental impact,
thus satisfying many key stakeholders.
3
Financial Pressures of the Oil and Gas Industry
OFSE companies must be able to withstand fluctuating oil prices and the
complexities associated with international competition and trade. For example, in 2018, a
year in which Wall Street predicted oil would surpass $100, the market was plagued with
ongoing U.S.-China trade disputes, Iranian sanctions, and disagreements within OPEC
(Organization of Petroleum Exporting Countries). U.S. crude dropped 25% from the
beginning of the year with Brent crude (the international oil benchmark) down 19.5%
(DiChristopher, 2018). Concurrently, an increased fuel economy was leading to lower
gasoline consumption, thus forcing the industry to operate under extremely tight margins
(Ati, Brinkman, Peacock, & Wood, 2016). Given the constant potential for oil price
volatility, it is absolutely vital that OFSE companies cut costs whenever and wherever
possible.
Environmental Pressures of the Oil and Gas Industry and Fracking
Oil and gas well operators’ cost-cutting measures, particularly in the area of waste
disposal, have piqued the concern of environmentalists and citizens alike. These concerns
have resulted in negative publicity, law suits, and increased oversight from regulatory
bodies. Many existing environmental concerns have been compounded by the recent
boom of fracking in the United States. Fracking, derived from the term “hydraulic
fracturing,” is the process of drilling into the land to release and extract the gas inside.
The Independent Petroleum Association of America (n.d.) elaborates that fracking is “the
process of injecting liquid and materials at high pressure to create small fractures within
tight shale formations to stimulate the production and safely extract energy from an
4
underground well…” (para. 1). This unconventional process has transformed the natural
gas industry in terms of increased production quantity. However, the actual fracking
process has caused environmental uproar in geographic areas with active wells
throughout the United States.
One of the main environmental complaints about fracking is the impact it has on
local water sources. Depending on the rock formation, well operator, and well
configuration, among other factors, each fractured well requires between 1.5 and 16
million gallons of water (American Geosciences Institute, 2014). This water is often
extracted from the surrounding area, effectively reducing the amount of clean water
available to local residents. A 2014 article published in the Energy Policy Journal
conducted a public opinion poll and identified a series of externalities that a majority of
Americans had associated with fracking, including strains on water and sewage
infrastructure (Boudet et al., 2014). However, more threatening is the potential for this
waste water to contaminate local water sources. Historically, between 20% and 40% of
frack water returned to the ground is toxically contaminated with waste from the fracking
process. This water, often injected into wastewater injection wells or drained into open
air impoundment pits (frack ponds), has a tendency to leak into local water supplies
(Horton, 2018). While operators have the technology to recycle frack water, disposal
methods currently have lower direct costs.
Growth of the Natural Gas Industry
The economics of the oil and gas industry currently have a positive outlook.
Authors Zajicek, Karagiannis, and Wiljoit (2016) claim that technological development

5
in the United States along with the discovery of new oil and gas resources are shifting
supply dynamics of the energy sector. They claim that this shift can be seen particularly
in shale production where suppliers are looking to increase liquefied gas exports and
decrease imports. Their research determined that between December 2007 and June 2015,
domestic natural gas production increased 186% and domestic oil production increased
342%; both of these increases have been primarily attributed to the fracking boom. While
the share of natural gas growth is expected to decrease from 29% to 27%, given the
extraordinary scale of this energy output measurement, I assume there is still ample
opportunity for growth of US natural gas production and the industry will continue to
prosper.
How Organizational Learning Can Help
Given financial and environmental pressures present in the oil and gas industry,
compounded with tremendous growth potential, this is a good opportunity to study
organizational learning. Through previous studies of organizational learning, it is
apparent that increased efficiency is a common outcome, and one that would greatly
benefit this industry. IPIECA, the global oil and gas industry association responsible for
promoting environmental and social performance, explains how all stakeholders have a
role to play to ensure that energy is produced and used in a clean and efficient manner.
Specifically, the organization reports that improved efficiency has a “central role to play
in reconciling the goals of economic development, energy security and environmental
protection” (IPIECA, 2013, p. 3).

6
Across the industry, well operators are aware of the tremendous business
opportunities and widespread economic benefits associated with fracking and are
financially incentivized, both internally and by investors, to be efficient, cut costs, and
maximize the potential benefits. As BP’s former CEO John Browne stated,
Learning is at the heart of a company’s ability to adapt to a rapidly changing environment. It is the key to being able both to identify opportunities that others might not see and to exploit those opportunities rapidly and fully. This means that in order to generate extraordinary value for shareholders, a company has to learn better than its competitors and apply that knowledge throughout its businesses faster and more widely than they do (Prokesch, 1997).
Browne’s message underlines the essentiality of organizational learning for
financial success in the oil and gas industry. Mr. Browne elaborated that important and
effective types of learning include tracking employee expertise, promoting a learning
culture, collecting and sharing explicit knowledge, and utilizing technological systems to
share captured knowledge (Prokesch, 1997).
Unfortunately, as discussed previously, these financial benefits are currently
accompanied by wasteful processes and potentially negative impacts on local
communities. Across Pennsylvania, well operators face external pressures from
communities to manage waste and frack responsibly. A recent 2018 public opinion study
discovered that residents have a growing concern about the industry. In August 2011,
only 35% of survey respondents believed that the environmental risks of fracking
outweighed its potential economic benefits. As of March 2018, 55% reported that the
potential environmental risks outweighed the potential economic benefits of the fracking
industry in Pennsylvania (Frazier, 2018). This growing concern must be given attention
7
as communities historically have been shown to push back against the industry by
implementing fracking bans, well limits, traffic and road use restrictions, and high impact
fees (Squillace, 2016, p. 554). Each of these pushbacks from local communities would
negatively impact a well’s operation and consequently the company’s bottom line, thus
demonstrating the financial incentive to be efficient and environmentally responsible. By
harnessing the knowledge gained from organizational learning through investment in
methods such as energy efficient technology, benchmarking indices for well
performance, and eliminating unnecessary waste, it is possible to develop greater
community relationships and decrease the risk of negative community pushback
(IPIECA, 2013).
Conclusion
It has been found that learning does not automatically improve with experience
alone, but instead is a function of a wide variety of factors that work together to impact a
firm’s organizational learning rates. Researchers speculate that some of these variables
include individual learning, organizational structure improvements, and more effective
new employees, leadership, and equipment. As Argote states in her book, “for
organizations to compete effectively, we need to understand why some organizations
show rapid rates of learning and others fail to learn. A greater understanding of factors
responsible for the variation observed in organizational learning rates is needed” (2013,
p. 2).

8
One factor that is under-researched in the organizational learning space is the
relationship between firm size and learning. It is widely understood that differences
between small and large firms can be seen in organizational structure and management,
growth and productivity, and innovation (Schiersch, 2013). Firm size can also be
understood as a proxy for operational scope; as a firm’s size increases, their scope also
increases since they have more resources to conduct more business in a more efficient
manner. Schiersch explained that previous empirical research on size-efficiency
relationships yielded ambiguous results with both positive and negative relationships.
Further, a majority of size-efficiency studies are set in developing countries, with a
minority analyzing successful industries in developed countries (2013). At this point, no
known study analyzes size-efficiency or size-learning relationships in the oil and gas
industry.
Given the lack of previous research and knowledge on the impact of increased
operational scope on learning in the oil and gas industry, especially in terms of
environmental responsibility, research is needed to understand whether operational scope
is a driver of organizational learning. This study will analyze whether the size of the
operator, measured by the firm’s average number of wells in operation over the firm’s
total operating period, is a driver of organizational learning (quantified by a waste
efficiency ratio) in the oil and gas industry.
Understanding this differentiation would be valuable for multiple stakeholders.
First, understanding their company’s learning curve will help internal decision makers’
when formulating long-term plans and potentially provide insight into the types of plans
they should make moving forward. Additionally, it could provide an important metric for
9
investors to understand which companies have lean, efficient processes. Moreover, this
information would be valuable for policymakers in the energy sector. An understanding
of organizational learning abilities of operators of different sizes would shed light onto
different firm’s abilities to meet target objectives as well as the potential differential
impacts of regulations.
One hypothesis tested in this study is that larger operators are less agile and
slower learners because it is more challenging for larger companies to have “timely
responses that span organizational, product and geographic boundaries (Harraf,
Wanasika, Tate, & Talbott, 2015, p. 676). Similarly, as size increases, the costs of errors
increases resulting in more risk-averse decision making. As Harraf et al. explain, these
growth factors make agility more challenging and therefore less likely to be incorporated
into organizational processes (2015, p. 676).
On the other hand, another hypothesis to be tested is that smaller operators are
less agile and slower learners because they do not have benefits of economies of scale
(“The keys to organizational agility,” 2015). Similarly, it is possible that they have lesser
capacity for knowledge sharing, given that they have fewer active wells from which to
learn.
Given the lack of existing research on the size-learning relationship and
competing theories behind this relationship, specifically in the oil and gas industry,
research is needed to identify what relationship, if any, exists between operational scope
and organizational learning in this context.
10
METHODOLOGY
Selection of the Fracking Industry
In the 1980s, George Mitchell pioneered fracking for the extraction of shale gas
(Gertner, 2013). Since then, the industry has boomed and continues to have positive
growth prospects. Given the highly politicized rhetoric around the environment, fracking
has also proven to be a frequently debated industry as of late. According to ABI inform,
limited to the search of frack as a root (thus encompassing fracking, fracker, frackers,
etc.), the Wall Street Journal alone published 295 articles in the past two years
(December 6, 2016 to December 6, 2018) that mention fracking. Considering the
relatively new nature of the industry paired with the excitement of contemporary debates,
it is both an interesting time to research this industry and valuable to provide insights into
how it can function more efficiently.
Fracking in Pennsylvania
Pennsylvania was selected as the location for this study due to geographic policy
differences and the scope of the industry across the state. Fracking regulations differ by
geographic area; some states have full fracking bans, some localities have bans or
moratoria, and other areas are currently debating the issue (Hirji & Song, 2015). I opted
to study a single state to control for some of these dramatic policy differences.

11
Pennsylvania is consistently identified as one of the top natural gas producers in
the country and, as a Pennsylvania native, these conversations and debates are
particularly interesting and hit close to home. Fracking in Pennsylvania is made possible
because of the Marcellus Shale Formation. The Marcellus Shale is a stretch of
sedimentary rock reaching from Upstate New York down through Pennsylvania, West
Virginia, and Ohio. Buried thousands of feet below the surface, this formation created a
large volume of natural gas over millions of years. Now, this shale formation gives life to
the Pennsylvania fracking industry. As of August 2018, Pennsylvania is home to almost
9,000 active wells (“The Marcellus Shale, Explained,” n.d.). The Pennsylvania
Department of Community and Economic Development also listed natural gas as one of
the top industries in the state (n.d). In 2016 alone, gross natural gas production in
Pennsylvania exceeded 5 trillion cubic feet and consequently, as the nation’s second
largest natural gas producer, has been ranked among the top three energy exporters in the
country. Further, the Global Energy Institute, an arm of the U.S. Chamber of Commerce,
issued a report on the economic impact of fracking regulation across the country.
Pennsylvania was highlighted as one of the states whose economy relies the most on the
fracking industry; the study reported that a ban on fracking in Pennsylvania could lose the
state $50 billion a year in state GDP (2016). Due to the scope of the industry and its
integral nature on Pennsylvania’s economy, it is sufficiently representative of other
fracking geographies across the United States.

12
Frack Wastewater
Large amounts of fracking wastewater provide a financial burden to well
operators and serve as the basis for many environmental concerns. In fact, one of the
largest frack waste components is water, with each well requiring approximately 350,000
barrels or more of water input (one barrel is equal to 42 gallons). For a typical Marcellus
well in Washington County, Pennsylvania (one of the largest producing counties in the
state), per well water costs are estimated to be $1.4 million (Haines, 2018). Well
operators are financially motivated to increase production efficiency and decrease the
total amount of water used on each well.
Additionally, in 2011, the U.S. Environmental Protection Agency formally
banned the disposal of frack waste water at public sewage plants. This regulation was
preceded by former Pennsylvania Governor Tom Corbett’s directive to oil and gas
companies to end the practice. While disposal at public treatment facilities was never the
most popular method of disposal, it has indefinitely ruled out the option for operators and
forces them to come up with independent disposal processes (Hurdle, 2016). Some of
these other processes include “spreading” (releasing waste water on unpaved roads to
control dust), impoundment pits, and injection wells. Each of these methods involves the
risk of toxic water contaminating local water sources. This contamination, or even the
idea of contamination, has resulted in many lawsuits being filed against well operators.
According to the Westlaw database limited to Pennsylvania courts and related federal
cases, Range Resources (one of the most prominent Pennsylvania oil and gas companies)
alone has been implicated in approximately 80 cases in the past 10 years (2008 to 2018).
These cases are costly, time consuming, and reflect poorly on the firm’s public opinion.

13
Range Resources is one of thousands of operators in the state, meaning that industry-wide
across Pennsylvania, lawsuits hinder financial performance.
Well Selection
Both conventional and unconventional wells from 1990 to 2018 were selected for
this study. This time frame was selected because the process of fracking Shale gas was
first pioneered in the late 1980s by George Mitchell (Gertner, 2013). Given that the
Marcellus Shale Formation underlies approximately 60% of Pennsylvania’s total
landmass (see Figure 1) and is the principal source of oil and gas in the state, it follows
that 1990 is when fracking could first be considered viable in Pennsylvania.
Figure 1. Map of shale formations in the northeast. From “Marcellus and Utica Shale Formation Map,” by Marcellus Shale Coalition, http://marcelluscoalition.org/pa-map/.
Conventional and unconventional wells are the two methods of oil extraction
utilized in Pennsylvania. Conventional wells are vertical configurations used when oil is

14
already flowing beneath the ground. Unconventional wells are typically horizontal wells
used to extract oil from rock with low permeability (e.g. coal, shale, sandstone).
Unconventional wells are typically recognized as extracting oil through the fracking
process. However, conventional and unconventional wells can be at work
contemporaneously to maximize oil extraction from a single geographic location. In
addition, a single well could switch from extracting oil by conventional methods to later,
once most free flowing oil has been extracted, extracting oil through unconventional
methods. Considering many well operators own both conventional and unconventional
wells, operate them within the same geographic regions, and utilize much of the same
labor and technology for operation, it follows that they should both be included in this
efficiency study.
Data Selection
Data was collected from the Pennsylvania Department of Environmental
Protection’s Oil & Gas Production Reports and Waste Reports (“PA DEP Oil & Gas
Reporting Website - Production / Waste Reports,” n.d.). The Production Reports included
data related to oil, gas, and concentrate output per well. The Waste Reports reported
types and quantities of wastes per well. All data collected from both reports is self-
reported by well operators pursuant to directives included in the Oil and Gas Act of 1984.
The Act requires that “…every well operator shall file with the department, on a form
provided by the department, an annual report specifying the amount of production on the
most well-specific basis available. Annual reports shall also specify the status of each
well…” (Oil and Gas Act of 1984). This act was updated and replaced by the Oil and Gas

15
Act of 2012 which required that operators instead report data on a monthly basis.
However, since data prior to 2012 could not be identified on monthly levels, annual data
was used throughout this study.
Data Explanation
After cleaning and merging Production and Waste Reports, the final data set
consisted of sixteen variables, eleven of which were descriptive. These data provided
insights into well operators, well operating years, and well types (conventional or
unconventional) along with production and waste quantities. See Appendix A for a list of
variables included in the final data set. The raw data was reported by well for each year it
was in operation and will be henceforth referred to as “well/year measurements.”
Data Operationalization
In order to determine if operator size is a driver of organizational learning in the
oil and gas industry, I tracked operator’s waste output per unit of production over
cumulative production output. Prior research identified an increase in efficiency over
increased cumulative output to be an indicator of organizational learning. In the context
of this analysis, an increase in efficiency is explained as a reduction in the amount of
waste being generated per unit of production output. In order to ultimately track these
measurements, I operationalized key measures including operator size, total waste and
production outputs, and waste ratios. All data operationalization and analysis was
conducted using STATA.
16
Learning Model
Learning was measured as a function of waste output per unit of production
output and is subsequently referred to as “waste ratio.” The waste ratio was generated
using the following formula:
𝑊𝑎𝑠𝑡𝑒 𝑅𝑎𝑡𝑖𝑜 = (𝑇𝑜𝑡𝑎𝑙 𝑊𝑎𝑠𝑡𝑒 ÷ 𝑇𝑜𝑡𝑎𝑙 𝑃𝑟𝑜𝑑𝑢𝑐𝑡𝑖𝑜𝑛)
This ratio for a certain group (industry, quartile, individual operators) was tracked
and plotted on graphs. These graphs used cumulative output as the independent variable
and the waste ratio as the dependent variable. I first gathered summary statistics and ran
simple regressions on those data. An indication of the potential for organizational
learning would be if the waste ratio had a negative correlation with cumulative quantity at
a significant level (𝛼 = 0.05). I then graphed linear and quadratic functions on the data to
visualize the learning curve for the group and to compare it with other groups.
Organizational learning was exhibited in learning curves that had a significant, negative
geometric relationship. This model was replicated at the industry level (by quartiles
identified by firm size), and by individual operators. Measuring the waste ratio over
cumulative output to ultimately generate graphical representations of industry level
efficiency trends required the construction of several key variables.
Dependent Variable: Waste Ratio
Production and waste variables were converted to their most basic form for
analysis. Conventional and unconventional wells produce three types of outputs: oil, gas,
17
and concentrate. For the purpose of this research, there is little value in viewing them as
individual outputs, so I combined them into one “total production” value for each
well/year measurement. Similarly, many different types of fracking wastes were reported
in the waste reports, so I combined them into a single “total waste” well/year
measurement. Using these two total measurements, I created the waste ratio. By creating
this waste ratio, rather than looking at total waste output, I controlled for increased waste
levels due to increased production levels, and vice versa.
Preliminary Analysis: Time
Given the nature of learning curves, the first independent variable in this analysis
is time. In this case, time serves as a proxy for experience as a well operator. Per the
directive of the Oil and Gas Act of 1984, annual data from wells was collected and
starting in 2012, monthly data was collected. However, all monthly data was transformed
to yearly quantities to maintain consistency throughout the analysis.
The graphs created by this preliminary analysis represent an eyeball test of the
diffusion of practices across industry. While this analysis is confounded by external
influences such as international conflict or gas prices, it is still important to understand
what is happening over time.
Primary Analysis: Cumulative Quantity
In the primary set of regressions, cumulative production quantity was used as the
independent variable as a measurement of operational scope. This measure was
constructed in order to compare well operators waste ratios at a certain period in their
18
production timeline, rather than at a certain year. By running the analysis in this manner,
it controlled for the fact that not all firms begin and end operation during the same years,
i.e. an operator who began operation in 2002 and an operator who began in 2009 will
have their waste ratios compared at a certain production level (Q) rather than in a certain
year when the older operator had more experience than the newer one.
Measuring Learning
Previous research shows that learning occurs at the industry, organizational, and
individual levels. Individual level learning is not particularly applicable to the research
question posed, so it is not included in the analysis. However, it is necessary to control
for industry level learning and knowledge sharing, other technological improvements, or
external shocks, before concluding that any learning being observed is solely at the
organization level based on operator size. While many learning curve analyses today
consist of multivariate regressions, early concepts of learning curves began as simple
graphical representations of cumulative output on unit costs or efficiency ratios. This first
part of this analysis follows a similar model of looking for patterns in raw data based on
graphical evidence visualized through learning curves. The second part of this analysis
uses a multivariate analysis to determine the impact of firm size and operational scope on
the waste ratio.
19
Industry Level Learning by Quartile
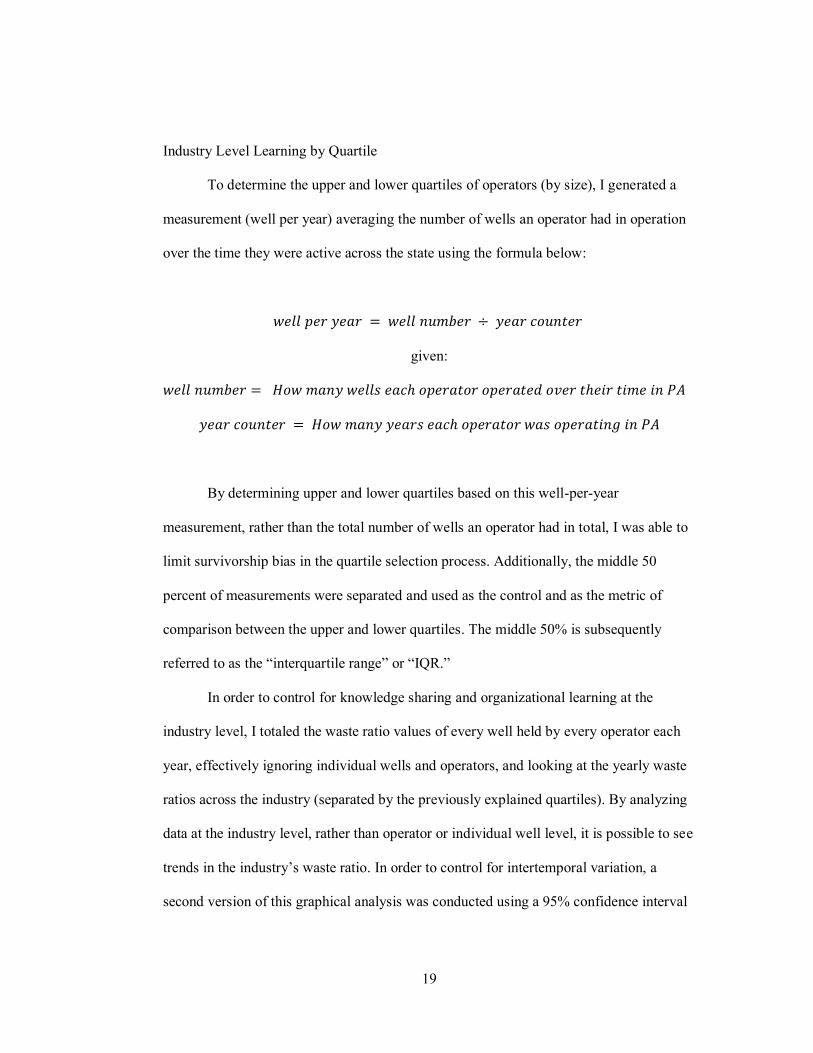
To determine the upper and lower quartiles of operators (by size), I generated a
measurement (well per year) averaging the number of wells an operator had in operation
over the time they were active across the state using the formula below:
𝑤𝑒𝑙𝑙 𝑝𝑒𝑟 𝑦𝑒𝑎𝑟 = 𝑤𝑒𝑙𝑙 𝑛𝑢𝑚𝑏𝑒𝑟 ÷ 𝑦𝑒𝑎𝑟 𝑐𝑜𝑢𝑛𝑡𝑒𝑟
given:
𝑤𝑒𝑙𝑙 𝑛𝑢𝑚𝑏𝑒𝑟 = 𝐻𝑜𝑤 𝑚𝑎𝑛𝑦 𝑤𝑒𝑙𝑙𝑠 𝑒𝑎𝑐ℎ 𝑜𝑝𝑒𝑟𝑎𝑡𝑜𝑟 𝑜𝑝𝑒𝑟𝑎𝑡𝑒𝑑 𝑜𝑣𝑒𝑟 𝑡ℎ𝑒𝑖𝑟 𝑡𝑖𝑚𝑒 𝑖𝑛 𝑃𝐴
𝑦𝑒𝑎𝑟 𝑐𝑜𝑢𝑛𝑡𝑒𝑟 = 𝐻𝑜𝑤 𝑚𝑎𝑛𝑦 𝑦𝑒𝑎𝑟𝑠 𝑒𝑎𝑐ℎ 𝑜𝑝𝑒𝑟𝑎𝑡𝑜𝑟 𝑤𝑎𝑠 𝑜𝑝𝑒𝑟𝑎𝑡𝑖𝑛𝑔 𝑖𝑛 𝑃𝐴
By determining upper and lower quartiles based on this well-per-year
measurement, rather than the total number of wells an operator had in total, I was able to
limit survivorship bias in the quartile selection process. Additionally, the middle 50
percent of measurements were separated and used as the control and as the metric of
comparison between the upper and lower quartiles. The middle 50% is subsequently
referred to as the “interquartile range” or “IQR.”
In order to control for knowledge sharing and organizational learning at the
industry level, I totaled the waste ratio values of every well held by every operator each
year, effectively ignoring individual wells and operators, and looking at the yearly waste
ratios across the industry (separated by the previously explained quartiles). By analyzing
data at the industry level, rather than operator or individual well level, it is possible to see
trends in the industry’s waste ratio. In order to control for intertemporal variation, a
second version of this graphical analysis was conducted using a 95% confidence interval
20
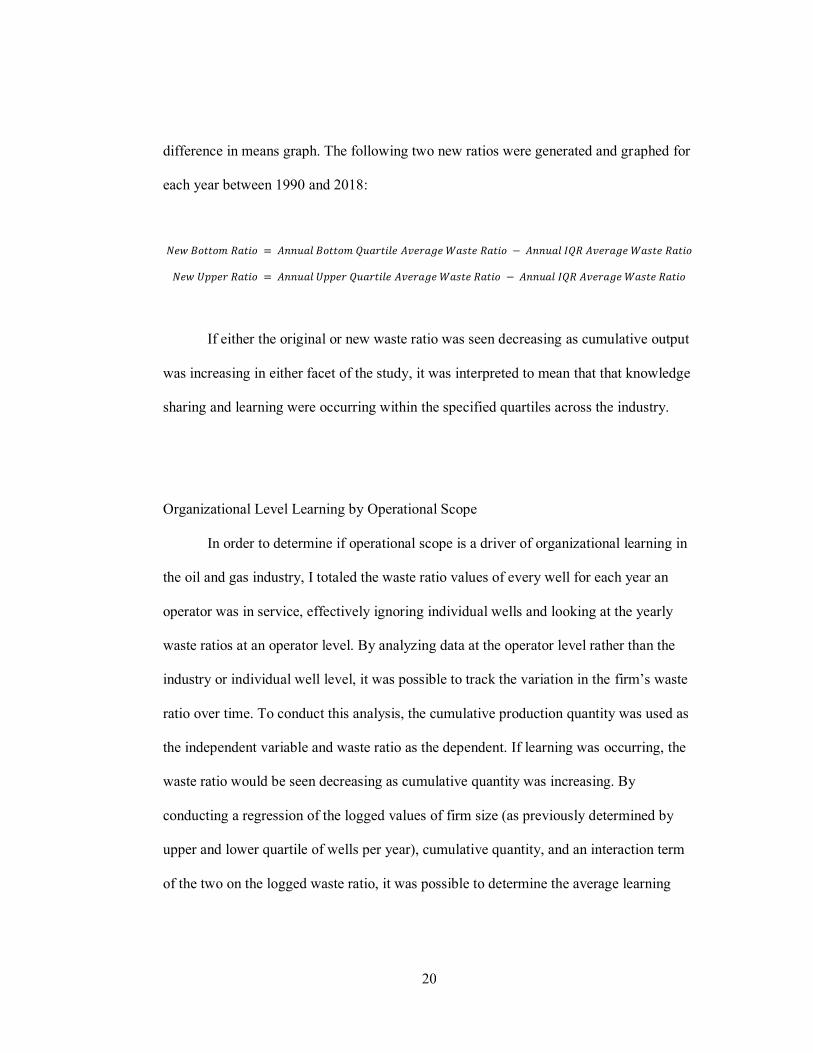
difference in means graph. The following two new ratios were generated and graphed for
each year between 1990 and 2018:
𝑁𝑒𝑤 𝐵𝑜𝑡𝑡𝑜𝑚 𝑅𝑎𝑡𝑖𝑜 = 𝐴𝑛𝑛𝑢𝑎𝑙 𝐵𝑜𝑡𝑡𝑜𝑚 𝑄𝑢𝑎𝑟𝑡𝑖𝑙𝑒 𝐴𝑣𝑒𝑟𝑎𝑔𝑒 𝑊𝑎𝑠𝑡𝑒 𝑅𝑎𝑡𝑖𝑜 − 𝐴𝑛𝑛𝑢𝑎𝑙 𝐼𝑄𝑅 𝐴𝑣𝑒𝑟𝑎𝑔𝑒 𝑊𝑎𝑠𝑡𝑒 𝑅𝑎𝑡𝑖𝑜
𝑁𝑒𝑤 𝑈𝑝𝑝𝑒𝑟 𝑅𝑎𝑡𝑖𝑜 = 𝐴𝑛𝑛𝑢𝑎𝑙 𝑈𝑝𝑝𝑒𝑟 𝑄𝑢𝑎𝑟𝑡𝑖𝑙𝑒 𝐴𝑣𝑒𝑟𝑎𝑔𝑒 𝑊𝑎𝑠𝑡𝑒 𝑅𝑎𝑡𝑖𝑜 − 𝐴𝑛𝑛𝑢𝑎𝑙 𝐼𝑄𝑅 𝐴𝑣𝑒𝑟𝑎𝑔𝑒 𝑊𝑎𝑠𝑡𝑒 𝑅𝑎𝑡𝑖𝑜
If either the original or new waste ratio was seen decreasing as cumulative output
was increasing in either facet of the study, it was interpreted to mean that that knowledge
sharing and learning were occurring within the specified quartiles across the industry.
Organizational Level Learning by Operational Scope
In order to determine if operational scope is a driver of organizational learning in
the oil and gas industry, I totaled the waste ratio values of every well for each year an
operator was in service, effectively ignoring individual wells and looking at the yearly
waste ratios at an operator level. By analyzing data at the operator level rather than the
industry or individual well level, it was possible to track the variation in the firm’s waste
ratio over time. To conduct this analysis, the cumulative production quantity was used as
the independent variable and waste ratio as the dependent. If learning was occurring, the
waste ratio would be seen decreasing as cumulative quantity was increasing. By
conducting a regression of the logged values of firm size (as previously determined by
upper and lower quartile of wells per year), cumulative quantity, and an interaction term
of the two on the logged waste ratio, it was possible to determine the average learning

21
trend, the effect of being either large or small on efficiency, and the difference in learning
between small and large operators.
22
RESEARCH FINDINGS
Throughout this section, my analysis focuses on the incidence of organizational
learning in the Pennsylvania oil and gas industry. Operationalized by running regressions
on and graphing the waste ratio for 1,199 well operators between 1990 and 2018, this
study determined that decreases in the waste ratio over time were not significantly
determined by operational scope. My study first looked at trends within Pennsylvania’s
oil and gas industry over time. I then controlled for learning at the industry level and
determined that there is no evidence of organizational learning across small operators or
large operators, compared to learning of the IQR. Further multivariate analysis
controlling for the fixed effects of individual firms was conducted to determine if
organizational learning was occurring within operators. It was found that on average all
firms, regardless of operational scope, decreased their waste ratio as their cumulative
output increased. I later went into detail regarding how these findings aligned with prior
research and my original hypotheses.
Industry Level Trends Over Time
I began by comparing both the upper and lower quartile average annual waste
ratios to the IQR’s waste ratio to determine if they were statistically different. After
closer analysis of the annual difference in waste ratio means between the bottom quartile
and IQR, I in fact rejected with 95% confidence that the average means of the bottom

23
quartile and IQR were the same. This piece of the analysis provided basis for proving a
difference between the bottom quartile’s and IQR’s efficiency trends over time. The
graphical representation of this relationship is seen in Figure 2.
Figure 2. Industry level bottom quartile difference in means.
See Appendix E for summary statistics and the graphical comparison between the
difference in mean waste ratios at the industry level.
Through an analysis of the difference in annual means between the upper quartile
and IQR, industry wide shocks were taken into consideration. Ultimately the regression
explains 32% of the variation in waste ratio between 1990 and 2018. A graphical
representation of this relationship can be seen in Figure 3.
24
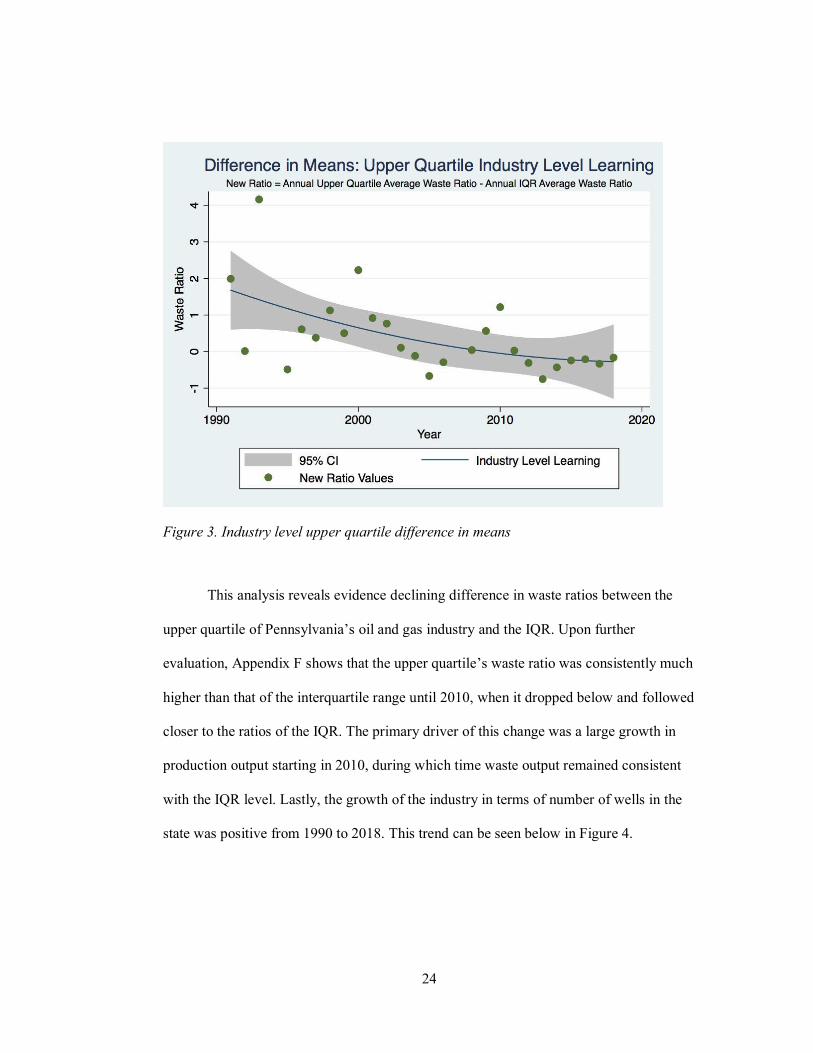
Figure 3. Industry level upper quartile difference in means
This analysis reveals evidence declining difference in waste ratios between the
upper quartile of Pennsylvania’s oil and gas industry and the IQR. Upon further
evaluation, Appendix F shows that the upper quartile’s waste ratio was consistently much
higher than that of the interquartile range until 2010, when it dropped below and followed
closer to the ratios of the IQR. The primary driver of this change was a large growth in
production output starting in 2010, during which time waste output remained consistent
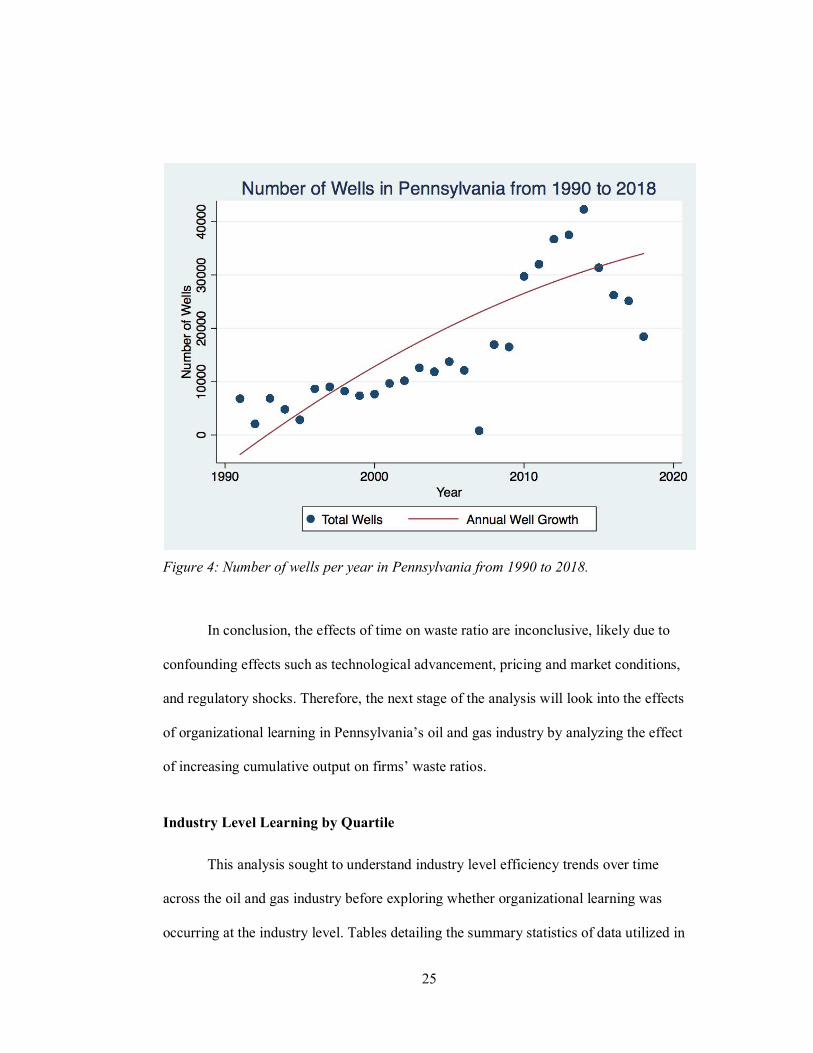
with the IQR level. Lastly, the growth of the industry in terms of number of wells in the
state was positive from 1990 to 2018. This trend can be seen below in Figure 4.
25
Figure 4: Number of wells per year in Pennsylvania from 1990 to 2018.
In conclusion, the effects of time on waste ratio are inconclusive, likely due to
confounding effects such as technological advancement, pricing and market conditions,
and regulatory shocks. Therefore, the next stage of the analysis will look into the effects
of organizational learning in Pennsylvania’s oil and gas industry by analyzing the effect
of increasing cumulative output on firms’ waste ratios.
Industry Level Learning by Quartile
This analysis sought to understand industry level efficiency trends over time
across the oil and gas industry before exploring whether organizational learning was
occurring at the industry level. Tables detailing the summary statistics of data utilized in
26
this analysis can be found in Appendices C and D (Appendix C details all data and
Appendix D details data without outliers in the 99th percentile). Through simple
regressions and data charting by quartile, I examined the effect of firm size on
organizational learning at the industry level.
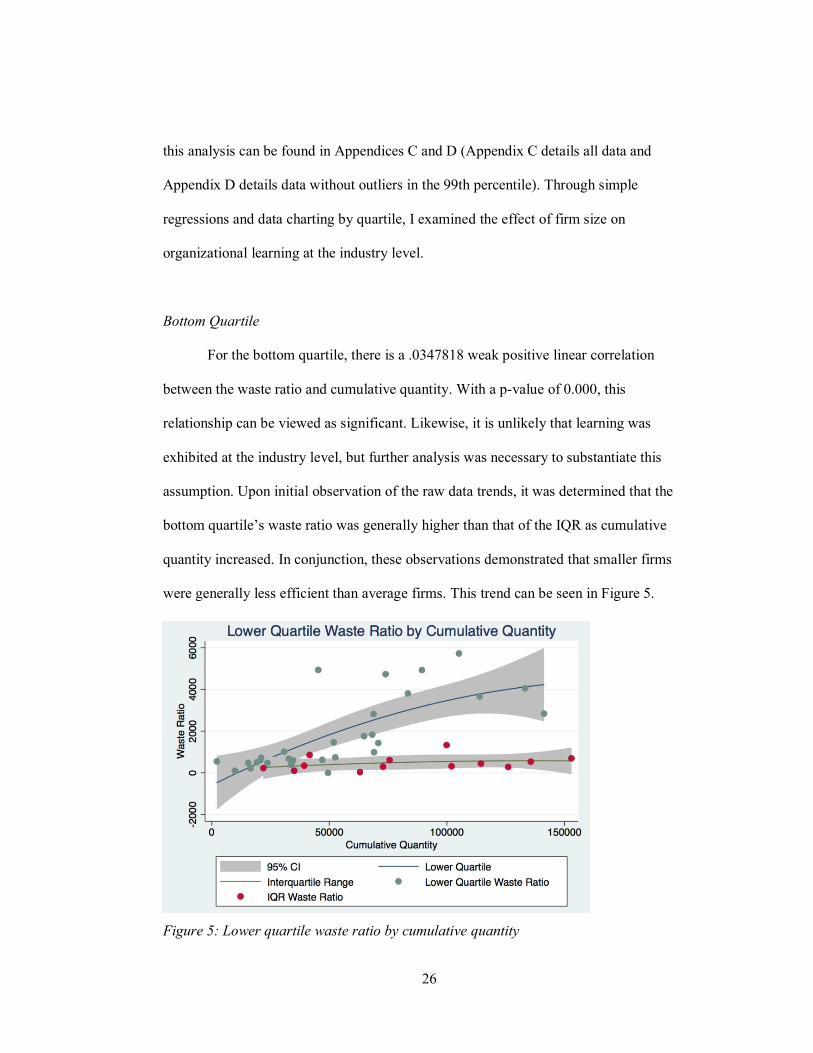
Bottom Quartile
For the bottom quartile, there is a .0347818 weak positive linear correlation
between the waste ratio and cumulative quantity. With a p-value of 0.000, this
relationship can be viewed as significant. Likewise, it is unlikely that learning was
exhibited at the industry level, but further analysis was necessary to substantiate this
assumption. Upon initial observation of the raw data trends, it was determined that the
bottom quartile’s waste ratio was generally higher than that of the IQR as cumulative
quantity increased. In conjunction, these observations demonstrated that smaller firms
were generally less efficient than average firms. This trend can be seen in Figure 5.
Figure 5: Lower quartile waste ratio by cumulative quantity
27
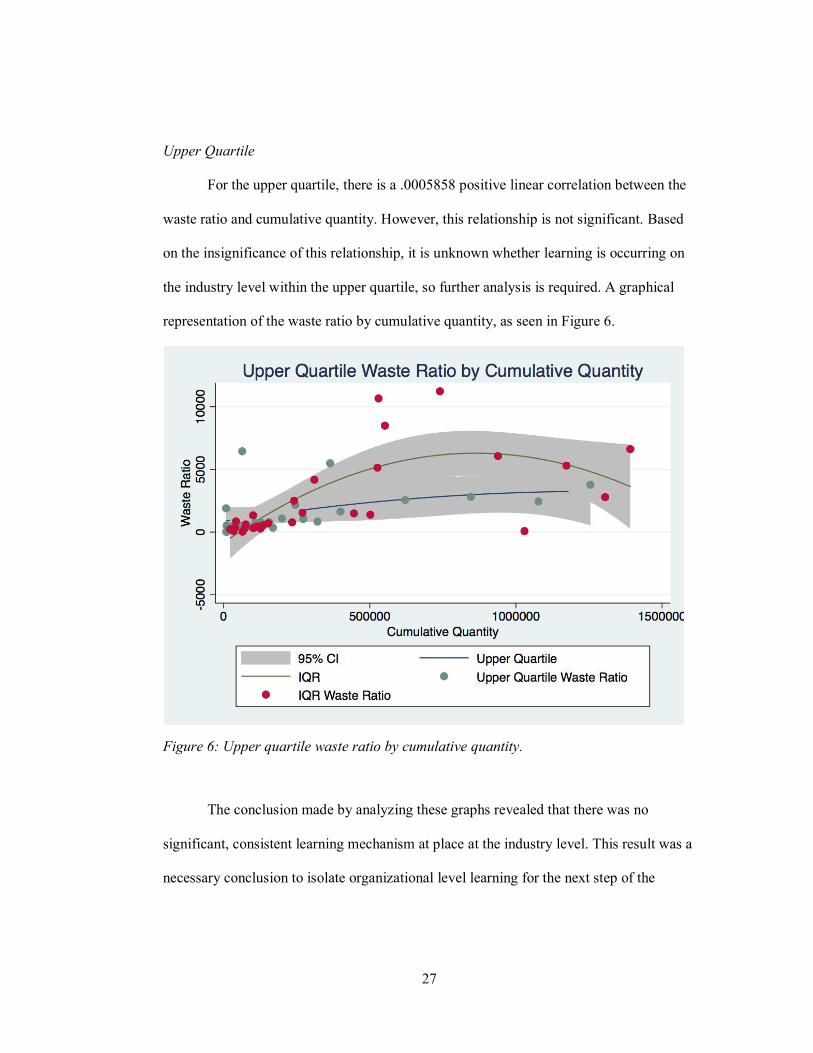
Upper Quartile
For the upper quartile, there is a .0005858 positive linear correlation between the
waste ratio and cumulative quantity. However, this relationship is not significant. Based
on the insignificance of this relationship, it is unknown whether learning is occurring on
the industry level within the upper quartile, so further analysis is required. A graphical
representation of the waste ratio by cumulative quantity, as seen in Figure 6.
Figure 6: Upper quartile waste ratio by cumulative quantity.
The conclusion made by analyzing these graphs revealed that there was no
significant, consistent learning mechanism at place at the industry level. This result was a
necessary conclusion to isolate organizational level learning for the next step of the

28
analysis. The drivers of internal differences seen in the graphs will be further investigated
in the next analysis when controlling for fixed effects of individual firms.
Organizational Level Learning by Firm Size
The second part of this analysis sought to identify organizational learning by
small and large individual operators within the oil and gas industry. Through multivariate
regressions and data charting, I examined the effect of operational scope and firm size on
learning at the organization level.
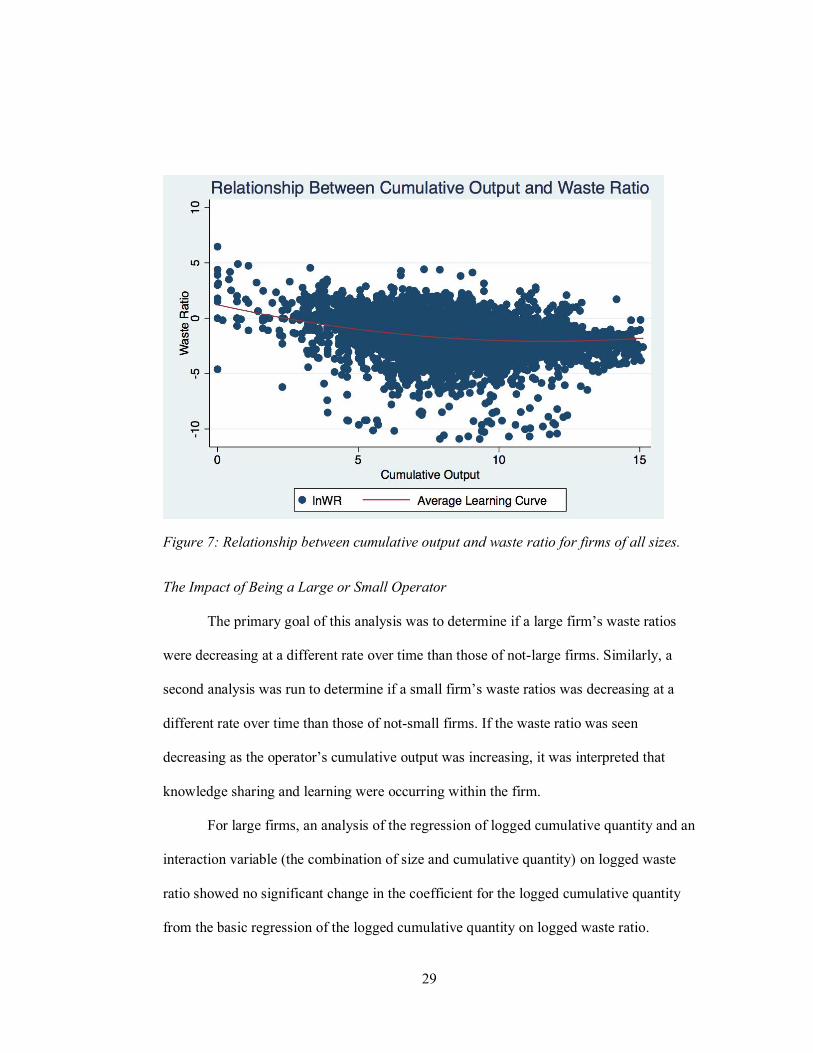
The Impact of Increased Operational Scope By running a regression on the logged relationship between waste ratio and the
operational scope, it was found that on average, as cumulative output was increasing,
waste ratio was decreasing, thus providing evidence for learning across all firms of all
sizes. In fact, a 1% increase in the cumulative output was associated with a significant
decrease in the corresponding waste ratio by 0.43%. See Figure 7 for a graphical
representation of this trend.
29
Figure 7: Relationship between cumulative output and waste ratio for firms of all sizes.
The Impact of Being a Large or Small Operator The primary goal of this analysis was to determine if a large firm’s waste ratios
were decreasing at a different rate over time than those of not-large firms. Similarly, a
second analysis was run to determine if a small firm’s waste ratios was decreasing at a
different rate over time than those of not-small firms. If the waste ratio was seen
decreasing as the operator’s cumulative output was increasing, it was interpreted that
knowledge sharing and learning were occurring within the firm.
For large firms, an analysis of the regression of logged cumulative quantity and an
interaction variable (the combination of size and cumulative quantity) on logged waste
ratio showed no significant change in the coefficient for the logged cumulative quantity
from the basic regression of the logged cumulative quantity on logged waste ratio.

30
Further, the interaction term’s coefficient of 0.0385 had a p-value greater than 0.05 and
therefore could not be considered significant. Similarly, the same regression for small
firms again showed no significant change in the coefficient for the logged cumulative
quantity and had an insignificant p-value for the interaction coefficient. Please see Figure
5 below for a breakdown of these numbers.
Impact of Being a Large or Small Operator
Regression 1: Cumulative quantity (logged) on waste ratio (logged) Regression 2: Cumulative quantity (logged) and interaction (logged cumulative quantity and firm size) on waste ratio (logged) *all regressions were run with the xtreg command in Stata. All regressions also controlled for fixed effects and robustness.
Regression 1:
Logged cumulative quantity coefficient -0.4305
Logged cumulative quantity p-value 0.000
Large Operators Regression 2:
Logged cumulative quantity coefficient -0.4344
Logged cumulative quantity p-value 0.000
Logged interaction coefficient 0.0385
Logged interaction p-value 0.594
Small Operators Regression 2:
Logged cumulative quantity coefficient -0.3968
Logged cumulative quantity p-value 0.000
Logged interaction coefficient -0.0599
Logged interaction p-value 0.282 Figure 8. Quantitative impact of being a small or large firm.
31
In conclusion, this analysis found that neither being a large or small firm impacts
learning more than the other. There was no significant difference between firms of any
size and their ability to be more efficient and learn over time. Therefore, this analysis
shows that firm size is not a driver of organizational learning in Pennsylvania’s oil and
gas industry.
Stakeholder Takeaways
The findings of this research can provide value for key stakeholders including
investors, policy makers, and internal decision makers.
Investors
From the investor perspective, a firm’s ability to practice organizational learning
within the oil and gas industry could be used as a metric of interest for investment
decisions. Given that the industry trend is a decrease in waste ratio associated with an
increase in cumulative output, if a firm is not meeting industry standards it is likely not a
worthwhile investment. Similarly, investors should recognize that firm size was not an
indicator of increased efficiency over an increase in cumulative output. Likewise, firm
size alone should not be a key decision point for investors. Future research of interest to
investors would include relationships between learning rates (or lack thereof) discovered
in this research and firm profitability measurements.
32
Policy Makers
While there is evidence across firms of all sizes within Pennsylvania’s oil and gas
industry of declining waste ratios with increases in cumulative quantity, it would be
valuable to understand what enables some firms to be more efficient than others. With
future research, policy makers could understand which firms need extra incentives to be
efficient and create policy as such. Further, even though firms in general are becoming
more efficient, it would be beneficial to communities if firms generated less waste. In
2018, Ross Craft, chairman and CEO of Approach Resources Inc, explained that
environmentally friendly, efficient technologies exists that are capable of cleaning water
to a point where it can be put into local water sources, used for farming, or even
consumption (Haines, 2018). Unfortunately, he admits that the technology is expensive,
an obvious deterrent for oil and gas operators already operating in tight margins.
Accordingly, well developed policies and regulation enforcement could incentivize oil
and gas companies to take the next step to invest in technology that help protect the
environment.
Internal Decision Makers
Considering the overwhelming direct and indirect costs of waste and waste
handling, it is vital for firm’s financial interests to efficiently manage and reduce their
respective waste ratios. Likewise, it is important that individual firms research and
understand their respective abilities to decrease their waste ratio as their cumulative
output increases. By capitalizing on internal strengths and learning opportunities, firms
would reap significant cost savings. As John Browne, former CEO of BP, explained,
33
knowledge “is relatively inexpensive to replicate if you can capture it”(Prokesch, 1997).
He expands to discuss that working activities in the oil and gas industry are not one-time
events and, that if each repetition can be more efficient than the last, a lot more money
can be made (1997).
34
DISCUSSION
A number of limitations from this study are noteworthy and the resulting
opportunities for future research warrant additional discussion.
Limitations
While a majority of data limitations were consciously avoided through this
study’s methodology, others were ineludible. First, data utilized in this study was self-
reported by well operators. Due to the nature of this collection process, data is not likely
to be completely accurate, either by accident or because of adverse reporting incentives
and a lack of institutional oversight. While notice was taken to clean the data and avoid
glaring misrepresentations of truth, it is possible that some data utilized in this study was
not true to reality. Further, inconsistent reporting guidelines, while anticipated due to the
nature of the newly developing and rapidly growing industry, forced the simplification of
analysis. For example, when the Oil and Gas Act of 2012 was implemented, waste and
production metrics were subsequently reported monthly rather than annually, and there
were more specific descriptions of waste types and waste disposal methods. All of these
increasingly specific data measures would have made for a richer study and analysis.

35
Future Research Opportunities
Future research on organizational learning’s impact on energy efficiency,
specifically within the setting of Pennsylvania’s oil and gas industry, would shed light on
some of the questions left behind from this study. One of the largest questions I had at the
completion of my research was: “How have energy operators managed, both financially
and legally, to not decrease their waste ratios over time?” I believe an avenue of future
research that could shed light on this question would be to measure and track the rate of
waste being recycled. A possible hypothesis is that while overall waste ratios might not
be decreasing, the amount of waste being recycled is increasing, effectively decreasing
the environmental impact of waste being created and disposed of.
An additional element that could be valuable to incorporate in future research
would be to control for well geography. While it was beyond the scope of this project, I
hypothesize that regardless of the identity of the well operator, certain geographies have
varying access to resources and disposal methods based on proximity to bodies of water,
the necessity to navigate mountainous terrain, and even varying levels of precipitation.
Additionally, the existence of local regulations or restrictions could impact a well
operator’s ability to operate at optimal efficiency levels.
Similarly, it would be interesting to conduct this same or similar research in other
states or on a national scale. Perhaps companies with operations in multiple states have
efficiency bottlenecks in certain states but are able to make headway in others. By only
analyzing a single state, it is difficult to truly put operator performance in perspective.
While I concluded that waste ratio had not significantly decreased over time in
Pennsylvania, maybe Pennsylvania operators have efficiency figured out and have no

36
room for improvement. Likewise, having a comparison to other states or a national basis
would provide valuable insights and basis of comparison for this research question and
subsequent findings.
Lastly, supplementary research into well-level, individual learning rates would
provide valuable insights for internal decision makers. By analyzing individual wells’
waste ratios, underperforming wells could be identified and remedying steps could be
taken to improve the well as needed. This research would also provide insight into
whether or not firm leadership needs to invest in and facilitate more knowledge sharing
within the company. By understanding which wells are performing exceptionally,
explanatory metrics (technological innovation, organizational structure, leadership, etc.)
can be identified and shared across the company.

37
APPENDIX
Appendix A
Final Data Set Variables
FINAL DATA
Production Variables Waste Variables
Operator Operator Number Period ID Reporting Period Unconventional Well County Well Latitude Well Longitude Well Permit Number Well Status Well Type Condensate Quantity Gas Quantity Oil Quantity
Operator Operator Number Period ID Reporting Period Unconventional Well County Well Latitude Well Longitude Well Permit Number Well Status Well Type Units Waste Quantity
*Bolded terms indicate variables present in both lists prior to merging data
38
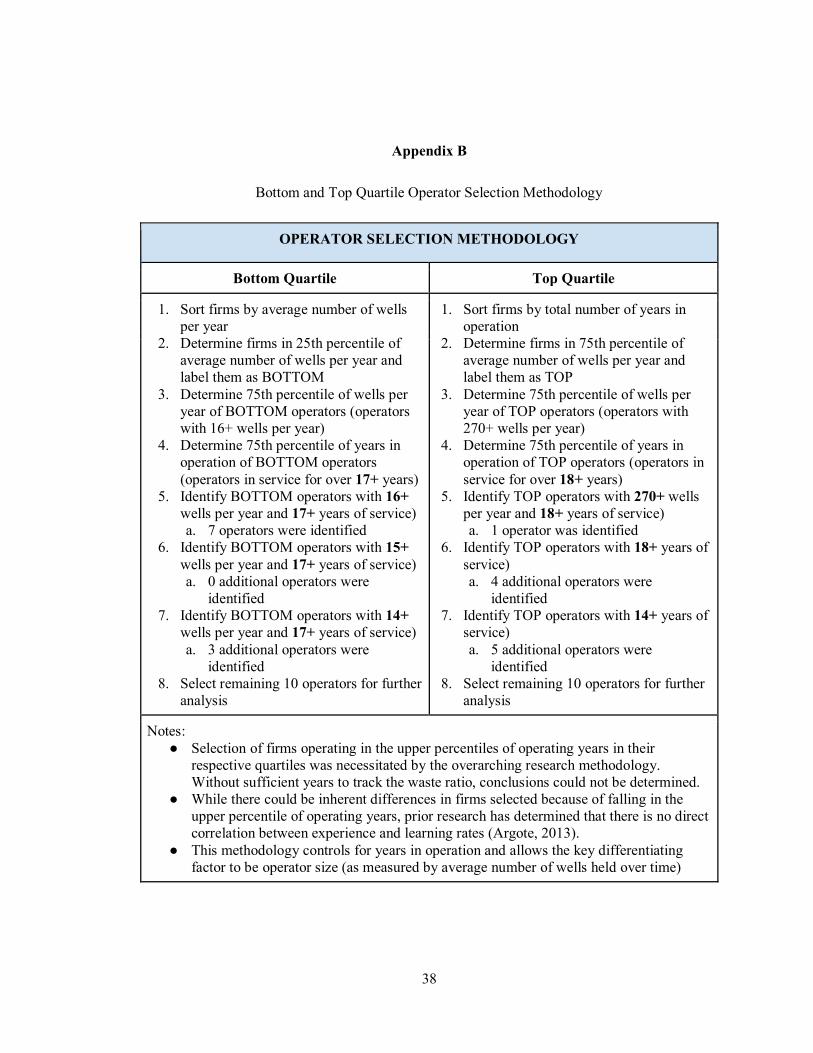
Appendix B
Bottom and Top Quartile Operator Selection Methodology
OPERATOR SELECTION METHODOLOGY
Bottom Quartile Top Quartile
1. Sort firms by average number of wells per year
2. Determine firms in 25th percentile of average number of wells per year and label them as BOTTOM
3. Determine 75th percentile of wells per year of BOTTOM operators (operators with 16+ wells per year)
4. Determine 75th percentile of years in operation of BOTTOM operators (operators in service for over 17+ years)
5. Identify BOTTOM operators with 16+ wells per year and 17+ years of service) a. 7 operators were identified
6. Identify BOTTOM operators with 15+ wells per year and 17+ years of service) a. 0 additional operators were
identified 7. Identify BOTTOM operators with 14+
wells per year and 17+ years of service) a. 3 additional operators were
identified 8. Select remaining 10 operators for further
analysis
1. Sort firms by total number of years in operation
2. Determine firms in 75th percentile of average number of wells per year and label them as TOP
3. Determine 75th percentile of wells per year of TOP operators (operators with 270+ wells per year)
4. Determine 75th percentile of years in operation of TOP operators (operators in service for over 18+ years)
5. Identify TOP operators with 270+ wells per year and 18+ years of service) a. 1 operator was identified
6. Identify TOP operators with 18+ years of service) a. 4 additional operators were
identified 7. Identify TOP operators with 14+ years of
service) a. 5 additional operators were
identified 8. Select remaining 10 operators for further
analysis
Notes: ● Selection of firms operating in the upper percentiles of operating years in their
respective quartiles was necessitated by the overarching research methodology. Without sufficient years to track the waste ratio, conclusions could not be determined.
● While there could be inherent differences in firms selected because of falling in the upper percentile of operating years, prior research has determined that there is no direct correlation between experience and learning rates (Argote, 2013).
● This methodology controls for years in operation and allows the key differentiating factor to be operator size (as measured by average number of wells held over time)
39
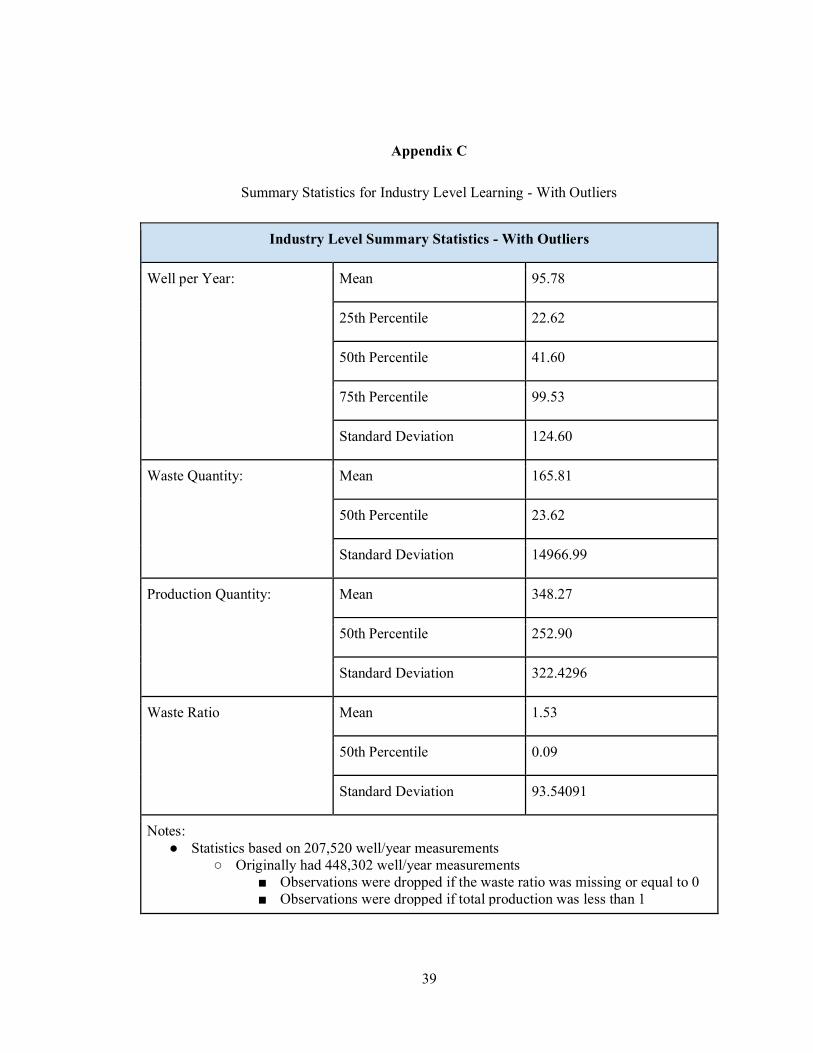
Appendix C
Summary Statistics for Industry Level Learning - With Outliers
Industry Level Summary Statistics - With Outliers
Well per Year: Mean 95.78
25th Percentile 22.62
50th Percentile 41.60
75th Percentile 99.53
Standard Deviation 124.60
Waste Quantity: Mean 165.81
50th Percentile 23.62
Standard Deviation 14966.99
Production Quantity: Mean 348.27
50th Percentile 252.90
Standard Deviation 322.4296
Waste Ratio Mean 1.53
50th Percentile 0.09
Standard Deviation 93.54091
Notes: ● Statistics based on 207,520 well/year measurements
○ Originally had 448,302 well/year measurements ■ Observations were dropped if the waste ratio was missing or equal to 0 ■ Observations were dropped if total production was less than 1

40
Appendix D
Summary Statistics for Industry Level Learning - Without Outliers
Industry Level Summary Statistics - Without Outliers
Well per Year: Mean 92.02
25th Percentile 22.48
50th Percentile 41.28
75th Percentile 99.53
Standard Deviation 116.27
Waste Quantity: Mean 61.25
50th Percentile 21.97
Standard Deviation 102.88
Production Quantity: Mean 346.05
50th Percentile 250
Standard Deviation 321.47
Waste Ratio Mean 0.86
50th Percentile 0.09
Standard Deviation 5.00
Notes: ● Statistics based on 200,717 well/year measurements
○ Observations were dropped if total waste, production, or waste ratio exceeded the 99th percentile

41
Appendix E
Summary Statistics and Graphical Representation of Bottom Quartile and IQR Industry Level Waste Ratios
Summary Statistics of Industry Level Waste Ratios: Bottom Quartile vs IQR
Ho: mean = 0 Ha: mean = 0 *mean = bottom quartile average annual waste ratio - IQR average annual waste ratio
Statistic Value
t-statistic 3.259
df 27
obs 28
95% confidence interval 0.083 to 0.365

42
Appendix F
Summary Statistics and Graphical Representation of Upper Quartile and IQR Industry Level Waste Ratios
Summary Statistics of Industry Level Waste Ratios: Upper Quartile vs IQR
Ho: mean = 0 Ha: mean = 0 *mean = upper quartile average annual waste ratio - IQR average annual waste ratio
Statistic Value
t-statistic 1.4017
df 26
obs 27
95% confidence interval -0.6320 to 3.342
Notes: ● One outlier, the single observation in the 99th percentile, was removed for the
difference in means regression

43
REFERENCES CITED American Geosciences Institute. (2014, June 17). How much water does the typical
hydraulically fractured well require? Retrieved March 24, 2019, from https://www.americangeosciences.org/critical-issues/faq/how-much-water-does-typical-hydraulically-fractured-well-require
Argote, L. (2013). Organizational Learning: Creating, Retaining and Transferring
Knowledge (2nd ed.). New York, NY: Springer Science+Business Media. Ati, N., Brinkman, M., Peacock, R., & Wood, C. (2016, March). Margins under pressure
as market falls further | McKinsey. Retrieved March 17, 2019, from https://www.mckinsey.com/industries/oil-and-gas/our-insights/margins-under-pressure-as-market-falls-further
Boudet, H., Clarke, C., Bugden, D., Maibach, E., Roser-Renouf, C., & Leiserowitz, A.
(2014). “Fracking” controversy and communication: Using national survey data to understand public perceptions of hydraulic fracturing. Energy Policy, 65, 57–67. https://doi.org/10.1016/j.enpol.2013.10.017
DiChristopher, T. (2018, December 31). Oil prices had their worst year since 2015 —
here’s what went wrong. Retrieved March 24, 2019, from https://www.cnbc.com/2018/12/31/oil-prices-are-set-for-their-worst-year-since-2015.html
Frazier, R. (2018, April 3). Poll: Public concern grows over natural gas industry’s
environmental impact. Retrieved March 31, 2019, from StateImpact Pennsylvania website: https://stateimpact.npr.org/pennsylvania/2018/04/03/poll-public-concern-grows-over-natural-gas-industrys-environmental-impact/
Gertner, J. (2013, December 21). George Mitchell, father of fracking. The New York
Times. Retrieved from https://www.nytimes.com/news/the-lives-they-lived/2013/12/21/george-mitchell/
Global Energy Institute. (2016, November 4). New Energy Institute Report Finds that
U.S. Could Lose Nearly 15 Million Jobs If Hydraulic Fracturing is Banned.

44
Retrieved December 6, 2018, from https://www.globalenergyinstitute.org/energy-accountability-fracking-press-release
Haines, L. (2018). Shaving Water Costs. Oil and Gas Investor. Retrieved from
https://www.approachresources.com/approach/files/d6/d6f702b6-07e5-4b26-b297-6b744dc8cb3b.PDF
Harraf, A., Wanasika, I., Tate, K., & Talbott, K. (2015). Organizational Agility. Journal
of Applied Business Research; Laramie, 31(2), 675. Hirji, Z., Song, L. (2015, January 20). Map: The Fracking Boom, State by State.
Retrieved September 17, 2018, from http://insideclimatenews.org/news/20150120/map-fracking-boom-state-state
Hirschmann, W. (1964). Profit from the learning curve. Harvard Business Review, 42(1),
125–139. Horton, M. (2018, July 16). What are the effects of fracking on the environment?
Retrieved March 24, 2019, from https://www.investopedia.com/ask/answers/011915/what-are-effects-fracking-environment.asp
Hurdle, J. (2016, June 14). EPA bans disposal of fracking waste water at public treatment
plants. Retrieved March 26, 2019, from https://stateimpact.npr.org/pennsylvania/2016/06/14/epa-bans-disposal-of-fracking-waste-water-at-public-treatment-plants/
Independent Petroleum Association of America. (n.d.). Retrieved December 5, 2018,
from https://www.ipaa.org/fracking/ IPIECA. (2013). Saving energy in the oil and gas industry. London, United Kingdom. Marcellus Shale Coalition. (n.d.). Marcellus and Utica Shale Formation Map. Retrieved
March 26, 2019, from http://marcelluscoalition.org/pa-map/ Oil and Gas Act, Penn. Assemb. 223 (1983-2984), Chapter 11 (Penn. Stat. 1984) PA DEP Oil & Gas Reporting Website - Production / Waste Reports. (n.d.). Retrieved
April 2, 2019, from Pennsylvania Department of Environmental Protection website:
45
https://www.paoilandgasreporting.state.pa.us/publicreports/Modules/Welcome/ProdWasteReports.aspx
Pennsylvania Department of Community and Economic Development. (n.d.). Retrieved
December 6, 2018, from https://dced.pa.gov/key-industries/naturalgas/ Prokesch, S. (1997, September 1). Unleashing the Power of Learning: An Interview with
British Petroleum’s John Browne. Harvard Business Review, (September–October 1997). Retrieved from https://hbr.org/1997/09/unleasing-the-power-of-learning-an-interview-with-british-petroleums-john-browne
Schiersch, A. (2013). Firm size and efficiency in the German mechanical engineering
industry. Small Business Economics, 40(2), 335–350. https://doi.org/10.1007/s11187-012-9438-8
Squillace, M. (2016). Managing unconventional oil and gas development as if
communities mattered. Vermont Law Review 40(3), 525-560. The keys to organizational agility. (2015). Retrieved March 31, 2019, from
https://www.mckinsey.com/business-functions/organization/our-insights/the-keys-to-organizational-agility
The Marcellus Shale, Explained. (n.d.). Retrieved December 6, 2018, from
https://stateimpact.npr.org/pennsylvania/tag/marcellus-shale/ T. P. Wright. (1936). Factors Affecting the Cost of Airplanes. Journal of the Aeronautical
Sciences, 3(4), 122-128.