firms and customers i - … · when should government privatize stuff? ... should governments...
TRANSCRIPT

Firms and customers IMPA 612: Public Management EconomicsFebruary 12, 2018
Fill out your reading report on Learning Suite!

Current eventsNow expanded to take advantage of your new vocabulary!

Costs and profit
Demand and profit maximization
Outsourcing revisited
Plan for today
Popsicle Sticks, Inc.

OutsourcingWhen should government privatize stuff?

Conditions for contracting
The bigger the adverse consequences of cost-cutting on quality, the stronger the case for in-house provision

Should governments outsource…
Snowplows Garbage
Mail Schools
Prisons Police
Healthcare
Military

Demand and profit maximizationHow much stuff should you make and how much should you charge for it?

0
1
2
3
4
5
6
7
8
0 8,000 16,000 24,000 32,000 40,000 48,000 56,000 64,000 72,000 80,000Quantity Q: pounds of Cheerios
Pric
e P:
dol
lars
per
pou
nd
Demand and WTP

Total costs (TC) Unit cost × quantity$2 × Q
Total revenue (TR) Price × quantityP × Q
Profit (TR − TC) P × Q − $2 × Q(P − $2) × Q

0
1
2
3
4
5
6
7
8
9
10
0 8,000 16,000 24,000 32,000 40,000 48,000 56,000 64,000 72,000 80,000
Pric
e P:
dol
lars
per
pou
nd
Quantity Q: pounds of Cheerios
$60,000$34,000$23,000$10,000
$0
Isoprofit curves (P − $2) × Q

Profit maximization
Feasible Set0
1
2
3
4
5
6
7
8
9
10
0 8,000 16,000 24,000 32,000 40,000 48,000 56,000 64,000 72,000 80,000
Pric
e, P
: dol
lars
per
pou
nd
Quantity, Q: pounds of Cheerios
$60,000$34,000$23,000$10,000$0Demand curveE


Popsicle Sticks, Inc.Sister company to XYZ Airlines, probably

SpecificationsSquares attached at all four corners using labels
Labels cannot be wider than sticks
Squares must be square when inspected
Labels must be cut with the scissors, not be torn
CostsTable rental: $1.00
Scissor rental: $0.50
Popsicle stick: $0.10
Label per corner: $0.05
Wage per active employee: $0.40

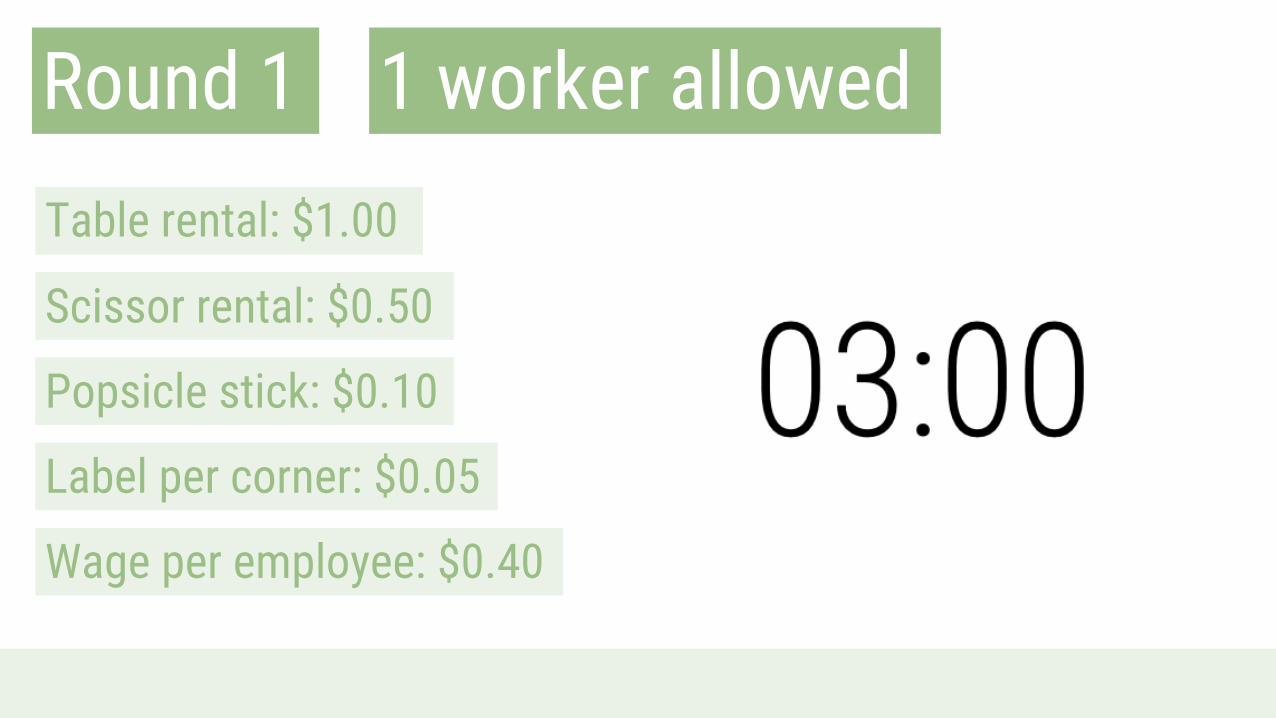
Round 1 1 worker allowedTable rental: $1.00
Scissor rental: $0.50
Popsicle stick: $0.10
Label per corner: $0.05
Wage per employee: $0.40
Round 1 1 worker allowedTable rental: $1.00
Scissor rental: $0.50
Popsicle stick: $0.10
Label per corner: $0.05
Wage per employee: $0.40

Round 2 2 workers allowedTable rental: $1.00
Scissor rental: $0.50
Popsicle stick: $0.10
Label per corner: $0.05
Wage per employee: $0.40

Round 2 2 workers allowedTable rental: $1.00
Scissor rental: $0.50
Popsicle stick: $0.10
Label per corner: $0.05
Wage per employee: $0.40

Round 3 Unlimited workers allowedTable rental: $1.00
Scissor rental: $0.50
Popsicle stick: $0.10
Label per corner: $0.05
Wage per employee: $0.40

Round 3 Unlimited workers allowedTable rental: $1.00
Scissor rental: $0.50
Popsicle stick: $0.10
Label per corner: $0.05
Wage per employee: $0.40

Round 4 Unlimited workers allowedTable rental: $1.00
Scissor rental: $0.50
Popsicle stick: $0.10
Label per corner: $0.05
Wage per employee: $0.40

Round 4 Unlimited workers allowedTable rental: $1.00
Scissor rental: $0.50
Popsicle stick: $0.10
Label per corner: $0.05
Wage per employee: $0.40

Round 5 Unlimited workers allowedTable rental: $1.00
Scissor rental: $0.50
Popsicle stick: $0.10
Label per corner: $0.05
Wage per employee: $0.40

Round 5 Unlimited workers allowedTable rental: $1.00
Scissor rental: $0.50
Popsicle stick: $0.10
Label per corner: $0.05
Wage per employee: $0.40

Fixed costs
Variable costs
Average costs
Cost function shape

Costs and profitMaking stuff costs money and affects profits

2000
2200
2400
2600
2800
3000
3200
3400
3600
3800
4000
30 32 34 36 38 40 42 44 46 48 50 52 54 56 58 60 62 64 66 68 70 72 74 76 78 80
Average cost
-2000
48000
98000
148000
198000
248000
1 3 5 7 9 11 13 15 17 19 21 23 25 27 29 31 33 35 37 39 41 43 45 47 49 51 53 55 57 59 61 63 65 67 69 71
Total cost of production, C(Q)
F
0
Quantity of cars, Q
Aver
age
cost
of p
rodu
ctio
nTo
tal c
ost o
f pro
duct
ion,
C(
Q)350,000
Quantity of cars, Q
0
A
Q0= 20
4,000
A
Q0= 20
C0 = 80,000
AC at A= slope of OA= C0/Q0= 4,000
Q1= 40
B
B
Q1= 40
3,400
AC at B= slope of OB = 3,400
Q2= 60
D
D
Q2= 60
3,600
AC at D= slope of OD= 3,600

2000
2500
3000
3500
4000
4500
5000
5500
6000
3032343638404244464850525456586062646668707274767880
Average cost
-2000
48000
98000
148000
198000
248000
1 3 5 7 9 11 13 15 17 19 21 23 25 27 29 31 33 35 37 39 41 43 45 47 49 51 53 55 57 59 61 63 65 67 69 71
F
0 Q2= 60
D
Quantity of cars, Q
D
A
Tota
l cos
t of p
rodu
ctio
n,
C(Q)
350,000
Quantity of cars, Q
0 Q2= 60
4,600
A
Q0= 20
C0 = 80,000
1ΔC
A
ΔC= 2,200
1
ΔCD
ΔC= 4,600
AC
MC6,000
Aver
age
and
mar
gina
l cos
ts
of p
rodu
ctio
n
3,400
Q1= 40
B
Q1= 40
ΔC= 3,400
Q0= 20
2,200

2000
2200
2400
2600
2800
3000
3200
3400
3600
3800
4000
30 32 34 36 38 40 42 44 46 48 50 52 54 56 58 60 62 64 66 68 70 72 74 76 78 80
A
Q0= 20 Quantity of cars, Q
Aver
age
and
mar
gina
l cos
ts
of p
rodu
ctio
n
4,000
2,000
0
MC
B
Q1= 40
D
Q2= 60
AC

Size and locationEconomies of scale
Economies of agglomeration
Network effects
Cost to make stuff goes down as you make more stuff
Cost to make stuff goes down as you clump together
Cost to make stuff goes down when everyone uses your stuff
(Dis-)

Long-run vs short-run costs
LRAC
SRAC

Costs and scale
Economies of scale
Constant returns to scale
Diseconomies of scale
LRAC
SRAC

Next time…Profit maximization without isoprofit curves
Elasticities, taxes, market power