first asareca general assemblyasareca/sites/default/files... · 8. role of extension, the regional...
TRANSCRIPT

Association for Strengthening Agricultural Research in Eastern and Central Africa
Feeding our region in the 21st century
First ASARECA General AssemblyVolume 2: Selected scientific and technical papers


Feeding our region in the 21st century
First ASARECA General AssemblyVolume 2: Selected scientific and technical papers

Disclaimer
This document has been produced with the assistance of the World Bank administered Multi Donor Trust Fund to ASARECA, financed by the European Union, the UK Department for International Development, the Canadian International Development Agency and the United States Agency for International Development. The contents of this document are the sole responsibility of ASARECA and her implementing partners and can in no way be taken to reflect the views of the contributors to the Trust Fund.
© 2013 ASARECA
[ASARECA] Association for Strengthening Agricultural Research in Eastern and Central Africa. Feeding our region in the 21st century: First ASARECA General Assembly, Volume 2: Selected scientific and technical papers: ASARECA: Entebbe, Uganda; 2013.
This publication may be reproduced with the intention of increasing its availability to those who need it. ASARECA encourages fair use of reproduced material. Proper citation is requested.
Association for Strengthening Agricultural Research in Eastern and Central Africa (ASARECA)PO Box 765, Plot 5, Mpigi RdEntebbe, UgandaTel: +256 41 4320212 / 4320556 / 4321885Tel: +256 41 4321126 / 4322593Email: [email protected]: www.asareca.org
ISBN 2978-92-95070-94-3 (pdf)
Edit / design: BluePencil Infodesign, Hyderabad, India (www.bluepencil.in)
Print: Pragati Offset Pvt Ltd, Hyderabad, India (www.pragati.com)

iii
Contents
Preface 1
Sub-theme I: Agricultural Development Challenges and Opportunities
1. Agricultural science, technology, and innovation: Feeding Eastern and Central Africa in the 21st century 4 Professor Calestous Juma
2. Managing current and future climate-induced risk in Eastern and Central African agriculture 15 K.P.C. Rao
3. The Emerging Impact of CAADP as a planning and partnership platform to accelerate growth and 33 poverty reduction among African countries – Ousmane Badiane
4. High and volatile food prices: Drivers and Impacts on food security in Eastern and Central Africa 53 Joseph Karugia
5. The role of mainstreaming gender in agricultural research and development, and its contribution 75 to feeding our region in the 21st century – Henry Manyire
6. Governance and oolicy imperatives for transformation of agriculture in Eastern Africa 89 Godber W.Tumushabe
7. Proven technologies for feeding the Eastern and Central African region 96 Morris W. Ogenga-Latigo
Sub-theme II: National and Regional Institutions Perspectives
8. Role of extension, the Regional Extension Association, and their strategic partners in feeding the region 110 in the 21st century – Silim M. Nahdy, Max Olupot, Kristin Davis and Eliot Zwane
9. The role of universities and their strategic partners in attaining food security in the Eastern and Central 121 Africa region in the 21st Century – Geoffrey C. Mrema
Sub-theme III: Advances in Research for Development: ASARECA Success Stories
10.Overcoming seed potato quality constraints to tackle food insecurity and poverty in Eastern and Central 142 Africa in the 21st century – Z.M. Kinyua, A. Bararyenya, E. Schulte-Geldermann, B.O. Obura, I.N. Kashaija, S. Tindimubona, F. Opio, D. Oyena, I. Rwomushana, W.M. Muriithi, J. Kinoti, P. Namugga, G. Kimoone, M. Inamahoro, N. Niko, P. Ndayihanzamaso
11.Genetic engineering of maize for drought tolerance in Eastern and Central Africa 148 Jesse Machuka, Richard Oduor, Steven Runo, Rasha Adam, Jonathan Matheka, Leta Bedada, Miccah Seth, Eric Kuria, Clet Masiga and Charles Mugoya
12. Utilization of beans for improved health and nutrition in Eastern and Central Africa – Michael Ugen 154
13. Evolution of policy harmonization and rationalization of the seeds sector in Eastern and Central Africa 161 Evans Sikinyi, Michael Waithaka, Miriam Kyotalimye

14. Promoting farmer-led seed enterprises of African indigenous vegetables to boost household incomes and 169 nutrition in Kenya and Tanzania – Daniel Karanja, Nasambu Okoko, Edwin Kiptarus, Paul Okongo, Silivesta Samali, Alphonce Katunzi, Hamis Mtwaenzi, Firoz Mwakitwange, Victor Afari-Sefa, Richard Musebe, Martin Kimani and Lydia Kimenye
15. Modern beekeeping as an enterprise for monetary benefits, environmental rehabilitation and biodiversity 177 conservation: A case study of Lushoto District, Tanzania – Kimaro D.N., G.E. Mbeyale, J.P. Hella, G.C. Kajembe, O. Semalulu and Mogaka, H.
16. Productivity and profitability of groundnuts with phosphorus fertilizer in Mbale district, Uganda – O. Semalulu, 194 V. Kasenge, P. Makhosi, R. Gita and C. Gumisiriza
17. Evaluating the potential of grain amaranth as a climate change adaptation strategy for rural communities in 206 East Africa: A case study of the western highlands of Kenya – G. Ayaga, R. Orlale, C. Esendi, D. Mutsotso
and O. Semalulu
18. Up-scaling of soil and water management technologies and drought-tolerant varieties for increased maize 215 productivity in the east and central Africa countries – HW Mwangi, F Mgonja, H Admassu, F Opio, I Rwomushana , J Karau, V Kimani
19. Improving capacity for agricultural research in Eastern and Central Africa: The SCARDA approach at ARC, Sudan 223 – K El-Siddig, J Methu, D Akishule, W Ekaya, S Chindime-Mkandawire, I Frempong, N Ojijo and T Chancellor
20. Presentation: Emerging issues underlying food insecurity in the ASARECA region – Prof. Joseph Mukiibi 230
21. ASARECA strategy regional challenges and opportunities in the context of the theme “Feeding our region 236 in the 21st century – Dr Seyfu Ketema, Executive Director, ASARECA

The Association for Strengthening Agricultural Research in Eastern and Central Africa (ASARECA) was established in 1994. It comprises eleven member countries: Burundi, Democratic Republic of Congo, Eritrea, Ethiopia, Kenya, Madagascar, Rwanda, South Sudan, Sudan, Tanzania and Uganda.
ASARECA is a sub-regional not-for-profit organisation whose mission is: To enhance regional collective action in agricultural research for development, extension, training and education to promote economic growth, fight poverty, eradicate hunger and enhance sustainable use of resources in Eastern and Central Africa (ECA). The mission commits to overcoming poverty and hunger in the ECA sub-region.
ASARECA sees improved delivery and impact of scientific knowledge, policy options and technologies as a powerful instrument to drive the sub-region towards meeting the Comprehensive African Agricultural Development Programme (CAADP), which is the agricultural agenda of the New Economic Partnership for African Development (NEPAD) and the Millennium Development Goals (MDGs).
ASARECA serves as a forum for promoting regional research and strengthening relations among National Agricultural Research System (NARS), in ECA, as well as with the Consultative Group for International Agricultural Research (CGIAR). ASARECA links agricultural research in the region to the political dialogue possible in COMESA, FARA and AU/NEPAD. It monitors political and institutional change in the global research system and represents member countries in such fora.
From December 14 to 16, 2011 ASARECA held its First General Assembly in Entebbe, Uganda, under the theme: Feeding our Region in the 21st Century. The Assembly follows the approval of ASARECA’s new Constitution in 2010, providing for the establishment of Patron Ministers and a General Assembly. These were established to offer strategic guidance to ASARECA in order to promote economic growth, fight poverty, eradicate hunger and enhance sustainable use of resources in Eastern and Central Africa.
The objectives of the General Assembly were to:• Create a forum for developing a shared vision and shared goals to enhance sustainable agriculture to bring
about economic growth and improved livelihoods in our region.• Introduce ASARECA; its strategic regional objectives, challenges, opportunities and successes to the Patron
Ministers and members of the General Assembly.• Provide an enabling environment for the General Assembly to play its oversight role in accordance to the
provisions of the Constitution and Governance Manual.• Receive from Patron Ministers and the General Assembly, in line with ASARECA’s mission, recommendations
and strategic guidelines in agricultural research for development, extension and agricultural training and education which will contribute to feeding our region in the 21st Century.
This second volume of proceedings presents a selection of scientific and technical papers that were presented at the First General Assembly. It is our wish that this information can contribute to further agricultural innovation and development in the ECA.
Dr. Seyfu KetemaExecutive Director, ASARECAFebruary 2002 – February 2013
1Preface
Preface


Sub-theme I
Agricultural development challenges and opportunities
4 First ASARECA General Assembly, Volume 2
1.1 Executive Summary
This paper was prepared to assist ASARECA advance its mission to promote the role of science and technology and innovation in feeding the region in the 21st century. ASARECA was established in 1994 and its member countries include Burundi, Democratic Republic of Congo, Eritrea, Ethiopia, Kenya, Madagascar, Rwanda, Sudan, Tanzania, and Uganda. Feeding the region will require fundamental reforms in the structure of agricultural research to bring innovation to bear on raising agricultural productivity. This can be achieved through systemic links between research, training, commercialisation, and extension. The region is dominated by fragmented approaches, where these functions are carried out in separate institutions often under different ministries with weak linkages between the functions and among the institutions.
The bulk of new agricultural knowledge is generated in national research institutes that have no teaching mandate except through sporadic partnerships with universities. Higher technical training, on the other hand, is carried out by universities that have limited research budgets and weak connections with farmers and the business community. Extension services that used to exist in government departments have virtually collapsed in most ECA countries. Commercialisation of agricultural research results in limited products and is often hampered by the lack of supportive policies, institutions, and financing. Emphasis by donor agencies on the role of NGOs has not served as a viable alternative to robust linkages between research and farming communities.
ECA countries have tried to address some of these chal-lenges by promoting collaboration between universities and research institutes. A common approach involves university students spending part of their time in research institutes. Other approaches include strength-ening agricultural research in universities, with a focus on post-graduate training as well on the creation of new agriculture departments and faculties. Although such incremental efforts are important and should be encouraged, the magnitude of the challenge facing the region requires new and bold efforts to improve the agricultural innovation system as part of the larger
agenda of enhancing the application of science, technology, and innovation to overall economic transformation.
There is an urgent need to create a new generation of innovation-oriented agricultural institu-tions that bring together in an efficient way agricultural research, training, commercialisation, and extension. There are at least three complementary options for achieving this. The first is to add research and extension components to existing agricultural universities. Some of this is already being done, but the scope is too limited and universities continue to focus more on degree training and less on research. These educational functions are needed and their quality should be improved.
The second option is to create a new generation of agricultural universities with the four functions as their core mission. This option could be pursued in countries that are in the process of expanding their higher education systems and creating new universities. This is not an option for many countries given the high costs involved. Private enterprises, especially large farms, could be encouraged to pursue this approach as part of their efforts to improve farm productivity and competitiveness. In addition, most ECA countries would find it politically difficult to justify such new investments given the low level of funding to regular universities and national research institutes.
The third option is to significantly upgrade the training, extension, and commercialisation functions of existing NARIs. This appears to be a more viable option because it would build on a strong research tradition, ongoing training efforts, connections with the private sector and farmers, and extensive international partnerships. Strengthening NARIs in this manner would also lay
1. Agricultural science, technology, and innovation: Feeding Eastern and Central Africa in the 21st century
Prof Calestous Juma

Agricultural science, technology, and innovation: Feeding ECA in the 21st century 5
the foundation for the emergence of the first generation of ECA research universities with an initial focus on agricultural innovation.
Achieving this goal will require considerable political commitment at the highest level of government. The efforts would need to be championed primarily by ministers responsible for agricultural research but will inevitably involve input from other ministers whose functions touch on education, finance, commerce, science and technology, and infrastructure. More fundamentally, the new agricultural institutes will serve as the loci for coordinating interactions between government, industry, academia, and relevant civil society in fostering innovation.
These institutions would need to function under incentive structures that would differentiate them from existing universities that focus on teaching. Their primary mission would be to foster agricultural innova-tion through research, training, commercialisation, and extension. The reforms needed to enable them to emerge as a new species of research and technical training insti-tutes may involve the adoption of new legislation.
Little innovation occurs without committed champions. Promoting the creation of the first generation of research universities in ECA will require dedicated advocates. Ministers responsible for agricultural research will need to play a leading role in the effort to upgrade NARIs so that they can serve as new centres for agricultural innovation. This advocacy will involve seeking political support, promoting policy and legislative reform, launching national pilot initiatives, rallying additional financial support, strengthening regional and international partnerships, and recognising and rewarding agricultural innovation.
The proposal laid out here is not aimed at advancing agricultural research at the expense of other sections of the economy. To the contrary, it seeks to kick-start a process by which ECA can achieve the larger goal of bringing science, technology, and innovation to bear on long-term economic transformation. Ideally, the legislative framework created for upgrading national agricultural institutes should set out incentives that could also benefit other research-oriented agricultural universities.
Furthermore, the framework would also be used to promote similar efforts in fields such as industry and services. In this regard, the creation of agricultural innovation universities would serve as a starting point into the broader efforts by ECA countries to strengthen
the role of science, technology, and innovation in economic transformation. This initiative is not a trigger for institutional rivalry; it is paving a new path for the future of ECA.
1.2 Introduction
The aim of this paper is to assist ASARECA in its its mission to promote the role of science and technology and innovation in feeding the region in the 21st century. ASARECA was established in 1994 and its member countries include Burundi, Democratic Republic of Congo, Eritrea, Ethiopia, Kenya, Madagascar, Rwanda, Sudan, Tanzania, and Uganda.1
The paper is written in keeping with earlier calls on “ASARECA to explore…the possibility of establishing a network that deals specifically with institutional innovation issues in agricultural research and innovation systems. There is also a pressing need for African agricultural research organisations to develop expertise in institutional innovation to complement their expertise in technological innovation.”2 The paper seeks to give effect to the pillar on “agricultural research, technology dissemination and adoption” of CAADP, which aims to achieve accelerated gains in productivity. More specifically, CAADP envisaged that achieving such accelerated productivity gains will require:
“(a) an enhanced rate of adoption for the most promising available technologies, to support the immediate expansion of African production through the more efficient linking of research and extension systems to producers; (b) technology delivery systems that rapidly bring innovations to farmers and agribusinesses, thereby making increased adoption possible, notably through the appropriate use of new information and com-munication technologies; (c) renewing the ability of agricultural research systems to efficiently and effectively generate and adapt new knowledge and technologies, including biotechnology, to Africa, which are needed to increase output and productivity while conserving the environment;
1. For a comprehensive review of ASARECA member states, see S. Ketema and H. Elliot, Introduction to the History, Evolution and Status of the National Agricultural Institutes of the ASARECA Member Countries (Entebbe, Uganda: Association for Strengthening Agricultural Research in Eastern and Central Africa, 2008).
2. S. Chema, E. Gilbert, and J. Roseboom, A Review of Key Issues and Recent Experiences in Reforming Agricultural Research in Africa (The Hague: International Service for National Agricultural Research, 2003), p. xii.

6 First ASARECA General Assembly, Volume 2
and (d) mechanisms that reduce the costs and risks of adopting new technologies.”3
The paper argues that feeding the region will require fundamental reforms in the structure of agricultural research to bring science and technology to bear on raising agricultural productivity. This can be achieved by creating a new generation of innovation-oriented agricultural institutions that strengthen linkages between research, training, commercialisation, and extension services.
The paper calls for upgrading the training, extension, and commercialisation functions of existing NARIs. The efforts would build on the institutes’ strong research tradition, ongoing training efforts, connections with the private sector and farmers, and extensive international partnerships. Strengthening NARIs in this manner would also lay the foundation for the emergence of the first generation of research universities in ECA with an initial focus on agricultural innovation.
To advance the argument, the paper is divided into four sections. • The first section provides background information
on the status of agriculture in Africa in general and ECA in particular.
• The second section stresses on the connections between agricultural transformation and overall economic growth, with specific reference to the role of science, technology, and innovation. This section draws from the experiences of the Green Revolution to underscore the importance of research in agricultural productivity improvement. The section suggests that ECA countries will need to adopt different institutional arrangements that reflect today’s challenges and opportunities.
• The third section outlines the challenges or institutional fragmentation and offers options for upgrading NARIs so that they can serve as loci for agricultural innovation. The emphasis of the section is to create a foundation for the emergence of Africa’s first generation of innovation universities using agriculture as a starting point. The section also provides elements of such innovation universities drawing from other inspirational models.
• The final section of the paper outlines specific options for action needed to achieve the objectives
3. New Partnership for Africa’s Development (NEPAD), Comprehensive Africa Agriculture Development Programme (CAADP)(Midrand, South Africa: NEPAD, 2003), p. 3.
laid out in the paper. The measures include identification of political champions; seeking support through regional and continental bodies; initiating pioneering national pilots; reforming national legislation; mobilising financial resources; and strengthening international partnerships.
1.3 Feeding ECA in the new millennium
The state of African agriculture
In sub-Saharan Africa, agriculture directly contributes to 34 of GDP and 64% of employment. Growth in agriculture is at least two to four times more effective in reducing poverty than other sectors. It also stimulates productivity in other sectors such as food processing. Agricultural products also compose about 20% of Africa’s exports. Given these figures, it is no surprise that agricultural research and extension services can yield a 35% rate of return, and irrigation projects a 15–20% return in sub-Saharan Africa.4
Even before the global financial and fuel crises hit, hunger was increasing in Africa. In 1990, over 150 million Africans were hungry; as of 2008, the number had increased to nearly 250 million. Starting in 2004, the proportion of undernourished began increasing, reversing several decades of decline, prompting 100 million people to fall into poverty. One-third of the people in sub-Saharan Africa are chronically hungry – many of whom are smallholder farmers. High food prices in local markets exclude the poorer consumers—forcing them to purchase less food and less nutritious food, as well as to divert spending from education and health, and to sell their assets. This debilitating cycle is self-perpetuating.
Gender gaps are a major concern in ECA countries. Agricultural productivity in the region could increase by 10 to 20% if such gaps were reduced both in school and in the control of agricultural resources. In addition to this critical gender dynamic, the rural-urban divide is also a key component of the agricultural and economic picture. Over 50% of the people in the region living in rural areas are poor, and reductions in rural poverty typically drive reductions in national poverty levels.
Over the last 25 years, growth in agricultural GDP in the region has averaged approximately 3% but has varied significantly among countries. Growth per
4. World Bank, World Development Report, 2008 (Washington, D.C.: World Bank, 2008), pp. 40–41.

Agricultural science, technology, and innovation: Feeding ECA in the 21st century 7
capita, a proxy for farm income, was basically zero in the 1970s and negative from the 1980s into the 1990s. Six countries experienced negative per capita growth. As such, productivity has been basically stagnant over 40 years—despite significant growth in other regions, particularly Asia, thanks to the Green Revolution. Different explanations derive from a lack of political prioritisation, underinvestment, to ineffective policies. The financial crisis has exacerbated this underinvestment, as borrowing externally has become more expensive, credit is less accessible, and foreign direct investment has declined.
Only 4% of Africa’s crop area is irrigated, compared to 39% in South Asia. Much of rural Africa lacks passable roads, translating to high transportation costs and trade barriers. Cropland per agricultural population has been decreasing for decades. Soil infertility is a result of the degradation: nearly 75% of the farmland is affected by the excessive extraction of soil nutrients.
Fertiliser use in Africa is less than 10% t of the world average of 100 kg. Just five countries (Ethiopia, Kenya, Nigeria, South Africa, and Zimbabwe) account for about two-thirds of the fertilisers consumed in Africa. On an average, sub-Saharan African farmers use 13 kg of nutrients per hectare of arable and permanent cropland, whereas the rate in the Middle East and North Africa is 71 kg. Part of the reason why fertiliser usage is so low is because of the high costs of imports and transportation: fertiliser prices in Africa are two to six times the average world price. This results in low usage of improved seed: as of 2000, about 24% of the cereal-growing area used improved varieties, compared to 85% in East Asia and the Pacific. As of 2005, 70% of the area under wheat cultivation and 40% of the area under maize cultivation used improved seeds – a significant improvement.
Africa’s farm demonstrations show significantly higher average yields compared to national yields. For example, Ethiopia’s maize field demonstrations yield over five tons per hectare compared to the national average of two tons per hectare for a country plagued by chronic food insecurity. This potential will only be realised as Africans access existing technologies and discover their own. More specifically, African countries will need to rethink how they position their universities and other institutions of higher learning as agents of agricultural innovation.
ECA region
ASARECA was established in September 1994.5 The 10 member countries cover an area of 8.5 million square km with a total population of more than 280 million people, most of whom are rural dwellers pursuing agricultural livelihoods. Roughly one-third – 300 million hectares – of the total land area is devoted to agricultural use. Agriculture is, therefore, the most common occupation in ECA, and it looms large in national economies throughout the region. Overall, agriculture accounts for 43% of the regional GDP.
Given that the bulk of the region’s population resides in the rural areas and depends on agriculture for income and sustenance, and given the low levels of productivity growth in the sector, hunger and malnutrition have deepened in ECA in recent years. The picture that emerges is, therefore, one of a region comprising countries progressively less able to meet the needs of their burgeoning populations.
With agriculture looming so large in most national economies, sluggish growth in agricultural productivity has translated into sluggish overall growth and generally low per capita income levels. High levels of agricultural importation – particularly of staples – appear to be only partially filling the consumption needs of a population lacking purchasing power, resulting in high levels of adult and child malnutrition and towering child mortality rates.
The central objective of this paper is to outline strategies for fostering the role of science, technology, and innovation in meeting food security objectives for ECA. The paper seeks to achieve this goal in two ways. First, it highlights the current status, identifies key challenges, and outlines opportunities for advancing the application of agricultural science and technology to meet the food needs of the region. Second, it provides information that will help to foster debate on how best to meet those objectives.
This paper is guided by the view that efforts to promote the application of science and technology to agriculture are part of the larger agenda of leveraging science and technology for development. The agricultural sector is a strategic starting point in the efforts to use science, technology, and innovation for overall economic transformation, and the lessons learned as well as the policy and institutional arrangements created to foster change in agriculture will apply to the other sectors as well.
5. See Ketema and Elliot, Introduction to the History, Evolution and Status of the National Agricultural Institutes of the ASARECA Member Countries.

8 First ASARECA General Assembly, Volume 2
1.4 Agricultural science, technology, and innovation
Agriculture and economic growth
Agriculture and economic development are intricately linked. It has been aptly argued that no country has ever sustained rapid economic productivity without first solving the food security challenge.6 Evidence from industrialised countries as well as rapidly developing countries indicates that more productive agriculture stimulated growth in the non-agricultural sectors and supported overall economic well being. Economic growth originating in agriculture can significantly contribute to reductions in poverty and hunger. Increasing employment and incomes in agriculture stimulates demand for non-agricultural goods and services, boosting non-farm rural incomes as well.7
Much of our understanding of the linkages between agriculture and economic development has tended to use a linear approach. Under this model, agriculture is seen as a source of input into other sectors of the economy. Resources, skills, and capital are presumed to flow from agriculture to industry. In fact, this model is a central pillar of the “stages of development” that treat agriculture as a transient stage toward industry phases of the economy.
This linear view is being replaced by a more sophisticated outlook that recognises the role of agriculture in fields such as “income growth, food security and poverty alleviation; gender empowerment; and the supply of environmental services”.8 A systems view of economic evolution suggests continuing interactions between agriculture and other sectors of the economy in ways that are mutually reinforcing.9 Indeed, the relationship between agriculture and economic development is interactive and associated with uncertainties that defy causal correlation.
6. C. Peter Timmer, “Agriculture and Economic Development,” in Bruce L. Gardner and Gordon C. Rausser, eds., Handbook of Agricultural Economics, Vol. 2A: Agriculture and Its External Linkages (London: Elsevier, 2002), pp. 1487–1546.
7. Prabhu Pingali, “Agricultural Growth and Economic Development: A View through the Globalization Lens,” Agricultural Economics, Vol. 37, No. s1 (December 2007), pp. 1–12.
8. Prabhu Pingali, “Agriculture Renaissance: Making ‘Agriculture for Development’ Work in the 21st Century,” in Robert E. Evenson and Pingali, eds.,Handbook of Agricultural Economics, Vol. 4 (London: Elsevier, 2010), pp. 3867–3894.
9. Mary Tiffen, “Transition in Sub-Saharan Africa: Agriculture, Urbanization and Income Growth,” World Development, Vol. 31, No. 8 (August 2003), pp. 1343–1366.
Research and agricultural productivity
The Green Revolution continues to be a subject of considerable debate. Its impact on both agricultural productivity and reductions in consumer prices, however, can hardly be disputed. Much of the debate over the impact of the Green Revolution ignores the issue of what would have happened to agriculture in developing countries without it. On the whole, without international research in developing countries, yields in major crops would have been higher in industrialised countries by up to 4.8%. This is mainly because lower production in the developing world would have pushed up prices and given farmers in industrialised countries incentives to boost their production.
It is estimated that crop yields in developing countries would have been up to 23.5% lower without the Green Revolution, and equilibrium prices would have been between 35% and 66% percent higher in 2000. But, in reality, prices would have remained constant or risen marginally in the absence of international research, mainly because real grain prices actually dropped by 40% from 1965 to 2000.10
Higher world prices would have led to the expansion of cultivated areas, with dire environmental impacts. Estimates suggest that crop production would have been up to 6.9% higher in industrialised countries and up to 18.6% lower in developing countries. Over the period, developing countries would have had to increase their food imports by nearly 30% to offset the reductions in production.
Without international research, calorific intake in developing countries would have dropped by up to 14.4% and the proportion of malnourished children would have increased by nearly 8%. Put differently, the Green Revolution helped to raise the health status of up to 42 million preschool children in developing countries.11 It is not a surprise that ECA countries and the international community continue to seek to emulate the Green Revolution or recommend its variants as a way to meet current and future challenges. More important, innovation-driven agricultural growth has pervasive, economy-wide benefits as demonstrated through India’s Green Revolution. Studies on regional growth linkage have shown strong multiplier effects
10. R.E. Evenson and D. Gollin, “Assessing the Impact of the Green Revolution, 1960–2000,” Science, May 2, 2003, pp. 758–762.
11. Ibid.

Agricultural science, technology, and innovation: Feeding ECA in the 21st century 9
from agricultural growth to the rural, non-farm economy.12
It is for this reason that agricultural stagnation is viewed as a threat to prosperity. Over the last thirty years, agricultural yields and the poverty rate have remained stagnant in ECA countries. Prioritising agricultural development could yield significant, interconnected benefits, particularly in: achieving food security and reducing hunger; increasing incomes and reducing poverty; advancing the human development agenda in health and education; and reversing environmental damage.
1.5 Challenges and opportunities for institutional innovation
Institutional fragmentation
The challenges facing African agriculture will require fundamental changes in the way universities train their students. It is notable that most African universities do not specifically train agriculture students to work on farms in the same way medical schools train students to work in hospitals. Part of the problem arises from the traditional separation between research and teaching – the former is carried out in national research institutes and the latter in universities. There is little connection between the two in most ECA countries.
There are two main reasons for this separation and the associated fragmentation. Africa established colonial research institutes before it created universities. The main function of the research institutes was to serve colonial agricultural objectives and not to build local scientific and technological capabilities or foster local entrepreneurship.
The first generation of ECA universities were designed to prepare young Africans for public service and, as a result, focused largely on the social sciences and humanities. By the time universities were being established, the European tradition of separating research from education was already in place. This separation found expression in distinct laws as well as in ministries. This approach, also expressed in ministerial separation, is more evident in former British colonies than in Francophone countries.
The second reason for the separation is legislative continuity and emulation. ECA countries continued the
12. Peter B.R. Hazell, “An Assessment of the Impact of Agricultural Research in South Asia since the Green Revolution,” in Evenson and Pingali, Handbook of Agricultural Economics, Vol. 4, pp. 3469–3530.
same tradition partly because their economic structures did not create much demand for locally generated knowledge except in fields such as agriculture. ECA countries continued to reproduce the structure despite the fact that it did not appear to reflect local realities. For example, much of the research cooperation between foreign universities is conducted through national research institutes. This hampers the ability of ECA countries to foster stronger international university-to-university partnerships.
The fragmentation was worsened by two additional factors. First, agricultural extension services that used to exist in agricultural ministries collapsed in the 1980s largely because of cut-backs in public expenditure. Second, there are no major efforts aimed at commercialising local research results. The absence of extension support and lack of mechanisms that foster commercialisation have left NARIs considerably isolated and undermined their ability to promote innovation.
Opportunities for creating universities for agricultural innovation
The NARIs in the ECA region operate a large number of research programmes that provide a strong basis for building new initiatives aimed at upgrading their innovative capabilities. In effect, what is needed is to strengthen the educational, commercialisation, and extension functions of the NARIs.
More specifically, clustering these functions would result in dedicated research universities whose curriculum would be modelled along full value chains of specific commodities. For example, innovation universities located in proximity to coffee production sites should develop expertise in the entire value chain of the industry. This could be applied to other crops as well as to livestock and fisheries. Such dedicated universities would not have a monopoly over specific crops but would serve as opportunities for learning how to connect higher education to the productive sector.
Internally, the new universities should redefine their academic foci to adjust to the changes facing the region. This can be better done through continuous interaction with farmers, businesses, government, and civil society organisations. Governance systems that allow for such continuous feedback to universities will need to be established. The reform process must include specific measures. First, the universities for agricultural innovation need a clear vision and strategic plans for training future agricultural leaders with a

10 First ASARECA General Assembly, Volume 2
focus on practical applications. Such plans should include comprehensive roadmaps on moving research from the laboratory to the marketplace. They also need to define how to best recruit, retain, and prepare future graduates. These plans should be prepared in partnership with key stakeholders.
Second, the new universities need to improve their curricula to make them relevant to the communities in which they are located. More important, they should serve as critical hubs in local innovation systems or clusters. The recent decision by Moi University in western Kenya to acquire an abandoned textile mill and revive it for teaching purposes is an example of such an opportunity. Such connections can be fostered without owning the facilities. For example, breweries and distilleries can play key roles in offering opportunities for training in fields such as biotechnology and allied fields.
Many of the NARIs are located in the proximity of a wide range of productive facilities with which they can foster long-term working relations. They can also branch into new knowledge-based fields. For example, NARIs located close to breweries can build up expertise in biotechnology using fermentation knowledge as a foundation. Similar arrangements can be created with other agro-based industries such as sugar mills and fish factories.
Third, the universities should give students more opportunities to gain experience outside the classroom. This can be done through traditional internships and research activities. But the teaching method could also be adjusted so that it is experiential and capable of imparting direct skills. More important, such training should also include the acquisition of entrepreneurial skills and other forms of experiential learning.
Fourth, NARIs have extensive programmes that involve working directly with farmers. This outreach is a large part of their mandate and efforts to reach farming communities. A “reverse outreach” approach under which farmers and entrepreneurs can selectively participate in “open classroom” programmes would help to strengthen extension services. Under the “open classroom” approach farmers and entrepreneurs would join classes of their choice as participants. This would give faculty and students an opportunity to interact with farmers in a classroom setting.
Fifth, in addition to degree courses, universities for agricultural innovation will also need to extend their reach into the sphere of vocational training. This can
be done directly through various programmes such as “farmer schools” or in conjunction with high schools. The link with high schools and other educational institutions is particularly important considering the region’s demographic structure. In most parts of the region, the majority of the population is in school, which makes educational institutions an integral part of the community.
Sixth, yet another way to facilitate the transfer of knowledge from universities to farming communities is through internships and community service. These activities should be structured so that they are part of the academic calendar. They would serve two main purposes. The first would be to transfer knowledge from universities to farmers. Second, returning students would bring back to the university feedback and lessons that could be used to adjust the curriculum, pedagogy, and interactions with farmers.
Seventh, one of the main teaching missions of universi-ties for innovation is to translate ideas into goods and services through enterprise development. Training young people to learn how to create enterprises should therefore be part of the mission of such universities. This can be done in partnership with financial institu-tions such as banks, cooperatives, and microfinance organisations. Such activities may also lay the founda-tion for the emergence of rural-based angel funding or venture capital facilities. Similarly, sources of support such as rural development funds could be redirected to help translate ideas from such universities into new enterprises.
Eighth, continuous faculty training and research are critical for maintaining high academic standards. The new universities should invest more in undergraduate agricultural educators to promote effective research and teaching and to design new courses. Researchers at NARIs would only need minimum training to acquire the necessary pedagogical skills. In fact, many of them are involved in extensive field training activities and so they already teach even though they are not university lecturers. Additional support to the NARIs can be provided by education departments in existing universities. Where needed, teacher-training institutes could create special courses aimed at offering training in experiential pedagogy.
Ninth, providing tangible rewards and incentives to teachers for exemplary teaching raises the profile of teaching and improves education. Furthermore, establishing closer connections and mutually beneficial

Agricultural science, technology, and innovation: Feeding ECA in the 21st century 11
links between all stakeholders (academia and industry, including private and public institutions, companies, and sectors) should generate further opportunities for everyone.
1.6 In search of institutional models
Learning from others
There are numerous models that ECA countries could learn from when exploring how to make universities more relevant to agriculture. The land grant system originally developed in the United States is being reinvented around the world to address analogous challenges. One of the most pioneering examples in curriculum reform is EARTH University in Costa Rica, which was created through an endowment provided by USAID and the WK Kellogg Foundation. Its curricu-lum is designed to match the realities of agribusiness. The university dedicates itself to producing a new generation of agents of change who focus on creating enterprises rather than on seeking jobs.
EARTH University emerged in a context that mirrors today’s Africa: economic stagnation, high unemployment, ecological decay, and armed conflict. Inspired by the need for new attitudes and paradigms, EARTH University was created in 1990 as a non-profit, private, international university dedicated to sustainable agricultural education in the tropics. It was launched as a joint effort between the private and public sectors in the United States and Costa Rica. The Kellogg Foundation provided the original grant for a feasibility study at the request of a group of Costa Rican visionaries.
Based on the study, USAID provided the initial funding for the institution. The original mission of the university was to train leaders to contribute to the sustainable development of the humid tropics and to build a prosperous and just society. Located in the Atlantic lowlands of Costa Rica, EARTH University admits about 110 students a year and has a total student population of about 400 from 24 countries (mainly in Latin America and the Caribbean) and faculty from 22 countries. Through its endowment, the university provides all students with 50% of the cost of tuition, room, and board.
In addition, the university provides scholarships to promising young people of limited resources from remote and marginalised regions. Nearly 80% of the students receive full or partial scholarship support. All students live on campus for four intensive years. EARTH University has developed an innovative, learner-centred, and experiential academic programme that includes
direct interaction with the farming community.11 Its educational process stresses the development of attitudes necessary for graduates to become effective agents of change. They learn to lead, identify with the community, care for the environment, and be entrepreneurial. They are committed to lifelong learning. Within the curriculum, there are four activities in particular that embody EARTH University’s experiential approach to learning. 1. Gaining work experience and advancing com-
munity service This activity is undertaken by all first-, second-,
and third-year students and continues in the fourth year as the professional experience course. In the first and second years, students work in crop, animal, and forestry production modules on EARTH University’s 3,300 ha farm. In the first year, the work is largely a routine activity and the experience centres on the acquisition of basic skills, work habits, general knowledge, and familiarity with production.
2. Gaining professional experience In the second year, the focus changes to
management strategies for these same activities. Work Experience is later replaced with Professional Experience. In this course, students identify work sites or activities on campus that correspond with their career goals. Students are responsible for contacting the supervisors of the campus operations, requesting an interview, and soliciting “employment”. Upon agreement, supervisors and students develop a joint work plan that the student implements, dedicating a minimum of 10 hours per week to the “job”. The second activity is an extension of the Work Experience course. Here third-year students work on an individual basis with small, local producers on their farms. They also come together in small groups under the community outreach programme, which is integral to the learning system. Community outreach is used to develop critical professional skills in students, while at the same time helping to improve the quality of life in nearby rural communities.
3. Focusing on experiential learning and internships The third-year internship programme emphasises
on experiential learning. The 15-week internship is required for all students in the third trimester of their third year of study. It is an opportunity for them to put into practice all that they have learned during their first three years of study. For many

12 First ASARECA General Assembly, Volume 2
of them, it is also a chance to make connections that may lead to employment after graduation. The international character of the institution grants many students the opportunity to follow their interests, even when they lead to internship destinations other than in their home country.
4. Sharpening entrepreneurial skills The fourth activity is the Entrepreneurial Projects
programme. EARTH University’s programme promotes the participation of its graduates in the private sector as a critical means by which the institution can achieve its mission of contributing to the sustainable development of the tropics. The development of small and medium-sized enterprises (SMEs) is a powerful way to create new employment and improve income distribution in rural communities.
For this reason, the university stresses the development of entrepreneurial spirit and skills. Courses in business administration and economics, combined with practical experience, prepare the students to engage in business ventures upon graduation. This course provides students the opportunity to develop a business venture from the beginning to the end during their first three years. Small groups of four to six students from different countries decide on a relevant business activity. They conduct feasibility studies (using financial, social, and environmental criteria), borrow money from the university, and implement the venture. This includes marketing and selling the final product. After repaying their loan, with interest, the group shares the profits.
This entrepreneurial focus has permeated all aspects of the university’s operations. It prepares students to become job creators and agents of change rather than job seekers. About 17% of the university’s 1,100 graduates run their own businesses. The university also manages its own profitable agribusiness, which has strong links with the private sector. When the university acquired its campus, it decided to continue operating the commercial banana farm located on the property. Upon taking over the farm, the university implemented a series of measures designed to promote more environmentally sound and socially responsible production approaches.
Going global
EARTH University has internationalised its operations. It signed an agreement with U.S.-based Whole Foods Market to be the sole distributor of bananas in their stores. The university also sells other agricultural
products to the US market. This helps to generate income for the university and small farmers while providing an invaluable educational opportunity for the students and faculty. In addition to internships, students have access to venture capital upon graduation. The university uses part of the income to fund sustainable and organic banana and pineapple production research.
Over the years, the university has worked closely with African institutions and leaders to share its experiences. Following nearly seven years of study through workshops, discussions, training courses, and site visits, African participants agreed on the importance of reforms in their own university systems, especially through the creation of new agricultural universities along the lines of the EARTH model. The case of EARTH University is one of many examples around the world involving major collaborative efforts between the US and ECA countries to disseminate and use scientific and technical knowledge to improve welfare through institutional innovations. Such experiences, as well others from Africa and around the world, offer a rich fund of knowledge that should be harnessed for agricultural development and economic growth in ECA region.
1.7 Breaking new ground
Many models show how to focus on agricultural training as a way to improve practical farming activities. Ministries of agriculture and farming enterprises in ECA countries should create entrepreneurial universities, polytechnics, and vocational schools that address agricultural challenges. Such institutions could link up with counterparts in developed or emerging economies as well as institutions providing venture capital and start to serve as incubators of rural enterprises. Establishing such institutions will require reforming the curriculum, improving pedagogy, and granting greater management autonomy. They should be guided by the curiosity, creativity, and risk-taking inclination of farmers.
Identifying champions
The first step in upgrading agricultural research institutes involves the identification of a “concept champion”. Constituencies of ministers and other leaders of ASARECA already include people who can serve as champions and advocates for upgrading NARIs into new universities for agricultural innovation. The concept champion will be essential in advancing the ideas at the national, regional, and international levels.

Agricultural science, technology, and innovation: Feeding ECA in the 21st century 13
Champions will take responsibility for exploring the political feasibility of translating the ideas laid out in this paper into practical action. Much of their work will involve seeking broad political support at the national and regional levels.
Promoting policy and legislative reform
The process of creating universities for agricultural innovation will require supportive policies and possible legislative reform. The policy framework for such actions may already exist in national and regional strategies for agricultural transformation. These policies derive their authority from continental guidelines such as CAADP that stress the importance of investing in agricultural research.
New legal instruments may need to be put in place to foster the creation of new research-oriented universities. There are several ways to approach this depending on available opportunities. The first is to introduce amendments in existing laws to provide for universities for agricultural innovation that include research, training, commercialisation and extension. The changes can be made to existing laws on higher education, science and technology, research or agriculture. The second approach would be to introduce new laws creating a separate regime, which can be managed by ministries responsible for agriculture in cooperation with higher education authorities. In some cases, it may be sufficient to introduce regulations that govern the management of universities for innovation under existing laws without legislative reform. The key element of such laws and regulations would be to grant sufficient autonomy to the new institutions while fostering excellence in research and practice. Policies and laws for such universities should be written in an inclusive way so that other institutions – whether private or public – that meet the established criteria can be designated as universities for innovation.
Building innovation management capacity
The creation and implementation of universities for innovation will require a cadre of people with expertise in innovation management. This can be achieved through education offered to high-level leaders responsible for policy promotion as well as the ultimate implementation of the agricultural innovation system. Such courses could be offered in conjunction with institutions such as the Harvard Kennedy School, which offers executive courses like “Innovation for Economic Development”, which are tailored to specific
institutional or country needs. In the long run, such courses should be part of the curriculum of the new universities and should be required for those seeking to work as innovation managers.
Initiating national pilots
One of the roles of the concept champions identified above will be to pilot the idea at the national level. The purpose of the pilot initiatives will be to create a basis for learning about how best to advance the idea of universities of agricultural innovation. The pilots will be carefully chosen to maximise the chances of success and not necessarily to determine the viability of the idea. The lessons learned from the execution of the pilots will be regularly shared by ECA countries. Ideally, a committee of ASARECA should be set up for purposes of monitoring implementation and liaising with national and regional bodies responsible for advancing agricultural research and higher education.
Mobilising additional financial resources
Financing is probably one of the most contentious issues in the region’s history of research and higher education. The perceived high cost of running institutions of higher learning has contributed to the dominant focus on primary education. This policy, however, has prevented leaders from exploring avenues for supporting higher technical education. Creating incentives for domestic mobilisation of financial resources is essential for leveraging external support.
There is a wealth of knowledge from around the world on how to finance innovation, which can be leveraged to help ECA countries identify the diversity of available approaches. These include public as well as private funding. A comprehensive review of known options needs to be undertaken as a matter of urgency.
Strengthening regional and international partnerships
It is important to establish regional and international partnerships among various institutions to support and develop joint programmes. These partnerships should pursue horizontal relationships and open networking to generate more synergy and collaboration, encourage sharing of resources, and foster the exchange of students and faculty. This can be accomplished through regional exchanges that involve the sharing of research facilities and other infrastructure. Such collaboration could be extended to include international partners through mechanisms such as the Open Courseware Consortium, a free and open digital publication of educational

14 First ASARECA General Assembly, Volume 2
materials organised as courses. The consortium includes open educational content from 200 higher education institutions and associated organisations. Its mission is to advance education and empower people worldwide through open courseware.
The advent of broadband internet through investments in fibre optic cables offers additional opportunities for the new universities to become part of the global knowledge ecology. Many universities around the world are offering online courses and are using internet connectivity to extend their reach to the developing world. Governments and private enterprises can help strengthen these linkages by facilitating access to broadband facilities.
Recognising innovation and rewarding excellence
The tasks laid out above will take considerable dedication, courage and commitment. Such efforts need to be recognised and rewarded. One way to do so is to institute an agricultural innovation prize for outstanding contributions to strengthening agricultural research in ECA countries. The prizes would recognise achievements in research, teaching, commercialisation and extension. The announcement of the winners could be spread over four days at a defined period. The award ceremony would be held in conjunction with ASARECA annual meetings. The host head of state or other senior government official could preside over the ceremony.
1.8 Conclusion
CAADP is nearly a decade old. Since its adoption in 2003, much of the discussion has focused on the proportion of national budgets devoted to agriculture in general and agricultural research in particular. Although financial resources are critical and require special attention, efforts to reform Africa’s agricultural innovation system deserve equal attention.
Over the last decade, considerable work has been done to redefine the role of government in agricultural research, decentralise research activities, increase stakeholder
participation, identify new financial instruments, and strengthen system-wide linkages. These measures have been purposed on an incremental basis. They have indeed yielded commendable results. The next challenge, however, is to build on these achievements and pursue bold steps aimed at upgrading the status and performance of agricultural institutes by creating genuine innovation systems that involve research, training, extension, and commercialisation. This process will be non-trivial and will require bold political action involving high-level leaders. The efforts will come with political risks and debate. Maintaining the status quo, however, is riskier than experimenting with new models. Mistakes will be made. But as Albert Einstein said, “Anyone who has never made a mistake has never tried anything new”.
About the author
Calestous Juma is an internationally recognised authority on the role of innovation in economic development. He is Professor of the Practice of International Development and Director of the Science, Technology, and Globalisation Project at Harvard Kennedy School. He also directs the School’s Agricultural Innovation in Africa Project funded by the Bill and Melinda Gates Foundation. Juma teaches graduate courses on “Innovation, Development and Globalisation” and “Technology and Sustainability” as well as holds an undergraduate seminar on “Biotechnology, Sustainability and Public Policy”. He holds a DPhil in science and technology policy studies from the University of Sussex (UK) and has received several international awards and honorary degrees for his work on sustainable development. In 2007, he was awarded the honour of the Elder of the Order of the Burning Spear by the President of Kenya for his work on “assisting governments to solve diplomatic problems”. He is editor of the peer-reviewed International Journal of Technology and Globalisation and the International Journal of Biotechnology. His latest book, The New Harvest: Agricultural Innovation in Africa, was published in 2011 by Oxford University Press. Juma is currently working on a book on socioeconomic sources of resistance to new technologies.
Managing current and future climate-induced risk in ECA agriculture 15
Abstract
Agriculture, the mainstay of economies of all countries in ECA, continues to remain underdeveloped with inadequate adoption of yield-enhancing technologies, inefficient with low levels of productivity and uncompetitive in a rapidly globalising world. Farmers continue to prefer to use conventional techniques involving low level of investments over improved technologies that led to the Green Revolution in other regions of the world. One of the main reasons for the low levels of adoption of improved technologies is that agriculture in the region is predominantly rain fed and hence highly vulnerable to uncertain and erratic distribution of rainfall.
Rainfall during the crop season, especially in the semi-arid areas, varies from about one-third to two-and-a-half times the normal amounts, creating vastly different seasons with different possibilities. Analysis of long-term historical climatic data indicates that the region experiences cycles of wet and dry periods that are closely linked to cycles in the El Niño-Southern Oscillation (ENSO) phenomenon. The entire region, with the exception of Sudan, records above normal rainfall during El Nino years. An increasing trend in temperature is noticed in all the months and in the annual mean minimum and maximum temperatures. The observed rate of increase in temperature compares well with those reported by the Intergovernmental Panel on Climate Change (IPCC) in its fourth assessment report. According to IPCC, the region will be warmer by about 3.20C and will receive 11% more rainfall by end of the century.
Though there are problems in predicting accurately where, when and by how much the climate changes, there is general consensus that rainfall will be more variable with increased frequency of occurrence of extreme vents. The current variability and projected changes will have significant negative impact on agriculture through changes in the growing environment and in other parameters such as nutrient and water availability on which crop production depends. Several available soil, water and crop management technologies have the potential to mitigate the negative impacts
of climate variability and change, but their adoption by smallholder farmers is very low, mainly due climate-induced risk and uncertainty over returns on investment. The paper presents some of the available options that help in preparing for and managing climate risks. It highlights the potential benefits from use of seasonal climate forecast information in planning farm operations and suggests some simple, inexpensive and efficient technologies that involve very low levels of investment and risk. In general, the research community from the region has paid very little attention to climate-induced risk in agriculture, which needs to be corrected to address the threats from climate change effectively.
2.1 Introduction
Agriculture is, and will remain for the foreseeable future, the most important sector in the economies of almost all countries in ECA. It constitutes nearly 40% of the region’s GDP and, more importantly, is the main or only livelihood for nearly 80% of the region’s population (IFPRI, 2004). Despite its importance, agriculture in the region remains underdeveloped with inadequate adoption of yield-enhancing technologies, inefficient with low levels of productivity and uncompetitive in a rapidly globalising world. The poor performance of African agriculture is even starker when compared with the progress achieved by countries in Asia and Latin America in increasing food production. While developing countries in those regions reaped good benefits from improved technologies, most countries in the region failed to benefit from the same. Sub-Saharan Africa is the only region in the world in which the average per capita food production has stagnated and is still at levels reported two decades ago (FAO, 2004). The growth rate for cereals grain yield is about 1%, much below the population growth rate of 3% (UN, 2001). As a result, the per capita cereals production has decreased from 150 to 130 kg/person, whereas Asia and Latin America have recorded an increase from about 200–250 kg/person (FAO, 2001).
Between 2005 and 2008 average yields of maize, the main cereal grown over 25 million hectares in Africa, were estimated at 3.8 t/ha in Brazil, 3.1 t/ha in Mexico, 2.5 t/ha in the Philippines, and 3.9 t/ha in Thailand, compared
2. Managing current and future climate-induced risk in Eastern and Central African agriculture
K.P.C. Rao, Principal Scientist ICRISAT/ICRAF
16 First ASARECA General Assembly, Volume 2
to 1.4 t/ha in sub-Saharan Africa. The situation is not very different for other crops. The continuous practice of low input subsistence agriculture with unsustainable management practices is leading to decline in soil fertility and organic matter, resulting in severe erosion of the productive potential of the resource base. Fertiliser use by African farmers is extremely low by international standards – around 8 kg/ha, compared to a global average of 100 kg/ha. The outcomes of lack of investment and stagnation of agricultural production reinforce each other – leading to poverty traps and vulnerability of livelihoods to climatic and other shocks (Reardon and Vosti, 1995; Collier and Gunning, 1999).
Lack of agricultural development in Africa has been the subject of many studies, assessments and reports from as early as 1938. As pointed out by Easterly (2009), most of them highlight the same problems and suggest even the same solutions. He also draws attention to the fact that technological solutions to major problems faced by African agriculture are well known and have been around for several decades. For example, soil fertility is a never-ending problem with which the farmer will always have to contend. A number of practical and feasible technologies that include chemical, biological and cultural interventions for improving soil fertility are available, but the same are rarely used by subsistence smallholder farmers.
The reasons for farmers not investing in fertilisers are many. Among the major limitations are high cost of fertilisers, limited access, and low profit incentive. Considering that African agriculture is primarily rainfed and is entirely dependent on rainfall that is both seasonal and highly variable, we argue that low profit incentive stemming from uncertainty and risk associated with variable climatic conditions is the primary reason for low adoption of fertility-enhancing technologies. The same is true with the adoption of improved varieties, soil and water conservation measures and several other productivity-enhancing technologies. Rainfed agriculture is one of the most vulnerable sectors to variability in climatic conditions that occurs at many temporal scales, from seasons to years to decades and beyond. While the amount and distribution of rainfall has a direct impact on the productivity of agriculture, its variability contributes to uncertainty in the expected performance of farm production and to the rates of return that farmers receive from investing in innovative farming practices (van de Steeg et al., 2009).
Overlaid on this challenging scenario is the accepted prediction that, whatever happens to future greenhouse
gas emissions, we are now locked into global warming and inevitable changes to rainfall patterns, which are likely to exacerbate existing rainfall variability in many parts of Africa and further increase the frequency of climatic extremes. Though uncertainty prevails over the precise nature and extent of these changes, most climate change projections for the region indicate an increase in temperatures by about 2.50C to 3.00C accompanied by modest and seasonally variable increases in precipitation (5%–10%) by mid-century (IPCC, 2007). These apparently small changes in the climate can have big implications for agriculture.
ECA is one of the most vulnerable regions to climate variability and change due to its predominantly semi-arid to arid climate, degraded soils, extreme poverty and lack of infrastructure (Fischer et al., 2005; IPCC 2007). The region experiences prolonged and highly destructive droughts covering large areas at least once every decade and more localised events more frequently. The region recorded severe droughts and/or famines in 1973–1974, 1984–1985, 1987, 1992–1994, 1999–2000, 2005–2006 and more recently in 2010–2011. According to UNDP (2006), a single drought event in a 12-year period will lower GDP by 7%–10% and increase poverty by 12%–14%. Extreme events, including floods and droughts, are becoming increasingly frequent and severe (IPCC 2007). The negative impacts of climate are not limited to the years with extreme climatic conditions. Even with normal rainfall, the countries in the region do not produce enough food to meet their people’s needs. Left unmanaged, these impacts can have far-reaching consequences on the local food security, economy, and poverty.
The objective of this paper is to provide a brief account of climate-induced risk in agriculture and discuss available options to mitigate risks while capitalising on opportunities associated with variable climate in the ECA region. It focuses on prospects to cope adequately with current climatic variability in the rain-fed farming systems, which, while serving the immediate needs and requirements of smallholder farmers in the region, will serve as a stepping stone to adapt to challenges posed by climate change.1
In the section following this introduction, the paper provides a brief review of the climate of the region with special focus on observed trends and variability, followed by projected changes in the climate due to
1. Much of the information in this paper is sourced from studies conducted through projects funded by ASARECA and the Climate Change Adaptation in Africa (CCAA) programme of IDRC/DFID.

Managing current and future climate-induced risk in ECA agriculture 17
global warming from increased concentration of greenhouse gases in the atmosphere. In the third section, it explores the impacts of current and projected changes in climate on agriculture. The fourth section describes, with evidence, potential management strategies that can be employed to reduce vulnerability of agricultural systems to climate-induced uncertainties through better preparedness, tactical management and lasting recovery.
Though options like use of heat and drought-tolerant varieties, soil and water conservation practices, including irrigation, agroforestry, conservation agriculture and other sustainable management practices are widely suggested in the strategies to adapt agriculture to climate change, they are not covered in this paper. These practices are extremely useful in buffering climate-induced stresses and extensive literature is available on the effectiveness of these practices both in the region and globally. It focuses more on how risk associated with variable climate is constraining adoption of these technologies and what options are available to reduce
this risk and promote use of technologies. Considering the fairly good reliability of seasonal climate forecasts, potential value of this information in planning farm operations, and applicability to other countries in the region, a more detailed account about the usefulness of seasonal climate forecasts is included. This is also one of the major interventions developed, tested and promoted under the projects supported by ASARECA- competitive grants system (CGS). The last two sections of this paper draws conclusions from the work being reported and provides recommendations for further strengthening the research on climate variability within ASARECA and its partner institutions.
Climate of the region
The climate over Equatorial Eastern Africa is considered as one of the most complex due to large-scale tropical controls that include several major convergence zones superimposed on regional factors such as lakes, topography and maritime influences (Nicholson, 1996). Eastern Africa exhibits high seasonal rainfall variability (Figure 1), ranging from unimodal, bimodal to trimodal
Figure 1. Seasonal rainfall distribution in Eastern Africa (Ogallo, 1989).

18 First ASARECA General Assembly, Volume 2
rainfall distributions (Ogallo, 1989 and Indege et al., 2000). However, much of the region experiences a bimodal pattern of rainfall near the Equator and tends to a unimodal system as distance from the Equator increases (Conway et al., 2005), with wet seasons from March to May and October to December.
Highlands of central Kenya, southern and western Tanzania, south-western Ethiopia and much of Uganda receive rainfall of more than 800 mm, with the northern and eastern parts of Kenya and east central Tanzania, which are semi-arid, receiving less. In the December to February season, the rainfall is concentrated over the lake regions and most parts of Tanzania. March to May is the main rainfall season and accounts for nearly 42% of the total regional annual rainfall, with the highest intensity observed near the water bodies of the Indian Ocean, Lake Victoria and the East African highlands (Indeje et al., 2000). The June to August rainfall season, which accounts for about 15% of the total regional annual rainfall, is confined to the western highlands of Kenya and Ethiopia, the coastal areas and most parts of Uganda. The September to November rainfall season contributes about 25% of the total regional annual rainfall and is well distributed in the whole of East African region. Within these seasons, altitude and other localised variables produce distinctive regional climates characterised by widely diverse climates ranging from
desert to forest over relatively small areas, changing within tens of kilometres. More than a third of the ECA region total land area of 8.1 million km2 is covered by semi-arid and sub-humid agro-ecologies, where variability and change in climate are going to have a profound effect on the future of agriculture (Figure 2).
2.2 Variability and trends in climate of ECA region
Rainfall across the region is highly variable both within and between seasons and the variability increases disproportionately as one move from sub-humid to semi-arid regions (Figure 3). Within semi-arid tropics, rainfall during a crop season varies from about one-third to two-and-a-half times the normal amount, and this variability in rainfall is the primary source of uncertainty and the main cause for the large fluctuations in farmers’ income. For example, available records at Melkasa in Ethiopia indicate that annual rainfall varied from 1300 mm in 1977 to 550 mm in 2002 and at Katumani in Kenya rainfall varied from 1250 mm in 1963 to 350 mm in 1987. Optimising farm management under these highly variable conditions is a major challenge since management practices that are appropriate for average to above average seasons may perform poorly or even fail in below normal seasons.
Historical trends in rainfall over Eastern Africa indicate cycles of wet and dry periods and the trends in temporal variability of rainfall at most locations are very similar. Rainfall showed mostly positive anomalies during 1960s followed by negative anomalies during the 1970s (Figure 4). After the 1970s, the fluctuations in rainfall have been dominated by short period cycles of about five years’ duration that normally coincide with the swings in ENSO. Several studies that analysed rainfall variability in Eastern Africa have concluded that the variability in
Figure 2: Distribution of drylands in ECA. (Areas with an aridity index of 0.2 to 0.5 are designated as semi-arid and those with an aridity index of 0.5 to 0.65 as dry sub-humid)
Figure 3: Long-term mean rainfall totals (mm) and the variability for different locations in ECA.

Managing current and future climate-induced risk in ECA agriculture 19
rainfall is closely associated with the phenomenon of ENSO and sea surface temperatures, with a time scale of variability of 5 to 6 years (Nicholson, 1996, Schreck and Semazzi, 2004, Indeje et al. 2000). El Nino is associated with above-normal rainfall during the short rains throughout the entire region, except for Sudan. This relationship between rainfall and the phenomenon of ENSO makes the rainfall in the region more predictable. No discernable increasing or decreasing trend in either the annual or the seasonal rainfall is observable. The
proportion of negative anomalies ranged between 49% and 59% for the stations we have data, indicating fairly equal distribution of positive and negative anomalies (Rao et al., 2011).
However, a general increasing trend in both minimum and maximum temperatures, especially from about 1990 onwards, and in mean annual temperature is noticed in most months, (Figure 5) and the rate of increase is similar to the one reported by IPCC (IPCC, 2007). This supports (the hypothesis) that the region is warming along the lines predicted globally. Unfortunately, the analysis is limited by availability of good quality data. There are very few meteorological stations in the region with good records of long-term temperature data.
2.3 Projected climate change scenarios
According to the most recent IPCC assessment report (AR4), the global average temperatures will increase by about 1.10 C–2.90 C under a low emission scenario and by 2.40 C–6.40 C under high emission scenario by the end of this century. For Eastern Africa, the predicted changes under a medium emission scenario (A1B) are summarised in table 1. The median predictions show an increase in both temperature and rainfall. Annual temperature of the region is projected to increase by about 3.20C and rainfall by about 11% towards the end of this century. For shorter time scales, IGAD Climate Prediction and Application Centre (ICPAC) predicts that the mean annual temperatures in the region will increase by about 0.80C–1.10C by 2030 and by 1.50C–2.10C by 2050 for the mid-range emission scenario, A1B (ICPAC, 2007). At the same time, the assessment predicts that the rainfall in the region will increase by 0.6%–9.7% and 1.1%–18.8% by 2030 and 2050 respectively, for the same emission scenario.
Despite the availability of overwhelming evidence in support of climate change at the global and regional
Figure 5. Mean maximum and minimum temperatures for the short rain season (Oct.-Dec.) at Makindu, Kenya (1959–2004).
Table 1: Temperature and rainfall projections for Eastern Africa (120S and 220E to 180N and 520E) from a set of 21 global models in the CMIP3 for the A1B scenario by 2100 (IPCC, 2007)
SeasonTemperature response (oC) Precipitation response (%) Extreme seasons (%)
Min 25 50 75 Max Min 25 50 75 Max Warm Wet Dry Dec. Jan. & Feb. 2.0 2.6 3.1 3.4 4.2 -3 6 13 16 33 100 25 1March April & May 1.7 2.7 3.3 3.7 4.5 -9 2 6 9 20 100 15 4June, July & August 1.6 2.7 3.4 3.6 4.7 -18 -2 4 7 16 100 Sept. Oct. & Nov. 1.9 2.6 3.1 3.6 4.3 -10 3 7 13 38 100 21 3Annual 1.8 2.5 3.2 3.4 4.3 -3 2 7 11 25 100 30 1
Notes: Table 1 shows the minimum, maximum, median (50%), and 25 and 75 % quartile values among the 21 models for temperature (°C) and precipitation (%) change. Numbers in the Extreme Seasons columns indicate that when there is a change in frequency of extreme seasons, the increase is positive.
Figure 4: Standardised annual rainfall anomalies at Katumani.

20 First ASARECA General Assembly, Volume 2
levels, uncertainty prevails over the exact nature and consequences of climate change at the local level, making it difficult to plan and develop appropriate adaptation strategies, programmes, and technologies. Global-level simulations using climate models provide various scenarios with high levels of confidence, but these predictions become less clear when it comes to the magnitude and timing of the changes at sub-regional, national and local levels, and, according to IPCC, difficulties remain in reliably simulating and attributing observed temperature changes at smaller scales. For example, the downscaled median values for rainfall show a 71% increase for Katumani and 50% decrease for Gedarif (Table 2). These are highly significant changes, but with very high levels of uncertainty. These predictions are expected to improve in the coming years with better downscaling techniques.
Though there are problems in predicting accurately where, when, and by how much the climate changes, based on our current knowledge and understanding there seems to be a general agreement among the scientific community about the changes as listed below. Since these projections are based on several assumptions of greenhouse gas emissions and nature of future socio-economic development, the magnitude and direction of these changes can vary with changes in underlying assumptions. 1. The region will be warmer by about 10C by 2030
and by about 20C by 2050. 2. The region is expected to receive slightly higher
rainfall, especially during the period from September to February.
3. The region will also experience an increase in the frequency of both extreme wet and dry seasons.
4. The region will experience an increase in the variability of rainfall both between and across the seasons.
5. The changes in temperature and rainfall will lead to significant changes in the extent and distribution of
arid and semi-arid climates, especially in Tanzania, DR Congo and Madagascar.
1. Impact of climate change on agriculture
Rainfall and temperature regimes are perhaps the most important factors in determining the potential productivity of various agricultural enterprises either directly or indirectly. The direct effects of rainfall and temperature determine the suitability, rate of growth and potential yield of crops, while the indirect effects influence the supply of nutrients and water through changes in nutrient and hydrological cycles. Annual crops with short production cycles are considered to be much more sensitive to changes in seasonal climatic conditions compared to perennials with growth cycles covering several seasons or years. The extent to which climate change affects crop production at a given location, among others, depends on the current climatic conditions at that location, type of crops grown, level of management, and status of soil and other resources.
There are many pathways through which climate-related factors can affect crop yields (both positively and negatively) and crop suitability.
Firstly, changes in temperature and precipitation lead to changes in evaporation from the soil and transpiration from vegetation. Hence, higher temperatures will lead to increased demand for water by plants, which is difficult to meet, especially when rainfall is expected to decline and become more variable.
Secondly, different crops have different optimal growing conditions and high temperatures can make the crops unsuitable for growing in some areas where the current climatic conditions are already close to the maximum tolerable limits.
Table 2. Downscaled rainfall projections for some locations in Eastern Africa from a set of 11 global models in the CMIP3 for the A1B scenario
Location2046–2065 2081–2100
Min Med Max Min Med MaxKatumani (Kenya) 23.9 41 57.6 30.9 70.9 96.9Melkassa (Ethiopia) -27.6 1.9 39.6 -16.6 1.5 35.0Same (Tanzania) -1.1 8.6 29.2 -0.8 18.9 51.9Gedarif (Sudan) -74.9 -48.5 -42.2 -77.7 -49.6 -31.9

Managing current and future climate-induced risk in ECA agriculture 21
Major shifts in production zones are predicted for crops with a narrow optimal temperature range such as coffee and tea.
Thirdly, crops grow faster and mature earlier under warmer temperatures compared to cooler temperatures. The available data indicate that duration of several crops will be reduced by about one to two weeks with every degree increase in temperature, depending on current temperatures at that location and the type of crop grown. This reduction in the time that a crop takes to mature will also reduce the productive potential of these crops. Studies using crop simulation models broadly indicate that potential for biomass production will decline by about 500 kg/ha with every one week of reduction in the maturity duration of the crop.
Fourthly, some crops may benefit from increased concentration of CO2 in the atmosphere. The response of crops to increased CO2 concentration, often referred to as “CO2 fertilisation effect”, varies among plant species. Plants with “C-3” photosynthetic pathway, which include potato, beans, rice, wheat and many weed species, can benefit from this phenomenon, but no significant benefit is expected in case of crops like maize, sorghum and millet with “C-4” photosynthetic pathway.
Further, attaining these benefits requires high levels of management, including use of fertiliser, optimum conditions for root growth, and control of weeds, pests and diseases. Under the prevailing low-input management scenario, it is very unlikely that the region will be able to benefit from this phenomenon since other factors will continue to place overriding constraints to crop growth and yield. In addition to these direct effects, climate change will also affect crop production by reducing the capacity of natural resources to support productive agriculture. The effects include decline in soil fertility from increased mineralisation, reduction in plant available water due to increase in evaporative demand of the atmosphere, increase in erosion and soil degradation, and changes in the distribution and incidence of pests and diseases, including weeds. All these changes will have a significant impact on productivity, food security, and profitability, both at the household and the national levels.
Given the large number of factors and their many interactions, high spatial and temporal variability
in the climate, soil and other resources supporting crop production, and high level of uncertainty associated with future climate projections, it is extremely difficult to estimate precisely how the productivity of crops is going to be affected by changes in climate. Recent studies have used a variety of approaches to assess the likely impacts of climate change on sub-Saharan Africa agriculture, ranging from quantitative crop simulation modelling (Jones and Thornton, 2003; Abraha and Savage, 2006; Walker and Schultze, 2008) to statistical time series analyses (Lobell et al., 2008). A more recent study, focusing on maize, sorghum, millet, groundnut and cassava, (Schlenker and Lobell 2010) combined historical crop production and weather data into a panel analyses and were able to produce a robust model of yield responses to climate changes. Their projections showed that the mean aggregate production changes for maize, sorghum, millet, groundnut and cassava were –22%, –17%, –17%, –18% and –8% respectively. A number of other studies that assessed impacts of climate change on agriculture in the region have, in general, concluded that the effects are largely negative and advocated serious efforts to adapt to the progressive climate change.
2. Adapting agriculture to climate variability and change
Adapting agriculture to climate change is an ambiguous task due to various reasons that include long-term nature of change, uncertainty in predicting the magnitude of change, likely impacts (both negative and positive), and unquantifiable inherent ability of natural systems and practitioners to adapt to the gradual changes in climate. Further, the impacts may not necessarily be linear; there may be thresholds beyond which impacts and resulting damages become catastrophic (Hansen, 2008). Although farmers continue to innovate and adapt, many studies indicate that they will be limited in their capacity to react and respond to the changes that are occurring much more rapidly than they have experienced before (Rao et al., 2011). More appropriate interventions that are based on deep understanding of historical and current trends in climate, sound science and meaningful analysis of costs and benefits are required to overcome adverse impacts of climate-induced uncertainties of today and the near future.
A number of different approaches have been suggested to adapt agriculture to climate variability

22 First ASARECA General Assembly, Volume 2
Table 3: Potential options for farmer adaptation to climate variability and change and benefits and constraints to adoption
Suggested adaptation practice Potential benefit Constraint to adoptionChange in crops/varieties More suitable to new climates Timing of shift and availability of appropriate crops. Market for some
crops may not be attractive. Choices may be limited for very dry environments
Drought and heat-tolerant varieties Covers risks from extremes Low yield potential and may not be beneficial in normal and good seasons
Soil and water conservation Increases soil water availability and moderates effects of droughts
Amount of water conserved is limited by profile water-holding capacity and benefits are associated with use of other productivity-enhancing technologies
Fertiliser use Increases yield and arrests nutrient depletion High cost and risk on investment. In some places access is a problem
Seasonal climate forecasts Tactical decisions to match management to season’s potential
Lack of reliability and availability in user-friendly formats
Conservation agriculture Increases yield, conserves soil and water and improves soil quality
Lack of availability of residue and planting equipment
Diverse income sources Non-farm income sources less climate sensitive
Limited opportunities in rural areas
Adjustable planting dates Crop growth matches seasonal rainfall Not appropriate to areas practicing dry planting, and limited opportunities due to short growing period
Farm expansion Increases production Availability of land and labour and potential impacts on environmentImproved markets Increases income by realising better prices and
reduces vulnerability to price fluctuations Unsuited to areas with poor access to markets and possible conflicts with middlemen
Early warning systems Avoids potential losses Lacks reliability and institutional supportSafety networks and insurance Covers risks and encourages investments in
improved technologiesHigh premium and low interest of insurers in dry areas where risk is high
Agro-forestry Increases over all productivity and makes better use of rainfall
Lack of availability of suitable trees and trade-offs
and change. Among them are, integrated planning of land and water resources at plot and watershed scales to ensure that the synergies are properly captured; promoting activities that are geared towards improving soil fertility; diversifying agriculture with crops and varieties that can perform better under various climatic stresses; developing sound risk management strategies, including safety nets and risk insurance, and adaptive management that disseminates timely climate information to farmers and tailors techniques to shifting climatic conditions.
An integrated approach that combines all these elements is often referred to as “Climate Smart Agriculture”, which addresses both adaptation and mitigation objectives. It is defined as agriculture that sustainably increases productivity, resilience (adaptation), reduces/removes greenhouse gases (mitigation), and enhances achievement of national food security and development goals (FAO, 2010). The technological components that are suggested under these strategies are mainly aimed at sustainable intensification, which is the key to ensure food security, especially in countries
where good scope for increasing current levels of productivity exists.
Most of these technologies are not new but have met with limited adoption by smallholder farmers (Table 3). The primary constraints that are affecting adoption of these practices include season specificity of these technologies, limiting economic benefits to certain type of seasons; high requirement of labour and capital investments per unit area; high input costs and uncertain returns; and lack of access to information and inputs. Fundamental to these practical constraints is the variability in inter- and intra-seasonal rainfall and the inevitable uncertainty that it imposes on farm production and returns on investments.
Development of interventions that reduce risk and enhance adoption of improved technologies is the subject of research under two projects supported by ASARECA-CGS: “Making the best of climate: Adapting agriculture to climate variability” and “Managing Uncertainty: Innovation Systems for Coping with Climate Variability and Change”. Studies carried out under these projects have made significant contributions to improve the understanding of uncertainty and risk associated

Managing current and future climate-induced risk in ECA agriculture 23
with variable rainfall and in developing management options that not only minimise risks during below normal seasons, but also help farmers take advantage of opportunities created during normal and below normal seasons. Here we briefly summarise the findings from these studies and discuss their implications.
2.4 Understanding and evaluating climate risk
The process of risk management starts with an assessment of how the risk is perceived by farmers and how it is currently being managed. Over the years, farmers have developed and adapted successfully to the fluctuations in climate across and during the years through keen observation, experimentation and practice. The role and value of this local indigenous knowledge in designing appropriate research, development and extension strategies that are relevant to the local conditions has long been recognised and is well documented (Chambers 1983; Richards 1985; Agrawal 1995; Carswell and Jones 2004; Chambers et al. 1989; Pretty et al. 1999).
However, considering the complexity involved in understanding the trends in highly variable phenomena such as rainfall, doubts have been expressed on the ability of farmers to accurately discern climate trends from their casual observations (Kempton et al., 1997); the completeness of their assessment since they represent simplified versions of complex reality (Johnson-Laird, 1983); and the subjective nature of these perceptions (Beal, 1996; Marra et al., 2003; Pannell et al., 2006; Sattler and Nagel, 2010). Further, farmers’ perceptions are also likely to be shaped by the agro-economic performance of crops and other farm enterprises that affect their livelihoods, where climate is only one of the many bio-physical and socio-economic factors that affect productivity. Farmers’ perceptions are influenced by a range of other factors such as gender, level of education and farm size.
Studies conducted in five districts of Eastern Kenya, viz., Machaos, Makueni, Kitui, Mwingi and Mutomo, to assess farmers’ knowledge and understanding of both short-term and long-term variability in climate and associated risks revealed that farmers, in general, have a good understanding and knowledge of their location’s general climate , its variability and the probabilistic nature of variability (Rao et al., 2011). However, their ability to estimate the frequency distribution of different events and discern long-term trends is more subjective. Farmers tend to attach higher significance to negative events or impacts, leading to a biased estimation in
the frequency of occurrence of negative events (Table 4). This has important implications in the assessment of risk and in subsequent decision-making. Their perception of higher risk results in them preferring techniques requiring low levels of cash investment and acts as a major deterrent in optimising input use and taking advantage of improved technologies. This is one of the primary reasons for low levels of adoption of improved inputs such as use of fertilisers and improved seed.
The analysis of long-term maize yields of Machakos and Makueni districts highlights the effect of these conservative approaches adopted by farmers on productivity of agriculture (Figure 6). While the practices adopted by farmers are yielding fairly good results during below normal and to some extent during normal seasons, they are unable to capitalize on the opportunities available during the normal and above normal seasons. The current district average yields of about 0.5 t/ha is very low when compared to the
Table 4: Distribution of different season types (%) as perceived by farmers and from analysis of historical climate data
LocationFarmer perception Climatology
Good Average Poor Good Average PoorKitui 34 37 29 65 17 18Mwingi 26 32 42 41 30 28Mutomo 21 33 46 42 26 31Katumani 23 34 43 28 36 35Makindu 8 29 63 18 23 59
Figure 6: Maize yields of Machakos and Makueni districts dur-ing years with different types of seasons. (B = Below normal seasons with <250 mm rainfall, N = Normal seasons with 250– 350 mm rainfall and A = Above normal seasons with >350 mm rainfall. The two letters represent long and short rain seasons and numbers on the bar refer to the number of years)

24 First ASARECA General Assembly, Volume 2
yields achieved in on-farm trials and on the farms of progressive farmers in the area.
Use of fertilisers is essential to improve productivity of inherently infertile soils. However, farmers, in general, do not use fertilisers even though the productivity gains from their use is well demonstrated and well known. One of the reasons for this is the risk and possible loss of investment made in this costly input. For example, results from simulation analysis conducted with long-term climate data from Katumani on maize yield with farmer practices of no fertiliser and improved practice with 40 kg N/ha indicate that, on an average, use of recommended dose of 40 kg N/ha gives much higher yield than that achieved by farmers under low input system (Figure 7). However, in below normal rainfall seasons, maize yields are higher under low input system than in the improved system. Further analysis on returns on investment revealed that, at Katumani, farmers will realize the investment made in fertilizers in 65% of the years and will earn a good profit in 56% of the years.
An important implication of this assessment is that recommendations based on performance under mean conditions may not be appropriate in environments where climate variability results in high season-to-season variability in production. The recommended solutions should include adequate information on the risk and return profile of the proposed technology so that the end users can make informed decisions depending on their ability to take risks.
2.5 Managing climate risk
The uncertainty associated with climate variability, combined with inaccurate perceptions about risks
and risk aversion on the part of decision makers, causes substantial loss of opportunity in climatically favourable and even average years (Hansen et al., 2010). Farmers employ a range of strategies to protect against the possible losses, which include selection of less risky but less profitable crops (Dercon, 1996) or cultivars (Morduch, 1990); under-use of fertilisers (Bliss and Stern, 1982; Binswanger and Sillers, 1983); shifting household labour away from farming enterprises (Rose, 2001; Rosenzweig and Stark, 1989); and shifting from productive to non-productive but more liquid assets as precautionary savings (Paxon, 1992; Fafchamps, 2003; Zimmerman and Carter, 2003). Most of these practices are very effective in reducing the risk but at the cost of reduced productivity. The resulting opportunity cost is a serious impediment to agricultural development efforts and hence rural livelihoods and agrarian economies. Hence, there is a need for increased attention to risk management options in order to deal effectively with year-to-year fluctuations in seasonal rainfall.
Risk management is the process of choosing appropriate methods to avoid, reduce, mitigate and recover from risks that smallholder farmers face from events that have different probabilities of occurrence. Effective risk management strategies should cover adequately all of these aspects and should assist in better preparing, managing and recovering from impacts of different magnitude and frequency. Such strategies can be broadly grouped into three categories:1. Ex-ante adaptation options for better preparedness:
Actions taken before the event is realised to prevent or minimise losses from identified risks.
2. In-season adaptation options for better management of emerging risks: Actions taken in response to the nature of the rainfall season as it unfolds.
3. Ex-post adaptation options to facilitate better recovery from shocks: Actions taken after the risk is realised to minimise livelihood impacts of adverse climatic shocks. These are mainly associated with the relief and recovery programmes, and stress the need for a shift from ad-hoc relief measures to planned interventions that aim at creating longer-term livelihood options for better vulnerability reduction.
Figure 7. Simulated long-term maize yields at Katumani, Kenya, with farmer practice of no fertilizer and improved practice with recommended dose of 40 kg N/ha.

with NEPAD and REC member countries on strategy implementation facilitated some fundamental changes. The initial strategy offered an already-defined, detailed set of CAADP project activities that did not easily lend themselves to a decentralized, bottom-up imple-mentation. Instead, RECs and country leaders wanted a decentralized approach that would allow them to identify relevant CAADP activities and tailor them to their own needs and circumstances, thus improving chances of success at the local level. Responding to this, NPCA rolled out a roadmap consisting of the following steps, which became critical for the forging of the later partnerships that made CAADP possible:1. Constituency building—to encourage civil society’s
participation in setting objectives and prioritizing programmes and to encourage partnerships with the private sector. More importantly, efforts to inform and involve other national government ministries would be encouraged early in the CAADP implementation process.
2. Open consultation—to guide every level of the implementation process, including consultation with the AUC, RECs, national governments, and sector stakeholders, including farming communities.
3. Investment priority setting—to create an analytical base for informed choices on programme design, to provide a balance between long-term prospects and short-term interventions, and to better position CAADP programmes in country priority setting and budget negotiations.
4. Resource mobilization—to build sufficient capacity within the NPCA, RECs, member countries, and CAADP-affiliated technical institutions to roll out and scale up CAADP effectively.
Partnerships, review, and dialogue processes under CAADP
Working out the implementation modalities of CAADP required that key groups of actors be identified, their roles and responsibilities be defined, and inclusive processes be developed to coordinate involvement by all concerned parties. The success of CAADP as a collective framework depended on broad ownership and participation by core stakeholder groups through shared processes, as described in figure 1. Figuring out how to translate a continent-wide framework into concrete country-level activities that added value to existing country efforts without duplicating them was a major challenge for NEPAD and CAADP stakeholders. A critical decision was made early on to ensure that
CAADP builds on and strengthens existing national efforts where needed. Accordingly, the CAADP country process described in figure 2 is initiated on a demand-driven basis through open consultation between RECs and their member countries. It is led by national governments and other local stakeholders, with support from RECs and NEPAD. The process consists of a series of steps as shown in figure 2, centred on several key tasks and deliverables, which include the following:• Stocktaking and analysis of growth options to align
national efforts. The centrepiece of this component is the organization of country CAADP roundtables to review on-going and future national development efforts. The stocktaking looks at the extent to which on-going country policy, strategy, and investment efforts allow countries to meet: (1) the Millennium Development Goal (MDG) target of a 50% reduction in poverty by 2015; and (2) the CAADP objectives of a 6% annual agricultural growth rate and a 10% budget share for the sector. The growth options analysis evaluates alternative strategies for achieving the same targets should it not be possible to achieve the above targets under current trends. The output of these analyses is a series of country-specific technical papers that examine different scenarios for meeting national growth and poverty-reduction targets.2
• Building partnerships and alliances to accelerate progress. The goal here is to develop partnerships at the country level to meet the necessary policy, budgetary, and development assistance needs of the CAADP agenda in line with CAADP principles and established processes. These include public–private partnerships, business-to-business alliances, platforms for coordination of development assistance, and other institutional mechanisms for policy dialogue as well as programme progress and performance review.
• Signing of country CAADP compact. The compact consists of a set of defined actions, commitments, partnerships, and alliances agreed upon by national governments, the private sector, the farming community, and development partners to bridge gaps in growth and poverty-reduction
2. The technical papers are summarized in five brochures that serve as background material for the CAADP country roundtable meeting. They include Brochure 1: Review of ongoing agricultural development efforts; Brochure 2: Agricultural Growth, Poverty Reduction, and Food Security: Past Performance and Prospective Outcomes; Brochure 3: Strategic Options and Sources for Agricultural Growth, Poverty Reduction, and Food Security; Brochure 4: Long-Term Funding for Agricultural Growth, Poverty Reduction, and Food Security; and Brochure 5: Strategic Analyses and Knowledge Support Systems to Inform and Guide the CAADP Implementation Process.
35The emerging impact of CAADP as a planning and partnership platform

Figure 1: Key actors, roles, and activities under CAADP implementation.Source: Badiane, Odjo, and Ulimwengu (2010).Notes: ACFS/UKZN, African Centre for Food Security at the University of KwaZulu Natal; ADWG, Agriculture Development Partner Working Group; APO, agricultural producer organization; CAADP, Comprehensive Africa Agriculture Development Programme; CILSS, Permanent Inter-State Committee for Drought Control in the Sahel; CMAWCA, Conference of Ministers of Agriculture of West and Central Africa; COMESA, Common Market for East and Southern Africa; CSO, civil society organization; DP, development partner; ECCAS, Economic Community of Central African States; ECOWAS, Economic Community of West African States; FAAP, Framework for African Agricultural Productivity; FAFS, Framework for African Food Security; FARA, Forum for Agricultural Research in Africa; FIMA, Framework for the Improvement of Rural Infrastructure and Trade-Related Capacities for Market Access; M&E, monitoring and evaluation; NEPAD, New Partnership for Africa’s Development; PSR, private-sector representative; RECs, regional economic communities; ReSAKSS, Regional Strategic Analysis and Knowledge Support System; SADC, Southern African Development Community; SLWM, Sustainable Land and Water Management; UNZA, University of Zambia.
performance that are identified during the stocktaking process. The compact guides country policy and investment responses to meet CAADP growth and budget expenditure goals, long-term planning of development assistance to support country efforts, and partnerships to raise and sustain necessary investments in agribusiness and farming. It is signed by the ministers of finance and agriculture, AUC, RECs, development partners,
and representatives of farmer organizations and the private sector.
• Establishment of dialogue and mutual review mechanisms. Country dialogue and review mechanisms are established to encourage improved policy and strategy planning and implementation, leading to greater efficiency in the provision of public goods and services. These mechanisms incorporate broad and inclusive representation

of stakeholder groups; use effective monitoring and evaluation procedures to ensure high-quality reporting on performance and progress; and link to the continental and regional-level dialogue and review processes to facilitate cooperation, benchmarking, and mutual learning. The Regional Strategic Analysis and Knowledge Support System (ReSAKSS) is a major facilitator of the review and dialogue architecture of CAADP. ReSAKSS operates three platforms, covering West Africa, Southern Africa, and East and Central Africa.3 It publishes the annual Agricultural Trends and Outlook Reports, which serve as a basis for review of CAADP progress at the country, regional, and continental levels. Each year, the report is submitted to the CAADP Partnership Platform, the main dialogue platform, which brings together representatives of the AUC, NPCA, RECs, leading professional organizations, country representatives, and development agencies.
The CAADP country roundtable process promotes shared vision and commitment on the part of several actors, who need to work complementarily. The most
3. See www.ressakss.org.
important among these actors, and their respective roles are as follows:• National governments lead the country implemen-
tation process through a national committee or working group or other mechanism set up to ensure effective leadership and coordination for CAADP. Although ministries of agriculture are expected to be heavily involved in the process, involvement by other ministries, including finance, trade, and industry, as well as the agribusiness and farming communities, is considered critical to suc-cessful roundtable planning and country compact implementation. A national committee or working group is charged with planning the roundtable and coordinating participation of the RECs, NPCA, and development partners. National committees also coordinate the dialogue and review process after a compact is signed.
• RECs and NPCA coordinate and facilitate the CAADP implementation process across countries. RECs set up regional coordination mechanisms and knowledge support systems in collaboration with ReSAKSS to facilitate cross-country cooperation, peer review, and mutual learning. The NPCA
Figure 2: The CAADP country roundtable processSource: Badiane et al. 2010.
37The emerging impact of CAADP as a planning and partnership platform

assists with policy dialogue, mutual review, and coordination of development assistance. RECs may differ in their approach to coordinating CAADP country activity. For example, the Economic Community of West African States (ECOWAS) coordinates implementation in 15 countries through a director general in the ministry in charge of NEPAD or regional integration, while the ministry of agriculture is in charge of technical leadership. In contrast, the Common Market for Eastern and Southern Africa (COMESA) strategy is less comprehensive. It coordinates its country CAADP process on a bilateral basis through a dedicated CAADP roundtable coordinator, who works with country steering committees, which, in turn, appoint one person to liaise with COMESA.
• Development partners participate in the country roundtables and integrate relevant aspects of the country compact into their in-country planning processes and at the headquarters level, where appropriate. Partners are expected to align their strategies for assistance to the agricultural sector with the CAADP framework and to join partnerships and alliances established under CAADP country compacts.
• Technical partners inform and guide the roundtable process to help country stakeholders identify tech-nical priorities. Such partners include universities, specialized agribusiness and farmer organizations, sub-regional research organizations, and external technical agencies and research networks such as FAO and the Consultative Group on International Agricultural Research (CGIAR), in particular the International Food Policy Research Institute (IFPRI).
A critical and innovative component of CAADP is an independent technical review that is organized to systematically evaluate the technical quality of country investment programmes developed subsequent to the roundtable and the signing of country compacts. The review is led by a group of external experts mobilized by NPCA in collaboration with the lead pillar institutions. It includes evaluations of the extent to which the values and principles of CAADP, such as inclusive review and dialogue processes, as well as regional complementarities, are embedded in country investment plans. The review also evaluates the extent to which best practices and success factors identified in the pillar framework documents and related implementation guides are incorporated into
the plans.4 Moreover, it verifies whether the plans are consistent with long-term growth and poverty-reduction goals that were agreed upon at the compact signing stage. Finally, the review allows stakeholders to evaluate whether proposed programme interventions are adequately budgeted, logically constructed, and implementation ready.
The emerging impact of the Comprehensive Africa Agriculture Development Programme at the country and global levels
African governments that adopted CAADP sought to increase agricultural growth rate by 6% to achieve the MDG of reducing poverty to 50% of its 1990 level by 2015. They also opted for a partnership framework to mobilize the required funding to achieve this growth rate, including the allocation by national governments of a budget share of at least 10% to the agricultural sector. Finally, CAADP also reflects an option for evidence and outcome-based planning and implementation in support of an inclusive sectoral review and dialogue process, in line with the broader NEPAD peer review and accountability principle. A key element of CAADP is, therefore, to support and add value to the efforts of individual countries to ensure that they meet growth, budgetary, and poverty reduction targets and align with the above principles.
The transition to evidence-based and outcome-oriented planning and implementation
One of the many innovations of the CAADP process is its broad use of high-quality, locally based analysis to guide and inform the decision-making process—not just planning and implementation, but also stakeholder review of programme priorities and outcomes. This approach is unprecedented in the majority of countries. An early impact of its adoption has been the prioritization of the agricultural agenda within national governments. This has enabled ministries of agriculture to present high-quality strategy documents to their peers in government, to articulate their agenda more transparently, and to justify requests for increased funding by linking them to clear goals and outcomes. Together with efforts to promote inclusiveness, the transition to evidence-based planning has facilitated consensus among stakeholder groups and strengthened the position of the agricultural constituency in an unprecedented fashion.
4. See Badiane et al. 2010 for a discussion of pillar framework documents and implementation guides and their role in evidence and outcome-based processes.
38 First ASARECA General Assembly, Volume 2

An important part of the planning work carried out by the technical teams in individual countries consisted of reviewing past, current, and emerging country efforts against the above objectives. This includes: 1. Examining the recent growth performance of the
agricultural sector, as well as future growth and poverty outcomes based on observed trends.
2. Determining how such outcomes compare with the targets established for the sector under the CAADP agenda and how they compare withMDG1to halve the proportion of people living on less than a dollar a day.
3. Measuring the prospects of meeting these targets and analysing the implications for future sector growth and poverty-reduction strategies.
4. Estimating the long-term funding needs to accelerate agricultural growth and achieve the poverty-reduction MDG.
The embracing of CAADP as the centrepiece of poverty-reduction strategies by African countries also implies that agriculture and its individual subsectors must play a primary role as leading sources of pro-poor growth at the national and rural levels. Successful implementation of the agenda at the country level should therefore be guided by a clear understanding of the impact of sector-wide growth and growth within individual agricultural subsectors on income and poverty levels among different categories of rural households and across geographic zones.
The analysis has systematically targeted a set of key strategic questions. It has been facilitated by a team of researchers at IFPRI, working in collaboration with a number country and regional-level experts. In most of the countries, the teams have: (1) customized the IFPRI standard computable general equilibrium (CGE) model developed by Lofgren, Harris, and Robinson5; (2) constructed social accounting matrixes; (3) gathered additional data and constructed micro simulation models; and (4) used the two sets of models to simulate future growth and poverty-reduction outcomes based on several possible policy scenarios. At the minimum, the policy scenarios included the following: (1) continuation of pre-CAADP trends; (2) successful implementation of on-the-shelf pre-CAADP strategies, where they exist; (3) realization of the CAADP growth target; and (4) achievement of the MDG target of halving poverty. For the first two scenarios, the objective of the
5. A detailed description of the model can be found in Lofgren, Harris, and Robinson (2001) and the full GAMS code in Lofgren, Harris, and Robinson (2002).
simulations is to project growth and poverty-reduction outcomes by 2015. In the third scenario, the objective is to simulate the expected rate of poverty decline if the country under consideration manages to achieve the CAADP 6% agricultural-sector growth rate. The last scenario simulates the required agricultural-sector growth rate to enable the country to achieve the MDG poverty-reduction target by 2015, depending on the extent to which the required rate of growth is judged to be realistic or not. The analysis also examines the potential sources of future growth and poverty reduction, not only at the level of agriculture versus non-agriculture, but also among various agricultural subsectors.
The following sections highlight the type of questions that are addressed in an attempt to provide a better strategic direction than has been traditionally the case in the design and implementation of development policies and strategies among many African countries. They present a sample of the results that have come out of the analyses and have been used as input to guide the planning and dialogue processes among countries that are most advanced in the CAADP planning and implementation process.
Are countries on track to meeting CAADP’s growth and poverty reduction targets by 2015?
Under current trends or business-as-usual (BAU), agricultural growth among countries in the sample is projected to stabilize at around 4–5% by 2015, as indicated in the first column of table 1.6Although these rates are high by historical standards for most countries, they are less than the 6% targeted under CAADP. Mali and Nigeria are the only countries with expected rates of growth that are close to that target. It can also be seen from the figures in the third column that the projected rates of growth under current trends would not allow any county, except Cape Verde and Ghana, to achieve MDG1. Senegal and Sierra Leone and, to a lesser extent, Burkina would come close. In three countries, Benin, Cote d’Ivoire and Liberia, the rate of poverty in 2015 is expected to be, respectively, 17.7%, 37% and 24% higher in 2015 compared to 1990. The problem in these countries is that poverty has continued to rise after 1990 in the face of severe economic contraction in the first and prolonged civil wars in the other two countries. The decline in poverty resulting from projected agricultural growth under current trends would be insufficient to offset the increase in the poverty rate by 2015.
6.. Current trends describes the period leading up to the signing of the CAADP compact, which for most countries refers to the first decade of the 2000s.
39The emerging impact of CAADP as a planning and partnership platform

Prior to embracing CAADP, many countries had on-the-shelf strategies that pre-date the signing of the compact, and were at difference stages of readiness for implementation. The implied growth rates under these strategies, assuming that they could be successfully implemented and their declared targets achieved, are listed in the second column of table 1. The rates are universally higher than projected rates under current trends. The only exception is Liberia, for which the scenario under current trends refers to the post-conflict period. For the region as a whole, the average rate of growth for the agricultural sector is predicted to increase from the existing fewer than 5% to slightly more than 6%, thus meeting the CAADP growth target. However, for several of the countries, such as Benin, Nigeria, and Mali, where the implied growth rates are significantly higher than would be expected based on recent performance, there appears to be a gap between declared investment and growth targets. The implied rate of growth is high for Ghana as well, relative to historical records, but is less challenging in absolute terms than the rates for the other three countries. Nevertheless, the projected rates of growth for the majority of countries would still fall well short of the CAADP target of 6%.
With respect to the goal of poverty reduction, Benin would be the only country to join Ghana and Cape Verde in halving poverty rates below the 1990 levels under the present scenario, as shown in column 4.
It is, however, clearly unrealistic to expect Benin’s agricultural sector to nearly triple its pre-CAADP rate of growth to 14.3% a year by 2015. Strategies for all other countries would imply changes in poverty levels that are significantly below the MDG1 target. And for the two post-conflict countries, Liberia and Cote d’Ivoire, poverty rates would still be considerably higher than their 1990 levels: by nearly 25% and 35%, respectively. In contrast, the adoption and successful implementation of strategies and programmes that would enable all countries to achieve the 6% CAADP growth target would lead to substantial reduction in poverty rates across the sample, although less than half of the countries would achieve MDG1 by 2015 (fifth column).Realizing the poverty MDG by 2015 is made difficult for Benin, Cote d’Ivoire, and Liberia because poverty rates in these countries have continued to rise after 1990 and have not stabilized or started to decline before the end of that decade. In the case of Liberia, the poverty rate jumped from 61% in 1990 to 84% in 2007. Under continued growth trends during the period leading up to the signing of the CAADP compact, with a rate of 5%, as shown in the first column, the rate of poverty would have fallen by less than 10 percentage points by 2015 to 76%, still close to 25% above the 1990 level. In all of these scenarios, the rate of poverty in Liberia is significantly higher than the 1990 level because the rate of growth under current trends is already close to the CAADP target and projected to even decline slightly under implementation of pre-CAADP strategies.
Table 1. Long-term growth and poverty outcomes under alternative scenarios (%)
Agricultural growth rate by 2015 under BAU/
current trends
Agricultural growth rate by 2015 under
Pre-CAADP strategies
Poverty reduction by 2015 under current
trends
Poverty reduction by 2015 under Pre-CAADP
strategies
Poverty reduction by 2015 under CAADP 6
% growth targetBenin 5.1 14.3 17.7 -55.9 9.4Burkina Faso 5.1 5.3 -40.0 -44.1 -50.5Cape Verde 2.6 5.0 -61.0 -75 -78.0Gambia 3.7 3.8 -9.8 -10.4 -11.3Ghana 4.2 7.5 -50.1 -54 -66.0Guinea 3.0 3.2 -25.9 -28.2 -42.2Cote d’Ivoire 2.5 2.6 37.0 35.3 10.0Liberia 5.0 4.0* 24.3 24.2 22.6Mali 5.5 8.5 -11.0 -29 -14.1Niger 4.4 6.2 -6.5 -17.4 -16.6Nigeria 5.7 9.5 -10.0 -30.0** ***Senegal 4.1 NA -43.8 NA -49.7Sierra Leone 4.2 NA -42.5 NA -47.6Togo 4.7 5.0 -17.2 -19.4 -26.4
Source: Model simulation results for ECOWAS countries. Figures for Nigeria and Ghana are from Diao et al. 2010 and Breisinger et al. 2008, respectively.Notes: * The rate of growth is projected to decline as the country transitions out of the immediate post-war recovery period (current trends scenario).**The target year chosen by Nigeria is 2017. ***There were no separate simulations of this scenario, given that the country was already growing at 5.7% under the current trends scenario. NA: Not applicable
40 First ASARECA General Assembly, Volume 2

In Côte d’Ivoire, the rate of poverty rose by 50% from 32% in 1993 to 49% in 2008. The achievable reduction in poverty under the BAU scenario or the implementation of pre-CAADP strategies is less than five percentage point for that country. Realization of the CAADP growth targets would have merely brought poverty levels close to that of the early 1990s. The increase in poverty during the 1990s was less considerable for Benin. Poverty-level estimates in that country rose from slightly more than 25% in 1990to 36% in 2006. Under the BAU scenario, poverty levels would fall to 30% by 2015, a decline of about 18% compared to the 1990 level.
How fast should individual countries grow to achieve the poverty MDG? How much would they have to spend?
To halve poverty by 2015, many countries would have to reach double-digit rates of growth in the agricultural sector: between around 12% and 15% for Benin, Mali, Gambia, Niger and Cote d’Ivoire, and as much as 26% for Liberia, as shown in the first column of table 2. A history of civil war explains the very serious situation in the latter country. These extremely high growth rates indicate that it will be impossible for these countries to achieve the poverty reduction goal by 2015. Some could, however, do so by 2020, namely Benin, Cote d’Ivoire,
Mali and Niger, although all would require growth rates of around 9%, which by historical standards are still high (table 1, second column). Gambia and Liberia cannot achieve MDG1by 2020 but could reach it by 2025 if they were to realize agricultural growth rates of nearly 9% and 15%, respectively. While it is true that post-conflict countries can sometimes grow rapidly during the recovery phase, whether Liberia would be able to sustain such a high growth rate over a long period is questionable.
The extent of the challenge for many countries in achieving the poverty MDG or the CAADP growth target is also illustrated by the increased public funding required for the agricultural sector. As shown in the third column of table 2, the required funding growth rate to achieve MDG1 by 2015 is prohibitively high for most countries. The required annual rate of increase in public expenditure still remains extremely high, even if the target date for achieving MDG1 is moved to 2020. For six of the eleven countries for which estimates are available, funding for the agricultural sector would have to rise by around 20% or more annually. The remaining countries would still have to expand funding for the sector by double-digit rates or close to that as in the case of Burkina Faso. Realization of the MDG poverty target by a given country is therefore not only a question of
Table 2. Long-term agricultural growth and funding requirements
Country
Required agricultural growth rate to achieve
the poverty MDG target by 2015 (%)
Required agricultural growth rate to achieve the poverty MDG target
by 2020 (%)
Required agricultural funding growth rate to
achieve the poverty MDG target by 2015 (%)
Required agricultural funding growth rate
to achieve the poverty MDG target by 2020 (%)
Required agricultural funding growth rate to
achieve CAADP 6% target rate by 2015 (%)
Benin 13.1 9.1 22.8 13.9 7.9Burkina Faso 7.1 5.9 11.6 9.0 9.1Cape Verde -- -- -- -- 11.2Gambia 14.4 8.6a 99.3 59.3a 19.6Ghana -- -- -- -- 21.7Guinea 10.3 7.5 33.5 26.5 12.3Cote d’Ivoire 14.8 9.0 62.2 25.1 27.0Liberia 26.1 14.6a 117.7 65.7a 27.0Mali 12.5 8.1 45.8 13.7 8.2Niger 11.9 9.0 25.1 18.2 26.5Nigeria -- 9.5a -- 23.8a 4.7bSenegal -- 6.8c -- 10.0c 7.6Sierra Leone -- -- -- -- 10.0Togo 9.6 6.9 74.2 43.1 35.4
Source: Model simulation results for ECOWAS countries Notes: -- Not applicable as these countries are already on track under current trends to achieving the poverty MDG by 2015 (Cape Verde and Ghana) or scenarios were
otherwise not relevant or feasible.a) Projection years are 2017 for Nigeria and 2025 for Gambia and Liberia. b) For Nigeria, this is the required agricultural spending growth rate to sustain current growth trends, which at 5.7% is nearly identical to the CAADP target of 6%. c) For Senegal, the numbers shown correspond to the required agricultural growth rate and funding growth rate to achieve the government’s objective of the reducing
poverty rate to 17% by 2020.
41The emerging impact of CAADP as a planning and partnership platform

physically achievable agricultural growth but also a question of financial resource mobilization capacity.
The significance of the financial resources constraint is illustrated by the increase in funding required for achieving the CAADP target of 6% growth through to 2015. Although several of the countries may manage to increase funding, it would be insufficient for them to realize the poverty MDG, as can be seen from the last columns of tables 3 and 4. The only exception would be Burkina Faso. A look at current levels of sectoral funding sheds light on the feasibility of the pace of funding increase that is called for under the various scenarios. Figure 3 presents the share of agricultural sector funding for the various countries in the latest year for which the information is available. Several countries such as Benin, Côte d’Ivoire, Nigeria, Sierra Leone and Togo are currently allocating the lowest share of country budgets to agriculture. The scope of raising the level of agricultural funding should, a priori, be greater in these countries. For instance, to achieve the CAADP growth target by 2015 or MDG1 by 2020, Benin or Mali would require annual rates of growth in agricultural funding of around 8% and 14%, respectively. If agricultural sector budget shares can range from 9% to 10%, there may be some room to achieve such increases in sectoral spending. The scope for increasing agricultural sector spending is greater in the case of Nigeria, which currently spends only about 3% of its budget on agriculture. The required rate of increase to 24% of sectoral funding to achieve MDG1 by 2017 should be considered realistic and feasible.
Table 3. Public expenditure allocation to agriculture and efficiency
Agricultural sector budget share
at time of compact signing (%)*
Estimated expenditure elasticity of
agricultural growthBenin 8.6 0.26Burkina Faso 21.2 0.24Cape Verde 1.3 0.11Gambia 6.6 0.15Ghana 4.9 0.15Guinea 13.7 0.25Ivory Coast 3 0.25Liberia 6 0.22Mali 9.7 0.25Niger 22.3 0.53Nigeria 3.4 0.39Senegal 19.2 0.48Sierra Leone 2.8 0.24Togo 3.2 0.11
Source: Budget shares are from respective country CAADP Roundtable Brochures No. 4 (www.resakss.org); elasticities are based on model simulation results for ECOWAS countries. The average elasticity estimate for Africa by Diao et al. (2010) as a whole is 3.1.
*Current refers to the latest year for which data is available at time of signing the compact
Table 4: NAIP costs versus long-term funding benchmarks
National Agricultural
Investment Plans (NAIPs)Comparable pre-compact
growth scenario
Cost ratioExpected agricultural
growth rate (%) Cost (million USD)Expected agricultural
growth rate (%) Cost (million USD) [1] [2] [3] [4] [2]/[4]Benin 14.3 884.1 14.3 1276.2 0.69Cape Verde 6.9 96.4 6.0 51.6 1.87Gambia 8.0 296.6 8.6 1065.8 0.28Ghana 5.2 5479.5 6.9 3082.2 1.78Guinea 10.3 1601.2 10.3 222.0 7.21Liberia 9.9 947.7 9.4 149.5 6.34Mali 8.8 727.2 8.5 5376.4 0.14Niger 7.4 2457.0 6.4 2233.4 1.1Nigeria 21.0 7535.4 9.5 28563.1 0.26Senegal 9.7 2727.5 6.8 1771.1 1.54Sierra Leone 7.0 388.0 7.1 100.6 3.86Togo 6.8 947.2 6.7 989.3 0.96
Source: Respective country investment plans and CAADP Roundtable Brochures No 4 (www.resakss.org).
The other challenge related to meeting the funding requirement of achieving the CAADP growth and MDG poverty targets is reflected in the numbers in the last column of table 4: Out of the set of countries for which estimates are available, only three show an elasticity of agricultural growth with respect to public expenditure that is above the African average of 3.1 estimated by Diao et al. (2010). For many of these countries, therefore, achieving the CAADP growth
42 First ASARECA General Assembly, Volume 2

target by 2015 or MDG1 within the next 10 years would require both an increase in the level and in the efficiency of agricultural sector funding. This is because these countries are already spending relatively high shares of their budgets on agriculture and also have historically recorded relatively lower levels of responsiveness of agricultural growth to public sector spending. Other countries have very little room to raise already very high shares of agricultural spending and thus would need to focus primarily on raising the efficiency of funding to the sector. Burkina Faso, for instance, would need to expand sectoral spending by less than 10% annually to meet the CAADP growth target and realize MDG1 by 2020 (table 1). However, the country is already allocating more than 20% of its budget to agriculture (table 2). On the other hand, the elasticity of agricultural growth with respect to public funding in that country is estimated at 0.24 or 20% below the average African estimate. Gambia, Liberia, and Togo, on the other hand, are currently spending much less on agriculture but require a significantly larger increase in agricultural spending (above 20%) to meet either the CAADP growth target or MDG1 by 2020. The three countries also have historically lower expenditure elasticities of growth compared to the African average, with estimates of 0.15, 0.22, and 0.11, respectively. Niger and Senegal are in a peculiar situation, characterized by high sector spending shares and above-average public expenditure elasticities of growth, but still needing to further increase sectoral funding, albeit moderately in the case of Senegal, to meet CAADP growth and MDG1 poverty targets.
The CAADP target of allocating at least 10% of national budgets to agriculture seems to suggest that most countries would require to significantly raise the level of funding allocated to the sector. The figures in table 3 show where individual countries stand with respect to the budget target. Although the average agricultural sector budget share for the sample as a whole is close to the CAADP target, there is a wide variation across countries, with shares ranging from about 3% in Sierra Leone to 22% in Niger.
Five of the 13 countries for which data is available, namely Burkina, Mali, Ghana, Niger and Senegal have managed to allocate at least 10% of their budget to agriculture. The first two have had historically high levels of agricultural funding, which is primarily explained by heavy subsidies to the cotton sector. Recently, Senegal has considerably expanded funding for agriculture under a variety of presidential programmes.
Not only do the funding levels vary across countries, but they have also been unstable over time. More noticeably, they have trended downwards for most countries during the decade and a half preceding the adoption of the CAADP expenditure target. The declining trend has continued in Ghana, Nigeria and Mali up until the time of compact signing, as shown by a comparison of shares in table 3 and by considering the shares for the two countries at the end of the period as shown in figure 3. In contrast, Senegal, Burkina, and to a lesser extent Benin have raised sector expenditures after the CAADP roundtable and the signing of the compact. On the other hand, Togo went from a stable and rising trend in expenditure levels to a sharp drop by the time of the signing of the CAADP compact. The change in trends in the latter country can be explained by the political crisis and interruption of external funding for the sector for most of the 2000s. The continued decline in sectoral funding in Côte d’Ivoire in the period leading up to the signing of the compact can also be explained by the political crisis in that country and its impact on local fiscal resources and domestic services delivery institutions.
The likelihood of countries expanding and sustaining levels of agricultural sector funding is not only a function of political will but also of domestic fiscal capacities. Figure 4 presents domestic resources as a share of total agricultural spending. In most countries, the domestic share represents 60% or less of total agricultural sectoral spending over the nearly 20-year period covered by the data.
To achieve the CAADP budget target by relying only on domestic sources, most countries would have to nearly double their current share of domestic resources in total agricultural spending. The mobilization of external funding will therefore be a critical component of CAADP implementation in most countries. This is particularly so for Niger and Burkina, which already allocate a significant share of overall funding to agriculture but rely on external sources for 80% or more of the funding for agriculture.
In addition to the level and efficiency of funding, the degree of actual budget execution has historically been the third dimension of the problem of effective financing for agricultural growth. As shown in figure 5, the average rate of disbursement of agricultural budgets is distinctly lower than that of overall budget execution, which for most countries is in the 80% range or lower. The exceptions are Burkina and Senegal, which show higher execution rates for agriculture, although it is to
43The emerging impact of CAADP as a planning and partnership platform

Figure 4: Share of internal resources in agricultural spending (%)Source: Based on agricultural budget data survey across West Africa countries
Figure 3: Trends in pre-compact agricultural sector budget shares (%).Source: Based on an agricultural budget data survey across West Africa countries
be noted that Burkina exhibits an extremely low rate of overall budget execution of less than 50%. High performers in terms of agricultural budget disbursement include Senegal, Nigeria and Ghana, with execution rates exceeding 90%; lagging behind are Burkina, Cote d’Ivoire, and Togo. The key message from figure 5 is that efforts to increase agricultural funding under CAADP will have to address the constraints to effective budget execution, which appears to be a general problem and not specific to the agricultural sector.
How consistent are agricultural investment priorities and related growth and poverty outcomes among the first group of implementing countries?
The National Agricultural Investment Plans (NAIPs) are the next step in the CAADP implementation process after the agreement around key policy, budgetary, and partnership priorities during the roundtable. They define specific sub-sector objectives and identify specific activities to be funded. The main priority sectors that cut across individual countries are presented in figure 6. They include: value chain development; food and other emergency crises and disaster management; research and development, including seeds systems; improved water and other resources management; and capacity building for successful implementation. The horizontal bars denote the percentage share of each of these sectors in the overall investment budgets of individual countries. The difference across countries reflects the diverging priorities accorded to individual investment areas. Although the differences most likely reflect different advances in specific areas by different countries, it is interesting to note the wide variations
Figure 5: Agricultural and overall budget disbursement rates (% for latest year).Source: Based on ReSAKSS survey of agricultural budget data across West Africa countries.
between countries. The overall level of planned investments is shown in the second column of table 4. It is in the one billion US$ range for most countries, and double that amount or more for four countries. It is highest for Ghana and Nigeria, where planned investment levels exceed the US$5 billion mark. The smallest countries, Cape Verde and Gambia, have, as expected, the lowest levels of planned investments. In addition to defining priority investment areas and investment levels, country investment plans, in many cases, also specify the targeted rate of agricultural growth. In others, they specify specific investment outcomes such as total area of land to be brought under irrigation or specific crop yields that can be converted to corresponding changes in overall output and translated into sector growth rates.
44 First ASARECA General Assembly, Volume 2

Ideally, the design of the investment plans should be guided by the results from the analysis of alternative growth and poverty reduction options. Planning and implementation were undertaken so speedily that the growth analysis and planning activities overlapped, leading to an iterative rather than sequential process in integrating the two sets of activities. However, all countries undertook a consistency analysis after the first version of the investment plan was completed. The consistency analysis assesses the extent to which investment levels as well as growth and poverty reduc-tion outcomes that are being pursued in individual country investment plans are in line with the alterna-tive long-term growth, poverty reduction, and funding requirement scenarios, as well as historical expenditure levels discussed in the previous sections. In carrying out the analysis, proposed investment activities and related crop yields and/or target sub-sectoral growth rates are fed into the country CGE models to simulate the overall rate of agricultural growth and reduction
in poverty levels that would result from individual country PNIAs. The results are then contrasted with the outcomes from the alternative long-term scenarios. The comparisons can be as detailed as looking at differences in subsector growth rates and poverty outcomes among targeted geographic areas or demographic groups.7
The current paper examines consistency between target outcomes under investment plans and long-term scenarios at the sectoral or national level. The results are summarized in table 4 and figure 6.Table 4 compares the sectoral growth targets and associated expenditure levels under individual investment plans (first and second columns) with that of the closest long-term growth scenario (third and fourth columns). The comparison suggests significant discrepancies between proposed investment levels and simulated funding requirements for similar rates of growth in some cases. As shown by the ratios in the last column, the
7. See IFPRI Discussion Paper No. 1019 by Badiane et al (2010)
Figure 6: Common priority areas in country investment plans.
45The emerging impact of CAADP as a planning and partnership platform

discrepancies are observed in both directions. In Gambia, Mali, Nigeria, and Benin, the investment plans appear to be significantly underfunded to deliver the expected growth outcome. In contrast, suggested funding levels for the investment plans appear considerably higher than required to meet the growth targets in the case of Sierra Leone, Liberia, and Guinea, and to a lesser extent for Cape Verde, Ghana, and Senegal. Only for Togo and Niger do the suggested funding levels appear to be consistent with projected long-term growth outcomes.
The consistency analysis also assesses how realistic the pursed poverty reduction outcomes are. It does so by comparing targeted poverty reduction levels under the investment plans with projected outcomes under continuation of pre-CAADP trends or BAU. The results are plotted in figure 7. Benin, Nigeria, and Guinea exhibit the largest potential improvement from successful implementation of country investment plans. The first two however appear to have underfunded their investment plans and are thus less likely to achieve the expected poverty reduction outcome. Gambia and Mali are the other countries with underfunded PNIAs, which may not achieve the expected improvement in poverty outcomes. Sierra Leone, Liberia, Guinea, Ghana, and Senegal all have seemingly overfunded PNIAs and should be in a position to realize the expected decline in poverty levels at a lower cost than budgeted under the current investment plans.
Emerging trends of agricultural investments and growth among African countries
While it is too early to say anything definitive about the impact of CAADP on the agricultural sector in Africa, there is no question that its implementation has been happening at a time when performance in the sector is improving (Badiane 2008). The continent has, indeed, been seeing a remarkable economic and agricultural recovery during the last 10–15 years. Not only did the overall economic and agricultural growth accelerate to reach average rates of 6% before the food price crisis of 2008, but it also spread extensively to encompass a large number of countries. Total agricultural factor productivity rose by about 50% around the same period, and per capita food production improved to reverse the decline observed during most of the 1970s and 1980s.8 It is particularly worth noting that the recovery was robust enough to survive the 2008 crisis, and growth rapidly returned to pre-crisis levels within a relatively short period of time.
Extensive adoption and implementation of the CAADP agenda at this particular time in the history of the development of the agricultural sector in Africa is of great significance. It offers the opportunity to further sustain and deepen the unprecedented pace of growth
8. See Nin-Pratt and Yu (2008) for an analysis of recent agricultural productivity among African countries.
Figure 7: Decline in poverty rates by 2015 under investment plans compared to pre-compact projections under BAU (%).
46 First ASARECA General Assembly, Volume 2

recovery of the last 15 years. If through CAADP a large number of countries manage to maintain a 6% growth trajectory, living conditions in the continent would change dramatically within a generation. At the turn of the century, only five countries exceeded the CAADP target agricultural growth rate of 6%. By the middle of the decade, that number had grown to 9%. By the end of the decade, 13 countries had achieved annual agricultural growth rates greater than 5%, as shown in figure 8. It is worth noting that this level of agricultural growth is similar to the level of agricultural performance witnessed by India during its Green Revolution.
Besides improvements in planning and implementation of sector policies and strategies, sustaining the recovery process would require increased funding for the sector, a major goal under CAADP. Conscious of the need to reverse the trends of declining investment in the sector, African heads of state, at the launch of the CAADP agenda in 2003, committed to allocating at least 10% of government budgets to agriculture by 2008. As shown by Figure 9a, some progress toward that goal has been achieved, but quite a bit remains to be done. Fewer than 10 countries have reached the 10% mark, while close to that number have budget shares exceeding 5%. Figure 9b offers a better picture of the changes that have taken place. Since the Maputo decision, the share of countries that have achieved the budget expenditure target has grown steadily. In contrast, the share of countries spending between 5% and 10% has declined, while the number of countries spending less than 5% of their
budget for agriculture has remained nearly unchanged. It appears from the trends depicted in figure 9b that half of the reporting countries have not responded yet to the call to increase agricultural funding, despite the fact that many are making steady progress towards that goal.
With the adoption of long-term investment plans in nearly two dozen countries in the last 24 months, it is to be expected that the number of countries moving toward the expenditure target will increase in the coming years. This conclusion can be drawn from Rwanda’s experience, the first country to sign a compact in 2007 and complete an investment plan in 2009. As shown in figure 10a, its agricultural budget has nearly doubled from RWF 18 billion in 2007 to RWF 31 billion in 2009 and more than doubled to reach RWF 66 billion by 2011. The budget share also doubled since the signing of the compact, from 3.5% in 2007 to 6.8% in 2011 (figure 10b).
Emerging alignment and trends in development assistance to agriculture
CAADP is also preparing the ground for more effective planning and use of overseas development assistance in the agricultural sector across African countries. After the initial scepticism among development agencies and crossing the significant hurdles in making an African-owned-and-led development agenda acceptable, all leading multilateral and bilateral agencies have now broadly embraced CAADP. The Global Donor Platform
Figure 8: Progress toward achieving the CAADP growth target, 2008. Source: www.resakss.org.
47The emerging impact of CAADP as a planning and partnership platform

Figure 9a: Progress toward achieving the CAADP budget target, 2008.Source: www.resakss.org
Figure 9b: Progress toward achieving the CAADP budget target, 2002–2008.Source: Based on ReSAKSS data (www.resakss.org).
for Rural Development (2009) has established a CAADP Development Partner Task Force, which regroups key technical and financial partner agencies working in agriculture. It has issued common guidelines to facilitate alignment and action on the ground by country-based agencies. A consortium of the same partners has established a multi-donor trust fund at the World Bank to support the implementation of CAADP activities by RECs, countries and the Lead Pillar Institutions. At the global level, the adoption of the L’Aquila Food Security Initiative and the Global Agriculture and Food Security Programme (GAFSP) are a further testimony
to the efforts by the development community to support the CAADP agenda: both have been strongly influenced by the CAADP agenda, with which they share key principles and values. The GAFSP Fund, which has also been established at the World Bank to support investment in the agricultural sector, reflects many of the CAADP review criteria in its guidelines and has earmarked 60–70% of its resources for African countries.9 In 2010, more than US$220 million, or about the equivalent of 10% of the overall agricultural official
9. See www.GAFSPfund.org.
48 First ASARECA General Assembly, Volume 2

development assistance (ODA) to Africa in 2007, were allocated by the Fund to support CAADP investment plans in just five African countries: Ethiopia, Niger, Rwanda, Sierra Leone, and Togo. The Feed the Future Initiative of the US government is another strong signal of alignment with the CAADP agenda. Under the initiative, the US government wants to provide funding to support CAADP investment plans in more than a dozen African countries. Already, significant resources are being disbursed to help create the capacities that are needed to ensure successful implementation of the plans.
The development community’s support to CAADP has come at a time when development assistance to agriculture is rising again after a long period of decline. Overall disbursements for agriculture and rural
Figure 10a: Changes in post-compact agri-cultural budget levels in Rwanda (in RWF), 2000–2011.Source: Rwanda SAKSS node.
Figure 10b: Changes in post-compact agricultural budget shares in Rwanda (%), 2000–2011Source: Rwanda SAKSS node.
development have increased steadily since 2005 and have now exceeded disbursements for development food aid and emergency food aid, as shown in figure 11a. There are strong indications that these trends have continued beyond 2007, the last year for which funding levels are shown. The reversal of the trends for ODA to agriculture is more visible in figures 11b and 11c. For the first time since the mid-1990s, after 2005, agricultural ODA significantly exceeded the US$2 billion mark, leading to a doubling of its share in overall ODA disbursements from 4% to 6%. For most of that period, ODA to agriculture was virtually stagnant while overall ODA grew steadily (figure 11c). However, since 2005, agricultural ODA has exhibited trends similar to that of overall ODA; and for the first time, beginning in 2007, it grew faster than overall ODA.
49The emerging impact of CAADP as a planning and partnership platform

Figure 11a: Recent trends in ag-ricultural official development assistance (ODA) versus food aid disbursements, 2000–2007, millions (constant 2007 USD).Source: ReSAKSS (2011).
Figure 11b: Recent trends in levels and shares of agricultur-al ODA for Sub-Saharan Africa (SSA), 1995–2007.Source: ReSAKSS (2011).
Figure 11c: Recent trends in agricultural versus overall ODA for Sub-Saharan Africa (SSA), 1995–2007.Source: ReSAKSS (2011).
50 First ASARECA General Assembly, Volume 2

Conclusions
The emerging trends discussed in this paper indicate that CAADP has already begun to impact agriculture in African countries substantially. Its systematic approach based on a limited number of shared, quantified goals; a collective framework for priority setting; reviewing, benchmarking, and learning to support planning and implementation; and the establishment of partnership platforms to facilitate joint action has created a credible agenda that has successfully mobilized country govern-ments, stakeholders, and the development communities in an unprecedented fashion. The improvement in the quality of planning has enabled governments, the broader agricultural constituency, and their develop-ment partners to better understand the nature of growth and poverty-reduction challenges they face as well as the options they have in working together to overcome them. The agreement around priorities and the open, fact-based dialogue about coherence, consistency, and realism of proposed programmes should improve the chances of successful implementation of the adopted investment plans.
The strong leadership and ownership of the agenda by the African constituency and the increasing alignment by leading multilateral and bilateral agencies have practically placed the decade-long model of development partnership on its head. African governments are no longer picking up ideas, terminology, in (some cases, even entire passages) from strategy and policy documents prepared by leading global agencies in elaborating their national programmes. On the contrary, the principles, values, and processes developed under CAADP are finding their way into the programme documents of these agencies. CAADP criteria are being adopted and investment plans developed through CAADP are serving as the basis for funding decisions.10 This is a significant development, not only in terms of the historical relationships between African countries and the development community, but also in terms of the likely impact of the continuity and consistency of the strategic focus of the development agenda. It may also lead to greater predictability of development assistance, given the longer-term orientation of CAADP and the country investment plans. All this should lead to better returns to development assistance resources.
The emerging trends are encouraging and point in the right direction: growth in the agricultural sector is
10. See for instance European Commission (2007); GAFSP guidelines (www.gafspfund.org); U.S. Department of State. (2010) Feed the Future Guide (www.feedthefuture.gov/guide.html).
being sustained; funding levels are rising; the quality of policy and planning documents is getting better; the availability of analytical tools, data, and capacities is improving; and strategic dialogue and partnerships around the agricultural sector are getting stronger and more inclusive.
References
Badiane O, Odjo S P,Ulimwengu, JM 2010. Building capacities for evidence and outcome-based food policy planning and implementation: The example of the Comprehensive Africa Agriculture Development Programme (CAADP). Discussion Paper No. 01019. International Food Policy Research Institute, Washington, DC.
Breisinger C, Diao X, Thurlow J, Yu B, Kalovali S. 2008. Accelerating growth and structural transformation: Ghana’s options for reaching middle income country status. Discussion Paper No. 00750.Governance and Development Strategy Division,International Food Policy Research Institute, Washington, DC.
Diao X, Dorosh P, Johnson, M, Benin S. 2010. Estimating agricultural spending requirements: Meeting the MDG poverty reduction target in Sub-Saharan Africa. Working Paper, International Food Policy Research Institute, Washington, DC.
Diao X, Nwafor M, Alpuerto V, Akramov K, Salau S. 2010, February. Agricultural growth and investment options for poverty reduction in Nigeria. Discussion Paper No. 00954. Governance and Development Strategy Division, International Food Policy Research Institute, Washington, DC.
European Commission. 2007. Advancing African agriculture: proposal on continental and regional level cooperation on agricultural development in Africa. Communication (2007) 440. Brussels.
Global Agriculture and Food Security Programme. 2010. Country guidelines for public sector windows proposals. The World Bank, Washington, DC.
Global Donor Platform for Rural Development. 2009. Guidelines for donor support to CAADP at a country level. The World Bank, Washington, DC.
Lofgren H, Harris R L, and Robinson S. 2001. A standard computable general equilibrium (CGE) model in GAMS. Trade and Macroeconomic Division Discussion Paper No. 75. International Food Policy Research Institute, Washington, DC.
Lofgren H, Harris R L, and Robinson S. 2002. A standard computable general equilibrium (CGE) model in GAMS. Microcomputers in Policy Research No. 5. International Food Policy Research Institute, Washington, DC.
51The emerging impact of CAADP as a planning and partnership platform

Nin-Pratt A, Yu B. 2008. An updated look at the recovery of agricultural productivity in Sub-Saharan Africa. Discussion Paper No. 00787. International Food Policy Research Institute, Washington, DC.
Thurlow J. 2004. A dynamic computable general equilibrium (CGE) model for South Africa: Extending the static
IFPRI model. Working Paper No. 1-2004. Trade and Industrial Policy Strategies, Pretoria, South Africa.
ReSAKSS. 2011. Agricultural Trends and Outlook Report 2010. Nairobi, Kenya
US Department of State. 2010. Feed the future guide. www.feedthefuture.gov/guide.html.
52 First ASARECA General Assembly, Volume 2

Executive Summary
Global food prices increased substantially between 2007 and 2008 but declined in the last half of 2008 and stabilized in 2009 only to begin surging again in 2010 to reach unprecedented peaks in February 2011. Indeed, the recent prices are the highest since the inception of the United Nation’s FAO food price index (FPI) in 1990 suggesting a renewed food price crisis. There was little price fluctuation when it came to domestic food prices within the eastern and central African (ECA) region, where prices remained persistently high throughout the period under review. As global food prices rose sharply and peaked in the first half of 2008, food prices within the ECA region increased too, but at lower rates. Furthermore, even though global commodity prices slumped in the second half of 2008 and stabilized throughout 2009, food prices within the ECA region remained high. In 2010 and 2011, food prices within the ECA region have continued to rise in tandem with world food price trends. This paper draws from several reports and briefs that have been prepared by the Regional Strategic Analysis and Knowledge Support System for Eastern and Central Africa (ReSAKSS-ECA) in collaboration with the Association for Strengthening Agricultural Research in Eastern and Central Africa (ASARECA) in the last three years. It presents the results, major conclusions and recommendations from the analysis to provide information on the nature, content, causes, effects and implications of what has been called the global food price crisis in the context of the ECA region. This information will be useful for governments, donor agencies and other stakeholders concerned with addressing the food price crises, both in the short and long term.
A key observation is that while the price rise involved most of the staple commodities, including maize, rice, wheat, and meat, different countries in the ECA region exhibited different patterns and were affected differently. Among the sample countries, FPI rose fastest in Ethiopia and Kenya in that order. Uganda started experiencing a surge in FPI in early 2010. Results
also show that domestic prices were more volatile than global prices. The differing pattern between global and domestic prices could be largely explained by the low transmission of global price changes to domestic markets, an indication of poor integration of ECA markets into international markets.
The factors behind the dramatic surge in global prices are varied and, to a large extent, remain contested. Many authors have argued that the overarching cause for the spike in global food prices was that demand had outstripped supply. However, recent evidence on the causes of the global food price crisis points to a combination of factors on both the supply and the demand side. On the demand side, the combination of rising incomes in developing countries, increasing world population, rapid urbanization, changing diets and an ever-increasing demand for biofuel products have been the driving forces. On the supply side, the combination of high agricultural input prices (especially fertilizers and fuel), climatic shocks, reduced world food stocks, reduced exports, underinvestment in agriculture and declining agricultural resources such as land and water have been associated with low supply of food commodities.
The food price crisis in the ECA region has been attributed to a combination of global causes and other region-specific factors. One of the dominant causes has been the rapidly expanding population, which has created a huge demand for food. Unfortunately, the region is also characterized by low agricultural productivity due to underinvestment in the sector, high input prices and recurrent droughts. As a result, food supply has not expanded adequately to match the increased demand for food, fuelling an increase in prices. Other specific causes of the food price crisis in the region include unstable macroeconomic conditions, inappropriate trade policies, poor transmission of international prices to domestic markets, natural disasters and conflicts.
The high and volatile food prices have different effects on different countries and members of the community. It can deliver tremendous benefits to the farming
4. High and volatile food prices: Drivers and impacts on food security in Eastern and Central Africa
Joseph Karugia
Paper prepared for the 1st ASARECA General Assembly14−16 December 2011
Entebbe, Uganda
53High and volatile food prices: Drivers and impacts on food security in Eastern and Central Africa

communities and countries whose economies are domi-nated by agriculture. However such benefits accrue mainly to net-producing households or net-exporting countries. Commercial farmers, who can respond to the increase in prices by increasing production, can potentially benefit from the price boom provided that changes in the prices are transmitted to them through the value chain. Net exporting countries benefit from increased sales revenues, and hence improved terms of trade. Despite these potential benefits of the surge in commodity prices, the high food prices have impover-ished many small farmers in ECA countries, leading to household food insecurity as most farming households are net buyers of food. The surge in food prices has also adversely affected ECA economies, especially those of net food-importing countries. Such countries face the threat of food price-induced inflation, large food import bills and deteriorating terms of trade, adding to food insecurity at both the national and the household levels. The food price situation has posed significant challenges to achieving the Millennium Development Goals (MDG) within this region, and, in particular, to reducing poverty and hunger.
There have been diverse responses to the food price crisis across countries in the ECA region. Overall, two interrelated categories of responses have been noted. First, international actions and policies that donors have advocated, and, secondly, country-specific responses that individual governments have initiated. Within the ECA region, the policy responses are greatly varied, but can be broadly classified into demand-side and supply-side policies. The most common responses broadly aim to ensure that the majority of consumers have an adequate and affordable food supply and that safety nets are provided for the most food insecure and vulnerable. They also aim at fostering a positive agricultural supply response.
The conventional consumption policies adopted to cushion consumers against the adverse effects of rising food prices in the ECA region included interventions such as food subsidies, food stamps, food for work projects, safety nets and tax reductions. The supply-side policies implemented to increase food production revolved around release of food reserves, input subsidies and producer price support measures. In addition to the demand and supply-side policies, several ECA countries adopted trade policies to cushion their producers and consumers. The most popular trade policy measures adopted to manage food price increases included import-tariff reductions and the imposition of export taxes and export bans.
Given the many social problems that the food price crisis has created within the ECA region, this report recommends the adoption of both short-term and long-term policy measures. In the short-term, governments and donors within the region can meet the food needs of the most vulnerable by providing emergency food aid, zero rating of duties on food imports, abolishing price controls and export restrictions and adopting food safety nets. In the long term, investing in smallholder agriculture is undoubtedly the most sustainable safety net for the region. Agricultural investment should focus on increasing productivity and access to inputs and markets so that farmers are less vulnerable and more capable of responding to production incentives.
In the short term, governments and donors within the ECA region can meet the food needs of the most vulnerable by pursuing the following demand and supply-side policy measures:• Provision of emergency food assistance, which can
be achieved through the distribution of food by both donors and governments and the release of reserve stocks of food staples by governments.
• Adoption of food safety nets to cushion the vulnerable against the adverse effects of the food price crisis (e.g. cash transfers, food stamps).
• The provision of agricultural inputs and services.• Abolishing price controls and export restrictions. • Adjustments in trade and tax policy measures.• Macro-economic policy management, such as
maintaining low inflation rates and reduction of domestic borrowing.
• Investing in and strengthening the early warning and disaster management systems.
In the long term, investing in smallholder agriculture is undoubtedly the most sustainable safety net for societies. The priority areas of investment that should be considered include: • Investment in agricultural research to create a
green revolution in Africa.• Investment in key agricultural services such
as extension services, to ensure that the latest technologies are disseminated to farmers.
• Investment in local infrastructure, including irrigation, communications, power and transport. In particular there is a need to invest in the “last mile” rural roads to ensure that what is produced by poor rural people can reach the markets and fetch a good price.
54 First ASARECA General Assembly, Volume 2

• Investment in rural financial services, markets and linkages so that smallholder farmers can buy fertilizers and better seeds, gain more control over when and where to sell their produce, and insure themselves against risks such as drought.
• Investment in agro-processing to add value to primary products and to reduce post-harvest losses and improve quality.
• Enhance the ability of farmers to cope with effects of changing climate through research and supportive climate adaptation policies.
Introduction and historical background
Overview
Over the last four years, global food prices have witnessed unprecedented increases. Indeed, a marked increasing trend can be discerned from around 2000 following a historical long-term decline in real prices that ended around 1987. Global food prices reached the highest recorded levels in February 2011, surpassing levels seen at the height of the 2007 –2008 food crisis and the highest since the inception of the United Nation’s FAO FPI in 1990 to suggest a renewed food price crisis. Compared to 1990, the FPI rose by 32% in 2007, by 56% in 2008, and by 92% in 2011. Domestic food prices within the eastern and central Africa (ECA) countries exhibit a somewhat different pattern from that of the global food prices (Karugia et al. 2009; Meijerink et al. 2009). While global food prices rose sharply and peaked in the first half of 2008, food prices within the ECA increased too, but at lower rates (Macharia et al. 2009). But while global commodity prices slumped in the second half of 2008 and stabilized throughout 2009, food prices within the ECA region defied the international food price trends and continued to increase. Domestic food prices in the ECA region remained relatively high in 2009 even as global food prices declined (Meijerink et al. 2009). In 2010 and 2011, food prices within the ECA region have continued to rise in tandem with global food price trends.
Evidently, the food price crisis has worsened an already bad food security situation in the ECA region. The rising food prices puts the ECA region at risk of a reversal in gains made towards the attainment of MDGs on hunger and poverty. The impacts of the high food prices in the region are complicated by unstable macroeconomic conditions (such as exchange rate, monetary and fiscal policies) that artificially keep food prices high. The crisis has been further compounded by other regional
factors like persistent droughts and political conflicts such as those experienced in Zimbabwe, Kenya and Madagascar (Okello 2009).
While there is ample information on the nature, content, causes, effects and implications of what has been called the global food price crisis, much less is known about the food price crisis in the ECA region. Yet, such knowledge is important to tackle future crisis situations. Furthermore, the role of policy in precipitating rather than preventing food crises has been largely ignored. Given the limited information and understanding of the crisis in the ECA region, ReSAKSS-ECA, in collaboration with ASARECA, has been tracking food prices and undertaking empirical evaluations of the price trends to generate information that will be useful for governments, donor agencies and other stakeholders to address the crises, both in the short and long term.
This paper, which draws from several reports and briefs that have been prepared by ReSAKSS in the last three years, presents the results and major conclusions and recommendations from the analysis.
Methods
Data collection involved collation of secondary data on domestic monthly wholesale food prices as well as macro data on consumer price indices and exchange rates from January 2007 to July 2011. The main data sources were national sources such as statistical agen-cies, central banks, ministries of agriculture, and other government agencies. These were complemented with data from national and regional agricultural and trade initiatives such as the Regional Agricultural Trade Intelligence Network (RATIN). Additional data were sourced from FAOSTAT (statistics division of the FAO). While the focus is countries in the ECA region, data limi-tations restrict the analysis to Djibouti, Ethiopia, Kenya, Malawi, Rwanda, Tanzania, Uganda, and Zambia. The dominant farming system in all of these countries is a maize mixed system (Jayne et al. 2006). These countries exhibit similar food consumption patterns and have traditionally traded with each other, both informally and formally.
Trend analysis was undertaken to provide evidence of the behaviour of food prices. The coefficient of variation was used as an indicator of price volatility. To understand the price transmission from world markets to domestic markets and among the domestic markets in ECA, a combination of qualitative and quantitative approaches was adopted. Since the
55High and volatile food prices: Drivers and impacts on food security in Eastern and Central Africa

current study focuses on the situation during the food price crisis (starting 2007 to 2011) emphasis is on assessing short-run price transmission effects among markets in the ECA region and between domestic and global markets. The price analysis adopted here includes some correlation analysis and comparison of proportional price changes as described in Dawe (2008). The correlation coefficient is estimated to test for integration of the domestic and global markets and also integration among domestic maize markets in the region. The Dawe approach involves comparison of world and domestic commodity prices expressed in real domestic currency terms; it is executed in three steps. First, nominal domestic prices are deflated using national consumer price indices and nominal world price is deflated using a real exchange rate (RER) that links the domestic currency with the US dollar. The RER is obtained by deflating the nominal exchange rate with a ratio of consumer price indices between the US and the domestic country. Second, quarterly average world and domestic prices expressed in real domestic currency terms is computed. Third, cumulative quarterly changes in world and domestic real prices are compared to determine the degree of price transmission between world and domestic markets. To control for seasonal factors, the last quarter of 2008 is compared with the last quarter of 2010. The last quarter of 2008 is used as the base period because during that span the global food prices dipped and
become relatively stable. This phase clearly shows a period when domestic and global food price trends varied after the 2007–2008 food price crisis. To account for inflation, the prices are expressed in real domestic currency terms. The analysis of price transmission effects focuses on maize, the most important staple food in many countries in ECA (De Groote et al. 2002).
A synthesis of the current food price situation
Comparing trends in global and domestic food price indices
FAO data suggests that the global FPI generally rose in the year 2007 and peaked in June 2008. Further, the global FPI remained low and stable after the food price crisis (figure 1). The decline in global food prices after 2008 was primarily due to a strong supply response; bumper harvests in many parts of the world; and a fall in demand as the world economy slowed down following the financial crunch of 2008. Domestic FPI in the ECA region, on the other hand, continued to increase specifically in Kenya, Tanzania, Uganda, Ethiopia and Djibouti until the first half of 2009 (Wanjiku et al. 2011). Further, Macharia et al. (2009) reported that although global food prices had embarked on a downward spiral by July 2008, prices in EA countries continued to defy the global downward trend and continued to increase throughout 2008 and early 2009. The increasing trend
Figure 1: A comparison of global and country food price indices.Data source: Ethiopia: Central statistical agency; FAO global: FAOSTAT; Kenya: central bank of Kenya; Rwanda: National Institute of Statistics; Tanzania: Bank of Tanzania; Uganda: Uganda Bureau of statistics; Zambia: Central statistical office; Malawi: Malawi national statistical office; Mauritius: Mauritius government
56 First ASARECA General Assembly, Volume 2

in domestic food prices eased in the first half of 2010 in tandem with the global prices. However, as predicted by Macharia et al. (2009) the easing of the upward trend presented only a very temporary, if any, relief to the food price crises facing individual countries in ECA. Food prices began to increase in the second half of 2010 and have continued to rise in 2011. The global food prices, too, took an upward turn in 2010, increasing at an average rate of 4% between June and November 2010. According to FAO, between July and August 2010, its global FPI increased to its highest level since October 2008, but it was still 18% lower than its peak in June 2008 (FAO Media Centre, 2010). In August 2010, FAO reported that the sudden sharp rise in global wheat prices following drought in the Russian Federation and the country's subsequent restrictions on wheat sales contributed to an increase in global FPI. In addition, the drought experienced in Thailand in 2010 may have contributed to increased global food prices considering that Thailand is the world's largest rice exporter. The global FPI reached its highest ever peak in February 2011.
High and volatile prices continued to persist in 2011 in eastern African countries. But the countries were affected differently. Ethiopia’s FPI remained the highest–above the other countries in ECA and above the global FPI since the first quarter of 2008. According to the Famine Early Warning System and Network
(FEWS NET) and World Food Programme (WFP), the primary causes for high food prices in Ethiopia are increased demand for food from urban population, and climatic factors such as successive years of below average rainfall, and low agricultural production. A detailed comparison of the price behaviour of individual commodities in different countries is presented the next section.
Comparing trends in prices of key staple crops and livestock products
Both global and domestic maize and wheat prices at 2007 constant prices fell after the food price crisis (figures 2 and 3). Since then global maize and wheat prices have remained relatively low and stable, with some increase in the last half of 2010, especially in wheat prices. On the other hand, maize and wheat domestic prices in ECA countries have remained high, volatile and above the global prices. During the last quarter of 2008, global maize prices dropped by 12%, while maize prices increased in domestic markets in the ECA countries covered in this study. In Kenya, Zambia, Ethiopia, Tanzania and Rwanda maize prices increased by 3%, 10%, 7%, 6% and 4% respectively. Further, analysis of the wheat prices shows a similar trend in the region with global wheat prices dropping by 7% but domestic prices increasing by approximately 4% in both Kenya and Zambia
Figure 2: Maize price indices (January 2007=100).Data source: FAO global: FAOSTAT; Kenya: Ministry of Agriculture; Ethiopia: Central Statistics Agency; Rwanda: RATIN; Uganda: Uganda Bureau of Statistics; Tanzania: Bank of Tanzania; Zambia: Central Statistical Office.
57High and volatile food prices: Drivers and impacts on food security in Eastern and Central Africa

during the last quarter of 2008. These trends show that domestic food prices rose faster than global prices, suggesting a weak relationship between international and domestic prices. The trends further confirm high price differentials among the countries in the EA region, with food prices increasing at different rates and at different times among the countries. This suggests a role for intra-regional trade to buffer food price volatility in the region. High food prices in one country occasioned by shortages can be ameliorated by availability of food at low prices from another country.
The first quarter of 2010 experienced traces of declining maize prices in ECA (maize prices dropped by 7% in Kenya and by 2% in Uganda, Ethiopia and Tanzania). According to FAO, the slight decline in maize prices in 2010 in some countries in the ECA region was due to increased production attributed to good weather conditions in maize-producing zones. This favourable food production situation deteriorated during the first half of 2011 in Kenya, which experienced the la Nina phenomenon (prolonged dry spell), following which maize prices increased substantially.
The increase in global wheat prices observed in August 2010 was the largest increase in a single month since January 2008. It was even higher than at the peak of the global food crisis in 2008, when prices were at their
highest at 16% in the month of February 2008. According to the FAO, the sudden sharp rise in global wheat prices between July and August 2010 was due to a severe drought in the Russian Federation and the country's subsequent restrictions on wheat sales through a ban on all grain exports. This scenario confirms the role of trade restrictions in increasing global food prices.
Global and domestic meat prices in selected ECA countries continue to increase. The increasing global prices of meat observed in 2010 were a result of tight supply in large exporting countries (Australia, Argentina and Uruguay), where there was a drought in 2009, after which export restrictions were imposed. This decline in supply was coupled with increased demand after the reversal of the 2009 economic recession. In 2010 and the first half of 2011, various countries in ECA, especially Kenya, Ethiopia and Uganda, experienced drought in livestock-producing areas. The resultant deterioration of grazing resources, poor animal conditions, livestock mortality and migration may have triggered the high bovine meat prices due to reduced supply in the market.
Generally, the inadequately developed marketing infrastructure in ECA countries might partly explain the high price differentials among domestic markets. Improving marketing and transportation infrastructure has a big role to play in improving the integration of ECA regional markets.
Figure 3: Wheat price indices (January 2007=100).Data source: Ethiopia: Central Statistical Agency; Kenya: Ministry of Agriculture; Zambia: Zambia Statistical Office; FAO Global: FAOSTAT.
58 First ASARECA General Assembly, Volume 2

Food price volatility
Domestic food prices are much more volatile than the corresponding global prices. The coefficient of variation of domestic prices of maize in Kenya, Uganda and Ethiopia is significantly greater than the coefficient of variation of the global maize price (table 1). The high price volatility in ECA is associated with the weak integration of regional food markets among themselves and the poor integration also with the global markets (see discussion of price transmission in the following paragraphs). The pattern of price changes shows that countries in ECA are likely to be affected differently by global price surges.
The severity of high food prices can vary from country to country, just as the price of a commodity may display
different behaviour in different countries in the region. This is also reflected in the trends analysis. For example, figure 2 shows differently maize prices behave in Ethiopia and Rwanda, with maize prices in Ethiopia remaining extremely high since 2007. The high volatility of food prices in the regional markets may also have been caused by the imposition of food trade restrictions such as export bans. Such bans increase uncertainties in markets and affect grain movement between markets.
Transmission among global and domestic food prices
Price transmission occurs when changes in the price of any given commodity in one place are reflected in changes in prices in another place. This occurs if markets are efficient and policies are not an obstacle to their operation. This section analyses the integration of regional maize markets among themselves and the integration of regional markets into global markets. The section further assesses the extent to which changes in world maize prices have been passed through to domestic prices and the extent of price transmission among regional domestic maize markets.
Table 2 presents correlation coefficients between global and domestic maize prices. Correlation coefficients vary between -1 and 1. The closer to 1, the more correlated the prices are and the higher the possibility that the markets are integrated. The coefficient of correlation is close to 0 when there is no link between the two sets
Figure 4: Meat price indices (January 2007=100).Data Source: FAO Global: FAOSTAT; Ethiopia: Central Statistical Agency; Uganda: Uganda Bureau of Statistics; Zambia: Central Statistical Office, Monthly Statistical Bulletins.
Table 1. Volatility of global and domestic maize prices (Febru-ary 2007–July 2011)Countries Coefficient of variation %Kenya 35.85Uganda 36.86Zambia 23.04Ethiopia 41.19 Tanzania 24.52Rwanda 25.06FAO GLOBAL 25.82
Data source: FAO global: FAOSTAT; Kenya: Ministry of Agriculture; Ethiopia: Central Statistics Agency; Rwanda: RATIN; Uganda: Uganda Bureau of Statistics; Tanzania: Bank of Tanzania; Zambia: Central Statistical Office.
59High and volatile food prices: Drivers and impacts on food security in Eastern and Central Africa

of prices. Further, low correlation coefficients signifies that the markets are unconnected by actual movements of commodities from one market to another. The simple correlation coefficient is a popular measure of market integration because it is easy to implement. However, it masks the presence of other synchronous factors such as general price inflation, seasonality and procurement policy (Karugia et al. 2004). It is therefore used here as an indicator of possible market integration but not a conclusive one. The results in table 2 suggest insignificant correlation between global and most domestic maize markets in ECA, signifying a lack of integration between global and domestic markets.
Table 3 presents correlation coefficients of prices in domestic maize markets. All correlation coefficients are positive suggesting that maize prices in various markets in ECA tend to move in the same direction with significant integration. Maize prices in Uganda and Kenya tend to be highly correlated. Some correlation is also observed between Ugandan and Ethiopian maize markets, Kenyan and Ethiopian maize markets, and also between Ethiopian and Tanzanian maize markets. This implies that maize price changes in the region are likely to be transmitted across the borders to domestic markets in Uganda, Ethiopia, Tanzania and Kenya. Table 3 reports that the highest correlation coefficient is between maize prices in Uganda and Kenya (0.89) closely followed by Kenya and Ethiopia (0.79).
In general, the correlation coefficients between global and domestic maize markets were found to be lower than among the various domestic maize markets. This indicates that domestic markets have some degree of integration among themselves but no integration was noted between the domestic and global markets. Integrated markets play a crucial role in improving the food security situation of a country or region. Where markets are well integrated, price changes will cause the flow of food from surplus to deficit areas and food will flow from markets where the prices are low to where prices are high, reducing food shortages. These results highlight the importance of strengthening and implementing the regional approach articulated in Common Market for Eastern and Southern Africa (COMESA) and East African Community (EAC) treaties of addressing food security in the region. The potential of regional trade in addressing the persistently high food prices in the ECA region needs to be exploited.
Price transmission effects were also assessed by comparing proportional changes in domestic maize prices against the global prices. Table 4 displays
Table 2: Correlation coefficients between global and domestic maize prices (February 2007–July 2011)Country Correlation CoefficientsKenya 0.32Uganda 0.30Tanzania 0.29Ethiopia 0.07Rwanda 0.04Zambia -0.07
Data sources: FAO Global: FAOSTAT; Kenya: Ministry of Agriculture; Ethiopia: Central Statistics Agency; Rwanda: RATIN; Uganda: Uganda Bureau of Statistics; Tanzania: Bank of Tanzania
Table 3: Correlation coefficients between domestic maize prices (February 2007–July 2011) Uganda Kenya Tanzania Rwanda EthiopiaUganda 1 0.89* 0.52* 0.51* 0.67*Kenya 1 0.72* 0.68* 0.79*
Tanzania 1 0.41* 0.67*
Rwanda 1 0.48*
Ethiopia 1Data source: FAO Global: FAOSTAT; Kenya: Ministry of Agriculture; Ethiopia: Central Statistics Agency; Rwanda: RATIN; Uganda: Uganda Bureau of Statistics; Tanzania: Bank of Tanzania *Significant at the 5% significance level
Table 4: Cumulative percentage changes in real global and domestic maize prices between last quarter of 2008 and the last quarter of 2010
Column (1) Column (2) Column (3) Column (4)
CountriesWorld price
(US$)World price
(DC)Domestic price (DC)
(4) Pass through (%):
(3)/(2)Kenya -203.16 -146.14 4.31 -2.95Uganda -203.16 -51.58 -133.13 258.13Tanzania -203.16 -185.82 5.75 -3.10Ethiopia -203.16 17736.91 825.86 4.66Rwanda -203.16 -57.66 -4.43 7.69
Note: DC = Domestic CurrencyData Source: FAO Global: FAOSTAT; Kenya: Ministry of Agriculture; Ethiopia: Central Statistics Agency; Rwanda: RATIN; Uganda: Uganda Bureau of Statistics; Tanzania: Bank of Tanzania
the cumulative percentage change in the world and domestic prices of maize expressed in real local cur-rency terms between the last quarter of 2008 and the last quarter of 2010 for selected countries in the ECA region. The results reveal that real US dollar world prices for maize decreased during both periods. This confirms the downward trend of global maize prices after the food price crisis as earlier reported (see figure 2). A comparison between columns (2) and (3) reflects the degree of price transmission between world and
60 First ASARECA General Assembly, Volume 2
domestic markets; column (4) reflects the ratio between columns (3) and (2). According to Dawe (2008), there is strong price transmission between the world prices and domestic prices when the ratio in column (4) is above 85% and a country is pursuing free trade policies. The results show no price transmission for maize in all the countries with the exception of Uganda, which reflects price transmission between Ugandan local markets and the global markets. This suggests that the observed decrease in the global price of maize has not passed on to domestic wholesale maize prices in most EA maize markets. The analysis implies that specific country polices are key determinants of domestic prices, with little influence from global prices.
Proportional price changes in maize markets in EA were also analysed to understand price transmission effects among the domestic markets (table 5). By comparing the quarterly changes (last quarter of 2008 and last quarter 2010), maize prices increased in Tanzanian markets by about 6%, Kenyan markets by 4% and increased sharply in Ethiopian markets by 826%. This spurt in maize prices in Ethiopia is attributed to drought in 2009, market distortions and increased demand in urban areas. Maize prices decreased in Ugandan and Rwandan markets. The highest decrease was reported in Uganda (-133%). Uganda did not apply any restrictions on trade, thus formal and informal trade was freely exploited in the country. In addition, maize is not a staple food in Uganda thus with good weather conditions, prices are likely to decline.
Maize markets that are likely to be significantly inte-grated based on a comparison of proportional price changes include markets in Uganda, Kenya, Tanzania and Ethiopia. The results in table 5 support the results from the correlation analysis presented earlier. The cells show the degree of price transmission between markets. For example, only about 3.2% of a price change in Nairobi is reflected in price changes in Kampala. On the other hand, there is a strong transmission (3000%) of price changes from Kampala to the Nairobi market.
This may reflect the direction of causality and magni-tude of trade flows. The integration of maize markets can be strengthened by elimination of barriers that weaken market integration, for example, non-tariff barriers and trade restrictive policies. If the markets are well integrated, the price changes will cause the flow of food from surplus to deficit areas.
Causes of rising and volatile food prices
The factors behind the dramatic increase in global prices are varied and to a large extent remain contested. Many authors have argued that the overarching cause for the spike in international food prices was that demand had outstripped supply. However, the 2008–2009 decline in world food prices was not caused simply by a fall in demand or an increase in supply, but rather a combination of economic factors that suggest that the food crisis is not yet over. Most analysts support the argument that none of the factors in isolation would have caused the surge in food prices. This section discusses the causes of the international food price crisis and explores their relevance in the context of the ECA region.
Demand-side factors
On the demand side, the combination of rising incomes in developing countries, increasing world population, rapid urbanization, changing diets and an ever-increasing demand for biofuel products have been the driving forces behind the food price crisis.
In the recent past, many developing countries have experienced high economic growth and continue to show strong sustained growth, especially China and India. The sustained high economic growth rates have resulted in higher household incomes and increase in the numbers of the middle-class population, leading to the rise in food prices (Polaski 2008). The growth in income is a key driver of change on the demand side of the world food equation. As consumer incomes increase, demand for meat, milk (and other dairy
Table 5: Cumulative percentage price change between first quarter of 2008 and last quarter of 2010–real domestic prices for maizeVariables Nairobi Kampala Dar Addis KigaliPrice change (%) 4.31 -133.13 5.75 825.86 -4.43
Pass through (%)*
Nairobi 100.00 -3.24 74.94 0.52 -97.23Kampala -3087.83 100.00 -2314.02 -16.12 3002.40Dar 133.44 -4.32 100.00 0.70 -129.75Addis 19154.29 -620.32 14354.19 100.00 -18624.34Kigali -102.85 3.33 -77.07 -0.54 100.00
*Computation for pass through (%) of Nairobi’s price change relative to Kampala’s price change is -3.24= (4.31/-133.13)*100Data sources: RATIN (Kenya, Uganda, Tanzania, Rwanda); Central Statistics Agency (Ethiopia)
61High and volatile food prices: Drivers and impacts on food security in Eastern and Central Africa

products) and eggs, which are dependent on grains as feedstock, rises. The increased consumption of livestock products leads to an increase in demand for food grains for consumption, animal feed, and industrial use. Rapid income growth in China has contributed to increased oilseed demand, causing the prices to climb as the country has been increasing soybean imports for its livestock and poultry industry (Mitchell 2008). Given the high dependence on food imports in the ECA region, the rising incomes in other parts of the world translate to increased food prices.
According to the United Nations (2008), the world population has grown substantially over the last five decades. The rapid increase in population has pushed up the demand for food, while supply has been unable to keep pace, causing food prices to increase. This food consumption gap is likely to widen since the global population growth is postulated to continue until at least 2050, and projections indicate that this growth will mainly take place in developing countries. The rapid population growth implies that there are now more people to feed against very low food stocks, which exerts pressure on the world food supply, leading to increases in food prices. Interestingly, most developing regions make up an ever-increasing share of the world’s population at a time when growth in food production has been dismal. The hunger situation within the ECA region is complicated by the internal disparities that make certain population categories vulnerable to price changes.
Over the last century, the world has witnessed rapid urbanization, resulting in population explosions in the cities and other urban places. By the end of 2008 it was estimated that half of the world’s population would be living in urban areas (UN 2008). The shifts in population patterns bring with them radical changes in food consumption patterns. Urbanized populations consume less basic staples and more processed foods and livestock products (Rosegrant et al. 2001). The rapid urbanization within the ECA region has been accompanied by an increased demand for livestock products, which has important implications on the prices of beef and milk.
An increase in the production of biofuel is considered one of the demand-side factors that have contributed greatly to the rapid increase of food prices (Mitchell 2008; Valk 2008). At least 100 million tonnes of food grains are converted to biofuel annually (Asian Development Bank 2008). The extent of biofuel’s contribution to the increase in food production has however been controversial. The American government claims that
biofuels are responsible for an overall increase of only 3% (Chakraborty 2008). In contrast, the International Food Policy Research Institute (IFPRI) estimated that the demand for biofuel in the period 2000–2007 accounted for 30% of the weighted average increase of cereal prices (Von Braun et al. 2008). Others analysts like Valk (2008) argue that even 30% is a conservative estimate.
The ECA countries do not produce biofuel and the effects on food prices could only be indirect through transmission of global food prices.
Supply-side factors
On the supply side, the combination of high agricultural input prices (especially fertilizers and fuel), climatic shocks, reduced world food stocks, reduced exports, underinvestment in agriculture and declining agricultural resources such as land and water have been associated with low food supply. In other words, demand outstrips supply causing a hike in food prices.
Further, the increasing international oil prices are driving up the costs of transportation, freight and processing of agricultural products. The high transport costs make international markets less attractive for bulk commodities such as staple grains. It has become more expensive to cultivate, including buy fertilizers, and transport crops, leading some farmers to reduce production. To make matters worse, in response to the high food prices, some countries, such as China, have enacted high export taxes on fertilizers to protect domestic farmers (Cha and McCrummen 2008).
In Africa, many farmers are incapable of responding to the high commodity prices because they lack access to input markets. As in the global scene, increasing prices of key agricultural inputs such as fertilizers, fuel for transportation constrain supply response even as food prices rise in the ECA region. The high fertilizer prices are likely to reduce an already very low intensity of fertilizer use even further. The situation is further exacerbated by a poor physical infrastructure, which constrains the distribution of both agricultural inputs and outputs. Thus, the high input prices within the ECA region limit food production and increase the prices of available food commodities.
World cereal stocks in 2008 were 5.4% lower than their 2005 levels. The global wheat and coarse grain stocks were lower in 2008 than in 2005 at 15% and 4% respectively. Most of the decrease in food stocks resulted from reduced planting and adverse weather conditions in some major producing and exporting countries such
62 First ASARECA General Assembly, Volume 2

as Argentina, Australia, Canada, the EU, United States, India, Pakistan, Thailand, and Vietnam (FAO 2009). Canada and Australia had more than 40% reduction in cereal stocks in 2008 as compared to the levels for 2005, while EU, Argentina and United States had more than 20% reduction. Other countries that experienced reductions include Morocco, Nigeria, Tunisia, South Africa, Russian and Syria. It is unlikely that these food stocks will be fully replenished over the coming ten years, implying that tight markets may be a permanent factor in the period up to 2017 (OECD 2008).
On the positive side, there were increases in cereal stocks over the same period in China, India, Pakistan, Philippines, Egypt and Tunisia at 17%, 33%, 33%, 48%, 32% and 58% respectively (FAO, 2009). In response to perceived food shortages, major food-producing countries imposed restrictions on grain exports. This served to fuel price surges; the situation was made worse when importing countries sought to purchase larger than normal volumes to build stockpiles (Von Braun 2007).
However, food stocks in sub-Saharan Africa (SSA) increased by about 9% between 2005 and 2008 but declined by 1% between 2008 and 2010 (FAO 2009). The levels of stocks held by the African countries are quite low when compared to the stock levels in Asia. FAO has reported that 23 countries still face food shortages in the SSA. Six of these are from the ECA region, namely, Burundi, DRC, Eritrea, Ethiopia, Kenya and Madagascar. The low levels of stocks in these countries have important implications on food prices in the region.
Underinvestment in agriculture is one of the long-term structural factors behind the food price crisis in Africa. Investments from both the public and private sectors to agriculture have been declining. Official development assistance (ODA) has been declining in the past two decades (World Bank 2007; Karugia et al. 2008) and fell from 18% in 1980 to 4% of the total assistance in 2007 (Ngongi 2008). At the country level, some countries in Africa have received very small proportions for agricultural investment out of the total ODA The low level of public sector investment in agriculture has been a major limitation to agricultural growth in developing countries.
Countries in sub-Saharan Africa invested 0.72% of their agricultural GDP in agricultural R&D as compared to 2.36% for developed countries in 2000 (World Bank 2007). Low funding has also limited transfer and uptake of technologies that can increase land productivity. Therefore, as demand has been increasing for food
products, African countries have been unable to increase yields to match the demand. Policy and financial neglect has resulted in farmers in Africa being unable to respond adequately on the supply side (Ahmed et al. 2008).
In cognizance of the low levels of investment in agriculture, African leaders have committed to allocate at least 10% of their budgets to the sector by 2008 as per the Maputo declaration of 2003. However, only a few of the African countries have managed to meet that target. In ECA for example, only one country (Ethiopia ) has managed to reach that target. Recently several countries have shown a positive trend towards greater allocation of resources to the sector, including Sudan, Tanzania, Uganda and Zambia. The low levels of investment in agriculture in the region have undermined productivity, which limits the supply of food commodities, contributing to the rising food prices in the region.
It should, however, be noted that it is not only a matter of increasing budgetary allocations to agriculture; how the resources are used is equally, if not more important (ReSAKSS 2007). Efficiency in the utilization of public resources is another issue that needs to be addressed. There is evidence of inefficient use of available resources across the agricultural sub-sectors and also across economic classifications in the ECA countries as it is the case in many other developing countries (Edmeades 2007; Fan, Omilola and Lambert 2009). A majority of these countries also allocate limited funds to R&D to enhance farm technology, irrigation, and rural infrastructure development–areas which can make a significant contribution to economic growth and poverty reduction (Lambert and Mac Neil 2009; Diao et al. 2008).
Food production in this region is further complicated by the scarcity of productive resources such as land and water. Most of the arable land is already under cultivation and this coupled with land resource degradation and competition with other uses frees limited land for food production. As a result food production is low and cannot match the demand, thereby pushing up food prices. Sub-Saharan Africa lags behind the rest of the world in the use of potential irrigable land and consequently its contribution to food supply. To increase food production, more land needs to come under irrigation. However, this would have to be done in the face of challenges of water scarcity and competing demand from an expanding urban sector. Among all the developing regions of the world, Africa has the lowest per capita water availability (MacLean and Voss 1996). Therefore, more efficient systems of irrigation would have to be adopted to ensure efficient water use.
63High and volatile food prices: Drivers and impacts on food security in Eastern and Central Africa

While evidence of the impact of climate change on global food production is not conclusive, the verdict of the International Panel on Climate Change (IPCC) is that extreme weather events will dramatically impact world food security. The world is witnessing increasing uncertainty and variability in rainfall and droughts. Risk-averse farmers and support agents overestimate the negative impacts and are hence reluctant to invest and exploit the opportunities of average and good seasons, which increases their vulnerability to climate shocks. In relation to the recent food price crises in ECA, weather varaibility, especially frequent droughts and floods, have posed a significant problem in countires such as Kenya and Ethiopia.
The other important economic factors that have con-tributed to the food price crisis include speculation, dysfunctional markets and the financial crisis. Specula-tion is often cited as a cause of increasing world food prices, but it can also be a symptom. According to the FAO, speculation has contributed to the persistence of high and volatile food prices (FAO 2008). Other studies have pointed at another possible short-term supply-side issue and attribute some current price volatility to speculative investors seeking safety in commodity markets from the weak American dollar and falling equity and bond markets (Evans 2008). The recent international financial crisis contributed to falling world commodity prices, but this should not be seen as a sign that the food price crisis is over; rather, the two have become complexly intertwined in ways that have implications for food security and economic stability. Existence of dysfunctional markets is another important factor causing the increase in food prices in the ECA region. Domestic markets in the region are small and fragmented, with individual farmers selling small quantities of the same product at spot markets characterized by information asymmetries. There is considerable trade potential associated with small markets and the phenomenon of staggered har-vesting, since surplus areas can supply food to deficit areas within and between countries. However, this potential is not fully exploited. In many ECA member countries, sub-regional and regional markets are poorly integrated due to infrastructure limitations and tariff and non-tariff barriers to trade. The existing market imperfections are complicated by the trade barriers in the region. These barriers are unpredictable and make it risky for trading firms to invest in developing durable marketing networks. They also impose transaction costs on investors and traders, which results in lower demand and lower prices for farmers and higher prices for consumers. For instance, in reaction to rising food
prices, Egypt, Tanzania, Kenya, Ethiopia, Malawi and Zambia imposed export restrictions in an attempt to shore up their own domestic supplies. The market imperfections reinforced by the existence of trade barri-ers keep food prices high in the region.
Insecurity is another factor affecting the food security situation in the ECA region. This disrupts food supply (production and marketing). Several countries in the region face conflicts or are emerging from conflicts, for example, DRC, Sudan, Uganda, Ethiopia, Djibouti, parts of Kenya (in 2007) and Zimbabwe. Over the years, availability of irrigated agricultural areas has shrunk. High agricultural potential areas in swathes of DRC, Southern Sudan and northern Uganda are not readily opened up due to conflicts. Besides providing facilities for human habitation, areas emerging from conflict will require basic infrastructure to support agricultural production. The insecurity worsens the food price situation and can be thought of as a regional casual factor of the high food prices.
Challenges of high and volatile food prices in ECA
High and volatile prices pose serious challenges to countries, households and individuals. The effects of the food price crisis depends on a variety of factors: (i) the extent of international price transmission to domestic markets; (ii) the ability of farmers to respond to price incentives through increased production or investments in productivity; (iii) whether households (countries) are net buyers (importers) or net sellers (exporters); (iv) household consumption patterns and the availability of other food options; (v) the share of household income devoted to food; and (vi) gender. This section discusses the impacts of the food price crisis on food security, economic growth and poverty reduction, natural resources, markets and trade, farmers’ welfare and gender.
Effects of the high and volatile food prices on food security
The food price crisis threatens the nutrition and food security status of the poor because they erode their already limited purchasing power (Von Braun 2008). The poor in ECA spend about 50–70% of their income on food. This also affects most small scale farmers who are net buyers of food. In fact, the high international food prices of 2007 and early 2008 led to increases in the number of malnourished and pushed more people into poverty. The food price crisis is estimated to have
64 First ASARECA General Assembly, Volume 2

largely contributed to the increase in the number of undernourished people worldwide from 848 million to 963 million between 2003–2005 and 2008 (FAO 2008). FAO estimates that the proportion of undernourished people in sub-Saharan Africa increased by 1% in 2007 due to the rise in food prices (FAO 2008).
Therefore, the recent food price situation has posed a significant challenge to the achievement of the MDGs, and in particular to the reduction of poverty and hunger. Furthermore, many countries in eastern Africa have faced unstable weather conditions in the form of floods (Uganda) and drought (Kenya), disrupting food production. Other factors including weak marketing institutions and poor road infrastructure have aggrevated the effects of food price increase.
Effects of the food price crisis on economic growth and poverty reduction
High food prices in the COMESA region have the potential to affect economic growth by inhibiting farmers and governments from investing in agriculture or other productive investments due to the need to spend more resources to acquire food. The rising food prices have adversely affected economies of ECA countries, especially those that are net importers of food. Countries such as Kenya have experienced food price-induced inflation, large food import bills and deteriorating terms of trade, adding to the problem of food insecurity at both the national and household levels. This is then likely to negatively affect the economies and reduce the gains in economic growth that have been achieved in the past decade by most countries in the region. The average real GDP growth rates for many of these countries increased between 2004 and 2008, but declined in 2009 following the food price and financial crisis. The low economic growth is likely to negatively impact investment and productivity, with direct ramifications for food prices and food security (Von Braun 2008).
The high food prices are likely to negatively affect progress in poverty reduction. The 2008 crisis elicited concerns that the rising food prices may completely eliminate gains made in poverty reduction over the preceding ten years (Valk 2008; World Bank 2008). The World Bank estimated that the 2008 crisis could push 100 million people into poverty, including 30 million in Africa. Minde et al. (2008) show that increases in prices of staple foods in southern Africa may have resulted in 2% and 4.4% increases in poverty in Malawi and Zambia, respectively.
Effects of the food price crisis on natural resources
One of the most prominent global impacts of the food price crisis has been increased competition for land and water resources for agriculture, which has resulted in a revaluation of natural resources (Von Braun 2008). As a result, farmland prices have increased and water resources have been overexploited.
It was reported that, in the ECA region, exploitation of natural resources increased as people struggled to get food during the crisis. High prices of meat and meat products triggered poaching of wildlife and overfishing. Similarly, high food prices meant that the poor could not afford to pay for energy, compelling them to encroach into forests for fuel wood. Others engaged in charcoal production, logging, sand mining and other environmentally destructive activities to generate extra cash to purchase food, adding to the already alarming rates of deforestation and soil erosion. In the long run, the food price crisis may lead to greater deforestation and encroachment into protected areas as the poor, who rely on subsistence farming, might opt to expand the land under food production.
Effects of food price volatility on markets and trade
The high food prices have a particularly negative effect on trade for the African continent, which is a net food importer and spends about 20 billion dollars annually on food imports. For instance, 45% of the rice and 85% of the wheat consumed in Africa is imported. The high import bill leads to negative terms of trade for the majority of African countries. Within the ECA region, cross-border trade in staple grains continues to flourish despite the export bans imposed by various countries like Tanzania, Malawi, Zambia and Ethiopia. Most cross-border trade in ECA is informal and food commodities move from surplus to deficit areas at different times of the year.
Effects of the food price crisis on farmers’ welfare
The surge in food prices has different effects on different members of the community. It can deliver tremendous benefits to the farming communities and countries whose economies are dominated by agriculture. However such benefits accrue mainly to net producing households. Commercial farmers, who can respond to the increase in prices by increasing production, can potentially benefit from the price boom provided that changes in the prices are transmitted to them through the value chain. Net exporting countries benefit by experiencing increased revenues from sales, and thus improved terms of trade.
65High and volatile food prices: Drivers and impacts on food security in Eastern and Central Africa

Though, in some cases, poor farmers may be able to benefit from increased prices. In the short term, however, this will be rare because they are still generally net buyers of food (FAO 2008). There is the possibility that increased food prices may encourage higher levels of production, which would increase agricultural wages, thereby reducing poverty. In the short term, the impact of soaring food prices on households depends crucially on the farmer’s position as producers and consumers with regard to agricultural output and food markets. Poor households that spend a large proportion of their income on tradable staple products are likely to be the ones who are going to be the worst affected.
Despite these potential benefits of the surge in com-modity prices, high food prices impoverish many small farmers in developing countries and lead to household food insecurity as most farming households are net buyers of food. The surge in food prices adversely affects most developing country economies, especially those of net food-importing countries. Such countries face the threat of food price-induced inflation, large food import bills and deteriorating terms of trade that add to the problem of food insecurity at both the national and household levels. Therefore, the recent food price situation has posed a significant challenge to the achievement of the MDGs, and in particular to the reduction of poverty and hunger especially among net food buying households and the urban poor.
Gender dimensions of food price volatility
Men and women experience the food price crisis differ-ently. Landless and female-headed households appear to be negatively affected by the food price crisis because they are almost always net-food buyers and lack the necessary resources, or access to those resources, that would allow them to increase production in response to rising food prices (FAO 2008). Moreover, pregnant women and lactating mothers are severely affected by the rising food prices (FAO 2008; Oxfam and Save the Children 2008). Studies have indicated that even without the food price crisis, women tend to be more vulnerable to food insecurity than men due to several other factors (Coon 2008; Freeman et al. 2008). The rising food prices would therefore worsen the food security status of women. Women are less able to cope with and overcome crises of various kinds because they have less access to and control over productive resources such as land, assets, transport and communication because of cus tomary laws and social discrimination (Quisumbing et al. 2008; Coon 2008; Freeman et al. 2008; Holmes et al. 2009).
Women in Africa own only 1% of the land and also have limited access to training, inputs, capital, credit and transportation (Holmes et al. 2009). Estimates from recent studies suggest that women receive 7% of agricultural extension services and less than 10% of the credit offered to small-scale farmers (Bafinga 2008 in Holmes et al. 2009). Furthermore, time and labour constraints limit potential productivity on their own farms (Holmes, Jones and Marsden 2009). A recent study conducted in southern Africa (Malawi, Lesotho and Zambia) found that there are marked differences in ownership of productive assets, in livelihood strategies and vulnerability, including food insecurity, between men and women ( Freeman et al. 2008). The study noted that women, particularly the elderly, widowed and divorced women, and female-headed households, comprised a huge proportion of those classified as vulnerable due to lack of key assets such as land and livestock, labour constraints to cultivate their fields, and non-existent or loss of supplementary income from a partner.
In addition to resource and asset constraints, women in Africa tend to be less educated than men and tend to have lower incomes. Across the ECA member states, the literacy rate for men in 2007–2008 was higher than that of women. Given the lack of control of and access to productive resources and assets, low education and income, women (especially the poor in urban and rural areas) in ECA are more vulnerable to the effects of the food price crisis. They face a higher risk of being negatively affected by the crisis, not only because they are primarily responsible for the management of food in the household, but also because they are often the ones who buffer the impact of the crisis at the household level through decreased consumption (Holmes et al. 2009). Furthermore, due to the gender division of labour, rising prices can have repercussions for women in the ECA countries, as they face greater time constraints since they have to travel longer distances to find cheaper, but more labour-intensive, foods to prepare.
Opportunities of high food prices to ECA
While the high staple food prices in global and domestic markets pose considerable challenges, they also present a number of opportunities to the domestic economies of ECA countries.
Benefits to farmers
Rising food prices have the potential to positively incentivize farmers and policymakers to invest in
66 First ASARECA General Assembly, Volume 2

agricultural production and productivity. It should be recalled that, during the period of declining food prices in the 1980s, there was a concern that the low prices were a disincentive for governments, donors and farmers to invest in agriculture. Increased food prices may encourage higher levels of production, which would increase agricultural wages, thereby reducing poverty. Increased productivity of smallholders is good for growth and poverty reduction. These benefits are likely to be experienced by countries that are net food exporters and households that are net sellers of food. However, many countries in ECA are net importers of food, while many small-scale farmers in the region buy more food than they sell.
Effects on trade flows and regional integration
Food price crises have the potential to spur cross-border trade within the ECA region between surplus and deficit areas. Such trade would be prevalent in food staples such as cereals and tubers. Policies that improve the efficiency of trade would contribute significantly to food security in the region. Policies such as export tax or export bans should be avoided as they dampen incentives to producers and fuel speculation in the market.
Regional trade has the potential to not only reduce price volatility and food insecurity (Haggblade 2008); it also has the potential to stimulate agricultural growth in production zones. However, trade barriers of various kinds, often imposed in an unpredictable manner, currently create a less than favourable investment climate for farmers and agribusinesses. Predictable trade policies that ensure cross-border market access are required to stimulate agricultural growth. In addition, public investments in production and marketing infrastructure, and agricultural support services are required to attract private investments, which will help commercialize food production and trade, enhance productivity and competitiveness, and foster regional integration.
Implications for investments in agriculture and world trade order• The rising and volatile food prices refocused
attention on agriculture and pushed it to the top of the international development agenda. The 2007–2008 crisis elicited divergent responses from governments and the international development community to avert social instabilities; it also prompted an interactive dialogue to identify appropriate measures to tackle the problems.
Overall, policy analysts, scientists and development partners agreed that policies and programmes needed to be put in place to address the negative impacts of the price rise and to tap opportunities to spur agricultural growth in developing countries.
The high food prices also offer a window of opportunity to make progress on the Doha Round of the world trade negotiations. From the perspective of high-income countries, the farmers no longer needed to be protected as the prices are high. However, developing countries will need to protect (facilitate) their farmers from the effects (to take advantage) of rising food prices. Trade agreements lowering import tariffs would reduce the burden on consumers in both developed and developing countries. The impact of the Doha Round on global agricultural trade and the current food price crisis would depend on the extent to which industrial and developing countries liberalize trade in agricultural products and the capacity of the latter to respond to new market opportunities. COMESA, EAC and SADC should take the advantage presented by the high food prices to extract maximum benefits from the Doha round and other initiatives geared towards opening of markets for African exports.
Policy actions in response to the food price crisis
National governments responded to the 2008 world food crisis in several ways. In general, the focus of the national policy was on guaranteeing an adequate and affordable food supply for the majority of consumers, providing safety nets for the most food insecure and vulnerable and fostering agricultural supply (table 6). Measures related to food supply and food trade were the most popular responses and included increasing food supply, reducing tax and tariff on food, controlling prices and restricting exports. Tax reduction on food was implemented in eight countries to improve food security in the short and long run, especially for consumers who depend mostly on markets for their food supplies. Export bans, on the other hand, were implemented in six countries and may have helped in controlling domestic prices in the short run; however, when imposed during times of shortage as was the case in 2008 and 2009, the restriction did not stop trade as anticipated but increased the price of cross-border transaction costs. The control of staple food movement through export bans may translate into high volatility of the prices in regional markets as the restrictions increase the uncertainties of food movements between markets. Countries like Ethiopia, Kenya and Tanzania
67High and volatile food prices: Drivers and impacts on food security in Eastern and Central Africa

Tabl
e 6: O
verv
iew o
f pol
icy re
spon
se m
easu
res t
o hi
gh fo
od p
rices
in th
e ECA
regi
on
Safe
ty n
ets f
or th
e vul
nera
ble
Food
supp
ly an
d fo
od tr
ade
Agric
ultu
ral p
rodu
ctio
n
Coun
tryFo
od
subs
idies
Cash
tra
nsfer
Food
for
work
and
food
for
train
ing
Food
ra
tion/
stam
p an
d vo
uche
rsSc
hool
fe
edin
g
Incr
ease
su
pply
usin
g fo
od g
rain
st
ocks
Incr
ease
su
pply
via
impo
rts
Redu
ce
taxe
s on
food
Price
co
ntro
ls/Co
nsum
er
subs
idies
Redu
ctio
n of
tarif
fs
and
cust
om
fees
on
food
im
ports
Rest
ricte
d or
ban
ned
expo
rt
Agric
ultu
ral
inpu
t sub
si-di
es (m
ostly
fe
rtiliz
ers &
se
eds)
Incr
ease
ad
min
-ist
ered
pr
ices f
or
prod
ucer
s
Ince
ntive
s fo
r ex
pand
ing
prod
uctio
n (c
redi
t)
Lowe
r im
port
tarif
fs fo
r in
puts
e.g.
fe
rtiliz
ers
Burundi
√
√√
√
√
√
Co
moros
DRC.
√
√ √
√
√
Djibo
uti
√
√√
√
Eritre
a√
√
√
Ethio
pia√
√√
√ √
√√
√√
√
Ke
nya
√
√√
√√
√√
√√
√√
√√
√Rw
anda
√√
√
√
√
√√
√√
Seychelles
Sudan
√
√
√
√√
Tanzania
√
√ √
√
√
√√
√
Uganda
√
TOTA
L4
58
66
43
85
36
41
11
Consistent w
ith longer run p
olicie
s to imp
rove food se
curity
Some
concerns relating
to longer run food s
ecurity
Likely
to create problem
s for longer run food s
ecurity de
pending
on du
ration a
nd targeting
Highly likely
to create problem
s for longer run food s
ecurity an
d/or create
serious problem
s for ne
ighbouring
countrie
s S
ourc
es; W
orld
Ban
k, 2
008;
FA
O, 2
008;
Kar
ugia
et a
l, 20
09; O
kello
, J.J
, 200
9; w
ww
.wfp
.org
; ww
w.fa
o.or
g
68 First ASARECA General Assembly, Volume 2

imposed maize export bans throughout 2009 (FEWS NET 2010a). This could explain why the food prices in the EA region remained high even after the food price crisis was over, exacerbating food insecurity. Export bans in EA encouraged corruption, increasing transfer costs, which was transferred to consumers through higher food prices (Okello 2009). Currently the export bans have been lifted in Tanzania (2013), Kenya (2010) and Ethiopia, and this is likely to open up cross-border trade. However, the region faces numerous tariff and non-tariff barriers to trade, including poor transport infrastructure and lack of marketing information systems, which are challenges to development of regional trade as they increase transaction costs, pushing up food prices.
The Ugandan government, on the other hand, did not impose any bans, quotas, or other restrictions on trade in food commodities (IFPRI 2008b). Instead, it focused on reducing taxes on food, thereby improving food security. Since maize is not the staple food crop in Uganda, high maize prices would benefit farmers and not hurt consumers. On the other hand, bananas are part of the staple diet and therefore a non-tradable commodity. Through sensible policymaking, Uganda has managed to stay food secure when the rainfall is good.
Price control is another measure that was implemented by five countries in the EA region. Price controls have a short-term positive effect on lowering consumer prices, but a long-term detrimental effect on farm gate prices. Kenya has gone through a regime of price controls (IRIN 2010). The Kenyan government, in November 2008, introduced consumer subsidies and price controls. Consequently, the millers were able to buy maize at subsidized prices while consumers enjoyed reduced and controlled prices for maize. Price control in Kenya was associated with claims of manipulation, corruption and political interference (IRIN, 2010). In February 2009, the Kenyan government removed the price subsidies for millers and price controls for consumers and the maize prices started rising again. But during the first half of 2010, maize prices in Kenya and some countries in the EA region declined due to increased production attributed to good weather conditions, which improved food access. The declining maize price trend changed again during the first half of 2011, when maize prices rose. Thus the maize prices in this region are affected not only by the domestic policy but also by the climatic conditions.
Another popular policy measure was to increase domestic food supply by releasing national food stocks. Four countries implemented this measure. The Kenyan
government, through the National Cereals and Produce Board (NCPB), released maize from the strategic reserves to stabilize market prices in 2008. This release of maize resulted in a significant reduction in reserve stocks (Barasa 2008), causing national food deficits, and led to a spurt in maize prices. The private sector in Kenya, including the millers, moved in to import maize, thereby increasing food access. In Ethiopia, by early 2010, the government, through the Ethiopian Grain Trade Enterprise (EGTE), was still importing wheat as a measure to stabilize markets (FEWS NET, 2010b). However, by early 2010, most countries in EA benefited from reduced maize prices due to improved harvests associated with good rainfall. On the twist, first half of 2011 reported declining maize stocks and subsequent rising prices.
Social safety net programmes was the other popular intervention implemented in the region to help the vulnerable cope with the food price crisis. It involved mainly food-for-work and food-for-training programmes, which were implemented in eight countries (table 6). Other social safety net programmes implemented included food subsidies, cash transfer, food ration and school feeding programmes. In 2005, the Ethiopian government initiated the Productive Safety Net Programme (PSNP) to provide reliable and timely support to chronically food-insecure households. The beneficiary households experienced a significant improvement in food security. These programmes are still running in Ethiopia and Kenya and include the cash transfer and food ration programmes in northern Kenya due to the 2011 drought.
School feeding programmes were implemented in six countries. These programmes encourage poor families to keep their children in school. They existed even before the food price crisis in some countries (Kenya and Ethiopia) and continue to run in some schools in Kenya.
From table 6 we can also see that very few countries implemented measures to increase agricultural pro-duction, despite its paramount role in improving food security in the long run. To enhance agricultural pro-duction, we need policies that will lower production costs through agricultural input subsidies. However, high input prices, mainly fertilizer and transportation costs, dampen the producers’ ability to increase output even when output prices are rising. The Kenyan government adopted a fertilizer subsidy that report-edly boosted agricultural production (Levine 2010). However, the poor transportation system and increas-ing fuel prices have significantly pushed up fertilizer prices.
69High and volatile food prices: Drivers and impacts on food security in Eastern and Central Africa

The governments in the EA region mainly resorted to short-term policies that reduced prices for consumers, paying minimal attention to policies aimed at stabilization of prices and markets. This explains the persistently high and volatile prices. Most governments paid little attention to interventions aimed at increasing domestic food production by triggering a supply response to the crisis. Farmers did benefit from the high prices, but they also faced high production costs due to high input costs. Despite the various policy actions adopted to curb rising food prices, the region has continued to experience persistent high and volatile food prices. Other regional factors, especially climate, may have exacerbated the food price crisis.
Future directions and recommendations
Despite the various policy actions adopted in the ECA region to curb rising food prices, the region has continued to experience persistent high and volatile food prices, implying that the policies may not have been effective. The analysis presented in this paper indicates poor integration of domestic markets into global markets and weak integration among the domestic markets in the region. Countries in ECA are affected differently by global price surges. The severity of the impact of high food prices varies in different countries and is also seasonal. This establishes a case for regionally coordinated responses to exploit regional diversity. A regional approach benefits from the food deficits and surpluses that exist simultaneously in different countries in the region. Policy actions for exploitation of this diversity should aim at facilitating regional trade, enhancing regional market information and intelligence systems, and promoting innovations to reduce costs of inputs by exploiting economies of scale in procurement of agricultural inputs. Improvements in regional market information and intelligence systems would go a long way in enhancing regional trade.
Given the many social problems that the current food price crisis has created within the ECA region, this report recommends the adoption of both short to medium-term coping strategies and long-term surveillance measures by governments, donors and farmers. The short-term coping strategies protect the poor without distorting the domestic food economy. On the other hand, the long-term “resilience” measures allow farmers to take advantage of production incentives while also stabilizing the economy to prevent vulnerability to future crises and price variability.
Short-term coping strategies
In the short-term, governments and donors within the ECA region can meet the food needs of the most vulnerable by pursuing the following demand and supply-side policy measures:• Provision of emergency food assistance: This can
be achieved through the distribution of relief food by both donors and governments and the release of reserve stocks of food staples by governments.
• Adoption of food safety nets to cushion the vulnerable against the adverse effects of the food price crisis, including cash transfers and food stamps.
• The provision of agricultural inputs and services.• Abolishing price controls and export restrictions.• Adjustments in trade and tax policy measures.• Macro-economic policy management measures.
such as maintaining low inflation rates and reduction of domestic borrowing.
• Investing in and strengthening the early warning and disaster management systems.
Long-term resilience measures
In the long term, investing in smallholder agriculture is undoubtedly the most sustainable safety net for societies. The priority areas of investment that should be considered include: • Investment in agricultural research to create a
green revolution in Africa.• Investment in key agricultural services, such
as extension services, to ensure that the latest technologies are disseminated to farmers.
• Investment in local infrastructure, including irrigation, communications, power and transport. In particular, there is a need to invest in the “last mile”–rural roads – to ensure that the produce can actually reach the markets and fetch a good price.
• Investment in rural financial services, markets and linkages so that smallholder farmers can buy fertilizers and better seeds, gain more control over when and where to sell their produce, and insure themselves against risks such as drought.
• Investment in agro-processing to add value to primary products and to reduce post-harvest losses and improve quality.
• Enhance the ability of farmers to cope with effects of climate change through research and supportive climate adaptation policies.
70 First ASARECA General Assembly, Volume 2

References
Von Braun J, Ahmed. A, Asenso-Okyere K, Fan S, Gulati A, Hoddinott J, Pandya-Lorch R, Rosegrant MW, Ruel M, Torero M, van Rheenen T, von Grebmer K. 2008. High food prices: The what, who, and how of proposed policy actions. IFPRI Policy Brief. Washington, DC: International Food Policy Research Institute.
Benson T, Nicholas M, John P, Miguel R, von Braun J. 2008. Global food crises: monitoring and assessing impact to inform policy responses. Food Policy Report. International Food Policy Research Institute (IFPRI), Washington.
Cha AE and McCrummen S. 2008. Financial meltdown worsens food crisis: as global prices soar, more people go hungry." Washington Post, 26 October 2008.
Coon K. 2008. The Food Crisis and Gender: Foreign Policy in Focus (www.commondreams.org/view/2008/11/01-3).
Dawe D. 2008. Have recent increases in international cereal prices been transmitted to domestic economies? The experience in seven large Asian countries. ESA Working Paper No. 08–03.
De Groote H, Doss C, Lyimo SD, Mwangi W. 2002. Adoption of maize technologies in East Africa: what happened to Africa’s emerging maize revolution? Paper prepared for the FASID Forum V, Green Revolution in Asia and its Transferability to Africa, Tokyo, December 8–10, 2002.
Delgado C, Rosegrant M, Steinfeld H, Ehui S, Courbois C. 1999. Livestock to 2020: The next food revolution. Food, Agriculture and the Environment Discussion Paper 28. IFPRI, Washington, DC, USA/FAO, Rome, Italy/ILRI, Nairobi, Kenya.
Demeke, M, Pangrazio, G, and Maetz, M. 2009. Country responses to the food security crisis: Nature and preliminary implications of the policies pursued, Initiative on Soaring Food Prices. Mulat Demeke, Guendalina Pangrazio and Materne Maetz of the Agricultural Policy Support Service, FAO. Accessed in August, 2009. http://www.fao.org/fileadmin/user_upload/ISFP/pdf_for_site_Country_Response_to_the_Food_Security.pdf.
Diao X, Fan S, Kanyaruukia S, Yu B. 2008. Agricultural growth and investment options for poverty reduction in Rwanda. ReSAKSS Working Paper # 21. IFPRI, Washington, DC.
Edmeades S. 2007. Main messages and supporting evidence for public expenditure on agriculture. Background note prepared for use by World Development Report (WDR) 2008, Accessed in July 2009: http://www1.worldbank.org/publicsector/pe/pfma07/MessagesEvidence.pdf
Evans A. 2008. Rising food prices: drivers and implications for development. Publication No: CH BP 08/02). The Royal Institute of International Affairs. Accessed in July 2008: http://www.cic.nyu.edu/internationalsecurity/docs/foodbriefingpaper.pdf
Fan S, Omilola B, Lambert M. 2009. Public spending for agriculture in Africa: Trends and composition. ReSAKSS Working Paper No. 28. April 2009. Accessed in August 2009: www.resakss.org.
[FAO] Food and Agriculture Organization of the United Nations. 2008. The state of food insecurity in the world 2008: High Food Prices and Food Security - Threats and Opportunities. FAO, Rome.
-----------. Soaring food prices: facts, perspectives, impacts, and actions required. Information Paper prepared for the High-Level Conference on World Food Security: The Challenges of Climate Change and Bioenergy, Rome, 3–5 June, FAO, Rome.
FAO Media Centre. 2010: Available: http://www.fao.org/news/archive/stories-2010/en/. Accessed November 2010.
Freeman A, Kaitibie S, Moyo S, Perry B. 2008. Livestock, livelihoods, and vulnerability in Lesotho, Malawi, and Zambia: designing livestock interventions in emergency situations. ILRI Research report number 8. ILRI, Nairobi, accessed in August 2009. http://www.ilri.org/Infoserv/webpub/fulldocs/LivestLivelihoo_ResRepo8/MalawiEmergency_RRep8.pdf.
FEWS NET. 2010a. East Africa regional food security outlook January to June 2010.
FEWS NET. 2010b. Ethiopia food security update, March 2010.
Haggblade S, Govereh J, Nielson H, Tschirley D, Dorosh P. 2008. Regional trade in food staples: prospects for stimulating agricultural growth and moderating short-term food security crises in Eastern And Southern Africa. Michigan State University, East Lansing. Presented to the AAMP Training Workshop and Policy Seminar, Nairobi, Kenya.
71High and volatile food prices: Drivers and impacts on food security in Eastern and Central Africa

Holmes R, Jones N, Marsden H. 2009. Gender vulnerabilities, food price shocks and social protection responses, Background note, August 2009. Overseas Development Institute (ODI), London, United Kingdom, Accessed in September 2009. http://www.odi.org.uk/resources/download/3285.pdf
[IFPRI] International Food Policy Research Institute. 2008a. IFPRI Forum, October 2008. Available: http://www.ifpri.org/sites/default/files/publications/if23.pdf. Accessed January 2011.
[IFPRI] International Food Policy Research Institute. 2008b. An assessment of the likely impact on Ugandan households of global food prices: A secondary data analysis. International Food Policy Research Institute Kampala office, Kampala, Uganda, June 2008.
[IRIN] Integrated Regional Information Networks. 2010. The humanitarian news and analysis service of the UN Office for the coordination of humanitarian affairs. Available: http://www.irinnews.org/Report.aspx?ReportId=89687 .
Jayne TS, Zulu B, Nijhoff JJ. 2006. Stabilizing food markets in Eastern and Southern Africa. Food Policy 31(4):328–341.
Jayne T, Chapoto A, Minde I, Donovan C. 2008. Rising world food prices and the political economy of food in eastern and southern Africa. Presentation made Egerton University Tegemeo Institute of Agricultural Policy, Nairobi, September 17–18, 2008.
Karugia J, Waithaka M, Freeman A, Prabhu R, Shiferaw B, Gbegbelegbe B, Massaw S, Kyotalimye M, Wanjiku J, Macharia E. 2009. Responding to food price crisis in eastern and southern Africa: Policy options for national and regional action. ReSAKSS Working Paper No. 27. April 2009.
Levin J. 2010. Poverty impact of rising maize prices in Kenya. Mimeo. Örebro University, Sweden.
Macharia E, Gbegbelegbe S, Wanjiku J, Karugia J. 2009. Food prices: eastern and southern Africa defy global trends. ReSAKSS Issue Brief No. 12, July 2009. Available: http://mahider.ilri.org/bitstream/10568/180/1/resakss%20issuebrief12.pdf. Accessed February 2011.
Maclean R, Voss J. 1996. Allocation of water resources in Africa: Potential for moving water. In p. 39–49, Rached E, Rathgebr E, Brooks DB, eds. Water management in Africa and the Middle East: challenges and opportunities. IDRC, Ottawa, Canada.
Meijerink G, Roza P, Berkum S. van. 2009. East African governments' responses to high cereal prices. LEI Wagenin-gen UR, The Hague.
Minde I, Chilonda JP, Sally H. 2008. Rising global food prices–policy challenges and options for southern Africa. ReSAKSS Issue Brief No. 6. The Regional Strategic Analysis and Knowledge Support System (ReSAKSS), Washington, DC.
Ministry of Agriculture, Kenya: http://www.kilimo.go.ke/index.php?option=com_content&view=article&catid=84:questions-area&id=112:fertilizer-prices-in-kenya-since-the-year-2000: Accessed January, 2011.
Mitchell D. 2008. A note on rising food prices, vol. 1 of 1. Policy Research Working Paper No. 4682. The World Bank. Retrieved from http://econ.worldbank.org.libproxy.txstate edu/external/default/main?pagePK=64165259&piPK=64165421&theSitePK=469372& menuPK=64166093&entityID=000020439_20080728103002.
Ngongi N. 2008. Policy Implications of High Food Prices for Africa. In Responding to the global food crisis: three perspectives. International Food Policy Research Institute (IFPRI), Washington, DC.
[OECD] Organization for Economic Cooperation and Development. 2008. Rising food prices: causes and consequences. OECD, Paris, France. Accessed in December 2008. www.oecd.org/dataoecd/54/42/40847088.pdf.
Okello JJ. 2009. The 2007–2008 food price swing: impact and policies in Kenya. Discussion Paper. Project on policies for good economic management of food price swings in Africa: FAO Trade and Markets Division.
Oxfam and Save the Children. 2008. Rising food prices in the Sahel: the urgency of long-term action. Based on a survey in West Africa by Oxfam and Save the Children. Accessed in July 2009 http://www.oxfam.org/sites/www.oxfam.org/files/bn-rising-sahel-food-prices-urgency-of-long-term-action-0812.pdf.
Polaski S. 2008. Rising food prices, poverty, and the Doha Round, Carnegie Policy outlook, May 2008, Accessed in June2009. http://www.carnegieendowment.org/files/polaski__food_prices.pdf.
Quisumbing A, Meinzen-Dick R, Bassett L. Helping women respond to the global food price crisis. 2008. IFPRI Policy Brief 7. International Food Policy Research Institute (IFPRI), Washington, DC.
72 First ASARECA General Assembly, Volume 2

Rosegrant MW, Paisner MS, Meijer S, Witcover J. 2001. Global food projections to 2020: Emerging trends and alternative futures. Washington, D.C. International Food Policy Research Institute.
Rosegrant M. 2008. Biofuels and grain prices: Impacts and policy responses. Testimony for the U.S. Senate Committee on Homeland Security and Governmental Affairs, 7 May 2008, Accessed on 27 August 2009. ht tp://www.ifpri.cgiar.org/sites/default/files/publications/rosegrant20080507.pdf.
RATIN. 2008. East Africa Food & Trade Bulletin No. 47, Accessed in January 2011 http://www.ratin.net/documents/RATIN%20Food%20%20Trade%20Bulletin%20February%202008.pdf.
United Nations. 2008. United Nations Population Division. An overview of urbanization, internal migration, population distribution and development in the world*. Paper presented at the population meeting 21–23 January 2008, New York, Accessed in August 2009. http://www.un.org/esa/population/meetings/EGM_PopDist/P01_UNPopDiv.pdf.
[UNICEF] United Nations Children's Fund. 2006. The state of the world's Children 2007: the double dividend of gender equality. UNICEF, New York: http://www.unicef.org/sowc07/. Accessed on September 2007.
Valk. 2008. ICTs and the global food price crisis, Background Study, Report prepared for ACACIA Program Initiative, International Development Research Centre (IDRC), August 2008. Version 1.0, Accessed in June 2009 ht tp://www.idrc.ca/uploads/user-S/12415313181ICTs_and_the_Global_Food_Price_Crisis_v1_0.pdf
Von Braun J. 2007. The world food situation: new driving forces and required actions (ISBN No: 0-89629-530-3). International Food Policy Research Institute (IFPRI); online access: http://www.ifpri.org/pubs/fpr/pr18.asp.
Von Braun J. 2008a. Food and financial crises: implications for agriculture and the poor. Food Policy Report No. 20. International Food Policy Research Institute (IFPRI), Washington DC.
Von Braun J, Ahmed A, Asenso-Okyere K, Fan S, Gulati A, Hoddinott J, Pandya-Lorch R, Rosegrant MW, Ruel M, Torero M, van Rheenen, T and von Grebmer K. 2008b. High food prices: the what, who, and how of
proposed policy actions. IFPRI Policy Brief, May 2008. International Food Policy Research Institute (IFPRI), Washington DC.
Von Braun J. Interview by David Biello. Has the food crisis abated? Scientific American, December 15, 2008.
Wanjiku J, Wambua J, Karugia J. 2011. Trends of staple food and input prices: global and regional overview, 2007–2010. Available: http://ilrinet.ilri.cgiar.org/Datafiles/files/ReSAKSS-ECA/Trends_of_staple_food_prices_in_ESA_2007-2010.pdf.
World Bank. 2007. World Development Report, 2008. Quebecor World, The World Bank, Washington, DC. Available from http://go.worldbank.org/ZJIAOSUFU0
World Bank. 9 April 2008a. Rising food prices threaten poverty reduction. World Bank. Online access: http://go.worldbank.org/QLBJFC7XI0.
World Bank. 2008b. Rising food prices: policy options and World Bank Response. Background note for the development committee, Online access: http://siteresources.worldbank.org/NEWS/Resources/risingfoodprices_backgroundnote_apr08.pdf.
World Bank. 2008c. 2008 World Development Indicators, Poverty Data, A supplement to World Development Indicators 2008, The World Bank, Washington DC, Accessed in April 2009. http://siteresources.worldbank.org/DATASTATISTICS/Resources/WDI08 supplement1216.pdf
Websites
Bank of Tanzania http://www.bot-tz.org/ Accessed May 2011
Central bank of Kenya www.centralbank.go.ke/ Accessed May 2011
Ethiopia central statistical agency www.csa.gov.et/ Accessed May 2011
Famine Early Warning Sytems www.fews.net/ Accessed May 2011
Food and agricultural organization of the United Nations (FAO) www.fao.org/worldfoodsituation/wfs-home/foodpricesindex/ Accessed May 2011
73High and volatile food prices: Drivers and impacts on food security in Eastern and Central Africa

National institute of statistics of Rwanda www.statistics.gov.rw/ Accessed May 2011
Tanzania national bureau of statistics http://www.nbs.go.tz/ Accessed May 2011
Uganda bureau of statistics www.ubos.org/ Accessed May 2011
Malawi national statistical office http://www.nso.malawi.net
Madagascar national institute of statistics (Institut National de la Statistique de Madagascar) http://www.instat.mg
Ministry of Agriculture, Kenya http://www.kilimo.go.ke/ Accessed May 2011
Government of Mauritius http://www.gov.mu
National Bank of Rwanda http://www.bnr.rw/ Accessed May, 2011
National Bank of Ethiopia http://www.nbe.gov.et/ Accessed May 2011
Regional Agricultural Trade Intelligence Network http://www.ratin.net/ Accessed May 2011
Regional Strategic Analysis and Knowledge Support System www.resakss.org
World Food Program www.wfp.org
Zambia central statistical office (http://www.zamstats.gov.zm)
74 First ASARECA General Assembly, Volume 2

Abstract
This paper seeks to highlight one of the major contra-dictions bedevilling efforts to feed the ECA region in the present times. Whereas the gendered management system of food production in particular and agricultural production in general has changed little over the last century, the bio-physical production system has under-gone tremendous change. As a result, there has been an increasing demand for food without commensurate increases in food production. While the deteriorating bio-physical production system that has depressed food production has evidently received research and policy attention, the static gendered management system, unfortunately, has received scanty attention. This is because the gendered management system is part of the broader structure of gender relations that are so entrenched in the formal and informal institutions in society that they are treated as a given or “natural”. Hence, agricultural and social scientists and policy makers rarely recognize the challenges posed by the gendered management system to food production.
Yet, evidence abounds that this system entitles males with ownership and control of resources and decision-making powers in the production, exchange and consumption of food more than it does the females. Paradoxically, the responsibility for food provision-ing within smallholder farming systems in the ECA region lies predominantly with females. Herein lies the challenge for feeding the ECA region from a gender perspective–those who are customarily responsible for food production are less entitled by the same custom. Asymmetries in males’ and females’ entitlements are the base for gender inequalities not only in the agricultural sector but also in the wider sectors of society. Therefore, if the goal of feeding the entire ECA region is to be realized, we cannot continue with “business as usual”
without addressing the constraints and challenges embedded within the static gendered management system of food production.
These constraints and challenges can best be addressed through mainstreaming gender in agricultural research and development. Gender mainstreaming is a glob-ally accepted strategy for promoting gender equality. Mainstreaming is not an end in itself but a strategy, an approach and a means to achieve the goal of gender equality. It involves ensuring that gender perspec-tives and attention to the goal of gender equality are central to all activities in policy development, research, advocacy/dialogue, legislation, resource allocation, and planning, implementation and monitoring of policies, programmes and projects. It is in this context that we examine the role of mainstreaming gender in agricul-tural research and development and its contribution to feeding our region in the twenty-first century.
Introduction
Agriculture in general and food production in particular within the ECA region have near similar bio-physical production and management traits. Bio-physical production traits comprise crops, pastures, animals, soil and climate, together with certain physical inputs and outputs. Management traits refer to people, values, goals, knowledge, resources, monitoring opportunities and decision-making processes within the agricultural sector. Specifically, the region exhibits the following bio-physical traits: less than 2 hectares are cultivated per household; rudimentary tools (hand hoe, axe and panga) are used; a mixed portfolio of crops is cultivated along with the rearing of animals; and there is an overwhelming reliance on indigenous planting and stocking materials.
5. The role of mainstreaming gender in agricultural research and development, and its contribution to feeding our region
in the 21st centuryHenry Manyire
School of Women and Gender Studies, Makerere University, P.O. Box 7062, KampalaEmail: [email protected]; [email protected]
A paper presented at the First ASARECA General Assembly held 14–16 December 2011 in Entebbe, Uganda
75The role of mainstreaming gender in agricultural research and development

With regard to management traits, agricultural/food production in much of the region is of the smallholder type and organized within and around the household. There is an overwhelming reliance on household labour and production is largely for household consumption. In addition, smallholder agriculture and rural ways of life are intimately intertwined. Rural ways of life are an embodiment of the cultures and values of a people. Thus, agricultural knowledge, skills and practices are informally passed on from generation to generation through socialization processes alongside other social and economic skills (including productive, reproductive, household maintenance, and so forth) that are deemed essential for societal existence and continuity in general and for raising children to become responsible adults in particular. Other forms of socialization include inculcating acceptable cultural/ethnic specific behaviour, attitudes and life skills in children. Responsible adulthood is, in most cases, understood as the ability to raise and cater for a family, within the structures of subsistence existence. Food self-sufficiency is the pride of subsistence existence, for market purchase of food is frowned upon as characteristic of the lazy. In fact, the eligibility of marriage candidates in many rural communities in the region was and is still weighed alongside levels of farm-level industriousness and, subsequently, food self-sufficiency in the natal homes of the potential candidates. That is why, up to today, there are very few smallholder farmers in the region who cultivate one crop largely for the market.
Smallholder subsistence agriculture, including food production, is, therefore, but one of the many life skills and practices that characterize rural life in the ECA region. Further, just like cultural values determine most life skills and practices, they also determine processes of food production, exchange and consumption. One of the cultural values that permeate the entire region, like in other societies all over the World, is gender. This implies that the values attached to agriculture, which are simultaneously part and parcel of the general values of living and livelihoods, are also gendered. Gender not only sets specific expectations, obligations and responsibilities on males and females in food production but also determines their entitlements to resources requisite for earning livelihoods including those required for food production. Implicitly, gender constitutes one of the major traits within the management system of food production.
Gendered entitlements to food production and consumption patterns
In much of the ECA region, smallholder food production is carried out as a “way of life” within structures of gender and household organization, which are themselves a concatenation of a complexity of norms, beliefs and practices that govern individual household members’ roles, rights and entitlements in food production, exchange and consumption. Gender and household organization remain fundamental principles governing the division of labour and determining expectations, obligations, responsibilities and entitlements of males and females within and beyond households. For example, this principle determines the economic and social roles that males and females will play and, in rural households, participation in food production is just one of the many. Gender and household organization also determine the entitlements and constraints in time, mobility and resources that each experiences in performing this role (Grieco 1997).
Sen (1981) defined entitlements as sets of alternative commodity/service bundles that a person can command in a society using the totality of rights and opportunities that s/he enjoys. A person’s “entitlement set” is the full range of goods and services that s/he can acquire by converting his/her “endowments” through “entitlement mappings”. Endowments are those assets, resources, including labour power, that somebody already commands or has access to while entitlements are the assets that somebody can within certain contexts produce under circumstances determined by prevailing legal and customary regimes. Through the application of endowments, entitlements are created or transferred.
Entitlement sets typically comprise any, all or a combi-nation of the following: • Trade-based entitlements, whereby one is entitled
to own what one obtains by trading goods that one owns with a willing party, for example, selling one’s non-food agricultural produce to purchase food.
• Production-based entitlements, whereby one is entitled to own what one gets by organizing production (for instance of food) using resources one owns, for example land, or resources hired/rented from willing parties under agreed conditions of exchange.
• Labour-based entitlements, whereby one is entitled to own the trade-based and production-based entitlements arising from one's labour power.
76 First ASARECA General Assembly, Volume 2

• Inheritance and transfer entitlements, whereby one is entitled to own what is willingly bequeathed to her/him by another who legitimately owns it.
• Social-interactional entitlements in the form of support, recognition, encouragement, high expectations from significant others, like parents, teachers, spouses, employers, extension workers, governments, organizations, communities and so forth, all of which foster confidence, optimism and control over one’s own life, and the power to make rational choices.
Entitlements further define the relationships between people and the commodities/services which they need to acquire (or to have access to) in order to be able to lead meaningful and fulfilling lives. People’s command over commodities is said to depend first on their position in society (what their occupation or class is, what they produce, where they live, how much land they own, what skills they possess, what authority they command and so forth) and second, on the rules which legitimize their claims over commodities/services. Since people’s entitlements depend partially on their position in society, an entitlement analysis can introduce a range of social, economic, cultural, and political factors that determine entitlements to food too.
According to Sen (1981), a person who has land, labour power and other resources, which together make up his/her endowments, can produce a bundle of food that will be hers/his. Or by selling labour, s/he can get a wage and with that buy commodities, including food. Alternatively, s/he can grow non-food crops and sell them to buy food and other commodities. The combined sets of all such available commodity bundles in a given economic situation are the exchange entitlement of his/her endowment. However, entitlements to such resources is governed by rules and norms that are distinguished and structured by gender, age, marital status and other axes of socio-economic inclusion and exclusion. “Gasper (1993) concludes that beyond legal/customary rights, effective access to resources within institutions typically depends not only on formal and informal rules but also on particular relationships with sources of authority and influence, most of which are gendered”.
Lesser entitlements to women can be observed most within farming systems where land is the most productive resource, the major form of wealth and the main source of livelihood for the majority of the people. Ownership of land also facilitates access to credit, membership in co-operatives and access to new farm
information and technology (Ardayfio-Schandorf 1997). Yet, due to the gendered entitlements, males owned 84% while females owned only 16% of titled land in Uganda for example (Sebina-Zziwa et al. 2004). As a result, the latter’s access to credit was less than 1% in 1993 just as their access to extension services and technology was negligible (World Bank 1993). Paradoxically, more females than males work in subsistence agriculture, contributing 80% of the labour in food crop and 52% of the labour in cash crop production (UNICEF 1994). UNDP (1998) adds that females carry out 70%–80% of the agricultural work such as planting, weeding, watering, harvesting, processing and storage of food.
Notwithstanding the immense contribution of women to agricultural work, their control over the proceeds of their labour is low; females sold only 30% of the food crops and controlled only 9% of the cash crop proceeds. Joint decision making by both spouses on the use of funds generated from agricultural production was 12% for food crops and 7% for cash crops (UNICEF 1989). Thus, females earn less income than males from agricultural production, which further places acute labour constraints on them in view of their limited capacity to hire labour due to cash shortages (Kasente 1998; Lockwood and Whitehead 1998). This has led to a significant reliance on child labour, which acts as a substitute for hired labour in farming enterprises run by women.
In addition to the above constraints that women face in terms of demands of excessive labour time, societal norms that bestow the power to control the proceeds of household production on males further serve as a disincentive. Madanda (1997) cited cases where females were more secure in their marriages with less food cultivation and insecure with higher production. Male spouses often used the proceeds from increased production to build new houses and purchase new bicycles (a status symbols in rural areas). With the new-found status, the males married more wives to the chagrin of their spouses. Thus, females rather risked food insecurity than insecure marriages and deliberately cultivated less. In other words, marital insecurity could fuel deliberate livelihood insecurity.
Women’s weaker property rights and a rigid gender division of labour have been reported to account for the limited gains to women in Africa from attempts at agricultural commercialization (Ardayfio-Scandorf 1997). There is widespread documentation of gendered conflicts that arise from agricultural specialization, especially production of cash crops (Blackden 1993;
77The role of mainstreaming gender in agricultural research and development

Bryceson 1995; Dolan 2001; Ongile 1999; Whitehead 1981). In these studies, men are found to appropriate not only the traditional cash crops but also the non-traditional ones once the crops become lucrative. For instance, Dolan (2001) reported that French beans were traditionally women’s horticultural property in Meru, Kenya. But as they became increasingly lucrative, men began to usurp either the land allocated for, or the income derived from, export horticultural production. As a result, female control was eroded as tensions resonated over male and female property rights and labour contributions to household subsistence. Men’s appropriation of cash crops was attributed to their ownership and control of land, which gave them powers over household production. It was further attributed to patriarchal social systems. These forces are also said to have contributed to the weak supply response of African agriculture to export opportunities (Joekes 1999). Evidence that farm output from a given quantity of household labour is less than the maximum that could be produced has been adduced in Burkina Faso (Smith and Chavas 1999; Udry 1996), Tanzania (Tijabuka 1994) and Zambia (Wold 1997).
Deteriorating bio-physical production system of food production
Food production in the ECA region is stifled due to the challenges arising from population increases, land frag-mentation, climate change, crop failure, deteriorating pastures, animal diseases, decreasing soil fertility and so forth. Droughts are becoming the norm in parts of north western Kenya and north eastern Uganda, while floods are devastating many agricultural livelihoods in eastern Uganda. Weather patterns in the region have become unpredictable, while yields in most parts of Uganda are on the decline.
Opportunity costs of food production
The obligations that are placed on female farmers in the ECA region pose several opportunity costs to women and girls, including the rights to education and skills and economic rights foregone by them in producing food. Studies abound that indicate that non-traditional agricultural export (NTAE) crops have a negative impact on young girls’ use of time in Uganda (Elson and Evers 1996). In the context of vanilla production, extra demands on women’s labour time was transferred to their daughters. Pollination by hand at critical stages in the growth cycle was often undertaken by girls at the expense of their schooling.
Elson and Evers (1996) also found that NTAE damaged children’s health and nutrition–increasing the work-load of women led to a decline in breastfeeding and worsened child-care practices. Further, food insecurity was intensified as families sold food to raise cash for basic family expenses. But the evidence was mixed. A study in selected villages of two Ugandan districts (Kasente et al. 2002) found that farmers were not compromising food security in response to NTAE incentives. However, this study also found that men controlled over 90% of the income from vanilla and that women were more likely than men to spend their income on household needs, especially food. Kasente et al. (2002) further highlighted factors affecting alter-native choices of women for remunerated labour. For example, only older women with no small children undertook marketing activities that required women to be mobile, while independent agricultural activities were only undertaken by women with sons.
Competing demands for land, labour and other resources used in food production
The overlap amongst, and close integration of, the agricultural and domestic roles in rural households results in competing demands for resources required for food production (World Bank 2005; Ellis et al. 2006; Manyire 2008). The boundary between agricultural and household responsibilities is very fluid. Among small-holder subsistence farmers in the region, agriculture is regarded as both a social and an economic activity. For females, smallholder farming is largely construed as part and parcel of their social roles within house-holds in addition to their reproductive, caretaker and household management roles. This is because, in most cultures in Uganda, food security, especially house-hold provisioning, is largely regarded as a woman’s responsibility. The overlap between the agricultural and domestic roles of females in rural communities is well captured in the lyrics of a Luganda traditional song which goes “nfunda nomuubbi ngazaala, nga’lima, nag’yaniliza nabagenyi” which translates into “I would rather prefer a homely woman but who produces chil-dren, cultivates and welcomes visitors.” Alternatively, for males, agriculture is perceived more as part of their economic role that should earn households income (Manyire 2008). In some communities like the Tooro of Western Uganda, some women even pester their spouses to leave the village and subsequently agricul-ture, and go to Kampala (or other urban areas) to earn higher incomes.
78 First ASARECA General Assembly, Volume 2

Females, therefore, usually undertake all their social roles, including that of an agriculturist, simultaneously, while males focus their energies on the economic role of earning an income. Where returns from agriculture are low or non existent, males end up leaving agricultural undertakings to females as they seek income-earning opportunities outside agriculture, for example in brick laying, sand mining, stone quarrying, boda boda riding and so forth. Where these opportunities are minimal, men may just idle around doing nothing! It is these variations in perceptions that constitute the foundations for the gender differences in opportunities and constraints in time, mobility and resources in the agricultural sector.
Discriminatory food production policies, programmes and projects at national and local levels
There is growing documentation and increasing awareness in the ECA region in general and in Uganda in particular of the practical limitations to women’s participation in development processes (innumerable roles, responsibilities; heavy workload; little control of, and access to, resources; and existing power relations that prohibit participation and benefit). However, what is less understood and articulated are the restrictions on expression of women’s perspectives. The limitations relate to social exclusion and unfavourable terms of inclusion of segments in society in the development process. Sen (2000) defined social exclusion as a form of inability to do things that one has reason to want to do. Unfavourable inclusion manifests in form of deeply “unequal” terms of social participation, for instance in the credit and land markets, extension services, on-farm trials and field demonstrations, in the exchange markets, or even in the rural-labour market (Kelles-Vitanen 1998). Social exclusion and unfavourable inclusion are deeply institutionalized in society and these inadequacies are reflected in the development policies, programmes and projects, preventing certain categories of people from effectively participating in the development process.
Agricultural production policies, programmes and projects generally assume that promotion of the participation of both men and women revolves around similar mechanisms and that women’s interests are automatically promoted. This is misleading because the assumption does not recognize the obstacles posed by the gendered nature of institutions within which the development policies, programmes and projects are designed and implemented and within which the targeted men and women farmers operate. Baden (2000)
defines institutions as the formal and informal rules and constraints that shape social perceptions of needs and roles, while organizations administer these rules and respond to needs. Institutions create the context for organizations, such as those in agriculture, to operate. They further tend to socially exclude certain categories of people from opportunities for advancement or give certain others an unfair opportunity.
This explains why the National Agricultural Advisory Services (NAADS) in Uganda have failed to operation-alize its Poverty and Gender Strategy for the Delivery of Improved Agricultural Advisory Services (Republic of Uganda 2003). Yet the NAADS, through the Ugandan Plan for Modernization of Agriculture (PMA) is cogni-zant of the gender dimensions of poverty in Uganda. It is explicitly stated that:
“operationalizing the PMA will require special considerations to gender issues. All interven-tions must be gender responsive and gender focused such that both men and women are included. Intervention planning and imple-mentation should carefully consider men’s and women’s participation, roles, responsibilities and workloads, as well as control of, and access to resources and existing power relations that may prohibit participation and benefit” (Republic of Uganda 2000 p 9).
Therefore, the tendency within agricultural production policies, programmes and projects to assume that promotion of the participation of both men and women revolves around similar mechanisms that automatically promote women’s interests is problematic. For it is not clear how participation of poor men and women is expected to lead to articulation of their interests in ways which can influence institutional rules and practices (effectiveness) and consequently lead to making of decisions about resource use that lead to poverty reduction in the material sense (impact).
For conventional “gender participation” approaches do not address perceived male resistance and silencing, internalized subordination and difficulty of expressing women’s interests within existing frameworks of traditional development practices. For poor women and some men, the sense of powerlessness and exclusion is a product not just of their gender subordination but also of interlocking forms of exclusion simultaneously linked to their socio-economic status. This is what Sen (2000) described as analysis of deprivation of capability and subsequent experience of poverty. Under this form of analysis, focus shifts from distributional issues raised
79The role of mainstreaming gender in agricultural research and development

in traditional analyses of poverty (the lack of resources at the disposal of an individual or household) to the role of relational features: inadequate social participation; lack of social integration; and lack of power in deprivation of capability and experience of poverty (Room 1999). Moulaert (1995) further points out that such exclusions and unfavourable inclusions acting singularly or in various combinations may ultimately evolve local sub-cultures within groups which limit and undermine the capacity of the affected people to take up opportunities for improving their socio-economic wellbeing.
Time poverty
Variations in gender roles and responsibilities constitute a major hindrance to food production in the ECA region (World Bank 2005; Republic of Uganda 2002). Women's significant yet understated roles in agricultural production and their pivotal position in household management and welfare (food preparation, health and hygiene, reproduction, child care and socialization) are central to the region’s agricultural development and social survival. The different structural roles of men and women in the agricultural sector are coupled with their equally different and skewed roles in the household management, and the boundaries between agricultural and household activities tend to overlap (Gelb 2001). What particularly characterizes women's roles, in contrast to those of men, is that they must carry out these roles simultaneously, not sequentially. This is evident not only in the Uganda participatory poverty assessment process/second poverty assessment (UPPAP/PPA2) report, which amply documents the extent of women's labour overloads and their very long working hours, but also in the harsh choices and trade-offs that women inevitably have to make because of the simultaneous competing claims on their (but not men’s) labour time. The UPPAP/PPA2 highlighted the problem of women’s “over-burden” and identified the strong imbalance in the gender division of labour as one of the main contributors to poverty. A comparison of time use for women and men in rural Uganda revealed that poor women work between 12 and 18 hours per day, with a mean average of 15 hours, compared with an average male working day of approximately 8–10 hours. The main source of discrepancy is women’s heavier commitment to their reproductive roles (child rearing and care of family members) and the additional responsibility for the family food security. This is coupled with the requirements for water and energy provisioning. The “overloads” of women is a key component of both individual and household
production, in large part because of the disproportionate cost borne by women of reproduction and household management responsibilities. As they carry out their multiple tasks, women, much more than men, must work in the face of severe constraints, many of which are deep-rooted and systemic in nature, and are ground in social institutions and modes of household organization. Understanding the time constraint and its implications, and moving to reduce or eliminate it, is fundamental if food production is to be enhanced in the ECA region.
In addition to their prominence in agriculture and household management and welfare, women bear the brunt of domestic tasks: processing food crops, providing water and firewood, and caring for the elderly and the sick. This is the second component of women’s labour “overloads”, their “double workday”, as revealed in the UPPAP/PPA2 analysis (Republic of Uganda 2002), as well as in numerous other studies in Uganda (Manyire 2008; Nayenga 2008). Analysis of how men and women and boys and girls spend their time is critical to understanding both the “overloads” of women and how this affects agricultural production. Fetching water, collecting fuel wood, and pounding grain involve arduous physical work and must be performed daily, in addition to agricultural and other productive work. The time and effort required for these tasks, in the almost total absence of even rudi-mentary domestic technology, is staggering. The focus on women’s overburden in the UPPAP recognized explicitly that agricultural and household economies are intertwined, and that this has critical implications for both the allocation of labour and its productivity across the full range of tasks that disproportionately fall to women. Some specific negative effects of time constraints were identified in a number of key areas in a way that insightfully captures the cross-cutting nature of this issue (Republic of Uganda 2002). For example, women’s ability to produce enough food for the family is compromised by their heavy workload.
Glick et al. (2004) do provide descriptive data on the respective workloads of men and women, boys and girls, in both domestic and market tasks, separately for rural and urban households. The data show that women spend between four and five times as many hours as men on domestic tasks, while girls do about three to five as much again as boys. Rural men offset this differential by spending about 1.3 times as much time as women on market work, while rural women’s work week is about one to three times longer than that of men. Examples from the transport, water, and energy
80 First ASARECA General Assembly, Volume 2

sectors further illustrate the marked gender differences in time allocation, reflecting in turn important structural dimensions of, and rigidities in, the gender division of labour. They confirm and reinforce the UPPAP findings that not only are women overburdened, but they also have by far the greater of the burden for “meeting family needs”.
Gender-specific domestic overloads further affect more female than male children. Girls usually perform more domestic chores at home than boys do, typically fetching water, caring for younger siblings and helping with food production and preparation to the detriment of their academic pursuits. Although exceptions exist, rural agricultural households seldom depend so heavily on boys because girls tend to be better substitutes for their mothers than boys are for their fathers (Manyire 1998; Herz et al. 1991). Therefore, the greater access that women have to resources and ownership of assets (Valdivia 2001), the more empowered they will become to undertake their multiple roles within farming systems (Agarwal 1994).
The case for mainstreaming gender in agricultural research and development and its contribution to feeding our region in the twenty-first century
Introduction to gender mainstreaming
Gender mainstreaming is a globally accepted strategy for promoting gender equality. It is not an end in itself but a means to achieve the goal of gender equality. Mainstreaming involves ensuring that gender perspectives and the goal of gender equality are central to all activities in policy development, research, advocacy and dialogue, legislation, resource allocation, and planning, implementation and monitoring of policies, programmes and projects. In 1997, the United Nations Economic and Social Council defined the concept of gender mainstreaming as follows:
“…the process of assessing the implications for women and men of any planned action, including legislation, policies or programmes, in all areas and at all levels. It is a strategy for making women’s as well as men’s concerns and experiences an integral dimension of the design, implementation, monitoring and evaluation of policies and programmes in all political, economic and societal spheres so that women and men benefit equally, and inequality is not perpetuated. The ultimate goal is to achieve gender equality.”
Gender mainstreaming includes actions aimed at: • Undertaking a gender analysis with a view to
identifying inequalities between men and women which need to be addressed.
• Providing equal opportunities to all and carrying out gender-specific actions wherever inequalities are pronounced.
• Starting a process of institutional change• Giving girls and women a voice• Carrying our gender budgeting• Undertaking participatory gender audits
Gender analysis
Gender analysis is a systematic tool used to examine the social and economic differences between women and men. It looks at their specific activities, conditions, needs, access to and control over resources, as well as their access to development benefits and decision making. It studies these linkages and other factors in the larger social, economic, political and environmental contexts. The findings of the analysis inform strategic planning of any interventions. Gender analysis and planning are also required for the development and implementation of specific measures to promote equality of opportunity and treatment between male and female workers. All policies and programmes, whether at the macro, sectoral or micro levels, need to engage in gender analysis and planning as a means to not only achieving gender equality but also realizing their overall goals. Gender analysis entails, first and foremost, collecting sex-disaggregated data (i.e., data broken down by sex) and gender-sensitive information about the concerned population. It is the first step in gender-sensitive planning for promotion of gender equality. It is not confined to identifying differences, but, more importantly, recognizes the politics of gender relations and the adjustments that institutions need to undertake to attain gender equality. It examines the inequalities between women and men, boys and girls, asks why they exist, and suggests how the gap can be narrowed. Gender analysis entails five key variables:• The division of labour between men and women,
and boys and girls;• The different needs of men and women, and boys
and girls;• The sex-based division of access to, and control
over, resources and benefits;
81The role of mainstreaming gender in agricultural research and development

• Opportunities and constraints in the social and economic environment; and,
• The capacity of institutions to promote equality between men and women, and boys and girls.
The practice of gender mainstreaming
Gender mainstreaming is akin to blood transfusion for it is integral to all development decisions: it concerns the staffing, procedures and culture of development organizations as well as their programmes; and the entire staff in an organization is responsible for gender balanced behaviour. Gender mainstreaming undoubt-edly necessitates major attitudinal changes and adjustments in the working methods of organizations at all levels. The changes and adjustments are required not only to address why women and some poor men lack resources but also why they may not even access and utilize resources targeted towards them (Razavi and Miller 1995).
In this regard, Gaynor and Jennings (2004) noted that effective gender mainstreaming requires major insti-tutional changes at policy, organizational and resource allocation levels. At the policy level, they reported that gender equality commitments should be explicitly backed by requisite resources that translate into pro-gramme implementation. At the organizational level, organizational norms, procedures and staff need to be consciously sensitized to a culture of gender equal-ity. At the resource allocation level (both human and financial), apart from ensuring that gender sensitivity and specific activities to promote gender equality are covered by the programme budget, staff also need to have access to process funds which can be used to sponsor research to support gender mainstreaming as well as capacity building activities.
While gender sensitivity has been included in many policy documents in several countries, translating this principle into actual, realistic and practical activities by the different stakeholders involved in the implementation of the policies remains a challenge. As noted, earlier, this challenge arises from inadequacies in appreciation of the forms of social exclusion and unfavourable inclusion that prevent women and other categories of vulnerable people from effectively participating in development processes. This makes a strong case for mainstreaming gender in agricultural research and development if we are to feed the ECA region in the twenty-first century.
The relevance of gender mainstreaming in food production
Gender and smallholder food production mutually interact to produce different sets of opportunities and constraints that influence the abilities of different categories of men and women to participate in food production, consumption and exchange. Opportunities include access to, ownership and control of assets like land, oxen, ploughs, labour, income, knowledge of modern agronomic practices, extension services, yield enhancing technologies, credit, capital, markets and so forth. Constraints manifest in the form of lack of access to, and ownership and control of the aforementioned assets. Constraints further arise from competing demands for labour time, especially in reproductive roles (child raising and care) and domestic roles (home maintenance, grain processing and preparation, fuel and water collection, care of the sick and elderly and so forth). Furthermore, constraints manifest in form of low levels of optimism, confidence, impetus and active agency to undertake certain forms of agricultural production, for example production of high value crops, which may be deemed a preserve of a certain gender, particularly males, or better-off farmers. There are also constraints manifesting in the form of lack of self-confidence, impetus and active agency to seek extension advice, credit, high yield varieties and even certain markets which could again be deemed a preserve of certain gender or farmers of higher socio-economic status.
However, although gendered entitlements in agri-culture tend to favour males more than females with respect to opportunities, and further constrain the latter, caution should be taken not to lump all males and all females into homogenous categories. This is because the influence of gendered entitlements on food production, consumption and exchange is not a given. Rather, these entitlements are mediated via several socio-institutional phenomena, which either mitigate or exacerbate their (gendered values) influence on the participation of different groups of male and female farmers in agriculture. For example, gendered entitlements in male-headed households may not be similar to those in female- or child-headed households. For instance, women from female-headed households tend to be more economically active compared to their counterparts in male-headed households because they are not dependent on males. Even among similar household types, for example the female-headed, the cause of female-headedness may present different types of gendered values. For instance, widows may
82 First ASARECA General Assembly, Volume 2

experience different sets of gendered values compared to the divorced and/or the never married. Widows tend to have more access to resources like land, especially if they have adult sons, compared to the divorced, for example. Younger men and women may experience different forms of gendered entitlements compared to older men and women. Further, in households with multiple forms of livelihoods (smallholder farming, trading, fishing, formal sector employment, remit-tances and so forth), the sets of gendered values differ from those in households where there are only one or two dominant forms of livelihoods. Also, the nature, manifestation and influence of socio-institutional phe-nomena in producing different sets of gendered values that influence food production is not similar across all individual males and females, households, communi-ties, ethnicities and geographical regions. This is due to variations in cultures, gender ideologies, levels of subscription to the ideologies and material conditions of agricultural production exhibited at the individual, household, community, ethnic and regional levels.
Mainstreaming gender entitlements to food within agricultural research institutions
The centrality of gender in food production amongst smallholder farmers in the ECA region makes it crucial that it is mainstreamed into the conceptualization, design, execution, dissemination and utilization of agricultural research and development. This can be attained first and foremost by consciously integrating the “management component” of farming systems into the various aspects of agricultural research and development initiatives. This component is crucial in organizing bio-physical production in farming systems.
Often, agricultural research and development initiatives tend to regard the management component as a given or a constant, and place more emphasis on the bio physical production component of farming systems: “efficiency of tools, fertility, maturity periods, resistance to drought and pests, yields and so forth”. For example, rather than conceptualizing a tractor or ox-plough solely in terms of acres of land ploughed per hour, agricultural research should seek to understand the relations between the acreage ploughed and human values. These indices include acreage ploughed for who (individuals/households), by who, for what purposes (food/cash crop or both), with what impact or effects (positive/negative), on who (individuals/households), how (reduced/increased labour time, improved/reduced/no change in welfare), why (gendered values, nature of division of labour, distribution of resources, entitlements and so forth).
Second is the need for the awareness that smallholder farmers are not homogeneous but are differentiated by gender and other social institutional phenomena (how do males and females relate between and among each other, including relations between agricultural scientists and farmers of similar and different gender). It is equally important to be conscious of the fact that individuals from different cultural backgrounds have different values and mindsets and respond differently to similar stimuli: for example, in Uganda, (and this is stereotypical) a Muhima will react to a cow by wishing to rear it; a Karamojong by wishing to rustle it; a Mukiga by wishing to slaughter and eat it; and a Muganda by wishing to sell it. Thus, since agriculture is practiced based on varying human values, there are no “one size fits all” scenarios. Care must be taken to collect and disaggregate data sets of varying agricultural potential by gender, entitlement sets, household types, communities, ethnicities and geographical regions.
Third, it is important to be aware of the opportunities and constraints that gendered entitlements place on the abilities of males and females to meaningfully engage in food production (division of labour, symbolic and material access to and control of resources, obligations and responsibilities and entitlements within and beyond farming, interaction of multiple roles that could be mutually reinforcing or conflicting, competing demands on labour time, inactive agency that negatively affects optimism and ambition to explore new opportunities, inactive agency that inhibits seeking advisory and material support, for example, from the NAADS and so forth.
Fourthly, addressing the management traits in general and gendered management traits in particular transcends the realms of psychology, sociology, rural development, economics, gender studies and philosophy. It is imperative, therefore, that agricultural research and development constitutes multi-disciplinary teams of agricultural and social scientists so that management and gendered management traits affecting and influencing food production are understood in their diverse forms and addressed holistically.
Mainstreaming gendered food entitlements within national agricultural policies, programmes and projects: NAADS in Uganda
Several agricultural policies and programmes of countries in the ECA region have made commitments to gender mainstreaming. In Uganda, for example, NAADS has a Poverty and Gender Strategy (Republic
83The role of mainstreaming gender in agricultural research and development

of Uganda 2003) that demonstrates both the range of gender mainstreaming concerns within NAADS in particular and within the communities in general. At the institutional level, the strategy shows concern regarding inequitable hiring policies, whereby contractual conditions may limit those hired to a narrow range of personnel who are already holding key positions, thus excluding women from key positions at the secretariat and district levels, thereby failing to support the gender principles of the programme.
Both NAADS vision and mission incorporate gender mainstreaming and reiterate making significant and tangible contributions to create conditions within which the rural poor, especially women and youth, can address their livelihood needs, especially income poverty. This implies empowering them to seek agricultural information and technologies and to be able to utilize these technologies to serve their own needs, especially to raise their incomes and increase their asset base. Within the NAADS, gender mainstreaming further implies avoiding reinforcing existing social arrangements that constrain the rural poor from improving their well-being (Republic of Uganda 2003).
The NAADS further operationalizes empowerment by enabling those previously denied the ability to make strategic life choices, acquire such ability. That is, the rural poor, especially poor rural women and youth, should be able to: increase the levels of control they have over their own lives; make their own decisions about livelihood options; and translate their chosen livelihood options into improvements in their well-being. Furthermore, NAADS operationalizes equity as: addressing the different priorities and constraints of different categories of men and women, either directly through its own initiatives or indirectly through linkages with other programmes; addressing inequality attached to various social categories including gender, ethnicity, class or wealth, age and disability; and, addressing inequity at different levels of government and non-governmental activity and in all institutions, from households, farmer groups and fora, to local government organizations and markets (ibid.).
The NAADS Strategy further stresses farmer group members’ awareness of the livelihood positions of the different members and the implications of these differ-ences for their involvement in enterprise development (ibid.). If members are unaware, the strategy calls for discussions about the different livelihood positions and their implications for group plans. Similarly, the strat-egy calls for ascertaining the risks and uncertainties of
the enterprises selected and introducing measures to reduce the impacts of the risks and uncertainties. Where the uncertainties and risks are not known to the groups, there is need to document and disseminate them.
The NAADS Poverty and Gender Strategy also brings to the attention of policy makers and implementers how decisions about enterprise development are translated at the household level; whose workloads are affected; and what resources are affected. The strategy also calls for understanding of how some household members could lose their control over household resources as a result of the expansion of an existing activity or introduction of a new activity. The strategy further probes whether all household members are likely to share improved incomes and recommends that a process for discussing these issues within NAADS farmer groups and households be incorporated into the various processes of enterprise development.
Mainstreaming gender in informal community and household institutions
At the community and household levels, NAADS highlights several covert and overt practices that justify gender mainstreaming, among which is social exclusion, whereby poorer farmers could be excluded from farmer groups by rules about literacy and numeracy skills, or physical assets (house, livestock or land) and social group membership (gender, age, ethnicity) conditions. The strategy further points to the possibility of discriminatory farmer institutional processes, whereby farmer fora members operate in support of wealthier group members in terms of enterprise choices, skills training and other support they need to enable them benefit from NAADS services. Another concern for gender mainstreaming outlined by the NAADS strategy is failure to support transformative change. This includes local views about culturally appropriate roles for men and women that result in overburdening of either sex and the use of these views by programme implementers to limit the opportunities made available to different categories of people. The strategy is further cognizant of inequities within groups, including farmer group membership “rules” or even “norms” of good membership that place pressure on poorer members to conform even though they might be left more vulnerable. The problem of inability to engage with markets due to lack of skills and “bargaining power” to negotiate better prices in the marketplace by poorer men and women is another concern for gender mainstreaming stressed in the strategy. Finally, the strategy is aware that economic growth could result in further inequities. This may arise
84 First ASARECA General Assembly, Volume 2

from promoting enterprises without adequate attention being paid to norms of labour use and divisions of responsibilities within households, which could result in unequal sharing of burdens and benefits of enterprise development within households (ibid.).
The NAADS strategy is further cognisant of the heterogeneity of farmers including female farmers. It therefore emphasizes on understanding the various characteristics of group members, including age, sex, marital status and their economic, physical and social assets. An understanding of farmers’ home situations and how these determine what they can or cannot do with NAADS is also called for. The strategy further calls for actions that farmer groups and NAADS programme can undertake to reduce constraints that different members face. If members face considerable time constraints for example, group meetings could be minimized and be held at the most convenient locations, including in the households of different members (ibid.).
Furthermore, the strategy is keen to ensure that members who hold key positions act in the interests of weaker members. The NAADS strategy also points to an understanding of how decisions about meetings, enterprises and capacity building needs are taken; whether everyone within the group understands the group accounts (and if not, why?); and suggests that if group behaviour is inequitable, group composition and group capacity issues should be addressed.
The strategy further seeks to ensure that service providers make specific efforts within farmer groups to ensure that voices of all members are heard. Where voices of all are not heard, the strategy suggests that the capacity of service providers to do this needs to be built and information about the groups, their composition and so forth, needs to be available for each new service provider so that issues of difference can be addressed. The strategy also cautions against groups engaged in activities such as savings, which may force poorer members to become indebted so that they can continue to stay within the group and enjoy the benefits they might have acquired from joining the group. Plans for group savings need to be flexible and take into consideration the vulnerability of different members.
A key concern of NAADS is to ensure that it does not simply reinforce existing forms of inequity, and reproduce programmes that focus principally on those who already have the ability to access resources, including advisory services and technologies. It seeks to focus on increasing the asset base of the rural poor,
thereby decreasing their vulnerability and increasing their opportunity for economic growth. According to the NAADS poverty and gender strategy, special efforts are needed to first identify and then to convince the vulnerable farmers, especially vulnerable women, to join farmer institutions since poorer farmers are often socially, economically and physically isolated. Once they are enlisted, again special efforts are needed to ensure that they can influence decisions about the type of activities they would like to engage in; have the information needed to assess the viability of these proposed activities; and determine the type, relevance and quality of goods and services they need in order to gain from their chosen activity. This particular focus of gender mainstreaming within the NAADS seeks to overcome barriers that have conventionally ignored the socially, economically and physically isolated in service delivery. Its success depends on local knowledge and ability to deal with more powerful community members who often respond more quickly to opportunities being offered. Local community based organizations and NGOs with a grassroots base were identified by the strategy as the relevant organizations to undertake this task within the NAADS programme.
Addressing isolation and lack of empowerment
While income poverty is the principal focus of NAADS, through its support for local institution building, gender mainstreaming expects to influence other aspects of poverty, including the sense of isolation and lack of empowerment. Within NAADS, it is the farmer institutions, the farmer groups and farmer fora that should decide how resources are to be allocated, how tasks and responsibilities are to be carried out, and how they will evaluate the activities and outputs. Activities carried out in groups are expected to increase the leverage of individual members over resources. The ability of the groups to achieve this depends on whether they have the required skills and information. Processes in farmer groups and farmer fora are not automatically equitable. Even when these organizations have participatory processes, these are usually of the type that keeps the authority structure of people, ideas and decision making, intact. Rules and norms (the unwritten rules), and the ability of individuals to manipulate these in their own interests, or in the interests of others, determine who decides what, who does what, and who actually gets what, even within these institutions. The
85The role of mainstreaming gender in agricultural research and development

challenge for mainstreaming gender within NAADS is to make these processes equitable. Theoretically, therefore, enhancing the participation of poor men and women is expected to lead to the articulation of their interests in ways which can influence institutional rules and practices (effectiveness) and consequently lead to making of decisions about resource use that lead to poverty reduction in the material sense (impact).
Addressing time poverty
The NAADS Poverty and Gender Strategy states that the programme was designed to address both the practical and strategic gender needs, which are key in gender mainstreaming (ibid.). Practical gender needs are those constraints that affect the ease with which different categories of people are able to fulfil their current roles and responsibilities, for example the heavy domestic labour burden on women that that compromise the amount of time they can invest in pro-ductive work. Strategic gender needs are constraints that influence the capacity of different categories of people to change their situation (roles, statuses and positions) in directions that they feel could improve their well-being. These constraints include ideologies that determine gender roles and responsibilities and entitlements (ibid).
Bringing men and the youth back into agriculture in general and food production in particular
There is an urgent need for bringing men and the youth back into food production in the ECA region through:• making food production in particular and agri-
cultural production in general economically profitable; and,
• facilitating a gender ideological shift from conceiv-ing food production and provisioning as a social role and responsibility for women to conceiving it as a profitable economic right for them.
Specifically, there is need to create favourable conditions for the rural poor, especially women and the youth, to engage in commercial food production and to empower them to seek advisory services and technologies and to use these tools to serve their own needs and interests, especially in raising their incomes from farming. Further, those with no direct access to agricultural resources should also benefit from the improved agricultural production and productivity resulting from the agricultural policies and programmes.
Conclusions
To feed the ECA region in the twenty-first century, we need to simultaneously address both the management and the bio-physical production components of the food production system. The management component and rural ways of life are intimately intertwined. Values governing rural ways of life permeate food production practices too in that, through gender norms, beliefs and practices, they determine the material and socio-interactional entitlements of males and females, often to the detriment of the latter. This compromises food pro-duction because the bulk of participants in smallholder agriculture (females) produce food more as an exten-sion of their gender-determined social provisioning roles, in addition to their reproductive and care-giving roles, including child care, care for the elderly and the sick, and household management. In addition, they face a host of constraints, including heavy workloads, lesser decision-making powers within households and wider communities, and limited access to, and control over, resources.
Unfortunately, agricultural research and development from the physical science perspective is yet to acknowledge let alone address the constraints to food production posed by the gendered management component of farming systems, more especially how gender affects food production. It is imperative therefore that gender is mainstreamed into agricultural research and development not only for purposes of advancing food production but also as a strategy for achieving gender equality.
Recommendations• Gender analysis should be integral in the
conceptualization, design, execution, dissemination and utilization of all agricultural research and development initiatives.
• There should also be a conscious integration of the “management component” of farming systems in the conceptualization, design, execution, dissemination and utilization of these initiatives. Focus should not be exclusively on the bio-physical production component.
• Agricultural research institutions should conduct gender audits to gauge the levels of gender awareness and understand how gender manifests within the institutions to the detriment of conceptualizing and executing gendered research and developing gendered agricultural policy.
86 First ASARECA General Assembly, Volume 2

• Gender analysts need to be recruited in all agricultural research institutions.
• Gender budgeting should be introduced and adopted in agricultural research institutions to facilitate gender mainstreaming in agricultural research and development.
• Agricultural research institutions should collect and disaggregate data sets of varying agricultural potentials by gender, entitlement sets, household types, communities, ethnicities and geographical regions in the ECA region.
• Agricultural research institutions should develop a conscious awareness of the opportunities and constraints that gendered entitlements place on the abilities of males and females to meaningfully engage in food production (division of labour; symbolic and material access to, and control of, resources; obligations and responsibilities within and beyond farming; entitlements within and beyond farming; interaction of multiple roles and their mutually reinforcing/cooperation or conflict-ing roles; competing demands on labour time; inactive agency that negatively affects optimism and ambition to explore new opportunities; inac-tive agency that inhibits seeking advisory and material support and so forth).
• Agricultural research institutions should develop a conscious awareness that addressing the manage-ment traits in general and gendered management traits in particular transcends the realms of psy-chology, sociology, rural development, economics, gender studies and philosophy. Hence, these insti-tutions should constitute multi-disciplinary teams of agricultural and social scientists so that both the traits affecting and influencing food production are understood in their diverse forms and addressed holistically.
References
Agarwal B. 1994. Gender and command over property: A critical gap in economic analysis and policy in South Asia. World Development 22, 10:1455–1478.
Ardayfio-Schandorf E. 1997. Household Structure and Rural Food Security in Africa. In Breth S, ed., Women, agricultural intensification and household food security, Sasakawa Africa Association, Mexico.
Baden S. 2000. Gender, Governance and the Feminization of Poverty. In UNDP, Women’s political participation and governance: 21st century challenges, UNDP, New York.
Blackden M. 2004. Gender and energy in Uganda: A brief summary of issues for the PEAP revision, World Bank, Washington, D.C.
Bryceson. D. ed. 1995. Women wielding the hoe: Lessons from rural Africa for feminist theory and development practice, Oxford, Berg
Dolan C. 2001. The “Good Wife”: Struggles over resources in the Kenyan horticultural sector. Journal of Development Studies 37, 3.
Elson D, Evers B. 1996. Gender Aware Country Economic Reports: Uganda. GENECON Unit Working paper 2. University of Manchester.
Gasper D. 1993. Entitlements analysis: Relating concepts and contexts. Development and Change 24:679–718.
Gelb A. 2001. Gender and growth: Africa’s missed potential. Findings No. 197. World Bank, Africa Region, Washington, DC.
Glick P, Saha R, Younger S. 2004. Integrating gender into benefit incidence and demand analysis, Cornell University, New York.
Grieco M. 1997. Beyond the policy table: Gender, agriculture and the African rural household. In Breath S. ed., Women, agricultural intensification and household food security, Sasakawa Africa Association, Mexico.
Herz B et al. 1995. Letting girls learn: Promising approaches in primary and secondary education, The World Bank, Washington, DC.
Joekes S. 1999. A gender analytical perspective on trade and sustainable development” in UNCTAD, Trade, Sustainable Development and Gender. New York and Geneva. (UNCTAD/EDM/Misc.78). Is this a journal? Style needs to change accordingly.
Kalles–Vittanen A. 1998. Discussant’s commentary: Asian Development Bank Seminar on Inclusion or Exclusion: Social development challenges for Asia and Europe, Geneva, 27 April.
Kasente D. 1998. Agricultural Intensification Strategies, Women's Workloads and Well-Being in Uganda, Geneva, UNRISD, mimeo.
Kasente D et al. 2002. Gender and the expansion of non-traditional agricultural exports in Uganda. UNRISD Occasional Paper No.12. UNRISD, Geneva.
Lockwood M, Whitehead A. 1998. Rescuing gender from the poverty gaps: World Bank poverty assessments and gender. Mimeo. UNRISD, Geneva.
Madanda A. 1997. A gender assessment of factors that affect household food security in Bungoko county–Mbale
87The role of mainstreaming gender in agricultural research and development

District. M.A (Women Studies) Dissertation, Makerere University, Unpublished.
Manyire H. 2008. Liberalisation of agricultural markets, livelihoods patterns and gender relations in central Uganda. PhD Thesis, Makerere University, Unpublished.
Mikkelsen et al. 2002. Mainstreaming gender equality: Sida’s support for the promotion of gender equality in partner countries. Sida Evaluation Report 02/01.
Moulaert F. 1995. Measuring socio-economic integration at the local level in Europe: An analytical framework. In Room G, ed., Beyond the threshold, The Policy Press, Bristol.
Moser C et al. 2004. Malawi gender audit: Evaporated, invisibilised or resisted. DFID, London.
Nayenga R. 2008. Gender dynamics in agriculture in Uganda: What are the key considerations? (http://www.finance.go.ug/docs accessed 16/11/2011)
Ongile G. 1999. Gender and agricultural supply responses to structural adjustment programmes: A case study of smallholder tea producers in Kericho, Kenya. Research Report No.109. Nordiska Afrikaninstitutet, Uppsala.
Power A, Wilson W. 2000. Social exclusion and the future of cities. Centre for Analysis of Social Exclusion, London School of Economics, London.
Razavi S and Miller C. 1995. From WID to GAD: Conceptual shifts in the women and development discourse. Occasional Paper No. 1..UNRISD, Geneva.
Republic of Uganda. 2000. Plan for the modernisation of agriculture: Eradicating poverty in Uganda. MAAIF/MFPED, Kampala.
Republic of Uganda. 2002. The Uganda participatory poverty assessment process/second poverty assessment report: Deepening the understanding of poverty. MFPED, Kampala.
Republic of Uganda. 2003. NAADS poverty and gender strategy for the delivery of improved agricultural advisory services. NAADS Secretariat, Kampala.
Room G. 1999. Social exclusion, solidarity and the challenge of globalisation. International Journal of Social Welfare 8: 166–174.
Sen A. 1981. Poverty and famines: An essay on entitlement and deprivation. Clarendon Press, Oxford.
Sen A. 2000. Social exclusion: Concept, application and scrutiny. Social Development Papers No.1. Asian Development Bank.
Smith L and Chavas J. 1999. Supply response of West African agricultural households: Implications for intra-household preference heterogeneity. Food Consumption and Nutrition Discussion Paper 69. International Food Policy research Institute, Washington DC.
Ssebina-Zziwa A et al. 2004. Patterns and trends in land ownership in Uganda, Kampala. MISR, Unpublished.
Tijabuka A. 1994. The cost of differential gender roles in African agriculture: A case study of smallholder banana-coffee farms in the Kagera Region, Tanzania. Journal of Agricultural Economics, 45, 1.
Udry, C. 1996. Gender, agricultural productivity and the theory of the household. Journal of Political Economy, 104, 5.
[UNDP] United Nations Development Programme. 1998. Uganda Human Development Report 1998. UNDP, Kampala.
[UNICEF] United Nations Children's Fund. 1989. Women and children in Uganda: A situational analysis. UNICEF, Kampala.
[UNICEF] United Nations Children's Fund. 1994. Equity and vulnerability for women, adolescents and children: Uganda national situation analysis. UNICEF, Kampala.
Valdivia C. 2001. Gender, livestock assets, resource manage-ment, and food security: Lessons from the SR-CRSP. Agriculture and Human Values, 18, 1:27–39.
Whitehead A. 1981. I’m hungry mum: The politics of domestic budgeting. In Young K et al, eds., Of marriage and the market, CSE, London.
Wold B. 1997. Supply response in a gender perspective: The case of structural adjustment in Zambia. Statistics Norway, Oslo and Zambian Central and Statistical Office, Lusaka.
World Bank. 1993. Uganda: Growing out of poverty. The World Bank, Washington, DC.
World Bank. 2005. Uganda from periphery to centre: A strategic country gender assessment, The World Bank, Washington, DC.
88 First ASARECA General Assembly, Volume 2

Introduction
I am deeply honoured and profoundly humbled to be given an opportunity to speak at this important gathering. Some of my most comfortable moments are not when I am with my learned friends—the members of the learned profession—but when I fraternize with the scientific community. I derive comfort that you, the scientific community, are the primary foundation of the new economy and the economy of the future. At least, I know that you are responsible for building the technological platforms upon which the new economies and businesses operate. But most important, you have your own noble duty–to ensure that the people of eastern Africa can live in a food secure environment.
Before I turn to the main focus of my presentation today, let me take a moment to share with you a personal story. I was born 45 years ago in a small village called Nyamirama in Ntumgamo District, southern Uganda. At about the age of six, I went to live with my Uncle’s family, having been attracted by a passion fruit tree that grew in his compound. That decision I made at the age of six changed my entire life–I often call my life story a passion fruit story.
But that is beside the point. Both, my parents and my Uncle’s family were and are still agricultural families–largely subsistence households. From the time I started school in 1976, I started small-scale agricultural
“enterprises”. I had my own garden of pineapples–I can say confidently it was the best in the village. I also ran a sweet banana (Kabalagala) partnership business with my Aunt. But it is the sweet banana business that I want to talk about. Many of today’s scientists, including many of you in this room, may not know that there are at least three ways to ripen Kabalagala. First, you can hang it (obugamba) under low intensity heat and smoke. Second, you can bury it in the ground (entabo)1 wrapped in banana leaves, cover it with soil, and it takes between five and seven days to ripen. Third, you can secure Kabalagala in a saucer-like basket (ekitenga) wrapped in banana leaves, again for five to seven days. An important point here is that each of these technologies will produce Kabalagala with a different flavour. At my primary school, Ruhanga Adventist Primary School, my Kabalagala trade made me famous and the school secured for me a place in the staff room, where I would keep my basket of bananas until the trading at break time.
Why is this story important for this meeting? That was then. Today, the entire banana economy in Ntungamo district and beyond is under threat. Until the beginning of 2010, my mother had one of the best banana plantations in my area. As you can see from picture 2 (February 2011), the banana plantation was decimated by banana wilt. You can see it was in rapid retreat and the destruction was unstoppable. The good news was that my parents had a safety net and could make a decision to destroy the plantation as a control measure. The bad news was that the banana economy in Ntungamo was the main source of income; it was the basis for household food security and livelihoods. In the face of this banana wilt onslaught, the choices of the households in Ntungamo, like elsewhere in Uganda or in the dozen ASARECA member states, were limited. Government intervention was almost entirely absent. The scientists may have been in the laboratory
1. “Entabo” is still used in most parts of western Uganda as the main technology for ripening bananas that are squeezed to make banana juice, which is then fermented to make local brew or Amarwa.
Picture 1: Ruhanga Adventist Primary School
6. Governance and policy imperatives for transformation of agriculture in Eastern Africa
Godber W Tumushabe
Executive Director and Policy Analyst, Advocates Coalition for Development and Environment.
KEYNOTE PRESENTATION
25 November 2011
89Governance and policy imperatives for transformation of agriculture in Eastern Africa

starting out on their research, because the government had just released the funds for banana wilt research. The politicians passed by the plantations in January–February 2011 looking for votes, and retreated to their bases in the capital once their election tours were done.
This is the context in which I thought I should situate my paper on governance and policy imperatives for the transformation of agriculture in eastern Africa.
Definition of concepts
Three basic concepts: governance, policy and transformation provide the conceptual limits for this address. Governance is a more complex concept because different disciplines define it and use it differently. In its simplest form, governance refers to “the process of decision making and the process by which decisions are implemented or not implemented.” It is a concept that can be used across scale (international, national or local governance), across units (corporate governance, institutional governance) or applied generally to all situations where decisions have to be made and implemented by multiple actors–hence the concept of agriculture governance. According to Francis Fukuyama, one of the foremost leading scholars of our time, the concept of governance has four key elements:• State capacity – related to a state’s power and ability
to enforce rules that are consistent and predictable.
• Rule of law – that establishes among other things property rights and limits the states’ discretion in manipulating those rules.
• Democratic institutions – that further limit exercise of state discretion by holding governments accountable to their citizens.
• An active citizenry – devoid of fear and manipula-tion that acts as frontline defenders of democracy.
Our exploration of governance of transformation of agriculture must therefore consider how each of these elements relates to agriculture policy decision making and the implementation of agriculture policy decisions among the countries of eastern Africa.
While the concept of policy is amenable to many definitions, the commonly used basic definition of policy is “what governments decide to do or not to do”. We refer to governments because we are mainly concerned with public policy. This is because we know that individuals, households, corporations or business make policies as well. For students of policy analysis, the point of departure is how to differentiate between the policy rhetoric of governments from what governments actually do. As I will elaborate later, I believe that part of the challenge of agricultural transformation is a policy that manifests itself in several dimensions.
Picture 2. Banana plantation decimated by banana wilt
90 First ASARECA General Assembly, Volume 2

The aspiration of many countries in this sub-region is to achieve total transformation of the agricultural sector. This agenda is well articulated in the Common Africa Agriculture Development Programme (CAADP) and other official and unofficial documents of the Africa Union, sub-regional agreements and strategy documents, as well as the national policies and strategies of states. However, part of the challenge is that the concept of “transformation” is often used loosely, and mostly by politicians who have no grounded understanding of what the term means.
I have previously had an opportunity to define the meaning of the term “transformation”. In 2007, I was honoured to lead a Ugandan team of technical experts to prepare a background paper for the Commonwealth Heads of Government Summit that took place in Kampala in November 2007. The theme of the Summit was: Transforming commonwealth societies to achieve political, economic and human development. The approach was to define the concept of transformation in terms of its common application: social, economic and political. In that framework, the concept of transformation could be defined in terms of its social, economic or political phenomena. The definition of “agricultural transformation” would, therefore, follow from these definitions.
First, social transformation means seeking a positive change in the whole of human life materially and socially by recovering man’s true identity as a human being and discovering his true potential through universal literacy, numeracy, vocationalization, and intellectualization of society. Socially transformed societies become productive stewards, faithfully caring for the world and its peoples.
Economic transformation connotes systematic and mea-surable improvements in macro-economic performance as well as micro and household-level indicators. Coun-tries witnessing a process of economic transformation must see the majority of their populations transiting out of abject poverty and deprivation. Economic transfor-mation also leads to national economies that are based on industrial skills and intellectual labour rather than archaic reliance on human muscle.
Political transformation, on the other hand, connotes attainment of a political life in which the rights of individuals and groups become the vanguard of political organization and accountability. In politically transformed societies, political leaders consider themselves as servants of the people and hold political authority for the common good of all citizens. In such
societies, political leadership is based on representative institutions that are accountable and operate to monitor and restrain any possible abuse of public power, discretionary authority and public resources. In countries that are considered not to have attained political transformation–and that is where I believe all the countries in this sub-region are–political leaders expect their populations to be eternally grateful to them when they deliver public service or allow for the exercise of individual rights and freedoms. Perhaps, an important rejoinder is that evidence points to the fact that political transformation is only or perhaps mostly possible in societies that have attained a certain level of social and economic transformation. But it is also possible to look at social and economic transformation as both a means to and a product of political transformation.
When considered in the above context, we can define agricultural transformation as a process in which individual firms and farming households shift from a highly diversified, subsistence-dominated production towards a more specialized production that is oriented towards the market or other systems of exchange. Most importantly, the process of agricultural transformation involves increased reliance on input and output delivery systems and increased integration of agriculture with other sectors of the domestic, sub-regional and international economies.
Consequently, agricultural transformation becomes an integral part of the broader process of structural transformation—a condition in which an increasing proportion of economic output and employment are generated by sectors other than agriculture. In effect, the economy becomes less agriculturally oriented in a relative sense. Relative because although the agricul-tural domination of the economy is diminishing, the agricultural sector continues to grow in absolute terms and generate important growth linkages to the rest of the economy.
Internally, within the agricultural sector, the transfor-mation process leads to a shift from subsistence (low productivity, subsistence level) to diversified (mixed family agriculture, part for consumption, part for sale) and finally to specialized (high productivity modern farms) farming. Structurally, the economy experiences a net resource transfer from agriculture to other sectors of the economy over the long term. An agriculture dominated economy can therefore be said to have achieved transformation if the economy is moving away from subsistence-oriented household-level production towards an integrated economy based on greater specialization, exchange, and the capturing
91Governance and policy imperatives for transformation of agriculture in Eastern Africa

of economies of scale. Many functions formerly con-ducted on the farm, such as input production and output processing, are shifted to off-farm elements of the economy.
Where are we now and how fast are we moving forward?
There can be no doubt that the reason we are talking about agricultural transformation is because we recognize that countries in eastern and central Africa, like elsewhere in sub-Saharan Africa, have not attained transformation in all its dimensions. It is not far-fetched to hypothesize that the failure to achieve overall structural transformation of our economies is rooted in our failure to achieve progressive transformation of our agricultural economies. Today, all economies are heavily dominated by agriculture. Approximately 78.9% of Uganda’s estimated 13 million households are either directly or indirectly dependent on agriculture.2 Over 80% of the labour force in each of the Eastern and Central Africa (ECA) countries is employed in the agriculture sector.
The agricultural sectors in a majority of the countries have been experiencing slow or negative growth. Kenya’s agricultural sector growth was –4.9 and –2.6 in 2008 and 2009 respectively.3 In all the countries, the contribution of agriculture to the national GDP has been declining over the years. For example, the share of agriculture in Uganda’s total GDP declined from 51.1% in 1988 to 33.1% in 1998 and declined further to 15.4% in 2008.4 Uganda’s National Development Plan asserts that this decline in the contribution of agriculture to GDP “represents significant structural transformation in the economy”. However, the share of the labour force engaged in agriculture increased from 66.4% in 2002–2003 to 75.1% in 2005–2005. I argue that deductions such as these that do not take into account the movement of the labour force are misleading for policy.
The conclusion from these economic and growth performance trends is that our economies are experiencing growth without transformation. The economic dominance of agriculture also implies that the agriculture sector must continue to be seen as an “engine of growth”. Achieving broader structural transformation can only emanate from the agricultural
2. UBOS, 20073. KNBS, 20094. NDP, 2010
sector. However, we have to accommodate both strategic and tactical factors to achieve systematic progress in transforming our agricultural sector and bring overall structural transformation into our national economies.
Policy and governance imperatives for agricultural transformation
We have already seen the meaning of policy, governance and transformation. We can, therefore, now turn to look at the policy and governance imperatives for transformation. The equivalent words for imperatives are: necessities, essentials, requirements, laws, rules, constraints, obligation, musts. In general terms, reference to imperatives is a reference to preconditions or constraints to achieving something. This section examines the imperatives.
Policy imperatives for agricultural transformation
All the countries of ECA have been engaged in wide-ranging policy and institutional reforms with far-reaching consequences for agriculture. Generally, it is easier to explain the range of national and regional policy reforms that have taken place since independence. The difficult task is to identify and achieve consensus on what has not worked or why reforms have not produced the necessary transformation and to agree on the kinds of policy adjustments needed to move our countries out of the current policy logjam. While it is possible to provide a general laundry list of what is not working, I suggest that there are specific policy constraints to achieving the transformation of the agriculture sector in the ECA countries.
The failure of national policy making
In many ways, there has been total failure of policy-making in general and agricultural policy-making in particular. This is often explained variously by policy analysts, scholars, politicians and practitioners. Indeed, we can look at the failure of national policy-making in many different ways.
First, response to agricultural policy failures has been less than coordinated, leading to inadequate policy actions. For example, the failure of the agricultural extension system in many countries has enlisted uncoordinated responses that continue to undermine access to critical agricultural advice. Since the inception of the Structural Adjustment Programmes at the beginning of the 1980s, the approach of governments to agricultural extension has been less than satisfactory.
92 First ASARECA General Assembly, Volume 2

Countries have continued to migrate through a number of policy approaches: from the decentralized extension services system to a unified system and back; from public service-based extension delivery systems to private sector-based delivery systems and back to some hybrid system [such as National Agricultural Advisory Services (NAADS) in Uganda]; from public funding of extension services to private funding of extension services and philanthropy.
Failed institutional responses and the challenge of institutional coordination
If ECA countries have failed in policy making, it is tenable to argue that this is because only half-hearted attempts have been made towards institutional reforms of the agricultural sector and altering the broader national institutional architecture within which agricultural transformation has to take place. In Uganda, for example, “administrative engineering” of the agricultural sector institutional framework is the single most important tragedy militating against the transformation of the sector. The Ministry of Agriculture, Animal Industry and Fisheries (MAAIF) has at least five political heads. The president operates as the chief agricultural extension officer and the ministry is headed by four ministers. However, the major problem is that the standard response to any institutional failure is to create a new institution. The failure of MAAIF to coordinate the sector was addressed by the creation of the Plan for Modernization (PMA) secretariat. Its failure to coordinate extension services delivery was resolved by creating NAADS. The failure by the police to investigate the theft of NAADS funds was solved by creating an ad hoc committee of inquiry. The combined failure of all of these measures to address the problems of poverty was solved by the creation of a poverty alleviation office in the president’s office. The result was that the mandate for agriculture was spread across a range of national and local institutions, all pretending to work very hard but without effective mechanisms for coordination.
The budget architecture
The transformation of agriculture in ECA is impossible without major changes in our national budget archi-tecture. In spite of all the political rhetoric beginning with the Regional Food Plan for Africa (AFPLAN), as endorsed by the Monorovia Declaration of 1979, through the Lagos Plan of Action 1980, the Maputo Declaration and now the CAADP, only limited progress has been made with regard to increasing public expenditure in
the agriculture sector. As of 2009, only seven countries had achieved or exceeded the public expenditure com-mitment of 10% of the national budget as agreed in Maputo. Uganda’s current expenditure on agriculture is in the range of 5% of the national budget. As shown in the figure below, only 25% of Uganda’s national budget in 2010–2011 was projected to be spent on the productive sectors, with the bulk of the budget going to social sectors, public administration and defence. Countries that move systematically towards achieving agricultural transformation will have to fundamentally change their budget architecture by directing more public funding to sectors that grow the economy and create new jobs.
Paying lip service to building domestic technological and innovation capacity
It is no longer contested that agricultural economies will be driven by continuous advances in science, technology and innovation. Indeed, there is a lot of political and policy rhetoric about the need for Africa to invest in science and innovation for agriculture. With few exceptions, the national practices as evidenced
Uganda budget 2010–2011 by sector
93Governance and policy imperatives for transformation of agriculture in Eastern Africa

through policy actions, budget allocations and scientific outputs are less than reassuring.
Transforming local governments into production units
AllECA countries are organized around local governments or local administration systems. However, these local units are often seen more as political or administrative units rather than production units. Yet, taxpayers spend a lot of money paying local political leaders and administrators without tangible output. Since agriculture dominates the economies of these local governments, an alternative model of engagement where local governments are funded based on agreed agricultural output targets could be the change that we need. Decades of attempting to “farm” from our capital cities have been a total failure. It is important that we explore the option of farming from below.
Agriculture, food security and national security
Hungry populations and unemployed youth are perhaps the single most important threat to national security in our countries. Yet, in the absence of a robust research agenda to explain the interconnectedness of agriculture and food security to national security and national stability, governments continue to make investments in peripheral sectors without giving agriculture the necessary priority. Within the sub-region, countries like Uganda have invested in buying expensive fighter jets and other forms of defence paraphernalia, ignoring the immediate problems of food security and youth unemployment. Our failure to frame investment in agriculture as our national security investment number one is major source of policy distortion.
These are strategic level policy imperatives that I believe are at the root of our failure to transform our agriculture sectors over the last half century. There are more tactical policy constraints that you will find in national policy documents and regional policy instruments. Indeed, it is easier to diagnose what is working and what is not rather than providing prescriptions on what should be done. This is because the strategic policy imperatives described above are rooted in a political economy that militates against robust action. Put differently, whether the above imperatives are addressed is less a question of policy and more a question of governance and the political economy within which policies are conceived, articulated and implemented.
Governance imperatives for agricultural transformation
Trapped by the nature of our democracy
Firstly, ECA is characterized by young and immature, albeit growing democracies. The nature of our electoral democracy means that politicians win votes by pro-viding both private and public goods. Private goods include jobs, corruption opportunities for the elite, and small gifts such as sugar, soap or salts to the largely peasant farmers during elections. Public goods include promises of schools, health centres, roads and, bridges (sometimes to nowhere).
Secondly, ethnic diversity and poverty are critical raw materials for building political patronage around ethnic coalitions. Winning political support does not require political leaders to pursue agriculture sector transfor-mation-enhancing policies. Politically, it is cheaper to reward local political elites to achieve effective ethnic mobilization rather than investing in long-term trans-formative policies and actions.
Thirdly, in Uganda, we have adopted a rural economic policy package that effectively undermines the growth and transformation of the agriculture sector. This package, involving welfarism, tax relief and admin-istrative engineering, delivers political dividends for politicians without the necessary investments in build-ing local economic infrastructure.
Fourthly, general breakdown in law enforcement and compliance militates against effective management and governance of the environment. In some countries, law enforcement and compliance monitoring shifts from the public law enforcement agencies to politicians. This was the case during the dying years of the Moi regime in Kenya. It is now the case in Uganda where politicians from the president to local political leaders undermine the work of law enforcement agencies with the statutory mandate to ensure the legal and ecological integrity of our environment. Given that our agriculture is still dependent on the mercy of nature and will continue to be so in the short and medium term, it is impossible to achieve transformation of agriculture without responsible stewardship of our environment.
Majority with a minority mentality: building demand for agricultural policy and action
The fate of agriculture and the possibility for a trans-formed agricultural sector across Africa can no longer be entrusted to governments or public service bureaucrats
94 First ASARECA General Assembly, Volume 2

based in the capitals. The failure of agricultural policy is rooted in the failure of governance, therefore agri-cultural managers and the scientific community must invest in creating their own majorities to push for more political attention to the agriculture sector. First of all, it is important that the farming majorities across our countries be activated into a strong political force to counter the biases against investing in agriculture or challenge the rhetoric and the inaction. In our current context, farmers still remain the majority with a minor-ity mentality. Secondly, across the sub-region, evidence is emerging of the growing influence of parliamentary committees in shaping national budget priority setting. As agricultural policy makers and practitioners, we need to pay more attention to working with key par-liamentary committees such as those responsible for agriculture, the national economy, science and tech-nology, the budget, or the environment and natural resources.
Building bridges across political parties
The transformation of agriculture must be approached as a bipartisan agenda that has to be promoted by ruling parties as well as the opposition. When fully mobilized, political parties can be important vehicles for mobilization and civic action. Indeed, efforts to shift more public funding to the agricultural sector can only be achieved if the ruling parties as well as opposition parties buy into it. As research managers and scientists, we must be interested in how political parties articulate their campaign agenda for agriculture. However, the governance framework within our countries undermines the potential for a bipartisan agenda on policies and actions that can help achieve political transformation. In some of the countries, it
may be suicidal for the Director General of National Agricultural Research Organization (NARO) or policy makers within ministries to meet with leaders of opposition parties to help them appreciate the urgency of the moment.
Africa is not impatient enough
Finally, it is possible to be paralysed by the nightmarish picture painted above. When I raise these fundamental policy and governance issues, I am often accused of not highlighting the progress that has been achieved. Let me therefore recognize that some progress has been made in a number of countries and more progress is likely over the next years. My point is simple. In the 21st century, African mothers are dying for lack of basic maternal care. Progress has been achieved in education enrolment, but African children are being given a 19th century education to compete in a 21st century global economy.
It is because of the stories that come from across this continent that I speak with passion about the failure of policy and governance in Africa and the dismal attention that is being paid to the agricultural sector. The fact that from the Monrovia Declaration (1979) to the Abuja Plan of Action (1980), to the Maputo Declaration (2003) and beyond, African politicians and policy makers keep on mouthing the commitments that have been made without meeting them gives one the impression that Africa is not impatient enough. It is important that at this conference and in the others coming after it, we think of the things we must do to galvanize ourselves into an elevated sense of urgency. It is only then that we will be able to step out of our comfort zones and join the on-going global race for the future.
95Governance and policy imperatives for transformation of agriculture in Eastern Africa

Executive Summary
This paper reviews and highlights available agricultural technologies and innovations that can be utilized to enhance agricultural productivity in Eastern and Central Africa and ensure food security in the 21stcentury. The technologies are reviewed under four main categories: (i) mainstream food production systems; (ii) integrated systems; (iii) drought-prone fragile ecosystems; and (iv) urban and peri-urban systems. The technologies reviewed cover the whole range of production decisions, including systems choices and crop types; follow activity sequences in food production from land preparation, planting, crop management (nutrients, water, weeds, pests and diseases); and finally examine harvest and post-harvest handling and processing. The review concludes that adequate agricultural technologies and innovations exist to enable the region transform its agriculture and ensure food security.
The paper also highlights existing opportunities that can be exploited to transform agriculture–in particular the untapped potential, renewed foreign interest in African agriculture, and the potential for countries to invest in the transformation. In conclusion, the paper recommends that the region must renew its commitment to agriculture, focus on transformation of farmers, particularly smallholders, and see research and technology generation as key to developing scientific, highly reliable and competitive farming systems.
Introduction
As we look at the challenge we have set ourselves as reflected in the theme for this Assembly: Feeding our region in the 21st century, we must keep in mind the very worrisome food situation in our region and Africa generally. In its October–December issue of 2011, the BBC Focus on Africa magazine published some grim statistics: 13 million in the Horn of Africa face a hunger crisis; there are 2 million acutely malnourished children in Somalia, Kenya and Ethiopia; a 20% decline is expected in production of key crops in eastern Africa by the end of the century if climate change is not urgently addressed (bbc.co.uk/focusonafricamagazine).
Over the last two decades or so, due to the limited attention given to agriculture by our governments, growth of the sector has been low, in the order of 2–4% per annum, with a frequent decline when countries suffer adverse weather conditions (World Bank, 2009). Yet, our populations have increased rapidly, with Zimbabwe and Uganda having some of the world’s highest population growth rates. In fact, if population growth and export agriculture are discounted from the little growth in the sector, it becomes clear that food agriculture in most ASARECA countries has been on the decline. Thus, not surprisingly, whereas sub-Sahara Africa’s Global Hunger Index (GHI) has fallen by only 14% compared to its 1990 level, in the near East and North Africa it fell by 33%, and by more than 40% in Southeast Asia, Latin America and the Caribbean (IFPRI, 2011). Given the poor state of our agriculture, how shall we deal with these challenges and ensure long-term food security for our people?
Technologies, innovations and agricultural transformation
It must be appreciated that modern agriculture is a deliberate and scientific undertaking that creates highly dynamic and unstable ecological systems, with nature competing against our interests. Agricultural technologies and innovations are our means to tipping the competitive balance in our favour and to ensure that our production needs and set objectives are met. Appropriate technologies and their adoption are therefore crucial to our success, and form the basis of the transformation that we must make from traditional low-productivity farming to technology-based, high-output and high-productivity agriculture that will ensure food security and sustainable livelihoods for our people in the 21st century.
What gives comfort is the fact that we have within our reach appropriate agricultural technologies and innovations that we can immediately deploy to rapidly transform our agriculture. In a recent review, the World Bank contended
7. Proven technologies for feeding the Eastern and Central African regionMorris W. Ogenga-Latigo
Tangi River FarmTel.: +256-772-456718/-754-456718
Emails: [email protected]; [email protected]
Paper presented at the First ASARECA General AssemblyEntebbe, Uganda
14–16th December 2011
96 First ASARECA General Assembly, Volume 2

that there are sufficient technologies and innovations to ensure agricultural transformation and food security in the developing world (World Bank, 2009). Similarly, in response to the emerging concern of climate change and its worldwide threat to food production, FAO recently published the compilation Climate-Smart Agriculture: Policies, Practices and Financing for Food Security, Adaptation and Mitigation (2010) in which it contends that, even with the threat of climate change, existing technologies and innovations are largely sufficient to address our farming and food security challenges.
Since the late 1960s, when dangers of persistent food shortfall in Sahelian Africa and some Asian countries loomed large, the international community, under the Consultative Group on International Agricultural Research (CGIAR), have focused on research and development of key food crops, particularly rice, maize, wheat, sorghum, millets, cassava, sweet potato, Solanum potato, and pulses (beans, groundnuts, cowpea, pigeon pea, field peas, chickpea) for the tropics. This, and the work of National Agricultural Research Systems (NARS) and the ASARECA networks, have made available a whole range of crop varieties, technologies and innovations that address the broad needs of our agriculture.
ASARECA has compiled some of the locally generated “best-bet” research outputs for enhancing agricultural productivity in eastern and central Africa. They include: (i) appropriate crop varieties of higher yields, better agronomic characteristics, novel nutritive qualities and resistance to pests and other environmental stresses; (ii) improved crop management practices; (iii) post-harvest handing and processing; and (iv) natural resources management (Kimenye and Bombom, 2009). There is also a wide range of long-proven technologies available within the region, and worldwide, that we can use to transform our agriculture.
This paper briefly reviews the various agricultural technologies and innovations available to address the challenge of feeding our people in the 21stcentury. Recognizing the fact that food security in the region depends largely on the production of mainstream food crops like cereals, legumes, oil seeds, vegetables, roots and tubers, and bananas, in broad agro-ecologies, the paper lays emphasis on these crops. It, however, also reviews available technologies related to challenges of climate change and production in fragile agro-ecologies; integration of animal production, agro-forestry and energy sourcing into our cropping systems; and technologies that can enhance food production and food security in urban settings.
Proven agricultural technologies for feeding our region
Successful agricultural production is a chain of linked activities that starts with deliberate selection of production systems, suitable varieties and breeds and appropriate production methods and practices, and follows activity sequences from land preparation, planting, crop management (nutrients, water, weeds, pests and diseases), to harvest and post-harvest handling and processing. Success at every stage requires effective use of appropriate technologies, innovations and practices.
A wide array of innovations and time-tested practices and technologies is available, covering the whole range of agricultural production and produce handling, including tillage machineries and equipment; planting tools and equipment; irrigation equipment and systems; herbicides and tools for weed control; inputs (fertilizers, pesticides and so forth); harvest tools, equipment and machineries; and post-harvest handing, storage and processing. A review of what is available reveals that creative capacities to put these technologies and innovations to effective use is the crucial factor for success.
For ease of presentation, we review these food pro-duction technologies under four main categories: (1)mainstream crop production technologies; (2) fragile agro-ecosystems production technologies; (3) integrated systems technologies; and (4) urban and peri-urban production technologies.
Category 1. Mainstream crop production technologies
Food security in our region largely depends on successful production of food crops like cereals, bananas, roots and tubers, pulses, oilseeds, vegetables that are our dietary mainstay. Starting from the choice of land preparation methods, to the crops we grow and how we grow them, up to produce processing and handling, there are various technologies and innovations that can help us achieve our goal.
Land preparation and zero tillage technologies
Traditionally, crop production in our region has depended on tillage agriculture, with crops grown on land cultivated using either hand-held tools (hoes), animal-drawn implements (ploughs, ridgers) or tractor-mounted equipment (subsoilers, ploughs, harrows, ridgers). Such an approach is labour-intensive,
97Proven technologies for feeding the Eastern and Central African region

demanding time and energy, but remains important and necessary. Against a background of high fuel prices and prohibitive tractor hiring costs for smallholder farmers, rapid movement of rural labour away from agriculture to urban life, the challenge of climate change and unstable rainfalls, and the urgent need to conserve soil moisture and other resources, greater attention needs to be directed to conservation agriculture, particularly zero- or no-till practices.
Zero- or no-tillage is a farming system in which non-selective herbicides, such as glyphosate, are used to kill residual crops and weeds in crop fields and wild vegeta-tion in uncultivated land before crop seeds are directly sown in the untilled soil. This system ensures sustain-able agricultural productivity even under extreme soil and climatic conditions (Silici, 2011), with very positive environmental effects, including soil erosion control, increased water infiltration, accumulation of organic matter in crop fields, and carbon sequestration in the long term.
Zero-tillage is being applied globally on over 100 million ha of crop fields under the most diverse climatic and soil conditions (Silici, 2011). Many commercial farmers in our region also utilize no-till practices. In northern Uganda, for example, some large-scale farmers now combine normal cultivation and zero-tillage in crop rotations of maize, soybean and upland rice. This has particularly allowed effective utilization of light early rains in the first season, early planting of follow-up crops during the second rains, and sustenance of good yields even under relatively poor weather. The technology is also suitable for smallholder farmers as herbicide use is less labour demanding and relatively cheaper than field cultivation; it also effectively suppresses weeds in the early stages of crop growth, and frees much needed time for other production activities. This potential, however, remains virtually untapped.
Improved food crops
Novel crop breeding techniques (e.g. marker assisted selection) and genetic engineering have enabled rapid generation of new crop varieties that address specific production challenges and meet diverse needs. It is estimated that there are currently over 8000 crop varieties worldwide (World Bank cited by Odame, Kabitha and Alemu, 2011), many of which are our own or are exotic varieties that can be successfully grown in the various agro-ecologies of our region. Locally, focus has been on improving traditional food crops, and even temperate crops such as Solanum potato and wheat, and adapting them to local challenges and needs,
particularly for higher yields, high nutritive qualities, stress tolerance, and resistance to pests and diseases.
a. Higher yielding varieties
Yield has been a standard improvement criterion in most newly released crop varieties. Except for the wholly vegetatively propagated East African Highland cooking bananas (matooke), there has been a dramatic improvement in the yield potentials of the whole range of food crops grown in our region. Dramatic yield improvements have been registered for crops like maize, sorghum, upland rice, cassava, sweet potato, groundnuts, beans and cowpea, with new better-performing varieties being released quite regularly.
Take maize, for example, whereas the open-pollinated varieties available to local farmers in Eastern Africa in the 1960s and 70s, such as Katumani in Kenya and Longe in Uganda, had yield potentials of less than 4mt/ha, some open-pollinated varieties now yield in excess of 6mt/ha and hybrids, such as Longe 10H in Uganda and PANA series in Malawi, yield up to 9–10mt/ha. Today, higher yielding hybrids are shared between the region and the agriculturally more advanced South Africa. Substantial yield increments have also been registered for other cereals such as New Rice for Africa (NERICA) upland rice (from 2 to 4mt/ha), sorghum (from 2 to over 4mt/ha) and finger millet (from under 2 to over 3mt/ha).
Yields of both cassava and sweet potato, traditional reserve food crops that had for long been neglected, have also dramatically improved. Since the 1990s, when efforts were directed at containing the spread of Cassava Mosaic Disease (CMD), new quick-maturing and higher-yielding cassava varieties have been regularly released, and these have dramatically improved production throughout the region. The varieties include NASE 1 and TMS series in Uganda, I92/0057 and TME series in Rwanda, MM96 series in Burundi and DR Congo, and Clones 35, 75 and 675 in Madagascar. For sweet potato, introduction of the vitamin-rich Orange Fleshed (OFSP) varieties (such as Kemb 10, Kakamega, Muganda) has increased yields by 56–103%, while improved quick-yielding Non-Orange Fleshed (NOFSP) varieties (such as Wagabulige, Yanshu) yield 3–4 times more than the traditional varieties (Kimenye and Bombom, 2009).
Among legumes, the new groundnut varieties (Serenut series in Uganda, AGRA series in Tanzania) yield 1–3 times more than the traditional varieties. The improved cowpea varieties, CP White and CP Kunde, grown in Uganda and other countries, yield over 3mt/ha compared to less than 1mt/ha for traditional varieties.
98 First ASARECA General Assembly, Volume 2

For beans, the climbing varieties being vigorously promoted in highly populated highland areas of eastern Africa, which face severe land pressures, are dramatically improving household food security. These varieties yield up to 5mt/ha as opposed to less than 2mt/ha for bush varieties. Over the last 10 years, while yields of bush beans have gone down by 60%, those of climbing beans have gone up by over 50% (Kimenye and Bombom, 2009). These legumes are also of critical importance in enhancing soil fertility.
Even bananas, which do not lend themselves to much innovation, have seen new varieties that can withstand outbreaks of diseases such as Sigatoka and Xanthomonas wilt that have adversely affected yields of the EA Highland cooking bananas. The FHIA series now grown in Uganda and other ASARECA countries, bear huge bunches that weigh up to 100 kg compared to 10–40 kg for most traditional cultivars. Some of the FHIA varieties also serve dual roles as desert and cooking bananas. Clearly, therefore, scientists in our region are effectively addressing crop yield potentials as a constraint to food security.
b. Highly nutritive varieties
Faced with the following challenges: dwindling stocks of fish in our freshwater bodies (fish has been traditionally relied upon as a relatively cheap source of non-plant proteins), the non-affordability of meat, eggs and milk by the rural poor, and the low levels of key vitamins in local diets, the nutritive values of two of our main carbohydrate food crops, maize and sweet potato, have recently been strengthened.
Under a regional programme, Quality Protein Maize (QPM) varieties have been developed and popularized, mainly in Uganda, Kenya and Tanzania. These varieties, such as Longe 5 (Nalongo) in Uganda, TANH611Q in Tanzania, and KH531H in Kenya, are typically rich in two essential amino acids, lysine and tryptophan. Their inclusion in local diets can vastly improve nutrition standards and the health of those who would otherwise suffer protein deficiencies.
In a similar effort, OFSP varieties rich in pro-vitamin A have been developed and are now available and being utilized in Rwanda, Burundi, Tanzania, Kenya and Uganda. Varieties, such as Kembo 10, Kakamega, Serura and Muganda, produce 20–30 times more beta-carotene than Golden rice, and have wide adaptability across a range of environments. It is suggested that effective utilization of these varieties can alleviate vitamin A deficiency among up to 50 million children and very
many childbearing mothers in Africa (Kimenye and Bombom 2009).
Efforts have also been made to improve the availability of some already nutritious food crops being grown in our region. For example, Solanum potato, an otherwise temperate crop, has been adapted for production in the lowland tropics. With higher protein and mineral content, higher digestibility, and good storability, its expanded production will greatly enhance local food security and nutrition. Varieties such as Victoria, Cruza, Rutuku, Kabale, Tigoni and Sangema and their local variants are now grown in Burundi, DR Congo, Ethiopia, Kenya, Tanzania and Uganda.
Even for cowpea, which is a major traditional source of plant protein for the rural poor in much of Africa, significant nutritional improvement has been made. Local cowpea varieties contain high levels of saponins that cause severe constipation when these varieties are eaten in substantial quantities, thus limiting intake. The new cowpea varieties, CP Kunde and CP White, now available in the region are free of this problem, have high protein content (>45%), and cook very quickly (20 minutes); additionally their leaves are highly palatable and an important source of vitamins. Effective use of all these varieties will dramatically change the food and nutrition situation in our region.
c. Stress-tolerant varieties
Agriculture in Africa faces two looming challenges. Firstly, with rapid population growth, there is overuse of land and communities are being forced to migrate to and farm in otherwise marginal areas with lower and erratic rainfalls and low fertility soils. Secondly, because of climate change, rainfall intensities and patterns have become less consistent even in traditionally very stable environments, with frequent droughts causing unexpected crop failures. Although, generally, many of the crop varieties now released in the region–upland rice, cowpea, groundnut, sorghum, millet and so forth–have degrees of tolerance to moisture stress, intensive efforts have been directed at developing crop varieties highly tolerant to drought and nutrient stresses.
The best example of this has been the development of stress-tolerant maize under the Africa Maize Stress (AMS) Project. In all our countries, most of the maize grown is rain-fed, and drought and low levels of nitrogen are major constraints to production. Under the project, three categories of new maize varieties have been released: (i) early maturing, (ii) extra-early maturing, and (iii) drought and low nitrogen tolerance
99Proven technologies for feeding the Eastern and Central African region

(Kimenye and Bombom, 2009). The varieties now promoted and grown in Ethiopia, Kenya, Tanzania, Burundi and Uganda include Espoir, STRS, ZM621 and ZM521, and ECAVL1, 2 and 16. Wide adoption of these varieties will fortify maize production against erratic weather and extend its frontiers to even currently non-maize, food insecure and drier marginal areas in our countries.
The other notable example is the development of bean varieties to address nutrient deficiencies. In many high potential areas of our region, naturally or through poor farming practices, soils have become highly nutrient deficient. The most important are the phosphorus-deficient, known as “lunyu” soils in central Uganda, responsible for significant decline in bush bean produc-tion. Through efforts in Kenya, varieties of Red Kidney, Red Mottled, Small Red, White/Navy and Pinto bean genotypes have been identified that have remarkable tolerance to P-deficiency. These are now widely grown in western Kenya, and are being promoted in DR Congo, Rwanda, Uganda and other ASARECA coun-tries (Kimenye and Bombom 2009).
d. Pest, disease and weed-resistant varieties
Pests, diseases and weeds are the most important biotic constraints to crop production worldwide, especially among smallholder farmers who lack the capacities to control them. But now we have the capacity to respond quickly and effectively to these challenges. Today, most of our new crop varieties are pest and disease-resistant. The greatest successes include resistance to the Maize Streak virus in maize, Groundnut Rossette virus in groundnut, and Cassava Mosaic virus in cassava.
A notable recent progress has been the use of resistance in integrated control of Striga, a weed that causes severe yield losses in maize, sorghum and upland rice, especially in nutrient depleted soils. Maize with imidazolinone-resistance (IR-maize) resists Striga parasitism and damage. This resistance, combined with low dose seed coating with the herbicide STRIGA-WAY (a.i. imazopry) from BASF, leads to remarkable control of Striga, and increases yields by up to 80% as compared to ordinary maize under Striga infestation. Five IR-resistant maize varieties (4 hybrids and 1 open-pollinated) are now available in western Kenya, and the technology is being extended to Uganda, Tanzania and other countries.
The other example that reflects our scientific capacity to quickly and effectively respond to emerging pest and disease challenges through the development of resistant
crops is the case of Rice Yellow Mottle Virus disease in Tanzania that became a menace as rice production expanded. Scientists developed and released two rice varieties resistant to the disease, Mwangaza and Kalalu, resulting in more than 50% yield increases for farmers. The varieties have now been introduced into DR Congo and Kenya (Kimenye and Bombom 2009).
From the above examples, we can conclude that we have the necessary crop types and varieties to meet our food production needs, and the scientific strength to address new challenges in this area. The potential of these new varieties will, however, only truly benefit us when the right seeds are used and the crops are grown using sound management practices.
Seed systems technologies
Food crops production in our region is seriously constrained by the challenges of effective supply and use of quality seeds and vegetative planting materials. This recognition is the basis on which AGRA (Namanga Ngongi, 2011) and various other agencies have focused on seed systems development.
Except for hybrid maize and a few other grain and horticultural crops, commercial seed supply systems are relatively poorly developed in our region. Commercial seeds are also costly and, generally, too expensive for ordinary farmers. Also, some of our critical food crops–bananas, cassava, potato and sweet potato –are vegetatively propagated, and supply of their planting materials is not commercialized. Therefore, most of our farmers rely on planting their own saved seeds and vegetative materials, and exchange the planting material amongst themselves.
Associated with farmer-based seed sourcing are various concerns, particularly (i) weed and pathogen contamination of seeds; (ii) high incidences of seed-borne diseases; (iii) systemic viral disease infections and spread in vegetatively propagated plants; (iv) rapid deterioration of seeds and planting materials; and (v) low rate of multiplication of seeds and planting materials of newly introduced crop varieties. Yet effective technologies and innovations exist that can ease farmer access to quality seeds and ensure sustainable seed supply to boost food production.
a. Chemical seed dressing
It has long been recognized that seed-borne diseases are responsible for poor crop germination, and can cause serious yield losses. The solution is to dress seeds with
100 First ASARECA General Assembly, Volume 2

appropriate pesticides before planting. Since colonial times, copper-based seed dressings have been used to protect cotton against Black Arm and other diseases, and commercial seeds remain similarly dressed with more modern fungicide-insecticide combination compounds. Yet, seed dressing is hardly used by our local farmers.
Our farmers suffer unnecessary and largely un-quanti-fied losses because they use their own untreated seeds. This season, for example, I used farmer-sourced seed to plant about 25 acres of the local rice variety “Super” or “Nylon” that is highly preferred and valued because of its large seed size, strong tasty aroma and good cooking quality. As I had successfully grown the variety before without seed dressing, and local farmers do so, I did not bother to dress the seeds with appropriate chemicals. Unfortunately, though the crop recovered from the drought that hit the area between May and July and tillered and flowered well, there was severe outbreak of the seed-borne Rice Head Blast disease that dried off the rice panicles before the grain filled. For failure to dress the seeds with a chemical that costs just US$30, I lost a crop that would have earned me over US$15,000. This disease affected not only me but also other farmers in northern Uganda.
b. Tissue culture seed cleaning
During the last two decades, this region suffered severe outbreaks of cassava viral and bacterial diseases that totally devastated the crop. One of the primary reasons for this was the rapid spread of the diseases since the farmers propagated through cassava cuttings that perpetuated the disease cycle, resulting in a negative downward spiral of production. Similar rapid spread of virus complexes in sweetpotato through planting vines have resulted in quick deterioration and decline upon release of otherwise potentially highly productive sweetpotato varieties. More recently, outbreaks of Xanthomonas bacterial wilt in EA Highland bananas, rapidly spread through infected planting suckers and pruning knives and hoes, threatened food security in some banana-dependent communities of central and western Uganda. Fortunately, however, these diseases can now be reasonably controlled at the vegetative seed production level through use of disease-free inputs and rapid micro-propagation.
Tissue culture or micro-propagation technology, now well established in our region, is used to produce thousands of disease-free plants and plantlets ready for sowing, rather than suckers or cuttings, in sterile containers that further reduce chances of transmitting diseases, pests, and pathogens. In Uganda, many
private tissue culture concerns now produce banana plantlets and plantlets of other vegetatively propagated crops for commercial sale. These plants, being clones, tend to be uniform in growth, yield and other qualities, and can be subjected to genetic quality control checks like certified seeds.
c. Community-level seed multiplication
Following the devastation of cassava by CMD and Cassava Brown Streak Disease (CBSD) and the development of new virus-resistant cassava varieties, the need arose to rapidly multiply the new varieties and make them locally available to farmers in the shortest time possible. A three-step process was evolved whereby the varieties were first multiplied at the research station. These materials were then moved to and propagated at the regional or district level sites, from where they were moved to the third community-level multiplication sites that belonged to individual farmers or farmer groups. Individual farmers then accessed the new materials from sites within easy reach. This approach ensured the rapid spread of the new varieties and a sustainable supply of planting materials, and led to the quick revival of cassava production in many ASARECA countries (Kimenye and Bombom 2009). This approach has also been used in Uganda to propagate and rapidly spread new sweetpotato varieties and FIA bananas.
The other approach that is now being vigorously promoted in Tanzania and other countries for rice and other seed crops is the production of Quality Declared Seeds (QDS). Selected farmers are identified and supported to produce quality crops for seed under superior management conditions that minimize disease infestation and proliferation of weed seeds. At maturity, the crops are inspected and their quality parameters declared without certification. Farmers then have the option of buying locally available seeds, chemically dressed or not, at much lower costs. A similar approach is now being instituted for upland rice, groundnut and other crops in northern Uganda. From the perspective of good planting materials, therefore, technologies at hand are sufficient to enable us meet our needs for sustainable food production.
d. Planting technologies
Besides quality, correct planting of seeds (density, placement depth) is the other key variable in our crop production systems, and seriously affects management practices and maximization of yield potential. In modern farming, seed planting technologies (planters, broadcasters) exist that ensure that crops are planted
101Proven technologies for feeding the Eastern and Central African region
at optimum densities and depths. Even under zero-tillage systems, mechanical planters are now available that will deliver seeds to appropriate depths in the driest soil, thus allowing early field operations and the maximization of water use for plant growth right from the onset of rains.
Among our smallholder farmers, commercial non-food crops, such as cotton, are planted in rows at recom-mended spacing, whereas food crops, such as sorghum, millet, upland rice, simsim and beans are broadcast. Broadcasting results in men avoiding weeding, leaving it to women to complete this task; which partially explains the disproportionate role women play in food crops production. It is estimated that, each year, women spend up to 2000hrs weeding one hectare of food crop (Juma 2011). Yet various mechanical planters are avail-able for planting of crops in rows, at appropriate depths and densities. Row planting also eases work allotment, use of mechanical tools, and movement within crop fields when applying pesticides and foliar fertilizers. Its use will also be inevitable when tie-ridging has to be adopted for rainwater conservation.
Crop management technologies
Successful field crop management is dependent on four critical activities: soil water management, soil fertility management, weed management, and pest and disease management. Failure in any one activity can lead to complete crop failure.
a. Soil water management
Much of our food production is dependent on rainfed agriculture and, in high potential areas, reliable rainfall means that farmers can produce the needed crops. With climate change, however, drought has begun to occur even in totally unexpected areas, thus undermining the reliance on rain for food production. Inevitably, we will have to turn to irrigation and effective rainwater harvesting and conservation to guarantee food security.
Irrigation is the most reliable water supply for farming. Irrigated crops are healthier and mature faster, and the yields and quality are consistently higher than rainfed crops. Our region has large freshwater bodies and rivers, streams and underground water sources that have not been tapped for crop production. It is only now, for instance, that Kenya and Tanzania, where periodic food shortfalls occur, are considering using the waters of Lake Victoria for crop irrigation.
A wide array of irrigation systems are available that can be easily accessed, and many are in use in our countries. These include self-propelled sprinkler systems, small sprinkler systems, drip irrigation systems open furrow systems and the like. Of immediate interest, however, are technologies that can help us maximize the use of rainwater, given our undeveloped agriculture and the high costs of modern irrigation systems.
In many dry parts of Africa, various technologies have been developed to harness rainwater for food production, including use of drought-tolerant and early and extra early crop varieties (Reij 2009; FAO 2010). Water harvesting systems allow the collection of rainwater from roof tops, surface runoffs and catchment points and its redirection to crop fields and individual plants, or storage for later use. Many commercial farmers (for example, horticulturists) in the ASARECA region, and particularly neighbouring Zimbabwe and South Africa, have successfully tapped water through rainwater harvesting, yet our smallholder farmers rarely do so.
Planting pits (such as zai in Burkina Faso) are used to facilitate both rainwater infiltration and retention, and to concentrate nutrients and water around crop plants. In western Uganda, banana farmers direct rainwater into troughs dug around banana mats. This has enabled successful banana production in even relatively dry cattle rearing areas. Similarly, in Teso, in eastern Uganda, water troughs are used to hold rainwater around orange trees, dramatically increasing fruit yields, benefiting farmers. While, in Malawi, virtually all communities grow maize on tie-ridges that trap water and retain nutrients. With increasingly smaller landholdings, cultivation in marginal lands and erratic rainfall, efficient irrigation and water-harvesting technologies will be vital to sustaining food production.
b. Soil fertility management
Modern crop varieties that produce high yields are heavy feeders and need fertilizers or enhanced soil fertility for growth. High mineral leaching and weathering in our region, poor soil management and intensification of land use due to population pressures impose an urgent need for effective soil fertility management systems. Conventional fertilizer use is well known, and this technology is freely available in our region. However, the extremely high cost of these fertilizers and increasing concerns about the environmental impact of heavy fertilizer use necessitates that we focus on alternative technologies to feed our crops. Three of these–modified fertilizer application systems, legume rotations and
102 First ASARECA General Assembly, Volume 2

organic manures–are technologies that our small-scale farmers can easily access and benefit from.
A simple alternative way to supply nutrients to crops in the field is the foliar application of fertilizers that are scientifically constituted with all the critical nutrient elements, including micronutrients. Although previously confined to greenhouse and horticultural use, foliar fertilizer technology is now widely used, is biologically and economically effective, and easy to use. On my farm, for example, using ten 2-lt hand-held sprayers and 400 lt of water, five workers apply foliar fertilizer on 10 ha of maize in just 3–4 hours, and at nominal cost. The same sprayers are used to apply herbicides to control weeds and fungicides and insecticides to control crop diseases and pests.
Alternatively, as practised elsewhere, inorganic nitrogen can be made available to crops using the Urea Deep Placement (UDP) technology. This involves the placement of granular or briquetted urea deep in the soil where it is slowly released to the growing plants. This technology generates 50–60% savings in urea use and was reported to have increased rice yields by up to 1mt/ha in Bangladesh (FAO, 2010).
The other organic options that are more easily available to farmers include rhizobium inoculation and the use of legumes such as soybean, groundnut and cowpea in rotation with non-leguminous crops, which is a sustainable way of supplying otherwise costly nitrogen to food crops, particularly cereals (maize, sorghum, upland rice, millet, wheat). The benefit of legumes for nitrogen fixation is well known, and we need to ensure their systematic utilization by farmers. The use of crop residues and animal manure to enhance soil fertility is equally well known; the latter especially in integrated crop-livestock production systems.
c. Herbicides in weed management
In all our countries, women play a disproportionate role in food production compared to men, bearing almost 80% of the burden (Odame et al. 2011). Much of this is linked to the back-breaking task of weeding, especially for food crops such as millet, sorghum, rice and teff, which are usually not planted in rows; in fact, men claim that sometimes they cannot distinguish the crop from weeds with their hoes. Yet effective chemical technologies exist, and have been used in the region for years (Ivens 1967), that can help alleviate this great burden.
In small grain cereals, the most stubborn weeds are usually leafy plants, such as Wandering Jew, Commelina
spp. and Black Jack, Bidens pilosa, whose rapid multi-plication necessitates that crop fields be weeded more than two to three times before harvest. Early crop pre-emergence application of such herbicides as glyphosate and 2, 4-D drastically reduces weed problems and eases weeding. The latter is particularly effective in post-emergence control of leafy weeds in cereals. The chemical is cheap, safe and easy to apply. A farmer using two small hand-held 2-lt garden sprayers, for example, requires just one jerrican (20 lt) of water and 1 lt of the herbicide to spray 1 acre of millet, sorghum or rice at a nominal cost of less than $10. A task undertaken by men usually, it offers incredible relief to women, reducing their burden in food production. The time, labour and resources that are saved can be used to further boost food production and enhance household food security.
Beyond these, there are selective crop-specific herbi-cides that, although more expensive, are very effective is controlling weeds. These include saturnil for rice and the atrazines for maize. With careful use, these chemicals are equally effective for weed control in tra-ditional cereals. In relation to zero-tillage agriculture, genetically-engineered and herbicide-resistant crop varieties, such as Roundup Ready maize, now in use in South Africa, have also been developed that allow total eradication of weeds in growing crops by using glyphosate without harming the crops. Herbicides, therefore, are indispensable tools in our food produc-tion systems.
d. Pests and diseases management
Pests (arthropods, birds, vermins) and diseases (fungal, bacterial, viral) are major impediments to crop production worldwide. Among smallholder farmers, the threats are dealt with by avoidance of susceptible cultivars or just acceptance of damage as natural. While the basic long-term strategy remains generation of crop varieties resistant to these pests and diseases, it is inevitable that, whenever necessary, control strategies, singular or integrated, are applied to avert crop damage. The best known of these strategies are chemical pesticides.
As discussed earlier, seed dressing chemicals exist that are used to eliminate infestations and protect seeds from pests and systemic plant pathogens. A wide range of insecticides and fungicides and antibiotics are available for the control of pests and diseases. Even for birds, particularly Quelea quelea spp., which are a menace to small grain cereals (rice, millet, sorghum), there are chemicals (repellents) available in the market that can prevent them from destroying the grain.
103Proven technologies for feeding the Eastern and Central African region

The problems with pesticides though are toxicity and high risk of human poisoning when indiscriminately used; high cost of protective gear; risk of water and environment pollution; and harming of non-target organisms such as bees and other beneficial insects. Therefore, caution and knowledge in their use will be essential.
Crop harvest and post-harvest technologies
In traditional farming systems, harvest and post-harvest crop losses are known to range as high as 20–30% or more, thus depriving populations of the food that they struggle to produce. A wide range of equipment, such as harvesters and threshers, shellers, slicers, sun driers, cleaners and storage bins and preservatives are available to enable farmers safely harvest food crops from the field, dry, clean and store them. Of greater interest is on-farm processing technologies that promote food preservation and utilization.
Fruit and vegetable driers enable farmers process and store highly perishable fruits and vegetables, and make them available off-season. Simple community-based oil presses and mills help quickly process grains for consumption. The by-products of this processing (bran and seed cake) are available to feed poultry, pigs and even dairy cows, thus boosting availability of animal proteins and diversifying food and income sources. In the case of sorghum and millet, which thrive well even in drought-prone environments but are less preferred especially by elites, processing technologies have been developed to boost uptake and utilization. Through these processes, easily marketable sorghum products like “Super Mtama”, a rice-like fine floor, are now available (Kimenye and Bombom 2009). From crop types to crop use, technologies are available that can ensure food security in the 21stcentury.
Category 2. Integrated systems technologies
In our region, food crop production may be closely linked or integrated with livestock production, agroforestry and household energy supply. Various technologies and innovations are available to exploit these linkages.
Crop-livestock systems
In most smallholder systems in our region, farmers not only grow crops but also keep some livestock, particularly poultry, small ruminants (goats, sheep and
rabbits), pigs, and cattle (for milk, draught and meat), with the two systems drawing benefits from each other.
Draught animals support farmers’ methods (ploughing, planting, weeding, transport) and help greatly expand outputs. More importantly, with the rising costs of mineral fertilizers, livestock manure becomes critical for resource-poor smallholder farmers to sustain soil fertility and yields and produce organic vegetables and other high-value crops by. It is also increasingly being used in gas digesters to produce methane gas for heating and lighting and high-N liquid manure, which is a by-product.
It has also been estimated that, due to growth in populations and in incomes as countries modernize, world demand for meat and dairy products will grow by 68% between 2000 and 2030. In our countries, this demand will not be met by meat imports nor large-scale ranching, but largely by small farmers. These farmers feed their livestock on crop residues and grown forage, as well as on by-products of their food processing (bran, seed cake). In many communities in the region, these crop–livestock systems sustain milk, meat and egg production (FAO 2010).
Food-agroforestry systems
Agroforestry is basically the use of trees and shrubs in agricultural and land management systems. It promotes food security by mitigating and reducing vulnerability and increasing adaptability of agricultural systems to weather and climate variations (FAO 2010).
In food crop systems, particularly in harsh agro-ecologies, shelter trees diminish the effects of extreme weather, prevent erosion and improve rainwater infiltration, halt land degradation, and increase soil organic matter and carbon sequestration. Legume species fix nitrogen and improve soil fertility. It is estimated that agroforestry systems in Africa have increased annual crop yields from 1.3 to 1.6mt per hectare. The trees also provide timber and firewood to farmers.
Agroforestry is similarly important in livestock systems. In arid and semi-arid environments, fodder trees in silvopastoral systems supplement poor quality forages and help improve livestock production. Even in high potential areas, land pressure has forced adoption of agroforestry trees. In Kenya, fodder trees–Calliandra and Leucaena–used in intensive livestock systems (dairy, small ruminants) have increased production and drastically reduced the need for external feeds (Franzel et al. 2003), thus promoting food security.
104 First ASARECA General Assembly, Volume 2

Food-energy systems
In integrated food-energy systems, food and energy crops are grown on the same land and the by-products of food production are used in energy generation. Examples abound in our region.
Home-grown fuel wood and crop residues are used by households in cooking, and the ash, in turn, is used to fertilize the soil. There are various commercial grain driers (for maize, rice, groundnut, soybean and the like) that use fuelwood or crop residues, such as rice husks and maize cobs, and are capable of drying tons of grain each day. These driers greatly reduce post-harvest losses. In DR Congo, legume fallow trees are an important source of charcoal for urban centres (CIRAD 2010). The sugar industry in the region uses cane bagasse as a source of energy and for electricity generation. While livestock manure is used in bio-digesters to produce methane gas for heating, cooking and lighting.
Category 3. Drought-prone, fragile ecosystems technologies
Against the threats of climate change and population pressures, and the food insecurity experienced by populations living in marginal arid and semi-arid areas in our countries, efforts have been made to develop technologies to stabilize and boost food production in these fragile ecosystems. The focus has been on rainwater use, support to livestock production, and holistic approaches to resource use.
Production technologies
Limited rainfall (intensity and duration) in arid areas demands that all available rainwater is put to effective use. Rainwater harvesting is therefore of crucial importance. In crop production, systems such as tie ridging pit planting, water troughs, and stone contour bunds allow water to collect and infiltrate into the fields, thus boosting crop survival and yields (Reij 2009). Drought-resistant crops (sorghum, bullrush millet, cowpea) have been successfully promoted in areas like Karamoja in Uganda. Even for maize, early maturing, extra-early maturing and stress-tolerant varieties (ZM621, STRS, etc.) that grow well during the short rainy seasons, mature with residual soil moisture, and yield enough to meet local food needs have been developed for the very low rainfall areas in the region.
With increasingly dry conditions and shrinking grazing lands, natural grasslands are being overgrazed. Crop
residues are therefore becoming critical in livestock feeding. In some cases, fodder and other agroforestry trees are grown and used to supplement poor quality forages (FAO 2010).
Ecosystems approach
Recognizing the complex ecological ramification of climate change, community challenges of food pro-duction and survival in low rainfall areas are being tackled at landscape or catchment levels, whereby the ecosystem attributes of a given community’s livelihood area are wholly considered and exploited in a bal-anced manner. Decisions on crop production, livestock grazing, water harvesting and so forth are made from a broader perspective (diversity, resilience and sustain-ability) rather than on an individual basis.
Through the catchment-wide approach, water harvesting has been successfully used in Kenya, where target communities have gained access to clean, safe, reliable water supply for both domestic and agricultural use. The communities have consistently improved their standards in health, sanitation and incomes (www.oikoumene.org/DavidMburu_rainwater_harvesting.pdf).
Category 4. Urban and peri-urbanfood production technologies
It is estimated that up to 15% of the world’s food is pro-duced through urban agriculture, and that up to 70% of urban households in developing countries participate in the production of vegetables, fruits, mushrooms, herbs, meat, eggs, milk and fish, from which some families meet around 60% of their vitamin and protein food needs (FAO 2010). Kampala is ranked among the leading cities in urban food production.
Urban agriculture is carried out in small vacant fields, shelters within homesteads, houses, window boxes and on rooftops. Specialized systems are required to maximize production. Ecosan toilet technologies allow the safe processing of human waste to generate manure and water for crop production. To avoid use of large volumes of soil, drip irrigation and hydroponic systems that feed water and nutrients directly to plant roots are used. These techniques enable growing of crops in waste, sand and aggregate-filled bags, drums and so forth. Plants grown thus can also be fertilized using foliar fertilizers. These systems allow intensive production of and ready access to perishable food crops such as tomatoes.
105Proven technologies for feeding the Eastern and Central African region

Opportunities for feeding our people in the 21st century
As outlined above, over the years, scientists have generated new and improved technologies that we can use to completely transform the region’s agriculture. Many of these technologies and innovations have, however, remained largely unutilized while the challenge of technology adoption itself has become a preoccupation and major object of study (ASARECA 2011; Odame et. al. 2001; FAO 2010; Doss 2005).
There is no doubt that we have the capacity–actual and potential–to feed our people in the 21st century. However, to achieve our goal, we need to address the challenges and, at the same time, grasp the opportunities. The most obvious of these opportunities include our natural endowment, international goodwill, and the availability of technologies and innovations that we can use to transform agriculture.
The wealth of our region
It is a fact that, in our region, there are vast tracts of untapped and fertile agricultural land; large fresh water bodies with huge irrigation potential; undeveloped, low input and low technology agricultural systems; and a large labour force. This contrasts greatly with the economically developed world, and China, India and other Southeast Asian countries, which have little free land for farming, yet feed their people (World Bank 2008). Currently, we are largely dependent on the hoe and oxen as the main tillage tools, with tractor use limited to commercial farms and estates. Also, fertilizer use rate in the continent is the lowest in the world; further, only 1% of the land is irrigated in the Horn of Africa and 7% in the rest of the continent as compared to 38% in Asia (World Bank 2008; BBC 2011). The majority of our farmers also continue to grow unimproved low-yield traditional crop varieties though high yield improved ones exist.
The rudimentary nature of our farming systems offers incredible opportunities for adoption and use of simple technologies and still initiate rapid improvement and change in our production and productivity. All kinds of machinery and equipment suited to small-scale agriculture can now be easily accessed, relatively cheaply, from countries like China, India and Brazil, where these technologies have helped them transform their agriculture. Some of these countries, under the South–South partnership, even feel morally obligated to help us transform. Why then have we not tapped into these opportunities?
Just by adopting improved technologies, particularly low-level mechanization, and modest use of fertilizers with improved crop varieties, and effectively utilizing available labour, it is possible to dramatically increase food production and attain surpluses without increasing the acreage under crops. For the full potential to be tapped, first of all it needs to be recognized and then planned for and the necessary investments made.
Renewed world interest in African agriculture
Following the adverse effects of economic liberalization on African agriculture over the last two decades–its negative impact on food security, rural development and the capacity to produce agricultural raw materials and commodities–coupled with the threats of population explosion and climate change, huge international interest has been generated to invest in and transform African agriculture for development and world stability (World Bank 2008; 2009).
In our region, for example, the financial commitment now being made to support agricultural research and development by the World Bank, Danish Agency for International Development (DANIDA), United States Agency for International Development (USAID), UK’s Department for International Development (DIFID) and others reflect the world’s readiness to assist us transform our agriculture. With well articulated policies and programmes for agricultural transformation, and clearly demonstrated political will to do so, our region can easily tap into this huge international concern and goodwill and obtain substantial funding for agricultural development and sustainable food production. The question is: Do we recognize this potential? Are we prepared to make the commitments required to tap into it?
New commitment of governments to agricultural growth and transformation
During the pre-independence and early post-independence periods, governments in all ASARECA countries showed strong commitment to agriculture, with budgetary allocation to the sector exceeding 10–15% annually. Consequently, there was rapid progress in agricultural growth and transformation and all our countries were food secure. Unfortunately, over the last two decades, food production has suffered the greatest neglect as our governments cut budgetary allocation to agriculture (World Bank 2009), and rather focused on export crops, such as flowers, tobacco, cotton, tea and coffee, which earn them the much needed foreign exchange and are lead by the private sector.
106 First ASARECA General Assembly, Volume 2

Except for the Malawian Government’s recent support for maize production (by supplying affordable fertilizers and improved seeds), which wiped out the country’s food shortage, the African governments continue to neglect food agriculture, and our countries have not met the Maputo Protocol target of increasing agricultural funding to at least 10% of national budgets. Given this scenario, our governments now have the opportunity to recommit themselves in words, resources and deed, to supporting agricultural growth and transformation.
The challenge for our governments is to realize that, with the majority of our people engaged in and dependent on agriculture, livelihood changes will not occur in the region unless agricultural transformation takes centre stage in national development goals. It is a known fact that transforming smallholder systems is not only important for food security but also for poverty reduction, as well as for aggregate growth and sectoral change (World Bank 2008; FAO 2010). When that commitment is made, a key vehicle for transformation will be the large-scale adoption of agricultural technologies and innovations (Ngongi 2011). Agricultural transformation will then spur further technology development and innovation to address emerging challenges, with huge benefits to the economy. This is the path that emerging economies of Southeast Asia (India, Malaysia, Thailand and so forth) and Latin America (Brazil) took to transform their economies.
In the 1960s, for example, India suffered frequent food shortages, yet the country had set its sights on industrialization and modernization. To realise its objectives, the government formulated and diligently implemented a radical agricultural transformation policy and programme. It set itself the goal of banishing food shortage and hunger from the subcontinent and developing agricultural systems that would effectively support an agrarian population in a modernized India.
To achieve its goal, the government: (i) undertook agrarian reforms, limiting land holdings and taxing unused land; (ii) invested in and supported research and technology development and adoption; (iii) revamped the agricultural extension system and undertook intensive training of farmers in modern farming; (iv) established agricultural banks to provide affordable credit to farmers; (v) provided some subsidies (for example, diesel); (vi) supported the development of effective input supply and produce marketing chains with stable prices that allowed farmers to plan and invest long-term; and (vi) established policies and implemented programmes to promote and protect
the interests of Indian farmers, including use of cheap DDT when the pesticide had virtually been banned world-wide. With lower level interventions within the states and communities, India was able to turn its agriculture around, to become food self-sufficient, and to produce various agricultural raw materials (cotton, sugar and the like) for its industries. The gains from agriculture enabled India to industrialize without grossly upsetting the social balance. When will we see a similar commitment in our region?
Future directions and recommendations
Considering the goal set out in the theme of this Assem-bly, and the issues discussed in this paper, I see various action agendas that we should critically consider as possible ways forward for our region.
To begin with, there is an urgent need for our governments, individually and collectively as a region, to agree to and embrace agricultural transformation as the key to development; then they need to take full responsibility for and lead that transformation, following the examples of countries like India, Malaysia and Brazil. As informed citizens, we must collectively: (i) demand that our governments place agricultural development and transformation at the top of their governance agenda, and push them to formulate long-term visions and goals that capture this prioritization; (ii) push them to formulate, fund and lead national and regional agricultural transformation programmes, with clearly defined objectives, action plans, verifiable outputs, and effective institutional, legislative, regulatory instruments and other functional strategies for their attainment; and (iii) focus, as a necessary precondition for success, on the key players in agricultural transformation–state actors, farmers, researchers, and input producers and suppliers–with a view to entrenching their roles to lead the change and building bodies of informed and effective participants.
Further, we must focus on the transformation of our farmers, and particularly smallholder farmers who are the key players in agricultural progress. In this regard, we need to: (i) formulate and effectively implement programmes to promote rapid adoption and use of improved agricultural technologies; (ii) avail resources (credit) and conditions (market access, warehousing, crop insurance) to enable farmers to farm, grow and transform; (iii) provide necessary training (certified farmers) and effective extension services, and ensure easy access to information (for example, crop production
107Proven technologies for feeding the Eastern and Central African region

and input use guides, weather and market information); and (iv) encourage, recognize and reward successes.
Lastly, we must place technology generation and adoption at the centre of our transformation efforts, and recognize the great role researchers have played in agricultural transformation. We must, in particular, encourage researchers and policy makers to appreciate the nature of our smallholder farmers that we all seek to transform. While it will be necessary to generate and use transitional technologies to move them out of subsistence and traditional entrenchment, the ultimate goal must remain the building, in the shortest time possible, of scientific and highly competitive farming systems that will ensure food security and will sustain farming communities as our countries develop, industrialize and modernize.
The huge agricultural potential in our region, availability of needed technologies, and the various successes we have scored over the years gives us confidence that we have the capacity to transform our agriculture and to adequately feed our people in the 21st century and beyond. All we need is to end the rhetoric, fully commit to agriculture as a foundation for development, and to act resolutely.
Acknowledgement. Dr Charles Mugoya, Dr Lydia Kimenye and Mr Clet Wandui Masiga, ASARECA helped in sourcing some of the literature used in the preparation of this paper and redirecting its contents.
References
[ASARECA] Association for Strengthening Agricultural Research in Eastern and Central Africa. 2011. Concept note for stakeholder workshop on findings of the study on the poor adoption of proven agricultural technologies and innovations in eastern and central Africa (ECA). ASARECA Secretariat. Entebbe, Uganda.
BBC Focus on Africa, October 2011.
[CIRAD] Centre de coopération internationale en recherche agronomique pour le développement. 2010. Sustainable charcoal production in the Democratic Republic of the Congo. CIRAD.
Doss CR. 2005. Analysing technology adoption using micro-studies: limitations, challenges, and opportunities for improvement. Agricultural Economics 34:207–219.
[FAO] Food and Agriculture Organization of the United Nations. 2010. “Climate-smart” agriculture: Policies,
practices and financing for food security, adaptation and mitigation. FAO, Rome.
Franzel S, Wambugu C, Tuwei P. 2003. The adoption and dissemination of fodder shrubs in Central Kenya. Agricultural Research and Network Series Paper No. 131. Overseas Dev. Institute, London.
Guigale M. 2011. Food inflation: Causes, impacts and policies. World Bank, Washington, DC.
[IFPRI] International Food Policy Research Institute. 2011. Increasing agricultural productivity and enhancing food security in Africa: New challenges and opportunities. Concept Note for an International Conference. IFPRI, June 2011.
Ivens GW. 1967. East African weeds and their Control. Oxford University Press, East Africa.
Juma C. 2011. Preventing hunger: Biotechnology is key. Nature 479:471.
Kimenye L and Bombom A. 2009. Best-bet research outputs for enhancing agricultural productivity in eastern and central Africa. ASARECA-TUUSI Project.
Namanga N. 2011. Delivering African agricultural productivity and food security through a Green Revolution: Prospects and challenges. AGRA Paper delivered at the International Conference on Increasing Agricultural Productivity and Enhancing Food Security in Africa: New Challenges and Opportunities. IPFRI, Addis Ababa, 1–3 November 2011.
Odame H, Kabutha C, Alemu D. 2011. Why low adoption of agricultural technology in eastern and central Africa? Final Report to ASARECA. 12th September 2011.
Reij C, Tappan G, Smale M. 2009. Agro-environmental transformation in the Sahel: Another kind of “Green Revolution”. IFPRI Discussion Paper. International Food Policy Res. Institute, Washington, DC.
Sileshi G, Akinnifesi FK, Ajayi OC, Place F. 2008. Meta-analysis of maize yield response to woody and herbaceous legumes in the sub-Saharan Africa. Plant and Soil 307:1–19.
Silici L. 2011. Conservation agriculture and sustainable crop intensification. Integrated Crop Management. Vol. 10. Plant Production and protection Division, FAO, Rome.
World Bank. 2008. World Development Report 2008, Agriculture for development. The World Bank, Washington, DC.
World Bank. 2009. World Development Report 2010, Development and climate change. The World Bank, Washington, DC.
108 First ASARECA General Assembly, Volume 2

Sub-theme II
National and regional institutions perspectives

Executive summary
Nearly one billion people globally suffer from chronic food insecurity. The growing world population and climate change have affected farming practices, while the global demand for food is expected to increase dramatically. Engaging the research, extension and advisory services and scientific community is critical to developing new and innovative agricultural approaches required to meet this demand.
Empowerment of farmers and producer groups encompasses various key elements such as: access to productive assets, strengthening capacity in development, establishing effective and efficient institutional structures, genuine participation in development, and building a democratic decision-making process. Empowerment has many different dimensions, including political, economic and institutional, and all these aspects play an important role in food security and poverty campaigns.
The biggest challenge is to transform our agricultural exten-sion services from the old stereotype of connecting researchers and farmers to one that is innovative and dynamic, and works with farmers, researchers and the business community. As a policy maker, educating people and sensitizing them to understand the farming sector is important to avoid failed policies.
The private sector is one of the key actors in extension and advisory services delivery and achieving food security in the Association for Strengthening Agricultural Research in Eastern and Central Africa (ASARECA) sub-region. In many cases, this implies delivery of Agricultural Advisory Services (AAS) through social enterprises funded through public-private partnerships. Such partnerships lead to sector-wide growth that has direct and indirect benefits for the poor. The service centred around pro-poor growth should, therefore, not exclude the commercial sector, which benefits agriculture through increased investment, access to international and local markets, increased competitiveness and an improved policy environment. Also, reduced poverty creates increased
opportunities and markets for entrepreneurs, processors and producers.
The African Forum for Agricultural Advisory Services’ (AFAAS) objective is to create efficient, effective and syn-ergistic linkages and partnerships between AAS of member countries to improve the delivery of advisory services to farmers. It operates within the framework of Pillar IV of the Comprehensive African Agriculture Development Pro-gramme (CAADP), which seeks to enhance the livelihoods of African farmers and pastoralists and is spearheaded by the Forum for Agricultural Research in Africa (FARA). Within this framework, AFAAS ensures that, through effective AAS, CAADP Pillar IV directly addresses the needs of African farmers, contributing to sustained growth and transforma-tion of African agriculture.
The key reforms to date include: decentralizing administration of field extension services; improving linkages among farmers, educators, researchers, extension agents and other stakeholders; and increasing the independence and flexibility of extension services by creating small and semi-autonomous units within government ministries. Though each country has approached reform in a manner relevant to its own concerns, all have a common need and obligation to improve accountability to clients, put in place a demand- and market-driven service provision system, ensure decentralization of service delivery and to promote increased participation of the private sector in the provision of agricultural extension services. The experiences of different countries have created a wealth of knowledge and innovations.
Agricultural extension and services are a vital element of the array of market and non-market entities and agents, who provide critical information that can improve the livelihoods of farmers and other rural people. Apart from their conventional function of providing knowledge for improved agricultural productivity, extension and advisory services are expected to fulfil a variety of new functions, such as linking smallholder farmers to high-value and export markets, promoting environmentally sustainable production techniques, and
8. Role of extension, the Regional Extension Association, and their strategic partners in feeding the region in the 21stcentury
Author: Silim M. Nahdy1
Co-authors: Max Olupot2, Kristin Davis3 and Eliot Zwane4
1 & 2African Forum for Agricultural Advisory Services3Global Forum for Rural Advisory Services
4Agricultural Extension Services, South Africa
110 First ASARECA General Assembly, Volume 2

helping farming communities cope with the effects of HIV/AIDS and other health challenges that affect agriculture.
Introduction
Nearly one billion people globally suffer from chronic food insecurity. The growing world population and climate change have affected farming practices, and the global demand for food is expected to increase dramatically. Engaging the research, Agricultural Advisory Services (AAS) and scientific community is critical to developing new and innovative agricultural approaches to meet this demand (Borlaug 2011). Given the food price volatility, rising demand for grains and meat products, more frequent weather-related disasters, and constrained resources, sustainably intensifying yield outputs in small-scale farms becomes more critical to food security and poverty reduction in Africa (World Bank 2011).
There is a fresh and firm resolve worldwide to fight the menaces of hunger and rural poverty. It is worth noting that extension workers, whether they belong to government departments, non-governmental organizations (NGOs), private institutions or farmers’ associations, could constitute a formidable force in this fight. Extension in sub-Saharan Africa (SSA) and, in particular, in the Association for Strengthen-ing Agricultural Research in East and Central Africa (ASARECA) countries, has a new role to play and needs the serious attention of policy-makers and development partners for its meaningful reform and modernization in addressing the challenges of the 21st century (FAO 2005).
“Most African countries cannot significantly reduce poverty, increase per capita incomes, and transform into modern economies without focusing on agricultural development.”
- (Diao et al. 2006)
Agricultural extension and advisory services are taking on a new dimension because of the global movement for reforming the national extension systems in developing countries, which was initiated late in the 20th century. New learning needs of farming communities are emerging as the region enters into an era of globalization, democracy, privatization and decentralization, affecting the farmers of both developed and developing countries – albeit in different ways (AFAAS 2011).
Demand-led extension and advisory services is a rela-tively recent label for a notion that has been around since people began to write about extension as an academic
discipline and educational practice (Scarborough et al. 1997). Demand-led advisory services capture the idea that the information, advice and other services offered by extension professionals should be tailored to the expressed demands and felt-needs of the clients or recipients of the service not just to their “needs” as identified by various stakeholders (government, corporations, scientists, and extension professionals). In reality, agricultural extension and advisory services should be responsive and relevant to the demands of the users.
Various authors have explained the concept of empow-erment (Freiro 1972, Oakly 1991, and Basin1992). When talking of empowerment of farmers or producer groups, it encompasses various key elements such as: access to productive assets, strengthening capacity in develop-ment, establishing effective and efficient institutional structures, genuine participation in development, and democratic decision-making processes (Monaheng 2000). Generally, empowerment has different aspects, which include the political, economic and institutional.
Different approaches to empowerment may not nec-essarily refer to entirely new approaches, but rather reorganizing and putting into practice already exist-ing initiatives such as ensuring that farmer groups determine their own trajectories, which could include adopting new technology, for example, using 3G mobiles, or building their capability to access various types of information to increase production. In areas that lack communication facilities, other strategies could be used, for example, local resources in effecting farmer-to-farmer communication, including radios and tape recorders to transmit messages to farmers. The evidence of empowered producer groups should be measured. Some of the outputs or evidence should include the following: efficient farm production and farm management, food-secure households, effi-cient marketing, distribution and utilization of farm produce, and sustainable use of natural resources in the farming sector. The additional indicators are developed leadership that respects democratic principles and ownership of decisions taken (Zwane 2011, personal communication).
Innovative extension and advisory service as a system for achieving food security through technology transfer to increase incomes, is classified as an accelerator for rural and agricultural development. Following Mosher’s classification in 1966, which talks about accelerators and essentials for agricultural development, we can enlarge the list and formulate elements favouring rural development. The essentials must be in place; if any
111Role of extension, the Regional Extension Association, and their strategic partners in feeding the region in the 21stcentury

are missing or inadequate, the whole development process will be hampered. Accelerators are additional factors that aid and enhance the development process to anticipate and avoid problems or to minimize the negative effects of development on certain categories of actors in rural development. (Hoffmann 2011)
Building value chain markets to improve rural livelihoods is a pivotal role of extension and advisory services. They facilitate the development of business management skills among smallholder farmers and other local entrepreneurs to participate in markets. Extension and advisory services facilitate linkages among market actors (including financial and non-financial inputs, processing, trading and so forth), including brokering collaborations and promoting social learning among them. It links smallholder farmers, rural entrepreneurs, and other members of the agricultural community with institutions offering training and education in fields relevant to the agricultural sector.
Institutional development processes and social, institu-tional and organizational innovations remain crucial for linkages between farmers, their organizations and the public sector. Extension and advisory services bridge the gap in developing informal and formal farmer orga-nizations, and rural youth organizations, and helping them articulate their demands. They help implement government policies and programmes through infor-mation, awareness and advice on technological options, including land stewardship, food safety and animal welfare.
Synthesis of the current situation
The root cause of food insecurity in developing countries is the inability of people to gain access to food due to poverty. While the rest of the world has made significant progress towards poverty alleviation, Africa, in particular SSA, continues to lag behind. Projections show that the situation will be exacerbated unless preventive measures are taken. Many factors have contributed to this backwardness including: low national investment in agricultural development, high prevalence of HIV/AIDS, civil wars, poor governance, frequent drought and famine, and agricultural dependency on the climate and rain fed systems. (Mwaniki 2004).
In the 1996 Rome Declaration on World Food Security, food security is defined as: “Food that is available at all times, to which all persons have means of access (and) that is nutritionally adequate in terms of quantity, quality and variety,
and is acceptable within the given culture.” (FAO1996)
Over 70% of the food insecure population in Africa lives in the rural areas. Ironically, smallholder farmers, who produce over 90% of the continent’s food supply, make up 50% of this population. The rest of the food insecure population consists of the landless poor in rural areas (30%) and the urban poor. Throughout the developing world, agriculture accounts for around 9% of the GDP and employs more than half the total labour force (Work Bank 2010).
In countries where more than 34% of the population is undernourished, agriculture represents 30% of GDP and nearly 70% of the population relies on agriculture for their livelihood. This fact has often been used to support the argument that developing countries should move away from agriculture and invest in technology. Over 70% of the poor live in rural areas, where also the largest proportion of the food insecure live. We cannot significantly and sustainably reduce food insecurity without transforming the living conditions in these areas. The key lies in increasing the agricultural profitability of smallholder farmers and creating rural off-farm employment opportunities (Mwaniki 2004).
Extensive empirical evidence demonstrates that agricultural research and development (R&D) invest-ments have greatly contributed to economic growth, agricultural development, and poverty reduction in developing regions over the past five decades (World Bank 2007). Effectively disseminated new technologies and crop varieties resulting from R&D investments have enhanced the quantity and quality of agricultural produce, and at the same time increased sustainability, reduced consumer food prices, provided rural produc-ers with access to markets, and improved gender-based allocations and accumulations of physical and human capital within households. Given important chal-lenges, such as rapid population growth, adaptation to climate change, increasing weather variability, water scarcity, and the volatility of prices in global markets, policymakers are increasingly recognizing the need to invest more in agricultural R&D to increase agricultural productivity in SSA (IFPRI 2011).
Additionally, women are the backbone of the rural economy in much of SSA. FAO found, in a survey of nine African countries in 1996, that women's contribution to the production of food crops ranges from 30% in Sudan to 80% in the Republic of Congo, with estimates for other countries tending towards the higher end of the scale. They are responsible for 70% of food production,
112 First ASARECA General Assembly, Volume 2

50% of domestic food storage, 100% of food processing, 50% of animal husbandry and 60% of agricultural marketing. Women rarely own land and, when they do, their holdings tend to be smaller and less fertile than those of men (TakyiwaaManuh 1998).
The need for extension services
The decline in per capita food production in Africa indi-cates a pressing need to invigorate agricultural research and dissemination. This requires addressing key issues of capacity strengthening, sustainable financing, demand-led, participatory approaches, accountability and building a critical mass (Jones 2004). In the light of these challenges, Africa’s leaders have provided a framework for development through the New Partner-ship for Africa’s Development (NEPAD). NEPAD aims to increase annual agricultural output by 6% for the next 20 years. The Comprehensive Africa Agricultural Development Programme (CAADP) is the NEPAD programme for agriculture.
The programme has identified four pillars, which together will promote interventions that can address the widely recognized crisis situation of agricultural development in Africa. The four pillars are: extending the area under sustainable land management and reliable water control systems; improving rural infrastructure and trade-related capacities for improved market access; increasing food supply and reducing hunger; and agricultural research and technology dissemination. Together these pillars comprise critical components in Africa’s agricultural development agenda, especially for aspects of agricultural service delivery and/or extension approaches that have been severely affected by national and regional policy shifts.
Definition of extension and advisory services
According to Christoplos (2010), agricultural extension and advisory services can be defined as systems that facilitate the access of farmers, their organizations and other market actors to knowledge, information and technologies; facilitate their interaction with partners in research, education, agri-business, and other relevant institutions; and assist them to develop their own technical, organizational and management skills and practices.
Extension services also disseminate research-based knowledge to rural and farming communities, which includes information about technologies, new research, markets, input and financial services, and climate and weather. It facilitates the learning process and offers
advice to individual farmers, groups of farmers, farmer organizations, cooperatives and other agribusinesses along the market chain. In the 21st century, the scope of extension services has gone beyond technology transfer to facilitation and beyond training to learning, and assisting formation of farmer groups, helping them deal with marketing issues and partner with a broad range of service providers and other agencies (Davis, 2008).
Extension approaches and policy shifts
Training and Visit Approach
Over the last three decades, the world has witnessed rapid changes in the global policy environment, which have ranged from protectionist planned economic systems to liberalized and externally driven market-led economic systems. Many countries in SSA experienced sweeping economic crises in the late 1980s and 1990s and, as a result, a number of them were forced to undertake economic policy reforms, largely supported by the World Bank and IMF. Agricultural development in Africa has suffered from a lack of consistency in policy, and more so particularly with regards to agricultural extension. Until the late 1980s (and for some countries including Uganda, Rwanda, Kenya until the late 1990s), the most common method of disseminating technologies and results was the ‘Training and Visit’ (T&V) Approach, which proved costly and top down.
Characterized by a top-down, single-line of command management structure, this approach initially improved resource mobilization and manpower intensity and introduced a number of organizational changes. However, in addition to the high costs associated with the T&V approach, it also had other shortcomings such as the inability to monitor the quality of extension services, largely due to the lack of mechanisms to ensure accountability to farmers. These shortcomings, coupled with declining resources being allocated to national agricultural extension systems, led to the conclusion that this expensive and relatively non-flexible approach needed to be re-thought. In most cases, the approach was dropped and other forms of advisory service delivery mechanisms were designed and piloted.
Shortcomings of the modified approaches
Unfortunately, what remained characteristic of the new systems was that, although they contributed to increasing the production of some commodities, they failed to yield a sustainable transformation of
113Role of extension, the Regional Extension Association, and their strategic partners in feeding the region in the 21stcentury

agriculture to address rural poverty. Evaluation of the agricultural extension projects also showed that the unified agricultural extension and the modified T&V approaches were not focused and resulted in minimal adoption of technologies by end-users. Both approaches were based on public funding and public delivery that proved inefficient and unsustainable.
Demand-driven approaches
Subsequently, a number of new extension approaches emerged, all attempting to respond to the gaps that could not be resolved by the earlier approaches. In general, these models departed from the traditional public service models and, in most countries, the focus shifted from the largely supply-driven approaches (with the government as the sole provider of advice) to much more flexible, pluralistic demand-driven systems (Davis 2008; Davis et al.2009). The new models reflect attempts to overcome some of the inherent weaknesses of the traditional public extension systems.
Since the traditional extension systems were confronted by a number of challenges, reforms in delivering advisory services have mainly focused on relevance, efficiency and cost-effectiveness. Further, when it comes to application, several aspects such as delivery approaches, funding mechanisms, sustainability, appropriateness, linkages, partnerships have been taken into consideration, all the while putting knowl-edge management upfront.
Key reforms in provision of extension services
Literature shows the key reforms in SSA to date as: decentralizing administration of field extension ser-vices; improving linkages among farmers, educators, researchers, extension agents and other stakeholders; and increasing the independence and flexibility of extension services by creating small and semi-auton-omous units within government ministries. Though each country has approached the reforms in a unique manner relevant to its own concerns, all have a common need and obligation to improve accountability to clients, establish a demand- and market-driven service provision system, decentralize service delivery and promote increased participation of the private sector in the provision of agricultural extension services. This has created a wealth of knowledge and innovations in different countries.
An analysis of various studies on extension and advisory services systems revealed four lessons for the future:i. There is no single extension model that can fit all
needs.ii. Extension is a tool for rural development and
its linkages with other services and information sources are important.
iii. Learning must span national and regional borders, and should highlight issues of capacity development and quality assurance.
iv. In the light of past failures, particularly those related to financial sustainability, there is need to build cost-recovery mechanisms into pluralistic demand-driven agricultural advisory service delivery (AFAAS 2008).
African Forum for Agricultural Advisory Services
An agricultural extension platform provides practi-tioners an environment and forum for professional growth through life-long learning. The current level of knowledge explosion makes it necessary for the exten-sion worker to ‘keep running in order to stand still’ so to speak – otherwise s/he becomes out of date, irrelevant and ineffective (Mutimba 2010).
The African Forum for Agricultural Advisory Services (AFAAS) is the umbrella organization for AAS in Africa. Its objective is to create efficient, effective and synergistic linkages and partnerships between AAS of member countries to improve the delivery of these services to farmers. It operates within the framework of Pillar IV of the Comprehensive African Agriculture Development Programme (CAADP), which seeks to enhance the livelihoods of African farmers and pastoralists and is spearheaded by the Forum for Agricultural Research in Africa (FARA). Within this framework, AFAAS ensures that, through effective AAS, CAADP Pillar IV directly addresses the needs of African farmers, contributing to sustained growth and transformation of African agriculture.
AFAAS more specifically aims to: 1. Ensure that CAADP Pillar IV implementing
institutions sufficiently involve advisory services providers in their strategies, work plans and implementation, contributing to making these services more effective and relevant.
2. Ensure the availability and accessibility of appropriate and up-to-date knowledge on
114 First ASARECA General Assembly, Volume 2

advisory services from a range of sources in Africa and worldwide.
3. Strengthen the capacity of country-level advisory service stakeholders in determining their own priorities and in improving their advisory service systems.
4. Build partnerships at national, regional and international levels between agricultural advisory service and other institutions.
5. Build a continental African organization that can sustainably support national AAS to continuously enhance their contribution to national, regional, continental and global development.
AFAAS at the continental level is linked to the Global Forum for Rural Advisory Services (GFRAS). GFRAS has three main functions:1. Providing a voice for advisory services within
global policy dialogues and promoting improved investment in RAS.
2. Supporting the development and synthesis of evidence-based approaches and policies for improving the effectiveness of RAS.
3. Strengthening actors and fora in RAS through facilitating interaction and networking.
Challenges in agricultural extension and advisory services
Extension as a service is difficult to measure, and usually proxies are used (Birkhaeuser et al. 1991). Some of the key challenges include:• Limited resources to meet enormous demands for
services by farmer organizations.• Lead farmer concept is faced with some challenges
of demands for compensation vs. volunteerism. This is mainly due to a lack of harmonization of extension approaches—some pay lead farmers while others do not.
• Use of electronic and print media is expensive – the costs charged to programmes are exorbitant.
• HIV/AIDS undermines sustainability.• Limited capacity of villages structures and some
lead farmers to handle technical issues.• Governance challenges undermines progress in
development of farmer organizations.• Lack of coordination by extension players on the
ground exerts pressure on the extension agents as there are competing demands on their time.
• Trained extension workers unwilling to stay in rural areas.
• Number of extension workers trained insufficient to match the demand on the ground, leading to imbalanced staff–farmer ratio.
• The biggest challenge is the transformation of agricultural extension services from the old stereotype of connecting researchers and farmers to being innovative, discussing and working with farmers, researchers and the business community. As a policy maker, educating people and sensitizing them to understand the farming sector is important to avoid inaccurate and inappropriate policies.
While the continuing need for AAS has been well established (Anderson 1999), the challenge is to devise systems for providing and financing these services in a cost-effective and sustainable way that fits country-specific conditions (Leeuwis 2004). So far, the impact of extension on farm performance has been rather mixed. The literature overview below indicates very high rates of return on extension investment; there are also cases of negligible achievements, implying a misallocation of public resources. Clearly, the format by which extension services are rendered, as well as the circumstances in which recipients of extension services operate, will affect the extent of the impact.
As a result of the changes to the world stage, extension providers face a number of challenges in adequately responding and in achieving their objectives. AAS providers have had to adopt new roles and responsibilities coupled with new requirements for capacity strengthening. However, extension delivery systems still face difficulties inherent in the extension mandate. These include, but are not limited to, the magnitude of the task, dependence on policy and other agency functions, difficulty in attributing impact, fiscal sustainability, and linkages and interaction with research. The new challenge for extension remains how to develop and implement strategies and approaches for optimum involvement of the eventual users of the technology in the entire process, commencing with the identification of the field problem to the actual generation of the possible solution (Sadighi and Mohammadzadeh 2002).
One of the positive developments, however, is that it is now clear that policy and funding support for agricultural extension on the development agenda has been resurrected (Eicher 2007). The strengthening of AAS delivery is back on the forefront of the agendas of both national governments in SSA as well as
115Role of extension, the Regional Extension Association, and their strategic partners in feeding the region in the 21stcentury

developmental agencies such as the World Bank, DFID and FAO. The World Bank spent over US$3 billion in direct support for extension and has mobilized over US$2.5 billion from other sources since 1981 (Alex 2002).
Various components have been identified as preconditions for making AAS work, in other words, how the services can be made more pro-poor (Neuchatel 2003). These revolve around improving accountability by empowering clients (especially farmers, to monitor and control service providers) and strengthening incentives for services providers to serve the poor. There has been a change in how extension relates to other institutions and disciplines such as producers, educational institutions, research services, and the private sector, including input suppliers. Various models for both financing and delivery of extension are being piloted in various countries, but broadly all include a component of public financing and private delivery of AAS (Neuchatel 2007).
In many of the region’s countries, salary and retirement packages and conditions of service are poor. In addition, many agencies have outdated infrastructure and insufficient operating budgets to conduct research. Even with the increase in training opportunities in a number of countries, research agencies have difficulty retaining staff once they attain higher degrees and attract offers of better remuneration and working conditions either in higher education or private sectors or abroad (FARA 2006; World Bank 2007).
Additional challenges
All the efforts will hardly have a tangible long-term impact on poverty and food insecurity if the central issue of the very survival and the preservation of the human capital is not addressed. In this regard, the HIV/AIDS pandemic probably constitutes the greatest threat to food security and poverty alleviation in Africa. Overcoming HIV/AIDS is today a survival issue for tens of millions of people in the continent. It is both a crisis and a chronic condition in Africa. It is a crisis because of the speed of the spread of the epidemic and its aggravation of other stresses and shocks. It is also a chronic condition because its impacts most heavily on the most productive sectors of the African economies, namely prime-aged adults.
One of the emerging challenges is land grabbing. National and international investors are increasingly buying up or leasing extensive areas of public land under long-term contracts that frequently include rights to water use. Small-scale farmers are being forced out
of their own lands. In addition, competition for access to natural resources is intensifying under conditions of growing demographic pressure and failed development policies. Conflicts over water, land and grazing rights are increasing and absorbing more and more time, energy and frequently also financial resources, which are consequently not available to farms or households for agricultural activities. Conflicts are increasingly impeding extension activities (Ernst et al. 2011).
Opportunities
Global poverty and food security challenges have been formulated in the Millennium Development Goal 1. Particularly in SSA, rural poverty and urban food insecurity remain persistent. However, agricultural development can provide an important contribution to both income generation and food security enhancement. Investment in agricultural development has been found to be very effective in addressing these challenges (WDR 2008).
The types of interventions by governments and external supporters, including the World Bank, have changed considerably over time. The changes in interventions are reflected in the different frameworks that have guided thinking and practice regarding agricultural technology development and dissemination (Rivera et al. 2006). The linear approach has been replaced in most countries by a more systemic perspective, which emphasizes on the feedback linkages between agricultural research, agricultural extension, agricultural education and the farmers.
More recently, an “Agricultural Innovation Systems” framework has been articulated (World Bank 2007). This framework emphasizes focusing more broadly on the factors that stimulate innovative behaviour and stresses linkages and partnerships with a wide range of actors along agricultural value chains, including the agribusiness sector. The innovation systems perspective also stresses the role of a country’s communication infrastructure. While modern information and communication technologies hold considerable promise in promoting agricultural innovation, rural areas usually lag behind urban areas in their access to these technologies, and developing countries generally lag behind more developed countries in this regard. Extension and advisory services bridge the rural and urban gap.
Advisory services are critical for small-scale farmers, and have shown positive impacts in spite of under-resourcing and limited attention by policymakers and
116 First ASARECA General Assembly, Volume 2

donors. Strengthening of AAS requires institutional mechanisms that directly advocate and draw attention to the perspectives, needs and experience of AAS at the national, regional and continental levels. AFAAS and its partners facilitate the emergence of national level platforms for setting and driving national AAS agendas and determining issues that need to be addressed at the regional and continental levels (AFAAS 2011).
The delivery of advisory services has become pluralistic in nature. The spread of privatization has shifted many sectors of public services from the government to private companies. Many developing countries are already practising pluralism in extension and advisory services. Many NGOs, private companies and semi-autonomous bodies are engaged in delivering extension advice to farmers. The main challenge in installing an efficient pluralistic agricultural extension mechanism is the effective coordination among various agencies, the absence of which could lead to conflicting technical recommendations and creating confusion among the farmers. The governments should take the responsibility for coordination, technical supervision and quality control.
The public sector’s role in commercializing research outputs is often achieved through partnerships with the private sector. In a few of the region’s countries, private investment in agricultural R&D is increasing and creating an income stream for agricultural research agencies (Echeverría and Beintema 2009).
As regards decentralization, over the past two decades many countries have undertaken to decentralize government functions and transfer authority and responsibilities from central to intermediate and local governments, and often to communities and the private sector, this indeed is in line with the subsidiarity principle. Though decentralization is potentially important to agricultural knowledge and information systems, it is not an end in itself. Successful decentralization strategies must address three challenges: establishing a national framework for decentralization; developing subsector approaches; and enhancing capacities of various participants for coproduction of decentralized goods and services.
The subsidiarity principle has been reflected in giving farmers responsibility and control over resources for agricultural research, extension and training activities at the lowest appropriate level of aggregation. This is engrained in most government policies for agricultural development. However, many of the actors, especially farmers, who are not well positioned to articulate their
needs, later on make a demand for AAS. The processes of demand articulation and procurement of AAS require some documentation and negotiations, which many farmers may not fully comprehend. The frontline extension workers have played a big role in helping out the farmers and it is hoped that, with time, the farmers will be able to take control of the advisory services management.
There have been good initiatives in integration of strategic monitoring, self-evaluation and knowledge management together with stakeholders as the central elements of the process management and on-going improvement of performance. Extension and advisory services facilitate both service providers and famers to develop a clear understanding of the impact and outcomes of extension. This has facilitated the tracking of lessons for best fits in approaches, which is core for scaling up and out for improved productivity and production.
Future directions and recommendations
Promotion of demand-driven agricultural extension and advisory services is a fundamental mechanism for ensuring that farmers, government agents, the private sector and Civil Society Organizations (CSOs) play a central role in agricultural innovations system. Agricultural extension programmes based on the needs and demands of food-deficit producers and rural communities need to be strengthened through a wider multiplicity of institutional interventions than just public sector extension. If the poor are to benefit from AAS, reforms must promote local programmes within the framework of a national integrated food security strategy that helps the poor enter society's mainstream. This is not only a moral and social obligation but also in the economic self-interest of SSA countries.
The need to focus on women farmers' productivity and production shall be an effective trigger for social change. It has become increasingly clear in SSA that women have a significant role in farming and post-harvest activities in most countries in this region. Nevertheless, a complex set of rights and obligations reflecting social and religious norms prevail within rural communities; these dictate the division of labour between men and women and constrain women farmers. An understanding of the woman farmer’s role, its importance and these constraints is a prerequisite to devising policies to improve productivity, food security and socio-economic development (AFAAS 2011).
117Role of extension, the Regional Extension Association, and their strategic partners in feeding the region in the 21stcentury

A multi sectoral extension network offers an inclusive approach to rural development and brings together agricultural extension providers, promotes commu-nication for rural development, and establishes rural extension activities for non-agricultural populations in rural areas as well as an agricultural extension or communication strategy. In all cases where nationally integrated food security systems are being advanced, multiple sectors are encouraged to work collaboratively to combat food insecurity and generate income for both farming and non-agricultural populations.
The private sector involvement is one of the key elements to success in extension and advisory services delivery. However the promotion of private sector involvement in AAS must be pursued in ways that are socially responsible. In many cases, this may mean the delivery of services through social enterprises funded through public–private partnerships. Such partnerships would lead sector-wide growth that has direct and indirect benefits for the poor. Indirect benefits for the poor come as a result of the private sector and commercial interests benefiting directly, and the benefits are passed on to the poor through, inter alia: increased employment opportunities, lower consumer prices, greater availability and variety of consumable goods, and improved internal and external input and output markets.
The extension and advisory services centred around pro-poor growth should, therefore, not exclude the commercial sector, which benefits agriculture through increased investment (both local and overseas), through gaining access to international and local markets, and through increased competitiveness and an improved policy environment. On the other hand, reduced poverty creates increased opportunities and markets for entrepreneurs, processors and producers.
The success of Market-Oriented Agricultural Advisory Services (MOAAS) interventions depend on the level of infrastructure and basic service provision. These include good quality roads, reliable electricity and water supply, water for irrigation, land ownership, access to loans and inputs, reliable communication services, legal enforcement of contracts, and enabling policies. The case studies suggest that private sector initiatives are successful, sustainable and can achieve a considerable scale (AFAAS 2011). MOAAS provision can be considered as a ‘paradigm shift’, it needs a completely different way of thinking for interventions should be directed at all levels along the value chain.
The driving force for decentralization is the rationale that development decisions can be best made by district or municipal technical and administrative officials, since they are stationed close to the farming population. Decentralization of extension services requires a policy backed by political commitment, which regulates the transfer of authority and financial resources, determines local responsibilities, and establishes the mechanisms for public participation and social monitoring.
Governments have found, in recent years, that they are less able to continue providing all the services previously offered. With costs rising, limited resources, and changes in the prevailing philosophy regarding the appropriate extent of government intervention, governments have been slow to increase provisions for many publicly funded activities. This has led to new forms of institutional arrangements for extension financing and delivery. Contracting out is being explored in many developing countries as a public sector reform and private sector development. There is a consensus that input and output services ought to be the private sector’s domain and that public funds should only be used for building private sector systems and for regulatory and quality control functions.
More and more service providers are coming into the extension field with a range of partnership arrangements. In many developing countries, NGOs, private companies, semi-governmental organizations, farmers’ organizations and the like are delivering extension advice to producers using a range of modalities. Extension and advisory services are taking on the task of facilitating debate on ways of doing things and organizing activities to improve the wider aspects of livelihoods. Options for fulfilling this task include public, private and mixed funding along with a range of delivery and management arrangements. It is now widely accepted that no single actor or agency is best placed to offer the wide range of services required. This means that a plurality of extension and advisory services is needed to support producers and the rural poor by undertaking various extension activities. The role of public sector extension in pluralistic service systems must be that of assuring quality and enhancing the demand capacity of the client system (Hoffmann et al. 1998, Kidd et al. 2000). When the private sector is contracted to deliver public extension, there needs to be a follow-up monitoring and evaluation mechanism (Alex et al. 2004).
The principal models of structuring, organizing and funding extension range from purely public sector
118 First ASARECA General Assembly, Volume 2

models to purely private ones, with collaborative and contracting mixes in between. For an effective extension service delivery in a pluralistic setting, the roles for public and private actors and agencies need to be clearly defined. Public delivery of services may be necessary in remote areas, while partnership arrangements may be necessary elsewhere, and private delivery in well-integrated areas. Where public and private extension systems compete, the public service should claim full cost-covering fees to avoid unfair competition and to give private actors a chance to develop major cost recovery over time.
The cost of organizing and coordinating a multi-sectoral network of extension providers is a human capital investment therefore public financing is critical at the beginning. The benefits at first will be social, but hold the promise of uplifting the population to the point where it will be able to contribute to the costs of development. Thus, investment in non-formal education services that purport to move the rural poor into mainstream society is a long-term goal but promises a solution to the development conundrum.
The use of appropriate tools and approaches in extension and services delivery calls for urgent attention and investment. Tools and approaches are critical for market linkages both for small and large-scale farmers, and promote partnerships to harness synergies in use of different opportunities; famers should not merely be consulted, instead they must play a pivotal role in the use of the tools and approaches.
Conclusion
The fact that we are discussing feeding our region in the 21st century and the extensive literature and resources addressing the topic, is evidence that multi-stakeholders care about Africa’s food security. For it to become a reality, we should take a cue from the first strategic objective of NEPAD and facilitate African leadership to take ownership of and responsibility for Africa’s development agenda. Extension is more than it used to be. Its function and tasks are increasingly assumed by multiple public and private organizations.
Agricultural extension plays a catalytic role in agricul-tural and rural development. It provides the farming community with information and new technologies that can be adopted to improve production, incomes and standards of living. It also provides a channel through which farmers’ problems can be identified for research and for the modification of agricultural
policies to benefit rural communities. The extension system also provides a framework through which farmers are organized into functional groups, enabling them to gain access to production resources such as credit, inputs, marketing services and information on government development programmes.
The use of a pluralistic approach, involving diverse extension actors, now exists, including NGOs, for-profit private companies, rural producer organizations (RPOs), private advisers, as well as national, state and municipal extension services.
Establishing and strengthening coordination platforms is indispensable in the delivery of efficient and effective advisory services, which have a fundamental role in the transformation of rural livelihoods. Another worthwhile collaboration strategy is the setting up of coordination platforms, whose role is to facilitate the establishment, maintenance and strengthening of linkages among various actors in the local agricultural extension system. Coordination platforms can include all-stakeholder workshops, think tank workshops and coordination committees. Such platforms can be designed to analyse the existing extension systems and chart a way forward, through setting priorities for extension intervention and facilitating the implementation of joint extension programmes involving several advisory services actors.
Agricultural advisory (extension) services and personnel are a vital element of the array of market and non-market entities and agents providing critical information that can improve farmers’ and other rural peoples’ livelihoods. Apart from their conventional function of providing knowledge for improved agricultural productivity, extension and advisory services are expected to fulfil a variety of new functions, such as linking smallholder farmers to high-value and export markets, promoting environmentally sustainable production techniques, and helping rural populations cope with the effects of HIV/AIDS and other health challenges that affect agriculture.
References
[AFAAS] African Forum for Agricultural Advisory Services. 2011. A review of case studies on targeting women advisory service providers in capacity development programmes. AFAAS, Kampala, Uganda.
AFAAS. 2011. AFAAS strategic plan 2010–2015. AFAAS, Kampala, Uganda.
119Role of extension, the Regional Extension Association, and their strategic partners in feeding the region in the 21stcentury

AFAAS. 2011. Concept and learning framework for the African Forum for Agricultural Advisory Services (AFAAS). AFAAS, Kampala, Uganda and FARA, Accra, Ghana.
Alex G, Zijp W, Byerlee D. 2002. Rural extension and advisory services: new directions. Rural Strategy Background Paper No. 9. World Bank, Washington, DC.
Anderson 2007. Agricultural Advisory Services.A background paper for “Innovating through science and technology”, Chapter 7 of the WDR 2008.
Angela M. Achieving food security in Africa: Challenges and issues. U.S. Plant, Soil and Nutrition Laboratory, Cornell University.
Beitema N and Stads G. 2011. African agricultural R&D in the new millennium: Progress for some, challenges for many. International Food Policy Research Institute and Agricultural Science and Technology Indicators, Washington, DC and Rome, Italy.
Bhasin K. 1992. Education for women empowerment: Some reflections. Gender equality and differences, male education, women empowerment. Adult Education and Development, vol. 39. Published by DVV German Adult Education Association, Department for International Cooperation.
Christoplos. 2008. Mobilizing the potential of rural and agricultural extension.
Davis K. 2008.Extension in Sub-Saharan Africa: Overview and assessment of past and current models, and future prospects. Journal of International Agricultural and Extension Education 15(3):15–28.
Davis K, Faure G, Nahdy SM, Chipeta S. 2009. Institutional changes and challenges for agricultural advisory services in Africa. Paper presented at the 19th Annual European Seminar for Extension Education, Assisi, Italy.
Diaoet al. 2006. The role of development: Implications for Sub-Saharan Africa. DSGD Discussion Paper No. 29, IFPRI, Washington.
Fact sheet 2011: Borlaug 21st Century Leadership programme, August 2011.
[FAO] Food and Agricultural Organization. 2005. Modernizing national agricultural extension systems: A practical guide for policy-makers of developing countries.
Freiro P. 1972. The pedagogy of the oppressed conscietisation. Oxford Press, London.
Hoffman V, Kidd A, Lammer J. 1998. Towards pluralism in agricultural extension: A growing challenge to the public and private sectors. In: Agriculture and Rural Development.
Hoffman GB,ChristinckL. 2009: Rural Extension, Volume 1: Basic Issues and Concepts. Margraf Publishers, Weikersheim.
[IFPRI] International Food Policy Research Institute. Reaching sustainable food security for all by 2020. Getting the priorities and responsibilities right. IFPRI, Washington, DC.
Josué D. 2004: Assuring food and nutrition security in Africa by 2020: Prioritizing action, strengthening actors and facilitating partnerships.
Kimaro WH, Mukandiwa L, Mario EJ. eds. 2010. Towards improving agricultural extension service delivery in the SADC region. Proceedings of the Workshop on Information Sharing among Extension Players in the SADC Region, 26–28 July 2010, Dar es Salaam, Tanzania.
Kisamba M. 2006. Enhancing innovations in AAS with a special focus on farmer empowerment and market orientation in SSA. Presentation to AFAAS Symposium.
Monaheng T. 2000. Community development and empower-ment. In De Beer and Swanepoel, eds. Introduction to Development Studies (2nd edition).Oxford University Press, Southern Africa.
Mutimba et al. 2009. The role of universities in food security and safety: Perspectives. based on the Sasakawa Africa Fund for Extension Education Perspectives from Sasakawa Africa Fund for Extension.
Neuchatel Group. 2008. Common Framework on market-oriented Agricultural Advisory Services. Neuchatel Group, Lindau.
Oakly P.1991.Projects with people: The practice of participation in rural development. People include women. Published by the International Labour Office. Geneva.
Pierre L. 2008: Innovation and innovation trajectories in Agricultural Extension Services.
Takyiwaa Manuh, 1998. Women in Africa's Development. Overcoming obstacles, pushing for progress.
World Bank. 2002. Decentralization of agricultural extension: Lessons and good practices. AKIS team, Washington, DC.
Zwane EM. 2011. Personal communication. Manager Advisory services, Capricorn District. Limpopo Department of Agriculture.
120 First ASARECA General Assembly, Volume 2

Executive Summary
The objective of this paper is to review the current status, key challenges and opportunities in the context of the role of universities in feeding the Eastern and Central Africa (ECA) region in the 21st century. The paper focuses on the role of Faculties of Agricultural and Allied Sciences (FAS) and includes agriculture, forestry, veterinary medicine and those aspects of science and social sciences that contribute to agricultural research and development (R&D). Two aspects are covered: (i) Higher education and training, and (ii) R&D. The two sets of activities are estimated to take respectively about 50% and 25% of their working time. Estimates are that, in 2008, about 4476 scientists were employed in teaching and R&D functions of FAS in nine countries of the region [cf. 3748 employed by NAROs mostly for research] (ASTI2011, Flaherty2011)].
The milestones in the evolution of FAS in the ECA region are presented–starting from the two pioneering faculties that were established in the 1950s at Makerere and Gordon Colleges in Uganda and Sudan respectively to the over 100 FAS established between 1960 and 2010. In the early years and up to almost the end of the 20th century, the institutions focused on producing human resources for the public sector–either working directly in government departments and agencies and/or in NGOs. However, during the 1980s and 1990s, all countries in the region implemented Structural Adjustment Programmes (SAPs) with the objective of minimizing the public sector’s role and expanding that of the private sector. This reduced employment opportunities for the FAS graduates and forced them to orient their programmes towards the needs of the private sector–a task which they are still undertaking but are inadequately prepared for.
The capacity of FAS to support R&D efforts in the region is quite significant. This is largely because their staff are well qualified—45% of the academic staff in 9 ECA countries have PhD qualifications [cf. 22% in the National Agricultural Research Institutes (NARIs)/ National Agricultural Research Organizations (NAROs)]—and from different disciplines. Additionally, because of their teaching functions FAS have more specialized and sophisticated equipment. However, in most countries, their R&D effort is not that
well coordinated both internally (within FAS itself) and externally (with the efforts of the NARIs/NAROs). It is apparent that the effectiveness and efficiency of the national agricultural research systems could be greatly increased if there is better coordination and enhanced synergies in planning and implementation of the R&D efforts of NAROs and FAS. This will require changes in the current institutional framework for the national R&D work.
This paper presents a brief overview of the institutional frameworks to manage the higher education and research efforts of FAS as well as of NAROs established in other parts of the world, especially where they have had significant impact in the positive transformation of the agricultural sector. This includes, among others, the land-grant colleges in the USA, where the teaching, research and extension functions at the state level administratively fall under one organization–the College of Agriculture–a system which is quite effective and efficient. Also reviewed are the State Agricultural Universities (SAUs) of India, which were established in the 1950s and 1960s and modelled on the USA land-grant colleges and were instrumental in the success of the green revolution, which transformed agriculture in that part of the world.
The paper examines the issues that need to be factored in when considering the development of the agricultural sector in the 21st century. These include the need to review the entire agri-food chain from on-farm production, to harvesting, processing, transportation and marketing given the demographic trends in the region and the projections that over 50% of the population of all countries will be living in urban areas by the mid-century. These demographic trends may require a review of current sectoral policies and call for a shift from focusing entirely on the small-scale peasant farmers to the more commercial farmers–especially the small and medium-scale ones who are likely to produce significant surpluses for the market. The paper also discusses rural infrastructure and environmental issues.
The challenges and opportunities that FAS have to grapple with in relation to human resources development include: Declining employment opportunities for their graduates in the public sector and hence the need to revise programmes to focus on
9. The role of universities and their strategic partners in attaining food security in the Eastern and Central Africa region in the 21st century
Geoffrey C. Mrema
121The role of universities and their strategic partners in attaining food security in the ECA region in the 21st century

the needs of the private sector; declining university budgets and government scholarships; inadequate practical and entrepreneurial skills in the training programmes as well as the need to design programmes specifically geared towards training commercial farmers, including strengthening the capacity of teaching staff in this area. As for R&D, there is need to intensify efforts to establish national agricultural research systems to better coordinate and manage the planning and implementation of the national and regional research efforts. There is need to improve planning within FAS and to strengthen linkages with university departments researching on strategic policy research.
The paper discusses the institutional and organizational mechanisms necessary to enhance the role of FAS in human resources development as well as in R&D. There are two programmatic issues related to the involvement of ASARECAS with FAS: (i) Institutional Framework for NARS: Greater efforts
need to be invested in the formation of NARS and it is recommended that ASARECA should, as a matter of priority, initiate a programme for designing and recommending to its members options of national institutional frameworks. This should lead to well-coordinated national systems that plan and coordinate the consolidated national agricultural research programmes, starting with the work of NARIs and FAS. ASARECA could partner with other institutions experienced in institutional building in developing the conceptual framework for such a programme. This is one of the core functions of ASARECA as stated in its strategic plan for 2007–2016; however, none of its current programmes deal with this function.
(ii) Involvement of ASARECA in education: While the ASARECA mission statement includes agricultural education and training, it is not apparent from its strategic plan that it intends to get involved directly in what FAS are doing. Skilling of human resources is critical to the whole agenda of feeding the region in the 21st century and ASARECA has, at the outset, to decide on its role in this effort. This may require further consultations and studies given the fact that FAS have participated very little in ASARECA activities, especially in the area of human resources development.
Three organizational options for enhanced linkages between ASARECA and FAS are proposed:
• ASARECA could link up with established regional organizations such as Regional Universities Forum for Capacity Building in Agriculture (RUFORUM) and/or Inter-University Council for East Africa (IUCEA), and sign MoUs with them on working together to enhance the role of FAS. This will, however, depend on being able to resolve the issues related to the congruency of mandates as well as geographical coverage.
• ASARECA could consider establishing a Committee of Deans as was done in Southern Africa in the 1980s and 1990s to serve as a sub-committee of its Board for handling all matters related to human resources development as well as collaboration and coordination of the R&D work undertaken by FAS. This is subject to the option being possible under current governance instruments.
• ASARECA could start a programme/project to coordinate all its collaborative activities with FAS on the understanding that the latter will contribute to the programme/project and that the programme will evolve within a specified timeframe into an Association of Faculties of Agriculture in Central and Eastern Africa (AFACEA). The Association would then take over the coordination of all the human resources development and R&D activities as handled by FAS in the region. They may also be able to elicit the support of ministries of education and agriculture and that of agencies like FAO, UNESCO, UNIDO, etc.
Introduction
Universities have been and continue to be a key compo-nent of the developmental institutions that have played a critical role in the process of increasing agricultural productivity and attaining food security in most parts of the world. Indeed, the Land Grant Colleges (LGCs), which were established from the 1860s in the USA and the State Agricultural Universities (SAUs), which were established from the 1950s in India, have played impor-tant roles in the transformation of the agricultural sector in these two countries over the past 150 years. Since the 1950s, when the faculties of agriculture were established at the Makerere College in Uganda and at Gordon College in Sudan to offer BSc degree programmes in agricultural sciences, over 100 faculties/colleges/univer-sities of agricultural and allied sciences(FAS) have been established throughout the eastern and central Africa (ECA) region. These FAS are a critical component of the system of developmental institutions in the region
122 First ASARECA General Assembly, Volume 2

and are spearheading agricultural and overall rural development.
All FAS together employed about 4500 agricultural scientists in 2008 as compared to about 3800 employed by the National Agricultural Research Organizations (NAROs) of the 10 ASARECA member countries (see table 1). Each year, thousands of agricultural and rural development experts with BSc and/or MSc/PhD degrees graduate from these institutions. In addition, there are hundreds of agricultural/technical colleges (in many cases affiliated to FAS), which produce experts trained at certificate and diploma levels in various disciplines of agricultural and related sciences. FAS are important players in the R&D efforts of the ECA countries. The manpower they produce as well as the outputs of their R&D efforts are critical to building sustaining the capacity of the institutions involved in agricultural and rural development and attaining sustainable food security in the region. ASARECA recognizes the importance of agricultural education and training and states clearly in its mission statement that it seeks … ‘To enhance regional collective action in agricultural research for development, extension and agricultural training and education to promote economic growth, fight poverty, eradicate hunger and enhance sustainable use of resources in Eastern and Central Africa.’ (ASARECA 2007).
This paper seeks to review the current status, key challenges, and opportunities in the context of the role of universities and their strategic partners in feeding the ECA region in the 21st century. (The review aimed at initiating and inspiring discussions to facilitate a constructive debate on the subject in a parallel session that was held during the meeting of the ASARECA General Assembly in December 2011 in Entebbe, Uganda.) In a short paper of this nature, it will be impossible to cover all the pertinent issues especially for a region as diverse and with countries with different historical backgrounds as the ECA region. We shall therefore focus more on the countries where data as well as documentation is available on the evolution of their FAS over the past six or so decades.
The paper is divided into the following seven sections:1. The major milestones and changes that have
occurred in the evolution of higher education programmes and institutions for agricultural study in the ECA region.
2. The role and capacity of FAS in R&D efforts in the region, including modalities of implementation, will then follow.
3. A brief overview of the institutional frameworks for managing the higher education and research focus of FAS established in other parts of the world, especially where they have had a significant impact in the positive transformation of the agricultural sector.
4. Issues that need to be factored in when considering human resources development for the agricultural sector in the 21st century.
5. The challenges and opportunities of FAS in contributing to feeding the ECA region in the 21st century.
6. The mechanisms that ASARECA and FAS can use to facilitate enhanced cooperation in human resources development as well as in R&D.
7. In the last section some concluding comments are given.
Evolution of higher education and training in FAS in the ECA region
Colonial period–Before 1960
Higher education degree programmes (at BSc and higher levels) in agricultural and related sciences in the ECA region, like those in the entire sub-Saharan Africa (SSA) region, were first established in the 1940s and 1950s, when most countries were under colonial rule. To a large extent, the imperial countries (Britain, France and Belgium) established programmes modelled on what had evolved in their own universities. The only exception was Ethiopia which had never been a colony (other than for a short period during World War II, when it was conquered by Italy] where the Alemaya Agricultural College was established with US assistance through a programme implemented by Oklahoma State University.
The British Government had, in 1945, set up the Asquith Commission to advise on higher education in her colonies in Africa (UEA 1970). This commission recommended the establishment of several university colleges under the auspices of Inter University Council (IUC) for higher education in the colonies. These included, among others, Gordon University College in Khartoum, Sudan and Makerere University College in Kampala, Uganda, established in 1946 and 1949 respectively. The two colleges were affiliated to the University of London and up to the early 1960s offered the latter's degrees. These colleges (including others in West Africa such as Ibadan etc.) mirrored the University of London in terms of their organizational and administrative structure, academic
123The role of universities and their strategic partners in attaining food security in the ECA region in the 21st century

procedures and curricula. They were conceived as largely self-contained enclaves largely in accord with the Cambridge/Oxford style of university education, which sought to distance the students and staff from their immediate cultural and familial roots as part of the education process (Court 1991).
Makerere College had existed since 1922 and offered tertiary level education (diplomas in, among other areas, agriculture and veterinary medicine) throughout the 1930s and 1940s to students from eastern and southern Africa. The main objective of these programmes was to train Native Agricultural Officers (NAOs) to work under Colonial Agricultural Officers (CAOs). The CAOs were, in most cases, BSc level British officers trained in UK universities, who had then obtained a post-graduate diploma at the then Imperial College of Tropical Agriculture in Trinidad. These NAOs and CAOs were the main officers of the departments of agriculture (for research and extension) in British Colonies in eastern and southern Africa. When degree level education was established in Makerere, in 1949, these programmes were stopped and similar programmes established at agricultural colleges like Bukalasa in Uganda and Morogoro in Tanzania.
In eastern African countries, where there was a large contingent of European settler farmers, Egerton Agricultural College in Njoro, Kenya was established in 1940 to train the 'sons and daughters' of these farmers in the 'science and practice' of farming. The Egerton Agricultural College was established through an endowment fund bequeathed by Lord Egerton. Similarly, Gwebi College of Agriculture was also established in Zimbabwe (then Southern Rhodesia) in the early 1950s by the then colonial government. These two colleges focused on training 'farmers' in medium and large-scale commercial farming. In addition to farm management courses, students also learnt about land surveying and planning, agricultural engineering as well as agronomy and livestock production. Most of the graduates from these colleges went on to work on their parents farms or established/acquired their own farms. Some worked in input supply (agricultural machinery, fertilizers and pesticides) others in output marketing organizations serving the European farmers who had settled in eastern and southern Africa (Mrema1995a & b).
In the countries under French colonial rule, the institutions were modelled after, partnered with and largely administered by established universities in France and they received considerable support from the French government. During the 1950s, “centres de etudes superieurs” that matched the French standards of that time were established in Tananarive, Madagascar (1955) and Brazzaville (1959), largely to train the personnel required to staff local colonial offices. Belgium, which was the colonial power that ruled Burundi, DR Congo and Rwanda, had educational policies for her colonies that differed significantly from either those of Britain or France. They established only one centre in the DR Congo, which was under the administration of the Catholic University of Louvain, which oversaw its operations and provided staff by out posting its faculty members. This centre was bestowed university status in 1957, three years before Congo was granted political independence (Beintema et al. 1998).
Thus the system of higher education and training in agriculture that existed during the colonial period was a dual one–on the one hand, there were African agri-cultural instructors/ demonstrators/ officers supervised by European Agricultural Officers (AOs) (trained in Britain/Belgium/France) to undertake native agricul-ture and, on the other hand, 'sons and daughters' of settler farmers, who were being trained in commercial agricultural production at the colleges established spe-cifically for them. The emphasis in the education for the
Table 1: Numbers of agricultural scientists employed by NAROs and universities in nine ECA countries in 2008
CountryNumber in
NAROsNumber in
Universities TotalBurundi 82 48 130Eritrea 96 104 200Ethiopia 1163 620 1783Kenya 733 944 1677Madagascar 161 96 257Rwanda 81 92 173Sudan 710 1240 1950Tanzania 528 488 1016Uganda 194 460 654Total 3748 4476 8224
NOTES:
1. All numbers are from the ASTI database (Flaherty 2011). No figures/data available for the Democratic Republic of Congo [DRC].
2. Figures for Rwanda are for 2009, while for all the other countries they are for 2008.
3. Figures are for actual number of staff employed and not full time equivalent (fte) as shown in AIST database. NARO includes NARIs and other public sector funded research institutes (e.g. those funded by Commodity Boards etc).
4. University numbers include those employed by faculties of agriculture, forestry, veterinary medicine, as well as those in faculties of science and social sciences who are involved in agricultural research.
5. For NARO data it is assumed that one scientist = 1fte engaged in research as per AIST methodology while university data is calculated from information supplied by AIST (Flaherty2011).
124 First ASARECA General Assembly, Volume 2

first group was on training them to join departments of agriculture in extension and enforcement of agricul-tural ordnances and regulations. For the other group, the emphasis was on training medium and large-scale commercial farmers as well as managers who could handle input supply and output marketing systems.
The agricultural research system for the colonies was organized at three levels: (a) research centres/institutes in each colony doing applied adaptive research, for example, Namulonge and Kawanda in Uganda and Ukiriguru, Ilonga, Lyamungu in Tanzania; (b) regional agricultural research organizations doing more upstream research, for example, East African Freshwater Fishery Research Organization (EAFFRO) in Muguga, Kenya and Tropical Pesticides Research Institute (TPRI) in Arusha, Tanzania; (c) imperial centres based in UK /France/Belgium doing more upstream research in support of agriculture in the colonies. There are no known formal mechanisms which linked FAS and this three-tier agricultural research system, largely because the former was operating under the education sector while the latter operated under the agriculture sector. There was, however, a close working relationship between the research system and the diploma and certificate-level training as they were both under the agricultural sector.
Early independence period 1960–1985
In the 1960s, after independence, the training pro-grammes of the 1950s, which equipped Africans to hold middle level and senior positions in the public sector of the independent governments, saw an expansion. The argument advanced then was that more trained manpower was required and thus the training colleges were massively expanded to enrol more students and new ones were established throughout SSA. Some of the agricultural colleges were converted to faculties of agricultural sciences, for example, in Morogoro in Tan-zania. New faculties of agriculture and related sciences like forestry and veterinary medicine were established throughout SSA offering BSc. degree programmes (UNESCO 1963). At the BSc. Level, there were a number of shifts in the programme content, including moving from a general degree in agriculture to offering mild options in the various sub-disciplines of agricultural sciences to specialized degree programmes (Mrema and Woodend 1995).
Two colleges, Gwebi and Egerton, established to train white commercial farmers in the 1940s, were integrated into the national systems and converted to offer the same type of training for the public system as the
other colleges. The main purpose of acquiring higher education and training was, therefore, for employment in the public sector be it in extension, research, training, or in the numerous parastatals that were established to service the agricultural sector. For agricultural graduates, employment in the public sector was mostly assured as it was regarded as a priority area in most countries in SSA.
Thus by 1983–1984, FAO estimates that there were 227,000 trained personnel employed (mostly in public institutions) in the agricultural sector (including forestry and fisheries) in SSA, with about 11000 of these having postgraduate qualifications, 45,300 a first degree only and the rest certificate and diploma qualifications. A few postgraduate programmes, mostly at the MSc level, were also established in a number of universities but these faced the usual development problems of lack of adequate facilities and staff as well as low student–staff ratios. At the BSc. level, there were a number of shifts in the programme content, including moving from a general degree in agriculture to offering options in the various sub-disciplines of agricultural sciences to specialized degree programmes (Mrema and Woodend 1995).
The regional agricultural research organizations that had operated during the colonial period continued to operate until mid 1970s, when they collapsed due to political differences. This led to serious problems, for example, each of the three east African countries, which were part of the former East Africa Community (EAC, 1967–1977), had to establish its own system of NARO [TARO, Tanzania Livestock Research Organization (TALIRO) in Tanzania; KARI in Kenya and NARO in Uganda]. Universities in the region continued to be linked as the Inter-University Council of East Africa (IUCEA) survived the collapse of ECA and it facilitated student exchanges and inter-university consultations within the region. Indeed, the ASARECA secretariat in its earlier structure was modelled on the IUC (EA) secretariat that had survived after the collapse of the EAC in 1977.
Structural adjustment period 1985–2000
The over expansion of the public sector which occurred between 1960-1985 led to large deficits in the budgets of governments in most countries in SSA. Governments were therefore forced, through economic structural adjustment programmes (ESAPs) designed with the assistance of the IMF and the World Bank, to reduce the number of employees in the public sector by
125The role of universities and their strategic partners in attaining food security in the ECA region in the 21st century

retrenchment, early retirement and freezing of vacant posts. The SAP mandates affected extension and research departments and/or public organizations established to service the agricultural sector.
FAS, which were also almost entirely government-funded, were, likewise, significantly affected by SAPs. Their operating budgets were significantly reduced even though the number of students admitted increased to accommodate the large numbers of applicants completing secondary schools, whose capacity had expanded significantly in the 1970s and 1980s. Employment in the public sector of FAS and other faculties’ graduates declined significantly due to SAPs. The 1990s also saw a marked increase in the number of non-governmental organizations (NGOs), especially those working in rural areas. Many donor organizations started channelling significant amounts of their assistance through these NGOs, which were considered more efficient and effective than the government bureaucracy. The growth in the number of NGOs did create new employment opportunities for university graduates, especially those of FAS. This led to FAS re-orienting some of their programmes to factor in the needs of these new employers. It was apparent that while one of the main objectives of SAPs was to increase the role of the private sector in providing services to, among others, small-scale farmers in the distribution of seeds, fertilizers and similar activities many of the NGOs were also quite active in these areas, thus stifling private-sector initiatives (Eicher and White 1997).
During the period starting from 1975, there were comparatively large initiatives in all SSA countries to strengthen the human resources capacity of the NAROs, FAS as well as the extension services through post-graduate training at MSc, PhD and post doctoral levels. Scholarships for post-graduate training were offered not only by the former colonial powers but also by other developed countries like USA, the Netherlands and the Scandinavian countries. The International Agricultural Research Institutes (IARCs) were also involved in this training; they offered short courses and allowed NARO and FAS staff enrolled in universities in the region and overseas to use their facilities during the research part of their graduate programmes. All this opened up NAROs and FAS to more diversified education and training compared to the earlier period, when they were invariably confined by the dictates of the former colonial powers. FAS, in particular, exploited these opportunities and, by 2001, in quite a number of them, more than 50%of their staff had doctoral qualifications
(Beintema and Stads 2011)–a trend which has continued up to today.
During this period, a number of FAS became fully fledged universities in their own right–of interest here were those which were established as universities of agriculture modelled to some degree on state universities of agriculture (SAUs), which had been established in India and other Asian countries in the 1950s and 1960s. The SAUs in India and similar institutions in other Asian countries were credited with being among the key institutions that were responsible for the success of the green revolution in the 1960s and 1970s. The green revolution largely bypassed SSA. However, as will be explained later, the institutional and organizational framework of the SAUs in Asia was more integrated with the agriculture sector than that of the newly established universities in the ECA region such as the Sokoine University of Agriculture in Tanzania and the Jomo Kenyatta University of Agriculture and Technology in Kenya. This lack of integration with the major institutions and ministries involved with agricultural development may have lessened their contribution and impact on agricultural development and the attainment of food security. Also, colleges of agriculture such as Egerton College, which were under the ministry of agriculture (MoA), were converted to fully fledged general universities under the ministry of education (MoE) during this period.
It was also during this period that the regional eco-nomic commissions (RECs) were established in SSA, which initiated regional collaborative programmes in agricultural development. Notable among these was the Southern Africa Development Community, which, in 1984, established the Southern African Centre for Cooperation in Agricultural Research (SACCAR) as its organ to implement regional programmes in the area. The mandate of SACCAR initially was confined to cooperation in agricultural research, but, in 1985, this was broadened to include cooperation in train-ing (Nygaard et al. 1985). The SACCAR Board was expanded to include three representatives of Deans of Faculties of Agricultural Sciences, and a Committee of Deans of Agricultural Sciences (CDAS) was formally established as a committee of the board. CDAS devel-oped a blueprint for a long-term strategy for training of professional manpower for the agriculture and natural resources sector in the Southern African Development Community (SADC) region, which was subsequently approved by the Board of SACCAR (Rukuni et al.1990).
126 First ASARECA General Assembly, Volume 2

SACCAR developed and implemented several regional MSc programmes. The programmes were designed with inputs from experts from the region, and initially four such programmes were started at University of Zimbabwe (animal science), University of Zambia (crop science), University of Malawi–Bunda College (agricultural economics) and Sokoine University of Agriculture (land and water management). The German government provided assistance to the universities to start these programmes as well as disburse scholarships to regional students. SACCAR commissioned a design mission to plan additional regional programmes (Mrema et al. 1990), and another one to develop protocols for student and staff exchange (Rukuni et al. 1994). With the admission of South Africa in SADC in 1995, the SADC Secretariat and its organs were reviewed, which led to the abolition of SACCAR as an independent centre–largely because of the high operational costs–and it was replaced by a small unit in the Ministry of Agriculture of Botswana. The four regional MSc programmes are still operational and they have evolved their own governance mechanisms independent of SACCAR.
When ASARECA was established in 1995, it was essentially an association of NAROs, and FAS were not involved in the stakeholder consultations that occurred in 1994–1995, which led to its formation. However, FAS scientists were quite active in the ASARECA networks and five of the NARO directors who were in the Committee of Directors (CD) were formerly university staff. These directors appreciated the potential contribution of FAS in the national and regional R&D efforts as well as in human resources development. ASARECA CD then decided that the integration of the university and NARI contributions in research and in human resources development should be done at the national level rather than creating a parallel regional structure for FAS as had been done in the SACCAR/SADC case. One individual representing the universities was co-opted as a member of CD (ASARECA 1997).
The period from 2000–to date
Economies of most countries in the ECA region began to register positive economic growth from late 1990s and during the first decade of the 21st century. This led to increased government budgets, which translated into increased allocations to the ministries of agriculture and of education. Universities, including FAS, benefited from this growth in two ways: increased direct budget support from the governments and increased employment opportunities for their graduates both in
the public and private sectors. In the past, governments provided most students with scholarships for their university studies; however, due to increased numbers, by 2000, the numbers had significantly decreased and governments were instead providing loans to cover the fees and other expenses. Also, an increasing number of students were being sponsored by their own parents and/or the private sector.
New universities are also being established in all countries of the region–a few of these new universities are public universities, while a majority are private universities established by religious organizations and entrepreneurs, a number of them are also branches/campuses of overseas universities. Most of these private universities focus on programmes that do not require heavy investments in laboratories and workshops, for example, the humanities, social sciences, and law, education and business studies. The public universities continue to dominate in the laboratory-based programmes such as agricultural, engineering and medical sciences. SAPs, which the countries in the region implemented during the 1980s and 1990s, significantly increased the role of the private sector in the economies of the region. This, in turn, has led to pressure on FAS to produce graduates with entrepreneurial skills.
The 21st century has, therefore, seen massive increases in numbers of universities as well as the numbers of students enrolled in them in all countries in the ECA region, for example, in Tanzania, the number of universities has increased from less than 5 public universities in 2000 to 12 public and 29 private universities in 2010. Programmes at the undergraduate level in agricultural sciences are, however, offered mostly in the public universities, although some private universities are planning to initiate similar programmes, for example, the International University of East Africa will offer degrees in engineering and agriculture, while quite a number of other universities are offering degrees in agribusiness and agri-economics. All the public universities, although operating on their own charter with autonomous governing councils, maintain very strong links with ministries of education, through which they are funded by the governments of the region.
R&D work at the FAS/universities in the ECA region
The universities in the ECA region are well equipped for R&D work. According to ASTI surveys, university staff in the SSA region, under normal economic
127The role of universities and their strategic partners in attaining food security in the ECA region in the 21st century

conditions, spend about 50% of their time on teaching at both undergraduate and graduate levels; 20–30% on administration, outreach and service activities, including consultancy work; and the remaining 20–30% on research and development work, including supervision of undergraduate and post-graduate student research work (Beintema and Stads 2011; Flaherty 2011). Most of the research work is through projects funded by the research and publications committee of the university, student dissertation/theses research, and/or externally funded research projects–usually funded by donors, private sector companies, or government departments.
Research in FAS is, in many cases, not well coordinated; even within a department, every staff member wants to manage his/her own projects; and, at the faculty level, work by the different departments is not well coordinated–in fact, in many cases, each department conducts its own research. Undoubtedly, the qualifications of the staff in the universities is much
higher than in NAROs, for example, of the 3748 scientists employed by NAROs in 2008 in the nine ECA countries (table 1), only 831 or 22% had PhD qualifications and 1845 or 49% had MSc qualifications, while the remaining 29% had only BSc qualifications compared to the 2031 scientists (or 45%) and 1514 scientists (34%) respectively who had PhD and MSc qualifications in the university system. Indeed, the number of scientists with PhD qualifications in the FAS/universities in the nine ECA countries compares quite favourably with the total number of scientists with similar qualifications in all the 15 IARCs of the CGIAR system. There is need for a better institutional and organizational framework to exploit this pool of highly qualified human resources for agricultural R&D work both at the national and regional levels.
Institutional framework for effective linkages and impact
The universities and their FAS fall under the ministry of education, while NAROs fall under the agricultural ministries and, in quite a number of countries, there are separate research organizations responsible for research on livestock production and health, natural resources management and fisheries. The extension services also fall technically under the ministry of agriculture (or livestock, fisheries, forestry, where these come under different ministries) and, in quite a number of countries, they are operationally under the ministries of local government. Linkages between these different organizations/departments are often quite weak and there is little coordination among their operations. The current structure in most countries is based on the civil service system that was inherited from the colonial authorities. Also, there have been different institutional models to manage agricultural research at the national level including, being directly under the civil service bureaucracy, or being administered as separate projects reporting to higher levels of the ministry, or being separate autonomous organizations. Experimentation with different organizational and institutional models continues up to the present day.
One of the main objectives of the Framework for Action (FFA) for regional cooperation in ECA, which was developed by the World Bank-based secretariat of the Special Programme for African Agricultural Research(SPAAR), was that an institutional framework should be established to build an efficient NARS, which would coordinate the work of all the key organizations in agricultural R&D, including those involved in training and capacity building (NAROs/NARIs, FAS,
Table 2: Levels of qualifications of agricultural scientists in NAROs and universities in nine ECA countries
CountryNumber in NARO with
Number in FAS/ Universities with
PhD (%) MSc (%) PhD (%) MSc (%)Burundi 4 (4%) 62 (76%) 20 (41%) 16 (34%)Eritrea 1 (1%) 27 (28%) 29 (28%) 39 (38%)Ethiopia 201(17%) 493 (42%) 138 (22%) 277 (44%)Kenya 205(28%) 381 (52%) 566 (60%) 328 (34%)Madagascar 32 (20%) 120 (75%) 79 (82%) 17 (18%)Rwanda 6 (7%) 32 (40%) 16 (17%) 46 (50%)Sudan 220(31%) 362 (51%) 650 (52%) 434 (35%)Tanzania 95 (18%) 269 (51%) 302 (62%) 156 (32%)Uganda 67 (35%) 99 (51%) 230 (50%) 201 (44%)Sub Total 831(22%) 1845 (49%) 2031 (45%) 1514 (34%)TOTAL 2676 (71%) 3545 (79%)
NOTES:1. All numbers as provided by ASTI (Flaherty 2011). No figures/data are
available for DRC.2. Figures for Rwanda are for 2009, while for all the other countries they are
for 2008.3. Figures are for actual number of staff employed and not full time equivalent
[fte] as shown in the AIST database. NARO includes NARIs and other public sector-funded research institutes (for example, those funded by Commodity Boards and the like).
4. University numbers include those employed by faculties of agriculture, forestry, veterinary medicine, as well as those in faculties of science and social sciences who are involved in agricultural research.
5. For the NARO data, it is assumed that one scientist = 1fte engaged in research as per AIST methodology, while university data is calculated from information supplied by AIST (Flaherty 2011).
6. Numbers in tables are actual numbers employed with (%) being of total number employed by NARO or the university. To get the percentage of scientists with BSc only qualifications, subtract the sum of the percentage of MSc and PhDs from 100 (for example,. for Burundi, the percentage of NARO scientists with only BSc. qualifications = [100- (4+76)] = 20%.
128 First ASARECA General Assembly, Volume 2

seed companies and so forth) (SPAAR1994). SPAAR FFA did inform the process of establishing ASARECA and hence its name “association for strengthening agricultural research” at both the national and regional levels. From the outset, it was recognized that there were no NARS operating in any of the 10 countries and this was a major institutional weakness of the system. One of the major functions of ASARECA was to facilitate the evolution into NARS of the NAROs and FAS and other entities involved in R&D efforts at the national level.
In deciding to form ASARECA as an association for strengthening agricultural research in the region, the members of the founding CD were conscious of the fact that the concept of NARS involved more organizations than the NARIs/NAROs and that the process of building a national system had to be customized to meet local needs. The founding CD was certainly very concerned by the uncoordinated and unlinked set of organizations at the national level that were active in R&D as well as technology transfer efforts. What was required was to create a system wherein the individual components were not only interlinked, but were also able to communicate and cooperate to achieve some common goal. This was particularly the case in all the ECA countries where the NAROs were then and are still comparatively quite small and are required to undertake research on a large number of factors and commodities. The current institutional framework for agricultural research, education and extension in most of these countries is essentially a product of what was left by the colonial authorities, with the three functions being performed by three different bureaucracies under different ministerial authorities. CD agreed that the system as it existed then and still exists today had to be transformed–the question then was and still is today: transform to what?
An institutional framework that is often identified as one that could be emulated is the USA colleges of agriculture system, which has been quite successful. These colleges internally manage three different func-tions: research, teaching and extension; the linkage then is internal and it is administered by one person, the Dean. As Bonnen (1998) has noted, this direct linkage produces far more complementarity, coordination and thus higher productivity than can be extracted from systems where each of these three functions is embed-ded in a separate institution and reports to different ministerial bureaucracies. However, this system was created by the USA Congress over a 50-year period, starting with the Morrill Act of 1862, which created a system of land-grant colleges; the Hatch Act of 1887,
which established agricultural experimental stations linked to the land-grant colleges; and the Adams Act of 1906, which clarified the roles of the US Department of Agriculture (USDA)and the land-grant colleges in agricultural research; and, finally, the Smith-Lever Act of 1914,which established the state extension services linked to the land-grant colleges (Bonnen1986).
Bonnen (1998) has noted three serendipitous elements in the evolution of the US system of agricultural developmental institutions, which have contributed significantly to its success:• The sequencing of the three Acts, starting with the
first one which established the colleges in 1862, followed by the ones establishing the experimental stations and extension services and linking them to the colleges in 1887 and 1914 respectively. In his opinion, had the timing been reversed then the research and extension functions might have been assigned to different institutions independent of the colleges as has been done in most countries.
• That the Land Grant Colleges established under the 1862 Act were not confined to offer only agricultural programmes but also had broad goals of improving the welfare of the farm families, including a strong commitment to vocational skills. This prevented them from turning into … “a gaggle of isolated disciplines and an engine of social elitism.” (Bonnen 1998)
• The relatively small size of most of the states created a decentralized system from the outset, which ensured systematic and adaptive research on many different eco systems.
It is also important to note that the land-grant colleges established under the 1862 Morrill Act mostly served the more prosperous and medium to large-scale famers. It was not until 1890, when the second Morrill Act was enacted, that they shifted their attention to small-scale farmers. The Act gave them federal and state resources to provide, among other things, agricultural research and extension services to meet the needs of rural, and limited-resource people, who were in most cases small-scale farmers by USA standards. The 1890 Morrill Act focused on assistance to institutions, with major empha-sis to deliver technical and educational assistance to the poor, under privileged, under-educated, unemployed, politically powerless people in the states and areas they served(Christy and Williamson 1992). Thus the USA system is, by and large, a dual one.
The Indian experience of the past 60 years in crafting institutions for agricultural development is relevant to
129The role of universities and their strategic partners in attaining food security in the ECA region in the 21st century

SSA. As Lele and Goldsmith (1989) have noted, one of the most important factors contributing to the success of the green revolution in India in the 1960s to 1980s was the transformation of the agricultural research and education system. India inherited from the British, in 1947, a higher education system in agricultural sciences, which was formal and bookish and transformed it to one that aimed at seeking to develop practical skills and ability to solve field problems. With assistance mainly from USA, India, during the period 1950 to 1985, established 25 State Agricultural Universities (SAUs), which have played a critical role in transforming agriculture. The universities are modelled on the USA land-grant colleges, and are responsible for research, education and extension at the state level. The transformation of the Indian system was not easy, and there was the usual resistance to change, and intrigues, which have been described by Naik and Sankaram (1972), Read (1974) and Lele and Goldsmith (1989).
It is important to note that the green revolution in India was spearheaded by the more progressive and large-scale (by Indian standards) farmers, especially in the northern states of Punjab and Haryana (see table 3). In 2001, the semi-medium, medium and large-scale farm holdings constituted respectively 11.8%, 5.5% and 1.0% (totalling 18.3%) of the total number of farm holdings in India, but they respectively controlled 24.0%, 24.0% and 13.2% (totalling 61.2%) of the cultivated area. While the small-scale and marginal farm holdings constituted respectively 19.0% and 62.3%(totalling 81.3%) of the total number of farm holdings; however, they cultivated respectively only 18.7% and 20.2% (totalling 38.9%) of the cultivated land area. As Singh (2011) has noted in Punjab–the most successful state in terms of the green revolution–the area holdings under the semi medium, medium and large categories in 2001 were 22%, 43%, and 27% respectively, thus cultivating 92%of the total cultivated area and most of it irrigated. Further, in
India, the average size of a landholding to secure a loan from a commercial bank for a 40kW tractor was only 4.3ha,thus demonstrating the high levels of capital investment in agriculture in India.
Human resources for agricultural development in the 21st century
We have already examined the evolution of higher education and training in agricultural sciences in the preceding sections. Though most of the FAS programmes evolved over the past 50 years, they have largely retained the basic structure inherited from the British or French Universities that helped in establishing the institutions. Further, the programmes were originally designed for training human resources for the public sector in research, extension and administration. But the demand in the 21st century has shifted to trained manpower for the private sector, both in production and in service industries. Merely increasing the numbers from the current programmes is unlikely to solve the major agricultural production problems. There is need to update the curricula and the types of programmes offered in institutions of higher education in agricultural sciences in the ECA region (Lele and Goldsmith 1989; Borlaug 1986; Eicher1989, 1999)There are a number of issues that need to be considered when transforming these programmes.
Looking at the entire value chain
A number of social and political drivers are conducive to increased agricultural productivity and overall production, including the development of agribusiness and agro-industries in Africa. These include the rapid urbanization of SSA, where the rates of urban population growth are the highest in the world. According to UNFPA’s State of the World Population 2007,the urban population for SSA is expected to double between
Table 3: Size of farm holdings in India and the state of Punjab
Category (range in ha); (average size in 2001 in ha).
India Punjab
1971(%) 1991 (%) 2001(%)
1971 (%) 1991 (%)No. AreaMarginal (<1ha); (0.4ha) 50.6 59.4 62.3 18.7 37.6 26.5 Small (1–2ha); (1.42ha) 19.0 18.8 19.0 20.2 18.9 18.2 Semi-Medium (2–4ha); (2.72ha) 15.2 13.7 11.8 24.0 20.5 25.9 Medium (4–10ha); (5.8ha) 11.3 7.1 5.5 24.0 18.0 23.4 Large (>10ha); (17.12ha) 3.9 1.6 1.0 13.2 5.0 6.0 Average size (ha) 2.28 1.57 1.33 2.08 3.35 Total (millions) 70.5 106.6 119.2 1.38 1.03
130 First ASARECA General Assembly, Volume 2

2005 and 2030. By 2035, urban areas will account for 53% of Africa’s population (UNFPA 2007). The urban population by 2035 will be more than the total population of SSA in 2000.Urban growth potentially benefits the agriculture sector, especially agribusinesses and agro-industries, because it offers producers and processors access to expanding urban markets and increases demand for agro-products, especially in processed form. Additionally, urbanization necessitates increase in agricultural productivity and modernization of agri-food chains to enable efficient production and supply of foodstuffs to the growing number of urban dwellers. There is need, therefore, for manpower that can handle the requirements for the entire food/value chain from the farm to the consumers’ table.
Paradigm shift – commercial farming
Another relevant driver stems from the demographic profile of the African continent, where the population is mostly young. Indeed, more than half of the Africans are under 20 years of age. The youth constitute both a pool of labour and a source of entrepreneurial potential that can be tapped for commercial agricultural production, including the supporting services. Many younger Africans do not see traditional farming as an attractive occupation; they would probably see better prospects in productive and profitable agro-enterprises. Also there is the concern that the rural population is increasingly ageing as the young and educated migrate to urban areas for better opportunities. Given the current economic policies, it is the aging, rural small-scale farmers who are expected to produce even more for the growing urban population.
There is a need, therefore, to review the current agricultural development policies being pursued by governments in the region with the support of the major donor agencies. Most of the policies concentrate on the betterment of the small-scale peasant farmer. For sustainable agricultural growth in the medium and long term, there is need for a paradigm shift from policies that entirely focus on small-scale peasant farmers to ones where there is increased and perhaps equal attention paid to medium-scale African commercial farmers.
Large-scale farms are likely to play a limited role in increasing food production in the region. It is only in a few countries in the region, where either foreigners settled and established large-scale commercial farms growing export commodities like coffee, wheat, tea and flowers, for example, in Kenya, Tanzania, Uganda, Ethiopia, or where foreign transnational companies (TNCs) established large plantations (for example,
sugarcane in eastern Africa) that these large farms have been successful.
The preceding paragraphs should not be interpreted to mean that small-scale peasant farmers should be abandoned. Instead the suggestion is to accommodate the growth of medium-scale farmers, who will be able to create the demand and support necessary for sustainable institutions/organizations for input supply and output recovery. Governments and donor agency efforts in the 1960–1980s at directly providing services to the small-scale farmers have not been that successful. While NGOs have tried to provide these services, it is generally accepted that it is not a viable long-term option (Eicher and White 1989). With the introduction of SAPs, both governments and donor agencies are reducing funding for services and leaving it to the market. But markets require entrepreneurs to function–the argument, therefore, is that medium-scale farmers are the ones who can influence and create functioning markets, which can efficiently serve the agricultural sector for sustainable agricultural and overall economic growth.
These farmers could also become contractors to govern-ment and local authorities in maintenance and repair of the rural infrastructure and provide services that governments cannot efficiently provide like establish-ment of transport and processing companies. They can do this individually or through organizations that they establish. The mini green revolutions that have occurred in SSA in the past four decades, for example, maize in Kenya and Zimbabwe and cash crops like coffee and tea in east Africa, tobacco in Malawi and Zimbabwe and cocoa in West Africa, reinforce the need for such a para-digm shift to a dual structure (Byerlee and Eicher1997; IBRD/FAO 2009). The challenge then is to facilitate and catalyse the emergence of such medium-scale farmers, and FAS could be key players in this regard.
Rural infrastructure
Rural infrastructure is critical to agricultural develop-ment; maintenance and growth of such infrastructure is essential to increase agricultural productivity and overall growth. Currently, rural infrastructure like roads, markets, water and power supply, is deficient in all the countries in the ECA region. Better market incentives to farmers will be blunted if the physical barriers and economic costs of transporting of goods to and from the local markets are very high. Construction and maintenance of roads is an expensive undertaking,
131The role of universities and their strategic partners in attaining food security in the ECA region in the 21st century
and with economic structural adjustment programmes (ESAP); most governments in SSA will find it difficult to find money for such ventures. The World Bank rec-ommends decentralization of rural road construction and maintenance to local institutions and use of local contractors for such tasks.
Rural infrastructure needs to be coupled with the mechanization of African agriculture. In 1961, SSA had more tractors in use than Asia at 172,000 and 120,000 units respectively. However, by 2000, SSA had 221,000 units in use as compared to 6million units in Asia. While the number of tractors in use has increased from 2000 to 2011, the region still has very far to go in this regard, with 85% of the cultivated land being still being tilled by the centuries old hand hoe(Mrema et al. 2008). The economics of tractor utilization raises a number of issues and there is a potential role for medium-scale farmers with tractors in rural infrastructure construction and maintenance. As agriculture in most of ECA region is rain fed and the seasons are short, with the periods when the tractors are required for field operations being even shorter (2–3 months), such farmers could use their tractors for rural roads maintenance during the off-season provided they can be assisted by provision of equipment, including trailers, compaction equipment and other tractor-mounted road construction equipment (angle dozers/graders; hydraulic loaders and the like.), and training in rural road construction and maintenance. This will increase utilization rates of tractors and thereby lower unit costs for both ploughing and other field operations as well as for road construction–all this requires different types of human resources to service the sector than hitherto available.
Environmental issues
All ECA countries face the same environmental challenges, which include soil and water conservation, conservation of plant and animal genetic resources, and
global warming. Universities in the region, especially FAS, are quite well equipped to handle these challenges. They have the staff and the equipment to undertake research on environmental issues. Most agricultural universities have faculties in the various disciplines of environmental research, including the physical sciences (soil and environment physics, geography, soil and water engineering, hydrology and geology); bio-chemical sciences (crop and animal science, forestry, botany and zoology);and social sciences(agriculture and resource economics, sociology and agricultural extension). The region should therefore exploit this range of expertise and integrate research in universities with that of NAROs and other international partners.
Challenges and opportunities for FAS in the ECA region
FAS have to overcome a number of challenges in the ECA region face if they are to contribute more efficiently and effectively to the national and regional efforts of feeding the region. There are also opportunities that they could exploit to increase their role and contribution in the national and regional efforts. As indicated earlier, FAS are involved in two areas: capacity building as related to training of human resources at the under and post-graduate levels an area where they apply about 50% of their human resource capacity, and in R&D, where they use about 25% of their capacity. Although linked, the challenges and opportunities for the two areas will be examined separately.
Capacity development
Declining employment opportunities in the public sector
In all countries of the region, the employment opportu-nities in the public sector for FAS graduates have been declining and will continue to decline even further. The curricula of most undergraduate programmes are oriented towards training of manpower for the public sector. With increasing privatization of the agricultural sector, for example, extension services, FAS faces the challenge of adapting their programmes to suit the needs of the diverse private sector–from input suppliers and service providers to those involved in actual on-farm production as well as those involved in post-harvest handling, conservation, processing and marketing. The graduates will have to be competent in selling their services, for example veterinary skills or seed supplies, to farmers and at affordable prices. It is unlikely that the private sector can provide such services if there
Figure 1: Estimates of areas cultivated by different power sources in the sub-region
132 First ASARECA General Assembly, Volume 2

are no farmers/customers who can afford them. The challenge to FAS, therefore, is not only to change the programmes but also to influence government policy so that it creates an enabling environment for commercial provision of agricultural services as well as creation of an agricultural sector that is not only highly productive but also able to employ some of their graduates.
Declining university budgets and scholarships
Most governments in the region have reduced the support they provide to students for university education. Students are being asked to sponsor themselves or take student loans. With declining employment opportunities in the public agricultural sector, most students are likely to choose careers with more job opportunities or where they can establish businesses without too much start-up capital, for example, accountancy, law and such like. With an agricultural sector that is dominated by small-scale peasant farmers who are used to receiving free services from the government or from NGOs, the situation is rather bleak. Already some programmes could be discontinued because they are unable to attract enough students nationally to maintain economical student–staff ratios. Universities will, therefore, be forced to widen the catchment area for applicants to include students from other countries. This process of admitting regional students is likely to accelerate, especially in the five countries in EAC, where there is already free movement of labour. The challenge, which also presents an opportunity, to FAS is to design quality undergraduate and post-graduate programmes that are competitive regionally and provide adequate facilities as well as a conducive atmosphere for higher education and training.
Practical skills in degree programmes
An issue of concern with regard to the FAS curricula is the level and extent of practical training in the programme. As indicated earlier, higher education programmes in agriculture involve elements of both the science and practice of agriculture. In the more advanced countries, students enrolling in an agricultural programme would normally have spent a year or so working on a com-mercial farm learning practical skills. In Africa, most of the students are generally from small-holder farming families, where the level of technology is low, or are from urban areas and have little exposure to farming practices. Many observers have complained that FAS produce graduates who are too theoretical and have little practical or programme orientation or hands-on
experience in practical skills (Mrema&Woodend1995). Also, in most countries, there are few good commercial farms where students can go for practical training.
Some FAS have resorted to establishing their own commercial farms where they can offer the practical training. The challenge is to determine how much of the programme should be devoted to the science and how much to the practice of agriculture given the diverse backgrounds of the students. Then the practical training facilities have to be identified and financed. If commercial farms that are willing to offer such training can be identified, it provides opportunities for enhancing mutually beneficial FAS–industry linkages as well as for possibly more cost-effective ways of creating capacity. There is need to set up mechanisms of finding and documenting the best practices and most cost effective ways of offering such training, and this can be done more effectively at the regional level.
Entrepreneurial skills in degree programmes
As indicated above, the emphasis in the undergraduate degree programmes is on the science and practice of on-farm agricultural production. This is, in itself, a large enough task given the duration of the programmes and the background of the students enrolled. There is, thus, little coverage of the skills and technologies required for efficient handling and managing of the input supplies and output recovery systems, that is pre and post-production technologies and skills–key components of the value chain and the hallmark of modern agribusiness and agro-industries. Indeed, in the developed countries, the pre and post-production sectors employ much more people than on-farm production (ratio 9:1)(FAO/UNIDO 2009). Entrepreneurship is important and will become even more important in the future as the agricultural sector is modernized and transformed to meet the challenges of the 21st century. The challenge is to design and implement the most cost-effective and efficient ways of offering training and imparting entrepreneurial skills to the students.(Whether this should be part of the undergraduate programme or be offered at the post-graduate level needs to be given some thought.) To sum up, potentially, there is a huge opportunity, and the best practices and most efficient ways for offering training need to be identified, which again can be done more effectively at the regional level.
Training of commercial farmers
Given the demographic and socio-economic changes that are likely to occur in the region during the first
133The role of universities and their strategic partners in attaining food security in the ECA region in the 21st century

four decades of the 21st century, there is need for more indigenous commercial farmers, especially medium-scale ones in addition to the small and large-scale farmers. Small-scale farmers are usually self-trained, though a few may have had some training at farmers’ training centres. Many of the large-scale farms–which are few in any case–usually import their managers or have set up specialized centres such as the Mananga Management Centre (MMC) in Swaziland (which the then Commonwealth Development Corporation established in 1972 for training managers of its large-scale farms scattered throughout Africa, Caribbean, Latin America and Asia) (Norman et al. 1992; Mrema 1995).During the colonial period, colleges such as Egerton in Kenya and Gwebi in Zimbabwe were established to specifically train the sons and daughters of settler farmers. Graduates of these colleges were quite successful in commercial farming from the 1940s to the 1970s. However, these colleges were converted to train extension workers and other subject-matter specialists for the public sector soon after independence. Likewise, FAS have churned out large numbers of graduates who are geared largely for service in the public sector and NGOs.
The level of practical and business management skills that medium-scale commercial farmers require is much higher than what is currently on offer in any of the programmes that FAS conducts in SSA. The challenge for FAS and the colleges of agriculture is to design and offer education and training programmes for medium-scale farming. There are certainly huge opportunities in this sector given the planned programmes for the transformation of the agriculture sector such as Plan for Modernization of Agriculturein Uganda and the Southern Agricultural Growth Corridor of Tanzania. This is an area where ASARECA and other regional bodies such as IUCEA and RUFORUM could collaborate in planning and designing pilot programmes to be offered by FAS and other partners.
Capacity of FAS staff
Very often, the FAS teaching staff are academic and bookish in their orientation and only a few of them have hands-on experience of commercial farming and/or agribusiness; and those who have work experience outside FAS are most likely to have worked in the public sector or in NGOs. Another weakness is their inability to integrate their knowledge and skills across the different sub-disciplines of agricultural sciences. Often they are compartmentalized in their approach and fail to see that whatever they develop is a part of
wider system and has to be integrated into it (Borlaug 1986). The farming systems approach of the 1970s and 1980s was supposed to offer academicians a means of integrating their knowledge, but it was dominated by socio-economists to the exclusion of other sub-disciplines and failed to serve its purpose (Baker 1992; Castillo 1992). The challenge, therefore, is to find ways and means through which the teaching staff of FAS can avail opportunities to acquire and/or enhance their practical and entrepreneurial skills as well as their ability to integrate across the different sub-disciplines of agricultural sciences.
Role of FAS in national and regional R&D efforts
As indicated in the preceding sections, FAS in the region have a much larger pool of highly qualified agricultural scientists (see table 2). The total number of staff with PhD qualifications employed by FAS in the nine ASARECA countries in 2008 was 2031, against 831 similarly qualified staff in NARIs/NAROs (a ratio of 2.44:1.0). Even if data from the DR Congo were included, it is unlikely it will impact the ratios significantly. In the smaller countries, the number of FAS staff with PhDs is many times more than those in NAROs, for example, in Burundi and Eritrea, the ratio is 5:1 and in Rwanda it is 8:6 (see table 2)]. The FAS staff use about 50% of their working time on teaching and about 25% on R&D, with the remaining 25% being used for outreach, administration and similar functions.
The contribution to agricultural research of the FAS staff with PhD qualifications employed in the nine countries is equivalent to 508 full-time equivalent [fte] scientists, which is greater than the total number of IARC scientists employed in the entire SSA region. The major difference between the two systems is that contribution of the FAS scientists is organized and managed by over 400 departments that are under about 100 faculties and/or universities, while the contribution of scientists of the IARCs is planned and managed by the 15 CGIAR centres operating in SSA. There is no question that though the pool of highly qualified scientists in the FAS maybe fully utilized on a day-to-day basis, the impact of their efforts is greatly reduced at national level due to weak coordination within FAS themselves and with their counterparts in NAROs/NARIs, and even more so regionally and internationally. The following are the challenges and opportunities in relation to increasing the impact of the R&D efforts of FAS nationally and regionally in the ECA region.
134 First ASARECA General Assembly, Volume 2

Need to increase efforts towards formation of NARS
Currently none of the countries in the region have NARS operating, though there are NARIs operating under the ministries responsible for agricultural development and FAS operating under the ministries responsible for higher education. As indicated earlier, there is considerable increase in efficiency and effectiveness as well as impact if the R&D work of the NAROs and FAS is planned, financed and implemented under a coordinated national system, be it the university or the ministry of agriculture. The ultimate goal should be to bring all these efforts under one institutional framework; however, it is generally accepted that reaching such a goal may be a long and time-consuming process, especially where the two organizations are already operating separately with different incentive systems for their respective staff. The task of assisting countries in reaching this goal was previously assigned to International Service for National Agricultural Research (ISNAR); however, the CGIAR abolished ISNAR in 2002 largely due to internal contradictions in its work programme. The challenge for ASARECA is to initiate a programme to establish NARS, especially in the countries with small NAROs and FAS, for there may be opportunities here for immediate significant increases in efficiency and effectiveness; also, it may be easier to break the walls within FAS and NAROs and those between them.
Improve the planning and implementation process of R&D within FAS
The FAS R&D work in the region is organized on the basis of grants to individual scientists under departmental direction. Often activities of different individuals and departments are not integrated even when they are working on the same commodity or factor. Also, some of the departments in FAS may be the only centres of excellence in the country or even the region in their respective area. The challenge therefore is to design mechanisms for research planning and implementation that allow FAS to become reference experimental stations for particular commodities and/or disciplines at the national and regional levels. ASARECA should then focus on designing mechanisms that facilitate the maximum flow (both ways), across national boundaries, of the research output of such centres. This may apply also to work undertaken by university departments that are not directly affiliated to FAS such as irrigation engineering research under faculties of engineering or nutrition research under faculties of medicine and so forth.
Strategic policy research in universities
There are quite a number of centres/think tanks outside of FAS that may be affiliated to other university departments researching strategic policy at the macro and/or regional level with recommendations that may have far-reaching implications for the agricultural sector. Very often, these reports are submitted directly to key policy ministries such as finance and planning, or to the president’s office. NARIs may sometimes be consulted on such reports, but since they operate directly under the ministry of agriculture, they may be constrained in the way they respond to recommendations; this may have a serious negative impact on the agricultural sector. FAS and other university departments could play a useful role in such situations since they are relatively independent and can comment more objectively on such recommendations.
Institutional mechanisms for FAS to collaborate in capacity building and in R&D efforts
NARIs/NAROs in the ten countries in the ECA region established ASARECA in 1994. Administratively, NARIs/NAROs fall under the ministries of agriculture. The founding ASARECA CD was mindful of the fact that FAS in the region have a critical role to play not only in training the human resources required for agricultural development but also in the R&D efforts of the region. CD was also aware that its sister organization SACCAR had a very active Committee of Deans of their FAS, which had developed a long-term regional strategy for training professional manpower for the agricultural and natural resources sector and a protocol for student and staff exchange (Rukuniet al.1990; Rukuniet al.1994; ASARECA1997). However, it also noted that, with the exception of South Africa, which had joined SADC in 1995, most of the other countries had only one FAS and one NARO/NARI in that region. On the other hand, most of the other countries had more than one NARI and more than one FAS, for example, Kenya had more than five FAS in 1995,while Tanzania had four NARIs, thus making it difficult to follow the SACCAR model.
It should be appreciated that NARIs report to ministries of agriculture, while FAS report to ministries of education–which makes it difficult in many cases to plan and implement joint work even at the national level as each ministry normally prefers to exercise hegemonic control over the institutions under it. The situation becomes even more complex at the regional level, where there is no regional political body or
135The role of universities and their strategic partners in attaining food security in the ECA region in the 21st century

authority over the institution; for example, SACCAR was under SADC, which had its own governance structure with the Summit of Heads of State at the apex, while ASARECA did not have a similar political authority over it. Though higher education was not one of the sectors included in the regional programmes of SADC, training of professional manpower for the agricultural and natural resources sector was a core area of the SACCAR mandate and was approved by the SADC Summit in 1987.
ASARECA has largely remained a NARO-dominated organization since its establishment in 1994 and it focuses mainly on agricultural research. The World Bank managed SPAAR-facilitated consultations with key stakeholders in the ECA region, which culminated with the approval of FFA for agricultural research in the region, and provided the institutional conceptual framework upon which ASARECA was established. The main objectives of FFA and ASARECA were to facilitate the establishment of improved structures, procedures and methodologies for national agricultural research programme planning, priority setting and review in addition to integrating the available research capacity in all institutions (including FAS) into a consolidated national programme. In essence, ASARECA was being established to facilitate the formation of a true NARS at the national level(IBRD 1995).
Both the ASARECA strategic framework of 1997 and the strategic plan of 2007–2016 emphasized the importance of the research system to operate as a reliable system at the national level. Indeed, the current ASARECA Strategic Plan for 2007 to 2016 clearly states that ….ASARECA will succeed in its mission through performing the following core functions: among others …(8) Make NARS operate as (a) true system at the national level(ASARECA 2007). At the same time, ASARECA recognizes that it is an association of NARIs. It is, therefore, apparent that while ASARECA recognizes the need to get the NARS operating at the national level, there are no NARS operating in any of the ten countries. Most of the strategic plans for the different programmes do make reference to NARS, but, in practice, what they really mean are NARIs, and none of the countries have a consolidated national agricultural research programme.
From the outset, it was envisaged and it is still the case today that, NARIs and FAS would drive the consolidated national agricultural research programme. The CGIAR centre, ISNAR, was then the main partner of ASARECA in this task. However, ISNAR was dissolved in 2002
when a lot remained to be done in all the countries towards reaching a consolidated national agricultural research programme, especially one which includes the work of NARIs and FAS with different national institutions experimenting with different institutional frameworks. It is, therefore, recommended that ASARECA should, as a matter of priority, initiate a programme for strengthening the national institutional framework so as to have well-coordinated and consolidated agricultural research programmes, starting with the work of NARIs and FASs. ASARECA could partner with other institutions with experience in institutional building in developing the conceptual framework for the programme as well as other details.
The main task of universities and hence FAS is human resources development, primarily through formal undergraduate as well as post-graduate degree and diploma programmes and through short-term continu-ing education courses, attachment of staff to other/advanced institutions for capacity building and sab-baticals. In most countries of the region, these activities are overseen by the ministries of higher education, with minimal interaction with the ministries of agriculture. The former provide the recurrent and development budgets for these programmes, unlike in a few countries, where a major transformation has occurred and where the ministries of agriculture play a big role in developing and implementing the FAS programmes, for example India, USA, and The Netherlands. Further, while it has been acknowledged that development of human resources is critical to the agenda of feeding the region in the 21st century, it is not apparent from its strategic plan that ASARECA intends to get involved directly with what FAS are doing in this area. ASARECA needs to take a decision on the level of its involvement first.
It is also apparent that FAS in the ECA region do not have a region wide forum where they can meet to discuss the issues related to human resources development in the region. From the 1970s to the mid-1980s,the Association of Faculties of Agriculture in Africa(AFAA) provided this space. It was partially supported by FAO although its secretariat was wholly financed through contributions from member faculties. It was quite active, and organized bi-annual conferences, where the deans discussed issues of mutual interest. However, it ceased to exist since the mid-1980s largely due to the effects of SAP on member faculties. The emergence of SROs such as SACCAR, with its active Committee of Deans, in the mid 1980s may also have contributed to the demise of AFAA.
136 First ASARECA General Assembly, Volume 2

However, two regional organizations have been established recently, which provide regional oversight and coordination on some of the activities of FAS in parts of the ECA region. The first of these is RUFORUM, which was established for capacity building. It is a consortium of 29 universities in the eastern, central and southern Africa region and was established in 2004 with a mandate to oversee graduate-level training and networks of specialization in the Common Market for Eastern and Southern Africacountries. The second is IUCEA, which was established in 1980 by Kenya, Uganda and Tanzania to foster cooperation between the universities in the three countries. Since 1999, IUCEA has been formally linked with EAC, which now includes the three countries plus Burundi and Rwanda, which joined in 2005. Thus RUFORUM concentrates on graduate-level activities and innovation related to rural development in the wider eastern, central and southern Africa region, while the IUCEA focuses on university-wide activities in the five countries of EAC.
Opportunities for ASARECA• ASARECA needs to explore the possibility of
using the institutional infrastructure that has been established by both RUFORUM and IUCEA to foster and develop regional programmes and projects in the ECA region on capacity building as well as R&D to be implemented by FAS. The main issue of concern to some, if not all members, of ASARECA may be the lack of congruency between countries covered by ASARECA and those covered by the two organizations–RUFORUM covers countries from northern Africa to southern Africa, while IUCEA covers only the five EAC countries as opposed to ASARECA, which specifically covers 10 countries in the region. This is nevertheless an option that needs to be seriously considered.
• ASARECA could consider establishing a Committee of Directors as was done in southern Africa in the 1980s–1990s to serve as a sub-committee of its board for handling all matters related to HR development as well as collaboration and coordination of the R&D work undertaken by FAS in the region. This is, of course, subject to the option being possible under the current governance instruments of ASARECA.
• ASARECA could start a programme to coordinate all its work-plans and activities with FAS on the understanding that the latter will contribute to the programme and that it will evolve within a specified time frame into an Association of Faculties of Agriculture in Central and Eastern
Africa (AFACEA).The Association would then handle the coordination of all the HR development activities as well as those of R&D handled by FAS in the region. This has the advantage of allowing FAS to establish their own organization like AFAA, which should be financially possible if they adopt a low-cost mode of operation. They may also be able to elicit support from the ministries of education in addition to agriculture as well as from other agencies like FAO, UNESCO and UNIDO. They have a precedent in RUFORUM, which started initially as a programme of the Rockefeller Foundation before evolving into an autonomous organization with its own governance structures.
All the above options need to be considered: (i) programme within ASARECA to develop true NARS, starting with NAROs and FAS; (ii) partnership with both RUFORUM and IUCEA; (iii) establishment of a Committee of Deans of FAS as a Committee of the Board of ASARECA; (iv) and facilitate creation of an association of FAS in the region. An integrated and well-coordinated programme will go a long way in establishing food security in the region.
Conclusions
Technical and human resources play a critical role in not only increasing agricultural productivity and overall production, but also in transforming the agricultural sector to meet the challenges of feeding the rapidly increasing population of the ECA region in the 21st century. Unlike in the 20th century, when about 70% of the population was rural, and in most cases these rural dwellers produced their own food, the population, during a significant part of the 21st century, will be urban-based and rely on food produced by a declining and ageing rural population. The agricultural sector faces the challenge of not only increasing on-farm food production, but also ensuring that the food produced is harvested, processed, transported and marketed to the consumer. The demographic and socio-economic challenges require that the sector transform from one dominated by small-scale subsistence farmers to one dominated by small and medium-scale commercial farmers. The public and private components of the agricultural sector will require different types of human resources if they are to respond to these challenges. The responsibility for producing the required human resources falls on FAS in the region.
It is now over 60 years since the first two FAS in the region were established at Makerere and Gordon
137The role of universities and their strategic partners in attaining food security in the ECA region in the 21st century

University Colleges in Uganda and Sudan respectively. Since then, over 100 FAS have been established in the region and have produced thousands of graduates, who have hitherto been employed largely by the public sector as well as the NGOs. In the 21st century, FAS will have to shift the focus of its programmes to respond to the changes occurring in the agricultural sector as well as the overall economies of the region. Further, its role in the agricultural R&D efforts at the national and regional levels will need to be better planned and implemented. It efforts will also need to be coordinated with what is being done by NAROs/NARIs so as to optimize the utilization of human resources employed by the two systems. Also, there will be a need to develop new mechanisms to facilitate enhanced linkages between FAS and NAROs/NARIs at both the national and regional levels.
There is no doubt that the ECA region, which in 2008 employed over 4900 fte agricultural research scientists (compared to 5376 in Brazil and 16700 in India in 2006)(BeintemaandStads2011), has to enhance its coordinating mechanisms at the national and regional levels to better plan and implement the research effort. This will increase the efficiency and effectiveness of the entire system. Likewise, the whole issue of human resources development requires in-depth consideration, especially with regard to the extent and level of ASARECA involvement in the under-graduate and post-graduate education and training activities of FAS. This becomes all the more necessary since its mission statement states: … Enhance regional collective action in agricultural research for development, extension and agricultural training and education to promote economic growth, fight poverty, eradicate hunger and enhance sustainable use of resources in Eastern and Central Africa… (ASARECA2007).
The different options presented in this paper should, hopefully, stimulate debate at the ASARECA Assembly Conference and lead to concrete recommendations and decisions for consideration by the ASARECA governance system.
References:
Adams N. 1988. A new plan for Africa: Development agencies should think big. New Scientist.
[ASARECA] Association for Strengthening Agricultural Research in Eastern and Central Africa. 1997. Along-term strategic framework for regional agricultural research for Eastern and Central Africa. ASARECA, Entebbe, Uganda.
[ASARECA] Association for Strengthening Agricultural Research in Eastern and Central Africa. 2007. ASARECA strategic plan 2007–2016: Agricultural research-for-development in Eastern and Central Africa. ASARECA Secretariat, Entebbe, Uganda.
[ASARECA] Association for Strengthening Agricultural Research in Eastern and Central Africa. 2009. Strategic plans for the eight ASARECA programmes. ASARECA Secretariat, Entebbe, Uganda.
[ASTI] Agricultural Science and Technology Indicators. IFPRI/FAO Website http://www.asti.cgiat.org.
Baker D. 1992. The inability of farming systems research to deal with agricultural policy. ODI Agricultural Administration (Research & Extension) Network Paper No. 35. Dec. 1992.
Beintema NM, Pardey PG, Roseboom PJ. 1998. Educating African researchers: A review of the role of African universities. EPTD/IFPRI Discussion Paper No. 35.Washington D.C.
Beintema N and Stads G J. 2011. African agricultural R & D in the new millennium: Progress for some, challenges for many. IFPRI/ASTI, Washington D.C /Rome, Italy.
Bonnen JT. 1986. A century of science in agriculture: Lessons for science policy. Amer. J. Agric. Economics 68: 1065–80.
-------------1998. Agricultural development: Transforming human capital, technology and institutions. In Eicher & Staatz, eds. (1998) (see below).
Borlaug NE. 1986. Accelerating agricultural research and production in third world countries: A scientist's viewpoint. In J. of Agriculture & Human Value Summer: 5–14.
Borlaug JT and Doswell CR. 1995. Mobilizing science and technology to get agriculture moving in Africa. Dev. Policy Review 13, 2: 115–129.
Castillo GT. 1992. Sustainable agriculture: In concept and in deed". ODI: Agricultural Administration (Res. &Ext .) Network Paper No. 36: December 1992.
Christy RD and Williamson L. 1992. A century of service: Land-Grant Colleges and Universities, 1890–1990. Transaction Publishers, USA.
Eicher CK and Baker BC. 1982. Research on agricultural development in Sub-Saharan Africa: A critical review. MSU. International Dev. Papers No.1 1982. East Lansing, Michigan 48824.
Eicher CK. 1989. Sustainable institutions for African agricultural development. ISNAR Working Paper No. 19: February 1989: ISNAR, 2509 AJ The Hague, Netherlands: 38 pgs.
138 First ASARECA General Assembly, Volume 2

Eicher, C.K. 1999. Institutions and the African farmer. CIMMYT Distinguished Economist Lecture, Mexico, March 1999. 64 pp.
Eicher CK and Staatz JM. 1998. International agricultural development: Third edition. The John Hopkins University Press, Baltimore.
Flaherty K. 2011. Research officer, ASTI/IFPRI – FAO, Rome. Personal Communication Oct/Nov 2011.
Gajendra Singh. 2011. President, Indian Society of Agricultural Engineers [ISAE] (Personal communication, February 2011).
[IBRD] International Bank for Reconstruction and Development. 1993 . A strategy to develop agriculture in Sub-Saharan Africa and a focus for the World Bank. Ed. KM Cleaver. World Bank Technical Paper No. 203.
Lele U and Goldsmith AA. 1989. The development of national agricultural research capacity: India's experience with Rockefeller Foundation and its significance for Africa. In MADIA Discussion Paper 2: World Bank Washington, DC.
Mrema GC. 1995. Higher education in agricultural sciences and entrepreneurial skills in Sub-Saharan Africa: A critical review, In Mrema and Woodend (1995) (see below).
Mrema GC, Sharp J, Shute J, Siemens L, Wanchinga DM. 1990. Strengthening agriculture faculties in the SADCC region: Report of a CIDA/SACCAR Design Mission. Centre for Food Security, University of Guelph, Ontario, Canada.
Mrema GC and Woodend JJ (eds). 1995. Higher education and training in agricultural sciences and the private sector: Experiences from the SADC countries. SACCAR, Gaborone.
Mrema GC, Baker D, Kahan D. 2008.Agricultural mechanization in sub-Saharan Africa: Time for anew look. GSF Occasional Paper No.22.FAO, Rome, Italy.
Rukuni M, Mrema GC, Mphuru AN, Ngwira T, Makhambera P, Mbewe D. 1990. Along-term strategy for training of professional manpower for the agriculture and natural resources sector in the SADCC region: 1991–2010. SACCAR, Gaborone, Botswana.
Rukuni M, Mrema GC, Zamchiya DM, Zinyemba RM. 1994. Report of a consultancy on student and staff exchange in SADC faculties of agriculture, forestry &veterinary medicine. SACCAR/CIDA - Gaborone, Botswana.
Schutz T W. 1998. Investing in people. In p. 329–338. Eicher and Staatz, eds .
Singh G. 2009. Mechanization investments in India and lessons for Africa. Paper presented at Round Table Meeting of Experts on Investments in Agricultural Mechanization in Africa, organized by FAO & UNIDO Arusha, Tanzania 3–5 June 2009.
The World Bank. 2009. Awakening Africa’s sleeping giant—Prospects for commercial agriculture in the Guinea Savannah Zone and beyond. The World Bank, Washington, D.C. 236 pp.
[UEA] University of East Africa. 1970. University of East Africa: Calendar (1970): University Office: Ibadan, Nigeria.
[UNESCO] United Nations Educational, Scientific and Cultural Organization. 1963. The development of higher education in Africa. UNESCO, Paris.
White R and Eicher CK. 1999. NGOs and the African farmer. MSU Staff Paper No 99-01, East Lansing, USA website <http/agecon.lib.umn.edu/msu.html>.
139The role of universities and their strategic partners in attaining food security in the ECA region in the 21st century


Sub-theme III
Advances in research for development: ASARECA success stories

Summary
To improve the availability of healthy seed potato in eastern and central African (ECA) countries, where more than 95% of mostly poor quality seed potatoes are sourced from the farmers’ own previous harvests or markets or neighbours, two technologies, namely seed-plot technique (SPT) and positive seed selection (PSS), were validated and promoted through farmer-learning fora in Kenya, Uganda and Burundi. Noticeable improvements were made in the quality and availability of seed potato to small-scale farmers. The SPT achieved 2.5 to 3 times higher productivity for bacterial wilt-free seed potato and required about 50% less land to meet on-farm seed tuber needs than under conventional ware production systems. In addition to meeting their own on-farm requirements, some farmers started producing high quality seed potato in larger seed-plots for sale to others in their neighbour-hood. Additionally, the enthusiasm to utilize SPT spilled over to the setting up of seed-plots for multiplication of planting materials of other vegetatively propagated crops such as sweet potato and arrowroot as was the case in Kenya. On-farm ware potato yields under the PSS prac-tice were at least 30% higher than in fields where farmers obtained seed potato from ware plantings with no regard to the health status of the mother plants. Farmers who embraced and applied this technology effectively benefited by making potato farming more commercial; they also became sources of high quality seed potato for other farmers. The role that the two technologies played in improving the availability of high quality seed potato was further strengthened by linking farmers to sources of starter seed potato. In particular, more farmers became familiar with the processes employed by research insti-tutions and some private establishments to generate certified and clean seed potato, including those producing mini-tubers through aeroponics technology. Through the training, farmers were enabled to safeguard seed potato quality by protecting the plants against disease-causing agents such as Ralstonia solanacearum and other viruses. They took intensive care of their potato plots, especially those that grew seed for subsequent planting.
Key words: seed potato nursery, getting the best, self-sustaining
Introduction
Potato (Solanum tuberosum L.) is one of the major staple crops in the eastern and central Africa (ECA) sub-region and its importance continues to rise due to increased urbanization and uptake of processed potato products such as French fries (chips) and crisps. Demand for potatoes in sub-Saharan Africa is projected to have increased 250% between 1993 and 2020, with an annual growth in demand of 3.1% and growth in area under production at 1.25% a year (Scott et al. 2000). This increase will definitely come with its share of challenges that need to be addressed. Potato production is best done in the highland areas (altitudes of 1800 m and above), where temperatures are optimal for tuberization. Such areas are characterized by high population density, which poses a serious challenge to provide adequate food alongside the need for efficient income-generating enterprises for the masses. The potato fits well into the intensive smallholder systems that are predominant in the highlands, where farmers own parcels of land measuring between 0.25 and 5 hectares. It, therefore, stands out as the most important food and agricultural commodity to overcome these challenges. The crop, which has a protein–carbohydrate ratio that is higher than most cereals and even higher than other tuber and root crops, surpasses alternative crops in the highlands through its high yield potential and market prices.
The knowledge that the potato is the ideal crop due its realized and potential contributions to food security, poverty eradication and economic development in areas where it is grown, has resulted in more farmers taking up potato production. The area under the crop has continued to increase steadily over the years. From only 100,000 ha in 1994, it has increased to 240,000 ha in 2004 in the Great Lakes region: Rwanda, Burundi, DR Congo and Uganda (figure 1). The crop is ranked sixth in Burundi, fourth in Kenya and tenth in Uganda, and is also widely grown in other ASARECA countries, including Rwanda, DR Congo, Ethiopia and Madagascar. At the turn of the century, there were at least 89 varieties in the ASARECA sub-region, with a total acreage of 295,000 ha under improved varieties.
10. Overcoming seed potato quality constraints to tackle food insecurity and poverty in Eastern and Central Africa in the 21st century
Z.M. Kinyua, A. Bararyenya, E. Schulte-Geldermann, B.O. Obura, I.N. Kashaija, S. Tindimubona, F. Opio, D. Oyena, I. Rwomushana, W.M. Muriithi, J. Kinoti, P. Namugga, G.
Kimoone, M. Inamahoro, N. Niko, and P. Ndayihanzamaso
Corresponding author e-mail: [email protected]
142 First ASARECA General Assembly, Volume 2

Despite the increasing demand for potato and the great interest that farmers have in potato farming, the crop’s productivity has been declining owing to insufficient quantities of healthy, high-yielding seed of desirable potato varieties. It is recognized that potato planting materials contribute about 40% of potato production input costs. Unfortunately, more than 95% of seed potato is sourced from the farmers’ own harvests or markets or neighbours. Such tubers are often of substandard quality owing to latent infections by Ralstonia solanacearum (the bacterial wilt causal agent), viruses and other tuber-borne pathogens. Consequently, these seed quality-related constraints, in addition to other factors, lead to very low on-farm yields, which are frequently below 10 tonnes/ha in comparison to 40–60 tonnes/ha achievable under improved production circumstances (Lung’aho et al. 1997; Raemaekers 2001); for instance, the average yields in Burundi, Uganda and Kenya are 2.61 tonnes/ha, 7.0 tonnes/ha and 7.5 tonnes/ha, respectively (FAO database). Conversely, increasing the availability of high quality seed potato to farmers, coupled with enhanced management of tuber-borne diseases to reduce quality deterioration, would be a major step towards increasing potato yields and making the potato value chain more competitive.
Interventions to overcome constraints to availability of quality seed potato
Technological platforms: Together with other regional and international research-for-development agencies, ASARECA has supported research-based consortia that have endeavoured to bridge the gap in quantity and quality of seed potato that is available to farmers in
the ECA sub-region. Through the Quality Seed Potato Project, ASARECA has encouraged the validation and promotion of two technologies, namely the seed-plot technique (SPT) and positive seed selection (PSS), among small-scale farmers under various potato production scenarios.
A regional team drawn from Kenya Agricultural Research Institute (KARI, which is the lead institution), National Agricultural Research Organization (NARO), Institute des Sciences Agronomiques du Burundi (ISABU), International Potato Centre (CIP) and Uganda National Seed Potato Association (UNSPPA) implemented the project activities through farmer groups in collaboration with local agricultural extension and administrative staff in Burundi, Kenya and Uganda. In each country, farmer groups were selected or formed at similar administrative unit levels (referred to as commune in Burundi, location in Kenya and sub-county in Uganda). Twelve farmer groups hosted the testing of the technologies in Burundi; five and ten farmer groups in Kenya and Uganda, respectively, provided the necessary platforms to showcase and adapt the technologies.
At all the sites, the project team provided training to farmers and extension personnel during selected crop cycle stages and backstopped farmers by supplying clean seed potato tubers, fertilizer and pesticides initially for planting. On their part, farmers provided land and labour for field operations (weeding, hilling-up, pesticide application, dehaulming, harvesting, sorting and grading). In most cases, the land belonged to individual farmers who had agreed to host the experiments for their groups. In some
Figure 1: Potato area harvested (left) and potato production (right) in the ASARECA sub-region during the period 2005–2009 (Source: FAO database).
143Overcoming seed potato quality constraints to tackle food insecurity and poverty in ECA in the 21stcentury

cases, however, some farmer groups utilized land belonging to institutions such as churches and schools, whilst in other cases, the groups rented land for the purpose of hosting the trials as learning platforms. The ‘potato nursery’ approach: SPT utilizes the principle of maximizing tuber production per unit area of limited, disease-free land through high-density planting in seed plots (synonymous with a ‘nursery’). This is achieved by planting well-sprouted seed potato tubers on selected disease-free land at a spacing of 30 cm by 30 cm and nurturing the plants up to maturity to obtain seed for the following season as opposed to obtaining seed from ware potato fields where plants are spaced more widely (70 cm x 30 cm in Uganda; 75 cm x 30 cm in Kenya; 80 cm x 30 cm in Burundi). Carefully selected tubers obtained from seed plots can then be planted at the usual spacing for ware potato production, while, at the same time, reserving some for the establishment of more seed plots.
In Kenya, 11 seed plot demonstration sites were established and used for training (3 by Kianthumbi Farmers’ Group, 3 by Mutethia Mbuyene Women’s Group, 2 by Kibaranyaki Focal Area Group, 2 by Muchicha Horticulture Group, 1 by Marathi Focal Area Group). In Uganda, 10 group-learning demonstration sites were utilized, while 28 seed plots were established in Burundi. To explore the possibility of improving seed potato production under SPT, trials were carried out in Kenya to determine the effect of enhancing plant nutrition through inorganic fertilizer application. This was done by applying Diammonium Phospate (DAP) fertilizer (18: 46: 0) and Mavuno Planting fertilizer (10: 26: 10) in seed plots at rates based on nitrogen supply (0, 45, 90 kgN/ha). The crop variety Asante was used for three consecutive seasons hosted by Marathi Focal Area Group.
In the course of each season, monitoring and recording were carried out jointly by the project teams, partici-pating farmers and extension personnel for pests and diseases as well as general crop status. At each of the demonstration sites, seed quality and yields obtained from seed plots were compared with those obtained from the farmer practice plots. Simplified result analy-ses were undertaken after each season to enable farmers perceive the intended messages. Each member of the group was encouraged to establish her/his own seed plot as a demonstration plot for other farmers.
The ‘select-the-best’ approach: The PSS technique selects the best plants in a ware field (planted at the usual spacing) as mother plants to provide seed for the following season coupled with the removal and disposal
of diseased plants as soon as they are identified. The process of selecting seed potato under this technology starts with the identification and marking of healthy-looking potato plants (using pegs) when the first flowers appear on the crop followed by checking the health status of the pegged plants 2 weeks later and pegs that exhibit disease symptoms are removed from the plants. Ultimately, the plants that remain pegged are harvested individually, ensuring that plants with few tubers or those with malformed tubers are discarded. The resulting tubers are stored safely as seed. Tubers obtained from plants that are not positively selected in the target field are only used for home consumption or for sale as ware produce.
At each trial, the field was divided into two plots, one for PSS and the other for farmer’s practice. In the former plots, unhealthy plants were removed (rogued) to prevent the spread of diseases to neighbouring plants. Subsequently, the best and healthiest plants were identified and marked by pegging in a field before crop senescence, followed by harvesting them separately (starting with the healthy plants selected) to provide seed for the next season. In the practice plots, plants were allowed to mature and were harvested altogether, followed by random selection of seed from the bulked harvest to obtain seed for the next season.
Yields and bacterial wilt infection level were compared in the seeds from the two plots. Laboratory analyses were carried out on sampled tubers using NCM-ELISA for Ralstonia solanacearum. Data was subjected to analysis of variance (ANOVA) and means separated using the least significant difference (LSD).
Lessons learned
Seed-plot land productivity and tuber health status: SPT ably provided a platform through intensive management of bacterial wilt and other tuber-borne diseases, and farmers observed critical field sanitation procedures to implement it. Through this technology, a 2.5 to 3 times higher land productivity for bacte-rial wilt-free seed potato was recorded than under conventional ware production systems. Although the technology was tested under a wide range of production circumstances (different soil and weather conditions as well as varied farm conditions), the results were similar to earlier findings (Kinyua et al. 2001a; Kinyua et al. 2001b). This provided further proof that the technology could be utilized to ease the persistent lack or shortage of clean planting materials in the ECA region. Farmers greatly appreciated SPT
144 First ASARECA General Assembly, Volume 2

since it was a self-sustaining on-farm seed potato production system that did not demand that they purchase new seed every season, thus reducing their production costs.
This increased land productivity translated into a 50% less land requirement to meet on-farm seed tuber needs than under conventional ware production systems. This led to more land being available for rotation in prepara-tion for the establishment of seed-plots to provide seed for subsequent planting. Commonly, farmers preferred putting such land under cabbage, carrots or beans.
The exposure of the farmer groups and their experience of the improvements made in availability of good quality seed potato, prompted farmers to use SPT more extensively, with some deliberately producing more than their own seed potato needs for the purpose of selling to other farmers. In Kenya, in particular, four farmer groups engaged in joint commercial seed potato production through SPT. Other individual farmers have also started establishing seed plots on their own, borrowing from the lessons learnt at the demonstration sites. A notable development was the adaptation of SPT for bulking of planting materials of other crops, as was witnessed for sweet potato and arrowroot in Kenya.
The technology has been successfully adopted by farmers in four potato-producing areas in Kenya (Kianthumbi, Muchicha, Mutethia Mbuyene and Kibaranyaki), three areas of Burundi (Buyengero, Mugongomanga and Muruta) and three districts in Uganda (Kabale, Kisoro and Kanungu). The technology has already found favour with some of the partners in Uganda, especially the local government under the NAADS programme, and, consequently, it has spread to other potato-growing communities.
Seed plot performance enhancement through fertilizer application: Potato tuber yields significantly increased through the application of higher levels of Mavuno and DAP fertilizer (90 kgN/ha) in comparison to the lower levels of fertilizer application (45 kgN/ha) or no fertilizer application (table 1). The observed increase in produce in response to fertilizer application at 90 kgN/ha could be attributed to an increase in the stolon number through its effect on gibberellins biosynthesis in the potato plant. Kumar and Wareing (1972) have reported about the role of gibberellins in regulating stolon number through stolon initiation. Nitrogen, Phosphorus and Potassium (NPK) fertilizers are known to affect tuber formation in potato by influencing the activity and phytohormone balance in the plant, especially with regard to the levels of gibberellic and abscissic acids and cytokinins (Amzallag et al. 1992). Nitrogen application to potatoes before tuber initiation has also been reported to increase the number of tubers per plant and mean fresh tuber weight (Kanzikwera et al. 2001). Various other researchers have reported significant tuber number increase in response to NPK application (Sommerfeld and Knutson 1965; Gunasena and Harris 1969; Sparrow et al. 1992; Lynch and Rowberry 1997).
When the two types of fertilizer were applied, Mavuno induced the production of significantly more potato tubers per unit area than did DAP at similar rates (table 1). A closer examination of tuber size disaggregation showed that the former yielded more tubers of sizes 45–55 mm while the latter yielded more tubers of sizes 35–45 mm (figure 2).
This observation was similar to the findings of Sommerfeld and Knutson (1965) and Sharma and Arora (1987), who showed that excessive use of DAP fertilizers is usually associated with reduced tuber
Table 1. Effect of level of fertilizer application on the potato yield parameters
Means for yield Zero Mavuno 90 DAP 90 Mavuno 45 DAP 45
Number of tubers
237.10c 368.39a 327.61b 327.40b 302.25b
Tubers weight (kgs)
9.79c 17.25ab 17.52a 15.71ab 15.19b
g/tubers 41.38c 46.88bc 53.66a 48.11ab 51.74ab
Tubers /m2 43.89d 68.16a 60.47b 60.57b 54.90c
Tubers/plant 6.41a 6.96a 6.33a 7.12a 6.39a
Means followed by the same letter in the same row are not significantly different at p<0.05, according to Duncan’s Multiple Range Test
Figure 2. Effect of fertilizer type and rate of application on tuber sizes (Marathi Focal Area Group seed plot-fertilizer Regime Trial). Tubers were graded on the basis of diameter ranges of <25, 25–35, 35–45, 45–55 and >55mm.
145Overcoming seed potato quality constraints to tackle food insecurity and poverty in ECA in the 21stcentury

weight, sizes and numbers by hastening the maturation period. Though phosphorus has a positive effect on tuber yield, the overall yield increase due to DAP application was smaller than the yield increase due to Mavuno. This could probably be explained by the fact that DAP leads to faster closure of canopy and shortens the growing period (Sommerfeld and Knutson 1965). The other possible reason is that the applied DAP may not be available to the plants at a rate similar to the N fertilizer because of the problem of soil fixation, which is necessary to satisfy the soil’s demand for phosphorus. These results also demonstrated low production of seed potato in seed-plots without fertilizer application; and the number of tubers produced was low for all sizes. This is supported by the findings of MacKerron and Heilbronn (1985), indicating that potato tuber yield is directly dependent on the supply of N, P and K.
Getting the best through positive seed selection: Yields obtained in potato fields where PSS was practiced were about 30% higher than in fields where farmers obtained seed potato from ware plantings with no regard to the health status of the mother plants (figure 3).
The improved yields from the PSS practice were coupled with high quality of the produce, making them attractive for use as seed. In particular, the levels of tuber-borne diseases such as bacterial wilt and viruses were significantly reduced in comparison to the levels in usual farmers’ practice fields (figure 4).
Where the PSS technique was properly implemented, dramatic results were obtained. Yield increases from 2.8 tons (worth aboutUS$1150) to over 7.5 tons (worth over US$ 3000) were recorded on some 1-acre plots within a span of two seasons, much to the jubilation of the beneficiary farmers (personal communication, Mrs. Christine Nashuru, a farmer in Transmara, Kenya, with only recent experience in potato farming). This
has been a selling point of the technology in that the demand for seed from such farmers can hardly be met once recognized as producers of high quality seed.
Training in PSS has produced noticeable improvement in the outlook of potato farming, especially among small-scale farmers who perceive the purchase of certified or quality-declared seed potato as unaffordable. The knowledge and skills acquired has enabled farmers to maintain the quality of their seeds from their own seed stocks, thereby lowering the cost of buying seed potato in the long run. The early adopters were able to make a quick head start in commercial seed production: in particular, 6 farmers (5 females and 1 male) from the trained groups in Uganda registered with the UNSPPA as recognized seed potato producers. The skills related to PSS cultivation continued to be disseminated among farmers by using the CIP Select-the-Best Manual (Gildermacher et al. 2007), with additional assistance from agricultural extension personnel.
General outlook
The success of both the SP and PSS techniques in maintaining and improving the quality of seed potato that is available to farmers is highly dependent on regular training to impart or refresh the necessary knowledge and develop effective skills. This should be coupled with appropriate linkages to agricultural extension personnel and market outlets for any surplus produce. The role played by these two technologies in improving the availability of high quality seed potato should be further strengthened by linking farmers to sources of starter seed potato. In particular, farmers would greatly benefit from linkages involving public institutions generating certified and clean seed potato and also private establishments such as those producing mini-tubers through aeroponics technology. The emphasis
Figure 3. Comparison of yields obtained after using seed potato from positive seed selection and farmers’ practice plots.
Figure 4. Comparison of bacterial wilt and virus disease levels under positive seed selection and farmers’ practice cultivation.
146 First ASARECA General Assembly, Volume 2

on the need to have effective linkages stems from the fact that most seed potato is traditionally sourced from informal systems, which are unaware of the merits of planting high quality seed potato among farmers, and it contributes to a low effective demand for seed from formal systems. Increasing the effective demand for high quality seed potato from the formal seed potato systems coupled with more investment by interested parties would lead to establishment of more sustainable seed potato production and delivery systems.
Technical backstopping obtainable from research institutions and quality assurance agencies would also come in handy in improving the quality of seed potato reaching farmers, particularly those involved in seed multiplication. In particular, use of quality assessment procedures such as the nitrocellulose membrane enzyme-linked immunosorbent assay (NCM-ELISA) (Priou et al. 1999) and double antibody sandwich (DAS-) ELISA (Salazar 1979) as well as the detection of Ralstonia solanacearum, the bacterial wilt pathogen in soil and other media used for seed potato production, should be routine. The ECA sub-region has invested in these procedures, and they are commonly used, particularly in Kenya, to reduce the risk of infection of potatoes by tuber-borne disease-causing agents.
Specialized seed multipliers need to execute functions such as seed quality assessment, and market under an umbrella organization for purposes of produce traceability and self-regulation. UNSPPA operates through this principle and collaborates closely with NARO. These ideas are already taking root in parts of Kenya, where seed potato quality is a big challenge.
References
Amzallag GN, Herner HR, Poljakott-Mayber A. 1992. Interaction between mineral nutrients, cytokinin and gibberellic acid during growth of sorghum at high NaCl salinity. Journal of Experimental Botany 43: 81–87.
Gildermacher P, Demo P, Kinya P, Wakahiu M, Nyongesa M, Zchocke T. 2007. Select the best: Positive selection to improve farmers saved seed potatoes. Trainers’ Manual, CIP, Lima.
Gunasena HPM, Harris PM. 1969. The effects of CCC and nitrogen on the growth and yield of the second early potato variety. Craig’s Royal Journal of Agricultural Science 73:245 –259.
Kanzikwera RC, Tenywa JS, Osiru DSO, Adipala E, Bhagsari AS. 2001. Interactive effect of nitrogen and potassium on dry matter and nutrient partitioning in true potato seed mother plants. African Crop Science Journal 9:127–146.
Kinyua ZM, Smith JJ, Oduor GI, Wachira JN. 2001a. Increasing the availability of disease-free potato tubers to small-hold farmers in Kenya. Proceedings of the Seventh Symposium of the International Society for Tropical Root Crops-Africa Branch, 12–16 October 1998, p 494–499. Cotonou, Republic of Benin.
Kinyua ZM, Smith JJ, Lung’aho C, Olanya M, Priou S. 2001b. On-farm successes and challenges of producing bacterial wilt-free tubers in seed plots in Kenya. African Crop Science Journal 9: 279–285.
Kumar D, Wareing PF. 1972. Factor controlling stolon development in potato plant. New Phytology 71: 639 –648.
Lung’aho C, M’makwa C, Kidane-Mariam HM. 1997. Effect of source of mother plant, variety and growing conditions on the production of stem cuttings and subsequent yield of mini-tubers in the Kenyan potato programme. Proceedings of the Fourth Triennial Congress of the African Potato Association, Pretoria, South Africa. p 275–283.
Lynch DR, Rowberry RG. 1997. Population density studies with Russet Burbank potatoes. II. The effect of fertilization and plant density on growth, development, and yield. American Potato Journal 54:57–71.
MacKerron DKL, Heilbronn TD. 1985. A method for estimating harvest indices for use in surveys of potato crops. Potato Research 28:279–82.
Priou S, Gutarra L, Aley P. 1999. Highly sensitive detection of Ralstonia solanacearum in latently infected potato tubers by post-enrichment ELISA on nitrocellulose membrane. Bulletin OEPP / EPPO Bulletin 29:117–125.
Raemaekers RH. (ed.) 2001. Crop production in tropical Africa. Directorate General for International Co-operation (DGIC), Brussels, Belgium.
Salazar LF. 1979. Use of enzyme-linked immunosorbent assay (ELISA) for diagnosing potato viruses. Fitopathlogia 14 (1):1–9.
Scott JS, Rosegrant MW, Ringler C. 2000. Roots and tubers for the 21st century: trends, projections and policy options. Food, Agriculture and the Environment Discussion Paper 31. IFPRI.
Sommerfeld TG, Knutson KW. 1965. Effects of nitrogen and phosphorous on the growth and development of Russet Burbank Potatoes grown in the South-eastern Idaho. American Potato Journal 42:351–360.
Sparrow LA, Chapman KSR, Parsley D, Hardman PR, Cullen B. 1992. Response of potatoes (Solanum tuberosum L. cv. Burbank) to band placed and broadcast high cadmium phosphorus fertilizer on heavily cropped Krasnozems in North-Western Tasmania. Australian Journal of Experimental Agriculture 32:113–119.
147Overcoming seed potato quality constraints to tackle food insecurity and poverty in ECA in the 21stcentury

Abstract
Maize, the most important staple food crop in east and central Africa (ECA), is affected by drought–the single most important abiotic factor responsible for up to 70% maize loss. In 2008, a USD 350,000 project funded by USAID, through ASARECA, was initiated. The project sought to develop and disseminate drought-tolerant engineered maize genotypes adapted to ECA. This was done using genetic engineering approaches of gene up-regulation, under-regulation (silencing) and drought-inducible expression of candidate genes. To date, 15 tropical maize genotypes have successfully been transformed with drought-conferring genes: Annexinp35, Annat1, NHX1, XvPrx2, XvSAP1, IPT, CBF 1, amiRNA1 and amiRNA3. The maize genotypes developed using these genetic engineering technologies are being advanced and evaluated in the glass house at Kenyatta University in preparation for drought-stress experiments and field trials. The genetically engineered maize lines are: Ethiopian open-pollinated variety (OPV) (1), temperate line (1), Sudanese genotypes (8), Tanzanian OPV (1) and International Maize and Wheat Improvement Centre (CIMMYT) inbred lines (5). The research products ready for uptake and utilization include a base sequence of a drought-tolerance gene that has been isolated and cloned, and optimized protocols for regeneration of maize germplasm adapted to ECA specifications. Seventeen partners from around the globe have been identified, who are playing different roles in developing drought-tolerant transgenic maize. Scientists from the region are being trained to undertake research at postgraduate and doctorate levels. To ensure wide availability of drought-tolerant engineered maize genotypes to farmers in the region, more studies on generated maize lines are critical and synergies need to be built to up-scale the utilization of the research findings.
Background and rationale
Maize is the most widely cultivated cereal, covering over 147 million hectares in the world (Karvy COMTRADE Ltd. 2006). It is the third most important food crop for
humans after wheat and rice. It is a staple food crop in east and central Africa (ECA) and is grown on more than 5.5 m ha mostly by small and medium-scale farmers. Maize provides well over 50% of the dietary calories, with a per capita consumption of about 100 kg/year.
Maize productivity has been declining over the years due to a number of biotic and abiotic factors. Drought is the single most important abiotic stress responsible for reduced maize productivity in the arid and semi-arid areas, leading to up to 70% crop loss. This coupled with a lack of suitable varieties that perform well under insufficient and erratic rainfall, significantly reduce productivity of maize, with grain yield of 1.3tons/ha, compared to the potential of over 10tons/ha.
While conventional breeding has produced some success in developing drought-tolerant varieties, com-plementing it with biotechnological tools to introgress drought-tolerant genes into well-adapted varieties has been proven to work elsewhere. This project aims at introgressing genes conferring drought-tolerance through genetic transformation into local varieties that are already popular with the farmers in Sudan, Kenya, Tanzania and Ethiopia.
The general objective was to develop and disseminate drought-tolerant engineered maize genotypes adapted to ECA with the following specific goals: i. Identify, isolate and characterize drought-tolerance
conferring genes to transform maize germplasms adapted to ECA.
ii. Access available drought-tolerance conferring genes to transform adapted maize germplasms in ECA.
iii. Subclone accessed drought-tolerance conferring genes into suitable plant expression vectors.
iv. Optimize tissue culture protocols for regeneration of maize germplasm adapted to ECA.
v. Transform maize for drought tolerance.
11. Genetic engineering of maize for drought tolerance in Eastern and Central Africa
Jesse Machuka1, Richard Oduor1, Steven Runo1, Rasha Adam1, Jonathan Matheka1, Leta Bedada1, Miccah Seth1, Eric Kuria1, Clet Masiga2 and Charles Mugoya2
1Biochemistry and Biotechnology Department, Kenyatta University, P. O. Box 43844-00100, GPO, Nairobi, Kenya
2Agro-biodiversity & Biotechnology Program (AGROBIO), Association for Strengthening Agricultural Research in Eastern and Central Africa (ASARECA), P.O. Box 765 Entebbe, Uganda | Tel: +256-414 321885/320556
148 First ASARECA General Assembly, Volume 2

Methodology
Identification, isolation and characterization of drought-tolerance conferring genes
One gene was identified, isolated and cloned based on the role of Annexin 1 in drought stress tolerance in Arabidopsis (Dorota et al. 2009). These Annexin genes act as targets of calcium signals in eukaryotic cells, and play an important role in plant stress responses. Plants that over express the Annexin gene are more drought-tolerant. Maize Annexinp35 cDNA was isolated from plant tissue according to Kranz et al. (1994). The gene was then cloned into the plant expression vector pCAMBIA1300 and the new gene construct named pCAMBIA-ASAGE35 (the vector was named after ASARECA and GEMADOT project). The gene was then subcloned into pNOV2819 vector for maize transformation.
Access available drought-tolerance conferring genes
The available genes (table 1) for conferring tolerance to drought were accessed in partnership with relevant donors and agencies, such as the Rockefeller Foundation, the African Agricultural Technology Foundation (AATF) and the Public Sector Intellectual Property Resource for Agriculture (PIPRA) initiative, with a focus on drought-stress tolerance in maize. Genes were acquired through a material transfer agreement and the freedom to operate licence between the partner institution and the Department of Biochemistry and Biotechnology, Kenyatta University. The donor institution identified, isolated and characterized drought-tolerance conferring genes from naturally drought-tolerant plants. Molecular and genomic analyses facilitated the discovery of genes involved in drought-stress tolerance. The genes employed include genes encoding functional proteins such as transporters and chaperones as well as those encoding regulatory proteins, such as transcription factors and signalling factors.
Subcloning drought-tolerance conferring genes into suitable plant expression vectors
Eight accessed genes and one isolated gene were cloned into suitable plant expression vectors. The CBF1 gene was obtained from the pCAMBIA-CBF1 gene construct, which has hygromycin (an antibi-otic) resistance gene for selection in plants. Using PCR cloning, the gene was cloned into pNOV-2819, which has PMI gene for plant selection on mannose. The amiRNA PCR genes were subcloned between the ubiquitin promoter and TNos terminator in Ubi/NC1300 vector. The amiRNA expression cas-sette was then removed as a HindIII/ SpeI fragment and subcloned into pNOV2819. Co-transformation vectors containing the selectable marker TDNA and the TDNA for the gene of interest (amiRNA) for the production of plants free of marker genes were constructed essentially using methods described by Sambrook et al. (1989). The IPT gene was obtained in construct carrying the hygromycin resistance gene as a plant selectable marker. The SARK:IPT:NOS expression cassette was sub-cloned into the plant expression vector pNOV2819. This was accomplished by engineering for AscI and HindIII restriction sites on up- and down-stream ends of the expression cas-sette, respectively, through PCR using high fidelity Taq polymerase. The fragment was then ligated into pNOV2819, which had been digested with the same enzymes. Maize was then transformed with this gene. The PMI gene was used as a plant selectable marker with mannose as the selective agent (Negrotto et al. 2000). The Annexin1 gene was removed from the pROK2 vector as a Kpn1/BamH1 fragment and then engineered into the Ubi/NC1300 vector. The Annat1 gene cassette was removed from this resultant vector and ligated to the PNOV2819 vector to form pNOV2819-Annat1. The PMI gene was removed from PNOV2819 as a Sal1/Kpn1 fragment and placed into the pCAMBIA-NHX1 vector. The new construct was named pCAMBIA-NHX1-PMI.
Table 1: Partners who supplied the drought-conferring technologiesPartner Role Institute of Biochemistry and Biophysics, Poland Provision of Annnat 1 Gene expression vectorUniversity of Nevada Provision of NHX1, CBF1 and CBF3 gene expression vectors Syngenta Provision of pNOV2819 plant gene expression vector University of California Provision of IPT gene expression vectorUniversity of Cape Town Provision of XvPrx2, XvSap1 and XvG6 gene expression vectors and promoters Ghent University Provision of amiRNA gene expression vector IOWA State University Provision of PTF102 plant expression vector
149Genetic engineering of maize for drought tolerance in Eastern and Central Africa

Xerophyta genes were harboured in pTF 101.1, which has bar gene as the plant selectable marker. Subcloning of the xerophyta genes into the pNOV2819 vector was achieved by introducing HindIII and PacI restriction sites on the ends of the expression cassettes of the genes. Subsequently, the expression cassettes for XvPrx2, XvSap1 and XvG6 were then singly subcloned between the same restriction sites on the pNOV2819 backbone. The constructs were then immobilized into the Agrobacterium tumefaciens strain EHA101 or LBA4404, which was used to transform immature zygotic embryos of maize.
Optimizing tissue culture protocols for regeneration of maize germplasm
Adapted maize germplasm were obtained from national and regional maize breeding programmes in Ethiopia, Kenya, Sudan and Tanzania, as well as from CIMMYT. The germplasm was bulked in the respective countries, while others were grown at Kenyatta University, where regeneration and transformation experiments were initiated and procedures optimized. Different explants were used for callus initiation, subsequent somatic embryogenesis and regeneration according to procedures already developed by Prof. Jesse Machuka (Rasha et al. 2008, Ombori et al. 2008, Oduor et al. 2006), Dr. Kan Wang at Iowa State University, Ishida (Ishida et al. 2007) and Ames (Frame et al. 2002). Parameters that had been optimized for temperate maize regeneration were varied depending on genotypes to obtain optimal regeneration efficiency for ECA germplasm. Attempts were also made to obtain regeneration from seed calli, leaf disks, and young shoot meristems (Rasha et al. in press). Optimization of regeneration protocols for CIMMYT inbred lines and OPVs from Tanzania and Ethiopia, was achieved using immature zygotic embryos, obtained 14–16 days after pollination depending on genotypes. All media used were based on MS basal salts (Murashige and Skoog 1962) and LS (Linsmaier and Skoog 1965). Immature embryos 1–1.5mm in size were excised from maize kernels under sterile conditions and incubated on callus induction medium (CIM) supplemented with either 1 to 2.5 mg/l 2,4-D and 10 mg/l silver nitrate (AgNO3). In this study, only 2,4-D was used because of its availability, low cost and the effective role it can play in maize embryogenic callus induction. Induced somatic embryos from embryogenic calli were matured in embryo maturation medium amended with 6% sucrose. Plants were regenerated from matured somatic embryos as described by Ombori et al. 2008.
Plantlets were hardened and acclimatized as described by Ombori et al. (2008). Optimization of tissue culture protocols for Sudanese maize was achieved using different sources of explants, which included mature embryos, shoot tips and leaf segments. The protocols were optimized using different concentrations of 2, 4-D ranging between 0 and 10mg/L.
The protocol by Ishida et al. (2007) was also applied to 15 inbred lines obtained from CIMMYT to assess the efficacy of the protocol in promoting plant regeneration from the genotypes.
Transformation of maize for drought tolerance
Several Agrobacterium tumefaciens strains, such as LBA4404 and EHA101, were used. The A.tumefaciens strains contained standard binary vectors with right and left T-DNA border fragments, an origin of replication and a resistance marker gene for bacterial selection. These strains were supplied from Iowa State University and Syngenta. This was possible due to material transfer agreements (MTA) that were signed between Kenyatta University and Iowa State University and between Kenyatta University and Syngenta for the use of vectors for optimization of transformation procedures. The reporter gene constructs that were used were supplied by Iowa State University for protocol development. Various promoters, notably maize double CaMV 35S, CMPS, ubiquitin XvpSap1 and SARK were used to drive genes, including bar, phoshomannose Isomerase and the gus reporter gene. Several ECA adapted maize genotypes were tested to establish their transformability. This was done based on empirical assessment of factors that affect transformation in monocots (Koichi et al. 2003).
Maize ears with immature embryos of appropriate size were harvested between 12 and 16 days after pollination depending on the variety (Ishida et al. 2007). The ears were dehusked and surface sterilized in a tissue culture hood. The top half of the kernels was cut with a sterile scalpel and the embryos excised using a spatula. These embryos were then transformed with different genes for conferring tolerance to drought with the help of Agrobacterium strain EHA101 or LBA4404 and transferred to resting media to form callus. The calli were selected on mannose containing media (Negrotto et al. 2000) and surviving calli regenerated into plants that were hardened according to the protocol by Ishida et al. (2007).
150 First ASARECA General Assembly, Volume 2

Results
Subcloning drought-tolerance conferring genes into suitable plant expression vectors
Eight accessed genes and one isolated gene were cloned into suitable plant expression vectors (table 2).
Table 2: Genes subcloned into plant expression vectors and the vectors developedGene Expression vector developedAnnexinP35 pNOV-ASAGE35Annexinp35 PCAMBIA-ASAGE35Annat1 PCAMBIA-Annat1NHX1 pCAMBIA- NHX1- PMI/CBF1 gene pNOV2819-CBF1AmiRNA3 pNOV2819-Ubi/amiRNA3, pSMF03.1, pSMF03.2,
pSMF04.0amiRNA1 pNOV2819-Ubi/amiRNA1Annat1 pNOV-Annat1XvPrx2 pNOV2819-XvPrx2XvG6 pNOV2819-XvG6IPT pNOV2819-IPT-L-KU-PTL
Optimizing tissue culture protocols for regeneration of maize germplasm
The protocols for regeneration of several tropical genotypes were optimized. Using the procedure described in the materials and methods above, all four Tanzanian OPVs were successfully regenerated with Staha and Situka M-1 being the most regenerable genotypes (Seth et al. in press). Further, five CIMMYT tropical maize inbred lines were evaluated, among which CML216, CML395 and CML442 were highly regenerable (Bedada et al. in press). Among the six Ethiopian maize genotypes evaluated for regeneration ability using MS medium supplemented with four levels of 2,4-D on immature zygotic embryo explants; Melkassa-2, Melkassa-6Q and [CML387/CML176]-B-B-2-3-2-B[QPM] were found to be the most regenerable ones (Bedada et al. 2011).
Among the Sudanese genotypes, IL3 and Hudiba-2 were found to be the most regenerable genotypes, with regeneration frequency of 75.8% and 61.7%, respectively (Rasha et al. 2008).
The protocol by Ishida et al (2007) was identified as useful for obtaining plants from three genotypes obtained from CIMMYT (TL03B 6754A-20 (18), CML 216 and TL03B 6757-68 (13). The protocol was found to promote embryogenic callus formation at a frequency of between 54% and 76 % on the three genotypes. The protocol also promoted regeneration of between three and five plants per callus from the three genotypes.
Transformation of maize with the constructed plant expression vectors
Fifteen maize genotypes were transformed with nine different drought-conferring genes. amiRNA1 construct for silencing of PARP gene was successfully engineered into one CIMMYT inbred line (CML216) using the PNOV2819-amiRNA vectors at a transforma-tion frequency of between 5–11%. Additionally, three CIMMYT inbred lines (TL03B 6754A-20 (18), TL03B 6757-68 (13) and CML 216) have been transformed with co-transformation vectors bearing amiRNA3 gene con-struct for silencing of the maize PARP gene. Using the co-transformation vectors, the average transformation frequencies of 10%, 13%, 15% were obtained for inbreds TL03B 6754A-20 (18), TL03B 6757-68 (13) and CML 216, respectively.
Eight Sudanese maize genotypes (IL3, STR149, Giza-2, PR5655, IL15, IL16, Hudiba-1 and IL43) were transformed with three genes conferring drought stress tolerance (Annat1, Annexin p35 and NHX1) and the transformation frequency ranged between 0.5% and 34.8%.
Two genotypes were transformed with CBF1 gene construct. A188 gave a transformation frequency mean of between 35% and 69%, while the transformation frequency mean of CML 216 ranged from 19% to 39%. One Tanzanian OPV (Staha) and one CIMMYT inbred line (CML144) have successfully been transformed using Xvprx2 gene. The transformation frequency for these lines has ranged from 21% to 24%. Two CIMMYT inbred lines, CML216, CML395, and one Ethiopian OPV, Melkassa-2, were transformed with IPT gene with transformation frequency and efficiency ranging from 0.0 to 33 and 70% to 100% respectively.
Conclusion
Scientists from the ECA region at Kenyatta University in Kenya have genetically engineered tropical maize genotypes for drought tolerance. This was possible through: optimization of regeneration protocols; identification, isolation, sequencing and acquisition of genes; and development of plant expression vectors. More work is needed to advance the transformed genotypes for stress experiments and it is critical that we build synergies to up-scale the utilization of the findings.
Acknowledgement
A number of partners were involved in this project (table 3). The project was financially supported by USAID through ASARECA.
151Genetic engineering of maize for drought tolerance in Eastern and Central Africa

Table 3: Partners and their roles Partner Role and responsibility Contact details Institute of Biochemistry and Biophysics, Poland
Provision of Annnat 1 Gene construct Dr. Dorota Kanopka-Postupolska, Institute of Biochemistry and Biophysics, Polish Academy of Sciences, 02-106 Warsaw, Poland. E-mail: [email protected]
Kenyatta University and ARC Biosafety and Biotechnology Research Centre
Provision of AnnexinP35 gene construct
Rasha Adam, Biosafety and Biotechnology research centre, Khartoum, Shambat P.O. Box 126. E-mail: [email protected]
University of Navada Provision of NHX3, CBF1 and CBF3 gene vectors
Dr. Ron Mittler, Department of Biochemistry and Molecular Biology, University of Nevada, MS 200; Reno, Nevada 89557, USA.
CIMMYT Provision of maize germplasm Dr. Dan Makumbi, Global Maize Programme, CIMMYT, ICRAF HOUSE, United Nations Avenue, Gigiri, P.O. Box 1041 village market–00621, Nairobi, Kenya, Tel: 254 20 722 4615, E-mail: [email protected]
University of California Provision of IPT gene Dr. Eduardo Blumwald, Department of Plant Sciences, Mail Stop 5, University of California, One Shields Ave, Davis, CA 95616, Tel Office: 530-752-4640, Fax: 530-752-2278, E-mail: [email protected]
University of Cape Town Provision of XvPrx2 and XvG6 genes and promoters. Technical backstopping
Jennifer Thomson, PhD Department of Molecular and Cell Biology, University of Cape Town, Private Bag, Rondebosch 7701, South Africa, Fax: +27 (0) 21 689 7573, Tel: +27 (0) 21 650 3256, E-mail: [email protected]
Ghent University Provision of amiRNA gene constructs Mieke Van Lijsebettens, VIB / Universiteit Ghent, Department of Plant Systems Biology Technologie Park 927, B - 9052 Gent, Belgium, Tel: + 32 (0)9 33 13 970, Fax: + 32 (0)9 33 13 809
BeCA/ILRI Primer synthesis and DNA sequencing
Lucy Muthui, SegoliP Unit, International Livestock Research Institute (ILRI), P.O. Box 30709, 00100 NAIROBI, Kenya, Tel: 254-20 422 3000, Fax: 254 20 4223001, E-mail: [email protected]
KARI Research supervision and collabora-tion in conducting and facilitating field trials
Dr. James Gethi, KARI-Katumani, Tel. +254-44-20330, +254-721-831166, E-mail: [email protected]
AATF Consultancy Sylvester Oikeh, WEMA Project Manager, African Agricultural Technology Founda-tion (AATF), P.O. Box 30709-00100, Nairobi, Kenya, Email: [email protected]
ARC Provision of maize germplasm. Conducting and facilitating field trials
Rasha Adam, Biosafety and Biotechnology Research Centre, Khartoum, Shambat P.O. Box 126, E-mail: [email protected]
EIAR Provision of maize germplasm Dr. Dagne Wagary, Bako Agricultural Research Centre, Bako, EthiopiaJimma ARC Supervision Dr. Wondyifraw Tefera, Plant Biotechnology Division, Jimma Agricultural Research
Centre (JARC), Ethiopian Agricultural Research Organization (EARO)P.O. Box 1161, Jimma, Ethiopia, E-mail: [email protected]
ARI-MIKOCHENI Supervision and field trials Miccah S. Seth and Dr. Mneney, ARI-Mikocheni, P.O. Box 6226, Dar-es-Salaam, 225, Tanzania, E-mail: [email protected] and [email protected]
IOWA State University Provision of PTF102 construct Kan Wang, Iowa State University, Department of Agronomy, Plant Transformation Facility, Fax: 515 294 2299, E-mail: [email protected]
Institute of Biochemistry and Biophysics, Poland
Provision of Annnat 1 Gene construct Dr. Dorota Kanopka-Postupolska, Institute of Biochemistry and Biophysics, Polish Academy of Sciences, 02-106 Warsaw, Poland, E-mail: [email protected]
References
Bedada LT, Seth MS, Runo S, Tefera W, Machuka J. 2011. Plant regeneration of Ethiopian tropical maize (Zea mays L.) Genotypes. Ready for press in Biotechnology.
Darley CP, Wuytswinkel OC van, Woude K van der, Mager WH, and de Boer AH. 2000. Arabidopsis thaliana and Saccharomyces cerevisiae NHX1 genes encode amiloride sensitive electroneutral Na+/H+ exchangers. Biochemistry Journal 351, 241–249.
Dorota KP, Greg C, Grazyna G, Janusz D, Krzysztof F, Araceli C, Bartlomiej F, Stanley R, Jacek H. 2009. The R\role
of Annexin1 in drought stress in Arabidopsis. Plant Physiology 150:1394 –1410.
Frame BR, Shou H, Chikwamba RK, Zhang Z, Xiang C, Fonger TM, Green CE, Phillips RL. 2002. Plant regeneration from tissue culture of maize. Crop Science 15:417–421.
Ishida Y, Hiei Y, Komari T. 2007 Agrobacterium-mediated transformation of maize. Nature Protocols (2): 1614–1621.
Karvy COMTRADE Ltd. 2006. Maize Outlook Report. http://www.karvycomtrade.com/ downloads/ karvy SpecialReports/ karvys Special Reports_ 20060727_ 01.pdf. Accessed 21 October 2013.
152 First ASARECA General Assembly, Volume 2

Koichi et al. 2003. Overcoming of barriers to transformation in monocot plants. J. Plant Biotechnology 4(4):135–14.
Kranz E and Lörz H. 1994. In vitro fertilization of maize by single egg and sperm cell protoplast fusion mediated by high calcium and high pH. Zygote 2:125–128.
Linsmaier EM and Skoog F. 1965. Organic growth factor requirements for tobacco tissue cultures. Physiology Plantarum 18:100–127.
Murashige T, Skoog F. 1962. A revised medium for rapid growth and bio assays with tobacco tissue cultures. Physiology Plant 15:473–497.
O’Connor A-Sánchez JL, Cabrera-Ponce M, Valdez-Melara P, Téllez-Rodríguez JL, Pons-Hernández, and Herrera-Estrella L. 2002. Transgenic maize plants of tropical and subtropical genotypes obtained from calluses containing organogenic and embryogenic-like structures derived from shoot tips. Springer-Verlag.
Oduor RO, Ndung'u S, Njagi EN, Machuka J. 2006. In vitro regeneration of dryland Kenyan maize genotypes through somatic embryogenesis. International Journal of Botany 2:146–151.
Ombori O, Gitonga NM, Machuka J. 2008. Somatic embryogenesis and plant regeneration from immature embryos of tropical maize (Zea mays L.) inbred lines. Biotechnology 7(2):224–232.
Rasha AO, Abdelbagi MA, Jonathan MM, Jesse M. 2008. Regeneration of Sudanese maize inbred lines and open pollinated varieties. African Journal of Biotechnology 7 (11):1759–176.
Sambrook, J, Fritsch EF, Maniatis T. 1998. Molecular cloning: A laboratory manual, vol. I. 2nd edition. Cold Spring Harbor Laboratory Press, Cold Spring Harbor, New York.
153Genetic engineering of maize for drought tolerance in Eastern and Central Africa

Abstract
Common beans have the potential to alleviate micronutrient malnutrition and hunger as they are rich in quality protein, fibre and micronutrients such as iron, zinc and vitamin A. Although several interventions have been implemented to alleviate micronutrient malnutrition, including supplementation, fortification of foods and use of diverse micronutrient rich diets, it has remained rampant in developing countries. This is because many of the interventions have had limited reach and the rural and urban poor find fortified foods unaffordable. Beans are popular in the diets of many vulnerable groups. Therefore, if they can be biofortified and made nutrient-dense, it offers a potential and sustainable solution to malnutrition and hunger-related deficiencies. The national bean research programmes across the eastern and central Africa (ECA) region developed nutrient-dense bean varieties with iron and zinc content above 70ppm and 30ppm, respectively for farmer use in the region. Twenty-one micronutrient-dense bean varieties have been released across the region, while 20 varieties are at pre-release stage in eight countries. The national bean research programmes have also developed bean-based food baskets and recipes (twenty-six recipes) for utilization of bean for improved health and nutrition in the region. The developed varieties and bean-based food baskets are being intensively promoted through awareness creation (demonstrations, publications, training) for use among the vulnerable groups in the EAC region for improved health and nutrition. Preliminary results from Rwanda and Uganda showed improved health and nutritional status of HIV-affected communities, with regular consumption of micronutrient rich beans. Therefore, improved access to micronutrient rich beans and bean-based products is likely to improve health and nutritional status of the vulnerable groups in the communities across EAC.
Background
Chronic hunger and micronutrient malnutrition or hidden hunger is rampant in most parts of the world, especially developing countries. The lack of
micronutrients such as vitamin A, zinc and iron affects at least a half of the world’s population (Nestel et al. 2006). It affects mostly infants below age five and women of the reproductive age group, leading to anaemia, general body morbidity and mortality, mental impairment; stillbirths or low birth weight; blindness; and infant mortality. Iron deficiency anaemia is estimated at 65% and 34% among infants and pregnant women in Uganda, respectively (MAAIF/MoH, 2005). In Rwanda, anaemia was estimated at 59% among infants and 33% and 29% among women of 15–49 years and men, respectively (CIAT 2009), while protein and calorie malnutrition stood at 13% and 24%, respectively (MINECOFIN 2008). At 53% and 71% among women and children, malnutrition is one of the highest in the region (IFPRI 2005). Malnutrition and malnutrition-related sicknesses contribute to over a third of child deaths in the world (Horton 2008), while micronutrient hunger and related effects account for more than half of the daily infant mortality in sub-Saharan Africa (SSA) (Caulfield et al. 2006).
Several interventions such as supplementation, fortification of foods and promoting use of diverse micronutrient-rich diets (leafy vegetables, fruits, and animal and poultry products) have been used to mitigate malnutrition in developing countries. However, these interventions have had a limited effect, especially among the vulnerable majority of rural poor that comprises 80–90% of the populations in the SSA countries, since they are unfamiliar, inaccessible and/or unaffordable to them. Therefore, developing and promoting low-cost and user-friendly interventions that target the most vulnerable rural households become very critical to alleviate hunger and malnutrition. Utilization of biofortified crops such as common beans, which are popular in daily diets of the rural and urban populations offer a potential solution to combat malnutrition and hunger with the related deficiencies and deaths more effectively and sustainably (Kimani et al. 2006).
12. Utilization of common bean for improved health and nutrition in Eastern and Central Africa
Michael Ugen1, Augustine Musoni2, George Cheminingwa3, Paul Kimani3, Mwamburi Mucharo4 and Maureen Katafire4
1National Agricultural Research Organization (NARO), Uganda; 2Rwanda Agricultural Bureau (RAB), Rwanda;
3University of Nairobi (UON), Kenya; and 4Association for Strengthening Agricultural Research in Eastern and Central Africa (ASARECA), Uganda
154 First ASARECA General Assembly, Volume 2

Common beans (Phaseolus vulgaris L.) have the potential to alleviate malnutrition and hunger-related problems as they are rich in quality globulin protein (20–28%), energy (32%), fibre (56%) and micronutrients especially iron (70 mg/kg) and zinc (33 mg/kg) and vitamin A. Previous studies have suggested that there is high genetic diversity among bean genotypes for micronutrient densities (Beebe at al. 2000; Tryphone and Nichumbi-Msolla 2010); where daily bean consumption is high, it provides a significant amount of proteins, calories and micronutrients to avoid the consequences of malnutrition and hunger (Valdemiro and Whitaker 1982). At 40–60 kg per capita (compared with 17 kg for Africa), bean consumption in eastern and central Africa (ECA) is one of the highest in the world. Beans are consumed by over 50 million persons of all social and wealth categories in diverse recipes as green or fresh leaves, pods, grain and as dry grain in daily diets by as many as 99% of the population in countries like Burundi and Rwanda. They are popular complements of the largely starchy cereals and tuber-based diets, as they become a more easily available alternative to the rare and expensive animal sources of proteins among the resource-poor rural and urban consumers. Protein intake from beans comprise 65% of the protein (both plant and animal origin) consumption in Burundi and Rwanda (Sperling 1992). Bean proteins have high digestibility, with significant nutritional and health advantages for consumers. As a legume, bean consumption is highly correlated with low incidence of coronary heart diseases and death (Menotti et al. 1999; Demardi-Blacberry et al. 2004), and has been reported to be important in controlling non-communicable diseases such as diabetes and obesity. Beans are often called the ‘vegetarians’ meat’ for the rich (Schneider 2002) and ‘meat’ for the poor (MINAGRI 1988). Thus consumption of beans is very essential among all classes of consumers: the wealthy and the poor, infants, teens, pregnant and nursing women and offers a unique remedy to prevalent micronutrient malnutrition and the associated physical and mental development impairment.
To improve the food, nutrition and health security benefits from beans, there is a need to increase access to improved micronutrient-rich bean varieties and bean-based products, especially among the rural and urban poor. Information on nutrient-rich bean genotypes and bean-based products is available, which can be disseminated to the vulnerable groups across the region. This paper describes the approaches that the national bean research programmes in ECA (Burundi, Democratic Republic of Congo, Kenya,
Rwanda, Tanzania and Uganda) have adopted to reduce micronutrient malnutrition and hidden hunger and other related side effects of malnutrition among the rural and urban poor and at the same time improve their food security and income.
Methodology
Biofortification: breeding for micronutrient-rich bean varieties
The national bean research programmes were involved in collection of germplasm to identify superior parental lines (genotypes) with high micronutrient densities (over 70 mg/kg for iron and 30 mg/kg for zinc). The programmes used these parental lines to develop new varieties combining high iron and zinc contents, marketable traits and high yield potential, with resistance to pests and diseases and tolerance to low soil fertility, using conventional breeding and marker-assisted selection procedures. The developed genotypes were evaluated across agro-ecologies to assess mineral stability and genotype x environment (GXE) interactions. The genotypes were grown in replicated trials in randomized complete block design in plots ranging from 2–4m x 1.5–3m depending on the sites. A number of the genotypes were evaluated through preliminary, intermediate and advanced yield trials and on-farm trials using a participatory approach involving many stakeholders, and the best-performing genotypes with desired traits (high yielding, resistance to diseases, desired growth habits, desired pod characteristics, attractive seed colour and size, short cooking time and so forth) and rich in micronutrients were eventually released for farmer use. Levels of iron and zinc micronutrient content were determined by XRF machines or Agricultural Advisory Services (AAS) facilities at specialized laboratories at Waite Analytical Services (WAS) of Adelaide University, Australia and at the Department of Food Science and Nutrition of the University of Nairobi (UoN), Kenya.
The new nutrient-dense bean varieties were disseminated through: (a) increased production of breeder and foundation seeds by research institutes and seed companies; (b) increased multiplication and sale of certified and quality declared seeds by the formal and informal seed producers, respectively; (c) holding demonstrations and field days to create awareness; (d) training of trainers in various aspects of seed and grain production; and (e) developing and implementing appropriate information dissemination and communication approaches.
155Utilization of common bean for improved health and nutrition in Eastern and Central Africa

Development of nutrient rich-bean products, bean-based food baskets and recipes
Nutritionists from the national bean research pro-grammes, in collaboration with universities, identified and developed suitable bean-based food basket com-binations. They also developed recipe procedures and recipe development manuals for snap and dry beans and modified them as recipe books. An analysis of culinary properties, sensory characteristics (colour, texture, taste and flavour) and consumer acceptability of improved bean varieties was carried out.
Results
Biofortification of beans (development of nutrient-rich bean varieties)
The national bean research programmes in ECA (Kenya, DRC, Rwanda, Burundi, Tanzania and Uganda), through the Eastern and Central Africa Bean Research Network (ECABREN) and other development partners such as The Alliance for a Green Revolution in Africa AGRA, have, over the years, developed high-yielding micronutrient-rich bean varieties for integration in the diets of the consumers. Up to 960 bean populations have been developed and identified as high in iron (Fe) (above 70 mg/kg) and zinc (Zn) (above 30 mg/kg)–above the average nutrient content for beans of 50ppm and 20ppm of Fe and Zn, respectively. About forty locally collected or bred bush or climbing bean varieties with Fe and Zn content beyond the target levels of 80 mg/kg and 30 mg/kg Fe and Zn, respectively have been identified, released or are at the pre-release
stage by the national programmes across the region (Table 1). These new varieties have 80% or more Fe and 50% more Zn compared to the ordinary varieties. Many of these varieties combine high micronutrient content with high yield, resistance or tolerance to pests and diseases and low soil fertility, as well as farmer culinary and market preferences, thus being suitable for food and nutrition and income security for the farmers and the vulnerable groups. To date, a total of 21 micronutrient rich varieties have been released across eight countries, while 20 lines are at the pre-release stage in eight countries. Preliminary results on consumption of nutrient-dense beans regularly from Rwanda and Uganda show that micronutrient-rich beans can significantly improve the health and nutrition status of HIV-affected communities (PABRA Annual Report 2009 published in 2010). This was corroborated by Bennink (2010), who noted that consumption of beans on a regular basis increases intake of dietary fibre essential for the control of blood glucose concentrations in the body, which reduces rampant incidence of Type II diabetes, heart disease and high blood pressure and other non-communicable diseases, thus reducing the cost of medication among the wealthy. He also observed that consuming beans, improves glycemic index control, reducing serum cholesterol and body weight gain, which improved the health of HIV patients.
To improve adoption of nutrient-rich bean varieties by the farming communities, both the formal seed systems through registered seed companies and the informal community-based seed systems are used. The national research programmes produce the breeder seeds, while
Table 1: Characteristics of some iron (Fe) and zinc (Zn) micronutrient-dense released and pre-release bush and climbing bean genotypesGenotype Origin Growth type Fe mg/kg Zn mg/kg Laboratory Seed type Yield Kg/ha StatusNakaja Uganda Bush 144 44 UoN Small 1,500 EvaluationMLB 49-98A DRC Bush 124 55 UoN Small black 2,000 ReleasedAND 620 DRC Bush 147 38 UoN Large red mottled 1,500 ReleasedRWR 2245 Rwanda Bush 75 37 WAS Large red mottled 2,500 ReleasedRWR 2154 Rwanda Bush 75 34 WAS Large sugar 2,000 ReleasedRWV 1129 Rwanda Climber 81 34 WAS Large kaki 4,500 ReleasedMac 44 Rwanda Climber 78 31 WAS Large red mottled 4,000 ReleasedCAB 2 Rwanda Climber 85 37 WAS Large white 5,000 ReleasedNABE 9C Uganda Climber 106 24 WAS Large red 3,500 ReleasedRWV 2361 Rwanda Climber 79 29 WAS Large red mottled 3,500 ReleasedRWV 3006 Rwanda Climber 76 36 WAS Large white 3,600 Pre-releasedMaharagi Soja DRC Bush 92 29 UoN Small cream 1,250 ReleasedGofta Ethiopia Bush 79 35 UoN Medium cream 1,250 ReleasedHRS 545 Sudan Bush 75 45 UoN Small white 1,200 ReleasedMinimum Target - - 70 30 -
156 First ASARECA General Assembly, Volume 2

the formal seed sector produces foundation seeds and certified seeds for sale to the farming communities. The formal seed sector has stockists distributed all over the country but mostly in urban areas, who sell improved bean seeds to the communities and other seed users.
Areas far removed from the urban centres in most cases do not benefit from the improved seeds. In these areas, the informal seed system of community-based seed production is used, where farmer groups are organized into seed producers. They work closely with researchers, extension agents and NGOs to produce quality declared seeds that are commercially acceptable. The groups produce the seeds and sell it to the farming communities, especially in the hard to reach areas. The farmer groups’ capacity to produce quality declared seeds is enhanced by technical experts. They are trained in seed production (crop, pest, disease, soil fertility and water management), post-harvest handling, institutional and organizational development, entrepreneurship skills, negotiation skills, book keeping, processing and marketing and investments and savings. In Uganda, Community Enterprise Development Organization (CEDO), working closely with over 300 farmer groups, has produced over 3 tonnes of nutrient-dense bean lines (AND 620, MLB-49-89A, Roba 1 and G59/1-2). Similarly, in Western Kenya, the Nutrition Department, Ministry of Health, increased production of biofortified beans (over 3 tonnes of NUA 45, 6, 1, Gofta, Roba1 and Maharagi Soja) in the last year. In Rwanda, more than 15 tonnes of micronutrient-dense bush and climbing beans were multiplied and distributed to the farmers. A similar initiative is being undertaken in Burundi, DRC and Ethiopia. For example, the informal seed sector in Uganda recorded an average total gross margin of Uganda shillings 549,451 (USD 220) per hectare per season (AGRA 2008, 2011). This indicates that the informal seed system can become viable and sustainable over a period of time. This approach, therefore, supplements the conventional seed system and further increases access to improved seeds by the rural and urban poor, and also improves the income of the participating farmer groups.
The seeds are packed in small packages for easy selling, wider reach and affordability by a large number of community members. Rather than pack the seeds in larger packages of say 5 kg or more, they are packed in more affordable sizes of 0.25 kg, 0.5 kg, 1.0 kg and 2.0 kg. The farmers find the smaller packs more affordable although they cost more.
The informal seed system has been successfully implemented in Uganda, DRC, Burundi and Rwanda
and will give farmers more access to biofortified bean varieties, helping improve nutrition and health, especially of the vulnerable groups.
Development and commercialization of nutrient-rich bean products, bean-based food baskets and recipes
A survey carried out by Pan African Bean Research Alliance (PABRA) and its collaborating national programmes to identify who the malnourished are and what they eat in ECA (Uganda, Kenya, DRC, Ethiopia, Tanzania and Burundi) indicated the prevalence of malnutrition ranging from chronic hunger (lack of adequate food over a long period of time) to short durations of starvation due to seasonal variation in access to food. In eastern DRC, the prevalence of malnutrition was high in children under five years with 5-10% being moderately malnourished and over 20% at risk of malnutrition. The deficiencies stemmed mainly from lack of iron and protein due to poor quality diets with heavy dependence on starchy carbohydrate-filled foods, with little consumption of animal and fish products, legumes, fruits and vegetables. To address this situation, there is a need to develop biofortified beans and nutrient-rich bean-based foods that the less privileged communities and the vulnerable groups, who are more prone to malnutrition and chronic hunger, can afford.
Dietary combinations and cooking techniques that enhance nutrient availability and promote nutrient retention were highlighted. Focus was on home prepa-ration and community-based processing, including using processed bean products to enrich local recipes, fermentation, germination and food-to-food fortifica-tion. Bean-based products have been developed by the national programmes in collaboration with universities and other food-processing industries. These include bean-based composite flours formulated to meet nutri-tional needs of infants and adults. Two of the products (bean-based processed flours and composite comple-mentary flours like bean and grain amaranth) developed by Makerere University’s Food Science Department are already being marketed in supermarkets in Kampala. National Agricultural Research Organization (NARO) Food Science Unit is working closely with East Africa Basic Foods to facilitate the commercial marketing of bean-processed flour and products. Other bean-based products with high nutritive values developed and evaluated together with consumers include snacks such as samosas, bean finger rolls, bagia, bread, madazi, and many others (figures 1–3 ). Recipe booklets for making these products have been developed for consumer and community use.
157Utilization of common bean for improved health and nutrition in Eastern and Central Africa
Various national programmes have also developed snap beans-based products of high nutritive value, including snap beans mixed with other foods such as fish, groundnuts/sesame paste, okra, beef, chicken and mixed vegetables, stir-fried dishes, salads and snacks (fresh green bean fritters) and soup (figure 4). More than 26 recipes have been developed and documented in recipe books. These products are more attractive to all generations, especially the young, and in line with the changing dietary habits of this generation. The products and recipes are more attractive and create more interest in the consumption of beans. The major challenge is to design the best dissemination strategies so that the products can effectively reach all communities,
especially the hard-to-reach communities, who are the majority and more prone to malnutrition.
Dissemination of information and innovations (nutrient-rich bean varieties and bean-based food products and recipes)
National Bean Research Programmes have, over the years, designed and implemented dissemination strategies for wider reach of information to a wider set of stakeholders to create awareness and improve uptake of technologies (varieties and management technologies). Each year various national programmes produce posters, leaflets and production guides in
Figure 1: Farmers and other consumers participate in bean-based product and recipe development.
Figure 2: A range of bean-based products are displayed, including bean samosa, bagiya, finger rolls, cakes and biscuits.
Figure 3: Participating farmers and consumers evaluate a range of developed products.
158 First ASARECA General Assembly, Volume 2

various languages for dissemination to stakeholders. These information tools include descriptions of the different varieties and seed and grain production guides. Each national programme, in collaboration with other partners (NGOs, CBOs and government extension agents), encourages the setting of demonstrations and holding of field days to disseminate information to stakeholders.
Lessons learnt
The following were lessons learnt from the regional bean research projects for health and nutrition: • A wide germplasm base is key to bean variety
development progress. • Germplasm exchange among participating member
countries and institutions within ASARECA is the backbone of regional progress.
• Participatory methods that involve a wide range of stakeholders in the research process is key to technology development and adoption.
• Networking and regionality is key to efficiency and progress and avoids duplication of research work across the region.
• Sharing of information, technologies and innovations among the countries within the region is made possible through collaborative research activities.
• Regular skill upgrading of researchers is essential for capacity building and quality research results.
• Technical staff are key to research programme continuity and collection of quality research data.
• Exchange visits among farmers are useful to share ideas and information.
• Children can be good at disseminating information on beans to their parents.
Future interventions
Future interventions to improve utilization of beans for nutritional and health benefit will include the following activities: (a) baseline survey on nutrition and dietary assessment and identification of target populations; (b) evaluation of nutrient retention in micronutrient-rich bean-based foods; (c) development and selection from new populations for high Fe and Zn content (screen bean genotypes and germplasm for breeding); (d) regional evaluation of biofortified nutrient-dense bean lines for GXE through the participatory variety selection (PVS) procedure; (e) training of trainers in the communities and setting up of demonstration gardens; (f) promotion of marketing and consumption of nutrient-rich bean varieties and products (biofortified beans and bean products); (g) assessment of improvement of nutrition status with specific products of target population or communities; and (h) creating a
Figure 4: Snap bean recipes developed by the national bean programmes for consumer use: (a) snap bean soup, (b) snap bean mush-room stew, (c) snap bean samosa, (d) mixed steam vegetables, and (e) snap bean-“githeri”.
(a) (b) (c)
(d) (e)
Utilization of common bean for improved health and nutrition in Eastern and Central Africa 159

favourable environment for farmer access to improved nutrient-dense bean seeds in the region.
Conclusion
Beans have proved to be a very healthy food source for the vulnerable groups, especially for the rural and urban poor, who are unable to afford animal and fish sources and depend a lot on beans for proteins and micronutrients. The development of nutrient-dense bean genotypes (biofortification) increases the possibility of making micronutrients, especially Fe and Zn, more easily available to the vulnerable groups, thereby reducing micronutrient malnutrition and hidden hunger. Since beans are easy to grow and can be more easily accessed by a wider community than supplementation and fortified foods, consumption of biofortified beans and nutrient-rich bean-based foods could be one way of tackling malnutrition among the vulnerable groups.
The dissemination efforts, coupled with training, will spread awareness about the need to consume biofortified beans and nutrient-enriched bean-based food baskets. The strong collaboration among national programmes allows for exchange of information and innovations and stronger partnerships, which will encourage exploitation of synergies for more efficient results.
Acknowledgement
This research was made possible by financial support from ASARECA, PABRA and national governments of participating institutions and organizations. We also acknowledge the contributions from National Bean Research Institutes, participating civil society organizations, the private sector, farmers and farmer organizations and development partners.
References
[AGRA] Alliance for a Green Revolution in Africa. 2008. PASS 018. 2011. Grant 2008 PASS 018 Sustainable Community-based, Farmer-led Bean Seed Enterprises to Reach Communities not served by the formal seed sector for improved income and livelihoods, Final Report, 2011. NARO-NaCRRI, Kampala, Uganda.
Beebe S, Gonzalez A, Rengifo J. 2000. Research on trace minerals in the common bean. Food Nutrition Bulletin 21: 387–391.
Bennink RM. 2010. Health benefits associated with consumption of beans. Annual Report of the Bean Improvement Cooperative (BIC), Vol. 53: 2–3, 201.
Caulfield LE, Richard SA, Rivera JA, Musgrove P, Black RE. 2006. Stunting, wasting, and micronutrient deficiency disorders. In Jamison DT, Breman JG, Measham AR, Alleyne G, Claeson M, Evans DB, Jha P, Mills A, Musgrove P, eds., Disease control priorities in developing countries, 2nd ed., Oxford University Press and World Bank, Washington, DC.
[CIAT] Center for Tropical Agriculture. 2008. Harvest Plus Annual Report 2008.
Demardi-Blacberry I, Wahiliquist M, Kouris-Blazos A, Steen B, Lukito W, Horiek H. 2004. Legumes, the most predictor of survival in older people of different ethinicities. Asia Pacific Journal of Nutrition (1392) 217–20.
Horton R. 2008. Maternal and child undernutrition: An urgent opportunity. The Lancet 371(9608) 179.
[MAIIF/MoH] 2005. The National Food and Nutrition Strategy. Ministry of Agriculture, Animal Industry and Fisheries, Entebbe, Uganda.
Menotti A, Kromhout D, Blacburn H, Fidanza F,Buzina R, Nissinen A. 1999. Food intake patterns and 25-year mortality from coronary heart diseases: cross-cultural correlations in the seven countries study. European Journal of Epidemiology 15(6). 507–15.
[MINAGRI] Ministry of Agriculture and Animal Resources. 1988. Rwanda Ministry of Agriculture, Rwanda Horticultural Strategy Publication. Kigali, Rwanda.
[MINECOFIN] Ministry of Finance and Economic Planning. 2008. Rwanda Ministry of Finance and Economic Development Publication. Kigali, Rwanda .
Nestel P, Bouis HE, Meenakshi JV, Pfeiffer W. 2006. Biofortification of staple food crops. Journal of Nutrition 136(4), 1064–1067.
[PABRA] Pan-African Bean Research Alliance. 2010. Pan-African Bean Research Alliance Annual Report, 2009/2010.
Tryphone GM and Nchimbi-Msolla S. 2010. Diversity of common bean (Phaseolus vulgaris L.) genotypes in iron and zinc contents under screenhouse conditions. African Journal of Agricultural Research 5(8): 738 –747.
Valdemiro CS and Whitaker JR. 1982. Physical, chemical and nutritional properties of common bean (Phaseolus vulgaris). In: Advances in food research. Academic Press Inc. New York.
160 First ASARECA General Assembly, Volume 2

Abstract
For a long time, sub-Saharan Africa commanded less than 1% of the global trade in seed, with little, if any, intra-regional trade between neighbours. Regulations and policies established when most plant breeding and formal seed production were dominated by the public sector constrained growth in the sector as variety release procedures were designed to meet the needs of public research institutes, and seed certification was focused on public or parastatal seed enterprises. Each country developed its own seed certification regime. The lack of harmonized procedures and standards for key processes along the seed value chain posed a significant barrier to seed trade and inhibited the spread of new varieties beyond national boundaries. This led to delays in release and often rejection of useful varieties that did not meet the criteria and procedures. A public variety released in one country faced long battles to gain release in a second country. Phytosanitary regulations that were not based on scientific evidence further restricted possibilities for trade. Commercial seed trade was also hampered by lack of intellectual property protection for plant varieties and by different procedures for import and export of seed.
Starting in the late 1990s, an ASARECA initiative brought together key stakeholders in the seed industry to analyse the policy landscape, review the existing situation, and spearhead efforts to adopt options for policy reform. Options were clustered around five key areas: (i) variety evaluation and release, (ii) seed certification, (iii) plant variety protection, (iv) phytosanitary issues and (v) export and import documentation. A harmonization agreement around these key areas was adopted by delegates from Kenya, Tanzania and Uganda in 2002, and later rolled out to all ASARECA countries. The operationalization of this agreement was vested in a public–private entity launched as the Eastern Africa Seed Committee (EASCOM) in Kigali, Rwanda in 2004.
Reforms included a review of the national seed industry laws and regulations to align to the regional position
on seed; providing more autonomy to national seed agencies; creating more space for participation of the private sector; recognizing the role of plant variety protection; and streamlining export and import documentation procedures. As a result, seed production and trade has more than tripled, while prices for the key tradable – seed maize – have also stabilized. The total gain for enhanced intra-regional trade in seed maize alone arising from harmonized seed policies has been estimated at US$ 727 m per year for the ASARECA region.
The pace of harmonization has been slow, with some countries adopting reforms faster than their counterparts. The agreed reforms must be communicated through a policy process that may not be sympathetic to the view that regulation’s principal purpose is to encourage seed system development rather than to be a “police force”. Amendments of laws and regulations takes time, but changes in attitude and interpretation are often as important and as difficult to achieve. In addition, many regulatory reforms imply changes in institutional responsibilities and the establishment of new protocols that require additional resources.
BackgroundIn 10 countries in Eastern and Central Africa (ECA): Burundi, Democratic Republic of Congo (DR Congo), Eritrea, Ethiopia, Kenya, Madagascar, Rwanda, Sudan, Tanzania and Uganda, agriculture drives the economies and accounts for over 43% of Gross Domestic Product (GDP) annually. In Burundi, DR Congo, Ethiopia, Sudan and Tanzania, agriculture accounts for more than 50% of GDP, while in Kenya, Eritrea and Madagascar, it accounts for less than 30%. Growth in the agricultural sector is key to economic growth in these countries. This, in turn, implies that farmers must adopt technologies such as high-yielding varieties of appropriate crops to increase productivity.
In recent times, there have been notable improvements in access to quality seeds as seen in increased trade
13. Evolution of policy harmonization and rationalization of the seeds sector in Eastern and Central AfricaEvans Sikinyi1, Michael Waithaka2, Miriam Kyotalimye2
1Seed Trade Association of Kenya P. O. Box 2581-00202, Nairobi 00202 Kenya. Email: [email protected]
2Association for strengthening agricultural research in eastern and central Africa P.O. Box 765, Entebbe, Uganda. Email: [email protected]
Evolution of policy harmonization and rationalization of the seeds sector in Eastern and Central Africa 161

volumes across ECA. This can be attributed to the lowering of transactions costs and removal of lengthy and cumbersome import and export procedures, through gradual implementation of favourable and common regulatory, legal and trade arrangements.
Rationalization and harmonization seed policy and regulations in the region
The journey to common regulatory, legal and trade arrangements in the seed sector was initiated in 1999 by the Association for Strengthening Agricultural Research in Eastern and Central Africa (ASARECA). The aim was to rationalize (change the way business is done so as to increase efficiency and reduce waste) and harmonize (bring together regionally different approaches into unified strategies that are applicable across national boundaries) the regulatory and legal frameworks governing all aspects of the seed sectors in ECA.
The regulations and policies in question had been set up during the period when the public sector dominated plant breeding and seed production. Each country had its own procedures for variety testing, release and approval, seed certification and phytosanitary regulations. The period for testing was lengthy and the varieties had to be tested afresh in each country before the variety could be listed for commercial release. This often led to either delays in release or rejection of useful varieties that did not meet the varying criteria and procedures of the neighbouring country. Additionally, since the testing and certification was based on varying standards, procedures and technical competences, there was a lack of faith and confidence in the quality of seeds from various countries.
Process and institutional set up for policy reforms in the seed industry sector
The project began with extensive analyses of seed systems in Kenya, Tanzania and Uganda and a range of national- and regional-level activities and meetings that developed an agenda for seed regulatory reform. National efforts were augmented by regional workshops, which discussed the modalities for regional coordination and implementation.
The reforms were undertaken through a collaboration spanning various seed industry stakeholders from the participating countries. In 2001, the Seed-Regional Working Group (S-RWGs), comprising members from both the private and the public sectors in Kenya, Tanzania and Uganda, was formed. The S-RWG
coordinated the drafting of the agreement on what needed to be done in each of the five areas.
In 2004, the S-RWG was expanded to cover all ASARECA member countries and was transformed into the Eastern Africa Seed Committee (EASCOM). The membership of EASCOM in each country comprises four representatives covering policy (ministry of agriculture), regulation (ministry of agriculture or autonomous institution), seed trade (private sector) and plant breeding (scientists). EASCOM seeks to: review policies, laws and regulations; strengthen national seed and plant breeders’ associations; operationalize agreements and maintain databases; build capacities of seed sector players; and articulate implementation of harmonized agreements to the East African Community (EAC) and the Common Market for Eastern and Southern Africa (COMESA).
To bring about the desirable changes in the seed industry, the process used a four-stage policy cycle:1. Country data on constraints and concerns in the
seed industry were collected by national resource persons.
2. The information was analysed during the policy data analysis stage by the resource persons and a range of international experts in seed evaluation, registration, certification, plant variety protection and phytosanitary issues. International standards in the major categories of seed were considered and compared with existing and proposed regional standards. The end results were different options, which included benefits and costs as well as winners and losers in the game. Stages 1 and 2 were technical, and scientists played a leading role.
3. During the policy dialogue stage, which was essentially a political process, the changes suggested by technical teams were communicated to a broad range of stakeholders at the national and regional levels. Participants included multidisciplinary sets of scientists, seed companies, transporters, stockists, government technocrats, politicians and policy makers. This stage was highly interactive and required effective communication of potential solutions, forging of mutual expectations and several rounds of discussions to reach a consensus on a common course of action.
4. The fourth stage, which was the policy action stage, dwelt on the implementation of the agreements reached.
162 First ASARECA General Assembly, Volume 2

Key areas for harmonization
Five key areas were identified to restrict seed movement in the region:1. Variety evaluation, release and registration process2. Seed certification procedures3. Phytosanitary measures4. Plant variety protection procedures5. Import–export documentation procedures
Reforms in variety evaluation, release and registration
Evaluation has been greatly simplified in that breeders are responsible for ensuring quality up to the point of release. The National Certification Agency (NCA) chairs and validates the tests in National Performance Trials (NPT) and recommends release through a policy committee. On an average, the testing period across countries has reduced from three years to two seasons.
The laws that contain these agreements of harmonization include: Uganda Seed and Plant Act 2007, Tanzania Seeds Act 2003 and Kenya Seed Bill 2008. The regulations governing variety evaluation, release and registration in Kenya were approved by stakeholders on 28 July 2008 and were presented to the minister for agriculture, who, in turn, has passed them to the cabinet office for approval. These regulations, among other things, provide for agreements of harmonization, for example, varieties listed in one country can be released in another country after only one season testing, provided data used for release in the applicant country is available for similar agro-ecozones in the region. The regulations are being implemented in Tanzania since 2007 through the Tanzania Official Seed Certification Institute (TOSCI), in Kenya through the Kenya Plant Health Inspectorate Service (KEPHIS); and in Uganda, through the National Seed Certification Services (NSCS).
A regional variety list for Kenya, Tanzania and Uganda was produced in 2004. This was updated in 2011 and has helped improve knowledge on varieties available in the region. In addition, as shown in Table 1, participation of the private sector in breeding and release of new varieties on the market has also grown over time.
Table 1: Number of varieties released by the private sector
Country PeriodVarieties released
Numbers released by private companies (%)
Kenya 2000–07 140 43 (31)Tanzania 2004–06 24 9 (38)Uganda 2003–06 15 7 (47)
Reforms in seed certification
Prior to harmonization, certification standards were different across countries. This made it difficult for seed lots certified in one country to be traded in another country, irrespective of the demand. Seed certification refers to a set of procedures, methods and techniques used to verify the quality of seed during the multiplication and post-harvest handling process with the intent of ensuring that variety, identity and purity are maintained and safeguarded. The mandate for seed certification is vested in a nationally designated seed certification agency or equivalent organization where one does not exist. The certification agency will follow the progress of a variety at different stages of the seed production process, including examination of control plots using samples of seed drawn from lots; laboratory tests on seeds and seedlings using samples drawn from lots; and field inspection of growing seed crops on one or more occasions during critical growth stages.
Consequently, the ASARECA seed initiative reviewed and produced regional standards for seed testing and field inspections largely based on the Organization for Economic Cooperation and Development (OECD) seed schemes for ten key crops, including maize, rice, wheat, sunflower, soybeans and beans. The handbooks were published in 2007 and made available for use by national seed certification agencies or equivalent bodies as reference documents. These standards are largely compliant with the OECD seed schemes and International Seed Testing Association (ISTA) seed testing rules and have been captured in Kenya’s Seed and Plant Varieties Act (amended) 2013, in Tanzania’s Seed Regulations 2007 and in Uganda’s Seed and Plant Act 2006. To ensure adequate ownership, build capacity and generate confidence, Kenya, Rwanda, Tanzania and Uganda carried out joint certification exercises. This resulted in improved working relationships between regulators and seed companies in the region.
Until recently, ASARECA countries were unable to export seed to Kenya, which is ISTA accredited, because they were not ISTA members. Uganda acceded to OECD in 2005 and is a member of ISTA, but has not yet been accredited. Tanzania is a member of ISTA, and is finalizing the quality assurance manual and building the required capacity for accreditation and has also applied for OECD membership. To enable intra-regional trade in the interim as the two countries seek accreditation, an inter-agency seed certification scheme was initiated between Kenya, Uganda and Tanzania. Inter-agency certification is a procedure
Evolution of policy harmonization and rationalization of the seeds sector in Eastern and Central Africa 163

for completing or maintaining certification of seed originating in one country for which certification is either completed or retained in another country. Under this initiative, Kenyan inspectors have conducted field inspections on seed grown in Uganda meant for the Kenyan market; the seed is then bulked for final processing and sold in Kenya. This initiative has enabled Ugandan seed producers to participate in the Kenyan market as the process of ISTA accreditation is underway.
Reforms in phytosanitary measures
To rationalize the approach to phytosanitary inspections of seed traded across borders, the East African Standards Committee (EASC) spearheaded efforts to review the national quarantine pest lists for five countries–Burundi, Ethiopia, Kenya, Tanzania and Uganda–which is under validation by the respective National Plant Protection Organizations before publication.
Reforms in Plant Variety Protection
By 1999, only Kenya had a Plant Variety Protection (PVP) system in place in the region based on the International Union for the Protection of New Varieties of Plants (UPOV) 1978 Convention. Lack of plant variety protection for the breeders, discourages the introduction of new and appropriate varieties that may be available in other areas, in a given country. The region agreed to develop a sui generis system of PVP based on the UPOV (1991) Convention. The Kenya Seed Policy was launched in April 2011, providing for liberalization of the seed sector and amendment of the Seeds and Plant Varieties Act, and a draft Seeds and Plant Breeder’s Rights Regulations, which contain regional seed certification standards and provide for compliance to the UPOV 1991 Convention. KEPHIS received 853 applications for plant breeder’s rights by 2007, and 232 grants were awarded, mainly for flowers. The Kenya Agricultural Research Institute (KARI) has established a system of licensing, which is competitively open to seed companies.
Tanzania enacted the Plant Breeder’s Rights Act of 2002, which is now under review to comply with the UPOV 1991 Convention. The Act became operational in 2004, and a fully-fledged Plant Breeders’ Rights Office was set up in 2005. By June 2008, 35 applications had been received and 18 grants awarded.
Uganda has a draft PVP Bill 2002, which provides for farmer’s rights based on the Convention on Biological
Diversity (CBD). The Bill was approved by the Cabinet in February 2007 and the parliamentary committee on agriculture in May 2011; it is now lined up for debate on the floor of parliament. Ethiopia enacted a Plant Breeders’ Rights Proclamation in 2006, which is currently under review to make it UPOV (1991) compliant.
Reforms in import/export documentation procedures
Time taken to process seed import and export docu-mentation has reduced considerably in most countries, lowering the cost of cross border trade. The EAC Customs Union Treaty has also further eased import–export procedures generally.
Enhancing national capacities
The Ethiopian government organized a team to study the national seed system, focusing on the different components, which include certification and quality control, and national variety release and registration, with the aim of improving the system. The team sought to create awareness and stressed on the need to improve the existing guidelines and procedures in line with the harmonization processes that can develop the seed industry in the country and region. The team further noted that, unlike in many other ASARECA countries, Ethiopia was lagging behind in development of the seed system.
As a way of building the Southern Sudan Ministry of Agriculture and Forestry’s capacity, dissemination of technical information on harmonized standards, including phytosanitary requirements for various crops and quarantine pests, was undertaken.
Support to National Seed Trade Associations
In 2005, a review of the progress in harmonization highlighted the need to engage with the private sector through national seed traders’ associations and plant breeders’ associations. One recommendation was to strengthen existing associations or establish new ones where they did not exist. The review also highlighted areas that required further attention, such as, improv-ing efficiency of variety testing systems, supporting national seed quality control systems, and implement-ing agreements and policies. A key component of the harmonization was capacity building in terms of per-sonnel and infrastructure.
164 First ASARECA General Assembly, Volume 2

As a start, business plans for seed trader associations in Sudan, Rwanda and Tanzania were developed and national seed trade associations supported with infrastructure. In 2006, an association was established in Sudan and Ethiopia. Another one was established in Southern Sudan in 2008 to complement the efforts of the Khartoum-based association. In 2009, Burundi revised its seed legislation, which was assented to by the Parliament and signed into law in April 2012. Burundi also established a national seed traders association: the Collectif des Producteurs des Semences du Burundi (COPROSEBU). In 2010, DR Congo also revived the seed traders’ association that had been formed earlier, but never took off. The formation of Southern Sudan Seed Trade Association was also initiated.
Other on-going regional initiatives
EASCOM, the African Seed Trade Association (AFSTA), Iowa State University, and COMESA’s Alliance for Commodity Trade in Eastern and Southern Africa (ACTESA) joined hands in response to the Victoria Declaration at the fifth meeting of the COMESA Ministers of Agriculture held in March 2008. The declaration stated that "Member States commit to harmonizing, within two years, seed trade regulations in the region and to finalize
a regional protocol for the protection of new varieties of plants within the same period." The partners organized a series of studies and meetings to reach agreements for the three blocs – Southern Africa Development Corporation (SADC), COMESA and the EAC. While validating the harmonization of seed regulations in September 2011, COMESA countries agreed to move with all five areas that ASARECA had been working on. Key areas to be fast tracked were also identified in each category. COMESA would engage its legal instruments to push for the adoption of the agreements. This instrument was to be pursued with an initial presentation at the joint ministerial meeting in 2012. Once adopted and gazetted, the agreements would immediately bind member states to implement them.
Summary and way forward
The level of adoption and implementation of the harmonized seed agreements at the national level has been minimal due to a number of challenges mainly lack of legally binding frameworks at the regional level. The long bureaucratic procedures involved in the development, enactment and amendment of policies and legislations at the national level has been a major challenge.
Box 1. Kenya
Kenya has a long history of seed production and use. The Kenya Seeds and Plant Varieties Act came into force in 1975 and the Seed Trade Association of Kenya (STAK) was established in 1982. Kenya also has the Plant Breeders’ Association that handles breeders’ issues. Liberalization of seed industry in the 1990s necessitated a review of the laws and regulations. In 1998, the Ministry of Agriculture, together with stakeholders, initiated this review that culminated into the National Seed Policy that was finally launched in 2011. Amendment of the Act and related regulations is on-going and to be published and presented to parliament.
Currently, STAK serves as the secretariat for EASCOM and is responsible for the follow up of agreements reached during the harmonization and rationalization process.
The major benefits that have accrued from rationalization and harmonization are:
• Reduction of the time taken to carry out variety testing and release, from more than three years to two or, where necessary, three seasons.
• Easing of variety release and movement. If a variety is tested and released in one country, it can be released in another country based on the relevant data from the country of origin. A case in point is the collaboration between KEPHIS with the Ugandan Ministry of Agriculture, Animal Industry and Fisheries on seed field inspection in Kasese and Masindi in western Uganda.
• Capacity building and exchange of expertise in key areas have been strengthened between national agencies, particularly PVP. Previously, only Kenya had this expertise. In 2011, Burundi drafted a PVP Bill with expert support from STAK and Tanzania Plant Breeders’ Rights Office. South Sudan, Rwanda, Uganda, Madagascar and DR Congo are engaged in the same process.
With more than 84 registered seed companies and about 30,000 metric tonnes of seed sold annually, Kenya is set to reap benefits from opened borders and increased varieties of seeds available in the region. As an accredited member of the international seed organizations (ISTA and OECD), Kenya can export seed to any country in the region but cannot import from non-members. As an interim measure to allow importation from Uganda into Kenya, the ministers of agriculture in the two countries have set up an inter-agency certification scheme that enables seed produced in Uganda to undergo field inspections by KEPHIS officials before bulking for final testing, processing and sale in Kenya. Rather than use the scheme, Tanzania has opted to pursue membership in ISTA and OECD to enable its producers to export seeds to Kenya.
Evolution of policy harmonization and rationalization of the seeds sector in Eastern and Central Africa 165

Box 2. Tanzania
While the Tanzanian seed industry has been liberalized, public institutions, such as ASTA, continue to play a dominant role unlike in the other ECA countries. In 2003, Tanzania became the first country to include the harmonization terms in their new Act. With this, a National Seed Committee was formed to advise the government on issues related to seed, and the Tanzania Official Seed Certification Institute (TOSCI) was established. The law has provisions that set minimum standards and clear regulations and procedures in the seed sector.
Tanzania has, for several years now, been in the process of aligning itself with the International UPOV and ISTA. The aim is to adhere to the international standards and agreements so as to boost the quality of seed that is produced in the country. In addition, being a member of the Southern African Development Community (SADC), they are already implementing the requirement that if a variety is released in two countries, it can also be released in other member countries
TOSCI is equipping its laboratories and there is capacity building of seed inspectors and seed technologists in quality assurance, seed testing and seed sampling to enable it play an effective role and prepare it to join ISTA.
Compared to the other ECA countries, where the private sector companies operate independently, ASTA has established private–public partnerships to expand its reach throughout the country. This is a favourable mechanism for countries that are hesitant to have completely liberalized markets.
Box 3. Uganda
With the liberalization of the seed sector, entrepreneurs in Uganda were encouraged to establish seed companies, and agro-input dealers entered the market. There are 25 companies producing, processing and marketing seeds, agro-inputs and farm equipment. Out of these, 18 are members of Uganda Seed Trade Association (USTA). USTA contributes to training, documentation and data collection, and advocacy for its members. Previously, procuring reliable production information from the sector was difficult because of concerns about confidentiality. In 2010, USTA introduced a tamper-proof system of seed labels, primarily to stem the sale of fake seeds. The system provides information on seed production through an inbuilt database based on the number of labels issued.
Three seed companies illustrate the evolution of the seed industry in Uganda:
1. Nalweyo Seed Company (NASECO) was established in 1996, with its main production facility covering more than 150 ha in Kibaale district in western Uganda. NASECO has 500 outgrowers who have an assured market and get higher prices for their produce than those offered in the open market. The company has 32 formal staff, of whom 15 are technicians dealing with research, marketing and accounting, while 17 carry out support functions. Casual employees range from 60 to over 90 during peak seasons. The NASECO distribution system covers all the districts in Uganda, and they target to reach all sub-counties within the next three years. Throughout the chain, an estimated 160,000 households benefit from the company directly or indirectly.
2. Victoria Seeds Ltd was established in 2004 and is involved in processing, marketing, production, extension and research. It has offices and production facilities in Kampala and Gulu and Masindi in northern and western Uganda respectively. Having started with five employees, by 2011, they had a staff of 100. Besides its own blocks, the company works with farmers’ group. The company aids the groups with bulk purchasing and access to credit. Through these groups, farmers are able to get training on land preparation, seed production and post-harvest handling.
Victoria Seeds also builds social entrepreneurship groups with the aim of empowering women. In Gulu, this approach has benefited people resettling from Internally Displaced Persons camps. In 2008, the company signed up with 214 contract growers who operate on a household basis. The number has since grown to 912. The households are provided with training and have access to credit and tractor hire services for preparing the land for planting. The farmers manage the credit themselves and the company works out different models to link them to microfinance institutions and to establish other income-generating enterprises.
3. FICA Seeds Ltd has a production and processing unit in Masindi, Uganda. They supply farmers with foundation seeds for multiplication. The farmers are selected on the basis of the following: they must have at least 4 ha of land, access to infrastructure and capital, storage space and commitment. There about 300 contracted seed growers on about 400 ha of FICA block farm. The company carries out regular trainings and seminars for the farmers at different stages in seed production and post-harvest handling. FICA Seeds also operate from Tanzania, where they produce and sell seeds.
Seed companies have benefited from a harmonized regime since this has boosted the exports to neighbouring southern Sudan, Rwanda, Burundi and DR Congo.
The East African Community enacted the Standards, Quality, Meteorology and Testing (SQMT) Act in 2006, which provides a framework for cooperation in the development and implementation of standards (including seed standards). The Act is seen as an avenue for the harmonized agreements to be effected. Section
15(1) of the SQMT Act (2006) provides that “within 6 months of declaration of East African Standards, partner states shall adopt without deviation from the approved text of the standard, the East African Standard as a national standard and withdraw any existing national standard with similar scope and
166 First ASARECA General Assembly, Volume 2

purpose.” In addition to this provision, Section 19 empowers the Council of Ministers to declare the approved East African Standards as compulsory throughout the community to prevent, among other things, deceptive practices.
Over time, a number of standards have been harmonized in the region with a view to enhance free movement of goods in intra-regional trade. However, a number of factors, including differences in technical regulations and Sanitary and Phytosanitary (SPS) measures, their application and technical requirements, vast differences in the approaches of regulatory agencies and differences in ensuring compliance through activities such as inspection, testing, surveillance, registration, certification, auditing and accreditation (conformity assessment) have continued to hamper trade in the region.
Table 2. Progress in implementation of harmonization agreements in ECA countries
Policy milestone Achievements by country to date Work in progressEnacted legislation (Seed Act) that accounts for harmoniza-tion agreements
Burundi (Seed Act 2009), Ethiopia (Seed Proclamation of 2006 revised in 2010), Kenya (Seed Policy 2011, Seed and Plant Variety Amendment Bill revised in 2010), Madagascar (Seed Act 1994 reviewed in 2010), Rwanda (ministerial decrees of 2010 and Seed Act 2003), Tanzania (Seed Act 2003), Uganda Seed and Plant Act 2006
Uganda Plant Variety Protection Bill reviewed in 2011;Sudan Seed Act reviewed in 2006; Kenya Amendment Bill due for parliamentary discussions
Finalized Seed Act imple-menting regulations
Kenya (NPT Regulations 2009), Tanzania (Seeds Regulations 2007), Uganda draft Seeds Regulations of 2010 to implement the Seed and Plant Act of 2006
Rwanda, Burundi, Ethiopia, Madagascar
Finalized Plant Breeders Rights Act in accordance with UPOV 1991 and its implementing regulations
Burundi (draft PVP bill 2011), Kenya (UPOV 1978), Tanzania and Uganda (largely UPOV 1991 compliant)
Rwanda, Sudan, Madagascar, Eritrea, DRC have no sui generis systems based on UPOV (1991); Burundi has a PVP draft
Autonomous certification agency
Kenya Plant Health Inspectorate Service (KEPHIS), Tanzania Official Seed Certification Institute (TOSCI) and Plant Breeders’ Rights (PBR) office in Tanzania in 2005
Uganda considering autonomous seed service to oversee variety evaluation, release and registration;Ethiopia’s certification agency is under review with the seed proclamation based on the experiences of the other countries. Under the Agricultural Transformation Agency (ATA) an independent agency is being put in place.
National Seed Trade Association
DR Congo (revived AISC) in 2010,Burundi (COPROSEBU) 2009, Sudan (SSTA) 2008, Ethiopia (ESTA) 2005, Rwanda (STAR) 2003 revived in 2010, Kenya (STAK) 1982, Madagascar (AMPROSEM), Uganda (USTA) 2003, Tanzania (TASTA) 2002
Acceded to OECD and ISTA seed testing rules
Kenya Burundi, Tanzania and Uganda are in the process of acceding to OECD and ISTA.Ethiopia, Madagascar and Rwanda are considering.South Sudan is shifting from the American classification system to OECD.
Developed quarantine pest list
Burundi, Ethiopia, Kenya, Madagascar, Rwanda, Sudan, Tanzania, Uganda
Simplified export and import documentation procedures
Burundi, Sudan, Madagascar, Tanzania, Uganda Kenya, Ethiopia
It is against this background that the Council of Ministers during its 22nd meeting (EAC/CM/22/Decision 47), approved the expansion of the current EASC to include other standards-setting bodies, especially those involved in developing SPS measures, technical regulations and conformity assessment procedures such as (testing, inspection, surveillance, auditing, certification, registration and accreditation). This was considered necessary to streamline the manner in which these aspects of the quality infrastructure was being handled in the community and to provide an anchoring for technical activities, which currently could not be placed within any organs of the community.
To implement the Council’s decision, the EASC approved the establishment of the East African Technical Regulations Sub-committee (EATRSC). The committee has to provide a framework for the development of
Evolution of policy harmonization and rationalization of the seeds sector in Eastern and Central Africa 167

technical regulations in the region and, at the same time, link the standards technical sub-committee and the regulators.
ASARECA was granted technical status at EASC of the EAC. Through this committee the seed potato standard was approved for gazetting as an East African Standard. This was a major breakthrough for ASARECA-EASC, since once enacted the EAC standard would supersede existing legislation and take effect within six month in the five EAC member states. As a way forward, in view of the experience from the approved seed potato standard, there is a need to develop seed standards for all major crops, including conformity assessment procedures based on the SQMT Act (2006) to enhance the implementation of the ASARECA seed harmonization agreement. Additionally, similar harmonization activities at the COMESA level is hoped to complement the efforts at the EAC level. ASARECA
will pursue gazetting of the seed regulations already published through EASCOM through this mechanism.
ReferencesPAAP 2008. Draft proceedings of 4th EASCOM AGM.
ASARECA, Entebbe, Uganda.
ECAPAPA 2004. Harmonization of seed policies and regulations in eastern Africa. Experiences and lessons learned. ECAPAPA monograph series 6.ECAPAPA, Entebbe Uganda.
ECAPAPA 2002. Harmonization of seed policies and regulations in eastern Africa. Results and agreements. ECAPAPA monograph series 4.ECAPAPA, Entebbe Uganda.
168 First ASARECA General Assembly, Volume 2

Abstract
Food insecurity in sub-Saharan Africa is aggravated by micronutrient deficiencies–a major impediment to social and economic development. Malnutrition, including micronutrient deficiency, can impair growth and/or cause high mortality, especially among vulnerable populations of women and children. In Kenya and Tanzania, 40–45% of pregnant and nursing women suffer from Anaemia, while 25–30% of children under five are stunted and highly susceptible to infectious diseases. African indigenous vegetables (AIVs), including Africa nightshade, amaranths, crotalaria, spiderplant, jute mallow and African eggplant, are rich in micronutrients such as iron, zinc, vitamin A, and contain non-nutrient substances called phytochemicals, which help protect people against non-communicable diseases. Consumers in many parts of Eastern and Central Africa (ECA), especially in urban areas, are becoming aware of the nutritive benefits of these vegetables. A growing number of smallholders, in turn, are striving to take advantage of this renewed interest in the AIVs by growing and supplying them to markets in both rural and urban areas. AIVs are becoming a common item in major supermarkets and green grocery stores in some countries, especially Kenya, Tanzania, and Uganda. However, the potential to meet the growing demand for these vegetables in the region is limited by the lack of good quality seeds. A majority of the farmers use seeds either saved from their own previous crop or buy them from open-air markets, which have problems of
purity (with mean germination rates rarely above 50%). Having to depend on seeds from such sources also means that farmers have limited access to improved seed varieties that meet consumer-preferred attributes. An effective seed supply system and an assured market for seed are critical in fully using the potential of AIVs to improve food security and livelihoods of target communities.
This paper describes an on-going pilot project aimed at validating and promoting farmer-led seed enterprise (FLSE) models for sustainable supply of quality AIV seeds. The project is being implemented in Kenya and Tanzania. However, the lessons learned from these models will be shared for scaling up in other countries. Three FLSE models are being evaluated: (i) private sector seed company mediated model, (ii) research-mediated model, and (iii) informal grade model. The success of the models depends on technically skilling the seed producers as well as building strategic and functional linkages through public–private partnership with institutions and organizations in the value chain. Success parameters, such as volumes of quality seed (certified or quality declared depending on country seed regulations) of different AIVs produced and sold and number of smallholder seed growers trained and able to go through the quality assurance are used to evaluate the enterprise models.
More than 500 farmers (>40% women) have been trained in quality seed production and post-harvest handling.
14. Promoting farmer-led seed enterprises of African indigenous vegetables to boost household incomes and nutrition in Kenya and Tanzania
Daniel Karanja1*, Nasambu Okoko2, Edwin Kiptarus3, Paul Okongo4, Silivesta Samali5, Alphonce Katunzi6, Hamis Mtwaenzi7, Firoz Mwakitwange7, Victor Afari-Sefa8, Richard
Musebe1, Martin Kimani1 and Lydia Kimenye9
1 CAB International (CABI), PO Box 633-00621, Nairobi, Kenya2 Kenya Agricultural Research Institute, Kisii, PO Box 523-40200, Kisii, Kenya
3 Kenya Seed Company, PO Box 553, Kitale, Kenya4 Technology Adoption Through Research Organization (TATRO), PO Box 34-04061, Yala, Kenya
5Horticultural Research Institute, Tengeru, PO Box 1253, Arusha, Tanzania6 INADES Formation Tanzania, PO Box 203, Dodoma, Tanzania
7 Tanzania Official Seed Certification Institute, PO Box 1056, Morogoro, Tanzania8 The World Vegetable Centre, Regional Centre for Africa (AVRDC-RCA), PO Box 10, Duluti Arusha, Tanzania9 Association for Strengthening Agricultural Research in Eastern and Central Africa (ASARECA), Plot 5, Mpigi
Road, PO Box 765, Entebbe, Uganda*Author for Correspondence: [email protected]; Tel: +254 20 7224462; Fax: +254 207122150
Promoting farmer-led seed enterprises of African indigenous vegetables 169

Through the private sector-mediated farmer-led seed enterprises model in Kenya, farmers are earning on an average US$4,500 per annum from indigenous vegetable seed production. One exceptional farmer earned up to US$17,000 in 2010. Similarly, from the training and inspection undertaken by the government seed certification agency, farmers in Dodoma, Tanzania are now producing and selling high quality declared seed of African eggplant, amaranths and nightshade. These are quality seeds and have a mean germination and purity standard of above 90%. They are in high demand both locally and in Dar es Salaam, fetching a price of approximately US$3 per kilogram.
Keywords: African indigenous vegetables, technology, dis-semination, farmer, seed enterprise, income, Kenya, Tanzania
Introduction
Food security, a situation that exists when all people at all times have physical, social and economic access to sufficient, safe and nutritious food that meets dietary needs and food preferences for an active and healthy life (FAO 2011) consists of three main components: food availability, access and utilization (Lobell and Burke 2010). Nutrition is an important input for attaining the Millennium Development Goals (MDGs), whereas nutritional status is a key MDG indicator of poverty and hunger, and directly contributes to the MDGs related to health and education. Improved nutritional status leads to a focus on gender equity, reduces the risk of child mortality, improves maternal health, and improves the ability to combat disease. Undernourishment and malnourishment are used as measures of food security. It is estimated that 925 million of the global population are undernourished. Of these, 239 million (26%) are inhabitants of sub-Saharan Africa (SSA) (FAO 2010).
The problem of food security in SSA is aggravated by micronutrient deficiencies, also known as “hidden hunger”, a major impediment to social and economic development (FAO 2010). Malnutrition can impair child growth and even cause mortality, especially among vulnerable populations of women and children. Iron eficiency, for example, during childhood and adolescence, impairs physical growth, mental develop-ment, and learning capacity. In adults, iron deficiency (anaemia) reduces the capacity to do physical labour and increases the risk of the mother dying during delivery or in the postpartum period(Stoltzfus 2001). In Kenya and Tanzania, 40% to 45% of the pregnant and nursing women suffer from anaemia, while 25% to 30% of the children under five are stunted and highly
susceptible to infectious diseases (WHO 2002). In addi-tion, zinc deficiency is an important cause of stunting (Brown and Wuehler 2000; Roy et al. 1999; Umeta et al. 2000). Hence, interventions that deal with poor diet quality and related deficiencies of vitamin A, zinc, iron, among others, are important for achieving full food security in vulnerable populations.
African indigenous vegetables (AIVs), including Spiderplant (Cleome gynandra), African nightshades (Solanum villosum and Solanum scabrum), amaranths1 (Amaranthus spp.) Jute mallow (Corchorus olitorius), cro-talaria (Crotalaria ochroleuca and Crotalaria brevidens) and African eggplant (S. aethiopicum), have traditionally been significant contributors to food security and nutrition for smallholder farmers in the East and Central Africa (ECA) region (Onim and Mwaniki 2008; Abukutsa 2010). These AIVs are rich in micronutrients such as iron, zinc, vitamin A, and contain non-nutrient substances called phytochemicals, which help protect people against non-communicable diseases. The Spiderplant, for example, has been reported to relieve constipation and to facilitate child birth (Heever and Venter 2007), while African nightshade has been documented to cure stomach ache (Adesina and Gbile 1984). The AIVs are also known to contain substantial amounts of antioxidants that scavenge for and bind to harmful radicals, which have been linked to ailments such as cancer, diabetes and cardiovascular diseases. In addition, AIVs improve palatability and add variety to diets, especially those of the poor, and are particularly valuable sources of food during emergency periods such as flood, famine, drought and war. They are highly valued in the African diet as accompaniment to carbohydrate-based staples, and have an advantage over staple crops as they have shorter cycles, are faster growing, require little space and can maximize scarce water supplies and soil nutrients better; further, they are less risk-prone (Weinberger and Lumpkin 2007) and are rarely affected by common pests and diseases that affect other vegetables (Abukutsa 2010).
Improving food security requires improved food productivity, as well as health and nutrition of the undernourished and micronutrient-deficient chil-dren, youth and women. Dietary diversification is important in providing adequate quality nutrition. Therefore, adopting a food-based strategy that focuses on increased consumption of vegetables, fruits and legumes is a cost-effective and sustainable intervention
1. Amaranth although considered not indigenous to Africa, is included in this context to distinguish it from the more temperate kinds of leafy vegetables like the brassicas (cabbage and so forth). Besides, consumers and farmers alike consider amaranth as a ‘local’, ‘indigenous’ (mboga ya asili) vegetable.
170 First ASARECA General Assembly, Volume 2

to tackle nutrition deficiencies and lifestyle disorders (Gockowski et al. 2003).
It has been well established that AIVs contribute significantly to improve nutrition, food security, incomes and overall livelihoods for the rural and urban poor, but the potential to meet the growing demand for these vegetables in the region is limited by the lack of good quality seeds (Onim and Mwaniki 2008). Although peri-urban communities grow AIVs for commercial up market outlets like supermarkets and green grocery stores, they are often frustrated by poor quality seed. The majority of farmers use seeds either saved from a previous crop or obtained from open-air markets. Seeds from these sources tend to have problems of purity, especially the mixing of different varieties, and their mean germination rates are rarely above 50% (Onim and Mwaniki 2008). Farmers need pure seed to meet the market demand, but such clean quality seed is unavailable in the market. This undermines the quality of vegetables produced by farmers. An effective seed supply system and an assured market for seed is critical in successfully unleashing the potential of AIVs to improve food security and livelihoods, especially for the most vulnerable populations. For example, women, who often constitute a considerable part of the vulnerable population, can have access to an income through AIV. Earning an income empowers them and gives them a say in household decision-making. Further, they are likely to devote the income to household needs and education investments (FAO 2001).
This paper describes the on-going pilot project aimed at evaluating and promoting farmer-led seed enterprise models for sustainable supply of quality AIV seeds of AIVs in Kenya and Tanzania.
Project concept and approach
To address the issue of unavailability of quality seeds of AIVs in the region, the Association for Strengthening Agricultural Research in Eastern and Central Africa (ASARECA), in collaboration with CABI and other partners in Kenya and Tanzania, initiated the project Scaling up farmer-led seed enterprises for sustained productivity and livelihoods in Eastern and Central Africa in December 2009. The project is implemented in collaboration with Kenya Agricultural Research Institute (KARI), Kenya Seed Company Ltd. (KSC) and Technical Adoption Through Research Organization (TATRO) in Kenya. The partners in Tanzania include Horticultural Research and Training Institute Tengeru (HORTI-Tengeru), Tanzania Official Seed Certification Institute (TOSCI), INADES-Formation
Tanzania and The World Vegetable Centre, Regional Centre for Africa (AVRDC-RCA). The key objective of the project is to evaluate three farmer-led seed enterprise (FLSE) models on AIVs to generate evidence-based and rigorously analysed conceptual models for economically sustainable enterprises to improve production of seeds of AIVs in the region.
The project fits well with the fourth economic pillar of the Comprehensive Africa Agriculture Development Programme (CAADP), which was established as part of the African Union and New Partnership for Africa’s Development (AU/NEPAD). CAADP aims to “improve agricultural research and systems in order to disseminate appropriate new technologies, and increasing (sic) the support given to help farmers to adopt them.” The project is closely aligned to the Results2 frame of ASARECA, and to that of the Knowledge Management and Up-scaling (KMUS) Programme of ASARECA. It contributes directly to the ASARECA goal of “enhanced utilization of agricultural R & D innovations in ECA” and three of the five ASARECA results (outputs). As an action-oriented research activity, the project catalyses uptake, by increasing the availability of quality seeds of improved varieties of AIVs in uptake pathways in the project areas (ASARECA Result 2), and adds value by using quantitative and qualitative methods to rigorously analyse options for scaling-up. The participatory approaches used by the multidisciplinary team in Kenya and Tanzania to identify the knowledge gaps and to implement capacity building programmes for both men and women through the training of trainers (ToT) and farmers, help promote gender and social equity, thus ensuring validity and legitimacy of the findings (ASARECA Result 4). This is in tandem with ASARECA’s strategic plan for gender mainstreaming. The emphasis on dissemination, including the formulation of guidelines and recommendations for use beyond the end of the project, will ensure that the knowledge generated by the project, especially on farmer-led seed enterprise models for producing AIV seeds, is widely available and promote sustainability and replicability (ASARECA Result 5).
2. 1. Strengthened gender-responsive governance and management systems in ASARECA
2. Enhanced generation of demand-driven agricultural technologies and innovations
3. Enhanced adoption of policy options by decision makers to improve performance of the agricultural sector in ECA
4. Strengthened capacity for implementing agricultural research for development in ECA
5. Enhanced availability of information on agricultural innovation in ECA
Promoting farmer-led seed enterprises of African indigenous vegetables 171

Methodology
A regional inception workshop was organized, followed by a local in-country inaugural workshop, where various stakeholders, including change agents in working in the AIVs value chain, were identified, brought together and actively involved in the design and implementation of the project activities. Staff in the government extension, non-governmental organizations and community-based organizations, research organizations and universities, regulatory bodies, seed companies, and farmer seed growers (individual/group) were identified; other actors with whom the project would work indirectly were also identified. During the workshop, a design worksheet for the programme framework and a gender-sensitive strategy map was developed. The strategy map represented the activities that the project would undertake to directly influence the identified change agents (individual, group or organization), or indirectly influence the environment in which the change agents operated, to achieve the desired project outcome.
Using a multistage random sampling procedure, a baseline survey was first conducted to establish the pre-adoption socio-economic situation and production practices of the participating farmers. During the surveys, a participatory analysis of the needs and constraints of AIV seed growers and markets, as well as existing agronomic practices and post-harvest handling was undertaken. This formed the basis for subsequent activities, including, mobilization of farmers and development of a participatory training programme for master trainers and farmers (seed growers) to build capacities in local production and marketing of quality seed of identified priority AIV crops in their respective countries. With the technical support of the Monitoring and Evaluation Unit of ASARECA, as well as the gender mainstreaming department, a project performance monitoring plan, with clear gender-sensitive indicators for tracking progress, was developed. Given the strong capacity strengthening element and model evaluation aspects embedded in the project approach, the monitoring and learning processes adopted in the project were augmented by the outcome mapping.
Achievements
Identification and validation of farmer-led seed enterprise models
Based on the existing policy and regulations regarding seed production and marketing in Kenya and Tanzania,
three farmer-led seed enterprise models for AIVs are being evaluated. (i) Private sector seed company-mediated model: In this
model, farmers in western Kenya were linked to a private seed company, the Kenya Seed Company Ltd., through its subsidiary, Simlaw, which is engaged in vegetable seed marketing in East Africa. The process involved registration of the seed growers and working closely with seed inspectors from the Kenya Plant Health Inspectorate Services (KEPHIS) for seed inspection. In Tanzania, linkage of farmers in the Arusha region to East African Seed, Multiflower/Mkulima, Iffa Seed, Kibo Seed and Meru Agro-Tours seed companies was underway with TOSCI maintaining quality control of the seeds produced.
(ii) Research-mediated model: In this model, farmers were organized in groups to work with a National Agricultural Research Institute to produce quality seed. In Kenya, the groups were working with KARI. Through KARI seed-merchant licences, the farmers were facilitated to produce and market seed, because, their produce had not been independently certified. In Tanzania, farmers were working with TOSCI and able to produce and package quality declared seed (QDS) of African eggplant, amaranths and nightshade. As a result of these efforts, the livelihoods of farmers in the two countries improved along the scale; they could soon be registered to produce certified seed.
(iii) Informal grade improvement model: In this model, AIV seed was improved and distributed to farmers as starter seed, which they sold in the open market. This expanded the reach of quality seed to those who had no access to certified or QDS.
Strengthening of seed growers’ capacities
Building the capacity of farmers to produce and market AIV seeds as an enterprise contributed towards promotion of agriculture and food security at the local, national and regional levels. A training curriculum on AIV seed production was developed based on the identified needs for the farmer-led seed enterprises and used to train farmers. The training covered the technical aspects of seed production, including participatory approaches, enterprise selection, identification of seed production sites, nursery management, good agricultural practices for crop, pests and disease management, isolation distance, rouguing of off-types, harvesting and post–harvesting practices, record keeping, seed business management, seed regulation
172 First ASARECA General Assembly, Volume 2

and marketing. ToT was carried out for 19 farmers (7 women) in Kenya and 10 farmers (3 women) in Tanzania. After the training, the graduates conducted season-long training for farmers at the identified project sites, in line with the cropping season and the stage of growth of the respective AIV seed crop. Totally, 340 farmers (42.4% women) have so far been trained in western Kenya. The farmers used the knowledge to improve their production of African nightshade, crotolaria, jute mallow and African eggplant seed.
Preliminary data for the private sector-mediated model shows that a smallholder can profitably produce AIV seed. Forty five (35 male, 10 female) farmers are currently engaged in the model (figure 1), with the majority of the farmers having more than one seed crop. In Kenya, the farmers earned, on average, US$4,500 per year3 from indigenous vegetables, with an exceptional farmer earning as high as US$17,000 per annum through the seed company-mediated farmer-led seed enterprises (figure 2). It was noted that the productivity (seed yield/acre) increased by 10.6%, 40.1% and 59.4% for nightshade, jute mallow and crotalaria, respectively, during the second cropping season. This is attributed to the improved management (good agricultural practices) of the seed crops by the farmers as a result of the training conducted under the current project.
In addition to the training, the project initiated the development of descriptors and bulking of foundation seed for spiderplant and amaranths to ensure a sustainable supply of starter seed to growers in Kenya who have no formal contracts with seed companies. The breeder seed originally obtained from the World Vegetable Centre, Regional Centre for Africa and subsequently improved and maintained by Lagrotech Seed Company was used. It is estimated that, with an average yield of 172 kg per acre, the starter seed of Spiderplant so far produced would be able to generate an income of US$7,785.00 per acre in one cropping season.
Through the training and inspection by the government seed certification agency, farmers in Dodoma, Tanzania are now producing and selling high quality seed. For example, they are producing seed of the African eggplant with mean germination rate and seed purity rate of 94%; amaranths with mean germination rate and seed purity rate of 92%; and nightshade with mean germination rate and seed purity rate of 99% (Table 1). The seeds are in high demand locally and in Dar es Salaam, and fetching good prices at about US$3 per kg.
3. 1US$ = Ksh80
Figure 1. Number of farmers producing seeds of African indig-enous vegetables under a private sector seed company-mediat-ed model in western Kenya during the 2010 cropping seasons.
Table 1. Quantity and quality standards of Quality Declared Seed (QDS 1) produced by farmers in Dodoma, during the November 2010 cropping season
CropYield (kg)
Female Male TotalAfrican eggplant - 4.0 4.0Amaranths 75.0 585.0 660.0Nightshade 3.5 2.8 6.3
Germination (%)Female Male Mean
African eggplant - 94.0 94.0Amaranths 92.2 92.3 92.3Nightshade 98.0 100.0 99.0
Purity (%)Female Male Mean
African eggplant - 94.0 94.0Amaranths 92.2 92.3 92.3Nightshade 98.0 100.0 99.0
Figure 2. Income from production of seeds of African indig-enous vegetables under a private sector seed company-mediat-ed model in western Kenya during the 2010 cropping seasons.
Promoting farmer-led seed enterprises of African indigenous vegetables 173

Group strengthening and institutional capacity building
The first step in building farmers’ seed enterprise was creating awareness regarding the benefits of seed production, including profitability of such a business. Through a participatory process, the farmers groups were organized into better-structured autonomous producer groups, each with a democratically elected leadership and constitution. The groups were assisted to register to have a legally recognized status, which is essential to build trust and a sense of security among the group members. This also facilitated their access to financial services for savings and credit. For example, following the training in marketing and governance, two farmer groups, the Akikieun Vegetable Growers Group and the Korosiondet Kilimo Bora self-help group in Kenya, were formalized and registered as a community-based organization to maximize economies of scale. The groups also provided a mechanism for information sharing.
Contribution to promoting improved technologies in uptake pathways
With strong linkage with research institutions, both the national agricultural institution and the African Vegetable Research and Development Centre, Regional Centre for Africa (AVRDC-RCA), improved varieties were tested and selected by farmers for promotion. The market for AIV is characterized by variations in consumer preferences; seed producers were able to access varieties that meet these market demands. For example, some consumers (especially in urban cosmopolitan areas) preferred variants of African Nightshade that are less bitter; in such cases, growers
could access quality seeds of the broad-leafed variety. Other consumers, for example, in western Kenya, preferred the more bitter varieties, whose demand they could also meet. The linkages of the seed producers with research enabled access to foundation seed of these varieties. Improved varieties of different kinds of AIV handled in the project are now in uptake pathways in Kenya and Tanzania (picture 1 ).
Contribution to food security and poverty alleviation
Testimonials from participating farmers in Kenya and Tanzania indicate that the project is making a significant contribution towards people’s livelihoods. The vegetables contribute towards food and nutrition security and through crop diversification, including vegetable production and the seed enterprises, significant changes are visible in household incomes.
For example, Mrs Michel Orone, a window who grew seed under the private sector seed company-mediated model has built a permanent house from the income earned from selling quality seed of nightshade, crotalaria and beans. Mrs Orone used part of her income from the sale of seeds to pay the school fees (US$750) for her two grandchildren (orphans) in secondary school. In addition, during the 2010 cropping season, she employed, on average, eight casual labourers (men and women) for three months, each earning approximately US$1.5 per day. More testimonies, including farmers being able purchase motor cycles worth US $750 each, are being documented. Similarly, Mr and Mrs Boazi Sebai, QDS growers in Kongwa, Tanzania, spent Tsh80,000 (US$ 47) to meet their expenses to grow seed, including buying improved seeds. They harvested 300
Picture 1: Smallholder farmers harvesting leaves of spiderplant (left) and amaranths (right) in western and central Kenya, respectively.
174 First ASARECA General Assembly, Volume 2

kg of amaranth seed, which they sold, earning a total of Tsh750,000 (US$ 440). From this income, they are now constructing a permanent house (picture 2).
Lessons learnt• Production of quality AIV seeds requires a range
of skills and capacities at various levels, from planning, management of seed production to marketing. Skilled and knowledgeable people are required at all levels in the seed value chain.
• Improving farmers’ skills and knowledge in seed quality management, post-harvest handling and marketing could enhance uptake of these new enterprises.
• Besides technical support, financial support for seed production is essential to enable farmers acquire the required inputs, including simple labour-saving technologies for wet seed processing for crops such as Nightshade.
• Farmer- led seed enterprises can prosper under a favourable policy environment and if the required capacities and effective linkages are in place.
• The linkages between the seed growers, seed companies, and R & D organizations and institutions have enabled the seed growers to acquire the relevant skills to improve productivity. The agricultural extension system needs to continue sensitizing farmers to use quality seed.
• Success of farmer-led seed enterprises is based on strengthening institutional, technical and organization and governance of the groups; building partnerships with regulators for seed quality control; and providing basic seed.
• Since men, women and youth participate in these efforts, the farmer-led seed enterprises contribute to gender empowerment and inclusive development.
• Strengthening of seed producers’ groups provides a mechanism for information sharing among the smallholder farmers who want to improve their knowledge and skills in seed production and marketing.
• While the current project was based on an identified lack of seed and, therefore, focused on development of seed enterprises, for these businesses to continue to flourish, there has to be a continued growth in the demand for vegetables and, in turn, for seed. A sustained demand for vegetables in both local and urban markets within the country and in the neighbouring countries is necessary to expand the market for seed. Similarly, sensitization of smallholders on the need to use quality seed would also boost the growth and sustainability of the emerging AIV seed enterprises.
Conclusion
Validation of the farmer-led seed enterprises for AIVs is contributing towards food and nutrition security through crop diversification, as well as the improvement of livelihoods through better incomes. The success of farmer-led seed enterprise models for AIV is based on building good partnerships with a wide range of institutions and organizations for identifying, establishing and training seed growers. Building partnerships around these institutional linkages has been essential for the success of the project. This requires commitment of all partners, growers as well as local,
Picture 2: Mr and Mrs Boazi Sebai (left) in their amaranths seed multiplication plot. Their house (right), which is under construction using the proceeds from the sale of the seeds, in Kongwa District, Dodoma, Tanzania.
Promoting farmer-led seed enterprises of African indigenous vegetables 175

regional and international R & D agencies. Continuous support of farmer-led seed enterprises through capacity building of seed growers, particularly in seed production and marketing, is necessary to ensure that these enterprises become more efficient and profitable.
Acknowledgement
The work described in this paper was conducted as part of the activities of Project No. P056-09-P7-01-003 entitled, Scaling up farmer-led seed enterprises for sustained productivity and livelihoods in Eastern and Central Africa. This project was financed by the Multi Donor Trust Fund (MDTF).
The author also wishes to acknowledge the advisory and technical support from Dr Lydia Kimenye, Knowledge Management and Up-scaling Programme Manager.
References
Abukutsa MOO. 2010. African indigenous vegetables in Kenya: Strategic repositioning in the horticulture sector. Second Inaugural Lecture of the Jomo Kenyatta University of Agriculture and Technology.
Adesina SK and Gbile ZO. 1984. Steroidal constituents of Solanum scabrum subsp. nigericum. Fitoterapia 55(6): 362–363.
Brown KH and Wuehler SE. eds. 2000. Zinc and human health: Results of recent trials and implications for program interventions and research. The Micronutrient Initiative/International Development Research Centre, Ottawa, Canada.
[FAO] Food and Agriculture Organization. 2011. The state of food insecurity in the world. Food and Agriculture Organization of the United Nations,. Rome, Italy.
[FAO] Food and Agriculture Organization. 2010. State of food insecurity in the World. Food and Agriculture Organization of the United Nations, Rome, Italy. http://www.fao.org/ docrep/013/i1683e/i1683e.pdf. Accessed on 14 November 2011.
[FAO] Food and Agriculture Organization. 2010–11. The state of food and agriculture. Women in agriculture: Closing the gender gap for development. Food and Agriculture Organization of the United Nations, Rome, Italy.
http://www.fao.org/docrep/013/i2050e/ i2050e.pdf. Accessed on November 14, 2011.
Gockowski J, Mbazo’o J, Mbah G, Moulende TF. 2003. African traditional leafy vegetables and the urban and peri-urban poor. Food Policy 28: 221–235.
Heever E. van Den and Venter SL. 2007. Nutritional and medicinal properties of Cleome gynandra. Acta Horticulturae 752:127–130.
Lobell D and Burke M. 2010. Climate change and food security, adapting agriculture to a warmer world. Springer.
Onim M and Mwaniki P. 2008. Cataloguing and evaluation of available community/farmers-based seed enterprises on African indigenous vegetables (AIVs) in four ECA countries.
Roy S K, Tomkins A. M., Haider R et al . 1999. Impact of zinc supplementation on subsequent growth and morbidity in Bangladeshi children with acute diarrhoea. European Journal of Clinical Nutrition 53:529–534.
Stoltzfus RJ. 2001. Defining iron-deficiency anaemia in public health terms: A time for reflection. Journal of Nutrition 131:565S–567S.
Umeta M, West CE, Haidar J, Deurenberg P, Hautvast JG. 2000.Zinc supplementation and stunted infants in Ethiopia: A randomised controlled trial. Lancet 355:2021–2026.
Weinberger and Lumpkin . 2007. Diversification into horticulture and poverty reduction: A research agenda. World Development 35:1464–1480.
[WHO] World Health Organization. 2002. Nutrition pro-gramme (Bruno de Benoist,Ines Egli????), Micronutrient deficiency information system, iron deficiency anaemia. World Health Organization, Geneva.
176 First ASARECA General Assembly, Volume 2

Abstract
Water legislations recommend a 60 m to 200 m buffer strip around a water body; however, land shortage makes enforcement difficult. Nevertheless, where buffers satisfy socio-economic and ecological demands, there is a win-win situation. Modern beekeeping is one of the enterprises that can be undertaken in the buffer zone as a profitable enterprise for monetary and biodiversity conservation benefits. The benefits of beekeeping include provision of food (honey, pollen, brood), industrial raw material (beeswax candles, lubricants), medicine (honey, propolis, beeswax, bee venom) and income. In Tanzania, bee keeping is practised widely, but mainly using traditional methods, which account for 99% of the total honey and beeswax production, providing a good platform for understanding the effects of modernizing farmer bee practices on household incomes and conservation efforts around buffer zones.
The overall objective of the research was to promote adoption of sustainable NRM technologies through the development of a farmer-market value chain for honey as a stimulant to NRM investment. Specifically, the objectives were: (i) To evaluate the effect of introducing improved beehives on honey production; and (ii) To assess the effect on vegetation cover and biodiversity. Studies were initiated in Mwangoi and Migambo villages, Lushoto district, Tanzania, using modern beehives, specifically, the Sokoine University of Agriculture, Improved Tanzania Top Bar Hive or SUA-ITATOBE. Honey production, marketing, market linkages, vegetation regeneration and ground cover were monitored between 2008 and 2010, and used to calculate density, species abundance, dominance diversity indices, profit margin and discounted benefit–cost analysis. Beekeeping has become a commercial activity, carried out by both men and women, unlike what it was traditionally. With bees
‘policing’ the would-be land degraders, improved beekeeping has resulted in vegetation recovery and species diversity in the once degraded water sources and riverbanks. During 2008, 2009 and 2010, average honey production in the project sites increased from 69 kg, to 142.5 kg and 203 kg, and mean ground cover from 2.5%, to 22.5% and to 62.5%. Through improved honey harvesting, handling and packaging, farmers accessed markets in Lushoto town and Dar es Salaam. Profit margin (farm gate) ranged from TSh 834 to 1,111 per litre of honey.
Key words
Restoration; Biodiversity; Financial analysis; Benefit-cost
Introduction
A majority of the population in sub-Saharan Africa (SSA) depends on natural resources for their livelihoods, especially the rural population who rely on agriculture and other natural resources (World Bank 2002). In this context, use and management of land and other natural resources becomes important. The pressure on these resources has intensified due to population growth, commercialization and resource degradation. Against a background of a rapidly growing population, rising poverty levels, and low technological innovation and adoption, with inadequate institutional arrangements and structures for supporting sustainable NRM, declining agricultural and natural resource productivity in the region calls for concerted efforts.
Despite the challenges, there is a huge market potential in the region for natural resources products and services. Although research has generated a wealth of knowledge on suitable NRM approaches and techniques, the uptake remains low, particularly by subsistence farmers, who constitute the majority in the region. Extensive deforestation and encroachment
15. Modern beekeeping as an enterprise for monetary benefits, environmental rehabilitation and biodiversity conservation:
A case study of Lushoto District, Tanzania1Kimaro D.N., G.E. Mbeyale1, J.P. Hella1, G.C. Kajembe1, O. Semalulu2 and Mogaka, H.3
1Sokoine University of Agriculture P.O. Box 3003, Morogoro, [email protected]
2National Agricultural Research Laboratories. P.O. Box 7065, Kampala, Uganda
3ASARECA, P. O Box 765, Entebbe, [email protected]
Modern beekeeping as an enterprise for monetary benefits, environmental rehabilitation and biodiversity conservation 177

on marginal lands has led to reduction in land cover, widespread runoff and erosion, siltation and pollution.
These challenges are evident in both the lowland and the major highlands in the region. The densely populated mountain areas are home to important conservation practices and there are multiple pockets where bio-diversity is protected. Water and soil management of these highlands has a big impact on those living in the lowlands. In fact, despite being “richly” endowed in natural resources (deep soils, relatively reliable rainfall), a majority of the population is poor and can hardly meet basic needs like food and shelter, and has no income security. In sum, the quality of life is poor.
Also, a large section of this population depends on agriculture for its livelihood, which has already felt the impact of environmental degradation. Additionally, poor infrastructure, limited access to markets and support services, inadequate crop diversification and enterprise farming strategies affect profitability (Scherr 1999). The situation is further aggravated by inadequate governance institutions to address divergent interests related to resource access and use. The population is trapped in a vicious cycle of land degradation and poverty, and the lack of resources and knowledge to generate adequate income and opportunities to overcome these challenges (Kirsten et al. 2009).
It is important to recognize that natural resources are dynamic—they are socially, economically and politically interlinked. Human capital, including the various institutions—economic and management systems, policies and social networks—define NRM approaches and their utilization patterns and extent. Therefore, identifying and promoting best-bet NRM and value addition technologies for increased production and marketability of the preferred enterprises will contribute to sustainable NRM. This will have to be done in collaboration with different farmer-market chain actors. Facilitation of dialogue between the various players and building sustainable value chains are likely to promote sustainable NRM. It is also important to nurture strategic partnerships that promote the uptake of such technologies among different stakeholders.
The Eastern Arc Mountains chain stretching for some 900 km from southern Tanzania to the TaitaHills in south-coastal Kenya, and the volcanic mountains, which include Kilimanjaro (Tanzania) Mount Kenya (Kenya) and Mount Elgon (Uganda) to mention a few, are a global biodiversity hotspot, with more than 2,000 endemic species of plant and animals (Lovett
and Wasser1993). However, around 40% of the plant species (800 out of more than 2,000) and 2% of genera (16 of about 800) are estimated to be endemic (Lovett and Wasser 1993; Lovett 1998; GEF 2002). The endemics are found in most of the forest types, as well as in intervening habitats, such as rocky outcrops, heath land, montane grasslands and wetlands (Lovett 1998). Increasing population, land scarcity and frequent droughts have led to an increase in cultivation of banana, maize, rice and horticulture in fragile lands, including the valley and wetlands. In addition, bush fires are common, caused by farmers preparing the land, hunters, firewood collectors and honey gatherers. These land degradation processes lead to loss of vegetation, widespread runoff and erosion, siltation, pollution and eutrophication of water bodies. It also leads to overexploitation of soil resources and loss of biodiversity as is evident in the major highlands like Mt. Elgon (Uganda), Mt. Kilimanjaro and Eastern Arc Mountains (Tanzania) and Ethiopian Highlands.
Environment and NRM legislations give a blanket recommendation of a 60 m to 200 m buffer strip around a water body (lake or river). However, increasing land shortage hinders enforcement of such legislations. A win-win situation is required where the buffer strip satisfies both socioeconomic and ecological needs. Modern beekeeping offers a solution.
Honey is a highly marketable commodity in Tanzania, ECA and outside the region. However honey production is low. Beekeeping in Tanzania (like most of ECA) is mostly carried out using traditional methods based on beehives made from log, bark, reeds, pots (95%), commonly hung on trees and far away from the household. This method accounts for 99% of the total production of honey and beeswax. Modern beekeeping and training farmers in the production and marketing of better quality honey can act as a stimulant to farmers to conserve degraded lands, water bodies and/or water sources while realizing the economic benefit that such conservation efforts offer.
A research project was hence undertaken with the overall objective developing a farmer–market value chain for honey, to enhance adoption of sustainable NRM technologies and stimulate investment in NRM.
Specific objectives
The specific objectives of the research were: (i) To evaluate the effect of introducing improved bee hives on honey production; (ii) To assess the effect of improved beekeeping on vegetation cover and biodiversity.
178 First ASARECA General Assembly, Volume 2

Materials and methods
Description of the study site
The project was implemented in Uganda (Mbale and Bududa districts), Kenya (Siaya district) and Tanzania (Lushoto district) (figure 1). Within the project sites, priority enterprises were selected in a participatory manner based on their contribution to food security and income, their production costs and marketability. On this basis, banana and groundnuts were selected in Uganda, grain amaranth in Kenya and honey in Tanzania. After exploring the issues affecting the marketability of the selected enterprises, areas of intervention were identified and research areas spelled out. This paper focuses on Tanzanian project.
The Western Usambara Mountains (WUM) are located in Lushoto district, Tanga region, north east of Tanzania, between 0417627 to 0430952 E and 9492811 to 9465655 N (fig. 1). The mountains cover about 35
km2 and contain 23 gazetted forest reserves (Nyambo et al. 2006). The altitude ranges from 400 m to 2500 m a.s.l. The rainfall ranges from 600 mm to 2,000 mm p.a., bi-modally distributed with short rains from October to December and long rains from March to June, with a peak in April. Temperature varies from 25oC to 27oC at 800 m a.s.l. and from 17oC to 18oC at 1,500–1,800 m a.s.l. The mean annual relative humidity of the study area is 70%.
Geomorphology and soils
The WUM were formed by block-faulting of the Precambrian crystalline rocks 180–290 million years ago (Griffiths 1993). The successive erosion, uplift and reactivation of the faults have shaped the present landscape (ww.easternarc.org). The slopes are predominantly gently undulating to steep, intersected at the base by narrow flat and broad U-shaped valleys. They are also cut by numerous gullies. Some of these gullies carry permanent streams, while the rest carry
Figure 1. Location of project sites in Lushoto district, Tanzania.
Modern beekeeping as an enterprise for monetary benefits, environmental rehabilitation and biodiversity conservation 179

water only during the wet season. The rocks are assigned to the Usagaran System and have been subjected to several periods of metamorphism and migmatization. They represent a thick series of highly metamorphosed calc-argillaceous and calcareous sediments, with minor carbonaceous beds and with intercalated igneous rocks. Minor intrusions of gabbro, serpentinite, pyroxenite and anorthosite have been affected by phases of movement and metamorphism (Bagnall 1963; Muhongo and Lenoir 1994; Maboko and Nakamura 2002). Due to complex movements and erosion that have affected the landscape, rock outcrops occur in many places, including the escarpment and summits of ridges. However, the geological sequence of the rocks tends to be rather uniform (Mutakyahwaet al. 2003). The most common parent materials of the soils in the area are (acid) gneiss, pyroxene and hornblende granulites. Bauxite deposits have been observed in many places in the study area (Mutakyahwaet al. 2003).
Soils are mainly clays, sandy clays and sandy clay loams, varying in colour from red through grey-brown to black, characterized by low pH values and rich in iron, manganese and magnesium. According to Neerinckx (2006), the dominant soils on the slopes are characterized by an argic horizon, often strongly eroded, and thus acidic (acrisols, acricferralsols, lixisols and alisols). Besides, less eroded younger soils (luvisols and lixisols) can be found. The soils in the valley floorsare subject to a fluctuating groundwater table (fluvisols and gleysols), while the hilltops are characterized by superficial soils, where an abundance of rock and petro-plinthic outcrops rich in ironare present (Neerinckx 2006).
Hydrology, vegetation and land use
The main drainage pattern in WUM comprises rivers and streams. The rivers include Umba and Soni, which drain into the Indian Ocean and River Pangani respectively. Water from Pangani supports the Pangani and Hale hydropower generation facilities. The Migambo sub-catchment consists of four ridges, which drain into a stream running down to join River Mkuzi, a tributary of River Umba that crosses Mwangoi village.
The native vegetation is mountain rain forest (Kaoneka and Monela 2000). However, over time, most of the cover has been cleared for crop cultivation and plantation forest. The dominant vegetation in the study area varies with elevation (Kaoneka 1993), but broadly consists of natural forest Camphor-Podo vegetation, montane and afro-montane rain forest vegetation. The forest includes camphor (Ocoteausambarensis) with podo (Podocarpususambarensis and Podocarpuspensiculi)
and an undergrowth of Lanthuscirumilee and other shrubs. Associated species are Parinari excelsa, Pygeum Africanum, Ficalhoalaurifolie, Polyas spp., Macarangekilimandscharica,Chrysophylum spp.,Olea hochstetteri and Cassipoura spp. The major species of the plantations are cedar (Juniperusprocera), cypress (Cupressus lusstanica), Pinus radiate (Masunga 2009; Hubeau 2010). The montane forests are undergoing rapid degradation from different human activities (Stanleyet al. 1998).
Smallholder subsistence farming is the main economic activity for a majority of the households in Lushoto district (Mowo et al. 2002; Tenge et al. 2004; Davis et al. 2006), with more than 90% of the population depending on agriculture. Most cultivation is done on sloping land, where soil erosion is increasingly severe. The valley floors are intensively used for vegetable production, where water from furrow irrigation is used for irrigating horticultural crops. The dominant land uses include subsistence and cash crop agriculture (covering 58% of the area), orchards and commercial plantations (11%), indigenous protected forest reserves (16%), and pastures (15%) (Shemode 2002). The main cash crops are vegetables, fruits and Irish potatoes, while maize (Zea mays), cassava (Manihot esculenta), beans (Phaseolus lunatus) and potato (Solanum tuberosum) are the main food crops (Kamugisha et al. 2007). The average farm size is 1.8 ha per household.
The flora and fauna
The natural forest in WUM has diverse vegetation, ranging from sub-mountane to upper mountane. The vegetation may be sharply distinguished between montane rain and montane dry forests in which Ocoteausambarensis, Podo-carpususambarensis and Podocarpuspensiculy and a dense undergrowth of Lansthuscirumilee species dominate the southern portion of Shume, Sungwi, Hambalawei and Shagayu. In addition, the following species are known to be associated fauna Ficalhoa, Pygium, Rapanea, Fagaropsis and Cassipourea spp. The montane dry forest or cedar forest type occupies the northern and western portions of the Shume area and the dominant species here are cedar (Juniperusprocera), which is associated with the thick undergrowth shrubbery Fuclea, Teclea and Catha (Kiboga and Machange 2006). Except for the extensive anthropogenic activities in the reserve, the forest was supposed to have a characteristic continuous stand of trees that could attain a height of about 45 m or more. Generally, the forest in WUMs is evergreen throughout the year. The main native tree species in the entire forest and in the order of their dominance include Oco-teausambarensis, Podocarpususambarensis, Polysciasfulva, Newtoniabuchananiiand Entendofragmautirii (URT 2008).
180 First ASARECA General Assembly, Volume 2
A variety of animals, birds and insect species are common inhabitants in the forest reserves of WUMs. Animal categories found in the area include warthogs, black and white colubus monkeys, hares, baboons, rock rabbits, balloons, blue monkeys and squirrels among others, whilst reptiles consist of chameleons, lizards and snakes. A diversity of bird varieties include owls, swifts, francolins, kestrel, starlings, weavers, crow and eagles among many others and a number of insects like butterflies, ants, beetles, millipedes and centipedes (and other smaller organisms) (URT, 2008).
The study sites
Two pilot areas (Mwangoi and Migambo villages) located in WUM in Lushoto district, Tanzania were selected for this research. Mwangoi is in Mlalo division along River Umba, which is a trans-boundary river originating from WUM and ending in south-eastern Kenya. Migambo is in Kwai Division on the eastern part of the district. The importance of these areas as forest areas is increasing due to their potential as sources of water for both domestic and industrial purposes. The Mwangoi pilot area, which is partly owned by the community and the Lutheran Church, is under pressure due to the fact that the forest area has been encroached upon by human settlements, and agricultural activities have been accelerating erosion along the bank of the river. The Migambo pilot area, which characteristically is a catchment area, was managed as a farmland until recently, when the village government acquired it for conservation as a water source. Though the village government in Migambo strove very hard to conserve the area, fuel wood cutting and grazing disrupted their efforts. Beekeeping was introduced by the project to help discard environmentally unfriendly human activities, including farming, fuel wood collection and animal grazing.
The field trials
Field trials on honey production were initiated within the project sites to determine the input combination that optimizes production at least cost. This was the first step towards the optimization of production attributes within the first compartment of the Decision Support Tool (DST). The field trials used modern beehive technology (Sokoine University of Agriculture, Improved Tanzania Top Bar Hive or SUA-ITATOBE), to protect riverbanks and water sources as well as for biodiversity conservation in the selected pilot areas. On these sites, monitoring honey production (quantity and quality through post-harvest handling), marketing,
market linkages, vegetation regeneration and improving vegetation ground cover was undertaken.
Effect of beekeeping on vegetation restoration and conservation of degraded water sources and riverbanks
Data were collected through a fine scale survey focusing on the area where beekeeping was carried out by hanging beehives. Data collection was undertaken in May 2009, 2010 and 2011 for Mwangoi and in July during the same years for the Migambo pilot area. Before the actual data collection, a reconnaissance survey was carried out to estimate the area under study and to prepare sketch maps that facilitated layout of plots. Concentric nested circular plots with a radius of 15 m for the larger plot were adopted (De Vries 1986). Given the small area under study, the adopted sampling intensity was 10% so as to acquire data from almost all patches of forest. Therefore, three plots for Mwangoi and four for Migambo, each of 0.07 ha, were laid out, whereby an objective sampling technique was used to scatter plots at a distance not less than 50 m apart. Life-stages of all trees were counted, measured and identified to genus or species level in each nested circular plot as follows: 2 m radius of the plot–all seedlings (<30 cm tall, > 30 cm but < 1 cm dbh), 5 m radius–all saplings (≥1 cm dbh but < 5 cm dbh), 10 m radius–all sub-adults (≥ 5 cm but < 20 cm 10 dbh), 15 m radius–all adult trees with dbh ≥ 20 cm.
The data were used to calculate density, abundance and dominance of different tree species and diversity indices of the two pilot areas. Also, within a 1m x1m quadrant, all herbs and grasses were counted and identified to determine their composition and density. The reproductive condition of each identified plant was recorded by observing the presence of flowers, flower buds and fruits. A transect walk was undertaken with key informants in the pilot areas and other areas nearby where beekeeping was practised. Informants were also interviewed to capture their experience with beekeeping. Participant observations were also recorded to contribute to knowledge sharing and information exchange.
Data analysis
The data on vegetation species restoration were analysed to get the species composition, richness, diversity and their regeneration potential using the regeneration ratios. Species diversity was computed using Shannon’s
Modern beekeeping as an enterprise for monetary benefits, environmental rehabilitation and biodiversity conservation 181

and Simpson’s diversity indices. The Shannon Diversity Index was computed as:
H’ = -∑Pi*lnPi
Where H’ is the index of diversity, Pi is the importance value of a species as a
proportion of all species.
Simpson’s Diversity Index was computed as
C = ∑Pi2
Where C is the index number and Pi as defined above (Munishi 2001; Munishiet al. 2007).
Basic vegetation assessment based on species numbers, frequencies, basal areas, mean dbh and species “Importance Value Index” (IVI) were carried out and species with the highest IVI were referred to as the most “important” at that site. The IVI was calculated as follows:
Index of dominance = ∑ { }ni
N
2
Where ni= number of individual of a species (of one forest) N = Total number of individual of all species (of
one forest)
Relative density = Number of individuals of a species X 100Total number of individuals of all Species
Relative dominance = Total basal area of a species X 100
Total basal area of all species
Relative frequency = Frequency of Species X 100
Sum of all frequencies
Frequency = Number of quadrates in which a species is found
Cover Value Index (CVI) = Relative density + Relative dominance
Importance value index (IVI) = CVI + Relative frequency.
Results and discussion
Honey production, post-harvest handling and packaging
The project introduced the improved SUA-ITATOBE beehive for commercial production of honey and bee products as an incentive to conserving degraded river banks and water sources in Mwangoi and Migambo
villages of Lushoto district, Tanzania (figure 2). The SUA-ITATOBE beehive (wooden) has one opening that can be opened or closed, thus letting bees in or out at will (figure 2). This enabled farmers to keep bees right on their farm (figure 2): they could close the hive in the evening to enable them work on the farm the following morning, and open it after they were done with the farming. Today, beekeeping has become a commercial activity and is carried out even by women, unlike what it was traditionally.
The farmers’ group in Mwangoi village, with 26 members, after exposure during the training conducted by Sokoine University of Agriculture (SUA) researchers, purchased 10 SUAITATOBE hives from SUA at a cost of Tanzania Shillings (TShs) 300,000, with money the farmers themselves raised. The transport of the hives was facilitated by the project. The farmers then fabricated more beehives copying the prototype that was provided by SUA. By December 2011, the group had made 59 beehives, of which 23 were sold to the community at TShs 40,000 each. The group members have succeeded in making other equipment for honey harvesting, including processing buckets (the 3 column buckets with sieves), and protective gears (overall, gloves and smokers).
Farmers were also trained in better honey harvesting, handling and packaging methods, and linked to honey buyers in the locality, including Lushoto town and Dar es Salaam city for better market access (figure 3). The local carpenter in Mwangoi village established a tree nursery to ensure a constant supply of good quality timber for making beehives (figure 4). By December 2011, the group had sold 250 tree seedlings to other farmers at TShs 150 per seedling, earning the group TZS 37,500. The African bee is an aggressive colony; serving as ‘police’ to the would-be degraders, improved bee keeping has hence resulted in increased vegetation cover and species diversity in the once degraded water sources and river banks. Table 1 presents the sales of different equipment produced by the groups, earning a total revenue TShs 5,620,000 as off farm income. In addition, over the years, farmers have continued to harvest and sell honey (table 2). From 2008 to 2011, the group harvested 541litres and sold 265 litres of honey worth TZS 1,826,000, while the remaining 276 litres were consumed by the group members. The group aims at rearing 100 beehives, but this will depend on weather conditions and availability of space. The group also plans to purchase a water pump to supply water to the apiary and the vegetable gardens.
182 First ASARECA General Assembly, Volume 2

Figure 2: The SUA-ITATOBE beehive (wooden) with one bee entrance (opening) and a sliding shutter (picture on the top and bottom left) placed on a water source in Migambo village (right top) and on a farm in Mwangoi village (right bottom).
Table 1: Beehives, harvesting equipment, protective gears and processing equipment produced for sale by the group members
SN Gears Numbers of gears Price per unit TZS Sold units Revenue TZS Remarks1 Beehives 120 35,000 85 2,975,0002 Smokers 36 25,000 33 825,000 Three are used by the group members3 Harvesting attires 62 30,000 54 1,620,0004 Three column buckets
for honey processing 15 20,000 10 200,000
Total 233 182 5,620,000
Table 2: Honey production
Year/ season
Number of beehives per year
Number of individual beehives by gender Total number of
beehivesAmount of
honey collectedAmount of honey sold Price per litre Revenue TZSM F
2008 10 - - 10 88 72 4,000 288,0002009 10 8 2 20 120 54 5,000 270,0002010 14 13 6 33 220 52 7,000 364,0002011 17 22 10 49 113 87 8,000 904,000
17 22 10 48 541 265 1,826,000
Modern beekeeping as an enterprise for monetary benefits, environmental rehabilitation and biodiversity conservation 183

Figure 4: Tree nursery cultivated by farmers to ensure a constant supply of good quality timber for making beehives in Mwangoi vil-lage, Lushoto district, Tanzania.
Figure 3: Farmers in Mwangoi Village, Lushoto district Tanzania exhibiting improved honey post-harvest handling and packaging methods and harvesting gears.
184 First ASARECA General Assembly, Volume 2

Profitability analysis for honey
At the farm level
Table 3 compares the profit margins obtained by the bee keepers in the five villages. The profit margin per person per litre was estimated to be TZS 962, 1,111, 976, 956 and 834 for Lushoto town, Migambo, Lukozi, Mwangoi and Malindi villages respectively. The price charged per litre in Lushoto town was higher than the other areas, with Migambo having relatively high profit margins (1,111 TZS/L). This has contributed to higher production in Migambo compared to other villages.
At the local trade level
Local traders bought honey from the farm. The costs incurred by them included purchasing, packaging, transport, loading and unloading and other marketing costs (like levy and so forth), which were estimated. Profit margins at this level were low as compared to the retail level along the honey value chain. Table 4 shows that the average profit margin at the local trade level was TZS 962 per litre of honey. The low profit margin was attributed to high marketing costs–TZS 342 per litre of honey sold in the market. Assemblers bought raw unfiltered honey from the beekeepers, on which they had to incur relatively high processing costs.
At the wholesale level
Profit margin at the wholesale level was calculated as TShs 1,247 per litre of honey sold in the market (table 4). The marketing margin at this level was TShs 1,500, while the marketing cost was TShs 316 per litre of honey. The profit margin at the wholesale level was relatively low (as compared to the retail) but larger than that of assemblers. This could be explained by the fact that the three stakeholders denoted unequal sharing of marketing costs. The wholesalers, however, were likely to realize large gross profit margins, accruing from economies of scale due to large volume sales compared to the retailers and the others. These results concur with those of Mkamba (2006), who found that the net profit margin for retailers in Dar es Salaam was very high compared to that of wholesalers in the same market area.
At the retail level
Profit margin at the retail level was estimated to be TShs 1,538 per litre of honey sold in the market and the marketing margin per litre was TShs 1,800, while the marketing cost was TShs 306 (table 4). The relatively high profit margin at the retail level is due to the low marketing costs incurred per litre of pure honey
produced. Also the retail price charged per litre of honey on average is high when compared to other key actors in the honey value chain (TShs 6,000). The high price per litre of honey could be attributed to the increased demand for the product by neighbouring markets like Dar es Salaam, Tanga, Coast and Morogoro.
The costs and benefits of beekeeping for honey
Estimated benefit from keeping bees for honey
The estimated benefit from beekeeping for honey production in the study area was determined by the
Table 3: Profit margin at the farm level
DescriptionLushoto town Migambo Lukozi Mwangoi Malindi
Average yield per person /year (litre)
68 152 126 116 135
Average farm gate price(TZS)
4,100 4,000 4,000 4,000 4,000
Revenue 276,887 606,708 505,667 645,333 540,500Fixed costs 190,000 361,347 327,458 307,500 369,594Transport costs 8,600 21 313 16 667 14 200 18 500Labour costs 12,900 31,696 25,000 21,300 27,750Processing costs 6,722 5,125 5,970 4,450 5,067Loading and unloading costs
3,150 18,450 7,250 6,350 6,920
Total variable costs
31,372 76,856 54,887 46,300 58,237
Total costs 221,372 438,203 382,345 353,800 427,801Profit margin 55,514 168,505 123,322 111,533 112,699Profit margin per litre
962 1,111 976 959 834
Note: The costs were measured in Tanzanian shillings.
Table 4: Profit margin at the assembler, retailer and whole-saler’s levels
Description
TradersAssembler
(n=4)Retailer
(n=8)Wholesaler
(n=3)Average quantity of honey purchased per trader/year (litre)
1,250 1,325 1,200
Average buying price/litre
4,000 4,200 4,000
Average selling price/litre
5,000 6,000 5,500
Marketing costs/litre 343 306 316Profit margin/litre 962 1,538 1,247Marketing margin/litre 1,000 1,800 1,500
Note: The costs and margin are measured in Tanzanian shillings.
Modern beekeeping as an enterprise for monetary benefits, environmental rehabilitation and biodiversity conservation 185
selling price per litre of honey in the market. Honey business in the study area seems to be a paying business and very profitable since the benefits outweigh the costs incurred by beekeepers. The results show that the average price per litre of honey in the market is 4,000 TShs at the farm level and 5,000 TShs to 7,000 TShs at the retail market level (table 4).
Economic viability of beekeeping in the study area
In a related study, the economic viability of beekeeping was assessed for a period of nine years in five villages of Lushoto district, by focusing on net present value (NPV), benefit–cost ratio (BCR) and internal rate of return (IRR). Table 5 shows that the NPV values in Lushoto town, Migambo, Lukozi, Mwangoi and Malindi were TShs 346, TZS 282, TShs 589, TShs 54 and TShs 236 per litre of honey respectively. The NPV for all five villages were positive, indicating that the discounted present values of benefits exceeded the discounted present values of costs.
The positive NPV values were probably due to the low operational costs in beekeeping for honey production in the project villages. BCR and IRR were calculated to measure project worthiness in the long run. The BCR was 1.45, 1.33, 1.44, 1.38 and 1.43 for Lushoto town, Migambo, Lukozi, Mwangoi and Malindi villages respectively. Also, for all the villages, the calculated IRR was greater than the discounting rate of 20%. This implies that investment in beekeeping for honey in Lushoto district is economically viable.
The viability for traders was also assessed and the results are presented (table 6). The focus again was on NPV, BCR and IRR and covered local traders, retailers and wholesalers. The NPVs obtained for local traders, retailers and wholesalers were TShs 2,968, TShs 3,789 and TShs 2,809 per litre of honey respectively. The NPV for all traders were positive and was higher than that of beekeepers. The BCR for assemblers, retailers and wholesalers were 1.9, 2.0 and 1.7, while the estimated IRRs were 298%, 343% and 176% respectively. This implies that beekeeping for honey production and associated trading as an investment in Lushoto district is economically viable.
Biodiversity value of the rehabilitated water sources and river banks
Species diversity
The computed index of dominance for the two forest sites was 0.83 and 0.79 in Mwangoi and Migambo
respectively. The index of dominance measures the rate at which one or some species dominate the vegetation by their cover value. When this value is high, the stand is dominated by one or a few species. When the dominance index is low, all species have comparable cover values. The lower the index value, the lower the dominance of a single or a few species (Edward 1996). The high values, especially for Mwangoi, show that there are a few plant species thatdominate the community. The results in table 7, which indicate different Importance Value Indices (IVI)for different species in the two forest sites, show that the exotic tree species Acacia meansii is the one dominating the Mwangoi village forest site (IVI= 0.82), while, in Migambo, the dominant species is an indigenous tree Pyruscommunis(IVI=1.02).
Table 5. Summary of the beekeepers’ cash flow
Variable/litre Lushoto boma Migambo Lukozi Mwangoi Malindi
Fixed capital 13,304 6,969 7,666 10,975 9,045Labour cost 259 547 384 233 549Processing cost 336 256 299 223 253Loading/off loading
315 577 604 635 433
Total costs 14,387 10,381 9,208 12,221 10,646Discounted costs
15,035 14,451 11,799 14,059 12,855
Benefits 5,286 4,300 3,500 4,500 3,500Discounted benefits
21,766 19,224 16,959 19,391 18,349
BCR 1.45 1.33 1.44 1.38 1.43NPV 346 282 589 54 236IRR (%) 22 23 26 20 22
Note: The discounting factor used was 20%, which is based on the commercial recommendation and all costs and benefits were measured in Tanzanian shillings.
Table 6. Summary of the traders’ cash flow
Variables Assemblers Retailers WholesalersFixed capital 1,800 3,000 3,200Buying costs 4,000 4,000 4,000Labour cost 138 120 22Transport cost 63 28 63Processing cost 138 99 220Loading/off loading 33 28 29Total costs 6,172 7,280 7,534Discounted costs 5,617 6,417 6,704Discounted benefits 10,532 12,639 11,586BCR 1.9 2.0 1.7NPV 2,968 3,789 2,809IRR (%) 298 343 176
Note: The costs and benefits are measured in Tanzanian shillings.
186 First ASARECA General Assembly, Volume 2
Table 8 shows the diversity indices for the two sites. The Simpson’s and Shannon’s Diversity Indices for Migambo were 0.19 and 3.7 respectively, which show low diversity of plant species compared to many forests in West Usambara. Similarly, the Simpson’s Diversity Indices (SIDIs) and Shannon’s Diversity Indices (SDIs) of Mwangoi were 0.207 and 1.7, which are also low compared to many forests. SIDI indicates the probability that any two species encountered at random would be different, and its range is 0 ≥ SIDI < 1. SDI represents the quantity of ‘information’ per individual species, thus
giving an indication of the extent of species diversity in the system.
The greater the quantity of information, the more diverse the system and the higher the species diversity in terms of species composition of an ecosystem. Its range is > 0, without limit (Barbour et al. 1987; McGarigaland Marks 1995), and the higher the value, the greater the diversity. Values > 2 for Shannon’s Index have been assigned medium to high diversity (Barbour et al. 1987). Therefore, based on the results, though the biodiversity seems to be low, there have been signs of improvement over the years, given that the vegetation cover increased from between 15% and 20% above ground and between none at all and 5% ground cover in 2008 to between 40% and 70% above ground tree cover and between 40% and 55% ground cover at both sites.
The intensity of beekeeping and plant regeneration potential of the two sites
Beekeeping intensity and vegetation cover
In 2008, beekeeping was introduced in the area as a strategic approach to address conservation of both water sources, including river banks, and livelihoods in the two villages of Mwangoi and Migambo. In the two villages, people were organized into groups comprising between 20 and 30 members. The groups were trained in good beekeeping practices, group dynamics and marketing of bee products. Table 9 presents the intensity of beekeeping, management and vegetation cover changes over the three years. The number of beehives and honey production in the two villages for the three-year study period is also indicated. There was a significant improvement in honey production and vegetation cover status of the area.
In Mwangoi village, the site under study was a 1 km stretch along River Umba. By 2008, the river bank was highly degraded, being used for production of annual crops such as maize, beans and banana. After the introduction of beehives, the vegetation cover improved as people no longer used the area for crop production. Over the study period (2008–2010) the average vegetation cover for the two sites (Mwangoi and Migambo) increased from 2.5% ground cover and 17.5% above ground cover to 62.5% ground cover and 40% above ground cover (Table 9).
Most of the threats at the two sites, which included firewood cutting, grazing and cultivation, have stopped since bees have a policing effect–people stay away from sites where there are beehives as they are afraid of bee
Table 7: IVI values at Migambo and Mwangoi sites
Location Tree species IVI
Migambo
Pyruscommunis 1.021Solaneciomannii 0.469Prunusmritima 0.324
Albizia schimperana 0.312Acacia mearnsii 0.293Prunuspersica 0.264
Vernoniagalamensis 0.139Cussoniaholstii 0.089Cyprus distans 0.022
Mwangoi
Acacia meansii 0.826Grevilea robusta 0.804Eucalyptus sp. 0.661
Jacaranda mimosifolia 0.193Markamialutea 0.177Comiphora sp. 0.120
Acrocapusflexinifolius 0.089Dombeya sp. 0.056Albizia sp. 0.051Bridelia sp. 0.018
Table 8: Biodiversity indicators in Mwangoi and Migambo villages
Parameter Values
Mwangoi MigamboSpecies richness Trees Shrubs Herbs Climbers Fern Grasses
4012169003
3571211221
Number of plant families 23 23Density (stem ha-1)DbH ≥ 5cm 464 205Species diversity Simpson Index Shannon-Winner Index
0.2071.796
0.1913.755
Modern beekeeping as an enterprise for monetary benefits, environmental rehabilitation and biodiversity conservation 187

stings. This has enhanced vegetative regeneration as indicated in figures 5a, b, c, d, e and f. Recently, farmers have also reported an increase in the yield from fruit trees as a result of pollination by bees, for example, yield from Persea Americana, while other farmers have noted increases in beans and maize production in areas where bee hives are located in a farm plot. These results have been motivating more people to adopt the technology.
Plant regeneration potential of the two sites
Totally, 40 plant species (table 10) belonging to 23 plant families (table 8) were identified in Mwangoi; similarly, 35 plant species (table 11) belonging to 23 plant families (table 8) were identified in Migambo. The density of trees with diameter at breast height (DBH) ≥ 5cm were 464 stems ha-1 in Mwangoi, almost two times that recorded in Migambo, which was only 205 stem ha-1. More than 60% of the stems in Mwangoi had DBH less than 20 cm and in Migambo it was more than 80%. DBH of most of the native trees in both areas was less than 10 cm. However, the two pilot areas were highly disturbed but differed in their conservation history.
Mwangoi is a secondary forest, which regenerated with mainly exotic species Acacia mearnsii, Eucalyptus spp, Grevilea robusta and Jacaranda mimosifolia. Here, large trees are remnants of previously managed plantations, which were grown for fuel wood, building poles and timber.
Migambo is purely a young secondary forest, which recovered from a highly disturbed catchment forest and is currently dominated by shrubs and young trees of DBH less than 5cm. The density of tree regenerants at this site is 16,463 per ha, and regenerants of the other three life forms combined is 212,370 individuals per ha. In Mwangoi, the density of tree regenerants is 25,464 per ha and regenerants of other three life forms combined is 342,774 individuals per ha. The relatively low density of regenerants of tree species in Migambo could be attributed to the relatively few mature trees, which are the source of germplasm, and also suppression from shrubs that currently dominate the area. The densities
of regenerants in Mwangoi and Migambo are still higher compared to many forests in the Eastern Arc Mountains. High densities of regenerants are generally expected in young or disturbed forests like these and, with time, the two areas are capable of naturally restoring to dense forest. Normally, disturbed forests are regenerated by planting annual plants and shrubs that enrich the soils and support trees and the shrub undergrowth in the Mwangoi and Migambo forests are a positive sign.
Key lessons and challenges
Key lessons1. Modern beekeeping, when integrated into
community rural development programmes, can contribute to natural resources and biodiversity conservation, and, at the same time, enhance people’s livelihoods.
2. Beekeeping, as it is practised today in the highlands of Tanzania, is a technological intervention that satisfies both socio-economic and ecological demands, thus making it a win-win strategy for both the economy and the environment.
3. Modern beekeeping for honey production and associated trading is economically viable and is an incentive to small-scale farmers to adopt NRM.
4. Lack of or a limited and unreliable market for bee products is a major problem that inhibits the farmers from looking at beekeeping as a livelihood option.
5. Investing in profitable enterprises under prevailing market conditions through the Farmers Group Model (FGM) works as a stimulant towards ecological restoration of the degraded lands.
6. Direct marketing will cut down transport and other marketing costs, and small-scale beekeepers with a low working capital are likely to obtain reasonable profit only if they choose this marketing option.
7. The medium and large-scale beekeepers in the study area would do better business if they were
Table 9. Relationship between intensity of beekeeping, honey yield and vegetation status in Lushoto district, Tanzania (2008–2010)
Sites: YearsAverage no. of bee hives
Average honey yield, kg Management
Status of vegetation coverGround cover, % Above ground cover, %
Mwangoi & Migambo (average)
2008 10 45.0 Patrol the apiary, maintain and clean the beehives, regular visits to oversee the performance of the beehives
2.5 17.52009 25 142.5 22.5 30.02010 35 202.5 62.5 40.0
188 First ASARECA General Assembly, Volume 2

Figure 5. Extent of rehabilitation of a degraded river bank along River Umba at Mwangoi after intervention through modern beekeep-ing by the Mwamboa beekeeping group (2008–2010).
Installation of SUAITATOBE hives on a degraded river bank along River Umba at Mwangoi by the Mwamboa beekeeping group in 2008.
Extent of rehabilitation of the degraded river bank along River Umba at Mwangoi after the intervention through modern bee-keeping by the Mwamboa beekeeping group in 2009.
Extent of rehabilitation of the degraded river bank along Umba River at Mwangoi after the intervention through modern bee-keeping by the Mwamboa beekeeping group in 2010.
Installation of SUAITATOBE hives on a degraded water source at Kwaboli by the Tamillwai beekeeping group, Migambo,in 2008.
Rehabilitated water source at Kwaboli after the intervention through modern beekeeping by the Tamillwai beekeeping group in 2009.
Water storage tank constructed at Kwabolisub-village to supply water to three sub-villages after improvement of water supply and quality as a result of the intervention through beekeeping at the degraded water source in 2010.
Modern beekeeping as an enterprise for monetary benefits, environmental rehabilitation and biodiversity conservation 189

to sell their products in both wholesale and retail markets.
8. Mobilizing small-scale farmers into groups would help to manage and mitigate stakeholders’ diverging interests with respect to NRM.
9. For small-scale farmers to engage in NRM, eco-nomic interest is vital.
10. Holistic and integrated NRM of the catchment area is key to sustainable poverty reduction.
11. Existing knowledge and practices obtained from this study should inform and influence policy, strategies and investments.
12. The partnerships initiated between researchers and communities in this study are beneficial and should be applied to bring benefits to the small-holder farming community quickly and efficiently, and it could easily be up scaled to other similar environments.
Table 10: List of plant species identified at the Mwangoi site
Botanical nameVernacular
name FamilyLife form
Abutilon spp. Unknown Malvaceae ShrubAcacia meansii Wati Mimosoideae TreeAcalypha fruticosa Unknown Euphorbiaceae ShrubAcrocapus flexinifolius Unknown Caesalpinioideae TreeAgeratum conizoides Unknown Compositae HerbAlbizia sp. Mshai Mimosoideae TreeAspilia mossambicensis Mpaghasha Compositae ShrubBidenspilosa Kimbara/
mbwembweCompositae Herb
Bridelia sp. Unknown Euphorbiaceae TreeClausenaanisata Mjavikai Rutaceae TreeClerodendronrobundifolium Unknown Verbenaceae ShrubComiphora sp. Unknown Burceraceae TreeCrotoraria Unknown Papilionaceae ShrubCymbopogongiganteus Sporobulus Graminaeae GrassDodonea sp. Unknown Sapindaceae ShrubDombeya sp. Unknown Sterculiaceae TreeDrymariacordata Ugwiashighi Caryophyliaceae HerbEucalyptus sp. Mkaratusi Myrtaceae TreeGrevilea robusta Msongoma Proteaceae TreeHibiscus sp. Unknown Malvaceae ShrubIpomoea sp Unknown Convolvulaceae HerbJacaranda mimosifolia Mkrismas Bignoniaceae TreeJusticiabetonica Shikizi Acanthaceae HerbLantana camara Mvuti Verbenaceae ShrubMarkamialutea Mtalawanda Bignoniaceae TreeMicrogosasp Unknown Compositae GrassOxalis sp. Unknown Oxalidaceae ShrubPanicumtrichocladum Ukokamdogo Graminaeae HerbPhylunthus sp. Unknown Euphorbiaceae GrassPhylunthus sp. Unknown Euphorbiaceae ShrubPteridium sp. Silu Dennstaedtiacea ShrubRinchosia sp. Unknown Papilionaceae HerbSetariachevalieri Unknown Graminaeae HerbSolanum sp. Mtura Solanaceae ShrubSonchus sp. Unknown Compositae HerbTargetisminuta Unknown Compositae ShrubTiumpheta sp. Unknown Tiliaceae ShrubTuriaea robusta Dwayu Meliaceae TreeVernoniamyriantha Unknown Compositae ShrubVitexstricheri Unknown Verbenaceae Shrub
Table 11: List of plant species identified at the Migambo site
Botanical nameVernacular
name FamilyLife form
Acacia mearnsii Miwati,Wati Mimosaceae TreeAcalypha hirtella Mzindu Euphorbiaceae ShrubAgeratum conyzoides Beenge Asteraceae HerbAlbizia schimperana Mshai Mimosaceae TreeBasella alba Ndeema Basellaceae ClimberBidenspilosas Mbwembwe Asteraceae HerbBruceaantidysenterica Unknown Simaroubaceae ShrubCentallaasiatica Unknown Umbelliferae HerbChysanthemoidesmonilifera Kibugha Asteraceae/
compositaeHerb
Clausenaanisata Mjavikai Rutaceae ShrubCommelina Africana N'kongo Commelinaceae HerbCrotalaria Komanguku Fabaceae ShrubCussoniaholstii Mntindi Araliaceae TreeCyprus distans Ndago Cyperaceae SedgeGrewiacalymmosepala Mkolekole/
mkoeTiliaceae Shrub
Helichrysumschimpari Zumbankozo Asteraceae/compositae
Herb
Kalanchoedensiflora Sopolwa Crassulaceae HerbOxalis latifolia Kidadaishi Oxalidaceae HerbPassifloraedulis Mkakaa Passfloraceae ClimberPennisetumclandestinum Kainde Poaceae GrassPlectrunthusedulis Kizughwa Lamiaceae ShrubPrunusmritima Manyama Rosaceae TreePrunuspersica Mfyoksi Rosaceae TreePteridiumaquilinum Shiu Dennstaedtiaceae FernPyruscommunis Peas Rosaceae TreeRubusniveus Mshaa Rosaceae ShrubRuelliapatula Unknown Acanthaceae ShrubRumexusambararensis Nywanywa Polygonaceae HerbSeneciodeltoideus Uwenge Asteraceae ShrubSolaneciomannii Mguanguzo Asteraceae ShrubSonchusoleraceus Mshunga/
mchungaAsteraceae Herb
Tagetesminuta Bangipori Asteraceae ShrubTurraea robusta Mleawana Meliaceae TreeVerbena rigida Unknown Verbenaceae HerbVernoniagalamensis Mhasha Asteraceae Shrub
190 First ASARECA General Assembly, Volume 2

Conclusions and recommendations
Conclusions1. Environment and Natural Resource Management
Legislations give a blanket recommendation of a 60 m to 200 m buffer strip around a water body (lake or river). However, a growing land short-age hinders enforcement of such legislations. A win-win strategy is required, where the buffer strip satisfies both socioeconomic and ecological needs. Modern beekeeping offers an innovative approach to improve people’s livelihoods while promoting vegetation restoration and biodi-versity improvement at the degraded sites. This study, wherein modern beehives, namely SUA-ITATOBE, were used, confirms the above hypothesis.
2. The use of SUA-ITATOBE (which are made of wood) enabled farmers to keep bees right on their farm, transforming beekeeping into a commercial activity that both men and women could undertake, unlike in the past.
3. Beekeeping plays a major role in the socio-economic development and environmental conservation of several countries in the tropics. The Lushoto district in Tanzania has a favourable environment for beekeeping due its microclimate and flora, attracting bee colonies. These hives produce organic honey, which is in high demand in both local and international markets. Lack of or limited and unreliable markets for bee products is a major problem facing the sector.
4. Based on the study findings, the following conclusions are worth noting regarding options for marketing the honey:• Beekeepers, local traders/assemblers, whole-
salers and retailers are the key actors engaged in the markets.
• There are two marketing options for the produce: (i) direct marketing; (ii) indirect marketing. In direct marketing, the beekeepers sell the honey to the final consumers, while, in indirect marketing, they sell the honey through brokers and/or intermediaries.
5. The study revealed further that beekeeping for honey production and associated trading is economically viable based on the calculated NPV, BCR and IRR. The results indicated that the prices and margins obtained by the different actors in the
honey value chain varied significantly, with the retailers and wholesalers obtaining significantly higher profit margins despite the high production costs. In comparing the percentage share of the final price paid by a consumer, beekeepers obtained a lower share than wholesalers, local traders and retailers.
6. Direct marketing will cut down transport and other marketing costs. Small-scale beekeepers with low working capital are likely to obtain a reasonable profit if they opt to sell directly to the final buyer. The medium and large-scale beekeepers will be able to do better business if they sell their products in both wholesale and retail markets.
7. The study demonstrates that there is a significant increase in the densities of trees and ground cover due to beekeeping. However, the sites are still low in plant species richness and diversity. With the current plant regeneration and conservation effort and strategies, the studies sites show quick signs of vegetation restoration. However, the sites close to human settlements are vulnerable to invasion by alien plant species such as Lantana camara, which escape from settlements to nearby disturbed forests. To promote regeneration of the desired tree species, particularly for beekeeping, enrichment planting at the study sites is inevitable.
8. The quality and equity of governance determines how natural resources are managed, and how these resources support the livelihoods of the communities and aid sustainable economic development. However, good governance needs to incorporate a diverse range of stakeholders’ interests to share information, build collaboration and pool resources towards a common aim of better livelihood and improved NRM.
9. The study reveals that stakeholders in apiculture have diverse interests, including natural resource conservation and sustainable livelihoods, in addi-tion to the socio-economic activity of beehive making for income generation.
10. The study indicated further that mobilizing small-scale farmers into groups would help to manage and mitigate stakeholders’ diverging interests in apiculture with respect to NRM.
11. In addition, the study demonstrated that for small-scale farmers to engage in NRM, economic gain is vital.
Modern beekeeping as an enterprise for monetary benefits, environmental rehabilitation and biodiversity conservation 191

Recommendations
In the light of the gaps revealed from the findings of this study the following recommendations are made:1. Beekeepers in Lushoto district could benefit more if
they utilized the opportunity of selling bees honey based on product differentiation motivated by the increased demand for organic honey in both local and international markets.
2. Increasing the range and quantity of bees’ products is likely to attract more anticipated buyers, including wholesalers. Hence there is a need to motivate beekeepers in the study area to raise their production by providing them with improved beehives and promoting bulking centres for collective marketing.
3. Lack of market information is one the major factors affecting the profitability of beekeeping at the farm level. Therefore, there is a need to establish a market information network covering market search, prices and transaction conditions, encouraging different actors involved in honey production and marketing to fully exploit the potential of information technology available in the district, including cell phones, radio, television and magazines.
4. Farmer groups need to be strengthened in various ways, including enforcement of contract keeping between traders and beekeepers, to assist the latter to get assured markets and better prices for their products.
5. Based on the fact that beekeeping is exclusively tree and flower dependent, enrichment planting is important to sustain and improve beekeeping activity. Assessment and monitoring of populations of alien plant species is recommended to detect the adverse effects on the restoration, which may be a result of invasive species domination. Enriching the complementary (species that fill the gap in the flowering calendar) and supplementary (species that compensate fluctuations in the nectar flow) plants species in the habitat can also be researched.
6. The study recommends that efforts should be directed towards promotion of apiculture as an economic incentive for sustainable NRM and improved crop production.
7. The varied nature of resource-use conflicts identified in the study area calls for a pluralistic
approach that recognizes the multiple perspectives of stakeholders and the diverse interests in NRM.
8. A stepped-up and focused approach for mobiliza-tion of small-scale farmers as beekeepers coupled with establishment of a coordinated framework for NRM is strongly recommended.
9. An in-depth study should be conducted to develop a framework that will help coordinate the management institutions that deal with natural resources use at the village or local level.
10. Since small-scale farmers form the majority of stakeholders in apiculture and they lack co-ordination, it is strongly recommended that action research should be initiated to strengthen small-scale farmers by mobilizing them into beekeeping groups. Linkage of small-scale farmer groups with Farmer Based Organisations (FBOs)/NGOs will also empower them.
11. Advocacy among formal institutions and establishment of an institutional framework to guide beekeeping practices at the community level for sustainable NRM is of paramount importance. Informal governance structures will positively influence enforcement of formal rules and regulations on agriculture, forestry and beekeeping in Tanzania.
12. User-friendly technologies such as the modern hives introduced by the SUA-ASARECA project in the study area under FMG should be widely disseminated as an incentive to increase the par-ticipation of women in conservation of natural resources. This is highly recommended in the Lushoto district and other areas with similar agro-ecological zones, both in Tanzania and the entire region.
13. Since the existing formal institutions provide for joint management of natural resources by both informal and formal institutional structures and also include flexibility for establishment of a partnership framework, it is strongly recommended that this opportunity should be fully utilized by the decision and policy makers and research and training institutions to promote conservation of natural resources at the community level.
The above recommendations may be used to plan how to further develop the bee honey market in the Lushoto district in Tanzania and other areas with similar environmental conditions.
192 First ASARECA General Assembly, Volume 2

References
Bagnall PS. 1963. The geology of the North Pare mountains. Tang. Geol. Surv. Recs., 10, 7–16.
Barbour MG, Burk JH, Pitts WD. 1987. Terrestrial Plant Ecology. Second Edition. Chapter 9: Method of sampling the plant community. Menlo Park, CA: Benjamin/Cummings Publishing Co. Menlo Park, CA.
Davis S, Makundi RH, Machang'u RS, Leirs H., 2006. Demographic and spatio-temporal variation in human plague at a persistent focus in Tanzania. Acta Tropica 100(1-2):133–141.
De Vries, Pieter G. 1986. Sampling theory for forest inventory. A teach-yourself course. Berlin: Springer-Verlag. p. 399.
[GEF] Global Environment Facility. 2002. Project Brief: Conservation and Management of the Eastern Arc Mountain Forests, Tanzania. GEF Arusha, Tanzania.
Griffiths CJ. 1993. The geological evolution of East Africa. In: Lovett, JC and Wasser SK. eds. Biogeography and ecology of the rain forests of eastern Africa. Cambridge, Cambridge University Press. pp 9–21.
Kaoneka ARS. 1993. Land use planning and quantitative modelling in Tanzania with particular references to agriculture and deforestation: Some theoretical aspects and a case study from the western Usambara mountains. Dissertation for the award of PhD Degree at Sokoine University of Agriculture, Morogoro, Tanzania.
Kaoneka ARS and Monela GC. 2000. National Forest Policy and Legislation: Opportunities and challenges. In p 6–29, Shemwatta DTK and Ngaga YM, eds. Proceedings of the workshop on “Operationalization of forest policy: opportunities and challenges”. TAF/IFRI/SUA, Morogoro, Tanzania.
Kirsten JF, Dorward AR, Poulton C, Nick V (eds). 2009. Institutional economic perspectives on African agricultural development. IFPRI publication.
Kiboga J and Machange F. 2005 Strategic management plan for Shume forest plantation. Ministry of Natural Resources and Tourism, Forestry and Beekeeping Division, Dar es Salaam.
Lovett JC. 1998. Importance of the Eastern Arc Mountains for vascular plants. Journal of East African Natural History 87:59–74.
Lovett JC and Wasser SK. 1993. Biogeography and ecology of the rain forests of Eastern Africa. Cambridge University Press, Cambridge, UK.
Maboko MAH and Nakamura E. 2002. Iotopic dating and neo proterozoic crustal growth in the Usambara mountains of north eastern Tanzania: evidence for creval crust formation in the Mozambique belt and the Arabian-Nubian shield, Precambrian Research 113:227–242
McGarigal K and Marks BJ. 1995. FRAGSTATS: spatial pattern analysis program for quantifying landscape structure. U.S. For. Serv. Gen. Tech. Rep. PNW-GTR-351.
Ministry of Natural Resources and Tourism. 2006. Participatory forest management in Tanzania—Facts and figures, extension and public utility. Forests and Beekeeping Division, Ministry of Natural Resources and Tourism, Dar es Salaam.
Muhongo SM and Lenoir JL.1994. Pan African granulite facies metamorphism in the Mozambique belt of Tanzania: evidence from U-Pb on zircon geochronology. Journal of the Geological Society of London 151:343–347.
Mutakyahwa M, Ikingura J, Mruma A. Geology and geochemistry of bauxite deposits in Lushoto District, Usambara Mountains, Tanzania. J. Afr. Earth Sci. 36 (2003), pp. 357–369.
Neerinckx S. 2006. Ecological factors influencing the spread of plague disease, Lushoto, Tanzania, MS. Thesis, Belgium, Leuven. Catholic University of Leuven.
Nyambo B, Maundu J, Macharia I. 2006. Promotion of integrated pest management for vegetable production in the Eastern Arc Mountains and East African coastal forest mosaic biodiversity hotspots. Baseline study. http://easternarc.or.tz/downloads/West-Usambara/baseline%20report%20June%202006b.pdf] site visited on 04/7/09.
Stanley WT, Kihaule PM, Howell KM, Hutterer R. 1998. Small mammals of the Eastern Arc Mountains, Tanzania. J. East Afr. Nat. Hist. 87:91–100.
Tenge AJ, De Graaff J, Hela JP. 2004. Social and economic factors affecting the adoption of soil and water conservation in West Usambara Highlands, Tanzania. Land Degradation and Development 15: 99–114.Wiley Interscience Publisher.
[URT] United Republic of Tanzania. 1998. National Forest Policy. Ministry of Natural Resources and Tourism. Dar es Salaam, Tanzania.
World Bank. 2002. Reinvesting in African Smallholder agriculture. The role of tree crops in sustainable farming systems. Washington DC. World Bank.
Modern beekeeping as an enterprise for monetary benefits, environmental rehabilitation and biodiversity conservation 193

Abstract
The productivity and profitability of groundnuts following phosphate use on four varieties (red beauty, serenut 2, serenut 3 and serenut 4), were assessed on a farm in Bungokho sub-county, Mbale district, Uganda, between 2009 and 2010. Phosphorus was applied as a single superphosphate (SSP) at 0, 17.48, 34.96 and 52.44 kg Pha-1 in 2009 and at 0, 4.37, 8.73, 13.10 and 17.46 kg P ha-1, in 2010. During 2009, the response was highest for red beauty, followed by serenut 3 and then serenut 4. Response was quadratic for serenut 3 and serenut 4, with a peak observed at 35 kg Pha-1. For red beauty, the response was linear; no response was observed for serenut 2. Phosphorus (P) application increased groundnut yield in 2010 with a quadratic and significant (P<0.05) response, but varieties did not differ in their response to P. Agronomic response was observed up to 8.73 kg Pha-1, beyond which no significant increment in yield was observed. Highest gross margin (US$47 ha-1) was observed at 4.37 kg Pha-1. Considering that fertilizer cost contributed between 18 and 40% of the production costs, phosphate use at rates higher than 8.73 kg P ha-1 although agronomically beneficial, was unprofitable under the prevailing groundnut market price conditions. Breakeven prices for the four varieties with various P rates, however, indicated how high groundnut price would have to be for additional output to become profitable. Profitability would be assured with red beauty and serenut 3 varieties if their prices rose by 10% for all rates of P. Profitability with serenut 2 and serenut 4 varieties could be assured if their prices rose by 20% for P rates between 4.37 and 13.1 P ha-1 only. The study recommends the need for governments and other value chain actors to put in place mechanisms
for smallholder farmers to access and use fertilizers for enhanced productivity and profitability.
Key words : Groundnut varieties, phosphate use benefits, commodity value chain, marginal analysis, sensitivity analysis
Introduction
Groundnuts are an important income-generating crop in Uganda. It is used in the production of food, feed, fertilizer, oil and fuel. It is also useful in rotation because of its ability to fix free nitrogen into the soil, thereby improving soil fertility. Groundnut kernels are rich in protein and vitamins A, B, etc. and can be eaten raw, roasted, fried, sweetened or boiled. Confectionery products containing groundnut include cookies, snacks and peanut butter. The surplus after household consumption is readily sold for cash in local and regional markets and prices are generally high. The oil content of the kernels varies from 44% to 50% depending on varieties and agronomic conditions (FAO 2000). Refined groundnut oil is extensively used in food preparations. The oil can also be used in soap making, manufacture of cosmetics and lubricants. The residual oil cake contains 7-8% N, 1.5% P2O5 and 1.2% K2O and can be used as fertilizer or as a protein supplement in livestock rations. The haulms (plant stalks) can also be fed to livestock and the shells may be used as fuel, in the manufacture of coarse boards, etc. It is thus evident that not only is groundnut a highly resourceful crop, but several options exist to add value to groundnuts.
Although farmers in Uganda have been growing various groundnut varieties (e.g. Roxo 531, Red beauty,
16. Productivity and profitability of groundnuts with phosphorus fertilizer in Mbale district, Uganda
O. Semalulu1, V. Kasenge2, P. Makhosi3, R. Gita4 and C. Gumisiriza5
1National Agricultural Research Laboratories-Kawanda. P.O. Box 7065, Kampala, Uganda. (Email: [email protected]).
2Makerere University, College of Agricultural and Environmental Sciences, P.O. Box 7062, Kampala, Uganda.
3National Agricultural Research Laboratories-Kawanda. P.O. Box 7065, Kampala, Uganda.
4National Agricultural Research Laboratories-Kawanda. P.O. Box 7065, Kampala, Uganda.
5Uganda National Farmers Federation, P.O. Box 6213, Kampala, Uganda
194 First ASARECA General Assembly, Volume 2

Igola 1), the yields are low. For example, in Mbale district, productivity was found to be at 850 kg ha-1, shelled and marketable surplus at 50 kg/HH/season. These low figures are partially attributed to pests and disease damage (e.g. rosette), low yielding varieties, and soil fertility (e.g. low Phosphorous (P)) limitations, among others. The National Agricultural Research Organization (NARO) through the Serere Agricultural and Animal Research Institute (SAARI) released three high-yielding, short-duration, rosette-resistant ground-nut varieties, which met the specific requirements of different local markets. Serenut 2 (ICGV-SM 90704), an ICRISAT variety, was released in 1999 and rapidly established itself as one of the most popular groundnut varieties. Serenut 3R (ICGV-SM 93530), a red type, and the tan-coloured Serenut 4T (ICG 12991) were released by the Uganda Seed Board in 2002. The short duration of the varieties enabled farmers to grow two crops of groundnut a year and thus to significantly enhance their income potential (http://www.researchintouse.com/nrk/RIUinfo/PF/CPP38.htm).
A groundnut production manual (Anonymous 2002) was compiled in 2002 and distributed to agricultural extension agents and non-governmental organization staff. The manual describes recommended groundnut production practices and provides valuable information on agronomic and post-harvest handling aspects of groundnuts such as drying, curing and storage. It also gives a blanket recommendation of Single Superphosphate (SSP) at 100-125 kg ha-1 (or 8.7 kg to 10.9 kg P ha-1, which was developed in the 1970s). Recently, there has been a growing need to improve fertilizer recommendations for different crops, to take into consideration the decline in soil fertility, and requirements of new crop varieties. To meet this requirement, a new study was planned. However, it was understood that any revised fertilizer recommendations from the study should also take into consideration the current market prices for both the fertilizer and the resulting crop produce. As a result, the objectives of the current study were: (i) to study the performance of four groundnut varieties (serenut 2, serenut 3, serenut 4 and red beauty) under different phosphorus fertilizer rates; (ii) assess the profitability of phosphate fertilizer use on groundnuts.
Materials and methods
Description of the area of study
This study was conducted in Bungokho sub-county, Mbale district. Mbale is one of the districts found in the Mt Elgon ranges in eastern Uganda, and Bungokho is
one of the four sub-counties that make up Mbale district. Bungokho sub-county stretches from the lowland, 950 m above sea level, to the slopes of Mt. Elgon, typically 1,400 m above sea level. The study area comprised of two agro-climatic zones: the upper (eastern) part of the sub-county; and the lower (western) part of the sub-county.
The upper (eastern) part of the sub-county is located on the foot-slopes of Mt. Elgon and lies in the transition zone between the Kyoga plains and the Highland ranges (The Republic of Uganda 2004). It is characterized by an undulating topography with slopes ranging from 8% to 12%, with moderate to very deep black volcanic soils derived from granitic gneiss. The area receives 1270 mm to 1400 mm of rainfall annually, distributed into one long rain season from March to October with a peak in April and a secondary peak in August. Soils are well-drained with good permeability and moderate runoff. The dominant soil type is Haplic Lixisols (ISSS/ISRIC/FAO 1998). Lixisols are strongly weathered soils with low levels of available nutrients and low nutrient reserves. [Haplic: indicates that the major part of the upper 0.5 m of the soil profile is whole coloured]. However, the chemical properties of Lixisols are generally better than of Ferralsols and Acrisols because of their higher soil pH (BS > 50 %) and the absence of serious Al-toxicity. Due to low structural stability and moderate chemical fertility, the conservation of surface soil and Soil organic matter (SOM) is of primary concern. The low absolute level of plant nutrients and the low cation retention by Lixisols make recurrent use of inputs such as fertilizers, lime, and the like, a precondition for continuous cultivation (http://www2.hu-berlin.de/agrar/boden/Tropics/pcboku10.agrar.hu-erlin.de). Farmers grow crops in two seasons: the first (main) season runs from March to June and the second, from August to November and the temperature here ranges from 7.5°C to 27.5 C. The Bubirabi and Namatsale sites in Bubirabi and Bumageni parishes are found in this zone.
The lower (western) part of the sub-county lies in the Kyoga plains (The Republic of Uganda 2004) and is typically flat, with a 0-2% slope. The area receives about 1000 mm to 1200 mm of rainfall annually, distributed in virtually one rainy season that extends from March to November, with the main peak in April/May and a secondary peak in August/September. One dry season runs from December to about mid-March. Evaporation exceeds rainfall by a factor of about 8 during the dry months December to February (Republic of Uganda 2004). Temperature ranges from 15°C to 32.5°C. Two dominant soil units were identified in the area:
Productivity and profitability of groundnuts with phosphorus fertilizer in Mbale district, Uganda 195

Endopetric Plinthosols and Nitic Lixisols. Plinthosols have high content of mainly iron, and aluminium, with proportions varying from more than 80% iron oxides with little aluminium, to about 40% of each. [Endopetric indicates that the soil is strongly cemented or indurated between 50 cm and 100 cm from the soil surface (World Reference Book for Soil Classification)]. Most Plinthosols have poor cation exchange properties and low base saturation, but there are exceptions, e.g. Endoeutric soil units. Poor natural soil fertility, water logging in bottomlands and drought on shallow and sometimes skeletal Plinthosols, are serious limitations (http://www.fao.org/docrep/003/y1899e/y1899e08a.htm). Nitic Lixisols are Lixisols with a Nitic horizon (a clay-rich subsurface with moderately to strongly developed polyhedric or nutty structure with shinny ped faces, which can or cannot only partially be attributed to clay illuviation), characterized by diffuse or gradual transition to horizons immediately above or below (http://www.isric.org/ISRIC/webdocs/docs/major_soils_of_the_world). The Siira farmers’ group lies in this agro-climatic zone, while the Bunapongo farmers’ group lies midway between these – the upper and lower parts of the sub-county. Detailed soil characterization was carried out during the study (see section 3.1).
Experimental layout and design
Four groundnut varieties (red beauty, serenut 2, serenut 3, and serenut 4) were grown. A total of four farmer groups from four parishes within the sub-county participated in the trial. These were: Bubirabi Youth Development Association (BYDA) and the Namatsale farmers group in upper Bungokho, Siira II farmers group in lower Bungokho and the Bunapongo farmers group in the midway part of the sub-county. Each farmer received red beauty and one of the serenut varieties, which were randomly distributed to five farmers in each group. The groundnuts were planted at a spacing of 30x10 cm for serenut 3, serenut 4 and red beauty. Serenut 2 was planted at a spacing of 45x30 cm. Plot sizes were 20x10 m and each farmer had four plots which were divided into two each, to form eight plots. Phosphorus was applied as SSP at 0, 17.48, 34.96 and 52.44 kg Pha-1 (representing 0, 200, 400 and 600 kg SSP ha-1) during the second season of 2009. However, in the first season of 2010, phosphorus was applied at rates of 0, 4.37, 8.73, 13.10 and 17.46 kg P ha-1 (representing 0, 50, 100, 150, and 200 kg SSP ha-1, respectively). The experimental set up was a randomized block design, with groundnut variety and P rate arranged in a factorial combination, and
replicated four times (number of farmers’ groups). The crops were sprayed with the recommended dose dimethoate, which was 30 ml per 20 l of water, starting at 2 weeks after planting to control aphids that carry along the rosette virus. Farmers observed proper agronomic practices like timely weeding and spraying, among others.
Data collection and analysis
Agronomic data were collected using data sheets prepared to capture for each farmer and experimental plot, the actual area harvested, number of plants harvested, number of pods on representative plants and fresh and dry weight of groundnut pods. Information on the amount of groundnuts sold, eaten or given away between harvesting and drying was also collected from farmers, as a component of the yield. The data were processed using Microsoft Excel, yields were adjusted for harvested area, plant population, 14% moisture content, and expressed on a hectare basis. Data were statistically analysed using Genstat package version 3.2. Significant differences between treatment means were determined at a 95% confidence level and the means separated using the standard error of difference (sed) procedure. Two means were declared as significantly different when the difference between them was greater than twice the sed value.
For financial analysis, data on costs that varied including labour, fertilizer, spray, material supplies, transport, etc., groundnut yields and farm-gate prices, were collected using formal survey tools such as questionnaires, interviews, data sheets and field observations. The input market prices were obtained from the nearby Mbale market. Data were cleaned using Microsoft Excel and analysed using the Statistical Package for Social Scientists (SPSS).
Generally appropriate and simplified economic evaluation tools applied to this type of data were: partial budget analysis, marginal analysis, dominance analysis, breakeven analysis and sensitivity analysis.
Partial budget analysis was used to determine the Financial Net Benefits (FNB) of the alternative production packages.
FNB = (YPy)-CV …………………………………………(1)
Where, Y : average groundnut yield, kg ha-1
Py : average price of a groundnut variety
CV: costs that vary for each production package
196 First ASARECA General Assembly, Volume 2

Marginal analysis compared the extra (marginal) costs incurred in investing in a production package with extra net benefits from the investment. A higher net benefit may not be affordable to a poor farmer if it requires very much higher investment. To highlight this scenario for a production package, a net benefit/cost change ratio usually expressed as a percentage known as the marginal rate of return (MRR) has to be calculated. The calculation may more logically be done by proceeding stepwise from the least costly level of treatment to the most costly level in a procedure called marginal analysis (Kasenge et al. 2001).
MRR = [(FNB1-FNB2)/(CV1-CV2)] * 100 …..……………(2)
Where, FNB1-FNB2 : extra net benefit realized
CV1-CV2: extra cost incurred
The MRR actually indicates what one can expect to gain in return for the added investment when one chooses to change from one treatment to another. However, one will rationally compare the MRR with one’s acceptable minimum rate of return for such a technology change. The MRR, therefore, should be high enough to repay for one’s opportunity cost of working capital and for what one would expect to get for one’s time and effort in adjusting to the new technology level (CIMMYT 1988).
Dominance analysis simply listed the treatments (groundnut varieties with rates of phosphorus) in order of increasing costs that varied along with the net returns for each of the treatments. This was done on the assumption that no farmer would rationally invest in any treatment that had net returns which were less than or equal to those of a treatment with lower costs that vary (a preference for a lot more for a little more).
Breakeven analysis was done to provide a handy decision support tool for knowing, for example, how high Py would have to be for additional output to become profitable:
Py = TCV/Y ...……………………….……………….….. (3)
Where TCV is: total costs that vary for each treatment
Sensitivity analysis was done to test systematically what would happen to the profitability of a groundnut enterprise if major elements such as yield, price or cost of production changed from those observed. It is a means of dealing with the risk from variability in what one expects to gain from added investment (MRR) under certain conditions. It charts out ranges of levels over which a given investment option would be economically viable (appendix 3). A sensitivity analysis is done by varying one element or a combination of elements and determining the effect of that change on the outcome, which is, in this case, groundnut enterprise profitability. For example:
∆Py = ∆CV(1+MRR)/Y …………………….…………….(4)
Where ∆ refers to change
Results and discussion
Experimental site characteristics
Soils
Table 1 presents the mean soil characteristics at the study sites. The pH in the top 20cm was somewhat lower for upper sites (Bubirabi and Namatsale) compared to the lower one (Siira). However, pH values for all sites were within the range of 5.5 to 6.2, considered favourable
Table 1. Mean soil characteristics for the study sites.
Site Major Soil unit(s) Depth cm pH OM N P Ca Mg K Sand Clay Silt Textural class----- % ----- ----------- mg kg-1 ------------ ----------- % -------------
Bubi-rabi Haplic Lixisols 0-20 6.20 3.90 0.15 1.8 2168 448 456 60.4 27.8 11.8 Sandy clay loam20-50 5.80 2.40 0.11 0.7 2439 560 136 44.4 43.8 11.8 Clay
Namatsale Haplic Lixisols 0-20 6.40 3.10 0.13 6.2 3325 604 537 54.40 30.80 14.80 Sandy clay loam20-50 6.25 2.10 0.11 1.6 2580 629 654 49.40 37.80 12.80 Sandy clay
Siira Endopetric Plintho-sols
0-20 6.50 3.20 0.14 16.4 2892 472 632 54.40 33.80 11.80 Sandy clay loam20-50 6.15 2.35 0.12 23.4 4074 558 554 35.40 53.80 10.80 Clay
Critical values1
5.2 3.0 0.2 6002
1. Critical values for 0-20 cm layer, for most crops in Uganda (Foster 1976).2. Critical Ca value of 600 mg kg-1 proposed for groundnuts (Murat 2003).
Productivity and profitability of groundnuts with phosphorus fertilizer in Mbale district, Uganda 197

for groundnuts (Murat 2003). Available soil P was low in the top 20 cm of the upper sites, with Bubirabi exhibiting the lowest P levels. Since the groundnut crop is a surface feeder, P addition would be expected to enhance its growth, more so at the P deficient Bubirabi site. Calcium was above the range of 600 mg kg-1 to 800 mg kg-1 soil, therefore considered adequate (Kvien et al. 1988; Summer et al. 1988), indicating that it was not a limiting factor at any of the sites.
Rainfall distribution for Mbale from 2009 to 2010
In 2009, groundnuts were planted during September and harvested in the period between December and January 2010. Monthly rainfall totals ranged from 30 mm to 5 mm, with means decreasing during the dry season. In the year 2010, groundnuts were planted in April and harvested from July to August. Monthly rainfall totals ranged from 30 mm to 20 mm in June, with a peak of 40mm observed in July. Generally more rainfall was received during the April to July/August 2010 growing season, than the September to December/January 2009 season. This is consistent with farmers’ observations from the lower village (Siira),where prolonged dry spells in 2009 were reported.
Effect of Phosphorus application on different groundnut varieties, second rains of 2009
While it is acknowledged that there were site differences in terms of soil and micro-climatic conditions as presented above and that these would have an effect on the performance of different groundnut varieties and their response to P (Semalulu et al. 2010), this paper examines the effect of groundnut varieties and P rate to assess the yield and economic implications of phosphate fertiliser use.
Figure 1. Rainfall distribution for Mbale during 2009 and 2010.
There was a significant (P<0.05) Variety*P rate interaction in yield, meaning that groundnut yield depended both on the variety planted and the P rate applied (appendix 1). This in turn translated into a significant Variety*P rate interaction observed in groundnut income. Variation in production costs was most affected by variety and P rate, as main effects. The trend in gross margins was explained by a significant Variety*P rate interaction.
Red beauty yields (shelled), increased significantly with P addition. The trend was linear [Y(red beauty) = 8.8902x + 859.9; R² = 0.9662] and significant (P<0.05).Yields for serenut 3 and 4 showed a quadratic trend [Y (Serenut 3) = -0.0704x2 + 17.557x + 810.9; R² = 0.9348] and Y (serenut 4) = -0.0565x2 + 9.0646x + 871.95; R² = 0.8454, with yields levelling off at 35 kgPha-1. Serenut 2 yielded the lowestat any given P rate and its yields were not significantly affected by phosphate addition (P>0.05).
Production costs as affected by difference in groundnut varieties and P application, during the second rain season of 2009
On an average, groundnut production costs were significantly (P<0.05) lower for serenut 4 compared to other varieties (table 2). Production costs for red beauty, serenut 2 and serenut 3 were not significantly different (P>0.05). Phosphorus application significantly (P<0.05) increased groundnut production costs significantly (P<0.05) with each increment in the level of P applied(table 2).
Table 3 presents the relative contribution of fertilizer cost to the total cost of groundnut production. Increas-ing production cost for each level of phosphorus addition led to a significant (P<0.05) increase in the percentage of production cost that is due to fertilizer.
198 First ASARECA General Assembly, Volume 2

At 17.48 kg Pha-1, the percentage of production cost that is due to fertilizer was significantly (P<0.05) higher for serenut 2 compared to other varieties. However, at 34.96 kg Pha-1, there was no significant (P>0.05) difference in the percentage of production cost due to fertilizer, among the four varieties. At 52.44 kg Pha-1, the percent-age of production cost due to fertilizer was significantly (P<0.05) higher for serenut 4 than serenut 2 and serenut 3 but not in the case of red beauty.
Effect of phosphorus application on groundnut yield and profitability
Table 4 presents the main effect of phosphorus application on the yield and profitability of groundnuts in 2009. Averaged over all four varieties, phosphorus application increased the yields of both the shelled and unshelled groundnuts, although not significantly at 17.48 kg Pha-1. Increasing P rates to 34.96 kg Pha-1 significantly (P<0.05) increased the yield; further increment to 52 kg Pha-1resulted in a slight but not significant increase in the yield. Production costs increased significantly (P<0.05) with higher P rates. Income from groundnuts also increased with higher P rates applied. Highest increase in income was realized between 17.48 kg and 34.96 kg Pha-1, corresponding to the high increment in yield realized within this P range.
Figure 2. Effect of phosphorus application on groundnut yield during the second rain season of 2009.
Table 2. Production costs as affected by difference in ground-nut varieties and P application, second rains of 2009.
Production costs, shelled groundnutsVariety effect P rate effect
Variety US $/ha P rate US $/haRed beauty 1295 0 997Serenut 2 1293 17.48 1091Serenut 3 1368 34.96 1408Serenut 4 1199 52.44 1659sed 39.6 Sed 39.6CV, % 11 11
Table 3. Relative contribution of fertilizer cost1 to the total cost of groundnut production, second rains of 2009.
Production cost
% Fertilizer cost/total production cost (shelled)
P rate (US $/ha) Red beauty Serenut 2 Serenut 3 Serenut 40 997 0.00 0.00 0.00 0.00
17.48 1091 17.63 22.88 18.23 19.1434.96 1408 29.06 28.25 29.73 30.1452.44 1659 37.41 36.99 35.13 40.01Sed 39.6 1.49CV, % 11 10.00
1. Fertilizer price: US $50 per 50 kg SSP as at 2009-2010.
Productivity and profitability of groundnuts with phosphorus fertilizer in Mbale district, Uganda 199

At a given level of P, income from shelled groundnuts was higher than from that of the unshelled, showing that a farmer gains more through sale of shelled than the unshelled groundnuts. Averaged over four varieties, the gross margin (income minus variable production costs) for groundnuts was negative for all P rates, but less so for shelled than unshelled groundnuts (table 4).The values decreased further with phosphate addition. This result suggests that under the market conditions of this study (2009-2010), a farmer would actually make a loss growing groundnuts with phosphorus.
Effect of phosphorus application on different groundnut varieties, first rains of 2010
There was a highly significant (P<0.001) main effect of Variety and P rate but no Variety*P rate interaction was observed, meaning that groundnut yield was most influenced by the variety grown and the P rate applied (appendix 2). Absence of a Variety*P interaction suggests that the groundnut varieties did not differ in their response to P.
Main effect of groundnut varieties, first rains of 2010
Averaged over all P rates, red beauty gave the highest unshelled groundnut yields followed by serenut 2, serenut 3 and then serenut 4,which gave the lowest
Table 4. Main effect of P application on groundnut yield, second season of 2009.
P rate
Yield, unshelled
kg/haYield, shelled
kg/ha
Production costs, unshelled,
US $/ha
Production costs, shelled,
US $/ha
Income, unshelled,
US $/ha
Income, shelled, US $/ha
Gross margin, unshelled,
US $/ha
Gross margin, shelled, US $/ha
0 1165 817 987 997 777 903 -210 -9417.48 1235 870 1081 1091 830 970 -251 -12134.96 1623 1140 1398 1408 1099 1272 -300 -13652.44 1733 1215 1651 1659 1174 1365 -477 -295
Sed 70.9 50.0 39.4 39.6 48.3 56.3 57.7 63.7CV, % 15.6 15.2 11.0 11.0 16.5 16.1 26.0 60.5
(table 5). Mean yields for serenut 2, 3 and 4 were not significantly (P>0.05) different. Production costs differed for the varieties. Lowest values were observed for serenut 2 followed by serenut 3, although these were not significantly (P>0.05) different. Low production costs for serenut 2 is consistent with the low price of serenut seeds. On the other hand, production cost for serenut 4 was significantly (P<0.05) higher than the other varieties inspite of the low price for seeds; the reason for thisis unclear. Production costs for red beauty (unshelled or shelled) were not significantly different from those of serenut 3. For a given variety, production costs were higher for the shelled than the unshelled groundnuts.
Income realized from the sale of unshelled groundnuts was significantly (P<0.05) higher for red beauty com-pared to other varieties (table 6). This could be attributed to the higher overall yields observed for this variety, compared to other varieties. Serenut 3 follows red beauty in the level of income from the sale of unshelled groundnuts, then comes serenut 2 and serenut 4 comes last. The lowest income from serenut 4 is a combina-tion of both the lowest yield observed for this variety and the fact that this variety fetches the lowest price on the market. In general, with the exception of serenut 2, income from shelled groundnuts was higher than that
Table 5. Main effect of varieties on groundnut yield and profitability, first rains of 2010.
Variety and price (US $ kg-1)
Yield, unshelled,
kg ha-1
Yield, shelled, kg
ha-1
Production cost, unshelled, US $ ha-1
Production cost, shelled,
US $ ha-1
Income, unshelled, US $ ha-1
Income, shelled, US $ ha-1
Gross margin unshelled, US $ ha-1
Gross margin shelled, US $ ha-1
Red beauty (1.25) 1012 709 525.8 544.4 683.0 726.0 158.0 182.0Serenut 2 (1.00) 844 507 481.5 494.6 464.0 440.0 -17.0 -55.0Serenut 3 (1.25) 805 563 505.0 523.6 543.0 577.0 38.0 54.0Serenut 4 (0.90) 718 574 564.4 584.3 323.0 476.0 -241.0 -109.0
sed 55.1 38.9 12.96 13.76 33.1 36.5 35.0 38.22sed 110.2 77.8 25.92 27.52 66.2 73.0 70.0 76.4CV, % 46.7 46.9 14.1 14.5 45.5 46.2 1582.0 1801.8
200 First ASARECA General Assembly, Volume 2

from unshelled. Lower income from shelled serenut 2 is due to its low shelling percentage (60%) and the low market price (Shs. 1650 or US$ 0.825 per kg for serenut 2, compared to red beauty and serenut 3, with a shelling percentage of 70% and a market price of Shs. 2050 or US$ 1.025 per kg). The gross margin was significantly (P<0.05) higher for red beauty (both unshelled and shelled). The gross margin for serenut 3 and serenut 2 (unshelled) were not significantly different and gross margin was lowest for serenut 4. In general, for a given variety, the gross margin was higher for shelled than unshelled groundnuts, meaning that a farmer makes more profit from the sale of shelled than unshelled groundnuts. Serenut 2 was an exception to this, because of its high shelling costs due to the high labour cost involved in shelling off the rather hard shell.
Main effect of Phosphorus on groundnut yield, First Rains of 2010
The effect of phosphate application on groundnut yield in 2010 is graphically presented in figure 2; the data consist of means of four varieties. Phosphorus application increased groundnut yield, with significant (P<0.05) differences over the control observed at 8.73
kg P ha-1. Increasing P rate beyond 8.73 increased groundnut yields, but not significantly. For unshelled groundnut, the relationship was quadratic (Y= -0.6631X2+26.493X+689.49; R2=0.9978, P<0.05). Similar trends were observed for the shelled groundnuts (Y= -0.4832X2+18.312X+483.56; R2=0.9981, P<0.05). It is important to note that observed yields were much lower than the potential yield for groundnuts (3,000 kg ha-1). According to Bashaasa et al. (2001) actual yields of grain crops in Uganda ranged from 51% to 68% of potential crop levels. Clearly, conditions under which this on-farm study were carried out could not enable us realize the full yield potential of the crop.
Main effect of phosphorus on groundnut yield and profitability, first rains of 2010
Groundnut yields increased with P application, with significant differences from the control observed at 8.73 kg P ha-1, beyond which no further significant yield increments were observed. Production costs increased with P rate and were higher for shelled than unshelled groundnuts (table 6). Income realized from groundnut sale increased with P rate, in response to increased groundnut yields, with shelled groundnuts fetching a higher income than the unshelled. Gross margin for unshelled groundnuts grown without P was negative, meaning that a farmer would incur a loss by selling unshelled groundnuts. Gross margin was improved on application of 4.37 kg Pha, but decreased at higher P rates. For shelled groundnuts, the gross margin was positive at no P applied and again improved with 4.37 kg Pha applied, but decreased at higher P rates.
Effect of changes in yield, price and cost of production on groundnut profitability
Table 7 summarizes groundnut yields, costs, breakeven prices and returns for investment in phosphorus fertilizer over the two production seasons. Figure 3 graphically
Figure 2. Effect of phosphorus application on groundnut yield during the first rain season of 2010.
Table 6. Main effect of phosphorus on groundnut yield and profitability, first rains of 2010.
P rate, kgha-1
Yield, unshelled,
kg ha-1
Yield, shelled, kg ha-1
Production cost, unshelled, US $ ha-1
Production cost, shelled,
US $ ha-1
Income, unshelled, US $ ha-1
Income, shelled, US $ ha-1
Gross margin unshelled, US $ ha-1
Gross margin shelled, US $ ha-1
0.0 688 484 416.6 434.4 413.0 459.0 -3.0 254.37 794 552 458.8 475.0 472.0 522.0 14.0 478.73 875 611 523.3 541.4 524.0 579.0 0.0 3713.10 915 637 571.0 589.4 545.0 601.0 -26.0 1217.46 953 657 626.1 643.4 563.0 614.0 -63.0 -30
sed 61.5 43.5 14.49 15.39 37.0 40.8 NS NS2sed 123 87 28.98 30.78 74 81.6CV, % 46.7 46.9 14.1 14.5 45.5 46.2 1582.0 1801.8
Productivity and profitability of groundnuts with phosphorus fertilizer in Mbale district, Uganda 201

Table 7: Mean groundnut yields, costs, returns and breakeven prices for investment in phosphorus use (2009–2010) in Mbale district, Uganda.
Groundnut Variety
P- rate (kg/ha)
Average Yield(kg/ha)
Average Output (US$/ha)
Average CV(US$/ha)
Average NFB(US$/ha)
MRR %
Breakeven price (US $/kg)
S2 4.37 04.37 482.80 420.00 430.70 -10.70 0.89209RB 4.37 04.37 700.00 714.00 469.00 245.00 667.624021 0.67S3 4.37 04.37 485.40 500.00 475.00 25.00 -3666.66667 0.97857S2 8.73 08.73 478.20 416.00 492.50 -76.50 -580 1.0299S4 4.37 04.37 546.90 454.00 525.40 -71.40 15.5015198 0.96069S3 8.73 08.73 623.30 642.00 532.40 109.60 2585.71429 0.85416S2 13.1 13.10 556.00 484.00 543.90 -59.90 -1473.91304 0.97824RB 8.73 08.73 746.10 761.00 548.00 213.00 6656.09756 0.73449S3 13.1 13.10 653.30 672.70 583.50 89.20 -348.732394 0.89316S4 8.73 08.73 597.70 496.10 592.60 -96.50 -2040.65934 0.99147RB 13.1 13.10 720.60 735.00 603.90 131.10 2014.15929 0.83805S4 13.1 13.10 618.10 513.00 626.40 -113.40 -1086.66667 1.01343S4 0 00.00 691.00 604.85 688.90 -84.05 46.96 0.99696RB 0 00.00 751.80 869.80 700.05 169.75 2276.23318 0.93117S2 0 00.00 479.70 458.50 708.80 -250.30 -4800.57143 1.47759S3 0 00.00 677.40 790.50 765.15 25.35 489.1748 1.12954S2 17.48 17.48 564.00 580.25 782.20 -201.95 -1333.13783 1.38688S3 17.48 17.48 764.95 898.00 877.45 20.55 233.595801 1.14707S4 17.48 17.48 779.30 679.85 896.15 -216.30 -1266.57754 1.14994RB 17.48 17.48 908.95 1039.00 912.95 126.05 2037.79762 1.0044S4 34.96 34.96 594.40 1070.00 1299.00 -229.00 -91.9699521 2.1854RB34.96 34.96 1149.60 1437.00 1408.00 29.00 236.697248 1.22477S3 34.96 34.96 1435.20 1794.00 1431.00 363.00 1452.17391 0.99707S2 34.96 34.96 787.00 787.00 1494.00 -707.00 -1698.4127 1.89835S4 52.44 52.44 584.40 1052.00 1505.00 -453.00 2309.09091 2.57529RB 52.44 52.44 1354.40 1693.00 1648.00 45.00 348.251748 1.21677S2 52.44 52.44 831.00 831.00 1701.00 -870.00 -1726.41509 2.04693S3 52.44 52.44 1506.40 1883.00 1784.00 99.00 1167.46988 1.18428
Figure 3. Dominance analysis across all groundnut varieties and P rates (2009-2010) in Mbale district, Uganda.
202 First ASARECA General Assembly, Volume 2

portrays data in table 7. Closely corresponding to the observed differences in agronomic responses to phosphorus, on average only red beauty and serenut 3 groundnut varieties with phosphorus came up as financially viable treatments. Serenut 2 and serenut 4 groundnut varieties turned up as money losers at any rate of phosphorus fertilizer application. Nevertheless, breakeven analysis (table 7) determined breakeven prices for red beauty shelled groundnuts to be between US$ 0.67 per kg at 4.37 kgP ha-1 and US$ 1.22 per kg at 52.44 kgP ha-1; for serenut 3 shelled groundnuts between US$ 0.85 per kg at 4.37 kgP ha-1 and US$ 1.18 per kg at 52.44 kg P ha-1; for serenut 2 between US$ 0.89 per kg at 4.37 P kg ha-1 and US$ 2.05 kgha-1 at 52.44 kg P ha-1; for serenut 4 between US$ 0.96 per kg at 4.37 kg P ha-1 and US$ 2.58 per kg at 52.44 per kgP ha-1. These were price ranges for the varieties beyond which certain phosphorus application rates could be financially viable treatments (Bonabana-Wabbi et al. 2006).
Sensitivity analysis
Appendix 3 complements the above revelation in indi-cating that sure profitability for red beauty and serenut 3 varieties could be realized at any level of phosphorus application if groundnut price rose by 10%. For serenut 2 and serenut 4, profitability could only be assured with a groundnut price rise of 20%, at phosphorus applica-tion between 4.37 and 13.1 kg Pha-1.
Summary
Groundnut varieties differ in their response to phos-phorus, however the response is season-dependent. During the 2009 second season, red beauty and serenut 3 were most responsive to P, with serenut 3 and 4 showing a quadratic response and levelling off at 35 kg Pha-1;while for red beauty the response was linear, serenut 2 was unresponsive to P. In the 2010 first season, phosphate use increased groundnut yields, butno vari-etal differences were observed. Groundnut agronomic response to P was observed up to 13.1 kg P ha-1 (150 kg SSPha-1); however, highest gross margin (US $47ha-1) was realized at 4.4 kg P ha-1 (or 50 kg SSP ha-1). Highest gross margin was observed for red beauty (US $182 ha-1) followed by serenut 3 (US$ 54 ha-1), then serenut 2(US$-55 ha-1) and the lowest for serenut 4 (US $ -109 ha-1), in response to a similar trend in market prices of the four varieties. Further dynamic profit prospects were explored using breakeven analysis and sensitivity analysis. Narrower breakeven price ranges (US $0.67 - US$ 1.18 per kg at 4.37–52.44 kg P ha-1) were possible for the red beauty and serenut 3 varieties, rather than
for the serenut 2 and serenut 4 varieties (US$ 0.89-$ 2.58 at 4.37–52.44 kg P ha-1). Thus, red beauty and serenut 3, rather than serenut 2 and serenut 4, stood out as surer profitable enterprises with changes in groundnut prices (10% increase for the former pair and 20% increase for the latter pair).
Conclusions• Groundnut varieties differ in their response to
phosphorus, depending on the season.• Red beauty and serenut 3 were most responsive to
P, resulting in higher profitability for phosphate use.
• Groundnut agronomic response to P was observed up to 13.1 kg P ha-1 (150 kg SSPha-1); however, highest gross margin (US$ 47 ha-1) was realised at 4.4 kg P ha-1 (or 50 kg SSP ha-1).
• For planning purposes, sensitivity analysis proved useful in charting out ranges of phosphorus rates over which a given groundnut variety would be profitable. Profitability would be assured with red beauty and serenut 3 varieties if their prices rose by 10% for all rates of P. Profitability with serenut 2 and serenut 4 varieties could be assured if their prices rose by 20% for P rates between 4.37 Pha-
1and 13.1 Pha-1 only.
Recommendation
Considering that fertilizer cost contributes to 18–40% of the production costs, there is need for governments and other chain actors to put in place mechanisms to increase fertilizer access, affordability and use by smallholder farmers.
Acknowledgements
This work was funded by the Association for Strengthening Agricultural Research in Eastern and Central Africa (ASARECA) through a regional (East Africa) project NRM/09/03 “Promoting Sustainable Natural Resource Management through Effective Governance and Farmer-Market Linkages”. We would like to thank ASARECA and the donor community for funding this work; the administration and staff of National Agricultural Research Organization-Kawanda, Makerere University and the Uganda National Farmers Federation for their tremendous support during the course of implementing the project. We are indebted to the farmers, local leaders and other stakeholders within the project areas for their active participation in the project.
Productivity and profitability of groundnuts with phosphorus fertilizer in Mbale district, Uganda 203

References
Anonymous. 2002. Groundnut agronomic and post harvest practices. Training Manual.
Banani S, Baldeo S, Khandelwal RB. 1993. J. Indian Soc. Soil Sci 41(2):383-384.
Bashaasha, Bernard, David S, Kraybill, Southgate Douglas D. 2001. Land use impacts of agricultural intensification and fuelwood taxation in Uganda. Land Economics 77(2):241-249.
Bharambe PR, Patil VV, Shelke DK, Oza SR, Sondge VD. 2004. Response of rabi groundnuts to phosphorus under different land layouts and moisture regimes grown on a Vertisol. J. Indian Soc. Soil Sci 52(2):262-265.
Bonabana-Wabbi J, Taylor D, Kasenge V. 2006. A limited dependent variable analysis of integrated pest management adoption in Uganda. Available online at http://www.purl.edu/21040.
CIMMYT. 1988. From agronomic data to farmer recommendations: an economic training manual.
Gascho GI, Davis JG. 1994. Mineral nutrition. Inp: 214-254, Smartt J, ed., The groundnut crop: a scientific basis for improvement, Chapman and Hall: London.
http://www.researchintouse.com/nrk/RIUinfo/PF/CPP38.htm
http://ejeafche.uvigo.es/component/option,com_docman/task,doc_view/gid,453/
http://www.agnet.org/library/pt/2003025/
http://upetd.up.ac.za/thesis/available/etd-08152003-155125/unrestricted/01chapter1.pdf
http://www.ikisan.com/links/ap_groundnutEconomics.shtml
Hossain M A, Hamid A, Nasreen S. 2007. Effect of nitrogen and phosphorus fertilizer on N/P uptake and yield performance of groundnut (Arachis Hypogaeal L.). J. Agric. Res. 45(2):119–127.
ISSS/ISRIC/FAO []. 1998. World reference base for soil resources. World Soil Resources Report, FAO, Rome. p 84.
Kasenge, V, Taylor DB, Kyamanywa S, Bigirwa G, Erbaugh JM. 2001. Farm-level evaluation of monocropping and intercropping impacts on maize yields and returns in Iganga district, Uganda. Eastern Africa Journal of Rural Development 17(1):18–24.
Leong SK and Ong CK.1983. The influence of temperature and soil water deficit on the development and morphology of groundnut (Arachis hypogaea L.). Journal of Experimental Botany 34:1551–1561.
Murat MR. 2003. The impact of soil acidity amelioration on groundnut production on sandy soils of Zimbabwe. PhD Dissertation, University of Pretoria.
Okumu.2000. Available online athttp://www.kari.org/fileadmin/publications/Legume_Project/Legume2Conf_2000/41.pdf.
Stalker HT. 1997. Peanut (Arachis hypogaea L.). Field Crops Res 53:205–217.
The Republic of Uganda. 2004. Increasing incomes through exports: a plan for zonal agricultural production, agro-processing and marketing for Uganda.
Tran. 2003. Effect of phosphorus fertilizer on groundnut yield in poor alluvial and sandy soils of Thua Thien Hue. Better Crops International 17(2):16–17.
World Reference Book for Soil Classification. Available online at http://books.google.com.
AppendicesAppendix 1. Analysis of variance (ANOVA) summary for the second rain season 2009
Source DfYield,
unshelled Yield,
shelled Production
costs, unshelledProduction
costs, shelledIncome,
unshelled, Income, shelled,
Gross margin, unshelled
Gross margin, shelled
Variety 3 <0.001 <0.001 <0.001 <0.001 <0.001 <0.001 <0.001 <0.001P rate 3 <0.001 <0.001 <0.001 <0.001 <0.001 <0.001 <0.001 0.008Variety*P rate 9 <0.029 <0.030 0.086 0.083 <0.001 <0.001 0.004 <0.001Residual 301Total 319
Appendix 2. ANOVA summary for the first rain season 2010
Source DfYield,
unshelledYield,
shelledProduction cost,
unshelledProduction
cost, shelledIncome,
unshelledIncome, shelled
Gross margin unshelled
Gross margin shelled
Variety 3 <.001 <.001 <.001 <.001 <.001 <.001 <.001 <.001P rate 4 <.001 <.001 <.001 <.001 <.001 <.001 0.325 0.421Variety*P rate 12 0.189 0.464 0.904 0.94 0.228 0.556 0.139 0.429Residual 377Total 399
204 First ASARECA General Assembly, Volume 2

Appendix 3: Sensitivity analysis report for groundnuts (2009 – 10), Mbale district, Uganda
Average prices red beauty ($/kg)Red Beauty -50% -40% -30% -20% -10% 0% 10% 20% 30% 40% 50%P-Rates (Kg/ha) 0.56 0.67 0.78 0.89 1.01 1.12 1.23 1.34 1.45 1.57 1.680 -279.58 -195.48 -111.39 -27.30 56.80 140.89 224.99 309.08 393.17 477.27 561.364.37 -77.50 0.80 79.10 157.40 235.70 314.00 392.30 470.60 548.90 627.20 705.508.83 -130.72 -47.26 36.20 119.65 203.11 286.57 370.02 453.48 536.94 620.39 703.8513.1 -200.88 -120.27 -39.67 40.93 121.54 202.14 282.75 363.35 443.96 524.56 605.1617.48 -404.59 -302.91 -201.24 -99.57 2.10 103.78 205.45 307.12 408.79 510.47 612.1434.96 -765.05 -636.45 -507.86 -379.27 -250.68 -122.09 6.50 135.09 263.68 392.27 520.8652.44 -890.50 -739.00 -587.50 -436.01 -284.51 -133.01 18.49 169.99 321.49 472.99 624.49
Average Prices Serenut 2 ($/kg)Serenut 2 -50% -40% -30% -20% -10% 0% 10% 20% 30% 40% 50%P-Rates (Kg/ha) 0.46 0.56 0.65 0.74 0.83 0.93 1.02 1.11 1.20 1.30 1.390 -486.77 -442.36 -397.95 -353.55 -309.14 -264.73 -220.33 -175.92 -131.52 -87.11 -42.704.37 -207.23 -162.54 -117.85 -73.15 -28.46 16.23 60.93 105.62 150.32 195.01 239.708.73 -271.16 -226.89 -182.63 -138.36 -94.09 -49.82 -5.56 38.71 82.98 127.25 171.5113.1 -286.55 -235.08 -183.61 -132.14 -80.67 -29.20 22.27 73.74 125.21 176.68 228.1517.48 -521.15 -468.94 -416.73 -364.52 -312.31 -260.10 -207.89 -155.68 -103.47 -51.26 0.9534.96 -1129.73 -1056.88 -984.02 -911.17 -838.32 -765.46 -692.61 -619.76 -546.90 -474.05 -401.1952.44 -1316.37 -1239.44 -1162.51 -1085.59 -1008.66 -931.73 -854.80 -777.88 -700.95 -624.02 -547.10
Serenut 3 -50% -40% -30% -20% -10% 0% 10% 20% 30% 40% 50%P-Rates (Kg/ha) 0.56 0.67 0.79 0.90 1.01 1.12 1.24 1.35 1.46 1.57 1.690 -384.35 -308.20 -232.04 -155.88 -79.72 -3.56 72.60 148.76 224.92 301.08 377.244.37 -202.14 -147.56 -92.99 -38.42 16.16 70.73 125.30 179.87 234.45 289.02 343.598.73 -182.02 -111.94 -41.86 28.21 98.29 168.37 238.44 308.52 378.60 448.67 518.7513.1 -216.25 -142.80 -69.35 4.10 77.55 151.00 224.45 297.90 371.34 444.79 518.2417.48 -447.44 -361.44 -275.43 -189.43 -103.43 -17.43 68.57 154.58 240.58 326.58 412.5834.96 -624.21 -462.86 -301.50 -140.14 21.22 182.57 343.93 505.29 666.65 828.00 989.3652.44 -937.19 -767.83 -598.46 -429.10 -259.74 -90.38 78.99 248.35 417.71 587.07 756.44
Average Prices Serenut 4 ($/kg)Serenut 4 -50% -40% -30% -20% -10% 0% 10% 20% 30% 40% 50%P-Rates (Kg/ha) 0.43 0.52 0.60 0.69 0.77 0.86 0.95 1.03 1.12 1.20 1.290 -391.77 -332.34 -272.92 -213.49 -154.07 -94.64 -35.21 24.21 83.64 143.06 202.494.37 -290.23 -243.20 -196.17 -149.13 -102.10 -55.07 -8.03 39.00 86.03 133.07 180.108.73 -335.59 -284.19 -232.78 -181.38 -129.98 -78.58 -27.18 24.23 75.63 127.03 178.4313.1 -360.62 -307.46 -254.30 -201.15 -147.99 -94.83 -41.68 11.48 64.64 117.79 170.9517.48 -561.05 -494.03 -427.01 -359.99 -292.97 -225.95 -158.93 -91.91 -24.89 42.13 109.1534.96 -1043.41 -992.29 -941.17 -890.05 -838.93 -787.82 -736.70 -685.58 -634.46 -583.34 -532.2252.44 -1253.71 -1203.45 -1153.19 -1102.93 -1052.67 -1002.42 -952.16 -901.90 -851.64 -801.38 -751.12
Productivity and profitability of groundnuts with phosphorus fertilizer in Mbale district, Uganda 205

Abstract
There is growing scientific evidence linking climate change to many of the socio-economic and biophysical challenges affecting the vast majority of communities, especially in the developing countries. There is an urgent need to develop viable coping strategies to respond to the challenges. This study evaluated the potential for growing grain amaranth (GA) as a climate change adaptation strategy in Gem district, Western Kenya. The objectives of the study were to: i. Evaluate the potential of GA as an adaptation
strategy to climate change for smallholder farmers.ii. Develop soil fertility management guidelines for
sustainable GA production.iii. Facilitate value chain development for GA.
Farmyard manure (FYM) at 0, 2.5, 5.0 and 7.5 t ha-1and diammonium phosphate (DAP) at 0, 25, 50 and 75 kg ha-1were applied as factorial structure in a Random Complete Block Design (RCBD), replicated three times. Maize hybrid 511 was planted in adjacent fields under the same fertilizer treatments as a control study. Financial analyses for both GA and maize were carried out using partial financial analysis. Highest average GA yield was obtained from a combination of 75 kgha-1 DAP and 7.5 t FYMha-1. However, best marginal returns for GA was obtained at 75 kg DAPha-1. Marginal returns for GA was about five times higher than that of maize receiving the same FYM and DAP treatments. Moreover, with a shorter growth period and less moisture requirement, GA presents a possible alternative for rural poor communities to adapt to the impact of climate change.
Key words : Financial analysis; food security; nutrition; coping strategy
Introduction
There is growing scientific evidence linking climate change to the many socio-economic and biophysical
17. Evaluating the potential of grain amaranth as a climate change adaptation strategy for rural communities in East Africa:
A case study of the western highlands of Kenya1G. Ayaga*, R. Orlale, C. Esendi, D. Mutsotso and O. Semalulu2
1Kenya Agricultural Research Institute, Kibos, [email protected]
2National Agricultural Research Laboratories. P.O. Box 7065, Kampala, Uganda
challenges affecting the vast majority of communities, especially those living in developing countries (Kurukulasuriya and Rosentha 2003). East Africa is already experiencing the devastating impact of climate change, especially on its agriculture and ecosystem. The region has frequently experienced major floods and droughts, shifts and loss in marginal agricultural systems, biodiversity loss, vectors and diseases, water scarcity and famines and starvation induced by climate change. The impact has been felt more severely by East Africa, where 80% of the population depends on agriculture for its livelihood. Smallholder agriculture, which is characterized by high dependency on rainfall, marginal soils and subsistence farmers, becomes extremely susceptible. Early predictions suggest that, due to climate change, many African countries could lose more than 30% of their main crop, maize, by 2030.
A major reason for the vulnerability of the smallholder farmers to climate change is that they have limited options for adaptation. The limitation has been gradually introduced by policies, institutions, and practices as well as changes in lifestyles and coping strategies. It is amplified by the unsustainable NRM practices. For example, a majority of the smallholder farmers in East Africa have depended on maize as a staple food crop for many years despite clear evidence thatits yield has been decreasing in recent years, attributed mainly to natural resource degradation (Sanchez et al. 1996) coupled with changes in climate variability, seasonal shifts and precipitation patterns (APF 2008). This continued decline could have grave consequencesforthe poor rural smallholders. Short- or long-term climate change will require farmers to adopt new agricultural practices, including choice of crop varieties, increased use of inputs such as fertilizers, irrigation, timing of major operations and designing of alternative food supply systems.
Over-dependence on rain-fed agriculture in the region forces farmers to continue producing inadequate food even with normal rainfall, resulting in endemic poverty.
206 First ASARECA General Assembly, Volume 2

Additionally, there are the frequent climate-induced famines and related disasters, which push the population further into food insecurity. The governments often address drought problems using short-term emergency measures. Long-term strategic measures are required to encourage subsistence farmers to adopt self-reliant approaches and cope with climate change-induced impacts. Opportunities for adaptation, however, do exist, to reduce the impacts and consequently poverty in the region and also reduce the vulnerability of the marginalized and safeguard the livelihoods threatened by the droughts and degraded lands. One such promising adaptation strategy for the poor communities is the incorporation of grain amaranth (GA) into the existing crop list, as well as creating new products from it to alleviate food insecurity and poverty. GA has been identified in earlier years as a plant with promising economic value, yet it has remained under exploited to date (NAS 1975, 1984). Its leaves are eaten as a vegetable, while the seeds are used as cereals with high nutritional and medicinal values (Oke 1983; Saunders and Becker 1984; Kauffman and Haas 1983; Sanchez and Marroquin 1980; and NAS 1984).
Several characteristics of GA make it a compromise adaptation crop compared to maize, which is the current staple food crop in EA. Earlier studies have reported that the water requirement for growing GA is 42–47% that of wheat and 51–62% that of maize, and that it is drought tolerant at later stages of growth. Researchers have also reported that Kenyan farmers in regions with marginal rainfall plant amaranth rather than maize because they believe there is less risk of a crop failure with amaranth (Gupta1986). Observations indicate that amaranth, in the coastal desert of Peru, requires half the irrigation required by maize (Sumar et al. 1986). Amaranth's apparent ability to respond to water stress by increasing rooting depth makes it a potentially useful crop in regions where soil moisture conditions vary considerably among growing seasons (Burton and Henderson 1993). GA has also been reported to be the earliest maturing crop among cereals, taking only 45–75 days to mature compared to 180 days for maize in EA. It is disease and pest-resistant and does well in both high potential and dry lands and under different climatic conditions, including great heat (Putnam et al. 1989). It does well in different soils: sandy, loam, alkaline and saline, with a high yield potential of up to 1,000 kg per acre (Oluoch 2009).
The major challenge to increased production is the limited information available on the fertility require-ments of GA in East Africa. In USA, up to two-fold
yield increase was reported at 100 kg N ha-1; no yield advantage was noted at the higher N rate (Endres 1986). According to Kauffman et al. (1990), yield response was obtained with increasing N rates up to 90 kg ha-1; yields were reduced at higher rates. Lodging became a problem at 55 kg ha-1 and became more severe as the rate of N increased. There was no yield response to added P and K, probably due to the highest residual levels of P and K in the soil (Kauffman et al. 1990). In Guatemala, GA seed yields did not show a significant response between 0 to 90 kg N ha-1 (Bressani et al 1978a). By contrast, Sumar et al 1992 reported increasing GA response up to 160 kg Nha-1. In Nigeria, GA vegetative biomass was increased in response to N fertilizer when plants were harvested at 2-week intervals from 7 to 13 weeks after emergence (Olufolaji et al 1989).
This study was initiated to: (i) evaluate the potential of GA as an adaptation strategy to climate change for smallholder farmers; (ii) develop soil fertility management guidelines for sustainable GA production; and (iii) facilitate value chain development for GA.
Materials and methods
Description of the study site
The study was carried out in Wagai division, Gem district (formerly Siaya), Kenya (figure 1). The experiment was implemented during three cropping seasons of 2009 and 2010. Wagai division lies between longitude 340 22’ and 340 33’ East and latitude 00 02’ and 00 05’ with a total area of 193.3 km2. The area is characterized by a high rural population density of approximately 1,200 persons per km2, with farm holdings having declined to an average 0.5 ha. The area receives 1800–2000mm rainfall every year, which is bimodally distributed. The topography includes undulating hills, valley floors and plateaus, with an average slope range of 2% to 9%. Soils range from clay to loamy, but most commonly clay loam (44%) and silt clay loams (20%), with a restricted soil depth at 10–20cm in over 40% of the area. The major constraints at the farm level listed by the farmers include soil erosion, low and declining soil fertility, Striga weed and unaffordable inputs for nutrient replenishment.
Land use consists of subsistence cultivation of maize, sweet potatoes and cassava, with scanty tree cover, comprising Markhamialutea, Bridelliamicranthus, Acacia polyacantha, Albiziagrandibracteata, Tecleanobilis, Cussomia spp., Combretummolle, and Ficussycomorns. Shrubs are visible; the common species being Psidiumguajava, Carissa
Evaluating the potential of grain amaranth as a climate change adaptation strategy for rural communities in East Africa 207

edulis, Rhusvulgaria, Rhusnatalensis, Eucleadivinorum, Grewiabicolor, Acacia brevilpica, Acanthus pubsence and Lantana camara. Cropping and other activities compete for land use, and land degradation is severe. The division, as in many areas in Western Kenya and East Africa, has long been a maize growing zone, but worsening drought, believed to be linked to climate change coupled with the deterioration in soil chemical properties, texture and organic content as a result of land degradation,has made cultivation of the area’s once-reliable staple risky.
Field trials
Using a micro-catchment approach, 10 experimental fields were established, 2 in each of the 5 micro catchments. At each site, appropriate soil and water conservation structures were constructed to ensure that variation in grain yields at the different sites would largely be attributed to the applied treatments and to a lesser extent the farmers’ level of management.The other idea was also to promote the use of an integrated natural resource management (NRM) approach amongst smallholders for crop production. Sixteen treatments (table 1),comprising a combination of diammonium phosphate (DAP) with farmyard
manure (FYM) obtained from cattle sheds within the homesteads, were established in a randomized complete block design (RCBD), and replicated three times (figure 2).
Figure 1. Location of project sites in Kenya, Gem district (formerly Siaya).
Table 1:The combination and rates of FYM and fertilizer DAP applied in the trials
TreatmentFertilizer DAP
(kg ha-1)Farmyard manure
(kg ha-1) Abbreviation1 0 0 F0M02 0 2.5 F0M13 0 5.0 F0M24 0 7.5 F0M35 25 0 F1M06 25 2.5 F1M17 25 5.0 F1M28 25 7.5 F1M39 50 0 F2M010 50 2.5 F2M111 50 5.0 F2M212 50 7.5 F2M313 75 0 F3M014 75 2.5 F3M115 75 5.0 F3M216 75 7.5 F3M3
208 First ASARECA General Assembly, Volume 2

The DAP and FYM application was done at the onset of the short rains in September 2009 and the long rains in March 2010, just before planting. Shallow furrows 7.5 cm deep and 7.5 cm wide were cut in the demarcated 3 x 3 m plots and filled with the required amount of fertilizer and/or manure and mixed with the soil. Good quality amaranth seeds, obtained from African Amaranth Limited, Nairobi, Kenya, was then spread along the furrows and covered in thin soil layer. The inter-row spacing was 60 cm; after germination, the space between plants thinned to 15–20 cm. The dates of land preparation, planting, thinning, weeding and harvesting, plus visual observations of plant vigour were recorded. Yield data collected were subjected to analysis of variance (ANOVA) and the means were separated by the least significant difference (lsd) at 5% probability level. Maize hybrid 511 was planted in adjacent fields at a spacing of 75 cm between rows and 50 cm between plants, two seeds per hole having received the same treatment and replication as applied to GA. Yield data collected were subjected to analysis of variance (ANOVA) and the means were separated by lsd at 5% probability level.
Financial returns and analysis
The first step in the financial analysis for both GA and maize was estimation of the cost of fertilizing with manure and chemical fertilizer. This was followed by estimation of the economic returns from various rates of the applied fertilizer materials. The market prices of inputs and the value of GA and maize produced were based on price estimates at the local Akala market. However, the analysis did not include transport and
storage costs for fertilizers and seeds, nor costs of land preparation, weeding and farm implements. Further, this partial financial analysis did not consider the source of funds for the farmer to purchase the fertilizing materials. Ideally, if a farmer borrows money to purchase and apply the fertilizer, then the loan repayment together with interest should be included in the economic analysis. Equivalently, if the farmer uses money from her/his savings to cover the cost of fertilizing, then, to determine profit, a deduction should be made from the amount received from the sale of the produce corresponding to the return s/he would have received if s/he had used the money for some other purpose. Financial data were collected using formal survey tools (questionnaires, interviews, data sheets and field observations). Data were tabulated using Microsoft excel and statistically analysed using the Statistical Package for Social Scientists. Partial budget analysis was used to determine the net benefits of the alternative production packages for GA and maize.
Results and discussion
Effect of DAP on GA yield
GA yield grew with increasing rates of DAP (figure 3). The yield ranged between 2200 kg ha-1and3500 kg ha-1 during the first season, and between 2000 kg ha-1and 3510 kg ha-1during the second. The effect of DAP application on the grain yields was highly significant(P<0.001, LSD =62.4),with the plots receiving the highest level of inputs registering the highest yield. The effects of the fertilizer varied significantly with the two seasons (P<0.001, LSD =101.9).
Figure 2. Testing different soil fertility management options for grain amaranth in Kenya.
Evaluating the potential of grain amaranth as a climate change adaptation strategy for rural communities in East Africa 209
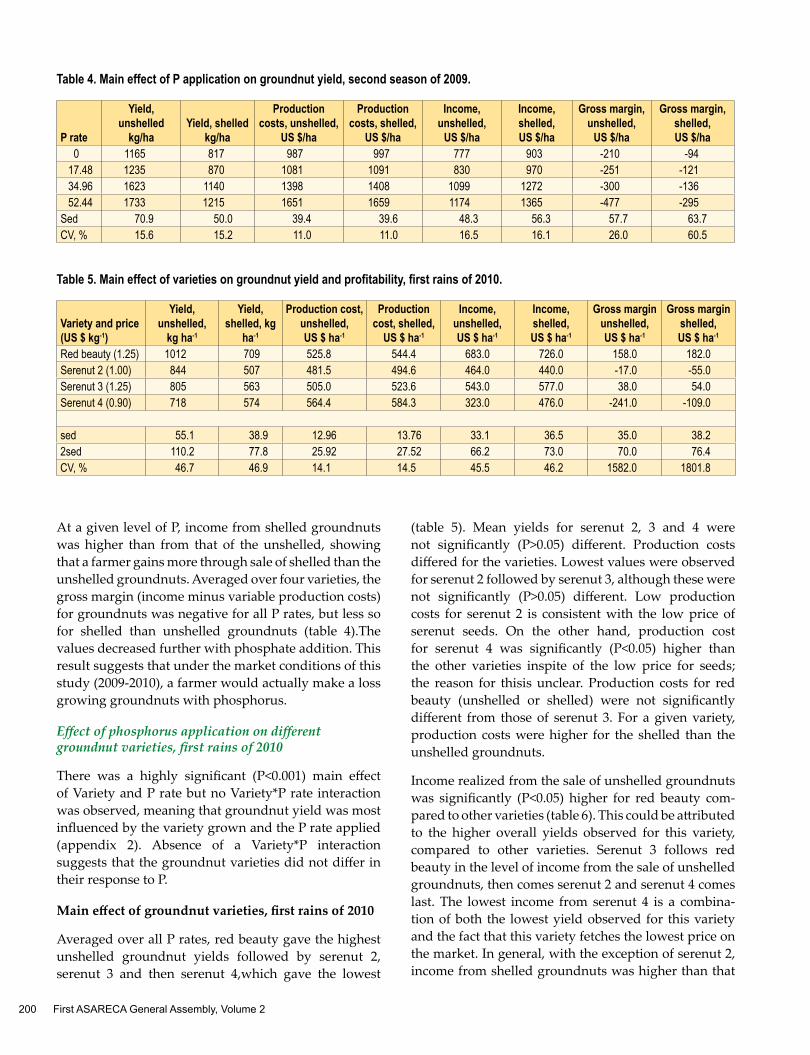
2800 kg). Yields with the same rates of applied DAP in the presence of 2.5 tons FYM ranged between 2200 kg ha-1 and 3500 kg ha-1 (an increase of 1300 kg), while in the presence of 5 and 7.5 tons FYM ha-1 the yields ranged between 2500 kg ha-1 and 3500 kg ha-1
(an increase of 1000 kg) and 2800 kg ha-1 and 3900 kg ha-1 (an increase of 900 kg) respectively (figure 5). It would appear that the impact of DAP on grain yield decreases when higher levels of FYM are also applied at the same time.
Figure 6 shows thegrain yields obtained when the rates of FYM were varied with DAP. There was a significant interaction effect between DAP and FYM (F[9,574]=106.1, P<0.001, LSD= 124.9). Yields of plots receiving incremental amounts of FYM at 0, 2.5, 5.0 and 7.5 tons ha-1 in the absence of DAP ranged between 520 kg ha-1 and 2900 kg ha-1 (an increase of 2380 kg), while for 25, 50 and 75 kg DAP ha-1, the yields were between 2300 kg ha-1 and 2800 kg ha-1 (an increase of 500 kg), 3000Kg ha-1 and 3200 kg ha-1(an increase of 200 kg) and 3200 kg ha-1 and 4000 kg ha-1 (an increase of 800 kg) respectively (figure 6). It would appear that the impact of FYM on grain yield decreases when higher levels of DAP are also applied at the same time.
Figure3. Effect of DAP on the amaranth grain yield for two seasons
Figure 4. Effect of FYM on the amaranth grain yield for two seasons.
Figure 5. Combined effect of FYM and DAP on GA grain yield
Effect of farmyard manure on amaranth grain yield
Amaranth grain yield increased with higher rates of FYM application (figure 4). The grain yield ranged between 2300 and 3100 kg ha-1 during the first season of the experiment and between 2300 and 3200 kg ha-1during the second season of growth. The effect of the applied FYM on the grain yields was highly significant (P<0.001, LSD =62.4), with the plots receiving the highest level of inputs registering the highest yield. There was no significant relation between the season and manure (F[3,574]=0.8, P>0.05), meaning that amaranth yields at different rates of FYM did not significantly differ between the two seasons.
These results are in agreement with previous studies where the effect of mineral fertilizers was reported to be highly significant, especially in soils with low inherent fertility (Sumar et al. 1992; Olufolaji1989; Macler et al. 1990). They indicate the important role FYM can play in the production of GA in the absence of mineral fertilizers. Mean yield of grain produced by applying 7.5 tons ha-1 was 3,200 kg ha-1 (figure 4) as compared to the mean yield of 3,600 kg ha-1 obtained by applying 75 kg ha-1 DAP (figure3). Apart from the slow nutrient releasing characteristics, FYM has other beneficial properties such as increasing soil organic matter, which, in turn, leads to improved soil and increased water-holding capacity and these could have contributed to the observed significant yield increase.
Combined effect of FYM and DAP on GA grain yield
There was significant interaction effect between DAP and FYM (F[9,574]=106.1, P<0.001, LSD= 124.9). Yields of plots receiving incremental amounts of DAP at 0, 25, 50 and 75 kg ha-1 in the absence of FYM ranged between 500 kg ha-1 and 3300 kg ha-1 (an increase of
210 First ASARECA General Assembly, Volume 2

Effect of applied DAP and FYM on maize grain yield
The effect of the applied treatments on maize grain yield is given in figure 7. Maize yield increased linearly with incremental application of DAP in the absence of FYM. The yields increased from 340 kg ha-1 in the control plots to 2210 kg ha-1 in the plots receiving 75 kg DAP ha-1, an increase of 1860 kg. Yield increase with the same rates of applied DAP in the presence of 2.5 tons FYM ranged between 1470 kg ha-1 and 2590 kg ha-1 (an increase of 1120 kg), while in the presence of 5 and 7.5 tons FYM ha-1 the yields ranged between 1620 kg ha-1 and 3040 kg ha-1 (an increase of 1420 kg) and 2020 kg ha-1 and 3590 kg ha-1 (an increase of 1570 kg) respectively (figure 7).
Similarly maize grain yield increased linearly with incremental rates of FYM application but not as pro-nounced as compared with DAP. The yields increased from 340 kg ha-1 in the control plots to 2000 kg ha-1 in the plots receiving 7.5 t FYM ha-1 (an increase of 1660 kg). Yields with the same rates of applied FYM in the pres-ence of 25 kg DAP ranged between 800 kg ha-1 and 2400 kg ha-1 (an increase of 1600 kg), while in the presence of 5 and 7.5 tons FYM ha-1 the yields ranged between 1600 kg ha-1 and 2800 kg ha-1 (an increase of 1200 kg) and 2200 kg ha-1 and 3590 kg ha-1 (an increase of 1370 kg) respectively.
Financial analysis
Table 2 shows the variable costs of inputs and produced grains as obtained from the project site and at the neighbouring Akala market. Variable costs were incurred mainly on land preparation, seeds, husbandry practices and fertilizers DAP and FYM. Both GA and
maize were sold in 2 kg tins (or gorogoro as known by the locals) at farm gate prices of KShs 200 and KShs35 respectively as in April 2011 when the market survey was conducted.
The computed gross margin for GA and maize and the grain yields obtained is given in figure 8.
Greater yields of GM were obtained as compared to maize for all the applied rates of FYM and DAP. On average, the marginal returns for GA was five times higher than that of maize receiving the same fertilizer treatment. Positive marginal returns for maize were only obtained with the supplemental application of mineral fertilizer. For GA, all the treatments, except for the control, produced positive marginal returns, indicating the economic superiority of amaranth even under low-input systems,wherein a majority of the smallholders operate, compared to maize. With the evidence of declining maize yields under smallholder farms, the superior economic attribute of GA would
Figure 6. Combined effect of FYM and DAP on maize grain yield. Figure 7. Effect of applied DAP and FYM on maize grain yield
Table 2. Grain amaranth and maize production costs per hectare*
VariableVariable cost (KShs)
Amaranth MaizeSeed per hectare (ha) 480 1,500Land preparation per ha 1,500 1,500Planting, weeding, thinning 2,000 2,000Harvesting 1,500 1,500Manure per ton 2,000 2,000Fertilizer 50 Kg 2,500 2,500Price of produce (2 kg) 200 35
*Costs and prices as in April 2011 within the project area and in Akala market.
Evaluating the potential of grain amaranth as a climate change adaptation strategy for rural communities in East Africa 211

perhaps make it a crop of choice for the impoverished farmers in the rural areas,who are burdened by the negative impacts of climate change. The argument would be for them to grow GA as a supplement to other crops and utilize the extra money obtained from the sale of the grain to buy maize from open market for consumption. The National Academy of Science (NAS 1975) had identified GA as a plant with economic value. However, its potential remains unexploited due to several factors. With its added favourable attributes such as drought and pest tolerance, faster maturity and good performance with low inputs or in less fertile soils, GA presents an opportunity as an adaptation strategy for the rural poor in ECA.
Technology innovations for value addition
During the course of implementing the field trials, several concerns were raised by participating farmers in regard to the planting and harvesting of GA; these activities were reported to be labour intensive and inefficient, leading to high loss of grain.
Sowing: Farmers reported difficulty in sowing GA seeds at 15 cm intervals and at a shallow depth of 6 cm because the seeds were tiny. They usually broadcast the seeds in rows about 75 cm apart. However, this leads to waste of seeds and a lower plant density, with additional effort and time required to thin the seedlings to the desired spacing. Without thinning,plant growth is usually stunted, perhaps due to over exploitation of nutrients and water.
Harvesting and threshing: Amaranth seeds are ready to harvest when you gently rub the seed heads between your hands and the seeds fall readily off. When this occurs, there is a very short window for harvesting and threshing. If the farmer waits too long, the wind will
blow the seeds away, resulting in reduced yield. Farmers reported that harvesting needs to be completed in one day. To achieve this, either additional labour is hired or the farmer only grows what can be harvested and threshed by his family in one day. The typical method used for harvesting is to cut the stem off and carry the fragile seed heads back to the homestead, where the grain is threshed. The cutting and handling of the seed heads leads to significant loss of grain.
Winnowing: The seeds are separated from the chaff by throwing the amaranth into the air. This process is again very time sensitive because the seed head becomes bristly after it dries and it is difficult to separate the seed from the chaff. Due its small size and light weight, a significant amount of the grain is usually blown off with the wind together with the chaff, resulting in losses.
To address the above concerns,ACCESS, a local NGO, madecollaborative efforts with a team from Hartford University US to devise innovative technologies that would increase the production of GA through efficient and reduced grain loss and wastage during planting, harvesting and post-harvest handling. Their collaboration saw the fabrication of a mechanical seed planter and a human-powered thresher.
Mechanical seed planter: The mechanical seed planter is a sisal twine apparatus, which is a wooden device, whose purpose is to guide a length of twine through a number of rotating gears. The gears dip the twine in a mixture of flour paste and an amaranth seed at intervals of 15 cm as the operator holds one end of the twine and walks away from the apparatus. The end result is seeds “glued” to a length of twine at the desired spacing. The combination of twine and flour paste serves a similar purpose as seeding tape would, in that both are adhesive surfaces to which seeds are affixed. The apparatus utilizes a biodegradable twine made locally from sisal. This ensures that the apparatus can remain in the ground through the next planting season without harming the environment. However, a significant difference between seed tape (competition) and sisal twine is that the former is most often imported and comparably expensive, while the sisal twine apparatus can be produced locally. Hence, in addition to increasing yields and planting efficiency, producing the sisal twine apparatus locally can provide employment opportunities and income.
A preliminary cost analysis of all materials needed to build the seed twine apparatus locally shows that the device would cost about US$ 5.20, which is well within the financial means of most Kenyan farmers. The major
Figure 8. Marginal rates of return for GA and maize treated with manure and mineral fertilizer combinations.
212 First ASARECA General Assembly, Volume 2

savings is the reduced labour from no longer having to thin the amaranth about three weeks after it germinates. For example, if the average daily wage of a farmer is $0.50–$1.15 a day, and thinning an acre of land requires two individuals two days to complete, then, potentially, between $2 and $4.60 could be saved every season. In addition, the farmer will require less seed quantities per unit of land planted compared to the broadcasting method currently used. Though, farmers will have the additional cost of having to purchase the sisal twine. Overall, the payback for the seed planter is between one and two growing seasons.
Human-powered thresher: The thresher consists of two drum wheels connected by a shaft (figure 9). The barrel, which is made out of wood,has a fine screen at the bottom to separate the amaranth seed from the chaff. A hand crank is used to rotate the thresher. The thresher is placed on a wheelbarrow so that it can be pushed between the rows of amaranth. The farmer bends the stalks down and rubs the seed heads into the thresher. When full, the thresher is then rotated so that the seeds are pushed through the fine screen and collected in a bag, while the finer chaff is blown away. The human-powered thresher provides the farmers with a tool to efficiently harvest and thresh the amaranth in the field.
Lessons learnt1. Collective action is the key to improving yield
and incomes of poor farmers. Smallholders acting as individuals can neither produce the quantities necessary to enter the larger, more reliable markets, nor access current information, nor transportation to those markets. Farmers themselves must form and participate in strong, local marketing associations to receive a fairer value for their produce. Reducing the stronghold of opportunistic middlemen requires that farmers develop greater
market intelligence and address farming as a business. The poorer farmers risk being bypassed if special effortsare not made to include them in the establishment of market associations.
2. Collective bulking, storage and transportation are essential for meeting market demand and for developing forward contracts with consumers or processors.
3. Better access to markets will accelerate the adoption of improved farming techniques in a manner that stimulates local economies and promotes employment opportunities as an important component of rural transformation.
4. Implementation of on-farm research work involving full participation of community groups requires patience, full-time dialogue and engagement and extensive training to achieve modest success.
5. The community measure results are in terms of immediate social benefits as opposed to scientific trend analysis, and this should guide the format of data presentation for participatory research approaches.
6. Empower the community, both individuals and groups, to achieve greater levels of self-reliance.This will build the community’s confidence and encourage itto manage the challenges by forming self-regulating NRM grassroots bodies, for example, micro-catchment committees.
Acknowledgements
ASARECA for facilitation
Colleagues from KARI (Ruth, Dorcus and Christine)
Colleagues from NARO, Uganda and Sokoine University (Tanzania)
Director, KARI
Figure 9. Prototype of the human-powered thresher.
Evaluating the potential of grain amaranth as a climate change adaptation strategy for rural communities in East Africa 213

References:
Bressani R, Gonzales JM, Zuniga J, BraunerM, Elias L.G.1987a. Yield, selected chemical composition and nutritive value of 14 selections of amaranth grain representing four species. Journal of the Science of Food and Agriculture 38:347–356.
Burton LJ and Henderson TL. 1993.Water use patterns of grain amaranth in the Northern Great Plains. Department of Plant Science, North Dakota State University, Fargo, ND 58105.
Climate could devastate crops. BBC News Online. 31 January 2008. http://news.bbc.co.uk/2/hi/science/nature/7220807.stm.
Endres C. 1986. Influence of production practices on yield and morphology of Amaranthus cruentus and Amaranthus hypochondriacus. M.S. Thesis, University of Arkansas, Fayetteville.
GuptaVK. 1986. Grain amaranth in Kenya. Proceedings of the Third Amaranth Conference. Emmaus, PA. Hauptli, H., and S.B. Jain. 1984. Genetic structureRodale Press, Inc.
Kauffman CS and Weber LE. 1990. Grain amaranth. In p. 127–139, Janick and Simon JE, eds., Advances in new crops. Timber Press, Portland, OR.
Lobell DB, Burke MB, Tebaldi C, Mastrandrea MD, Falcon WP, Naylor RL. 2008. Prioritizing climate change adaptation needs for food security in 2030. Science 319 (5863):607–10.
Macler B, Bamberg E, Moffat E, Bui H, Minor E,Mishioka L. 1990. Effects of salinity and N on growth, productivity and food value of Amaranthus in controlled culture. In pp: 129-142. Procceedings of the Natural Amaranthus Symposium, fourth: Perspectives on production, processing and marketing, Minneapolis, MN. 23–25 August 1990, Minn. Ext. Serv., St. Paul.
NAS. 1975. Underexploited tropical plants with promising economic value. Natural Academy of Sciences, Washington, DC.
NAS. 1984. Amaranth: Modern prospects for an ancient crop. Natural Academy of Sciences, Washington, DC.
Olufolaji AO. 1989. Response of four Amaranthus cultivars to N levels and harvesting methods. Tests Agrochemicals Cultivars 10:166–167.
Putnam DH, Oplinger ES, Doll JD, Schulte EM. 1989. Amaranth: in alternative field crops manual. University of Wisconsin-Extension, Cooperative Extension, University of Minnesota: Centre for Alternative Plant and Animal Products and Minnesota Extension Service.
SumarL, Pacheco J, Concha AIR, Castelo G, Aedo R, Choquevilca YC, Valdeiglesias E. 1992. Grain amaranth research in Peru. Food Reviews International 8:87–124.
Sumar K, Pacheco N, and Aquirre RJ. 1986. Chemical vs. organic fertilization of grain amaranth. Proceedings of the Third Amaranth Conference, Rodale Press, Inc., Emmaus, PA.
214 First ASARECA General Assembly, Volume 2

Abstract
The East and Central Africa region has an average production of 9 million tons of maize on 5 million ha of land and an average yield of 1.8 t/ha. These yields are relatively low compared to the potential yield of 4.5–7.0t/ha. The major constraints facing maize productivity include drought and low soil fertility. The current changes in climate due to global warming will further exacerbate the problem of drought. However, research has developed technologies and innovations that could alleviate the problems and boost maize productivity in the region. The challenge is that the technologies are not yet widely used by the small-scale farmers in the target areas; hence, no wide-scale impact is seen. A review was conducted in Ethiopia, Tanzania and Kenya to document proven soil and water management technologies (SWMT) and drought-tolerant (DT) varieties for improved maize productivity and to identify the constraints to adoption. SWMT were documented using literature review, and through the participatory approach during workshops and focused group meetings with farmers and other stakeholders. The review revealed that use of priority SWM practices with appropriate drought-tolerant varieties optimized productivity of maize; more than doubled the yield; created a demand for capacity building in the technologies; and contributed to household food security.
However, a majority of the smallholder farmers have limited access to technological knowledge. Also, the researchers lack adequate resources for adaptation trials to enhance technology dissemination and there is poor linkages and institutional frameworks. The solution lies in increased stakeholder participation and empowerment at all levels, from primary to tertiary, to stoke research and use the generated knowledge to meet demand. The focus should be on up-scaling to achieve the wider impact needed to ensure food security for the region in the 21st century.
Key words: Soil water management technologies, drought-tolerant maize varieties
Introduction
The world community is increasingly concerned about increasing food insecurity and poverty in sub-Saharan Africa (SSA). High dependence of African countries on pre-dominantly rain-fed agriculture, whose productivity and profitability is largely determined by annual rainfall, is one of the critical reasons for Africa’s inability to respond effectively to the developmental challenges. Maize is the third most important cereal worldwide in terms of area cultivated, after wheat and rice. It is the main staple crop in Latin America and Africa, and, in fact, the most important crop in SSA.
Frequent droughts (3–5 years) and irregular rainfall have been observed, particularly in the last ten years, to threaten maize productivity. In West Africa, 35% of the area is affected by drought; however, there has been a phenomenal increase in maize productivity in recent years due to increased use of high-yielding varieties (Godwin et al. 1997). The major part of the eastern and central Africa (ECA) region is semi-arid: Ethiopia 66%, Tanzania 40%, Kenya 80%, Rwanda 35%, and Burundi 15%. However, after a drought, good rains and/or flush floods follow. The resulting surface runoff and soil erosion causes leaching and further depletion of the topsoil. This is further aggravated by heavy weed infestation competing for the nutrients and soil moisture, lowering the maize production potential. Climate change impact is estimated to decrease maize productivity in Africa and Latin America by 10% by 2055, but in ECA this could even be substantially greater at the household level for the resource-poor smallholding farmers (www.elsevier.com/locate/gloenvcha). This may add significantly to the development challenges of ensuring food security and reducing poverty in the 21st century. In 1996, US and more than 180 world leaders pledged to halve the number of undernourished by 2015.
As for the population, the global figures have not decreased significantly (850 million in 2001–2003), but in SSA, the population increased from 170 million in 1990–1992 to 200 million in 2001–2003. However,
18. Up-scaling of soil and water management technologies and drought-tolerant varieties for increased maize productivity in the east and central Africa countries
HW Mwangi1, F Mgonja2, H Admassu3, F Opio4, I Rwomushana 4, J Karau5, V Kimani6
1Kenya Agricultural Research Institute, P.O Box 14733-00800, Nairobi. 2Selian Agricultural Institute, Tanzania3Ethiopia Agricultural Organization, Ethiopia. 4ASARECA. 5University of Nairobi, Faculty of African Studies and
Anthropology, Kenya. 6Pesticide Agricultural Resource Centre
Up-scaling of soil and water management technologies and drought-tolerant varieties for increased maize productivity in the ECA countries 215

according to http://www.gao.gov/htext/dt868.htm/international%20food%20security, insufficient efforts by host governments and donors threaten efforts to halve hunger in SSA. Coupled with increasing prices, chronic undernourishment due to low productivity, limited rural development, poor health of workforce and climate change, food insecurity is only likely to increase.
The ECA region has an average production of 9 million tonnes of maize on 5 million ha and an average yield of 1.8 t/ha. These yields are relatively low compared to the world average of 4.3 t/ha (CIMMYT, 2004) and the potential yield of 4.5 –8.0t/ha. America produces 40% of the world’s maize harvest, with an average yield of 5t/ha, indicating the potential that exists to increase productivity.
The commonly used production methods and tech-nologies exacerbate climate change effects and natural resource depletion, resulting in reduced productivity against increasing food demand. There is no doubt that sustainable improvement of SWM has so far proved to be intractable in the ECA region (Batiano et al. 2007).
Around 650 million people consume maize in Sub Saharan Africa (SSA) (Mwangi, 2008). About 90% of the crop is used as food. The rest is used as industrial raw material for biofuels, animal feed production, paper and pharmaceuticals manufacture. In ECA, it provides over 23% of the calories at about 100 kg of per capita consumption per year. Maize has also increasingly become a cash crop for the region. It is used as human food in many ways (corn meal, pop corn, roast maize, unleavened bread, soft drink, cornflakes, horminy-nixtamalization); a major source of starch in home cooking and industries (maize gluten, maize syrup, grain alcohol); alternative medicine; chemicals (plastics, fabrics, adhesives); cooking oil and bio-fuels (research for biogas diesel in Germany using Fischer Tropsch method); animal feed silage; horticultural (sweet corn, roast maize); and field maize (dry grain) or seeds.
Global food prices from 2007 to 2008 cast doubts on the ability of the market mechanism to balance food supply and demand in domestic and international markets. There are three options: (1) increase efficiency in maize production; (2) reclaim and place more semi-arid land under production; and (3) use advances in technology to enhance productivity.
A number of technologies and innovations have been developed that offer solutions to the problems and
have the potential to boost maize productivity, but are not adequately used by the small-scale farmers in the target areas. Finally, the production constraint was resolved by: (1) identifying SWMT and innovations available; (2) identifying the issues and constraints to their adoption at the local, national and regional levels; (3) building capacity, including trained trainers (TOT) on SWMT and DT varieties; (4) promoting priority SWM technologies like modified zais 2 by 2 feet, raised beds and furrows, conservation tillage/minimum tillage, maize transplanting, contour ridging, cover crops (Dolichos lablab, pigeon pea, beans, cowpeas and pumpkins), and DT varieties Dekalb 8031, Duma SC 41, DHO4, Situka 1, Situka M1, Vumilia K-1, Melkassa 2, Melkassa 4 and Melkassa 6; and (6) disseminating the generated knowledge. Use of SWMT and DT varieties improved maize productivity by 2 to 4 times compared to earlier farmer practices. This generated income and contributed to food security at the household level for the participating communities. Yet, the results remain limited in relation to the scale of the problems. Widely replicable and sustainable approaches are proposed for phase two:• Integrate strategies bringing together technical
and policy solutions that encourage change among stakeholders from the farmers to decision makers at both the national and regional levels.
• Using the technical knowledge that is generated, the initiative can be up-scaled and out-scaled further to empower more people from primary to tertiary levels. This will contribute substantially to building greater sustainable food security in ECA region in the future.
Project justification and rationale
In light of the present regional concern to enhance productivity and competitiveness of agriculture to meet the food needs of the 21st century, there is a great need to enhance utilization of available technologies and innovations in the region. Poor management of soil moisture, soil organic matter and inappropriate maize varieties have resulted in low maize productivity in most of the ECA countries; the existing food production system cannot meet the growing demand. Though, technologies have been developed to alleviate the problem of SWM and improved DT maize varieties have been introduced, they have limited use and have not benefited the smallholder farmers. The majority remains food insecure. Therefore, there is a need to upscale the technologies to increase maize productivity and thereby food security.
216 First ASARECA General Assembly, Volume 2

The major underlying assumptions in the project intervention work were:• Increasing adaptation and adoption of SWMT
with DT varieties in target agro-ecologies would increase maize productivity in the drought-prone areas of Tanzania, Ethiopia and Kenya.
• Improving farmers’, extension workers’ and researchers’ knowledge of SWM principles and practices would improve adoption of the technologies and thereby increase maize productivity.
Project goal
The project’s goal was to enhance sustainable productivity, add value to maize and increase its competitiveness in the ECA countries.
Project purpose
The project sought to enhance the use of tested SWMT, with DT varieties to sustain maize productivity in the drought-prone areas of Ethiopia, Tanzania and Kenya.
Project objectives
The three overall objectives of the project were: • To facilitate the uptake of tested SWMT with DT
maize varieties in the drought-prone areas of Tanzania, Kenya and Ethiopia.
• To strengthen the capacity for enhancement of promotion and utilization of SWMT with DT maize varieties in the region.
• To enhance availability of knowledge and information on SWMT with DT maize varieties to the various dissemination resources in the region.
Method
The project adopted the following process:• Reviewed, identified and documented the available
SWMT and DT varieties.• Identified issues and constraints to adoption of
the technologies through participatory meetings/discussions with farmers and other stakeholders.
• Promoted priority technologies during sensitization meetings and field demonstrations.
• Improved capacity of stakeholders to deal with existing technologies in the short and long term through extensive training, farmer field days, exchange visits to witness success stories and
sharing. The Group Approach was used to reach more people.
• Prepared and disseminated promotion materials (posters, brochures) containing the appropriate technologies; three documentaries were also made.
The budget outlined for the activities was US$ 103,920.00.
The study area
The project on up-scaling of SWMT and DT varieties for increased maize productivity aimed at integration and promotion of the already tested technologies and improved DT varieties to optimize maize productivity in Tanzania, Ethiopia and Kenya. The study area in Ethiopia was Marmarssa and Dibibissa. In Tanzania, it was Monduli, Arusha and Meru. In Kenya, it covered Kieni East, Kigumo, Murang’a South and Makueni.
Activities
Various activities were conducted to achieve the project’s goals:
Output 1: Identifying, documenting and disseminating tested SWMT for production of DT maize varieties.
The activities that were conducted to achieve this output included: the selection of sites; identification of farmer groups using participatory approaches; a baseline survey; review and documentation of SWMT and innovations; and the holding of workshops.
Output 2: Building the capacity of farmers, extension workers and partners to use improved SWMT for production of DT maize varieties.
The activities to achieve this output included: desk study, field visits, preparation of training modules, compilation of a SWMT training manual and conducting of ToT workshops in the use of integrated SWM for production of DT maize.
Output 3: Identifying and promoting SWMT for production of DT maize varieties.
The activities to achieve this output included: sensitizing farmers and development workers to improved SWMT for production of DT maize varieties; conducting farmer demonstration trials; conducting field days; and farmer assessments of demonstrated SWMT for production of DT maize varieties.
Output 4: Enhancing availability of knowledge and information on SWMT for production of DT maize varieties to uptake pathways.
Up-scaling of soil and water management technologies and drought-tolerant varieties for increased maize productivity in the ECA countries 217

This was accomplished through: preparation of promotional materials (brochures/leaflets, bulletins, poster) and dissemination of information and communication products through 8 field days, 3 documentaries, 7 workshops and the mass media.
The Group Approach enabled the project to reach the technologies to 523 farmers in Ethiopia, Tanzania and Kenya.
Results and achievements• Sites and participating groups were identified
using participatory approaches;• Baseline surveys were conducted, and issues and
constraints to adoption documented;• SWM technologies and innovations were reviewed
and inventories made available country-wise;• Training modules and manuals were prepared; • Capacity was built;• Consultative and participatory meetings with
stakeholders prioritized appropriate SWMT and DT for promotion; and
• Enhanced knowledge was made available to end-users.
The technologies that were promoted included: (i) Modified zais 2 by 2 feet, double digging or raised beds (see figure 1); (ii) broad bed and furrows (see figure 2); (iii) conservation tillage/minimum tillage; (iv) maize transplanting; (v) contour ridging; (vi) cover crops (Dolichos lablab, pigeon pea, beans, cowpeas and pumpkins); (viii) and DT varieties Dekalb 8031, Duma SC 41, DHO4, Situka 1, Situka M1, Vumilia K-1, Melkassa2, Melkassa4 and Melkassa6.
Intensive capacity building was undertaken on principles and technical skills for appropriate use of technologies through ToT, and trainers were empowered to train other farmers and ensure maize yield increase.
Results of the analysis as shown in Table 1 indicate that yield gaps varied with SWMT and use of DT compared to farmers’ practice:• Transplanting had significant effects on yields
{F [1,15]= 142.28, P< 0.001) with Least Significant Difference (LSD) 250.4 at 5% level of significance.
• Modified zais: 68 zais (maize holes) of 2 by 2 by 2 feet yielded 1 bag of 90kg and, on an average of 6.7–9.4 t/ha, while 1 by 1 by 1 foot yielded 4.1t/ha compared to 1.2 t/ha for DHO4 maize variety.
• Sub-soiling yielded 6.9t/ha.• Minimum tillage 2.2t/ha. • Intercrop 3.3t/ha.
Increased yields translated not only into household food security, but also surplus produce for sale and generated incomes, thereby contributing to poverty alleviation and wealth creation. The ultimate
Figure 1: Raised beds used for maize production. Figure 2: Use of broad bed and furrows.
Table 1. Maize yield gaps due to SWMT (2010)
Soil water management technologies
Maize yield (t/ha)
SWMT maize yield gap (t/ha)
Farmer practice 1.1–1.7 0Modified zai pits (1x1 x 1foot) 3.0–4.1 1.9–2.4Modified zai (2 x 2 x 2 feet) 6.7–9.4 5.6–6.7Ridging 4.5–6.9 3.4–5.3Minimum tillage 2.2–3.0 1.1–1.3Transplanting 2.4–3.3 1.3–1.6Intercropping 3.3–4.5 2.3–2.8
218 First ASARECA General Assembly, Volume 2

beneficiaries were key players in the maize product value chain – smallholders involved in cultivation, trading, processing and packaging, and marketing. In Tanzania, Loksale nomads planted lablab and generated income through the sale of the surplus, creating jobs and wealth. Ethiopia reduced labour and time used in conservation tillage and produced more maize. The effects of the knowledge that has been generated have the potential to spill over and impact many more people and could increase productivity of other DT varieties such as sorghum and millet.
Description of the study population:
Farmer characteristics: The baseline established that most of the survey respondents were above 51 years, with 59% of the respondents being male and 41% female. Among the respondents who were household heads, 88% were males while 12% were females. Of the household members, 83% stayed in their homestead, 12% in the urban areas and 5% elsewhere. As for the education level of the household head, results showed that 58% were educated up to the primary level, 35% secondary, 6% had attended adult education classes and 1% had a university degree. As for occupation, 84% of the respondents were farmers, 5% were businessmen, 4% teachers.
The range of implements the respondents owned included wheelbarrows (55%), ox-ploughs (19%), ox-carts (3%), knapsacks (39%), bicycles (24%) and shovels (79%).
Most of the respondents reared chicken, goats, sheep and cattle. Fodder crops for cattle were grown by 86.9%, which included napier grass (91%), grass (3%), napier and sweet potatoes (64%).
Land
Among the respondents, 47% had private land, 48% had customary land, and 3% lived on settlement land and 2% on leased land. About 62% had security of tenure. For 90% of the respondents, it was socially acceptable to protect their land from animals. The respondents had an average land size of 0.78 acres.
Food security
In terms of total household food production for both income and food, most of the farmers produced less than a bag for maize, beans, pigeon peas and cowpeas per season. In the last five years, respondents were able to produce enough grain to meet their food and market requirements in only two out of five years. On
an average, most respondents had enough grain for only four months of the year. However, they sold 57% of their produce.
Cropping sequence
The most important crop was maize, with an average of 2t/ha, and 54% was consumed at home. About half (47%) of the respondents utilized maize rotations as a cropping sequence. Of this, 20% grew maize and beans; 20% maize, beans and potatoes; 4% potatoes, beans and sukuma; 2% maize, beans and bananas; 9% beans, pigeon peas, and cowpeas; 4% beans; 2% pigeon peas and cowpeas; 4% maize; 18% beans; 2% sweet potatoes; 4% beans and cowpeas; 2% beans, njahi and sweet potatoes; and 9% maize, beans and sorghum. Of the respondents, 43% grew maize in rotation with other crops.
Tillage practices
Most of the respondents (91%) did not use conservation methods and practised conventional farming, and only 9% used mechanized farming. Most of them ploughed the land manually using jembe (18%), hoe (40%), draught animal (30%), and both jembe and hoe (12%).
Weed management
As for weed management practices, 95% used manual weeding, while 5% used herbicides. For homestead to lowland, herbicide use ranged from 5–25% where conservation agriculture (CA) had been adopted. A majority of the respondents (75–83%) weeded twice in a season.
Labour
For respondents using the ox-plough, 48% ploughed the fields themselves, 44% hired labour, 4% used labour sharing arrangements, 4% used other sources of labour. A majority of the top land respondents (62%) did the work themselves and a smaller number (38%) hired labour.
Soil compaction, soil fertility and pest control
Soil compaction was reported to be a problem by 48% of the respondents. They adopted mitigating tactics like deep ploughing (79%), application of manure (13%), use of ash (6%), or use of a sub-soiler (2%).
Soil infertility was a problem for 73% of the respondents. They mitigated the problem through the application of cattle manure (41%), inorganic fertilizers (31%), rotations (16%), improved fallows (8%), or natural fallows (4%).
Up-scaling of soil and water management technologies and drought-tolerant varieties for increased maize productivity in the ECA countries 219

Among the respondents, 17% practised crop rotation to reduce pest and diseases; 68% practised rotation to improve soil fertility; 5% practised rotation to diversify crop production; 3% for easier weeding; and 7% to reduce pests and diseases and improve soil fertility. Among the respondents, 33% left stover on the field for the following reasons: add soil fertility (31%), grazing (10%), traditional practice (7%), stop soil erosion (3%), composting (21%), manure purposes (21%) and mulching (7%). Among the farmers who were interviewed, rotation and intercropping had the same values. Of the respondents, 52% grew cover crops. The most regular ones were potatoes (28%), sweet potatoes (19%), beans and sweet potatoes (11%), napier grass and sweet potatoes (12%), pumpkins (4%), potato and yams (6%), sweet potatoes and grasses (6%), Dolichos lab lab (4%), peas (2%), sweet potatoes and pumpkin (4%), and beans, sweet potatoes and Irish potatoes (4%).
Maize varieties
The selection of maize varieties was: early maturity (33%), high yield (24%), availability (17%), DT (15%) and disease-tolerant (11%). About 52% of the respondents grew cover crops. The respondents got information on soil and water conservation from the government (78%), other farmers (14%), and 8% relied on themselves.
Farmer associations
Among the respondents, 90% had a household member who belonged to a farmers’ group or association. In 88% of the associations, soil and water conservation methods were discussed.
Environmental issues
The project emphasized the need for farmers to carefully plan the use of natural resources within the framework of conservation. Farmers need to take appropriate action in adapting promoted technologies to improve the status of their environment.
Farmers became aware of the need to assess the impact of adapted farming technologies on the environment continuously. For instance, according to a study con-ducted in Mombasa, plastics are increasingly being used as cooking fuel. The burnt plastics emit dioxins, which when inhaled, are lethal to the body. This dem-onstrated a need for all stakeholders to be sensitized to the environment; they need to adopt environmentally friendly technology and avoid putting pressure on the environment.
Stakeholders were sensitized during project inception and ToTs to the Environmental Impact Assessment (EIA) Tool, which is used to evaluate the effect of a proposed action on the environment, with the long-term goal being to protect human health and the environment. The EIA process involved screening, scoping, impact analysis, mitigation, reporting, review and decision making.
The use of plastics bags was another issue of concern. The effect of the use of plastic bags on the environment was discussed and it was suggested that biodegradable plastic bags replace them. As for carbon trade, it was not considered effective since the problem of pollution by multinationals companies persists. Various forums were used to challenge stakeholders to enhance SWMT to improve crop yield and adopt farming methods that serve to replenish and sustain natural resources.
Cost of technology adaptation, promotion and adoption
The concerns of ASARECA include increasing food insecurity, malnutrition, and poverty in ECA. High dependence on rain-fed agriculture, whose productivity and profitability is largely determined by annual rainfall, is one of the critical reasons for the inability to respond effectively to the developmental challenges.
The major constraints facing maize production in the ECA region is low maize productivity as a result of a series of abiotic and biotic stresses, including drought, low fertility. Further, a major part of the region is semi-arid, for example, 66% of Ethiopia, 40% of Tanzania and 80% of Kenya.
The cultivation practices involve continuous cropping and removal of any residue organic matter without replenishing the soil. These smallholder farmers have limited access to conservation agricultural technologies, which have shown a huge potential for improving productivity to meet food demands, generating rural employment and incomes, and enhancing soil moisture conservation and the physical and chemical characteristics for sustainable maize production. In practice, farmers face many problems that hinder them from adopting the technologies. These include: (i) high price of inputs and poor infrastructure; (ii) risk due to uncertainty in climate; (iii) low price of produce; and (iv) lack of access to credit for smallholders. Further, researchers have inadequate funds for scaling-up activities to make the necessary impact in the region.
220 First ASARECA General Assembly, Volume 2

The current problem must be arrested by mitigating the problem of drought that already exists in these countries. This can be done by concentrating on efforts to up-scale and out-scale SWMT and DT initiatives using DT varieties to ensure food security in the 21st
century.
Results
Project outcomes
Adoption and use of improved SWMT was facilitated and enhanced. The long-term outcome will be measured in terms of impact of the adopted technologies on the ultimate beneficiaries. The impact up till now has been three-fold:
Social impact
Baseline information was used to gauge the changes in the target area as a result of the project interventions. Among the changes that were observed were that there were more marketing jobs since beneficiaries were selling excess maize from SWMT. An increased demand for seed, especially DT and cover crops seeds, was also observed.
Environmental impact
The project created a sustainable soil nutrient recycling system through use of SWMT that are more environ-mentally friendly. Use of technologies, for example, ripping of soil with minimum tillage and cover crops enhanced soil water percolation, reduced surface runoff, resulting in less soil erosion. Intercropping with leguminous crops improved soil fertility in addition to creating biological diversity. The project, therefore, had a positive impact on the environment.
Linkages, partnerships and collaboration
A basic feature of the project was an in-built integrated approach to research for development, involving farmers, researchers, extension officers, civil society organizations, government institutions at local and national levels, and research systems. Partnerships were strengthened as regional capacities prepared to contribute towards meeting food security in the ECA region in the 21st century.
Conclusion and recommendations:1. Soil water capture improved and there was
increased productivity of DT maize cultivars up to
2–4 times in comparison with farmers’ traditional practice depending on the technology chosen technology demand created. However the supply of DT maize seeds were insufficient compared to demand by farmers.
2. Use of DT maize varieties increased maize productivity and resilience to climatic change impact as seen during the 2009 drought.
3. Participants became aware of the need for continuous assessment of the impact of the adapted farming technologies on the environment.
4. People endowed with technological knowledge and energy were unwilling to engage and farmers continued to till depleted soils. There is a need to change the perception of agriculture and link it to sustainable development. This can happen only if the innovation platform and knowledge exchange is strengthened.
5. Partnerships and collaborative efforts need to be encouraged so that efforts and resources are integrated to intensify the initiative and empower more stakeholders. Education levels from the primary to tertiary need to be improved to unlock the potential and assist farmers tap SWMT benefits and increase yields sustainably to ensure food security in the 21st century in the ECA region.
References
Batiano A, Waswa B, Kihara J, Kimetu J. Eds. 2007. Advances in integrated soil fertility management in Sub-Saharan African: Challenges and opportunities. XIV, 1094 p. Springer.
CIMMYT [International Maize and Wheat Improvement Centre]. 2004. Global trends influencing CIMMYT’s future. Prepared by the Global Trends Task Force in support of strategic planning at CIMMYT. Mexico, D.F.: CIMMYT.
Godwin ID, Sangduen N, Kunanuvatchaidach R, Piperedis G, Adkins SW. 1997. RAPD Polymorphisms among variant and phenotypically normal rice (Oryza sativa var. Indica) somaclonal progenies. Plant Cel Rep 16:320–324.
Mwangi W. 2008. Drought maize for Africa in Ortiz. R. Ed. CIMMYT 2008 Science Week: Program and Abstracts. CIMMYT pp. 127–134.
Website sources:
www.elsevier.com/locate/gloenvcha.
http://www.gao.gov/htext/dt868.htm/International%20food%20security.
Up-scaling of soil and water management technologies and drought-tolerant varieties for increased maize productivity in the ECA countries 221

Appendixes
Table 2. Soil and water management technologies and practices in study areaTechnology Tanzania Ethiopia Kenya Suitability/Advantage DrawbackGrass strips and vegetative buffers
√ √ It is the least costly and least labour-demanding
Harbours rodents and unsuitable for very dry areas
Contour bunds √ √ Used for draining excess runoff from steep cultivated slopes
Fanya juu terraces √ √ On slope annual rainfall of 500–1000 mm Labour-intensiveStone lines √ √ Areas with annual rainfall of 200–750 mm Bench terraces √ √ On steep slopes High labour demandConservation Agriculture √ √ High cost of herbicides and poor soil infiltration- Minimum tillage √ √ √ All areas High labour demand- Zero tillage √ √ √ All areas Loss of land from erosion- Crop rotation √ √ √- Cover crop √ √ √- Mulching √ √ √- Intercropping √ √
Table 3. Rare soil and water management technologies and practices SWMT COUNTRYModified zai pits KenyaTransplanting maize KenyaRoadside water harvesting Kenya/TanzaniaWater bands for supplementing irrigation Tanzania/Kenya/EthiopiaMicro-irrigation Structures KenyaBench terraces-fanya juu, fanya chini Tanzania/KenyaRaised beds, broad beds Ethiopia/Kenya/TanzaniaHigh density-furrows KenyaTrapezoidal bunds Tanzania/Kenya/EthiopiaSub-soiling Tanzania/Kenya/EthiopiaSemi-circular moons KenyaFurrowing Tanzania/Kenya/Ethiopia
Table 4: Drought-tolerant maize varieties in Ethiopia
Variety Suitable ecological zonesOptimum
yield (t/ha)Yield in farmers’
practice (t/ha)Maturity period
Disease tolerance
Melkassa 2 Drought-prone areas of Ethiopia and most African countries 5.5–6.5 4.5–5.5 Medium GoodMelkassa 4 Central rift valley (Adama, Ziway, Kobo, Miesso) and similar agro-ecologies 3.5–4.5 3.0–3.5 Early GoodMelkassa 6Q
Central rift valley (Nazareth, Ziway, Kobo, Miesso) and similar agro-ecologies
4.5–5.5 3.0–4.0 Medium Good
Table 5: Drought-tolerant maize varieties in Tanzania
Variety
Suitable ecological
zones
Optimum production
(t/ha)
Actual production in farmers’
practice (t/ha)
Maturity period
Disease tolerance
Situka 1 Low altitude
6 4 Medium Good
Situka M1 Low to medium altitudes
5 4 Early Good
Vumilia K-1 Medium to high altitudes
7 6 Medium Good
Table 6: Soil and water conservation technologies used in the study area in Kenya (%)Technologies Homestead Topland ValleysNone 43.0 11 18Strip cultivation 15.0 20 20Green manure 2.0 3 7Mulching 2.0 3 3Zero tillage 1.0 2 7Contour ridges 4.0 25 13Infiltration pits 4.0 2 0Terracing 27.0 31 0Compost 2.0 0 0Planted cover crops 0 2 0Crop rotation 00 7
222 First ASARECA General Assembly, Volume 2

Executive summary
Strengthening Capacity for Agricultural Research and Development in Africa (SCARDA) was a continent-wide capacity-strengthening initiative funded by DFID and coordinated by FARA. In East and Central Africa, SCARDA was managed by ASARECA, and targeted three NARS represented by the Institut des Sciences Agronomiques du Burundi (ISABU), Institut des Sciences Agronomiques du Rwanda (ISAR) and the Agricultural Research Corporation (ARC) in Sudan. The SCARDA programme goal was to strengthen the institutional and human capacity of African agricultural research and development systems to identify, generate and deliver research outputs that meet the needs of poor people. SCARDA had three components: (a) strengthening competencies and capacity in agricultural research management; (b) strengthening capacity for professional development in agricultural research and development; and (c) empowerment of tertiary agricultural educational institutions. Most of the focus at ARC Sudan was on components (a) and (b).
Under component (a), a series of learning workshops to strengthen the competencies and capacities of Agricultural research managers were delivered. The learning workshops focused on five competence areas: (1) facilitation for change; (2) managing research for development and quality of science; (3) facilitating partnerships and innovation platforms for impact; (4) managing self-development for leadership; and (5) Managing organizations, units or teams. In each of these areas, participants gained a level of proficiency that enabled them to professionalize their engagement in change at the ARC and to improve their overall performance as leaders and managers. Furthermore, during the workshops, participants were able to identify key issues/challenges, which were then assigned to peer learning groups (PLG) to address, using principles acquired during the group learning sessions.
19. Improving capacity for agricultural research in Eastern and Central Africa: The SCARDA approach at ARC, Sudan
K El-Siddig1, J Methu2, D Akishule3, W Ekaya4, S Chindime-Mkandawire5, I Frempong6, N Ojijo7 and T Chancellor8
Paper presented at the 1st ASARECA General Assembly
14-16 December 2011, Entebbe, Uganda
1ARC Sudan, 2ASARECA, 3ASARECA, 4RUFORUM, 5RUFORUM, 6FARA, 7FARA, 8NRI
Under component (b), activities undertaken were MSc training for young ARC scientists in disciplines that had been found to be deficient. Short, targeted re-fresher courses in select agricultural research and development areas were also delivered, and a mentoring program for mid-level and early career development staff was undertaken. In the MSc training, a total of 15 young and mid-level scientists from the ARC and a few other satellite institutions in the Sudan were supported for training in various disciplines, including Plant Breeding, Horticulture, Natural Resources Management, Range Management, and Agricultural Information and Communication Management. Short training courses were provided in two areas: Integrated Pest Management (IPM) and Laboratory Management for research technicians. The IPM course benefited 30 staff of the ARC and its partner institutions and covered critical areas relating to the identification and management of insects, diseases and weeds. The Laboratory Management training benefited 16 technicians from ARC and covered topics such as best laboratory management practices, clean seed production, seed certification, seed legislation and marketing, principles of research ethics, plant disease diagnostics and data management.
At the individual level, the ARC staff gained new knowledge and skills in agricultural research manage-ment. The reflective sessions in the learning workshops touched upon some deep issues in ARC and brought them to the surface, e.g. strategy development, regionalization of research and institutionalization of monitoring and evaluation (M&E) systems. These issues are now on the ARC agenda and the trained managers are actively involved in the ongoing change process. Feedback culture is defusing gradually among ARC staff and is expected to be anchored in the ARC system. A mentoring and coaching culture has formally taken root at ARC and is expected to cover a wide range of areas, such as career guidance, technical and
Improving capacity for agricultural research in eastern and central Africa: The SCARDA approach at ARC, Sudan 223

professional development and leadership. In some of the research stations, staff members of the ARC have successfully applied knowledge and skills acquired during the training related to the facilitation of partner-ships and innovation platforms for enhanced impact. The Master’s training programme has enhanced the professional skills of researchers in areas such plant breeding and biotechnology and Agricultural Infor-mation Communication and Management (AICM). The short-term training for technicians has upgraded their skills for laboratory analyses and crop protection techniques and the trained staff have become part of a wider network in the region.
1. Introduction
Strengthening Capacity for Agricultural Research and Development in Africa (SCARDA) is a DFID-funded programme of FARA that commenced in March 2008 and ended on 30 June 2010. SCARDA was implemented at the sub-regional levels by the subregional organizations (SROs), namely, CORAF in the West African sub-region, SADC in the southern Africa sub-region and Association for Strengthening Agricultural Research in Eastern and Central Africa (ASARECA) in the eastern and central Africa (ECA) sub-region.
SCARDA was born as a result of an assessment of national agricultural research systems (NARS) in 26 African countries, which was conducted in 2005 by FARA, in collaboration with the three SROs in sub-Saharan Africa. The aim of the assessment was to determine the various ways in which support could be provided to improve research performance delivery in the continent. Grave weaknesses in the capacity of the NARS to conduct and manage agricultural research were identified. Consequently, SCARDA was conceived with the purpose of strengthening the human and insti-tutional capacity, to ensure that the NARS are better able to identify, generate and deliver research outputs that meet the needs of the poor. The project was intended to pilot a new integrated and holistic approach (dubbed the ‘SCARDA Approach’) to institutional and human capacity-strengthening, involving 12 Focal Institutions (FI) and their key NARS partners from 10 African coun-tries, who were spread across the three subregions of sub-Saharan Africa (Ojijo 2011).
In the eastern and central Africa (ECA) subregion, SCARDA targeted three NARS or Focal Institutions (FI) in three countries. These were the Institut des Sciences Agronomiques du Burundi (ISABU), Institut
des Sciences Agronomiques du Rwanda (ISAR) and the Agricultural Research Corporation (ARC) in Sudan. Implementation of the project in the ECA subregion was led by ASARECA with support from the Regional Universities Forum for Capacity Strengthening in Agriculture (RUFORUM), as the lead service provider.
2. About Agricultural Research Corporation (ARC Sudan)
The Agricultural Research Corporation (ARC) is the major National Agricultural Institute in Sudan, assigned with the mandate of undertaking applied agricultural research on food and industrial crops, forestry, livestock and food technology. The institute is expected to develop sustainable production systems for different agroecological zones and regions in Sudan. It has a long history dating back to nearly one century ago, and as would be expected of such a public institution, it has undergone many stages of adminis-trative re-structuring and re-organization. Until 1967, when it became a semi-autonomous organization, ARC existed as a research unit in the Ministry of Agriculture (MoA). In 2001, alongside other research institutions in the country, it was placed under the umbrella of the Ministry of Science and Technology. This situation changed again in 2010 when the insti-tute reverted back to the MoA.
ARC delivers its mandate through a network of 23 research stations and 10 commodity and discipline based research centres that are located in different corners across major agricultural production areas and agroecological zones. These stations and centres are manned by a total of nearly 500 research staff and nearly 3000 support staff.
Like other NARS in most African countries, ARC suffers from major weaknesses in institutional and human capacity for initiating, designing, implementing and managing scientific research (Mukibi and Youdeowei 2006).
A scoping study at the start of SCARDA identified that lack of policy and long-term strategic planning in ARC constrained its ability to address emerging issues in a coherent manner (Dukheri and Elamin 2007). The study further noted that ARC is faced with many challenges, including the declining investment, degraded infrastructures, inadequate mechanisms to establish priorities, lack of an institutionalized M&E system, poor partnerships and ineffective research-extension-farmer linkages.
224 First ASARECA General Assembly, Volume 2

Most of the ARC managers had never received formal training on management and leadership to enable them to effectively engage in any change process. Areas such as staff motivation, visioning and strategic thinking, giving and receiving constructive feedback, mentoring and coaching were required to be anchored in ARC to improve overall organizational performance.
Professional training was also needed for younger staff, especially in certain areas such as plant biotechnology, integrated pest management, information and communication management and organic agriculture.
3. The SCARDA project components and implementation at the ARC Sudan
Operationally, the SCARDA project had the following three key components:1. Strengthening competencies and capacity in agri-
cultural research management. 2. Strengthening capacity for professional develop-
ment in agricultural research and development. 3. Supporting the empowerment of tertiary agricul-
tural education and training institutions.
Most of the focus at ARC Sudan as in the other FI targeted in the ECA subregion was on components 1 and 2 of SCARDA. A series of learning workshops to strengthen the competencies and capacities of agricultural research managers were delivered under component 1. These workshops were designed following a detailed capacity-building needs assessment, conducted in August/September 2009. The studies had concluded that ARC needed to embark on a process of organizational change if it was to enhance its performance.
Under component 2 of SCARDA, activities undertaken were MSc training for young ARC scientists in disciplines that had been found to be deficient. Short, targeted re-fresher courses in select agricultural research and development areas were also delivered, and a mentoring programme for mid-level and early career development was undertaken.
The MSc training was undertaken through five RUFORUM member universities in the sub-region, namely Makerere University, University of Nairobi (UoN), Jomo Kenyatta University of Agriculture and Technology (JKUAT), Sokoine University of Agriculture (SUA) and Egerton University (table 1). A few of the MSc students undertook their studies at the Sudan Academy of Sciences and were based at the ARC Sudan.
The delivery of short targeted courses was undertaken in collaboration with the Natural Resources Institute
(NRI) of UK and the National Crops Resources Research Institute (NaCRRI) of Uganda. The NRI has long standing expertise in Integrated Pest Management (IPM) in sub-Saharan Africa, Asia and Latin America, while NaCRRI is a National Research Institute in Uganda, working closely with Makerere University in research and training in the areas of Crop Science, Agronomy and Biotechnology.
3.1 Strengthening capacity in agricultural research management in ARC Sudan
The first learning workshop (LW1) for ARC Sudan was conducted during 8-12 February 2009 in Kenana, Sudan. The second learning workshop (LW2) followed from 13 to 17 February 2011 in Khartoum. A third joint LW3 was held from 21 to 24 March 2011 in Nairobi-Kenya with research managers from all three FIs coming together for sharing lessons and further support in their management and leadership skills (PicoTeam Reports 2009, 2011a, 2011b).
The target staff in the learning workshops were the senior staff involved in research management such as the direc-tors of research centres and stations, heads of research divisions, coordinators of research programmes and senior research scientists. The aim was for participants in the workshops to start by reflecting on the functionality of their research management systems, identify the areas that needed to be improved, and determine the specific actions that needed to be undertaken to address the chal-lenges. Several management and leadership competency tools were also discussed during the workshops. Specific actions that needed to be taken were then developed into Change Projects and reviewed in subsequent learning workshops. Voluntary PLG were created to address the different change projects according to individual interests.
The learning workshops, focused on five key competence areas in the management of research organizations and programmes (Schwedersky 2010). In each of these areas, participants gained a level of proficiency that enabled them to professionalize their engagement in change at ARC and to improve their overall performance as leaders and managers. The five competence areas are summarized in figure 1.
3.2 Strengthening capacity for professional development in agricultural research in ARC Sudan
3.2.1 MSc Training
A total of 15 young and mid-level scientists (5 females and 10 males) from the ARC and a few other satellite
Improving capacity for agricultural research in eastern and central Africa: The SCARDA approach at ARC, Sudan 225

institutions in Sudan were supported for training at the master’s level in various disciplines, including Plant Breeding, Horticulture, Natural Resources Management, Range Management, and Agricultural Information and Communication Management (AICM) (table 1). Five of these students were registered at three universities in the ASARECA subregion while the other 10 were registered locally at the Sudan Academy of sciences (SAS).
All the five students studying in Kenya and Uganda completed their MSc successfully and resources have been leveraged for two of them to undertake PhD studies. Of the other five undertaking their studies in Sudan, four have completed and the fifth individual is in the final stages of completion.
Amongst the ‘extra’ support provided to the MSc students was the provision of laptop computers to each student; project organized group training in proposal and scientific writing; and support for all to participate in a regional conference on Building Capacity for improved food and livelihood Security held in September 2010, in Entebbe, Uganda. Five students also participated in 10th African Crop Science Conference held in Maputo in October 2011.
3.2.2 Specialized short-term courses
The SCARDA project identified the need for the delivery of targeted short courses for researchers as another way of strengthening the capacity for professional development in the FIs. Key areas identified for training
were: integrated pest management (IPM); laboratory operations and plant disease diagnosis and monitoring and evaluation (M&E).
Integrated Pest Management (IPM)
One of the research objectives for the focal and satellite institutions is to improve the management of pests and diseases using sustainable approaches which mitigate potentially adverse effects to crop and livestock production. Consequently, SCARDA conducted training on IPM for technicians and researchers in crop protection. The 30 ARC researchers who participated in the training have attested to having acquired an enhanced understanding of: the role of IPM within sustainable agricultural development, different pests, diseases and weed control measures. The scientists are also now more familiar with sources of reliable information on crop protection, particularly on IPM.
Laboratory management and plant disease diagnosis
In collaboration with the NaCRRI in Uganda, a training workshop was conducted at the Namulonge Research Station in Uganda, for research technicians from all three FIs involved in SCARDA in the ECA. Eight participants from ARC Sudan participated in the training.
The 14 days of training conducted at the workshop provided participants with a highly interactive platform for learning, discussions and exchange of best practices as well as suggestions for new approaches to the participant’s roles, and functions in their respective research institutions. Hands-on practical exercises
Figure 1: Specific organizational and competency issues considered during the learning workshops (Adapted from PicoTeam East Africa).
Table 1: Summary of statistics on master’s level training in Sudan under the SCARDA programme.
Service providers Master’s course No. of students
Makerere University, Uganda
Plant Breeding and Seed Systems
3
Egerton University, Kenya Agric. Info. and Comm. Management (AICM)
1
University of Nairobi , Kenya
Range Management 1
Sudan Academy of Sciences
Soil and water (4)Horticulture (2)Breeding (3)Organic agriculture (1)
10
Total 15
226 First ASARECA General Assembly, Volume 2

and exposure to the modern research laboratories at NaCRRI equipped the technicians with enhanced skills for handling laboratory work.
Monitoring and evaluation (M&E )
A training workshop on planning, monitoring, evaluation and communication was conducted in Kigali, Rwanda, for selected key participants from all three FIs in early 2009, to enhance their capacity to deliver on the impor-tant aspects of agricultural research and development. The course targeted individuals with specific respon-sibilities for management of information, monitoring, reporting and communication. The trainers facilitated participants through a challenge identification exercise relevant to their institutions with respect to M&E and communication. Challenges identified included; unclear definition of staff roles, limited financial resources, and lack of training in communication and M&E.
3.2.3 Mentorship skills Development
During the first learning workshop at ARC Sudan, researchers in the early stages of their careers, including MSc students under SCARDA sponsorship at different universities in the subregion, were asked to identify potential mentors and approach them to ensure that they would be willing to fulfill this role. A mentoring orientation workshop was then organized in March 2010 in Khartoum for mentors and mentees to introduce the principles of mentoring and coaching, and to identify specific mentoring and coaching challenges (PicoTeam Report 2010). The workshop was also used for mentors and mentees to exchange their profiles, and to identify the professional desires of the mentees.
4. The outcomes of SCARDA
4.1 Improving leadership and management capacity
During the implementation of SCARDA, ARC was transferred back to the MoA from the Ministry of Science and Technology, to improve on its administrative structure. ARC had been placed under the Ministry of Science and Technology in 2001, alongside other research institutions in the country. A new strategy was also drafted during SCARDA implementation, and released for stakeholder consultation. The management was restructured into four new directorates: Research Programs and International Relationships; Human Resource and Information Management; Administration and Finance; and Technology Transfer and Agricultural Extension. Public-private partnerships were also strengthened and a planning, M&E unit, established.
Although most of these changes were not directly attributable to SCARDA, the learning process arising from SCARDA was successfully linked with the ongoing change processes in ARC. Participants became familiar with the key concepts and practices of good and effective leadership; being proactive, being solution-oriented and problem solvers. Some specific key learnings and achievements are discussed in the sections below.
Agricultural Research Corporation (ARC) strategy: the unfinished business
Before SCARDA was introduced at ARC, there were attempts to develop a National Agricultural Strategy 2007-2012. A draft strategy for agricultural research had been released for public consultation in 2007, but remained untouched until the inception of the first SCARDA learning workshop in 2009. The participating ARC staff at the SCARDA workshops identified the lack of a coherent research strategy as the most significant impediment to organizational change. The set of challenges, weaknesses and opportunities within the ARC system identified by the participants, provided a compelling basis for accelerating the development of an effective and well-supported agricultural research and development strategy for Sudan. SCARDA equipped the participants with the tools and processes to catalyse the strategy development process at ARC. Consequently, an action plan was proposed and task forces were set up with the following terms of reference: analysing the current trends and desired future; reviewing content of the draft strategy; suggesting tools and mechanisms and drafting a proposal on what would be done differently; consulting widely with stakeholders and reviewing strategies of other relevant institutions.
Agricultural Research Corporation (ARC) restructuring: an ongoing process
The SCARDA learning workshops also touched on some very deep issues in ARC and brought them to the surface. Given the sweeping reforms that were taking place at the national, regional and global levels, the participants realized that ARC is facing a transition period in which it would need to restructure itself, confront new demands and adjust to new political, scientific, institutional and economic environments. Consequently, ARC began reform by restructuring its top management in 2010. The SCARDA internal learning process helped the participants to actively engage in the ongoing change process. Restructuring of ARC is now included as a regular discussion point in ARC working agendas. A wide range of reforms to make ARC more outward looking, client oriented and impact driven,
Improving capacity for agricultural research in eastern and central Africa: The SCARDA approach at ARC, Sudan 227

were identified. Five major reform themes now dominate the current agenda for ARC. These are: decentralization (regionalization) of agricultural research; re-defining the role of governments in agricultural research; stakeholder participation; new and emerging forms of research funding; and strengthening of research-extension-farmer linkages.
Success stories from peer learning groups (PLG)
The learning process at the SCARDA learning work-shops included identification of key issues/challenges which were then assigned to teams termed as peer learning groups (PLG), and individuals to address, using principles acquired during the group learning sessions. The PLG proved to be a useful mechanism to catalyse this process. Due to resource limitations and the practical difficulties in organizing joint activities among staff located considerable distances apart, not all PLG were successful. Two examples of successful PLG are: “new partnership in North Kordofan” and “Senar-Whitenile-Bluenile Advisory Company (SWBAC)”, which are described in more detail below.
New partnership in North Kordofan
Before SCARDA, the El Obied Research Station (North Kordofan) was poorly and informally collaborating with the State MoA, development projects and non-governmental organizations. As a result, technology transfer to the smallholders was poorly articulated among stakeholders, resulting in poor adoption of tech-nologies. After SCARDA, the need for partnership was clearly demonstrated as a tool for enhancing adoption and inducing change. A memorandum of understanding (MoU) with the State MoA was developed and signed. The station gained in political advocacy and financial support from the State MoA. Technical backstopping from researchers enhanced the diffusion of technologies through demonstration farms. An innovation platform for community-based seed production of improved crop varieties has been established. Finally, partners like International Fund for Agricultural Development (IFAD), State MoA, a private seed company, and a farmers union were facilitated to serve in the proposed innovation platform to be functional next season.
Senar-Whitenile-Bluenile Advisory Company (SWBAC)
Before SCARDA, the linkages between Sennar, Kenana, Suki and Kosti Research Stations were loose and informal. Equipped with newly acquired skills after SCARDA, the four heads of stations agreed to form
the SWBAC as their Change Project, with the objective of providing farmers with information on nutritional and cultural operations, as well as pest and disease identification and control. The initiative was based on a strong team philosophy which allows individual advisers to develop their own interests and skills, whilst working together to assist the members.
4.2 Improving professional capacity
As indicated above, totally, 15 MSc students were trained in specific capacity-constrained areas of specialization. Most of the students completed their studies and are now holding positions of active research and are thus contributing to strengthening ARC capacity for innovation. The students have also become part of a strong network of young scientists in the region. They were amongst the graduates with improved confidence in public communication and research problem analysis, as well as improved soft skills such as proposal and scientific writing, group dynamics, teamwork, time management and social networking.
The training courses in IPM and laboratory operations upgraded ARC technicians’ skills in laboratory analyses and crop protection. Exchange of experiences with technicians from Rwanda and Burundi NARS was also a huge addition into their skills.
5. Summary and conclusions
SCARDA aimed at strengthening the institutional and human capacity of African agricultural research and development systems to identify, generate, and deliver research outputs that meet the needs of poor people.
At the individual level, the ARC staff gained new knowledge and skills in agricultural research man-agement. The reflective sessions that were part of the learning workshops touched some deep issues in ARC and brought them to the surface, e.g. strategy refresh, regionalization of research and institution-alization of M&E systems. These issues are currently on the ARC agenda and the trained managers are actively involved in the ongoing change process, which implies that SCARDA contributed significantly to institutional development at ARC. A feedback culture is defusing gradually among ARC staff and is expected to be anchored in the institution. A mentor-ing and coaching culture has also taken root and is expected to impact on a wide range of institutional and personal competency development areas, such as career guidance, technical and professional develop-ment, and leadership.
228 First ASARECA General Assembly, Volume 2

The master’s training programme has enhanced professional skills of ARC researchers in areas such as plant breeding, biotechnology and information management. The graduate students have become active researchers, strengthening and contributing to the ARC capacity for innovation. The short-term training for technicians has upgraded their skills for laboratory analyses and crop protection techniques, also contributing to the ability of the ARC for innovation. Like the MSc graduates, the trained technicians have also become part of a wider network in the region, having trained alongside their colleagues from Rwanda and Burundi. The linkages that have been created through both the MSc and technicians’ training have obviously uplifted the status of ARC as a research institution and should therefore be considered as an achievement in institutional development.
References
Dukheri IA, Elamin AEM. 2007. Sudan country consultations report . Khartoum, Sudan
Mukibi J, Youdeowei A. 2006. Agricultural research delivery in Africa: an assessment of the requirements for efficient, effective and productive African NARS. Final report. FARA, Accra, Ghana.
Ojijo N, Olang’o K. 2011. An approach to capacity strengthening in the emerging agricultural knowledge systems. Available online at http://www.kit.nl/portals/query.ashx?RecordID=683479&Portal=RIS
PICOTEAM Report. 2009. In First learning workshop on research management, leadership, and mentoring, Kenana, 8–12 February 2009.
2010. In Mentoring & coaching orientation workshop for Sudan ARC Khartoum, 3–4 March 2010.
PICOTEAM Report. 2011a. In Second learning workshop on research management, leadership, and mentoring, 13-17 February 2011, Al-Ferdous Hotel, Khartoum.
PICOTEAM Report. 2011b. In Third Learning Workshop on Research Management, Leadership, and Mentoring, 21-24 March 2011, Nairobi, Kenya.
Schwedersky T. 2010. Implementing the SCARDA programme in the ASARECA region – insights and experiences in organizational change, Paper presented at the regional lesson learning workshop on Change management processes at CORAF: enhancing synergy and coherence, 15-16 December 2010, Dakar.
Improving capacity for agricultural research in eastern and central Africa: The SCARDA approach at ARC, Sudan 229

Food security in the ASARECA region Causes of food insecurity Emerging research issues Role of NARIs Role of ASARECA Conclusion
FOOD INSECURITY IN THE ASARECA REGION
COUNTRY SITUATIONBurundi 28% of the population is food insecure; 53% of the
children under 5 are stunted; and 8% are acutely malnourished.
DR Congo 3.7 million of the population is severely food insecure and 17.2 million moderately food insecure. Acute malnutrition affects 11% of the children under 5.
Eritrea In a good year, the country can meet 60-70% and, in a bad year, only 25% of its total food needs. In 2004, 37% of the population was food insecure. 50% of the cereal requirements are obtained from imports or food aid.
Ethiopia 8.2 million people are chronically food insecure. 3.2 million people require food aid. About 40% of the provinces are food insecure. 38% of the children under 5 are underweight.
Kenya 3.8 million people need emergency food aid. 2.5 million in urban areas are chronically food insecure.
COUNTRY SITUATIONMadagascar Overall 33% and, in the south of the country, 50% of the
population is undernourished. 50% of the children are chronically malnourished. 53 municipalities are food insecure (2011). Among adults, women are most affected.
Rwanda 1.7 million people needed food assistance, of whom 294,000 were severely food insecure in 2006. In some districts, e.g. Bugesera, families were feeding “on grass, leaves and cassava”.
Sudan In South Sudan, over 60% of the returnees are food insecure (2011), while, in some areas, 20% of the residents are food insecure. In Darfur, 1.7 million people are food insecure.
Tanzania Food insecurity is present everywhere in the rural areas. 30% are food insecure or vulnerable. 34% of the children under 5 are underweight or stunted and 6% are severely malnourished.
Uganda Food insecurity affects 50% of the country in most years. In 2006, nearly 7 million rural people were highly vulnerable, while 4 million were moderately vulnerable.
CAUSESOF
FOOD INSECURITY
Droughts Floods Storms Cyclones
230 First ASARECA General Assembly, Volume 2
20. Presentation: Emerging issues underlying food insecurity
in the ASARECA region Prof Joseph Mukiibi

Weak research and extension institutions Low genetic potential of crops and livestock Pests and diseases Declining soil fertility Low market access Low land and labour productivity: over 80% of
national labour force producing 20-40% of GDP
Number of researchers and professors Quality of researchers and professors Subject matter coverage: natural vs. social
and environmental sciences Funding: EMBRAPA USD 1b.
ASARECA USD 0.3b Institutional instability
Poor marketing infrastructure: inefficient and costly transport system. Poor information flow.
Poor storage and low processing capacity. Region exports largely cheap raw materials,
thereby exporting jobs. Region imports expensive finished products,
e.g. cotton, hides and skins, coffee.
Weak institutions for policy research and analysis
Low capacity for policy generation and development
Externally generated policies adopted and recycled
All ASARECA countries, with the exception of Tanzania, have been involved in conflict and political violence: inter and intra-clan wars, ethnic conflicts and civil wars (some lasting several years), war with one or more neighbours and coups.
Military and quasi-military governments Stolen or stage-managed elections Rubber-stamp legislatures Lack of transparency in the conduct of public
affairs Misallocation and misappropriation of resources Low capacity for independent study and research
in politics–differentiation between politics and political science
Note: Lack of democracy does not necessarily lead to food insecurity. Egypt, Tunisia, Algeria , Libya Morocco are food secure. Food insecurity is a characteristic of sub-Saharan Africa.
Presentation: Emerging issues underlying food insecurity in the ASARECA region 231

Incapacity of Africa’s elite/leadership:a. To fully comprehend the richness of Africa’s
natural resource endowment;b. To protect and exploit that endowment for
development; andc. To innovate.
The incapacity is induced by internal and external factors.
98% of the world’s chromium 90% of the world’s platinum 70% of the world’s tantalite 64% of the world’s manganese 50% of the world’s gold 33% of the world’s uranium
Plus bauxite, diamonds, coal, gas and oil DRC alone has 70% of the world’s coltan and
more than 30% of the world’s diamond reserves
A large land mass (24.2 m sq km) with freshwater resources and all year-round sun
A large labour force (856m)HOW CAN GOD BE SO GENEROUS?
REGION/COUNTRY
AREA MSQ KM POPULATION , M PERSONS/SQ KM
Whole of Africa 30.3 1,020 34
Sub-Saharan Africa
24.2 856 35
ASARECA 8.5 340 40
USA 3.7 312 84
European Union 4.3 503 117
China 9.6 1,300 1,360
India 3.3 1,200 3,300
“Although it has abundant natural resources, Africa is the world’s poorest and the most underdeveloped continent.”
(Wikipedia).
COUNTRY HDI RANKINGKenya 0.509 143Madagascar 0.480 151Tanzania 0.466 152Uganda 0.446 161Rwanda 0.427 166Sudan 0.408 169Ethiopia 0.363 174Eritrea 0.349 177Burundi 0.316 185DR Congo 0.286 I87Norway 0.943 1
232 First ASARECA General Assembly, Volume 2

EMERGING RESEARCH ISSUES
The most important easily visible factor in climate variability is rainfall.
However, the region has great potential for irrigation.
Climate change – Global Warming. But remember the Ice Age.
COUNTRY POTENTIAL (mill ha)DR Congo 9.20 (Congo River Basin)Ethiopia 3.70Kenya 0.54Madagascar 1.50Sudan 2.80 (excluding South Sudan)Tanzania 2.10Uganda 0.20Whole of Africa 42.50
Regional studies agro-climatology and hydrology
Regional studies and droughts, floods, volcanic activity and cyclones
Water management and water rights Generating and disseminating policies and
technologies for irrigation and drainage
Greater emphasis on whole value chains: Agriculture is more than farming
Agribusiness Agricultural policy analysis and research:
Breed new policy varieties Renewed efforts in strengthening agricultural
research institutions
Currently, information on the impact of conflict on food security is gathered anecdotally by relief agencies.
There is need for structured and systematic studies and documentation on the impact of conflict on agricultural activities.
Results from such studies would inform government policies and form part of university curricula.
Presentation: Emerging issues underlying food insecurity in the ASARECA region 233

Bad/Poor management of public affairs, not only impacts national (including agricultural) development negatively, but also creates a syndrome of “we are a cursed race”, leading to loss of self-esteem in Africans and a poor image of Africans.
It is presently the subject of sensational journalism.
It must surely be a subject for serious and independent study by local research institutions.
Examples of topicsThe impact of: Loans and grants to and government budgets
for the agricultural sector during the last 20 years on smallholder farming in ASARECA countries
Food aid on the livelihoods of agricultural communities in the region
Structural adjustment on agricultural growth in the region
The disconnect between abundance of resources and extreme poverty. Is this a researchable area? Yes! All scientific disciplines can research this topic.
Africa’s under-development should be a subject included in the curricula of all universities.
Possible areas of study and investigation: With 70-80% of the national labour force in
farming and an abundance of land, why does agriculture contribute only 40% of the GDP?
Human beings learn from one another. Africans need to study how China feeds its billions from an area roughly the size of the ASARECA region.
ROLES
Expand research portfolio to include:a. Agro-meteorology and climate changeb. Food technologyc. Agribusinessd. Agricultural policyNARIs should become convening centres for research on governance, conflict and food
234 First ASARECA General Assembly, Volume 2

Be a convenor of institutions in the region for: Research on agro-climatology and climate
change Polylogues to create awareness regarding the
region’s abundant natural resources and their potential for spurring development
Technical and economic research on minerals Studies on the evolution of Asian, European
and American agriculture and agribusiness
Food security is about incomes The task before the ASARECA countries is to
improve the incomes and livelihoods of the poorest farmers so that they can climb the ladder of economic development.
THANK YOU
Presentation: Emerging issues underlying food insecurity in the ASARECA region 235

236 First ASARECA General Assembly, Volume 2
ASARECA has 10 member countries, namely: Burundi, the Democratic Republic of Congo, Ethiopia, Eritrea,
Kenya, Madagascar, Rwanda, Sudan, Tanzania and Uganda.
The theme for the First ASARECA general assembly is “Feeding our Region in the 21st century”. • ASARECA announces its first general assembly.• The assembly follows the approval of the new
constitution in 2010, providing for the establishment of patron ministers and a general assembly. These were established to offer strategic guidance to ASARECA in order to promote economic growth, fight poverty, eradicate hunger and enhance sustainable use of resources in ECA.
Objectives of the first ASARECA general assembly• To create a forum for developing a shared vision
and shared goals to enhance sustainable agriculture to bring about economic growth and improved livelihoods in our region.
• Introduce ASARECA, its strategic regional objectives, challenges, opportunities and successes to the patron ministers and members of the general assembly.
• Provide an enabling environment for the general assembly to play its oversight role in accordance to the provisions of the Constitution and Governance Manual.
• Receive from the patron ministers and the general assembly, in line with the mission of ASARECA, recommendations and strategic guidelines in agricultural research for development, extension and agricultural training and education, which will contribute to feeding our region in the 21st century.
Topical issues to be tackled • The role of STI and their contribution to feeding
our region in the 21st century
21. ASARECA strategy regional challenges and opportunities in the context of the theme “Feeding our region in the 21st century” Dr Seyfu Ketema, Executive Director, ASARECA
• Adapting agriculture to variable and changing climatic conditions in ECA: Lessons learnt and options for the future
• Volatile food prices: drivers and impacts on food security in ECA
• Progress towards implementation of CAADP
• Harnessing livestock resources for food security in pastoral areas of ECA
• Proven technologies for feeding the ECA region
• Governance and policy imperatives for transformation of agriculture in ECA
ASARECA Mission
ASARECA mission is to enhance regional collective action in agricultural research for development, extension and agricultural training and education; to promote economic growth; fight poverty; eradicate hunger; and enhance sustainable use of resources in ECA.
Mission is aligned to MDG and CAADP goals
This mission highlights the commitment of ASARECA to:• MDGs to reduce poverty and hunger by half by
2015 and• CAADP target of regional agricultural production
growth rate at an annual rate of 6% by 2015
AU/NEPAD THREE GOALS• Establish conditions for sustainable development
(peace and security, democracy and good political, economic and cooperate governance, regional cooperation and integration, capacity building)
• Encourage policy reforms and increased investments in priority sectors (agriculture, human development, infrastructure, and environment)
• Mobilise resources (increasing domestic savings and investments, management of public revenue and expenditure, and enhancing Africa’s share of global trade)

ASARECA strategy regional challenges and opportunities in the context of the theme “Feeding our region in the 21st century” 237
AU/NEPAD vision
The vision for agriculture is that the African continent should by 2015:
• Attain food security (in terms of availability and affordability) and ensure access of the poor to adequate food and nutrition
• Improve agricultural productivity to attain an average annual growth rate of 6%
• Create dynamic agricultural markets between nations and regions
• Integrate farmers into the market economy, and make Africa a net exporter of agricultural products
• Achieve a more equitable distribution of wealth
• Be a strategic player in agricultural science and technology development, and
• Practice environmentally sound production methods and establish a culture of sustainable management of the natural resource base
Rationale for investing at ASARECA level • There is evidence that investments at the regional
level yield better dividends than when investments are undertaken by individual nations in countries facing similar challenges to improve agricultural performance.
• Some problems are regionally important and extend beyond national boundaries, thus calling for regional collective action and investment at the regional level.
Future trends in agricultural production• According to FAO Study on Prospects for food
and Agriculture: Towards 2015 & 2030, 80% of the future increase in food production will come from agricultural intensification to meet the goals of the Millennium Declaration and the World Food Summit.
• But agricultural intensification (per unit area), which is projected to increase in the coming two decades, can be the most serious threat to the environment and to sustainability of the natural resource base.
Challenges to African agriculture and food security• Less water: increased demand from other sectors• Less arable land: land degradation and urbanisation• Less labour: HIV/AIDS and endemic diseases
Challenges
• A changing climate: increasing variability and more extreme events is projected to: ₋ reduce productivity ₋ affect ecological systems ₋ adversely affect human and animal health and ₋ decrease biodiversity
• Environmental and social implications: Increasing concerns over the environmental and social implications of various agricultural policies and technologies
Science and technology challenges to African agricultural research • Address water deficit problems, for example,
through improved drought-tolerant crops, irrigation technologies, and so forth.
• Produce a diversified array of crops, livestock, fish, forests, biomass (for energy) in an environmentally and socially sustainable manner
• Address soil fertility and salinisation of soils
Opportunities exist to benefit from regionally coordinated action and investment through:• The identification of shared goals• The promotion of economies of scale and scope and• Sharing of results and regional public goods that
would come as a result of regional collective action, collaboration and specialisation
Agro-ecological zones cut across political boundaries, therefore: • Technologies developed in one country frequently
find fertile ground across the border in similar environments of neighbouring countries.

238 First ASARECA General Assembly, Volume 2
In many countries in Africa, maize productivity is much lower compared to other regions
Food production growth is lower than population growth. Source:* from AfDB, 2007 and figures from World Bank, 2006

ASARECA strategy regional challenges and opportunities in the context of the theme “Feeding our region in the 21st century” 239
Estimated impact of collaborative research at regional and national levels• Impact of collaborative research at
the regional and national levels and benefits from regional spillovers. ₋ Using DREAM model of
IFPRI, the following slides present anticipated benefits from agricultural technology development in the sub-region, with and without regional spillovers.
• In the case of bananas, benefits with technology spillover for: ₋ Kenya, Uganda and Tanzania
anticipated to be over USD100 million.
Spillovers to other banana-growing and consuming countries in the region increase total benefits by an additional USD15 million over the 2004 to 2020 time period. • In cassava, direct gains amount to about USD90
million, while spillovers add an additional USD50 million
• Clearly the regional spillovers can be substantial

240 First ASARECA General Assembly, Volume 2
Highlights of success stories

ASARECA strategy regional challenges and opportunities in the context of the theme “Feeding our region in the 21st century” 241
Highlights of success stories, continued...

242 First ASARECA General Assembly, Volume 2
Highlights of success stories, continued...

ASARECA strategy regional challenges and opportunities in the context of the theme “Feeding our region in the 21st century” 243
m
m
There will be a 70% increase in maize production in ECA, thereby improving food security and reducing hunger and promoting economic development.
ASARECA strategic plan• The strategic plan advocates that governments
must invest in combinations of measures that: ₋ Enhance productivity growth in agriculture,
especially in the staple sub-sectors ₋ Enhance market functioning, especially
domestic markets for major staples ₋ Enhance productivity growth in non-agricul-
tural sectors
70% of ECA cropland is in the areas with high and medium agricultural potential.
Highlights of success stories, continued...

244 First ASARECA General Assembly, Volume 2

About ASARECAThe Association for Strengthening Agricultural Research in Eastern and Central Africa (ASARECA) is a non-political organisation of the National Agricultural Research Institutes (NARIs) of 11 countries: Burundi, D R Congo, Eritrea, Ethiopia, Kenya, Madagascar, Rwanda, South Sudan, Sudan, Tanzania and Uganda.
The mission of ASARECA is to enhance regional collective action in agricultural research for development; extension, agricultural training and education to promote economic growth; fight poverty; eradicate hunger and enhance sustainable use of resources in Eastern and Central Africa.
Partnerships: Through ASARECA, agricultural scientists in the 11 countries work together and in partnership with farmers, extension workers, private sector, scientists of regional and international institutions and development partners, to come up with new innovations that could lead to agriculture-led economic growth, poverty eradication and improved livelihoods.
Development agencies that support ASARECA include African Development Bank (AfDB), Department for International Development (DFID), Canadian International Development Agency (CIDA Canada), European Union (EU), International Development Research Centre (IDRC), Swedish International Development Cooperation Agency (SIDA - Sweden), United States Agency for International Development (USAID) and the World Bank – Multi Donor Trust Fund (MDTF).
The views expressed in this publication are not necessarily those of the above-mentioned development agencies.
www.asareca.org