first determination of magma-derived gas emissions from ... et... · first determination of...
TRANSCRIPT

Journal of Volcanology and Geothermal Research 304 (2015) 206–213
Contents lists available at ScienceDirect
Journal of Volcanology and Geothermal Research
j ourna l homepage: www.e lsev ie r .com/ locate / jvo lgeores
First determination of magma-derived gas emissions from Bromovolcano, eastern Java (Indonesia)
A. Aiuppa a,b, P. Bani c,d,⁎, Y.Moussallam e, R. DiNapoli a, P. Allard f, H. Gunawan c,M.Hendrasto c, G. Tamburello a
a DiSTeM, Università di Palermo, Italyb Istitituto Nazionale di Geofisica e Vulcanologia, Palermo, Italyc Center for Volcanology and Geological Hazard Mitigation, Jl. Diponegoro No 57, Bandung, Indonesiad Laboratoire Magmas et Volcans, Univ. Blaise Pascale—CNRS—IRD, OPGC, 63000 Clermont-Ferrand, Francee Department of Earth Sciences, University of Cambridge, Downing Street, Cambridge CB2 3EQ, UKf Institut de Physique du Globe de Paris, UMR7154 CNRS, 75005 Paris, France
⁎ Corresponding author at: LaboratoireMagmas et VolcansOPGC, 63000 Clermont-Ferrand, France.
E-mail address: [email protected] (P. Bani).
http://dx.doi.org/10.1016/j.jvolgeores.2015.09.0080377-0273/© 2015 Elsevier B.V. All rights reserved.
a b s t r a c t
a r t i c l e i n f oArticle history:Received 12 April 2015Accepted 2 September 2015Available online 10 September 2015
Keywords:Bromo volcanoVolcanic gasesSO2 and CO2 fluxesTengger CalderaEastern Java, IndonesiaMulti-GAS
The composition and fluxes of volcanic gases released by persistent open-vent degassing at Bromo Volcano, eastJava (Indonesia), were characterised in September 2014 from both in-situ Multi-GAS analysis and remote spec-troscopic (dual UV camera)measurements of volcanic plumeemissions. Our results demonstrate that Bromo vol-canic gas is water-rich (H2O/SO2 ratios of 56–160) and has CO2/SO2 (4.1 ± 0.7) and CO2/Stot (3.2 ± 0.7) ratioswithin the compositional range of other high-temperature magma-derived gases in Indonesia. H2/H2O andH2S/SO2 ratios constrain a magmatic gas source with minimal temperature of ~700 °C and oxygen fugacity of10-17–10-18 bars. UV camera sensing on September 20 and 21, 2014 indicates a steady daily mean SO2 outputof 166 ± 38 t d−1, which is ten times higher than reported from few previous studies. Our results indicate thatBromo ranks amongst the strongest sources of quiescent volcanic SO2 emission measured to date in Indonesia,being comparable to Merapi volcano in central Java. By combining our results for the gas composition with theSO2 plume flux, we assess for the first time the fluxes of H2O (4725 ± 2292 t d−1), CO2 (466 ± 83 t d−1), H2S(25 ± 12 t d−1) and H2 (1.1 ± 0.8) from Bromo. Our study thus contributes a new piece of information to thestill limited data base for volcanic gas emissions in Indonesia, and confirms that much remain to be done tofully assess the contribution of this very active arc region to global volcanic gas fluxes.
© 2015 Elsevier B.V. All rights reserved.
1. Introduction
The Indonesian volcanic arc, extending from west Sumatra toSulawesi in the northeast, hosts 140 identified active volcanoes (GlobalVolcanism Program, http://www.volcano.si.edu/), ~100 of which haveerupted in the recent history (Simkin and Siebert, 1994). Indonesia isone of the most active volcanic regions on our planet, and paid a prom-inent tribute to the historical death toll from volcanism. Paradoxically,however, relatively little is known about the contribution of theIndonesian island arc to the global volcanic gas fluxes to the atmosphere(see Oppenheimer et al., 2014). In their reference compilation of volca-nic SO2 fluxes, Andres and Kasgnoc (1998) reported data for only 4 con-tinuously degassing volcanoes in Indonesia (Merapi, Galunggung,Bromo and Slamet), whose single cumulative contribution(~0.1 Tg yr-1) cannot account for the overall country's contribution tothe global volcanic SO2 budget (recently estimated as 10-18 Tg/yr bydifferent authors; see Oppenheimer et al., 2014 for a review). Attempts
, Univ. Blaise Pascale—CNRS—IRD,
to extrapolate from these few available data have led to estimates of aregional SO2 flux that span more than one order of magnitude, from0.12–0.18 Tg/yr (Hilton et al., 2002) to 3.5 Tg/yr (Nho et al., 1996).The latter figure also includes the contribution of eruptive degassingto the SO2 budget. Syn-eruptive emissions in Indonesia were deter-mined for only a few events, fromeither space-borne sensing or the pet-rologic method (see Pfeffer, 2007, for an updated list), but the total(passive + eruptive) SO2 budget does not results better constrained(0.48–3.8 Tg/yr; Pfeffer, 2007) than that for only passive emissions.This paucity of information has persisted until today (see Shinohara,2013), even though a recent work by Bani et al. (2013) provided thefirst SO2 flux datum for Papandayan and further data for Bromo volca-noes in Java.
Our current knowledge for volcanic degassing in Indonesia is evenmore lacking for other major volcanic gas species such as H2O andCO2, whose emission rates were quantified at only one single volcano,Merapi in central Java (Allard et al., 1995, 2011; Toutain et al., 2009).Published volcanic gas analyses are available for only ~10 Indonesianvolcanoes (compiled in Pfeffer, 2007),whichmakes quantifying regionalgas flux inventories very problematic. For instance, Hilton et al. (2002)estimated an Indonesian CO2 flux of ~0.36 Tg/yr that is poorly

207A. Aiuppa et al. / Journal of Volcanology and Geothermal Research 304 (2015) 206–213
constrained from very few data. In summary, given the intense volcanicactivity in Indonesia and the important gas emissions sustained byother arc segments in the southwest Pacific, such as Papua NewGuinea (McGonigle et al., 2004; McCormick et al., 2012) and Vanuatu(Bani et al., 2012), increasing the data base for volcanic gas composi-tions andfluxes in Indonesia is essential to refining current global volca-nic gas inventories (Hilton et al., 2002; Burton et al., 2013; Shinohara,2013).
Bromo volcano, a small pyroclastic cone inside thewide Tengger Cal-dera in eastern Java (Fig. 1), has been oneof themost active volcanoes ofIndonesia in historical time (GVP), displaying persistent plume emis-sions via open-vent degassing from its summit crater (Fig. 1c) and occa-sional eruptions (the last one in January-March 2011; GVP, 2012). Thisvolcano has been studied on a few rare occasions from the ground forits SO2 emission and considered to be a small emitter (Andres andKasgnoc, 1998; Bani et al., 2013). However, satellite records in 2011–2013 have revealed that Bromo, in tandemwith nearby Semeru volcano(Fig. 1d), ranks in the top-20 list of degassing volcanoes on Earth (Carnet al., 2014). Therefore, further ground-truth information is badly
Fig. 1. (A)Map of Java island (source: Googleearthpro), showing the location of themost active Irelated to subduction of the Australian Plate underneath the Eurasia Plate along the Sunda arc (of the Tengger caldera summit, showing the location of Bromo volcano. The red square (MG) inUV camera on 20 September (Cam1) and 21 September (Cam2). Insets (C) and (D) are photosvolcanoes in the Tengger caldera, respectively.
needed for better assessing its actual SO2 flux contribution, but alsothe composition of its volcanic gases which have never been studied.This was the aim of our present work.
We here report on the results of a field survey performed in Septem-ber 2014, during which the chemical composition of Bromo's volcanicgas plume was characterised using a Multi-component Gas AnalyserSystem (Multi-GAS; Aiuppa et al., 2005; Shinohara, 2005). The volcanicSO2 flux was also simultaneously determined using a dual-UV camerasystem (Tamburello et al., 2012). Combining the two data types allowsus to provide the volatile emission budget for H2O, CO2, SO2, H2S and H2
from Bromo volcano.
2. Bromo volcano
Bromo (Latitude 7.942°S; Longitude 112.95°E) is a small tuff cone lo-cated in the central part of the Tengger caldera, a large (16-km-wide)polygenetic depression topping the summit of the (820 kyr old)Tengger volcanic massif in east Java (van Gerven and Pichler, 1995)(Fig. 1a–b). Bromo is the only active centre of a cluster of post-caldera
ndonesian volcanoes (source: GVP) and of Bromo volcano on east Java. Volcanism in Java isthemain direction of plate convergence is shown by red arrows); (B) Googleearthpromapdicates the position of theMulti-GAS, while the green circles stand for the positions of theshowing open-vent activity on Bromo's summit and a sunrise view of Bromo and Semeru

208 A. Aiuppa et al. / Journal of Volcanology and Geothermal Research 304 (2015) 206–213
cones constructed on the floor of the Sandsea caldera, the youngest (latePleistocene to early Holocene) and smallest (9 × 10 km) collapse struc-ture of the Tengger volcanic complex (Fig. 1b). van Gerven and Pichler(1995) distinguish five stages in the evolution of the Tengger system,and consider that intra-caldera (Bromo) activity started sometimesprior to ~1800 yrs B.P.. More than 60 explosive eruptions (mainly ofVEI = 2) have occurred at Bromo over the past four centuries, most re-cently in 2000–2001, 2004, and 2010–2012 (GVP; CVGHM Reports). Inspite of this recurrent activity, available information on Bromo in the in-ternational geological literature is relatively scarce. Mulyadi (1992) andvan Gerven and Pichler (1995) discuss some aspects of the structuraland geological evolution of the Tengger system. The petrology oferupted magmas (medium- to high-k andesites and basaltic andesites)is described in Whitford et al. (1979), van Gerven and Pichler (1995)and, marginally, in the study of Carn and Pyle (2001) on the nearbyLamongan Volcanic Field. Gottschämmer (1999) and Gottschämmerand Surono (2000) describe the location and spectral characteristics ofthe volcano seismicity (tremor, shock waves and LP events). Andresand Kasgnoc (1998) report a SO2 flux of only of 14 t d−1 from Bromo,based on COSPEC measurements in 1995.
3. Material and methods
Our gas measurements on Bromo were carried out on 20–21September, 2014. Intense, passive open-vent degassing was occurringat that time (Fig. 1c), in synchronism with a broad intensification ofboth volcanic activity and seismicity initiated in April–May 2014,which led local authorities to increase the Volcanic Alert Level to 2(on a scale of 1–4; source: Pusat Vulkanologi dan Mitigasi BencanaGeologi, PVMBG).
A compact, portable version of the INGV-typeMulti-GAS (same as inAiuppa et al., 2012, 2013) was temporarily deployed during the twoconsecutive days on the rim of Bromo's summit crater (Fig. 1b) inorder to measure at 0.5 Hz frequency the in-plume concentrations ofvolcanic gas species. The Multi-GAS was powered by a small (6 Ah)12 V LiPo internal battery and mounted onboard the same sensor kitas in Aiuppa et al (2013). H2O and CO2were detected by near dispersiveinfra-red spectroscopy (Licor LI-840A; 0–60,000 ppm range), and SO2,H2S and H2 via specific electrochemical sensors (respectively, models3ST/F, EZ3H, and EZT3HYT “Easy Cal”; all from City Technology a withcalibration range of 0–200 ppm). All the signals were co-acquired andstored in a data-logger, then post-processed using the Ratiocalc soft-ware (https://sites.google.com/site/giancarlotamburello/volcanology/ratiocalc; Tamburello (2015)), as described in Aiuppa et al. (2014). Un-certainties in derived gas ratios (Table 1) are typically ≤10%, except forH2O/SO2 (≤30%).
High-rate (0.5 Hz) SO2 flux time-series were also obtained in bothdays using the dual UV camera technique (Kantzas et al., 2010;Tamburello et al., 2012; see Burton et al., 2015 for a recent review ofUV-camera applications in volcanology). The dual UV camera techniqueis a modified version of the original UV-camera method of (Mori andBurton, 2006), and uses two co-aligned cameras (in this specific case:two Apogee Instruments Alta U260 cameras, each fitted with a16 bit512-512 pixel Kodak KAF-0261E thermo-electrically cooled CCD array
Table 1Volatile ratios calculated for the 4 distinct intervals (A–D) in Fig. 2. The arithmetic mean and s
A B C
20.9.14morning
20.9.14afternoon
21m
Mean σ Mean σ M
H2O/SO2 56 ± 16 66 ± 17 16CO2/SO2 3.4 ± 0.6 3.8 ± 1.5 5.1H2S/SO2 0.26 ± 0.10 0.44 ± 0.05 0.2H2/SO2 0.13 ± 0.05 0.15 ± 0.05 0.3
detector). The advantage of using two simultaneously acquiring cam-eras, instead of only one camera with two switching filters (as in theoriginal Mori and Burton, 2006 paper), is the higher time resolution,and the ability to more effectively manage errors arising from broadband absorption e.g., aerosols and ash (Kantzas et al., 2010; Kern et al.,2010, 2013). The same hardware as in Tamburello et al. (2012) wasused here. A Pentax B2528-UV lens (f = 25 mm; field-of-view of 24°)was mounted to the fore of each camera. Filters (of 10 nm FWHM;Asahibunko Inc.) were placed over each of these lenses, being centredon 310 nm (affected by plume SO2 absorption) and on 330 nm (fallingoutside the SO2 absorption bands), respectively. Absorbance A, pereach camera pixel and each couple of co-acquired images, was thus cal-culated as:
A ¼ − log10 IP310=IB310ð Þ= IP330=IB330ð Þ½ � ð1Þ
where IP and IB are the dark image subtracted plume and backgroundsky images, with the subscripted filters in place. Absorbance was con-verted into SO2 column amount by a calibration procedure achievedusing 4 SO2 cells of known concentration (path amounts of 94, 189,475, and 982 ppm m). Cells were sequentially placed in front of eachcamera when pointing to the background sky above the plume at thebeginning of each measurement series. Having the sun behind camerasminimised the spectral intensity changes during measurements andcalibrations. Data were post-processed using Vulcamera software(Tamburello et al., 2011) that also allows calculating the plume trans-port speeds using cross-correlation analysis (Tamburello et al., 2012,2013). Given the short distance from the volcano target, the relativelywell constrained plume transport speed (Table 2), and the plume typi-cally appearing transparent and with no visible ash, all conditions atwhich UV-camera errors are minimised (Kern et al., 2010, 2013), weevaluate the uncertainty in the UV camera measurements at ≤25%. Insuch optical conditions, good correspondence between results ofDOAS (differential optical absorption) scanning spectrometers and UVcameras has also been demonstrated (Kantzas et al., 2010).
4. Results
During most of our measuring period, the volcanic plume was seento convectively rise from the bottom of Bromo crater (Fig. 1c), beforebeing dispersed by gentle easterly winds (see below) towards thenorth-western outer rim where the Multi-GAS was deployed (Fig. 1b).The air-diluted volcanic plume was buoyant enough to float above thecrater rim for a large part of time, but could be pumped into ourMulti-GAS sensor during four successive time periods (referred to as Ato D in Fig. 2 and Table 1). Distinct increases in the volcanic gas mixingratios were accurately detected during these four intervals (Fig. 2). Thepeak in-plume mixing ratios resulted to be 460 ppmv (CO2), 16 ppmv(SO2), 6.7 ppmv (H2S), 4.6 ppmv (H2) and ~2000 ppmv (H2O), the latterbeing corrected for an ambient air mean H2O mixing ratio of19,300 ppmv. Strong positive co-variations observed between SO2 andthe other detected volatiles (Fig. 2) confirm their common volcanic or-igin. From these correlations, the gas/SO2 molar plume ratios for eachrecording interval were obtained by calculating the gradients of the
tandard deviation (σ) of the 4 observations is also shown.
D Mean
.9.14orning
21.9.14afternoon
ean σ Mean σ σ
0 ± 55 123 ± 54 101 ± 49± 1.8 4.1 ± 1.9 4.1 ± 0.70 ± 0.07 0.15 ± 0.10 0.26 ± 0.19 ± 0.22 0.19 ± 0.13 0.22 ± 0.1

Table 2Volatile fluxes from Bromo volcano.
20.9.14a
morning21.9.14b
morningAveragec
(20–21 Sept)
Mean ± σ Mean ± σ Mean ± σ
Plume speed (m/s)d 8.0 ± 1.8 4.6 ± 1Fluxes (tons/day)e
SO2 168 ± 35 164 ± 70 166 ± 37.5H2O 2628 ± 773 7383 ± 2540 4725 ± 2292CO2 393 ± 69 574 ± 203 466 ± 83H2S 25 ± 9 17 ± 6 25 ± 12H2 0.7 ± 0.5 2 ± 1 1.1 ± 0.8
a Fluxes calculated from gas composition measured in interval A (Table 1).b Fluxes calculated from gas composition measured in interval C (Table 1).c Fluxes calculated from the “mean” gas composition of (Table 1) and themean SO2 flux
of 166 tons/day.d Measured with UV cameras.e Calculated by multiplying the SO2 flux by MultiGAS-derived compositions.
Fig. 2. Scatter plots of SO2 vs (A) H2O (B) CO2 (C) H2S and (D) H2 mixing ratios in theBromo plume. H2O mixing ratios are after subtraction of a mean ambient air H2O mixingratio of 19,300 ppmv (measured by the Multi-GAS in the background site Cam1; seeFig. 1). Data acquired in the four distinct fumigation events A–D are distinguished bydifferent symbols (see legend). The best-fit regression lines, and their respectiveequations, are separately shown (in each of the 4 plots) for periods A–D. The slopesof these regression lines are the averaged volatile/SO2 ratios during each interval(reported in Table 1).
209A. Aiuppa et al. / Journal of Volcanology and Geothermal Research 304 (2015) 206–213
best-fit regression lines (shown in Fig. 2 with the relative equations).The resulting ratios are listed in Table 1.
H2O was a factor ~100 more abundant than SO2 in Bromo plume onaverage (Fig. 2a). H2O/SO2 ratiosfluctuated in the different recording in-tervals (range from 56 to 160; Fig. 2a and Table 1). This variability(about±60% of themean) iswell above the typical associatedmeasure-ment errors (±30%), and suggests a real temporal fluctuation of the gassource. Instead, the CO2/SO2molar ratio showed amuch greater tempo-ral stability, ranging from 3.4 to 5.1 and with a mean of 4.1 ± 0.7(Fig. 2b). While the concentrations of the minor gas components H2Sand H2 exhibited significant temporal variability (Fig. 2c and d), theH2S/SO2 and H2/SO2 ratios have quite well defined average values of0.26 ± 0.1 (range: 0.15–0.44) and 0.22± 0.1 (range: 0.13–0.4), respec-tively.We thus derive ameanH2/H2O ratio of ~0.002, comparable to theratios observed at other open-vent degassing volcanoes such as Etna inItaly (Aiuppa et al., 2011) andGorely in Kamchatka (Aiuppa et al., 2012)(Fig. 3).
The SO2 flux was measured for ~2 consecutive hours on both Sep-tember 20 and 21. For the two distinct days, the calculated plume trans-port speed (averaging at 8.0 ± 1.8 and 4.6 ± 1 m/s) and UV-camerapositions are shown in Table 2 and Fig. 1b, respectively. In both mea-surement days, observations were limited to the early morning clear-sky conditions (8–10 and 9–11 am local time, respectively), when theplume typically appeared transparent. Later in the day, visibility wasrapidly reduced by either meteorological clouds or by the plume be-coming too condensed. An example of a clear-sky UV camera image ofthe SO2-rich Bromo plume is illustrated in Fig. 4a. The pseudo-colourcontours show that SO2 column amounts up to ~600 ppmm were de-tected in the core of the plume at its exit from the crater rim. The SO2
flux was calculated by integrating along a slant column amount profile,roughly perpendicular to the plume transport direction (e.g., cross sec-tion L–R in Fig. 4a), then by scaling to the plume transport speed. Pro-cessing sequences of images allowed us to derive time-series of SO2
fluxes at 0.5 Hz, an example of which (for the September 20 dataset)is illustrated in Fig. 4b. The diagram demonstrates the oscillatory natureof volcanic degassing at Bromo, with 60–120 s long pulses of SO2 emis-sion that repeated at an average periodicity of a few minutes. This ob-servation reminds analogue degassing features observed at both Etnaand Stromboli open-vent basaltic volcanoes (Tamburello et al., 2013)and provides insight into the degassing mechanism at Bromo. Thetime-averaged SO2 flux was very steady as 1.94 kg/s and 1.90 kg/s dur-ing the two days of ourmeasurements, leading to amean daily output of166 ± 38 tons d−1 (Table 2).
5. Discussion
We provide here the first data set for the chemical composition ofgas emissions supplied by open-vent magma degassing at Bromo

Fig. 3. Scatter plot of SO2/H2S vs H2/H2O ratios in the Bromo plume (calculated for the 4fumigation intervals from data in Table 1). The compositional fields of other open-ventvolcanoes are shown for comparison (data source: Etna-Stromboli, Aiuppa et al., 2011; Er-ebus, Moussallam et al., 2012; Gorely, Aiuppa et al., 2012). The solid lines are equilibriumSO2/H2S and H2/H2O ratios in magmatic gases, calculated at 0.1 MPa pressure and in arange of temperatures (isotherms are shown in the figure as dashed lines) and redox con-ditions. Themodel lines labelled QFM, NNO, HM and FeIIFeIII stand for equilibrium compo-sitions at the fO2–temperature dependences fixed by the rock buffers Quartz–Fayalite–Magnetite, Nickel–Nickel oxide, hematite–magnetite, and Fe(II)–Fe(III) (see Aiuppaet al., 2011 for details on the calculations of themodel lines). The SO2/H2S vsH2/H2O ratiosin the Bromo plume are consistent with a quenched equilibrium gas composition at atemperature of ~700 °C and redox conditions intermediate between FeII–FeIII (NNO) andNickel–Nickel Oxide buffers.
210 A. Aiuppa et al. / Journal of Volcanology and Geothermal Research 304 (2015) 206–213
volcano. This volcano, while site of visible, persistent degassing over thelast decade, has received little attention until present.
OurMulti-GAS-sensed compositions demonstrate a H2O-rich natureof Bromo volcanic gases. The mean H2O/SO2 ratio of 101± 49 (Table 1)falls within the upper domain for arc volcanic gases (Fischer, 2008;Shinohara, 2013). Considering that our results approximate for thebulk composition of Bromo volcanic gas (excepting halogen com-pounds), the gas ratios in Table 1 constrain the mol.% chemical compo-sition of the gas. One obtains anH2Omolar proportion of 94.8%, which isstill in the typical arc range (Fischer, 2008). However, the majority ofopen-vent, mafic arc volcanoes, similar in nature to Bromo, emit some-what less hydrous gases, with H2O/SO2 ratio clustering at ~50 and H2Oat ~93 mol% (see the reviews of Shinohara, 2013; Aiuppa, 2015). Wefind that Bromovolcanic gas closelymatches these values on September20 (intervals A–B, H2O/SO2 ratios at ~56–66), but not on the followingday when the H2O/SO2 ratio was about twice higher (123–160;Table 1). We cannot exclude, therefore, that about a half of H2O mea-sured on September 21 was not magmatic in origin, and derived froman external source such as re-evaporatedmeteoric water. The largeme-teoric precipitation events that occurred on the Tengger massif on thenight between 20 and 21 September support this conclusion.
The mean CO2/SO2 ratio of 4.1 (Table 1) of Bromo volcanic gas, com-bined with a H2S/SO2 ratio of ~0.26, corresponds to a mean CO2/St ratioof 3.2 (range 2.6–4.2; where St = SO2 + H2S). Comparing with availablegas data for Indonesian volcanoes (Fig. 5), we find that our mean Bromovolcanic gas ratio of 3.2 is well below the CO2/St ratios that characterisethe majority of close-to-boiling hydrothermal gases in Indonesia (seeFig. 5). The prevailingly high CO2/St signature of these latter manifesta-tions reflects preferential sulphur scrubbing by gas–water–rock reactionsat hydrothermal conditions (Symonds et al., 2001) (see arrow in Fig. 5). In
contrast, the Bromo CO2/St gas ratio is intermediate between thecompositions of high-temperature gases from Merapi (4.3 to 6.3 at850–900 °C; Allard, 1986; Allard et al., 1995, 2011) and Papandayan(2.9-3.0; Giggenbach et al., 2001), suggesting a magmatic (high-temperature) gas feeding source at Bromo. Thermodynamic computa-tions based on the redox couples H2/H2O and H2S/SO2 (Fig. 3) alsoconcur to suggest that Bromo gas emissions originate from a high-temperature (~700 °C), likelymagmatic sourcewith relatively oxidisingredox conditions intermediate between the FeO–Fe2O3 and Nickel–Nickel Oxide buffers (NNO) (oxygen fugacities of 10-17–10-18 bars).We caution that this inferred temperature of ~700 °C (Fig. 3) does likelyunder-estimate the realmagmatic source temperature, since it probablyonly records the temperature of final gas equilibration in the so-called“effective source region” (von Glasow, 2010). This is the region at themagma–air interface where high-temperature volcanic volatiles mixand last equilibrate with air components. In-plume processing ofreduced species (H2 and H2S) during later (lower temperature) atmo-spheric transport and dilution will likely be kinetically limited(Aiuppa et al., 2007; Martin et al., 2009), allowing quenched high-temperature H2/H2O vs. H2S/SO2 redox equilibria to remain preservedin otherwise cold volcanic plumes (Aiuppa et al., 2011).
The novel compositional data for Bromo, in tandem with previousresults for Merapi and Papandayan, suggest that high-temperaturegases from the Java arc segment converge to a relatively narrowerrange of CO2/St ratios of ~3 to ~6 (see gray band area in Fig. 5). The av-erage volcanic gas CO2/St ratio of 4.3, calculated by Hilton et al. (2002)based on analysis of 42 gas samples from10 Indonesian volcanic centres(Fig. 5), falls right in the middle of this compositional range. We notethat our Java's CO2/St ratio interval of 3–6 lies at the upper end of therange of arc volcanic gases (Fischer, 2008), and is well above the“mean arc” CO2/St ratio (of ~2) recently proposed by Shinohara(2013) for persistently degassing open-vent volcanoes similar toBromo. These results thus claim for an unusually C-rich signature ofJava volcanic gases, relative to “mean arc” composition, possibly dueto larger involvement of slab- or crustal-derived fluids (compared toother arc segments). We caution, however, that a larger gas dataset(than currently available) would be needed to more fully characterisevariations in CO2 origin and abundance (relative to sulphur) along thearc. For example, the high-temperature volcanic gases vented atKrakatau, right west of Java, are substantially more CO2-poor (CO2/Stratio of only ~0.4; Allard, 1986), implying that along-arc variations ingas chemistry can be important in Indonesia (as recently demonstratedin other, better studied arcs such as Central America; Aiuppa et al., 2014).
Our measured SO2 flux of 164–168 t d−1 from Bromo is an order ofmagnitude higher than the low value (14 t d−1) quoted by Andres andKasgnoc (1998) and Shinohara (2013) (Fig. 6a). It is also much higherthan the SO2 output of 27.1 ± 9.5 t d−1 measured in June 2011 byBani et al. (2013), using differential absorption spectroscopy (DOAS).Bani et al. (2013) outlined that their DOAS traverses did not cover theentire plume's cross-section and thus probably underestimated the ac-tual SO2 emission rate. Prior to our study and that of Bani et al. (2013),the SO2 flux from Bromo had been measured in March 1995 (6, 22 and22 t d−1; GVP, 03/1995 – BGVN 20:03) and June 2004 (200 t d−1;GVP, 05/2004 – BGVN 29:05). We note that the 2004 value is relativelyclose to our 2014 result. The overall range in these data suggests thatBromo's SO2 source strength is not stable over time and that ourSeptember 2014 flux data does characterise a phase of increaseddegassing-seismic activity, such as previouslymentioned. Clearly, betterquantification of the time-averaged SO2 emission rate from Bromo re-quires more frequent measurements in future. We argue, in particular,that the SO2 fluxes may result particularly increased during the (rela-tively frequent) eruptive episodes of the volcano. For example,satellite-based UV observations (Carn et al., 2014 and 2015, pers.comm.) suggest a Bromo's time-averaged SO2 flux of ~700 t d−1 for2010–2014, a period encompassing the 2010–2012 eruptive episode(GVP; CVGHM Reports). Comparison between satellite- (OMI) and

Fig. 4. (A) The Bromo plume seen is a UV camera image captured on September 20 at ~3.10 am local time. Pseudo-colours indicate SO2 column amounts in the plume—in ppm m (seevertical colour bar for scale). A typical slant column amount cross section (from L to X in the image) is shown, from which integration the ICA (integrated column amount) was derived.The arrow stands for the plume transport direction. (B) A 1 h time-series of SO2 flux emissions from Bromo (from 20 September, 2014). The red error bar demonstrates ±25% relativeuncertainty on individual SO2 flux data.
Fig. 5. Scatter plot of CO2/St ratios in Indonesian volcanic gas emissions versus their dis-charge temperature. Low-temperature gases exhibit highly scattered CO2/St ratios, asseen in other arc segments (e.g., Central America; Aiuppa et al., 2014), reflecting the roleof gas-water rock reactions (gas scrubbing). High-temperature gases from the Java arcsegment, including our novel Bromo data, converge to a narrower range of CO2/St ratios(gray band area), that encompasses the Indonesian arc mean of Hilton et al (2002)(CO2/St ratio of 4.3). Data source (except Bromo, this study): compilation of Indonesiangas sample of Pfeffer (2007).
211A. Aiuppa et al. / Journal of Volcanology and Geothermal Research 304 (2015) 206–213
ground-based (UV camera) surveys seems to suggest, therefore, thateruptive periods may release a factor ~3 more SO2 than quiescent pe-riods (our present study). We caution, however, that the higher emis-sion rates from satellite observations may be biassed towards moreexplosive periods of activity from Bromo; with less intense (loweraltitude) passive emissions, though dominant on the long-term, remain-ing undetected (or, at least, poorly detected) from space.
Our 2014 flux value ranks Bromo as a typical volcanic arc emitter,sitting in the central portion of the global volcanic SO2 flux population(see Fig. 6a). In terms of SO2 emission, Bromo is intermediate betweenthe two largest Indonesian volcanoes yet measured, Merapi (time-average flux of 120 ± 30 t d−1 over three decades, range from 50 toN450 t/d; Allard, 1986; Allard et al., 1995, 2011; Surono et al., 2012)and Anak Krakatau (190 ± 65 t d−1; Bani et al., 2015). Recently,Smekens et al. (2015) reported a first SO2 fluxmeasurement at Semeruvolcano (Fig. 1d), just south of Bromo, with an estimated average dailyemission of 22-71 t d−1. They demonstrated that a substantial fraction(35–65%) of this SO2 release occurs during short-lived periodic explo-sive events, while passive emissions in between the explosions contrib-ute 9-50 t d−1. Although quantitative comparison of these and ourresults is limited by observations having beenmade in different periods(May–June 2013 at Semeru and September 2014 at Bromo), it appearsthat Bromo's emissions may be 2–7 times higher than those of Semeru,suggesting that Bromo could make a significant (dominant?) contribu-tion to the volcanic SO2 emissions detected by satellites over theTengger–Semeru massif (Carn et al., 2014).
The fluxes of other volatile species (H2O, CO2, H2S and H2) releasedby open-vent degassing at Bromo, quantified from our Multi-GAS data
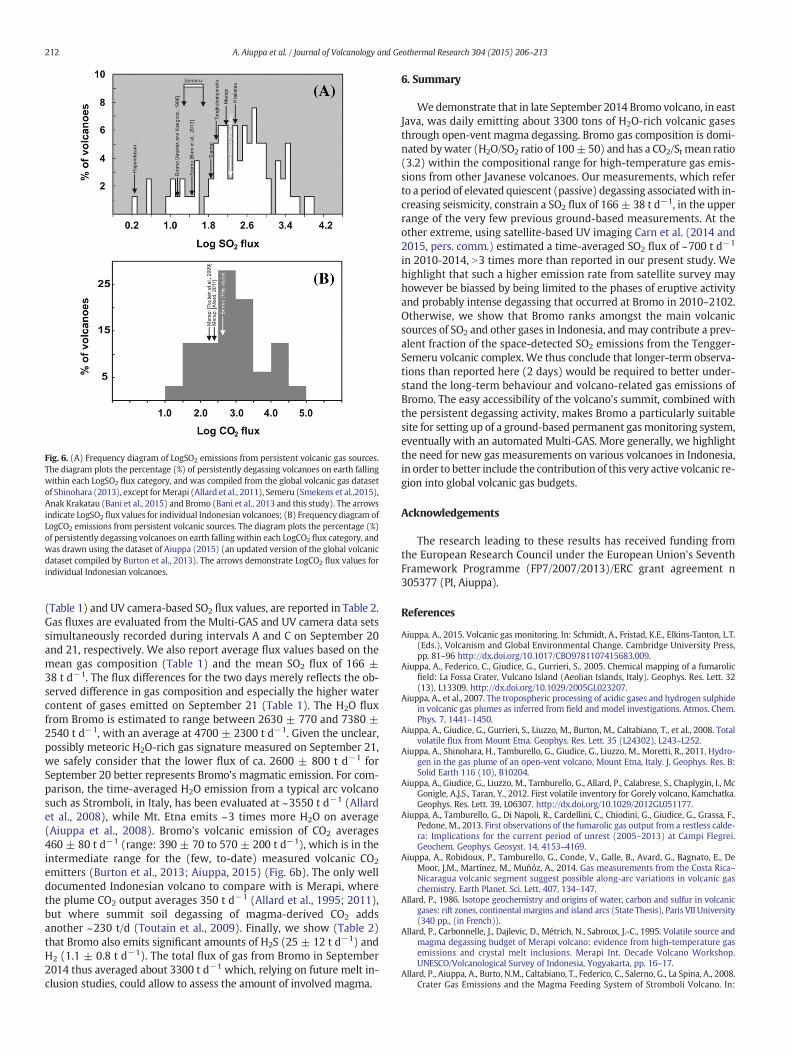
Fig. 6. (A) Frequency diagram of LogSO2 emissions from persistent volcanic gas sources.The diagram plots the percentage (%) of persistently degassing volcanoes on earth fallingwithin each LogSO2 flux category, and was compiled from the global volcanic gas datasetof Shinohara (2013), except forMerapi (Allard et al., 2011), Semeru (Smekens et al.,2015),Anak Krakatau (Bani et al., 2015) and Bromo (Bani et al., 2013 and this study). The arrowsindicate LogSO2 flux values for individual Indonesian volcanoes; (B) Frequency diagram ofLogCO2 emissions from persistent volcanic sources. The diagram plots the percentage (%)of persistently degassing volcanoes on earth falling within each LogCO2 flux category, andwas drawn using the dataset of Aiuppa (2015) (an updated version of the global volcanicdataset compiled by Burton et al., 2013). The arrows demonstrate LogCO2 flux values forindividual Indonesian volcanoes.
212 A. Aiuppa et al. / Journal of Volcanology and Geothermal Research 304 (2015) 206–213
(Table 1) and UV camera-based SO2 flux values, are reported in Table 2.Gas fluxes are evaluated from the Multi-GAS and UV camera data setssimultaneously recorded during intervals A and C on September 20and 21, respectively. We also report average flux values based on themean gas composition (Table 1) and the mean SO2 flux of 166 ±38 t d−1. The flux differences for the two days merely reflects the ob-served difference in gas composition and especially the higher watercontent of gases emitted on September 21 (Table 1). The H2O fluxfrom Bromo is estimated to range between 2630 ± 770 and 7380 ±2540 t d−1, with an average at 4700 ± 2300 t d−1. Given the unclear,possibly meteoric H2O-rich gas signature measured on September 21,we safely consider that the lower flux of ca. 2600 ± 800 t d−1 forSeptember 20 better represents Bromo's magmatic emission. For com-parison, the time-averaged H2O emission from a typical arc volcanosuch as Stromboli, in Italy, has been evaluated at ~3550 t d−1 (Allardet al., 2008), while Mt. Etna emits ~3 times more H2O on average(Aiuppa et al., 2008). Bromo's volcanic emission of CO2 averages460 ± 80 t d−1 (range: 390 ± 70 to 570 ± 200 t d−1), which is in theintermediate range for the (few, to-date) measured volcanic CO2
emitters (Burton et al., 2013; Aiuppa, 2015) (Fig. 6b). The only welldocumented Indonesian volcano to compare with is Merapi, wherethe plume CO2 output averages 350 t d−1 (Allard et al., 1995; 2011),but where summit soil degassing of magma-derived CO2 addsanother ~230 t/d (Toutain et al., 2009). Finally, we show (Table 2)that Bromo also emits significant amounts of H2S (25 ± 12 t d−1) andH2 (1.1 ± 0.8 t d−1). The total flux of gas from Bromo in September2014 thus averaged about 3300 t d−1 which, relying on future melt in-clusion studies, could allow to assess the amount of involved magma.
6. Summary
Wedemonstrate that in late September 2014 Bromo volcano, in eastJava, was daily emitting about 3300 tons of H2O-rich volcanic gasesthrough open-vent magma degassing. Bromo gas composition is domi-nated bywater (H2O/SO2 ratio of 100± 50) and has a CO2/St mean ratio(3.2) within the compositional range for high-temperature gas emis-sions from other Javanese volcanoes. Our measurements, which referto a period of elevated quiescent (passive) degassing associatedwith in-creasing seismicity, constrain a SO2 flux of 166 ± 38 t d−1, in the upperrange of the very few previous ground-based measurements. At theother extreme, using satellite-based UV imaging Carn et al. (2014 and2015, pers. comm.) estimated a time-averaged SO2 flux of ~700 t d−1
in 2010-2014, N3 times more than reported in our present study. Wehighlight that such a higher emission rate from satellite survey mayhowever be biassed by being limited to the phases of eruptive activityand probably intense degassing that occurred at Bromo in 2010–2102.Otherwise, we show that Bromo ranks amongst the main volcanicsources of SO2 and other gases in Indonesia, andmay contribute a prev-alent fraction of the space-detected SO2 emissions from the Tengger-Semeru volcanic complex. We thus conclude that longer-term observa-tions than reported here (2 days) would be required to better under-stand the long-term behaviour and volcano-related gas emissions ofBromo. The easy accessibility of the volcano's summit, combined withthe persistent degassing activity, makes Bromo a particularly suitablesite for setting up of a ground-based permanent gasmonitoring system,eventually with an automated Multi-GAS. More generally, we highlightthe need for new gas measurements on various volcanoes in Indonesia,in order to better include the contribution of this very active volcanic re-gion into global volcanic gas budgets.
Acknowledgements
The research leading to these results has received funding fromthe European Research Council under the European Union's SeventhFramework Programme (FP7/2007/2013)/ERC grant agreement n305377 (PI, Aiuppa).
References
Aiuppa, A., 2015. Volcanic gas monitoring. In: Schmidt, A., Fristad, K.E., Elkins-Tanton, L.T.(Eds.), Volcanism and Global Environmental Change. Cambridge University Press,pp. 81–96 http://dx.doi.org/10.1017/CBO9781107415683.009.
Aiuppa, A., Federico, C., Giudice, G., Gurrieri, S., 2005. Chemical mapping of a fumarolicfield: La Fossa Crater, Vulcano Island (Aeolian Islands, Italy). Geophys. Res. Lett. 32(13), L13309. http://dx.doi.org/10.1029/2005GL023207.
Aiuppa, A., et al., 2007. The tropospheric processing of acidic gases and hydrogen sulphidein volcanic gas plumes as inferred from field and model investigations. Atmos. Chem.Phys. 7, 1441–1450.
Aiuppa, A., Giudice, G., Gurrieri, S., Liuzzo, M., Burton, M., Caltabiano, T., et al., 2008. Totalvolatile flux from Mount Etna. Geophys. Res. Lett. 35 (L24302), L243–L252.
Aiuppa, A., Shinohara, H., Tamburello, G., Giudice, G., Liuzzo, M., Moretti, R., 2011. Hydro-gen in the gas plume of an open-vent volcano, Mount Etna, Italy. J. Geophys. Res. B:Solid Earth 116 (10), B10204.
Aiuppa, A., Giudice, G., Liuzzo, M., Tamburello, G., Allard, P., Calabrese, S., Chaplygin, I., McGonigle, A.J.S., Taran, Y., 2012. First volatile inventory for Gorely volcano, Kamchatka.Geophys. Res. Lett. 39, L06307. http://dx.doi.org/10.1029/2012GL051177.
Aiuppa, A., Tamburello, G., Di Napoli, R., Cardellini, C., Chiodini, G., Giudice, G., Grassa, F.,Pedone, M., 2013. First observations of the fumarolic gas output from a restless calde-ra: Implications for the current period of unrest (2005–2013) at Campi Flegrei.Geochem. Geophys. Geosyst. 14, 4153–4169.
Aiuppa, A., Robidoux, P., Tamburello, G., Conde, V., Galle, B., Avard, G., Bagnato, E., DeMoor, J.M., Martínez, M., Muñóz, A., 2014. Gas measurements from the Costa Rica–Nicaragua volcanic segment suggest possible along-arc variations in volcanic gaschemistry. Earth Planet. Sci. Lett. 407, 134–147.
Allard, P., 1986. Isotope geochemistry and origins of water, carbon and sulfur in volcanicgases: rift zones, continental margins and island arcs (State Thesis), Paris VII University(340 pp., (in French)).
Allard, P., Carbonnelle, J., Dajlevic, D., Métrich, N., Sabroux, J.-C., 1995. Volatile source andmagma degassing budget of Merapi volcano: evidence from high-temperature gasemissions and crystal melt inclusions. Merapi Int. Decade Volcano Workshop.UNESCO/Volcanological Survey of Indonesia, Yogyakarta, pp. 16–17.
Allard, P., Aiuppa, A., Burto, N.M., Caltabiano, T., Federico, C., Salerno, G., La Spina, A., 2008.Crater Gas Emissions and the Magma Feeding System of Stromboli Volcano. In:
213A. Aiuppa et al. / Journal of Volcanology and Geothermal Research 304 (2015) 206–213
Calvari, S., Inguaggiato, S., Puglisi, G., Ripepe, M., Ros, M. (Eds.), Learning from Strom-boli Volcano: An Integrated Study of the 2002–2003 Eruption. AGU Geophys. Mono-graph. Series 182, pp. 65–80. http://dx.doi.org/10.1029/GM182 (Washington D.C.,Chap. 1.5).
Allard, P., Metrich, N., Sabroux, J.C., 2011. Volatile and magma supply to standard eruptiveactivity at Merapi volcano, Indonesia. Geophys. Res. Abstr. 13 (EGU2011-13522).
Andres, R.J., Kasgnoc, A.D., 1998. A time-averaged inventory of subaerial volcanic sulfuremissions. J. Geophys. Res. 103 (D19), 25,251–25,261.
Bani, P., Oppenheimer, C., Allard, P., Shinohara, H., Lardy, M., Garaebiti, E., 2012. First esti-mate of volcanic SO2 budget for Vanuatu island arc. J. Volcanol. Geotherm. Res.211–212, 36–46.
Bani, P., Surono, Hendrasto, M., Gunawan, H., Primulyana, S., 2013. Sulfur dioxide emis-sions from Papandayan and Bromo, two Indonesian volcanoes. Nat. Hazards EarthSyst. Sci. 13, 2399–2407.
Bani, P., Normier, A., Bacri, C., Gunawan, H., Hendrasto, M., Surono, Tsanev V., 2015. Firstevaluation of sulfur dioxide degassing from Anak Krakatau volcano, Indonesia.J. Volcanol. Geotherm. Res. 302, 237–241.
Burton, M.R., Sawyer, G.M., Granieri, D., 2013. Deep carbon emissions from volcanoes.Rev. Mineral. Geochem. 75 (1), 323–354.
Burton, M.R., Prata, F., Platt, U., 2015. Volcanological applications of SO2 cameras.J. Volcanol. Geotherm. Res. 300, 2–6.
Carn, S.A., Pyle, D.M., 2001. Petrology and geochemistry of the Lamongan volcanic field,East Java, Indonesia: primitive Sunda arc magmas in an extensional tectonic setting?J. Petrol. 42, 1643–1683.
Carn, S.A., Flower, V.J.B., Telling, J.W., Yang, K., 2014. Satellite-Based Monitoring of GlobalVolcanic Degassing, Cities on Volcanoes 8, Yogyakarta, Indonesia, Sep 9–13.
Fischer, T.P., 2008. Fluxes of volatiles (H2O, CO2, N2, Cl, F) from arc volcanoes. Geochem. J.42, 21–38.
Giggenbach, W.F., et al., 2001. Evaluation of results from the fourth and fifth IAVCEI fieldworkshops on volcanic gases, Vulcano island, Italy and Java, Indonesia. J. Volcanol.Geotherm. Res. 108 (1-4), 157–172.
Global Volcanism Program, 2012. Report on Tengger Caldera (Indonesia). In:Wunderman, R (Ed.), Bulletin of the Global Volcanism Network 37:10. SmithsonianInstitution. http://dx.doi.org/10.5479/si.GVP.BGVN201210-263310.
Gottschämmer, E., 1999. Volcanic tremor associated with eruptive activity at BromoVolcano. Ann. Geofis. 42, 465–481.
Gottschämmer, E., Surono, 2000. Locating tremor and shock sources recorded at BromoVolcano. J. Volcanol. Geotherm. Res. 101, 199–209.
Hilton, D.R., Fischer, T.P., Marty, B., 2002. Noble gases and volatile recycling at subductionzones. Rev. Mineral. Geochem. 47.
Kantzas, E.P., McGonigle, A.J.S., Tamburello, G., Aiuppa, A., Bryant, R.G., 2010. Protocols forUV camera volcanic SO2 measurements. J. Volcanol. Geotherm. Res. 194, 55–60.http://dx.doi.org/10.1016/j.jvolgeores.2010.05.003.
Kern, C., Kick, F., Lubcke, P., Vogel, L., Wohrbach, M., Platt, U., 2010. Theoretical descriptionof functionality, applications and limitations of SO2 cameras for the remote sensing ofvolcanic plumes. Atmos. Meas. Tech. 3, 733–749. http://dx.doi.org/10.5194/amt-3-733-2010.
Kern, C., Werner, C., Elias, T., Sutton, A.J., Lubcke, P., 2013. Applying UV cameras for SO2
detection to distant or optically thick volcanic plumes. J. Volcanol. Geotherm. Res.262, 80–89.
Martin, R.S., Roberts, T.J., Mather, T.A., Pyle, D.M., 2009. The implications of H2S and H2
stability in high-T mixtures of magmatic and atmospheric gases for the productionof oxidized trace species (e.g., BrO and NOx). Chem. Geol. 263, 143–150.
McCormick, B.T., Edmonds, M., Mather, T.A., Carn, S.A., 2012. First synoptic analysis of vol-canic degassing in Papua New Guinea. Geochem. Geophys. Geosyst. 13, Q03008.http://dx.doi.org/10.1029/2011GC003945.
McGonigle, A.J.S., Oppenheimer, C., Tsanev, V.I., Saunder, S., Mulina, K., Tohui, S., Bosco, J.,Nahou, J., Kuduon, J., Taranu, F., 2004. Sulphur dioxide fluxes from Papua NewGuinea's volcanoes. Geophys. Res. Lett. 31, L08606. http://dx.doi.org/10.1029/2004GL019568.
Mori, T., Burton, M., 2006. The SO2 camera: a simple, fast and cheap method for ground-based imaging of SO2 in volcanic plumes. Geophys. Res. Lett. 33, L24804. http://dx.doi.org/10.1029/2006GL027916.
Moussallam, Y., Oppenheimer, C., Aiuppa, A., Giudice, G., Moussallam, M., Kyle, P., 2012.Hydrogen emissions from Erebus volcano, Antarctica. Bull. Volcanol. 74 (9),2109–2120. http://dx.doi.org/10.1007/s00445-012-0649-2.
Mulyadi, E., 1992. Le complexe de Bromo-Tengger Est Java, Indonesie Etude structurale etvolcanologique (These) University Blaise Pascal, Clermont-Ferrand, France.
Nho, E.Y., Le Cloarec, M.-F., Ardouin, B., Tjetjep, W.S., 1996. Source strength assessment ofvolcanic trace elements emitted from the Indonesian arc. J. Volcanol. Geotherm. Res.74, 121–129.
Oppenheimer, C., Fischer, T., Scaillet, B., 2014. Volcanic Degassing: Process and Impact inTreatise on Geochemistry. In: Holland, H.D., Turekian, K.K. (Eds.), Second editionElsevier, Oxford, pp. 111–179 http://dx.doi.org/10.1016/B978-0-08-095975-7.00304-1.
Pfeffer, M.A., 2007. The Relative Influences of Volcanic and Anthropogenic Emissions onAir Pollution in Indonesia as StudiedWith a Regional Atmospheric Chemistry and Cli-mate Model. Reports on Earth System Science. Max Planck Institute for Meteorology,Hamburg.
Shinohara, H., 2005. A new technique to estimate volcanic gas composition: plume mea-surements with a portable multi-sensor system. J. Volcanol. Geotherm. Res. 143,319–333.
Shinohara, H., 2013. Volatile flux from subduction zone volcanoes: insights from a de-tailed evaluation of the fluxes from volcanoes in Japan. J. Volcanol. Geotherm. Res.268, 46–63.
Simkin, T., Siebert, L., 1994. Volcanoes of the World. 2nd ed. Geoscience Press for theSmithsonian Institution, Tucson (Xi, 349 pp.).
Smekens, J.F., Clarke, A.B., Burton, M.R., Harijoko, A., Wibowo, H.E., 2015. SO2 emissions atSemeru volcano, Indonesia: characterization and quantification of persistent and pe-riodic explosive activity. J. Volcanol. Geotherm. Res. 300, 121–128.
Surono, et al., 2012. The 2010 explosive eruption of Java's Merapi volcano—a ‘100-year’event. J. Volcanol. Geotherm. Res. 241–242 (2012), 121–135. http://dx.doi.org/10.1016/j.jvolgeores.2012.06.018.
Symonds, R.B., Gerlach, T.M., Reed, M.H., 2001. Magmatic gas scrubbing: implications forvolcano monitoring. J. Volcanol. Geotherm. Res. 108, 303–341.
Tamburello, G., 2015. Ratiocalc: software for processing data frommulticomponent volca-nic gas analyzers. Comput. Geosci. 82, 63–67.
Tamburello, G., Kantzas, E.P., McGonigle, A.J.S., Aiuppa, A., 2011. Vulcamera: a program formeasuring volcanic SO2 using UV cameras. Ann. Geophys. 54 (2), 219–221. http://dx.doi.org/10.4401/ag-518.
Tamburello, G., Aiuppa, A., Kantzas, et al., 2012. Passive vs. active degassing modes at anopen-vent volcano (Stromboli, Italy). Earth Planet. Sci. Lett. 359–360, 106–116.
Tamburello, G., Aiuppa, A., Mcgonigle, A.J.S., Allard, P., Cannata, A., Kantzas, E.P., 2013. Pe-riodic volcanic degassing behavior: the Mount Etna example. Geophys. Res. Lett. 40,4818–4822. http://dx.doi.org/10.1002/grl.50924.
Toutain, J.-P., Sortino, F., Baubron, J.-C., Richon, P., Surono, Sumarti, S., Nonell, A., 2009.Structure and CO2 budget of Merapi volcano during inter-eruptive periods. Bull.Volcanol. 71 (7), 815–826. http://dx.doi.org/10.1007/s00445-009-0266-x.
van Gerven, M., Pichler, H., 1995. Some aspects of the volcanology and geochemistry ofthe Tengger Caldera, Java, Indonesia: eruption of a K-rich tholeiitic series. J. SEAsian Earth Sci. 11–2, 125–133.
von Glasow, R., 2010. Atmospheric chemistry in volcanic plumes. PNAS 107–15,6594–6599 (www.pnas.org/cgi/doi/10.1073/pnas.0913164107).
Whitford, D.J., Nicholls, I.A., Taylor, S.R., 1979. Spatial variations in the geochemistry ofquaternary lavas across the Sunda Arc in Java and Bali. Contrib. Mineral. Petrol. 70,341–356.