first half 2017 results presentation 1h17 results.pdfsaudi aramco hawiyah e haradh field gas...
TRANSCRIPT
FIRST HALF 2017 RESULTS PRESENTATION
25 July 2017
2
FORWARD-LOOKING STATEMENTS
Forward-looking statements contained in this presentation regrading future events and future results are based on current expectations, estimates, forecasts and projections about the industries in which Saipem S.p.A. (the “Company”) operates, as well as the beliefs and assumptions of the Company’s management. These forward-looking statements are only predictions and are subject to known and unknown risks, uncertainties, assumptions and other factors beyond the Company’ control that are difficult to predict because they relate to events and depend on circumstances that will occur in the future. These include, but are not limited to: forex and interest rate fluctuations, commodity price volatility, credit and liquidity risks, HSE risks, the levels of capital expenditure in the oil and gas industry and other sectors, political instability in areas where the Group operates, actions by competitors, success of commercial transactions, risks associated with the execution of projects (including ongoing investment projects), in addition to changes in stakeholders’ expectations and other changes affecting business conditions. Therefore, the Company’s actual results may differ materially and adversely from those expressed or implied in any forward-looking statements. They are neither statements of historical fact nor guarantees of future performance. The Company therefore caution against relying on any of these forward-looking statements. Factors that might cause or contribute to such differences include, but are not limited to, economic conditions globally, the impact of competition, political and economic developments in the countries in which the Company operates, and regulatory developments in Italy and internationally. Any forward-looking statements made by or on behalf of the Company speak only as of the date they are made. The Company undertakes no obligation to update any forward-looking statements to reflect any changes in the Company’s expectations with regard thereto or any changes in events, conditions or circumstances on which any such statement is based. Accordingly, readers should not place undue reliance on forward-looking statements due to the inherent uncertainty therein. The Financial Reports contain analyses of some of the aforementioned risks. Forward-looking statements neither represent nor can be considered as estimates for legal, accounting, fiscal or investment purposes. Forward-looking statements are not intended to provide assurances and/or solicit investment.
3
2
3
TODAY’S PRESENTATION
5
1H 2017 RESULTS
BUSINESS UPDATE
CLOSING REMARKS AND GUIDANCE
1 OPENING REMARKS
4 FIT FOR THE FUTURE
4
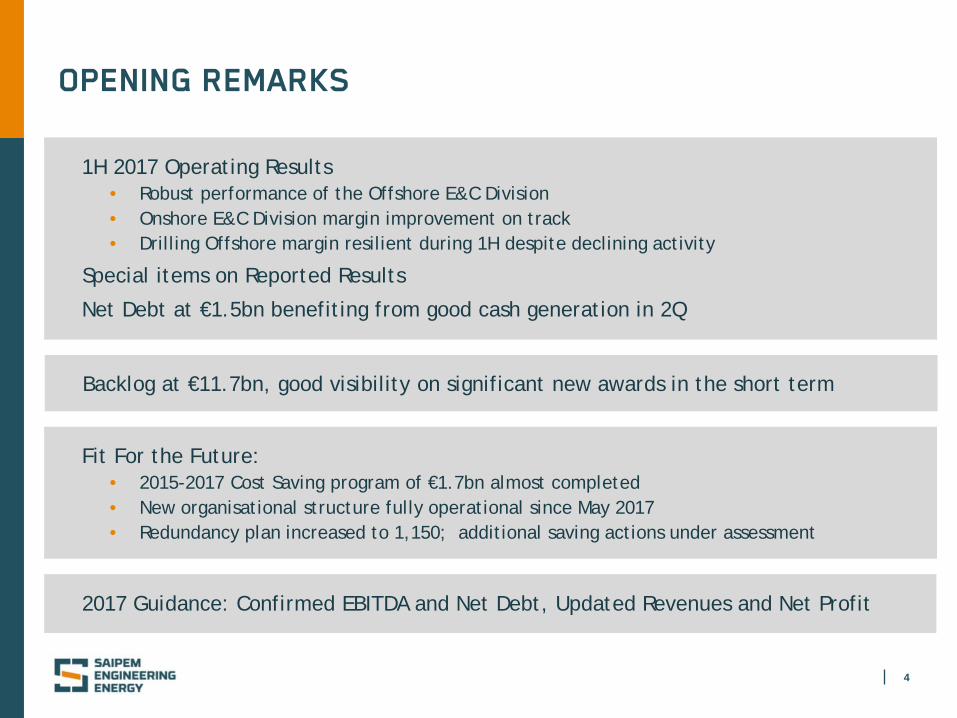
OPENING REMARKS
1H 2017 Operating Results • Robust performance of the Offshore E&C Division • Onshore E&C Division margin improvement on track • Drilling Offshore margin resilient during 1H despite declining activity
Special items on Reported Results
Net Debt at €1.5bn benefiting from good cash generation in 2Q
2017 Guidance: Confirmed EBITDA and Net Debt, Updated Revenues and Net Profit
Fit For the Future: • 2015-2017 Cost Saving program of €1.7bn almost completed • New organisational structure fully operational since May 2017 • Redundancy plan increased to 1,150; additional saving actions under assessment
Backlog at €11.7bn, good visibility on significant new awards in the short term
5
CO
RP
OR
AT
E
DI
VI
SI
ON
S
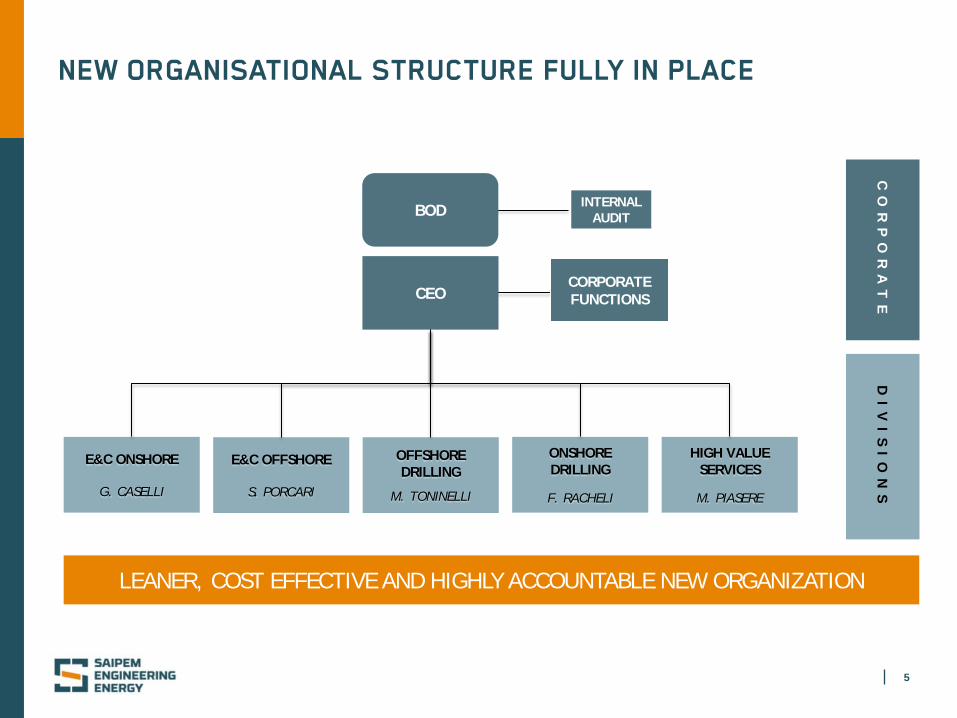
E&C ONSHORE
G. CASELLI
E&C OFFSHORE
S. PORCARI
ONSHORE DRILLING
F. RACHELI
OFFSHORE DRILLING
M. TONINELLI
HIGH VALUE SERVICES
M. PIASERE
INTERNAL AUDIT BOD
CEO CORPORATE FUNCTIONS
NEW ORGANISATIONAL STRUCTURE FULLY IN PLACE
LEANER, COST EFFECTIVE AND HIGHLY ACCOUNTABLE NEW ORGANIZATION
6
1H 2017 RESULTS
7
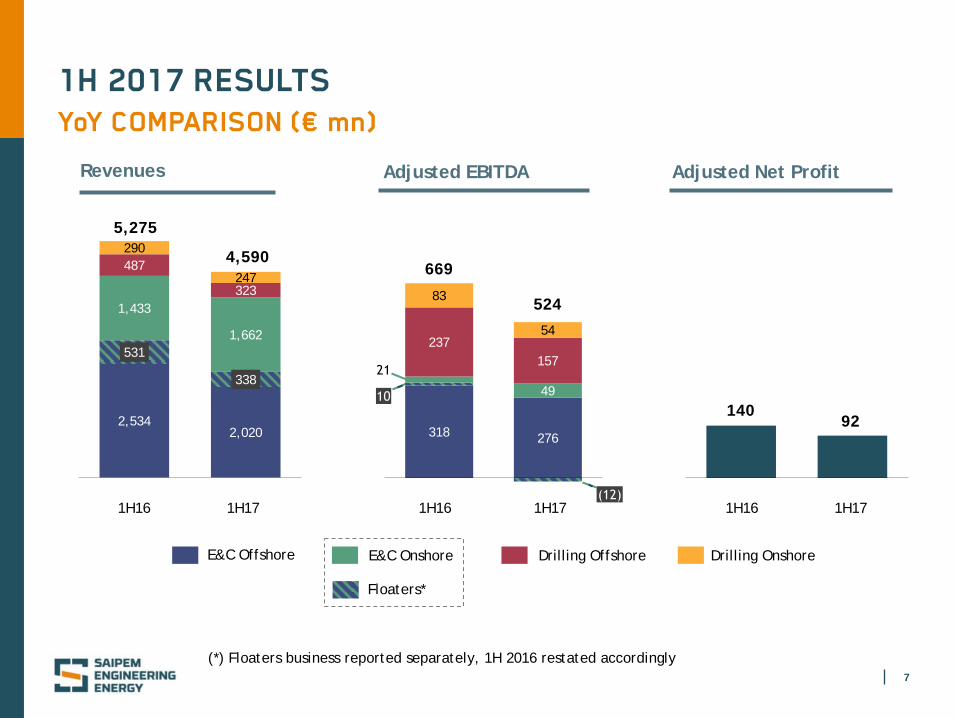
318 276
49
237 157
83
54
1H 2017 RESULTS YoY COMPARISON (€ mn)
E&C Onshore Drilling Offshore E&C Offshore Drilling Onshore
Floaters*
(*) Floaters business reported separately, 1H 2016 restated accordingly
Adjusted EBITDA
1H17 1H16
669
524
Revenues
2,534 2,020
531
338
1,433
1,662
487
323
290
247
1H17
4,590
1H16
5,275
Adjusted Net Profit
92 140
1H17 1H16
8
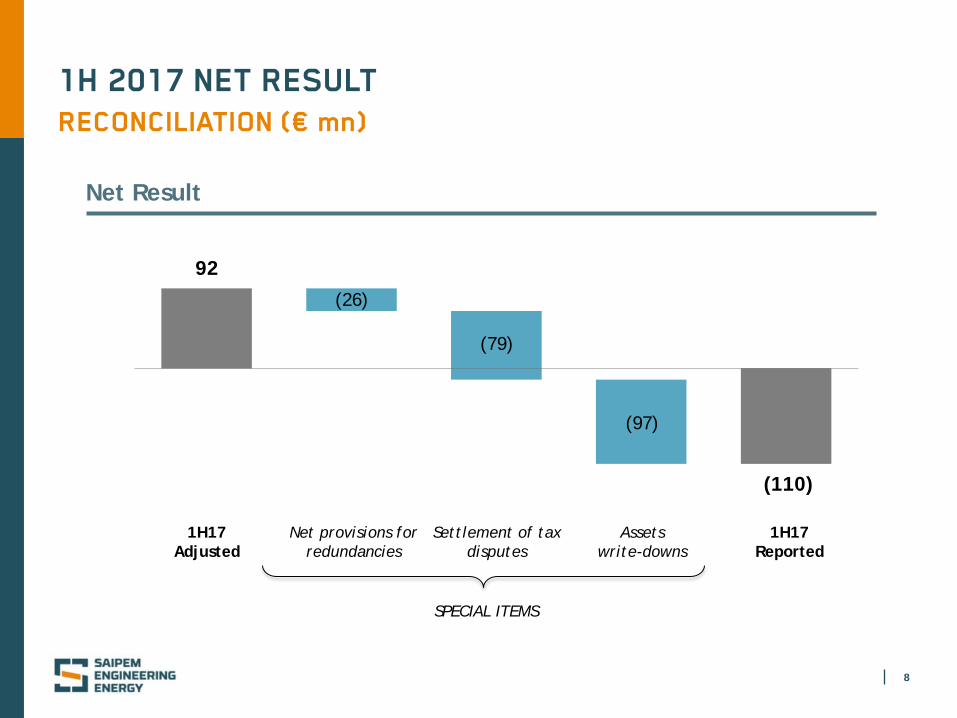
1H17 Adjusted
Net provisions for redundancies
Settlement of tax disputes
1H17 Reported
92 (26)
(79)
(110)
SPECIAL ITEMS
Assets write-downs
(97)
1H 2017 NET RESULT RECONCILIATION (€ mn)
Net Result
9
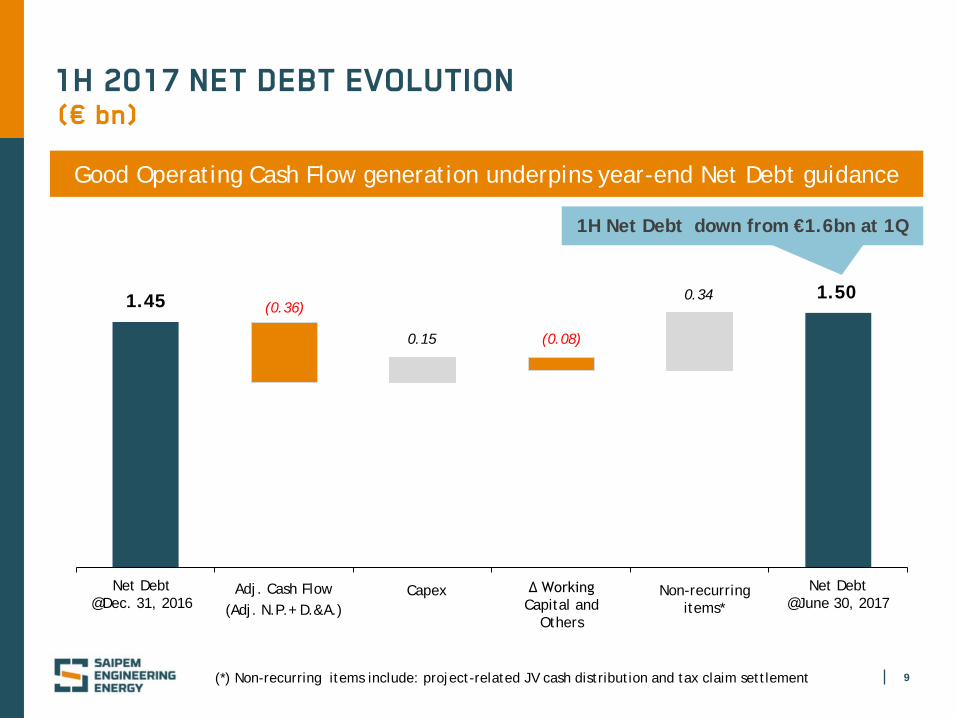
1H 2017 NET DEBT EVOLUTION (€ bn)
Adj. Cash Flow (Adj. N.P.+ D.&A.)
Capex Net Debt @Dec. 31, 2016
Net Debt @June 30, 2017
Δ Working Capital and
Others
1.50 (0.36)
0.15
0.34 1.45
(0.08)
Non-recurring items*
Good Operating Cash Flow generation underpins year-end Net Debt guidance
(*) Non-recurring items include: project-related JV cash distribution and tax claim settlement
1H Net Debt down from €1.6bn at 1Q
10
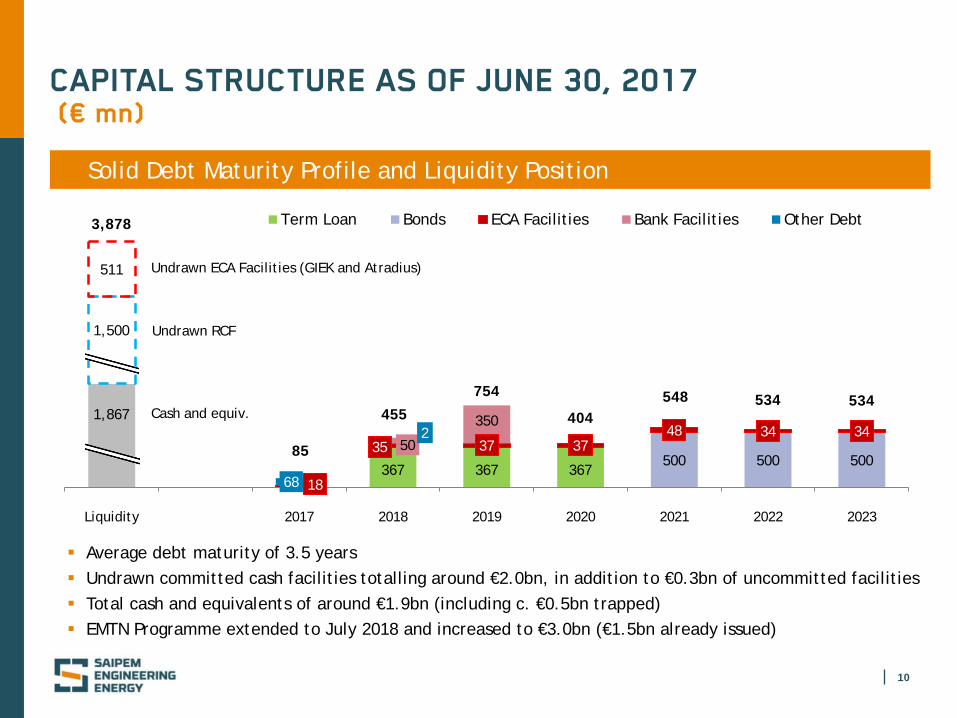
CAPITAL STRUCTURE AS OF JUNE 30, 2017 (€ mn)
Solid Debt Maturity Profile and Liquidity Position
Average debt maturity of 3.5 years Undrawn committed cash facilities totalling around €2.0bn, in addition to €0.3bn of uncommitted facilities Total cash and equivalents of around €1.9bn (including c. €0.5bn trapped) EMTN Programme extended to July 2018 and increased to €3.0bn (€1.5bn already issued)
367 367 367 500 500 500
18
35 37 37 48 34 34
50
350
68
2 85
455
754
404 548 534 534
511
Liquidity 2017 2018 2019 2020 2021 2022 2023
Term Loan Bonds ECA Facilities Bank Facilities Other Debt3,878
Undrawn RCF
Cash and equiv.
Undrawn ECA Facilities (GIEK and Atradius)
1,867
1,500
11
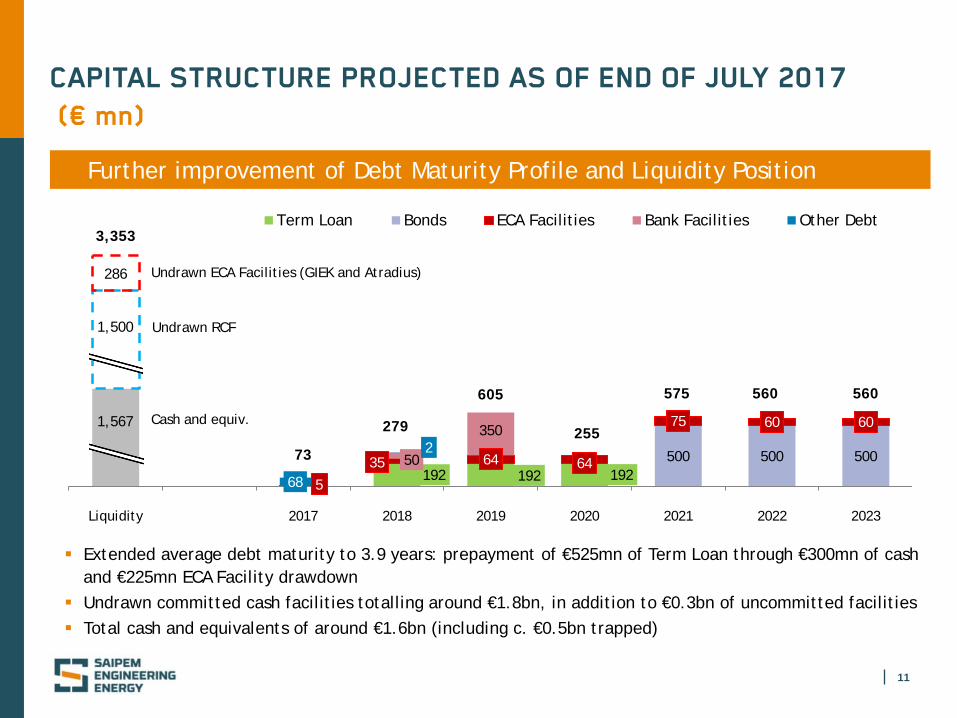
CAPITAL STRUCTURE PROJECTED AS OF END OF JULY 2017 (€ mn)
Further improvement of Debt Maturity Profile and Liquidity Position
192 192 192 500 500 500
5
35 64 64
75 60 60
50
350
68
2 73
279
605
255
575 560 560
286
Liquidity 2017 2018 2019 2020 2021 2022 2023
Term Loan Bonds ECA Facilities Bank Facilities Other Debt
Undrawn RCF
Cash and equiv.
Undrawn ECA Facilities (GIEK and Atradius)
1,567
3,353
Extended average debt maturity to 3.9 years: prepayment of €525mn of Term Loan through €300mn of cash and €225mn ECA Facility drawdown
Undrawn committed cash facilities totalling around €1.8bn, in addition to €0.3bn of uncommitted facilities Total cash and equivalents of around €1.6bn (including c. €0.5bn trapped)
1,500
12
BUSINESS UPDATE
13
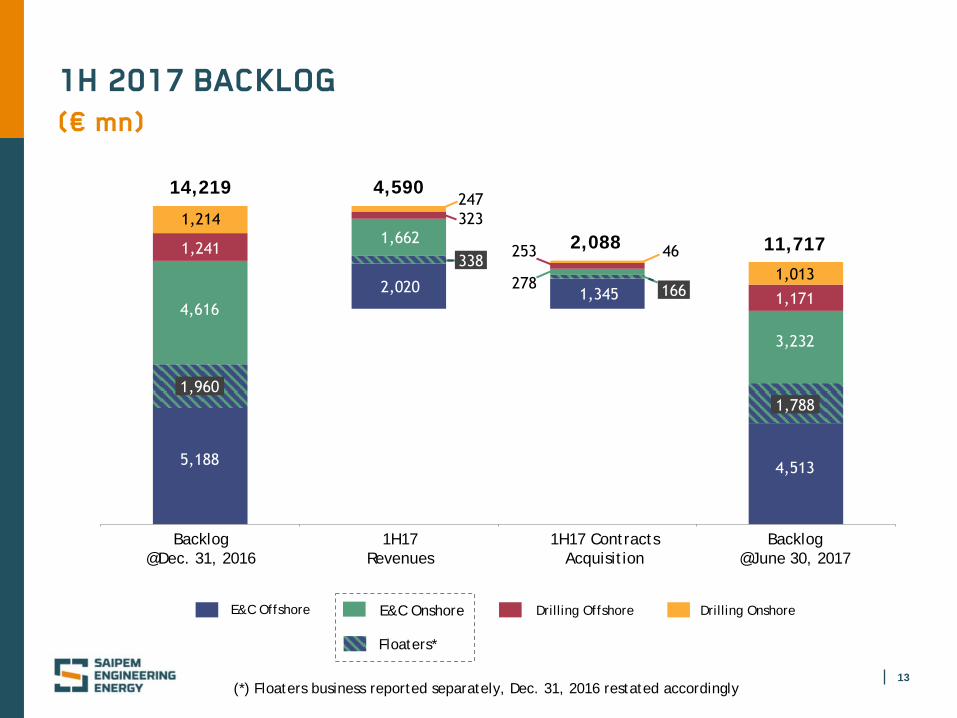
1H 2017 BACKLOG
Drilling Offshore E&C Offshore Drilling Onshore
(€ mn)
Backlog @June 30, 2017
Backlog @Dec. 31, 2016
1H17 Revenues
1H17 Contracts Acquisition
4,590
11,717 2,088
14,219
E&C Onshore
Floaters*
(*) Floaters business reported separately, Dec. 31, 2016 restated accordingly

14
BACKLOG BY YEAR OF EXECUTION (€ mn)
1,604 1,870
1,039
388 480
920
1,281
1,422
529
276
409
486
228
441
344
4,622
3,777
3,318
2017 2018 2019+
Drilling Offshore E&C Offshore Drilling Onshore E&C Onshore
Floaters*
(*) Floaters business reported separately
15
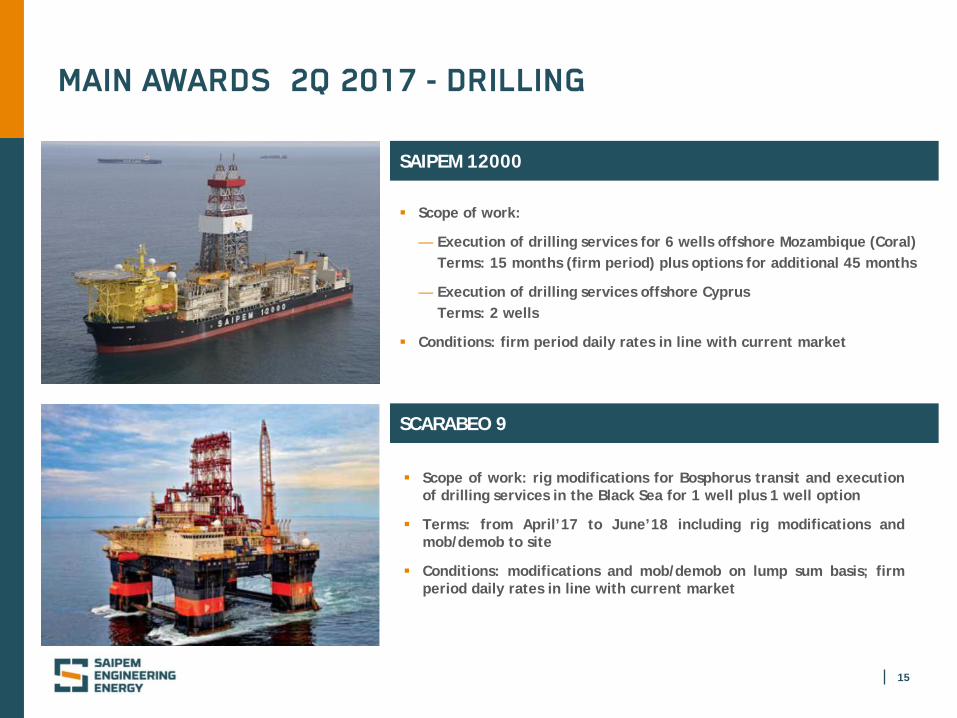
MAIN AWARDS 2Q 2017 - DRILLING
Scope of work:
— Execution of drilling services for 6 wells offshore Mozambique (Coral) Terms: 15 months (firm period) plus options for additional 45 months
— Execution of drilling services offshore Cyprus Terms: 2 wells
Conditions: firm period daily rates in line with current market
SAIPEM 12000
Scope of work: rig modifications for Bosphorus transit and execution of drilling services in the Black Sea for 1 well plus 1 well option
Terms: from April’17 to June’18 including rig modifications and mob/demob to site
Conditions: modifications and mob/demob on lump sum basis; firm period daily rates in line with current market
SCARABEO 9
16
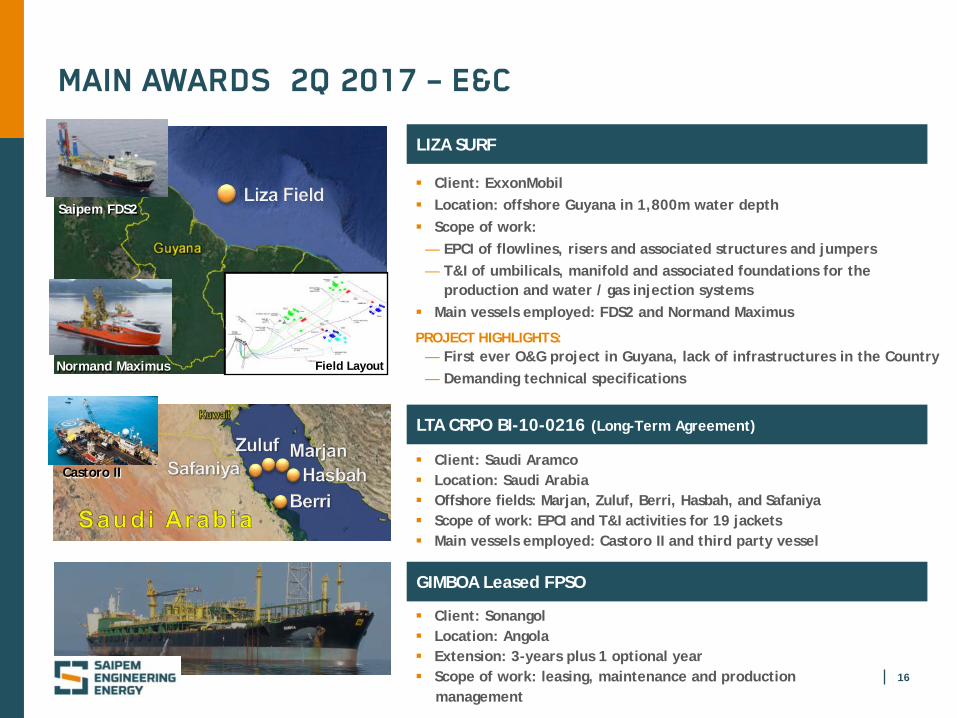
LIZA SURF
Client: ExxonMobil Location: offshore Guyana in 1,800m water depth Scope of work:
— EPCI of flowlines, risers and associated structures and jumpers — T&I of umbilicals, manifold and associated foundations for the
production and water / gas injection systems Main vessels employed: FDS2 and Normand Maximus
PROJECT HIGHLIGHTS: — First ever O&G project in Guyana, lack of infrastructures in the Country — Demanding technical specifications
LTA CRPO BI-10-0216 (Long-Term Agreement)
Client: Saudi Aramco Location: Saudi Arabia Offshore fields: Marjan, Zuluf, Berri, Hasbah, and Safaniya Scope of work: EPCI and T&I activities for 19 jackets Main vessels employed: Castoro II and third party vessel
GIMBOA Leased FPSO
Client: Sonangol Location: Angola Extension: 3-years plus 1 optional year Scope of work: leasing, maintenance and production management
Saipem FDS2
Castoro II
Normand Maximus
MAIN AWARDS 2Q 2017 – E&C
Field Layout

17
NEAR TERM E&C OPPORTUNITIES
TARGET PROJECT AWARDS IN EXCESS OF $4.0bn
Subsea
• Eni Zohr Ramp-up Phase - Egypt
• Eni West Hub - Angola
Upstream-Midstream
• ADCO BAB Integrated Facilities – Abu Dhabi
• KOC Pipelines for New Refinery Project (NRP) – Kuwait
• Saudi Aramco Hawiyah – Haradh Field Gas Compression
MMO
• CEC Phase 2 Open Cycle and O&M - Congo
Downstream
• DUQM Refinery Program – Oman
• OTTCO Ras Markaz Crude Oil Park Project - Oman
• NAOC Okpai Power Plant – Nigeria
• T.L.N.JV Arctic LNG Export Terminal FEED – Russia
Fixed Facilities
• Saudi Aramco LTA Developments – Saudi Arabia
Infrastructures
• RFI TAV Brescia Verona - Italy
18
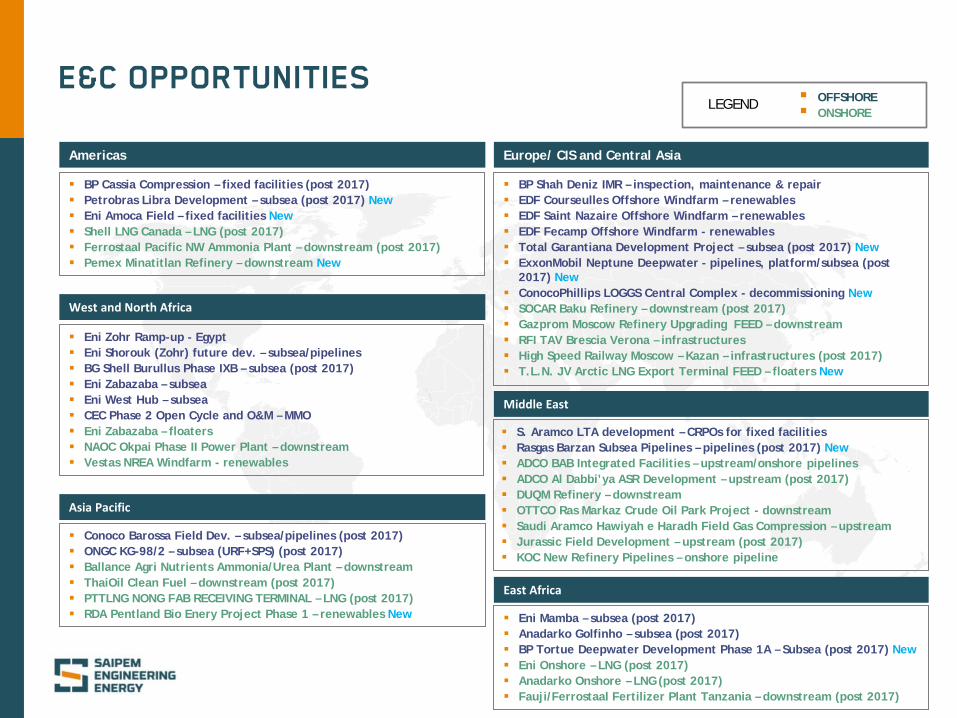
E&C OPPORTUNITIES
OFFSHORE ONSHORE
LEGEND
Eni Zohr Ramp-up - Egypt Eni Shorouk (Zohr) future dev. – subsea/pipelines BG Shell Burullus Phase IXB – subsea (post 2017) Eni Zabazaba – subsea Eni West Hub – subsea CEC Phase 2 Open Cycle and O&M – MMO Eni Zabazaba – floaters NAOC Okpai Phase II Power Plant – downstream Vestas NREA Windfarm - renewables
Middle East
West and North Africa
East Africa
Asia Pacific
Europe/ CIS and Central Asia
BP Shah Deniz IMR – inspection, maintenance & repair EDF Courseulles Offshore Windfarm – renewables EDF Saint Nazaire Offshore Windfarm – renewables EDF Fecamp Offshore Windfarm - renewables Total Garantiana Development Project – subsea (post 2017) New ExxonMobil Neptune Deepwater - pipelines, platform/subsea (post
2017) New ConocoPhillips LOGGS Central Complex - decommissioning New SOCAR Baku Refinery – downstream (post 2017) Gazprom Moscow Refinery Upgrading FEED – downstream RFI TAV Brescia Verona – infrastructures High Speed Railway Moscow – Kazan – infrastructures (post 2017) T.L.N. JV Arctic LNG Export Terminal FEED – floaters New
S. Aramco LTA development – CRPOs for fixed facilities Rasgas Barzan Subsea Pipelines – pipelines (post 2017) New ADCO BAB Integrated Facilities – upstream/onshore pipelines ADCO Al Dabbi’ya ASR Development – upstream (post 2017) DUQM Refinery – downstream OTTCO Ras Markaz Crude Oil Park Project - downstream Saudi Aramco Hawiyah e Haradh Field Gas Compression – upstream Jurassic Field Development – upstream (post 2017) KOC New Refinery Pipelines – onshore pipeline
Conoco Barossa Field Dev. – subsea/pipelines (post 2017) ONGC KG-98/2 – subsea (URF+SPS) (post 2017) Ballance Agri Nutrients Ammonia/Urea Plant – downstream ThaiOil Clean Fuel – downstream (post 2017) PTTLNG NONG FAB RECEIVING TERMINAL – LNG (post 2017) RDA Pentland Bio Enery Project Phase 1 – renewables New
Americas
BP Cassia Compression – fixed facilities (post 2017) Petrobras Libra Development – subsea (post 2017) New Eni Amoca Field – fixed facilities New Shell LNG Canada – LNG (post 2017) Ferrostaal Pacific NW Ammonia Plant – downstream (post 2017) Pemex Minatitlan Refinery – downstream New
Eni Mamba – subsea (post 2017) Anadarko Golfinho – subsea (post 2017) BP Tortue Deepwater Development Phase 1A – Subsea (post 2017) New Eni Onshore – LNG (post 2017) Anadarko Onshore – LNG (post 2017)
Fauji/Ferrostaal Fertilizer Plant Tanzania – downstream (post 2017)
19
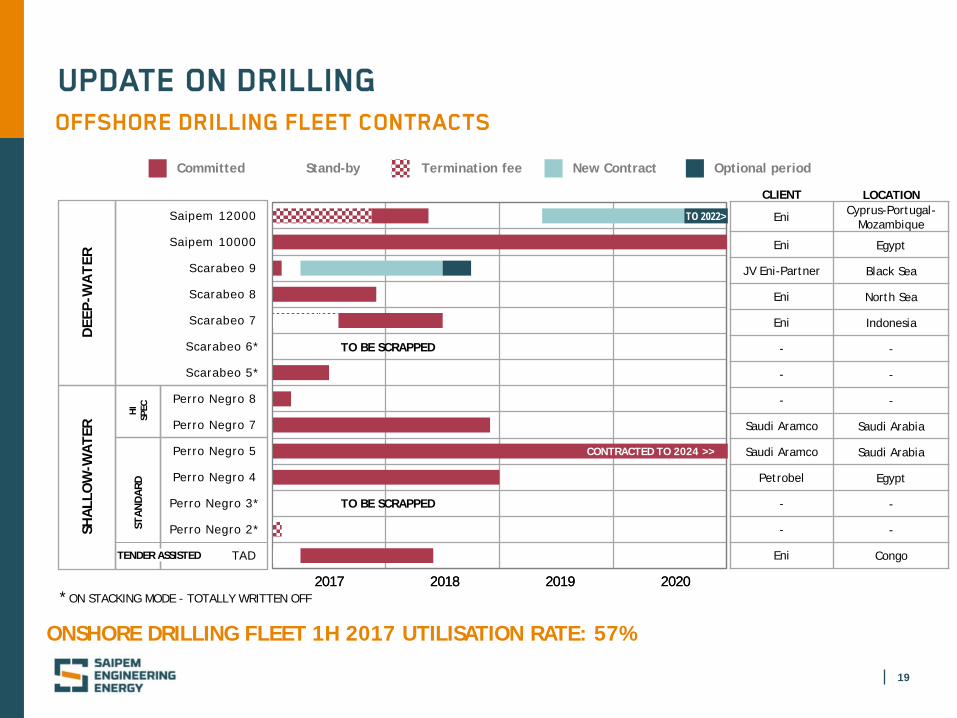
UPDATE ON DRILLING
2017 2018 2019 2020
OFFSHORE DRILLING FLEET CONTRACTS
ONSHORE DRILLING FLEET 1H 2017 UTILISATION RATE: 57%
CLIENT LOCATION
Eni Cyprus-Portugal-Mozambique
Eni Egypt
JV Eni-Partner Black Sea
Eni North Sea
Eni Indonesia
- -
- -
- -
Saudi Aramco Saudi Arabia
Saudi Aramco Saudi Arabia
Petrobel Egypt
- -
- -
Eni Congo
Saipem 12000
Saipem 10000
Scarabeo 9
Scarabeo 8
Scarabeo 7
Scarabeo 6*
Scarabeo 5*
Perro Negro 8
Perro Negro 7
Perro Negro 5
Perro Negro 4
Perro Negro 3*
Perro Negro 2*
TAD
2017 2018 2019 2020
Stand-by Committed
CONTRACTED TO 2024 >>
Termination fee New Contract
* ON STACKING MODE - TOTALLY WRITTEN OFF
DEE
P-W
AT
ER
SHA
LLO
W-W
ATE
R
HI
SPEC
ST
AN
DA
RD
TENDER ASSISTED
TO BE SCRAPPED
TO BE SCRAPPED
Optional period
TO 2022>
20
FIT FOR THE FUTURE
21
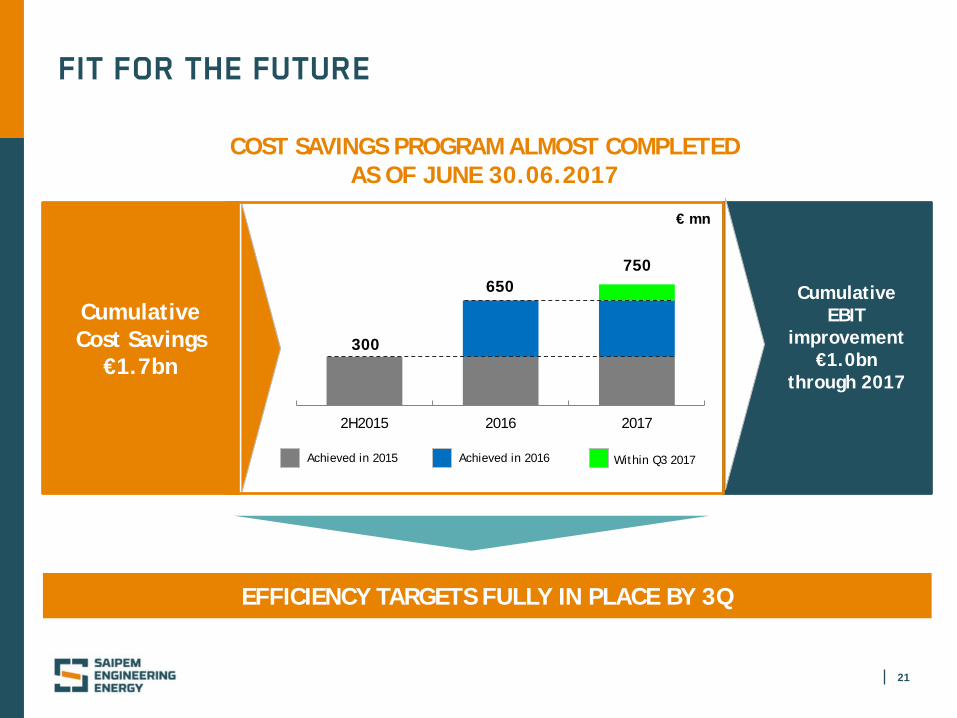
FIT FOR THE FUTURE
Cumulative Cost Savings
€1.7bn
Cumulative EBIT
improvement €1.0bn
through 2017
2H2015 2016 2017
750 650
300
€ mn
Achieved in 2015 Achieved in 2016 Within Q3 2017
COST SAVINGS PROGRAM ALMOST COMPLETED AS OF JUNE 30.06.2017
EFFICIENCY TARGETS FULLY IN PLACE BY 3Q
22
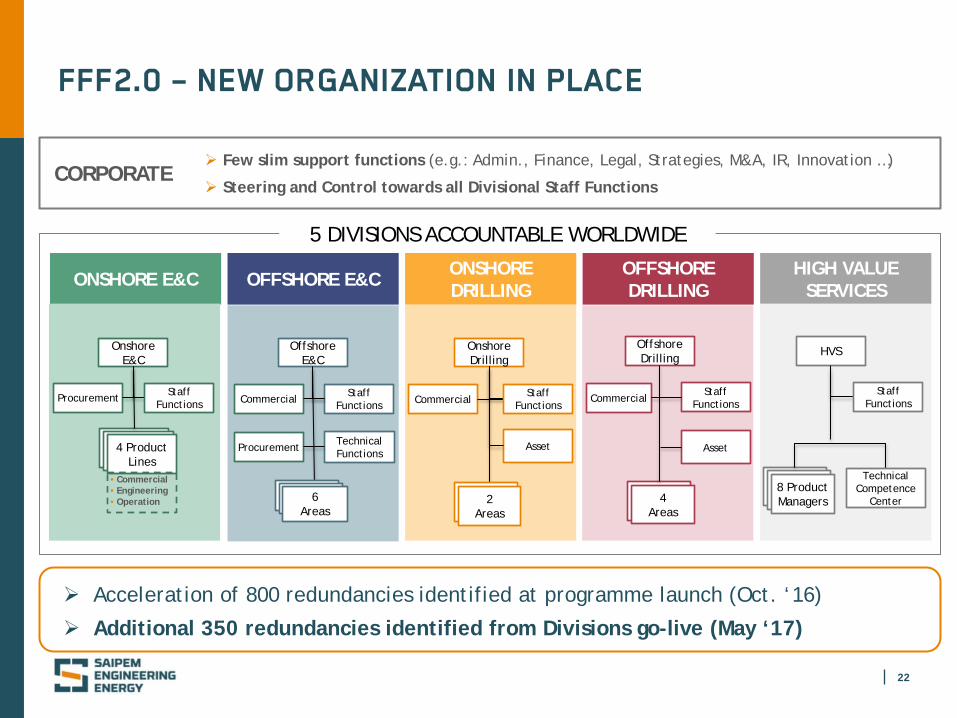
FFF2.0 – NEW ORGANIZATION IN PLACE
CORPORATE Few slim support functions (e.g.: Admin., Finance, Legal, Strategies, M&A, IR, Innovation …)
Steering and Control towards all Divisional Staff Functions
Acceleration of 800 redundancies identified at programme launch (Oct. ‘16)
Additional 350 redundancies identified from Divisions go-live (May ‘17)
ONSHORE E&C OFFSHORE E&C ONSHORE DRILLING
OFFSHORE DRILLING
HIGH VALUE SERVICES
5 DIVISIONS ACCOUNTABLE WORLDWIDE
Onshore E&C
4 Product Lines
Offshore E&C
Staff Functions
Technical Functions
Onshore Drilling
Asset
Offshore Drilling
4 Areas
HVS
8 Product Managers
Technical Competence
Center
Procurement Commercial
Procurement
Commercial Staff
Functions
Asset
Commercial Staff
Functions
• Commercial • Engineering • Operation
Staff Functions
Staff Functions
6 Areas
2 Areas
23
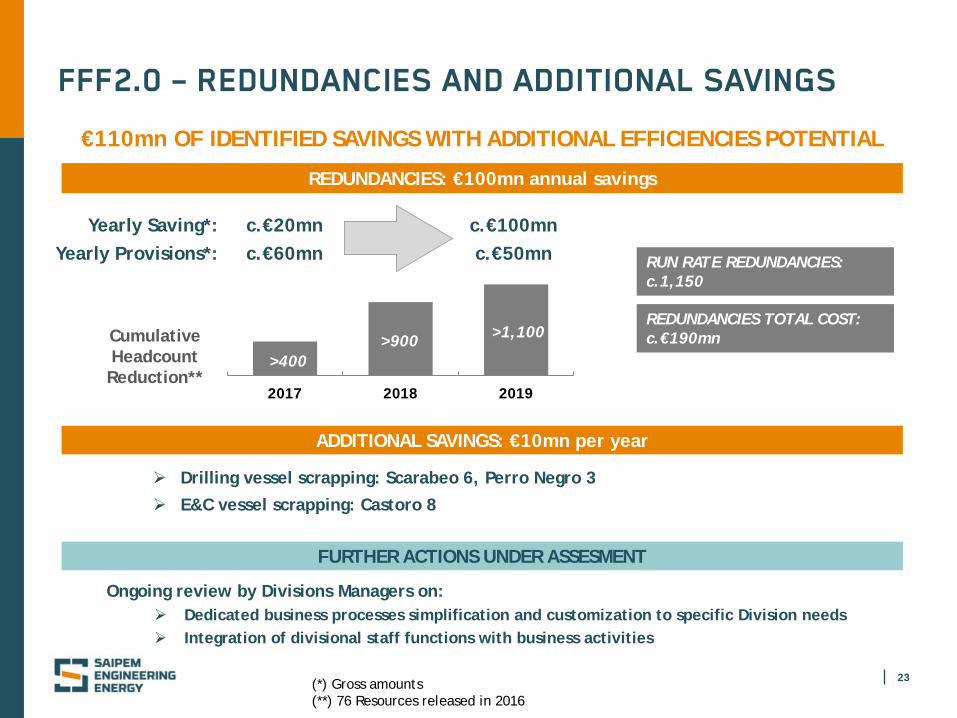
FFF2.0 – REDUNDANCIES AND ADDITIONAL SAVINGS
Drilling vessel scrapping: Scarabeo 6, Perro Negro 3
E&C vessel scrapping: Castoro 8
REDUNDANCIES: €100mn annual savings
Ongoing review by Divisions Managers on: Dedicated business processes simplification and customization to specific Division needs Integration of divisional staff functions with business activities
ADDITIONAL SAVINGS: €10mn per year
€110mn OF IDENTIFIED SAVINGS WITH ADDITIONAL EFFICIENCIES POTENTIAL
FURTHER ACTIONS UNDER ASSESMENT
(*) Gross amounts (**) 76 Resources released in 2016
2017 2018 2019
c.€100mn
>400 >900 >1,100
c.€20mn
Cumulative Headcount Reduction**
Yearly Saving*: Yearly Provisions*: c.€50mn c.€60mn RUN RATE REDUNDANCIES:
c.1,150
REDUNDANCIES TOTAL COST: c.€190mn
24
CLOSING REMARKS AND GUIDANCE
25
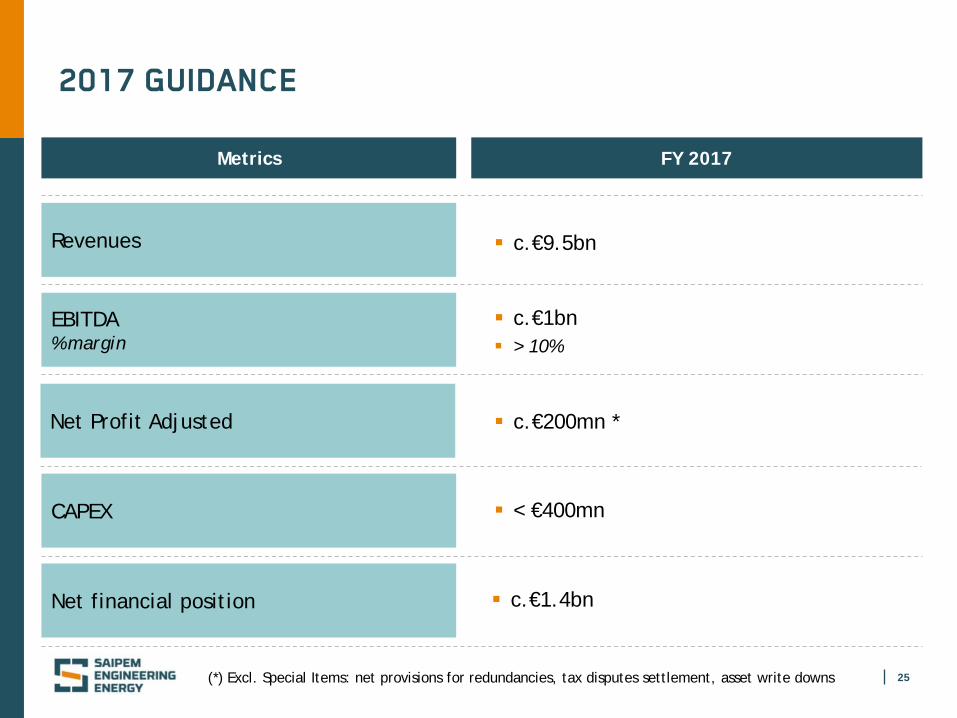
2017 GUIDANCE
Metrics FY 2017
Revenues
CAPEX
Net financial position
c.€9.5bn
Net Profit Adjusted c.€200mn *
EBITDA % margin
c.€1bn > 10%
< €400mn
c.€1.4bn
(*) Excl. Special Items: net provisions for redundancies, tax disputes settlement, asset write downs
26
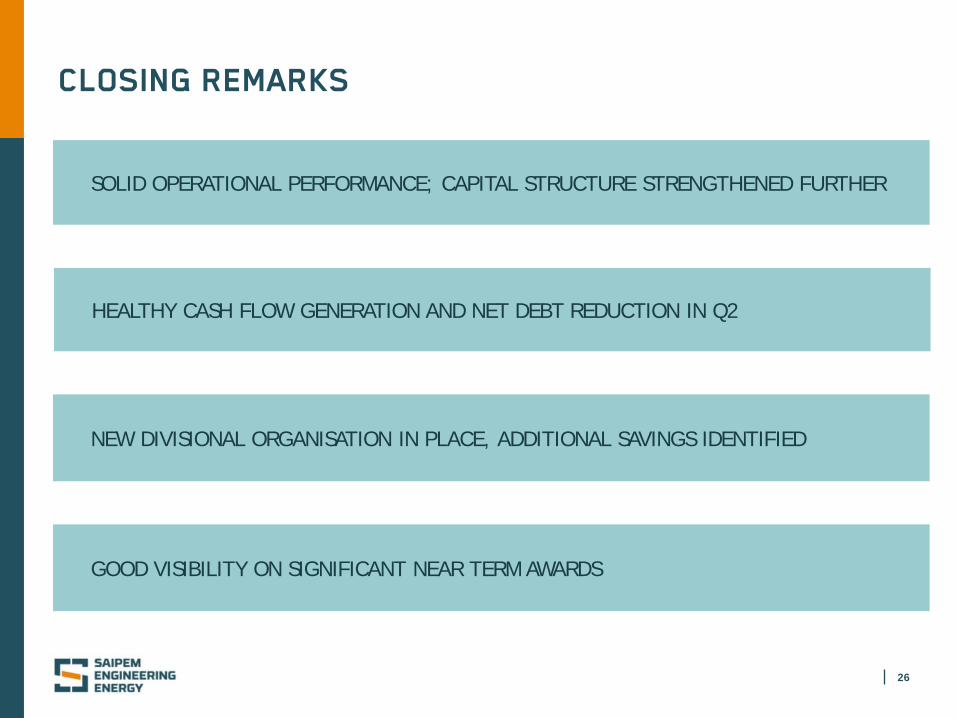
CLOSING REMARKS
NEW DIVISIONAL ORGANISATION IN PLACE, ADDITIONAL SAVINGS IDENTIFIED
GOOD VISIBILITY ON SIGNIFICANT NEAR TERM AWARDS
SOLID OPERATIONAL PERFORMANCE; CAPITAL STRUCTURE STRENGTHENED FURTHER
HEALTHY CASH FLOW GENERATION AND NET DEBT REDUCTION IN Q2
27
APPENDIX
28
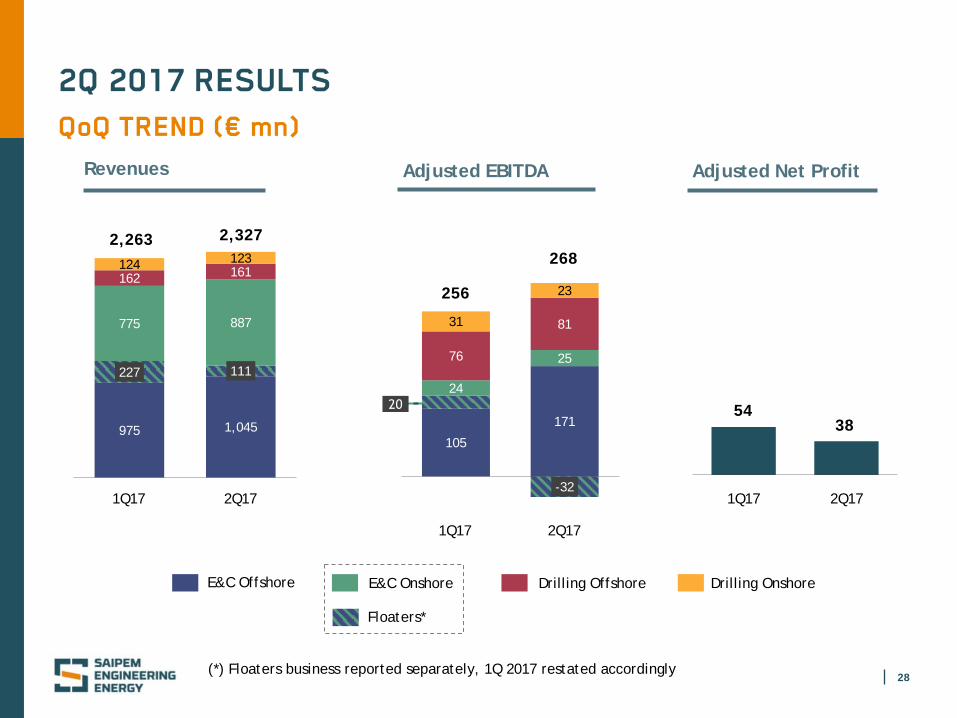
2Q 2017 RESULTS QoQ TREND (€ mn)
2Q17 1Q17
Revenues Adjusted EBITDA Adjusted Net Profit
2Q17 1Q17
38 54
E&C Onshore Drilling Offshore E&C Offshore Drilling Onshore
Floaters*
975 1,045
227 111
775 887
162 161 124 123
2,327 2,263
105
171
-32
24
25 76
81 31
23
268
256
2Q17 1Q17
(*) Floaters business reported separately, 1Q 2017 restated accordingly
29
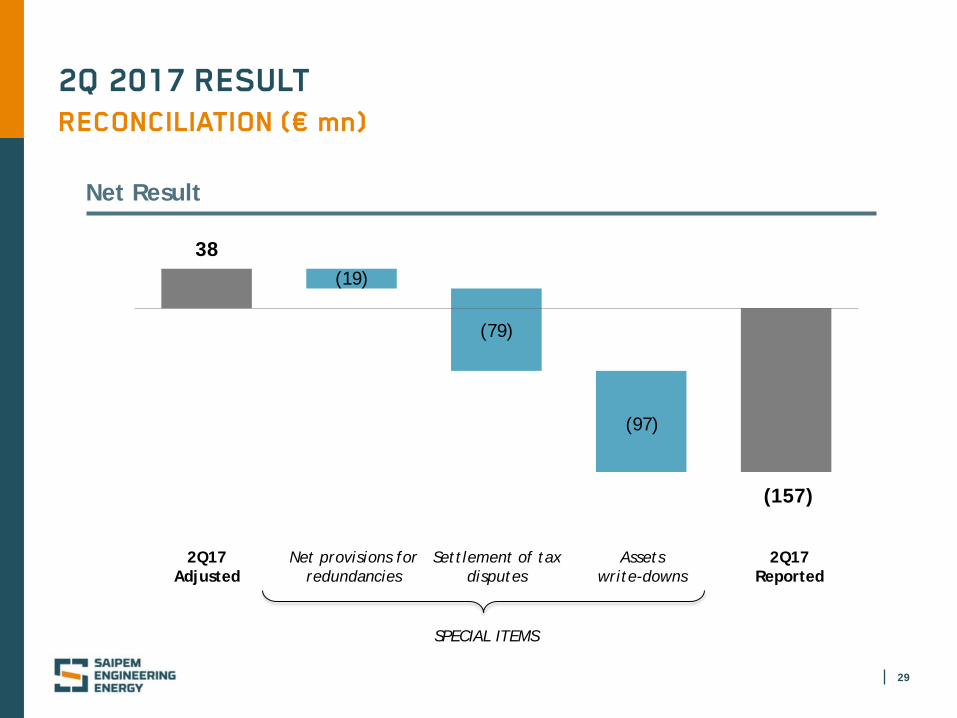
2Q 2017 RESULT RECONCILIATION (€ mn)
2Q17 Adjusted
Net provisions for redundancies
Settlement of tax disputes
2Q17 Reported
38 (19)
(79)
(157)
SPECIAL ITEMS
Assets write-downs
(97)
Net Result