first half of the fiscal year ending december 31, 2012 ... half of the fiscal year ending december...
TRANSCRIPT
First Half of the Fiscal Year Ending December 31, 2012
Management Report
Lion CorporationItsuo Hama, Representative Director and President, Executive Officer
August 3, 2012

2

3
Basic Policies for FY2012
The first year of “V-1 Plan”Four Strategies
Establish a medium-term growth trajectory/Strengthen earnings platform
1.Qualitative Growth of Domestic Businesses1.Qualitative Growth of Domestic Businesses
2.Quantitative Expansion of Overseas Businesses2.Quantitative Expansion of Overseas Businesses
3.Development of New Business Value3.Development of New Business Value
4.Enhancement of Organizational Learning Capabilities4.Enhancement of Organizational Learning Capabilities

Business Results for the First Half of Fiscal 2012

5
(US$/BBL) (RM/t)
Business Environment for the First Half of 20121. Trends in raw material prices
Crude oil (Dubai) Crude palm oil (Malaysia)
RM3,480/ton
$106/BBL
Jan. to Jun.FY2011 (actual)
(6.9%)
+5.4%
Y-on-YChange(%)
Jan. to Jun.FY2012 (actual)
Expected average annual price at the
beginning of FY2012Raw material
RM3,240/ton
$111/BBL
RM3,200/ton
$100/BBL
Crude palm oil
Crude oil
0
20
40
60
80
100
120
140
1/08 1/09 1/10 1/11 1/120
500
1000
1500
2000
2500
3000
3500
4000
4500
1/08 1/09 1/10 1/11 1/12

6
Stronger yen
Weaker yen
2. Exchange rate fluctuations
¥0.0749
¥2.68
¥81.8
Jan. to Jun.FY2011 (actual)
2.6% (strong yen)¥79.7¥78.0US$
4.5% (strong yen)¥2.56¥2.50Thai Baht
¥0.0650
Expected average annual price at the
beginning of FY2012
¥0.0698
Jan. to Jun.FY2012 (actual)
6.8% (strong yen)Korean Won
Y-on-YChange(%)Currency Currency rate
fluctuations caused a sales decrease
¥1.3 billion
-20
-10
0
10
20
Jan-11
Feb-11
Mar-
11
Apr-
11
May-
11
Jun-11
Jul-
11
Aug-11
Sep-11
Oct-
11
Nov-
11
Dec-11
Jan-12
Feb-12
Mar-
12
Apr-
12
May-
12
Jun-12
US$
Thai Baht
Korean Won
Jan 2011 = standard
Business Environment for the First Half of 2012

7
97
98
99
100
101
102
103
104
FY2007 FY2008 FY2009 FY2010 FY2011 1H FY2012
97
98
99
100
101
102
103
104
105
106
107
Dec-11 Jan-12 Feb-12 Mar-12 Apr-12 May-12 Jun-12
Annual trends Monthly trends in 1H of FY2012(%)(%)
3. Trends in Domestic Home Products Markets Trends in the total of 42 home product markets in which Lion participates (percentage of previous year’s results)
(Source: INTAGE Inc. SRI Survey) *44 markets until FY2010
No. of units
Amount
Unit priceUnit price
No. of units
Amount
Business Environment for the First Half of 2012

8
90
92
94
96
98
100
102
104
106
108
110
FY2007 FY2008 FY2009 FY2010 FY2011 1HFY2012
Unit price
Amount
No. of unit
(%)
4.Monthly Trends in Domestic OTC Drug Markets Trends in the total of 8 OTC Drug markets in which Lion participates (percentage of previous year’s results.)
(Source: Lion)
Business Environment for the First Half of 2012

9
(unit: ¥100 million)
Y-on-YChange
(%)
Y-on-YChange
(%)
Y-on-YChange
15.0
1.0
30.0
1.9
25.0
1.6
1,550.0
Jan.-Jun.FY2012
(forecast)
70.0
2.1
130.0
3.9
120.0
3.6
3,350.0
FY2012(forecast)
Y-on-YChange
FY2011(actual)
Jan.-Jun.FY2011
29.2
8.1
8.3
74.9
71.7
6.7
7.4
2.3
0.4
0.0
40.1
2.7
33.2
2.2
1,514.7
3,025.514.540.7
1.2
Net Income
% of Sales
(25.3)(10.1)121.8
3.7
Ordinary Income% of Sales
(24.8)(8.2)111.6
3.4
Operating Income% of Sales
2.335.23,275.0Net Sales
FY2012 Consolidated Financial Forecast
Full-year revenue and earnings are expected to increase. Although net sales are anticipated to rise, operating income is forecast to decline due to new product releases, brand cultivation and priority investment mainly for proactive advertising to promote Lion’s new corporate message in the first half. Net income is expected to grow due to the absence of a loss on disaster.
Forecast announced on February 10, 2012

10
(22.6)
(5.6)
(10.0)
3.1
Change from forecast
announced on Feb,10, 2012(%)
(3.3)ー11.10.4
0.0
11.6
0.7
Net Income
% of Sales
(1.6)(29.5)(11.8)40.1
2.7
28.3
1.8
Ordinary Income% of Sales
(2.4)(32.3)(10.7)33.2
2.2
22.5
1.4
Operating Income% of Sales
48.75.583.91,514.71,598.7Net Sales
Change from forecast
announced on Feb,10,
2012
Y-on-YChange
(%)
Y-on-YChange
Jan.-Jun.FY2011
Jan.-Jun.FY2012
(unit: ¥100 million)
Financial HighlightsNet Sales and Profits
◇ Net sales exceeded announced figures thanks to favorable domestic and overseas consumerproduct sales
◇Operating income was below announced figures mainly due to increased competition costs, reflecting intensifying competition in stores.

11
Financial HighlightsYear-on-year changes in consolidated operating income
(unit: ¥ 100 million)
33
22
+18
(7)
(1)
(30)
+9
0 10 20 30 40 50 60 70
Operating income for Jan-Jun 2012
Crude oil and vegetable oil
prices
Other expenses
Competition costs
Total cost reduction efforts
(manufacturing and logistics
costs, etc.)
Sales, productmix and others
Operating income for Jan-Jun 2011
Operating income fell ¥1.1. billion year on year due to an increase in competition costs amid intensifying competition in stores. This decrease occurred despite higher sales, comprehensive cost reduction efforts and the absence of loss on disaster following last yearʼs earthquake.

12
Y-on-Ychange(%)
Y-on-Ychange(%)
Net sales Segment income (operating income)
Jan.-Jun.FY2012
Jan.-Jun.FY2011
Y-on-Ychange
Jan.-Jun.FY2012
Jan.-Jun. FY2011
Y-on-Ychange
ConsumerProducts 1,268.1 1,192.7 75.3 6.3 9.3 20.5 (11.2) (54.8)
IndustrialProducts 242.4 249.1 (6.7) (2.7) 0.4 4.6 (4.1) (89.7)
Overseas 283.1 266.8 16.2 6.1 8.7 3.2 5.5 169.4
Other 143.8 117.9 25.8 21.9 4.8 2.7 2.1 77.9
Subtotal 1,937.5 1,826.7 110.7 6.1 23.3 31.1 (7.8) (25.1)
Adjustment (338.7) (311.9) (26.8) - (0.8) 2.0 (2.9) -
Consolidatedtotal 1,598.7 1,514.7 83.9 5.5 22.5 33.2 (10.7) (32.3)
(unit: ¥ 100 million)
Financial Highlights
Consumer Products Business: Despite higher net sales, operating income decreased due to the negative impact of last year’s disaster and intensifying competition.
Industrial Products Business: Revenues and earnings declined because of lower industrial demand.Overseas Business: Performance remained favorable (11.0% in terms of real sales based on local
currencies).
Results by business segment
Net sales include internal net sales within and among segments.

13
Consumer Products:Year-on-year change 6.3%
◇Oral Care Products:Y-o-Y change 18.4%Clinica and Dentor Systema brands, under which new products were released, experienced strong sales. Sales of the high-end toothpaste Dent Health rose 109% compared withthe same period of the previous fiscal year.
◇Beauty Care Products : Y-o-Y change (7.3%)Despite firm sales for hand soaps, antiperspirant and deodorant sales fell year on year due to the negative impactof ongoing lower-than-average temperatures.
◇Pharmaceutical Products: Y-o-Y change (3.5%)Sales of insecticides (pharmaceutical products) and eye drops fell compared with the same period of the previous fiscal year because of market shrinkage and intensifying competition in stores.
Results by Business Segment

14
Consumer Products
◇Fabric Care Products : Y-o-Y change 5.2%Although powder laundry detergent sales fell year on year due tointensifying competition in stores, sales were favorable for fabric softenersand liquid laundry detergents.
◇Living Care Products : Y-o-Y change (4.1%)Sales of household cleaners and dishwashing detergents both decreased
year on year because of intensifying competition in stores.
◇Other : Y-o-Y change 17.4%Overall sales increased substantially year on year owing to strong sales of direct-to-consumer products and pet supplies as well as a recovery in giftproduct sales.
Results by Business Segment

15
Industrial Products Busuness: Y-o-Y change (2.7%)In chemical products, sales of activators derived from oils and fats wereimpacted by the strong yen and intensifying competition, whileelectro-conductive carbon sales were weak amid sluggish industrial demand.In detergents for industrial use, sales of alcohol sanitizers for kitchenswere strong.
Overseas Business: Y-o-Y change 6.1%(up 11.0% based on a local currency basis)
Overall sales enjoyed a double-digit increase (local currency basis) thanksto favorable sales of detergents in Thailand and oral care productsin China. Thailand:Sales of Pao laundry detergent and dishwashing detergent were
favorableSouth Korea:Sales were steady mainly due to Chamgreen capturing
the No.1 dishwashing detergent brand share. China:Sales were robust for Systema toothbrushes and and Zact toothpasteHong Kong:Laundry detergent market share increased thanks to the release
of TOP NANOX
Results by Business Segment

Measures for the Second Half of FY2012 and Progress during the First Year of the
“V-1 Plan” Medium-Term Management Plan
17
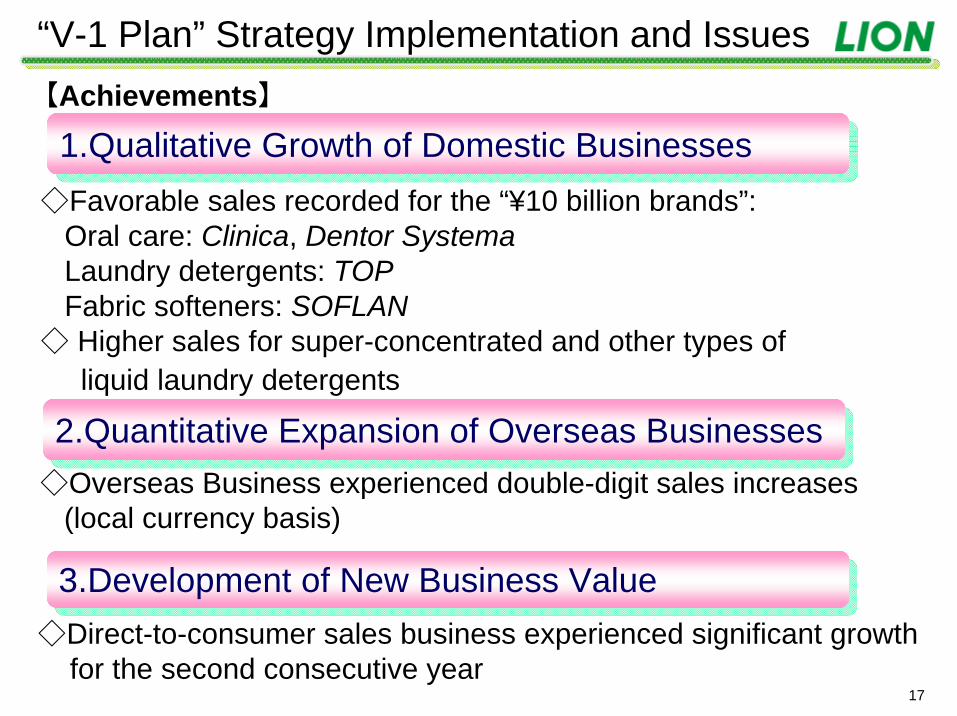
◇Direct-to-consumer sales business experienced significant growthfor the second consecutive year
1.Qualitative Growth of Domestic Businesses1.Qualitative Growth of Domestic Businesses
2.Quantitative Expansion of Overseas Businesses2.Quantitative Expansion of Overseas Businesses
3.Development of New Business Value3.Development of New Business Value
◇Favorable sales recorded for the “¥10 billion brands”:Oral care: Clinica, Dentor SystemaLaundry detergents: TOPFabric softeners: SOFLAN
◇ Higher sales for super-concentrated and other types ofliquid laundry detergents
◇Overseas Business experienced double-digit sales increases (local currency basis)
“V-1 Plan” Strategy Implementation and Issues【Achievements】
18
Net sales ratio basis
Promotion expenses
Net sales ratio basis
Advertising expenses
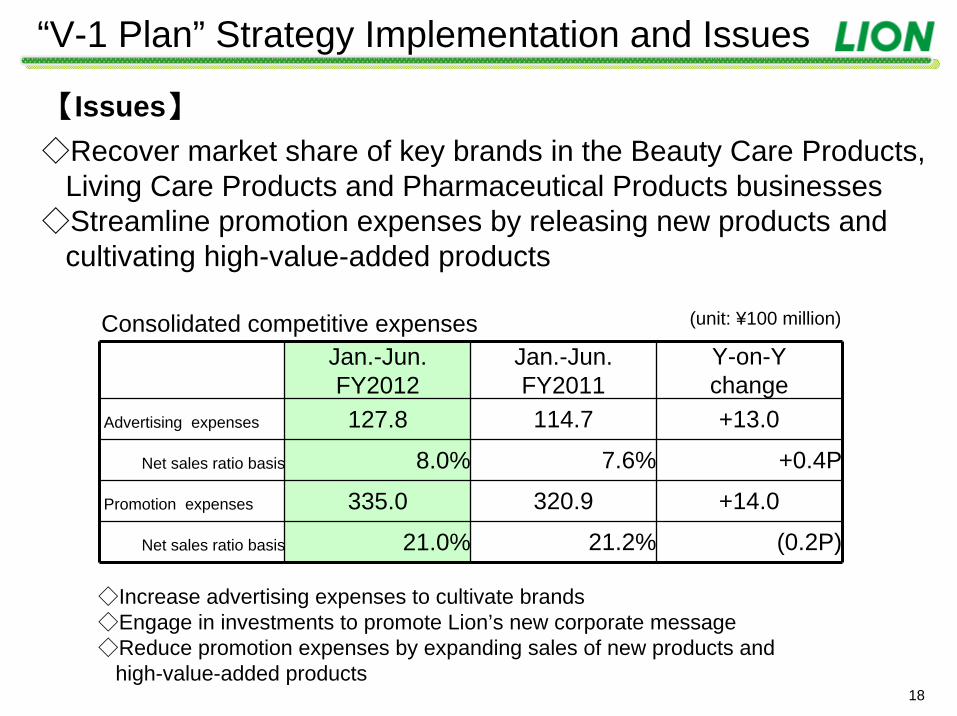
21.0%
335.0
8.0%
127.8
Jan.-Jun.FY2012
21.2%
320.9
7.6%
114.7
Jan.-Jun.FY2011
(0.2P)
+14.0
+0.4P
+13.0
Y-on-Ychange
◇Increase advertising expenses to cultivate brands◇Engage in investments to promote Lion’s new corporate message ◇Reduce promotion expenses by expanding sales of new products and
high-value-added products
◇Recover market share of key brands in the Beauty Care Products,Living Care Products and Pharmaceutical Products businesses
◇Streamline promotion expenses by releasing new products andcultivating high-value-added products
Consolidated competitive expenses (unit: ¥100 million)
【Issues】
“V-1 Plan” Strategy Implementation and Issues

19
Qualitative Growth of Domestic Businesses Oral Care Products
◇Strong sales of new products under the ¥10 Billion Brands:Clinica and Dentor Systema
◇Sales of the high-end toothpaste Dent Health rose 109% compared withthe corresponding period of the previous fiscal year
Dentor SystemaClinica
Toothpaste: Clinica Enamel PearlToothbrush: Clinica Flat Cut
Clinica 3D Cut
Projection comparison129%
Toothbrush:Dentor Systema Haguki PlusSoft type
Projection comparison134%

20
PLALANew releasesin September
platiusLineup expansion
New releases in August
Qualitative Growth of Domestic Businesses Oral Care Products
Issue: Further strengthen products in the mid- to high-end price rangeSecond half initiative: Strengthen toothpaste lineups in the mid- to high-endprice range
21
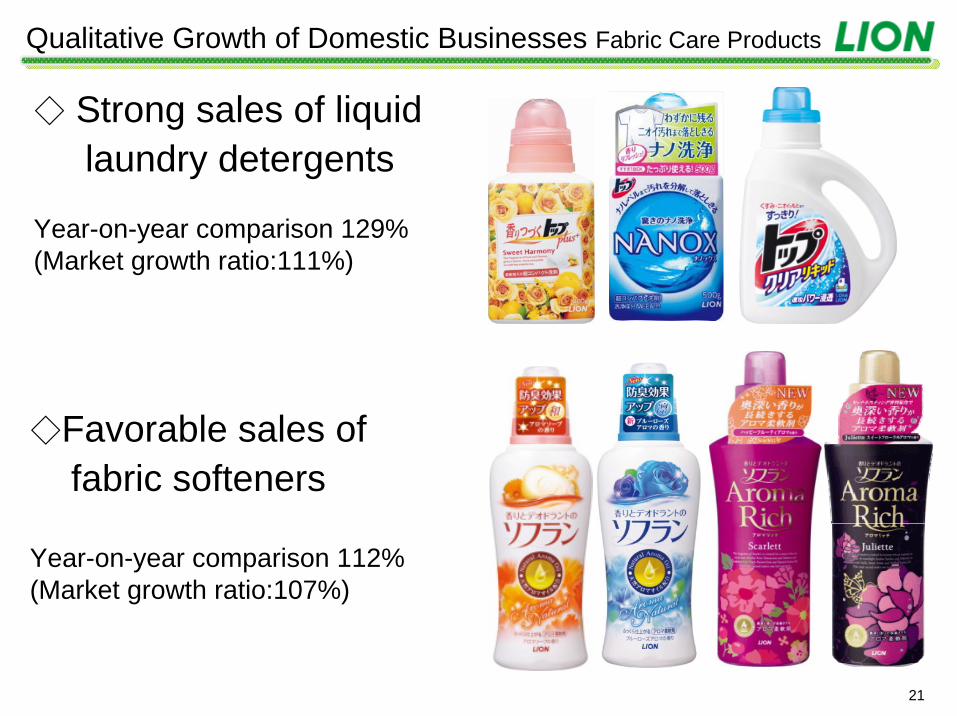
◇ Strong sales of liquid laundry detergents
Year-on-year comparison 129%(Market growth ratio:111%)
◇Favorable sales of fabric softeners
Year-on-year comparison 112%(Market growth ratio:107%)
Qualitative Growth of Domestic Businesses Fabric Care Products

22
TOP HYGIANew release in July
Kaori to Deodorant no SOFLAN(SOFLAN with Fragrance and Deodorant) Aroma Rich
Fragrance MistNew release in September
Qualitative Growth of Domestic Businesses Fabric Care Products
Issue: Strengthen sales of liquid laundry detergents while regainingmarket share for powder laundry detergents
Second half initiatives:Enhance super-concentrated liquid laundry detergent lineupsCultivate and bolster the SOFLAN brand
23
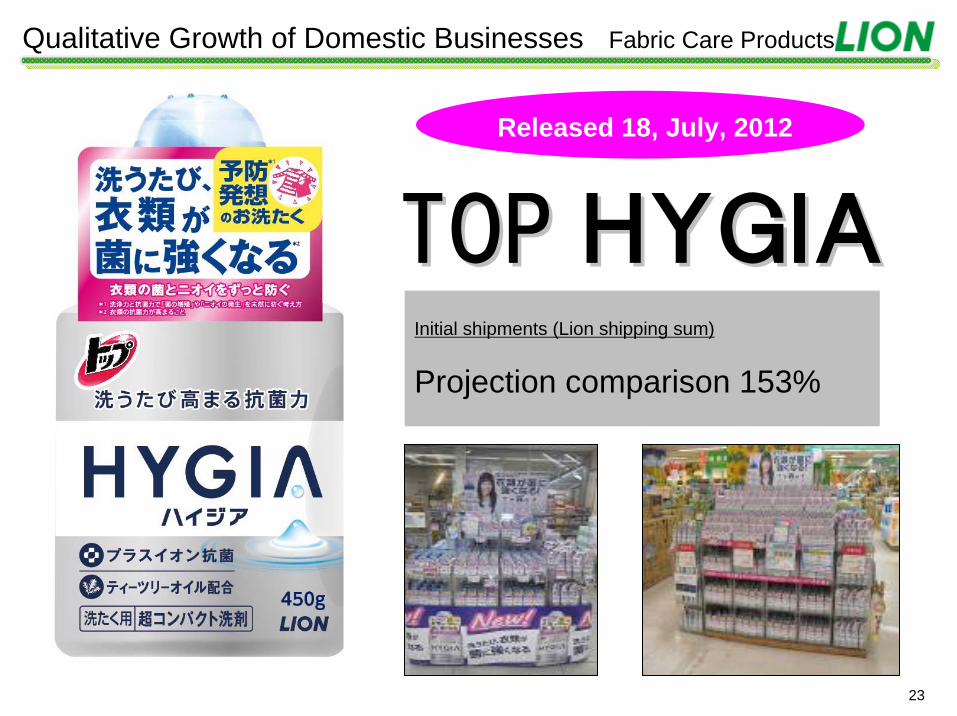
TOP TOP HYGIAHYGIAInitial shipments (Lion shipping sum)
Projection comparison 153%
Qualitative Growth of Domestic Businesses Fabric Care Products
Released 18, July, 2012

24
Powder detergents35%
Conventionalliquid detergent
35%
Super-concentratedliquid detergents
25%
Super-concentratedliquid detergents
50%
Conventional liquid detergent
15%
Powder detergents30%
Category composition ratio(forecast)FY2012 FY2015
IncreaseIncrease
Become the No.1 company in liquid laundry detergents
Laundry Detergent Market Outlook and Strategy

25
TOP HYGIADetergent that prevents bacteria growth and odors on clothing
TOP NANOXHigh-detergency detergent
Kaori Tsuzuku(Long-Lasting Fragrance) TOP plus Detergent featuring a pleasantly long-lasting fragrance
Pleasant 《Fragrance, softness》
Clean, refreshing《Detergency》
Hygiene & comfort《Antibacterial properties》
Category
Laundry Detergent Market Outlook and Strategy
Offer three super-concentrated detergent varieties to meet consumer detergent needs
26
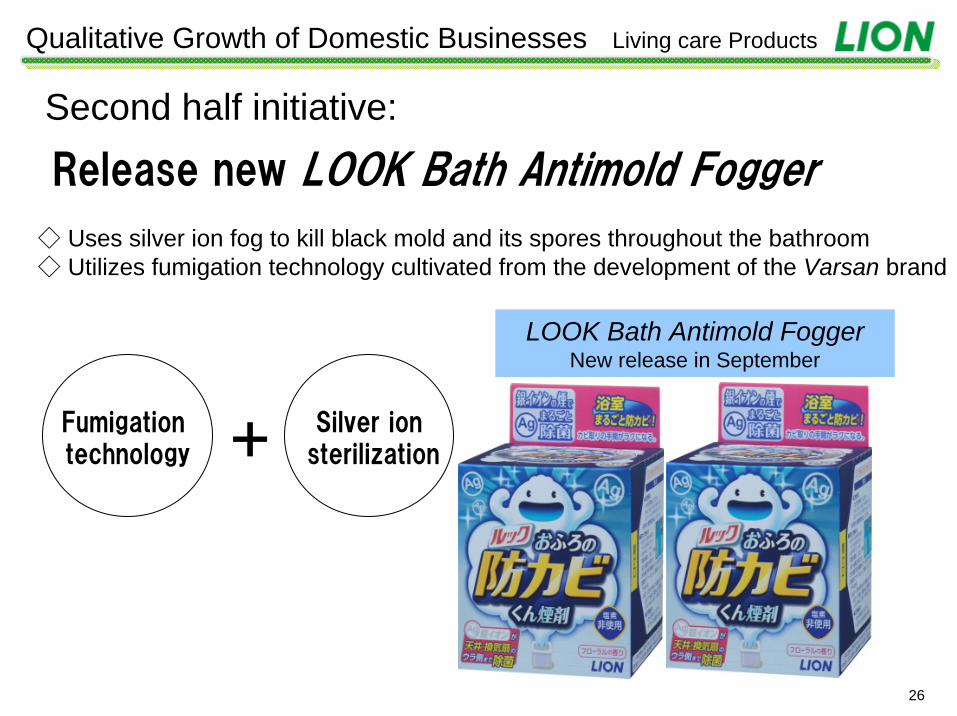
LOOK Bath Antimold FoggerNew release in September
Qualitative Growth of Domestic Businesses Living care Products
Second half initiative:
Release new LOOK Bath Antimold Fogger
◇ Uses silver ion fog to kill black mold and its spores throughout the bathroom◇ Utilizes fumigation technology cultivated from the development of the Varsan brand
Fumigation technology
Silver ionsterilization+

27
30
40
50
60
70
FY2008 FY2009 FY2010 FY2011 1H
FY2012
Foam
Liquid
(%)
Qualitative Growth of Domestic Businesses Beauty care Products
(Source: INTAGE Inc. SRI Survey, based on monetary amounts)
Second half initiative:Expand lineup of KireiKirei Medicated Foaming Hand Soap (September)
Proportion of sales

28
◇ New products cultivated in the second
◇Continue investing in the marketing of theBUFFERIN brand
Qualitative Growth of Domestic Businesses Pharmaceutical Products
Second half initiative:

29
◇Increase sales channels for electro-conductivecarbon black products for rechargeable battery applications
◇Products experiencing high demand for post-disaster reconstruction: Strengthen sales of Soil stabilizers, repairing materials and superplasticizers for concrete
◇Develop Asian markets: PT. IPPOSHA INDONESIA,LION IDEMITSU COMPOSITES INDIA PVT. LTD
Qualitative Growth of Domestic Businesses Industrial products
Chemical Products
◇ Capture demand from hospitals and othernew users
Detergents for Institutional-Use
Second half initiative:

30
◇Double-digit sales increase (local currency basis)
ThailandPao laundry detergent Favorable sales Year-on-year change
109%
Hong KongNANOX laundry detergentFavorable salesIncreased share of the laundry detergent market
South KoreaChamgreen dishwashing detergent Favorable sales
Captured No. 1 brand sharein the first half of 2012
ChinaSYSTEMA toothbrushFavorable sales
Quantitative Expansion of Overseas Businesses
Year-on-year change
135%

31
Quantitative Expansion of Overseas Businesses
Area expansion(Commence sales in the Philippines and Vietnam)
Boost production capacity
MalaysiaCompletion of laundry detergent
drying towerCommences operations in second half of 2012
PhilippinesSigning ceremony formalizing the
establishment of Peerless LionCommences operations in second half of 2012

32
Development of New Business Value
New product:
Released 17, May
Tomatosu+MilkPeptide Seikatsu
Direct-to-consumer sales channelsRecorded strong sales of such products as Nice rim essence Lactoferrinand accelerate growth in the future

Fiscal 2012 Consolidated Financial Forecast
34
FY2012Forecast
(Feb.10.2012)
Jan-JunFY2012Actual
Jul-DecFY2012Forecast
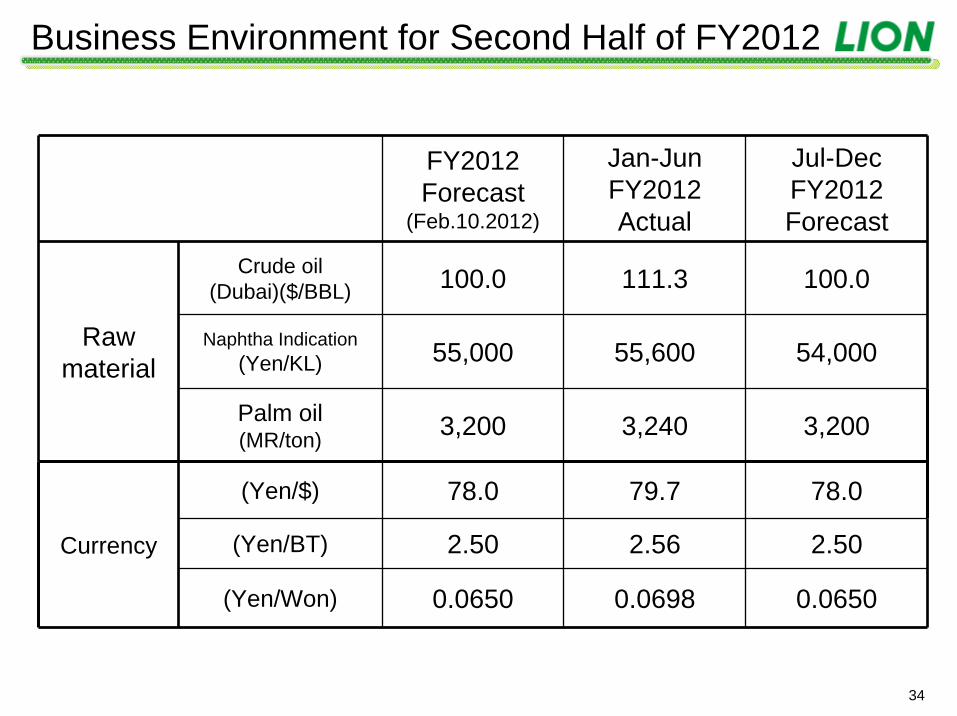
Rawmaterial
Crude oil (Dubai)($/BBL) 100.0 111.3 100.0
Naphtha Indication(Yen/KL) 55,000 55,600 54,000
Palm oil(MR/ton) 3,200 3,240 3,200
Currency
(Yen/$) 78.0 79.7 78.0
(Yen/BT) 2.50 2.56 2.50
(Yen/Won) 0.0650 0.0698 0.0650
Business Environment for Second Half of FY2012
35
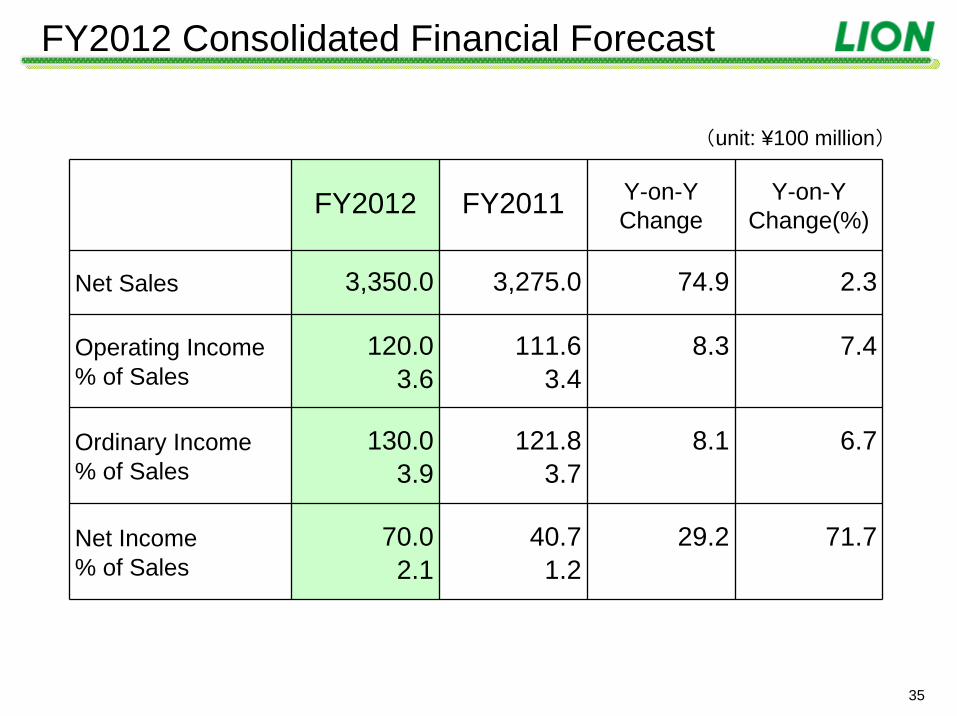
FY2012 FY2011 Y-on-YChange
Y-on-YChange(%)
Net Sales 3,350.0 3,275.0 74.9 2.3
Operating Income% of Sales
120.03.6
111.63.4
8.3 7.4
Ordinary Income% of Sales
130.03.9
121.83.7
8.1 6.7
Net Income% of Sales
70.02.1
40.71.2
29.2 71.7
(unit: ¥100 million)
FY2012 Consolidated Financial Forecast
36
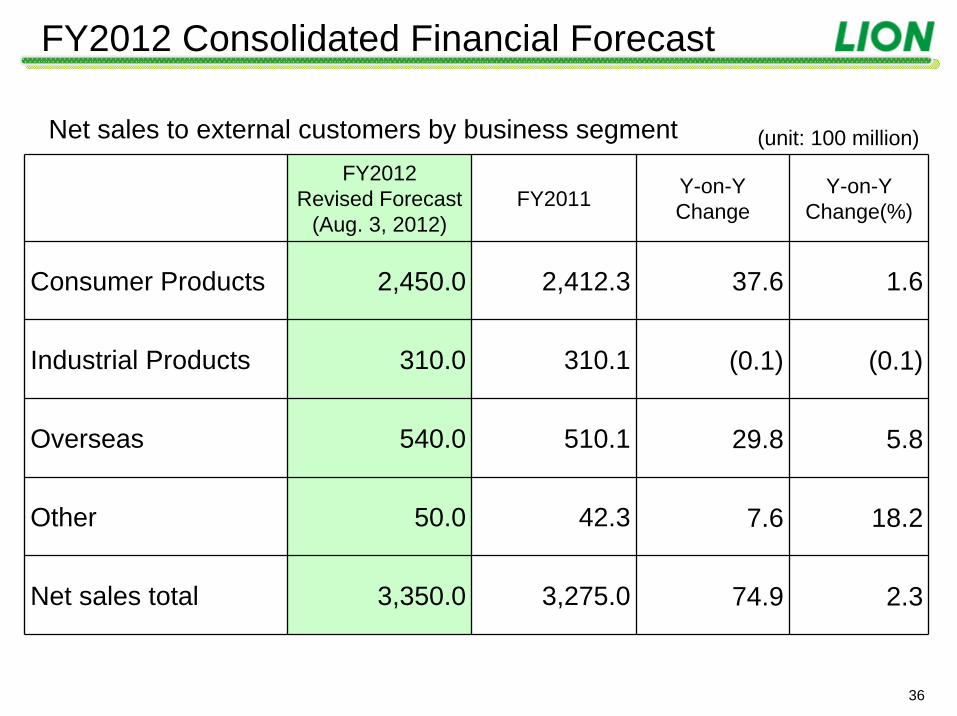
(unit: 100 million)
Y-on-Y Change(%)
FY2012Revised Forecast
(Aug. 3, 2012)FY2011 Y-on-Y
Change
Consumer Products 2,450.0 2,412.3 37.6 1.6
Industrial Products 310.0 310.1 (0.1) (0.1)
Overseas 540.0 510.1 29.8 5.8
Other 50.0 42.3 7.6 18.2
Net sales total 3,350.0 3,275.0 74.9 2.3
Net sales to external customers by business segment
FY2012 Consolidated Financial Forecast

37
Factors Causing Changes in Results Forecasts
◇Increasing costs for market competition due to falling retail prices amid fluctuating economic trends and intensifying competition
◇Intensifying competition among overseas businesses
◇Future Uncertainty caused by high raw material prices and exchange rate fluctuations
FY2012 Consolidated Financial Forecasts

38
Cash Dividends Paid to Shareholders
Payment ratio(Non-consolidated) - 54.7% 47.2% 53.2% 93.0% 65.4% 46.1% 82.4%
FY2004 FY2005 FY2006 FY2007 FY2008 FY2009 FY2010 FY2011 FY2012(Plan)
4 45 5 5
45
5 5 5
5 5 5 5
5 5 5 (5)
0
2
4
6
8
10
12
FY2004 FY2005 FY2006 FY2007 FY2008 FY2009 FY2010 FY2011 FY2012
Year end dividend
Interim dividend
1
(yen)
(Plan)
Dividends per share (annual)
8
109
(10)1010 10 1011
120th Anniversary Commemorative Dividend PaidIn FY2011 as of the year-end: ¥1

The forecasts and projected operating results contained in this
report are based on information available at the time of
preparation, and thus involve inherent risks and uncertainties.
Accordingly, readers are cautioned that actual results may differ
materially from those projected as a result of a variety of factors.
Note: Figures are rounded down to the digits that are displayed.

40
Reference Materials

41
Jan.-Jun.FY2012
Jan.-Jun.FY2011
Y-o-YChange
Y-o-YChange(%)
Net sales 1,598.7 1,514.7 83.9 5.5Cost of sales 693.5 644.2 49.2 7.6
Gross profit 905.1 870.4 34.6 4.0Selling, general and administrativeexpenses 882.6 837.2 45.4 5.4
Operating Income 22.5 33.2 (10.7) (32.3)Non-operating income 10.2 12.2 (1.9) (16.1)Non-operating expenses 4.4 5.3 (0.8) (16.2)
Ordinary income 28.3 40.1 (11.8) (29.5)Extraordinary income ー 0.4 (0.4) ーExtraordinary loss 2.1 33.3 (31.2) (93.7)
Net income before income taxes 26.2 7.2 18.9 261.1Income taxes 8.3 8.7 (0.4) (4.8)Adjustment of income taxes 3.2 (5.0) 8.3 ーMinority interests in earnings ofconsolidated subsidiaries 3.0 3.0 (0.0) (1.8)
Net income 11.6 0.4 11.1 ー
(unit:¥100 million)
Statements of Income (Consolidated)
42
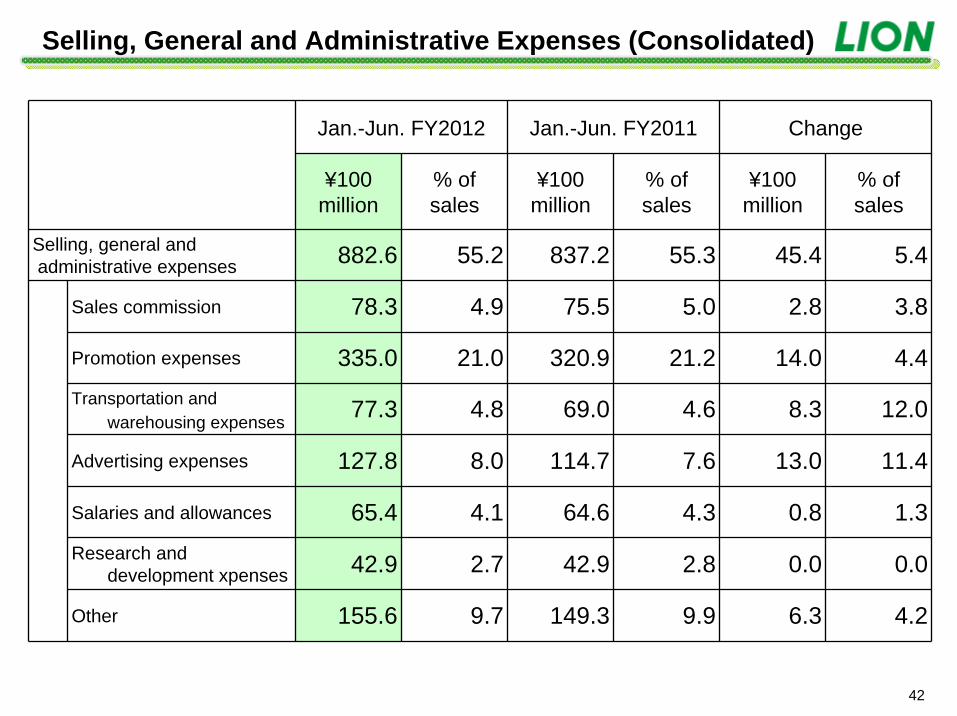
Jan.-Jun. FY2012 Jan.-Jun. FY2011 Change
¥100million
% ofsales
¥100million
% ofsales
¥100million
% ofsales
Selling, general andadministrative expenses 882.6 55.2 837.2 55.3 45.4 5.4
Sales commission 78.3 4.9 75.5 5.0 2.8 3.8
Promotion expenses 335.0 21.0 320.9 21.2 14.0 4.4Transportation and
warehousing expenses 77.3 4.8 69.0 4.6 8.3 12.0
Advertising expenses 127.8 8.0 114.7 7.6 13.0 11.4
Salaries and allowances 65.4 4.1 64.6 4.3 0.8 1.3Research and
development xpenses 42.9 2.7 42.9 2.8 0.0 0.0
Other 155.6 9.7 149.3 9.9 6.3 4.2
Selling, General and Administrative Expenses (Consolidated)

43
Jan.-Jun. FY2012 Jan.-Jun. FY2011
Extraordinary income
Reversal of allowance for doubtful accounts
0.2
Gain on disposal of noncurrent assets
0.2
Total ー Total 0.4
Extraordinary loss
Loss on disposal of noncurrent assets
1.3
Loss on disaster
Loss on disposal of noncurrent assets
28.0
0.3
Impairment loss 0.7 Impairment loss 0.0
. Other 5.0Total 2.1 Total 33.3
Significant Extraordinary Income or Loss (consolidated)
(¥100 million)

44
1H FY2012(Ended Jun 30,
2012)
FY2011(Ended Dec 31,
2011)Change
Current assets 1,251.7 1,272.2 (20.5)
Cash and time deposits 234.2 254.7 (20.5)Notes and accounts receivable-trade 509.5 551.9 (42.3)
Short-term investments 115.9 104.3 11.5
Inventories 322.6 302.5 20.1
Noncurrent assets 1,230.5 1,220.4 10.0
Property, plant and equipment 595.8 585.0 10.7
Intangible assets 195.8 214.8 (19.0)
Investments and other assets 438.8 420.5 18.2
Total assets 2,482.2 2,492.7 (10.5)
Consolidated Balance Sheets (Selected) I(unit: ¥100 million)

45
1H FY2012(Ended Jun. 30, 2012)
FY2011(Ended Dec. 31, 2011) Change
Current liabilities 924.6 946.0 (21.4)Notes and accounts payable-trade 415.0 420.7 (5.7)Short-term loans payable 56.0 51.4 4.6Current portion of long-term loans payable 24.1 24.1 ーAccounts payable-other and accrued expenses 374.2 378.8 (4.6)
Noncurrent liabilities 481.6 494.1 (12.5)Long-term loans payable 238.7 250.8 (12.0)Provision for retirement benefits 191.4 191.5 (0.0)
Capital stock 344.3 344.3 -
Retained earnings 562.6 567.5 (4.8)Treasury stock (165.1) (166.5) 1.4Valuation difference on available-for-sale securities 36.9 30.2 6.7Minority interests 1,075.9 1,052.5 23.4Total liabilities and net assets 2,482.2 2,492.7 (10.5)
Consolidated Balance Sheets (Selected) II(unit: ¥100 million)

46
plan plan
Note: Both capital expenditures and depreciation expenses include amounts for intangible assets.
Capital Expenditures and Depreciation Expenses (consolidated)
Depreciation expensesCapital expenditures(unit:¥100 million)
4051
3926
4562 59 59
60
60
32
5743
60
130
62
485140
6663
0
20
40
60
80
100
120
140
160
180
200
2007 2008 2009 2010 2011 2012 2007 2008 2009 2010 2011 2012
Right of trademarkJul-DecJan-Jun
350
250
304
83
392
106
124 124
79
117 120
63
44
70
120123

47
Consolidated Cash Flow
Jan.-Jun.FY2012
Jan.-Jun.FY2011
Change
Net cash provided by (used in) operating activities 56.8 (98.6) 155.4
Net cash provided by (used in) investment activities (51.5) (53.1) 1.6
Net cash provided by (used in) financing activities (21.1) (48.0) 26.9
Effect of exchange rate change on cash and cash equivalents 0.6 (0.6) 1.2
Net increase (decrease) in cash and cash equivalents (15.1) (200.5) 185.3
Cash and cash equivalents at beginning of period 356.4 445.8 (89.4)
Cash and cash equivalents at end of period 341.2 245.3 95.8
(unit: ¥100 million)

48
Jan.-Jun.FY2012
Jan.-Jun.FY2011
Y-on-YChange
Y-on-Y Change(%)
Consumer Products1,268.1 1,192.7 75.3 6.31,158.8 1,090.4 68.4 6.3
Industrial Products242.4 249.1 (6.7) (2.7)148.0 151.9 (3.9) (2.6)
Overseas283.1 266.8 16.2 6.1267.9 253.1 14.7 5.8
Other143.8 117.9 25.8 21.9
23.9 19.1 4.8 25.1Net sales total 1,937.5 1,826.7 110.7 6.1Sales to external customers total 1,598.7 1,514.7 83.9 5.5
Net sales and sales to external customers
Results by business segment (consolidated)
(unit: ¥100 million)
Upper line: Net sales; Lower line: Sales to external customersNet sales include internal net sales within and among segments.
The forecasts and projected operating results contained in this
report are based on information available at the time of
preparation, and thus involve inherent risks and uncertainties.
Accordingly, readers are cautioned that actual results may differ
materially from those projected as a result of a variety of factors.
Note: Figures are rounded down to the digits that are displayed.