first, i look for stocks and etf’s (exchange trades funds) to trade…i+pic… · •first, i...
TRANSCRIPT


• First, I look for Stocks and ETF’s (Exchange Trades Funds) to TRADE, this is different than a long term “Buy and Hold” investment strategy.• The typical time that I hold each Stock or ETF is one month to a few months.
• Second, I am a “Technical Trader” vs. a “Fundamental Trader.”• I primarily analyze the Price Patterns on the chart. I don’t study earnings reports or
company forecasts.• I believe strongly that “Fundamentals” like earnings, products, management, etc. do matter.• I also believe that the price of a stock is a reflection of what the market thinks of a company’s
fundamentals – that everything that is known about a company is reflected in the Price Patterns on the chart.
• A stock’s price movement is based on what the market believes about the company. These price movements sometimes have a clearly discernable pattern that can provide a basis for predicting the next price move.
• Price and Volume are the only realities in the market – everything else is subject to interpretation, manipulation, speculation and emotion. I base my analysis on the realities of Price and Volume that present themselves in price patterns on the chart.
*While I base my analysis on Technicals, I do check some key things about a company before taking a trade. Things like; Bankruptcy filing, acquisition announcements, etc.

• I look for stock trades that meet the following criteria:• The Trade is in the direction of the major trend of the overall market or sector.
• I do occasionally take “counter-trend” trades when the probability of winning is very high.• The Trade has a High Probability of winning, based on my analysis.• The Trade has a High Risk/Reward Ratio – meaning the Trade has the potential to make
much more money than it will lose if the Trade fails.• The Trade fits within my Risk Management parameters – it has a clear support or resistance
level for my Stop Loss placement.• The Trade has a high Capital Efficiency – meaning I do not tie up all of my trading capital in
one or two trades, but rather try to only have ~10-15% of available capital in a given trade. This is different than diversification.• Out of 10 trades, 3-4 will fail, 6-7 will win, 1-2 will win REALLY big.• I often by Put or Call options to improve the Capital Efficiency of my trades.
• My published picks include specific option contracts when appropriate.
• I do pay attention to Sector Weighting and limit Trade overexposure in sectors.
• I use 3 key tools in analyzing stock charts:• Elliot Wave Theory• Fibonacci Retracements and Extensions• ART® Applied Reality Trading® software from TradersCoach.com
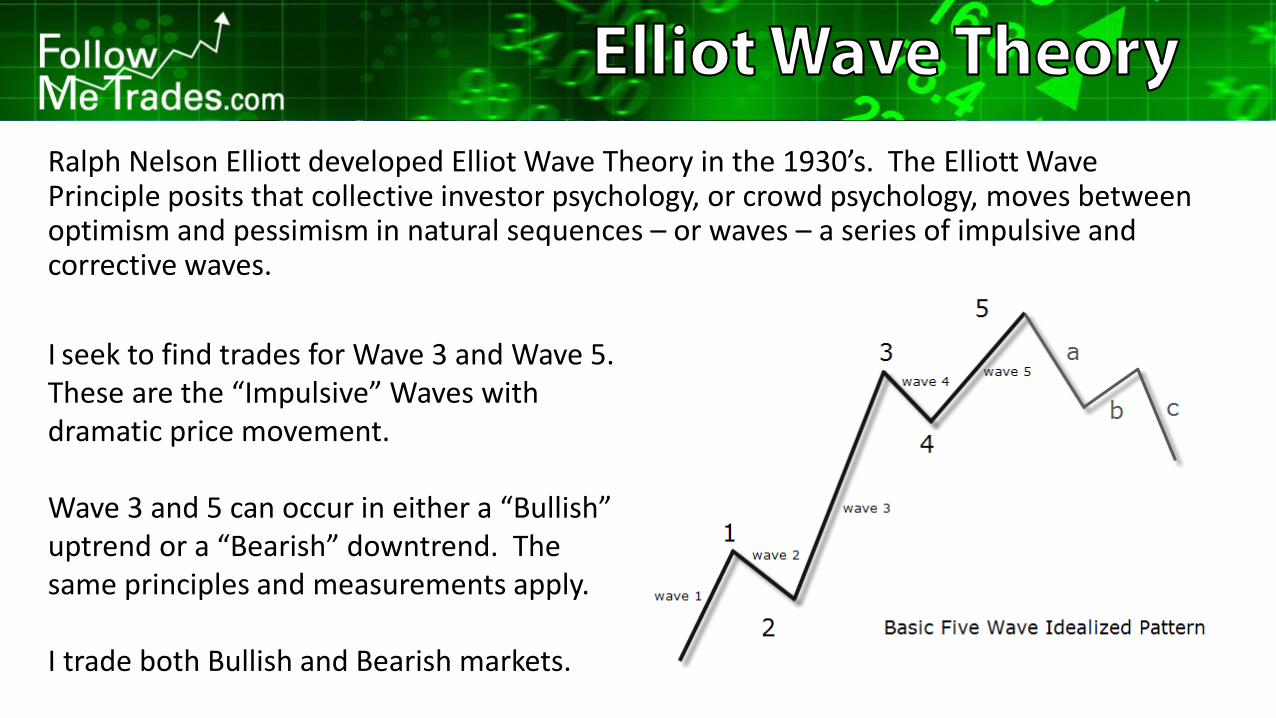
Ralph Nelson Elliott developed Elliot Wave Theory in the 1930’s. The Elliott Wave Principle posits that collective investor psychology, or crowd psychology, moves between optimism and pessimism in natural sequences – or waves – a series of impulsive and corrective waves.
I seek to find trades for Wave 3 and Wave 5.These are the “Impulsive” Waves with dramatic price movement.
Wave 3 and 5 can occur in either a “Bullish” uptrend or a “Bearish” downtrend. The same principles and measurements apply.
I trade both Bullish and Bearish markets.

Leonardo Fibonacci was an important Italian mathematician from the middle ages (1170-1250.) His discovery of “Fibonacci Numbers” and their “Fibonacci ratios” is considered one of the most important mathematical concepts ever and is used widely by scientists, artists, economists, architects and in many other disciplines as well as appearing all around us in nature.
The Fibonacci Number sequence is: 0,1,1,2,3,5,8,13,21,34,55,89…
Starting with 0 and 1, the next number in the sequence is found by adding the previous two numbers (I.e. 0+1=1, 1+1+2, 2+1=3, 2+3=5…)
Fibonacci Ratios are the ratios of one number position to other number positions in the sequence.
• A number divided by the previous number approximates 1.618
• A number divided by the next highest number approximates .6180
• A number divided by another two places higher approximates .3820
• and so on…
The Ratio .6180 is called the “Golden Ratio” and appears
all around us in the form of the shapes of things ranging from
snail shells and flower petals to pine cones, pineapple scales,
spiral galaxies and hurricanes.Fibonacci Spiral

Fibonacci Retracements and Extensions are used extensively in technical analysis of stock charts.
Stocks do not move up or down in straight lines, but move in a series of waves that quite often begin and terminate at or near Fibonacci Retracement and Extension levels.
Initial Wave up
Corrective WaveDown to FibonacciRetracement levels38.2% – 61.8%

Fibonacci Retracements and Extensions are used extensively in technical analysis of stock charts.
Stocks do not move up or down in straight lines, but move in a series of waves that quite often begin and terminate at or near Fibonacci Retracement and Extension levels.
High Probability move toFibonacci Extension levels61.8% - 100%

I use ART® Applied Reality Trading ® Software to help with Elliot Wave count and to identify key support and resistance levels for Stop Loss placement and for scaling out for profit.
Pyramid Trading PointsFor support and resistance
OWL Optimum Wave Locator For help with Elliot Wave count PTF Precision Trend Filter
For trend confirmation
ART Reversal Bars forKey reversals and scale out points
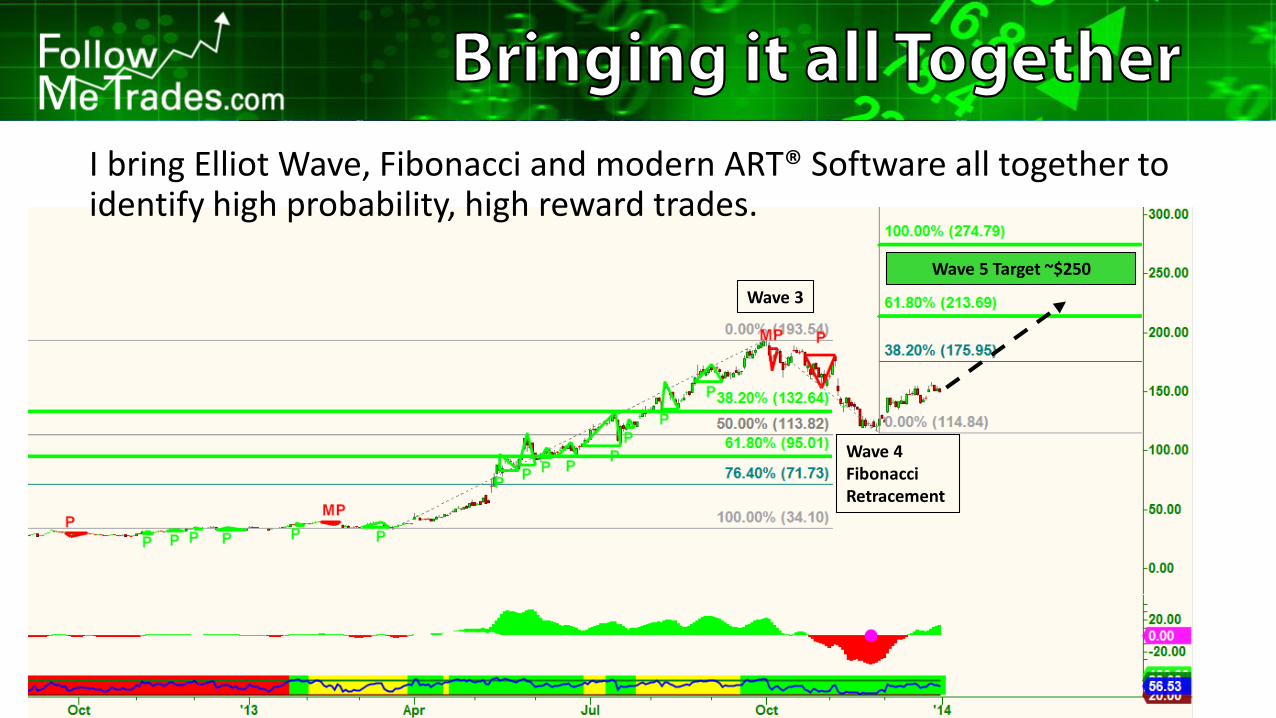
I bring Elliot Wave, Fibonacci and modern ART® Software all together to identify high probability, high reward trades.
Wave 3
Wave 4FibonacciRetracement
Wave 5 Target ~$250

• I use this method and scan through hundreds of Stock and ETF charts each week, finding the absolute best trades.• I also always have a couple dozen charts that I am watching
and waiting for my trade criteria to be met.
• I publish an average of 1-2 trades per week.• Each trade published will include;
• Price to Buy at.• Initial Stop Loss price.• Target price.
• Weekly Updates will include;• Brief commentary on the trade as it plays out.• Updated Stop Loss price level.• Price levels and proportion of shares to scale out of the position
for profit.• Price levels to exit the trade.
• I do this work already, for my own trading, in my own account – I invite you to “Follow Me,” and share in my success.
Symbol: HOLI Company: HollysysAutomation Technologies Ltd
Price to BUY: $25.02 - $25.50
Stop Loss Price: $21.45
Target Price: $36.00
Example
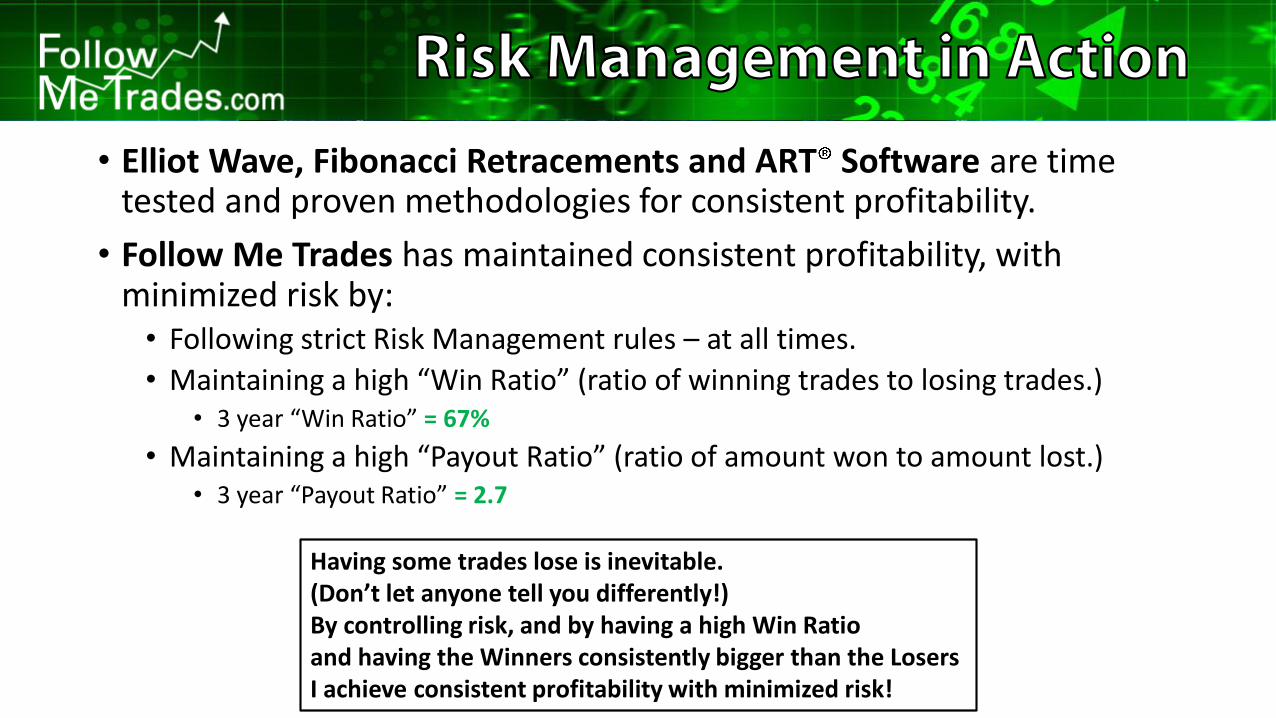
• Elliot Wave, Fibonacci Retracements and ART Software are time tested and proven methodologies for consistent profitability.
• Follow Me Trades has maintained consistent profitability, with minimized risk by:• Following strict Risk Management rules – at all times.
• Maintaining a high “Win Ratio” (ratio of winning trades to losing trades.)• 3 year “Win Ratio” = 67%
• Maintaining a high “Payout Ratio” (ratio of amount won to amount lost.)• 3 year “Payout Ratio” = 2.7
Having some trades lose is inevitable.(Don’t let anyone tell you differently!)By controlling risk, and by having a high Win Ratioand having the Winners consistently bigger than the LosersI achieve consistent profitability with minimized risk!
