first quarter 2018 conference call - … · first quarter highlights (a) see segment operating...
TRANSCRIPT

First Quarter 2018 Conference Call
April 25, 2018

Forward-Looking Statements
Certain information contained in this presentation constitutes forward-looking statements for purposes of the safe
harbor provisions of The Private Securities Litigation Reform Act of 1995. There are a variety of factors, many of which
are beyond our control, that affect our operations, performance, business strategy and results and could cause our
actual results and experience to differ materially from the assumptions, expectations and objectives expressed in any
forward-looking statements. These factors include, but are not limited to: our ability to implement successfully our
strategic initiatives; actions and initiatives taken by both current and potential competitors; increases in the prices paid
for raw materials and energy; a labor strike, work stoppage or other similar event; foreign currency translation and
transaction risks; deteriorating economic conditions or an inability to access capital markets; work stoppages, financial
difficulties or supply disruptions at our suppliers or customers; the adequacy of our capital expenditures; our failure to
comply with a material covenant in our debt obligations; potential adverse consequences of litigation involving the
company; as well as the effects of more general factors such as changes in general market, economic or political
conditions or in legislation, regulation or public policy. Additional factors are discussed in our filings with the Securities
and Exchange Commission, including our annual report on Form 10-K, quarterly reports on Form 10-Q and current
reports on Form 8-K. In addition, any forward-looking statements represent our estimates only as of today and should
not be relied upon as representing our estimates as of any subsequent date. While we may elect to update forward-
looking statements at some point in the future, we specifically disclaim any obligation to do so, even if our estimates
change.
2
First Quarter Highlights
(a) See Segment Operating Income and Margin reconciliation in Appendix on page 28.
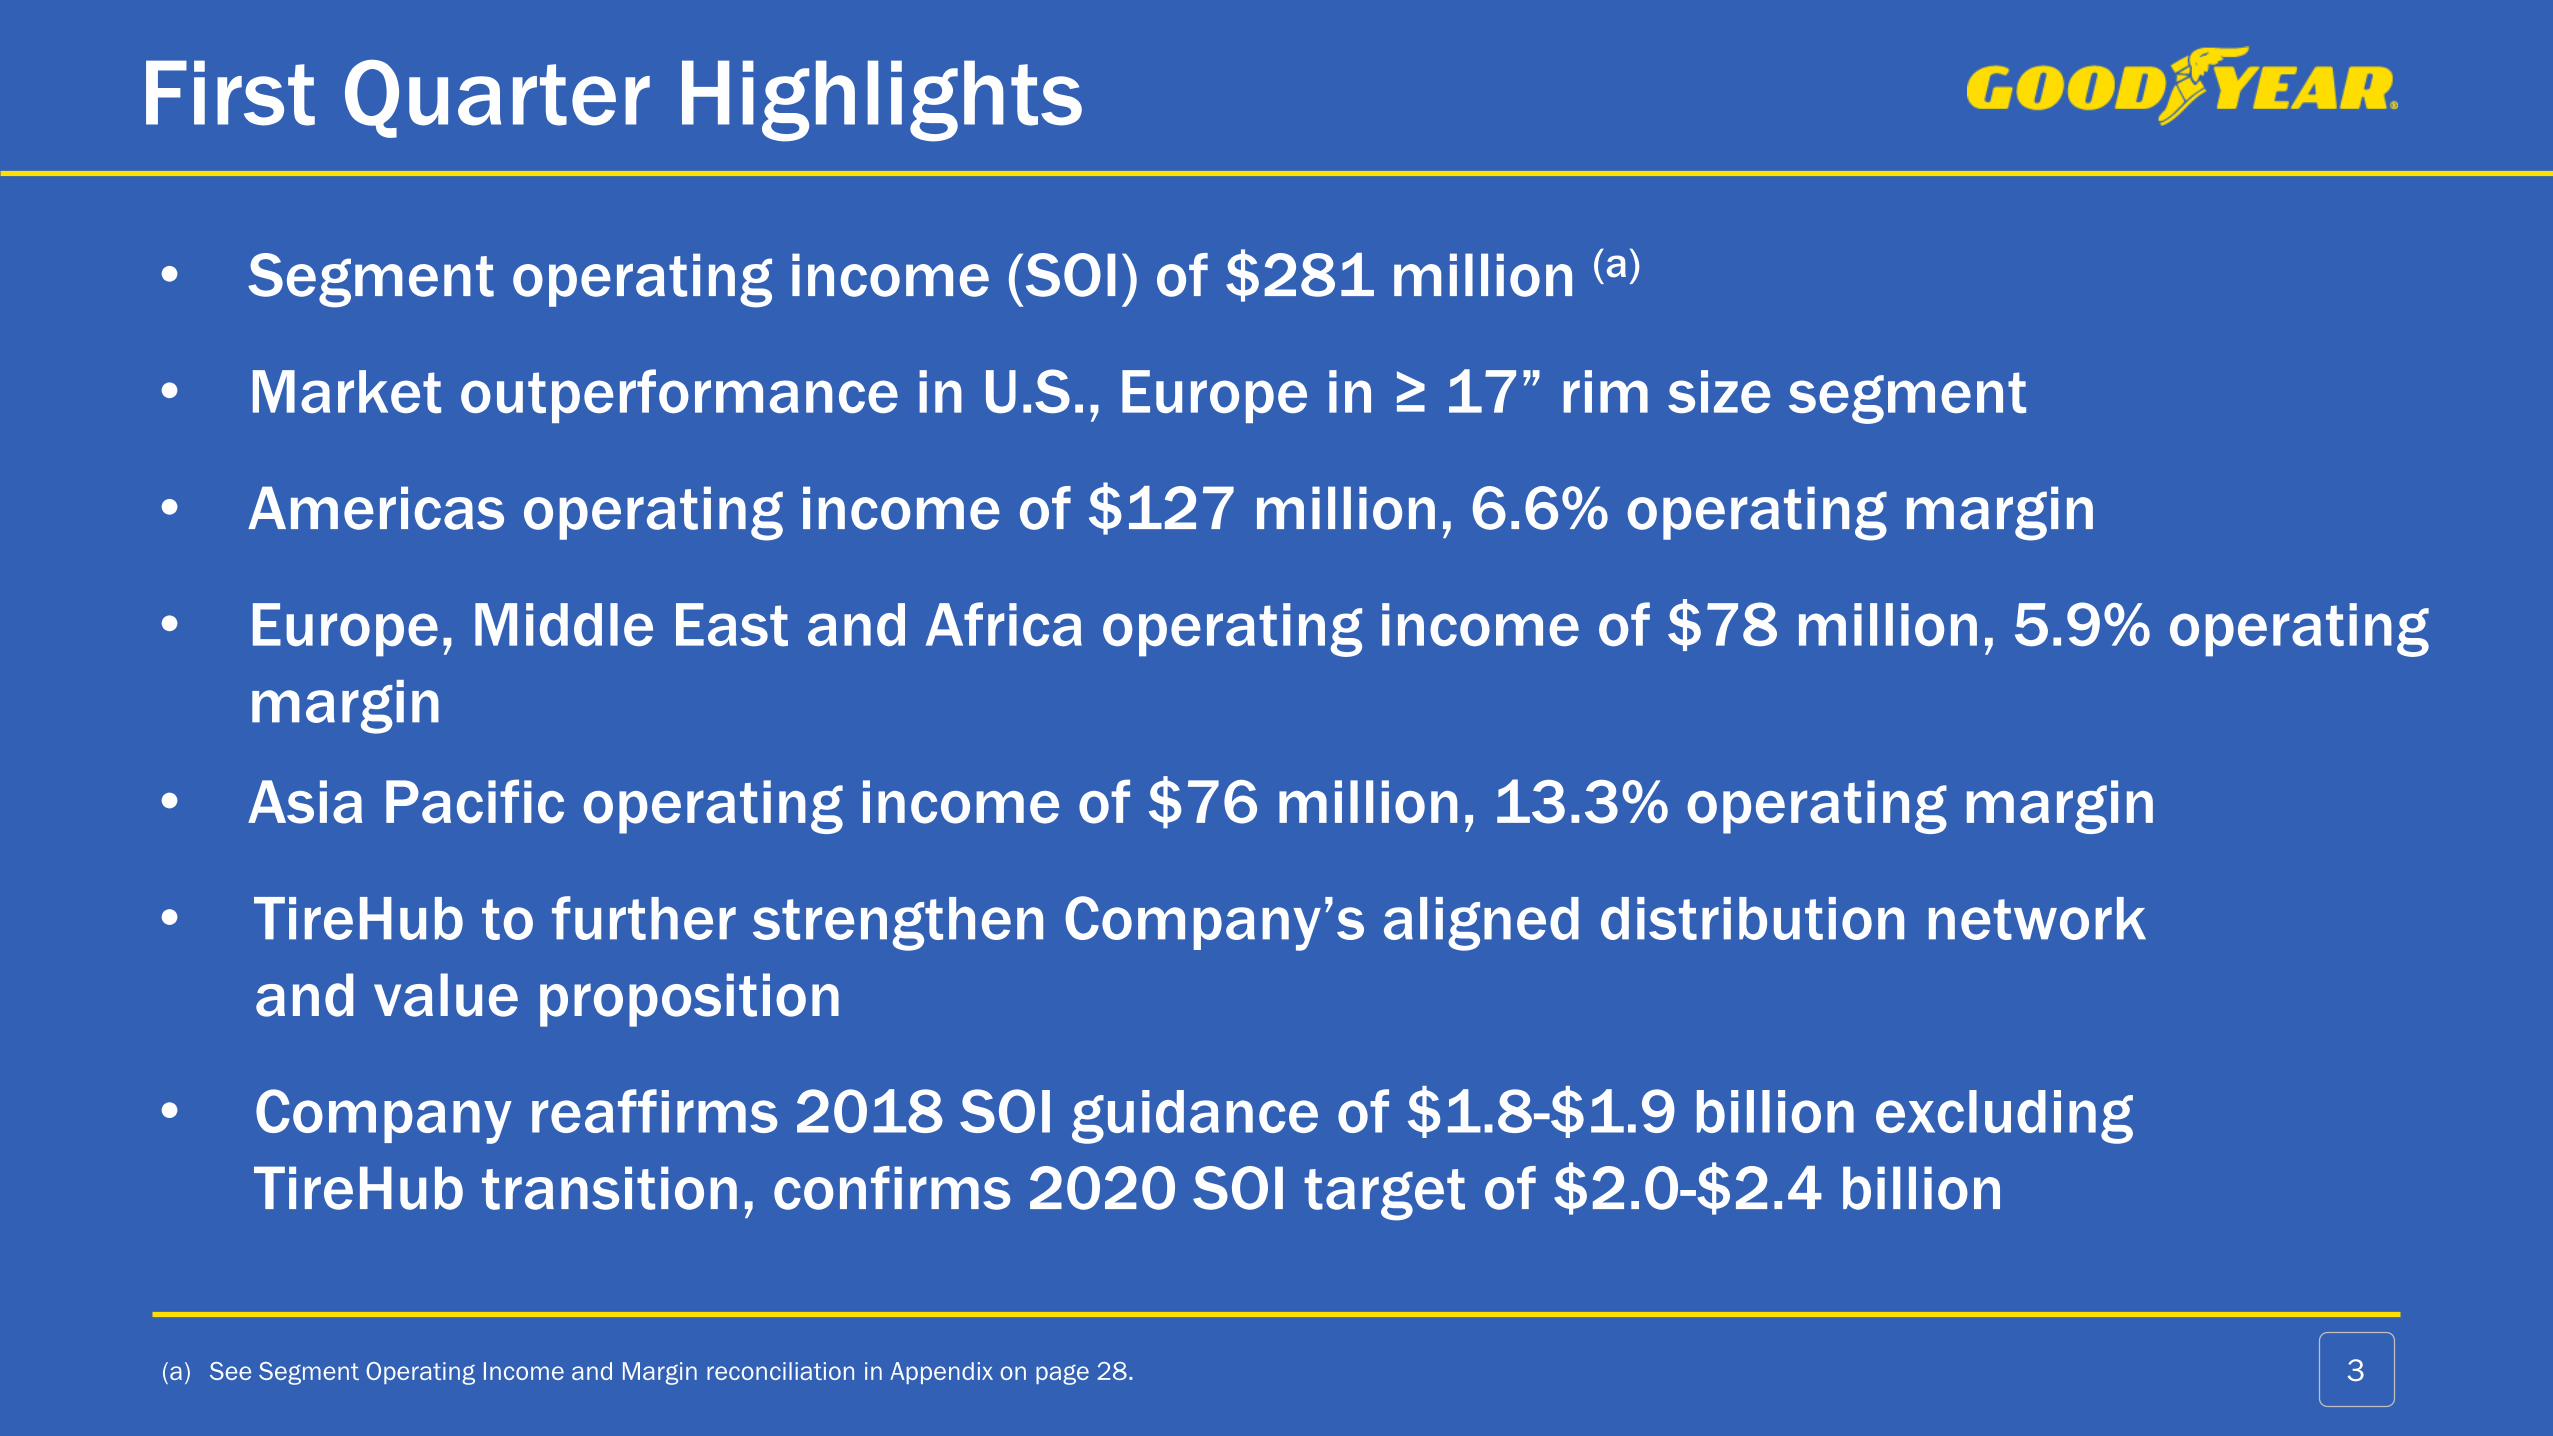
• Segment operating income (SOI) of $281 million (a)
• Market outperformance in U.S., Europe in ≥ 17” rim size segment
• Americas operating income of $127 million, 6.6% operating margin
• Europe, Middle East and Africa operating income of $78 million, 5.9% operating
margin
• Asia Pacific operating income of $76 million, 13.3% operating margin
• TireHub to further strengthen Company’s aligned distribution network
and value proposition
• Company reaffirms 2018 SOI guidance of $1.8-$1.9 billion excluding
TireHub transition, confirms 2020 SOI target of $2.0-$2.4 billion
3

TireHub will deliver best in class service for retail and fleet customers
4
TireHub
Tires in stock for
97% of vehicles
ON THE ROAD
Joining More Than
80 LOCATIONSFor A Nationwide
Footprint

Improved national distribution presence with TireHub, alongwith our aligned regional network, will support our growth
TireHub: An Extension of our Connected Business Model
5
U.S. Industry Fundamentals: ≥17”
(a) Source: U.S. Tire Manufacturers Association 6
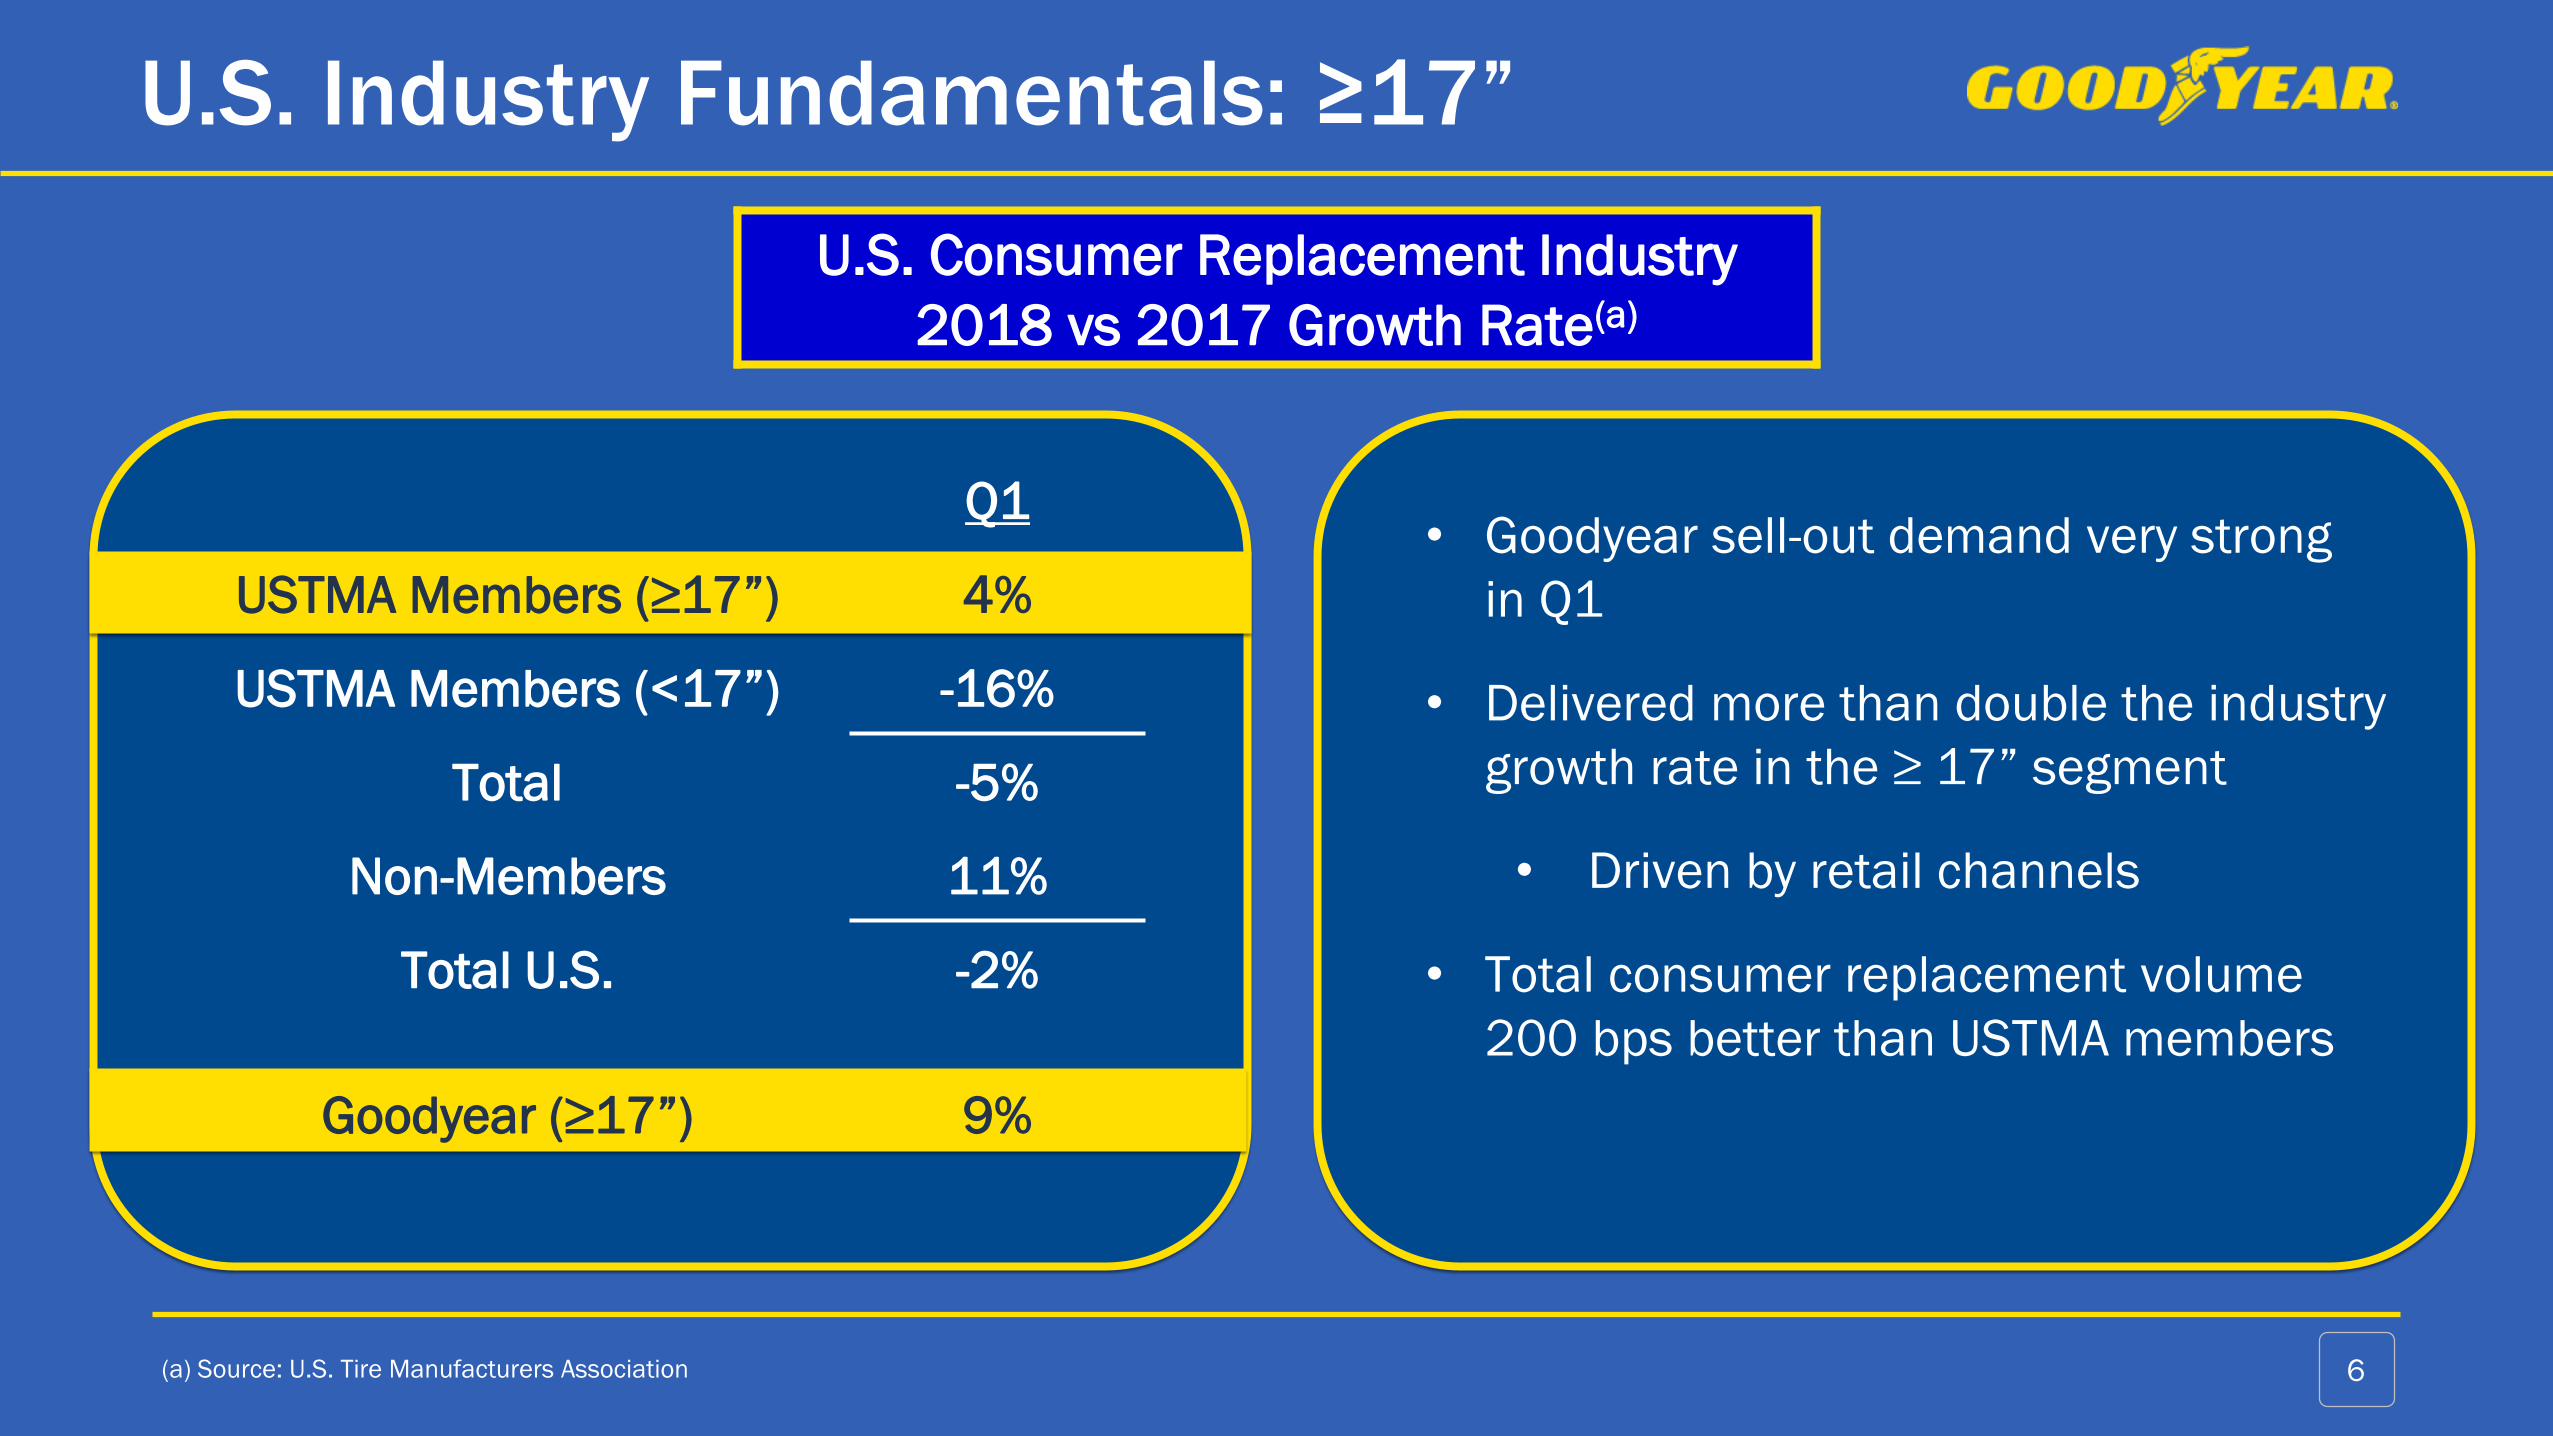
U.S. Consumer Replacement Industry
2018 vs 2017 Growth Rate(a)
• Goodyear sell-out demand very strong
in Q1
• Delivered more than double the industry
growth rate in the ≥ 17” segment
• Driven by retail channels
• Total consumer replacement volume
200 bps better than USTMA members
Q1
USTMA Members (≥17”) 4%
USTMA Members (<17”) -16%
Total -5%
Non-Members 11%
Total U.S. -2%
Goodyear (≥17”) 9%
TireHub further aligns distribution with Goodyear, enabling future growth
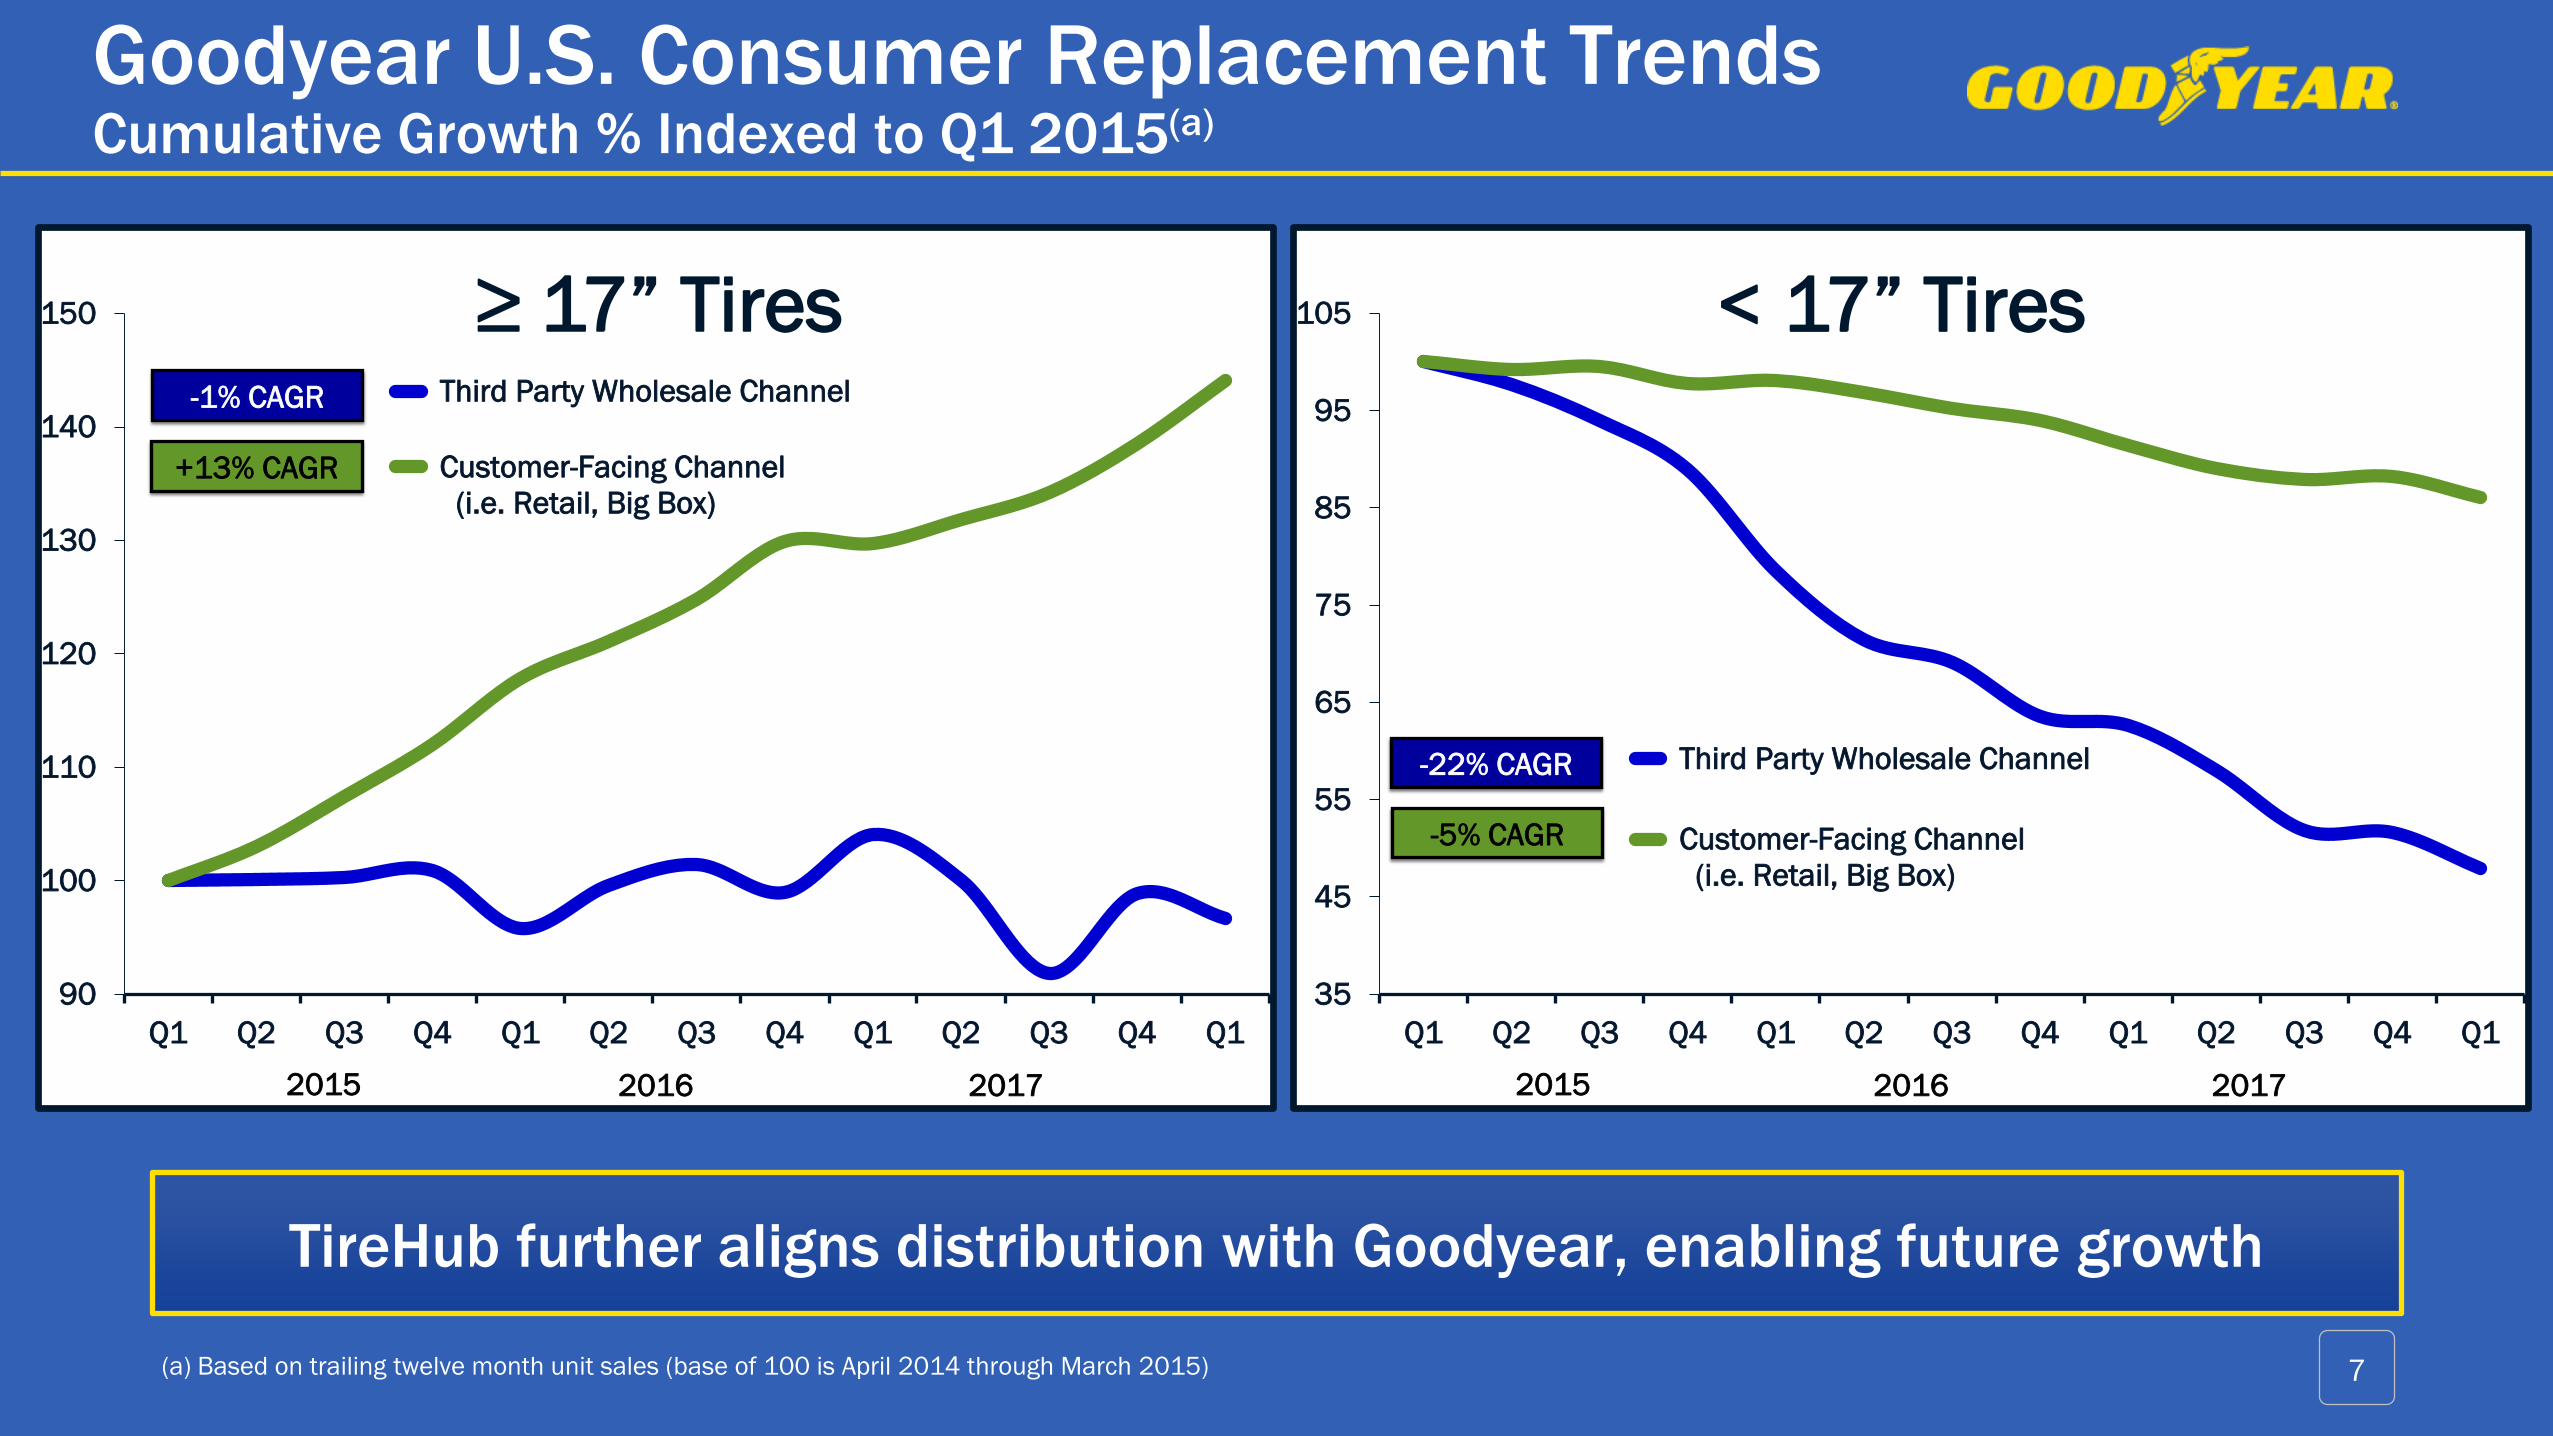
(a) Based on trailing twelve month unit sales (base of 100 is April 2014 through March 2015) 7
90
100
110
120
130
140
150
Q1 Q2 Q3 Q4 Q1 Q2 Q3 Q4 Q1 Q2 Q3 Q4 Q1
≥ 17” Tires Third Party Wholesale Channel
Customer-Facing Channel
(i.e. Retail, Big Box)
2016 20172015
+13% CAGR
-1% CAGR
35
45
55
65
75
85
95
105
Q1 Q2 Q3 Q4 Q1 Q2 Q3 Q4 Q1 Q2 Q3 Q4 Q1
< 17” Tires
Third Party Wholesale Channel
Customer-Facing Channel
(i.e. Retail, Big Box)
2016 20172015
-22% CAGR
-5% CAGR
Goodyear U.S. Consumer Replacement TrendsCumulative Growth % Indexed to Q1 2015(a)

Customer-facing channel consistently delivering demand pull,favorable mix-up, and above-market growth for our business
(a) Based on trailing twelve month unit sales (base of 100 is April 2014 through March 2015)
(b) Source: U.S. Tire Manufacturers Association, includes members only 8
90
100
110
120
130
140
150
Q1 Q2 Q3 Q4 Q1 Q2 Q3 Q4 Q1 Q2 Q3 Q4 Q1
≥ 17” Tires Third Party Wholesale Channel
Customer-Facing Channel
(i.e. Retail, Big Box)
Industry
2016 20172015
+13% CAGR
-1% CAGR
+9% CAGR
35
45
55
65
75
85
95
105
Q1 Q2 Q3 Q4 Q1 Q2 Q3 Q4 Q1 Q2 Q3 Q4 Q1
< 17” Tires
Third Party Wholesale Channel
Customer-Facing Channel
(i.e. Retail, Big Box)
Industry
2016 20172015
-22% CAGR
-5% CAGR
-8% CAGR (b)
Goodyear U.S. Consumer Replacement TrendsCumulative Growth % Indexed to Q1 2015(a)
(b)
EMEA Industry Fundamentals: ≥17”
(a) Source: European Tyre & Rubber Manufacturer’s Association 9
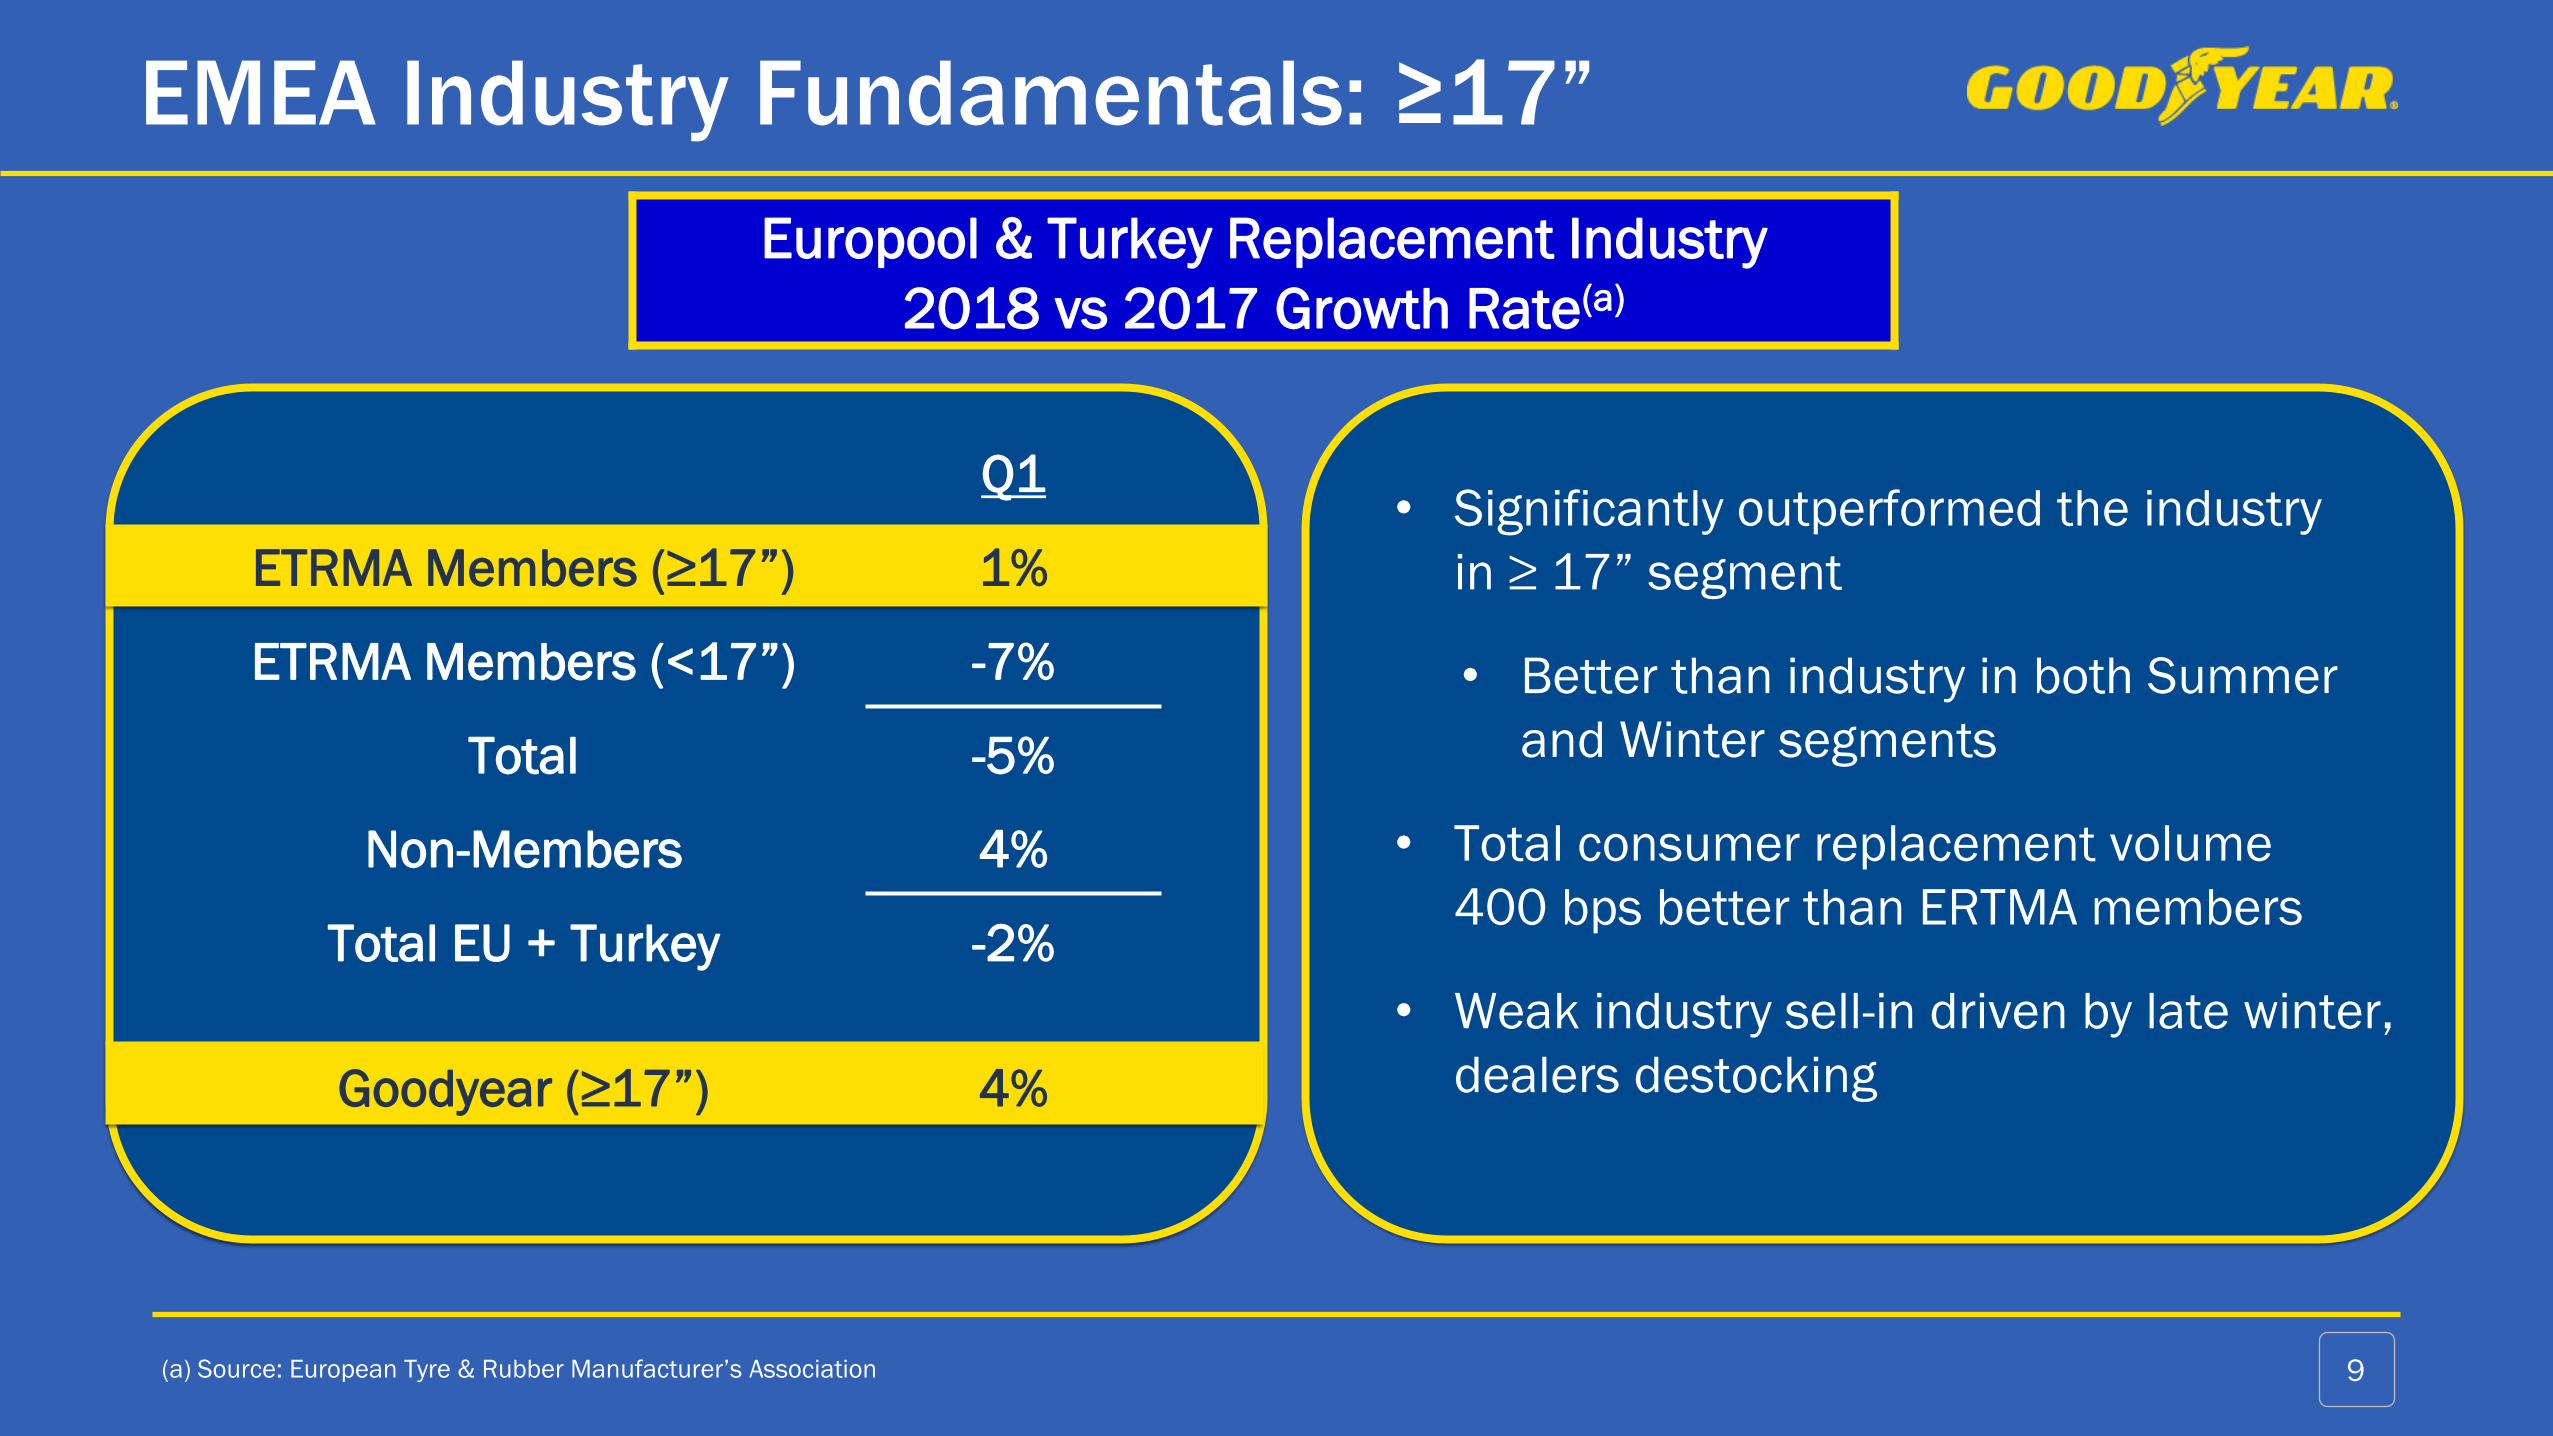
Europool & Turkey Replacement Industry
2018 vs 2017 Growth Rate(a)
Q1
ETRMA Members (≥17”) 1%
ETRMA Members (<17”) -7%
Total -5%
Non-Members 4%
Total EU + Turkey -2%
Goodyear (≥17”) 4%
• Significantly outperformed the industry
in ≥ 17” segment
• Better than industry in both Summer
and Winter segments
• Total consumer replacement volume
400 bps better than ERTMA members
• Weak industry sell-in driven by late winter,
dealers destocking

First Quarter 2018
Income Statement
(a) See Segment Operating Income and Margin reconciliation in Appendix on page 28.
(b) See Adjusted Diluted Earnings Per Share reconciliation in Appendix on pages 26 and 27.10
Terms: US$ millions(except EPS) March 31, March 31,
2018 2017 Change
Units 39.0 40.0 (2.5)%
Net Sales 3,830$ 3,699$ 4%
Gross Margin 22.3% 25.4% (3.1) pts
SAG 591$ 576$ 3%
Segment Operating Income(a) 281$ 390$ (28)%
Segment Operating Margin(a) 7.3% 10.5% (3.2) pts
Goodyear Net Income 75$ 166$
Goodyear Net Income Per Share
Weighted Average Shares Outstanding 240 252
Basic 0.31$ 0.66$
Weighted Average Shares Outstanding - Diluted 244 256
Diluted 0.31$ 0.65$
Cash Dividends Declared Per Common Share 0.14$ 0.10$
Adjusted Diluted Earnings Per Share (b) 0.50$ 0.74$
Three Months Ended
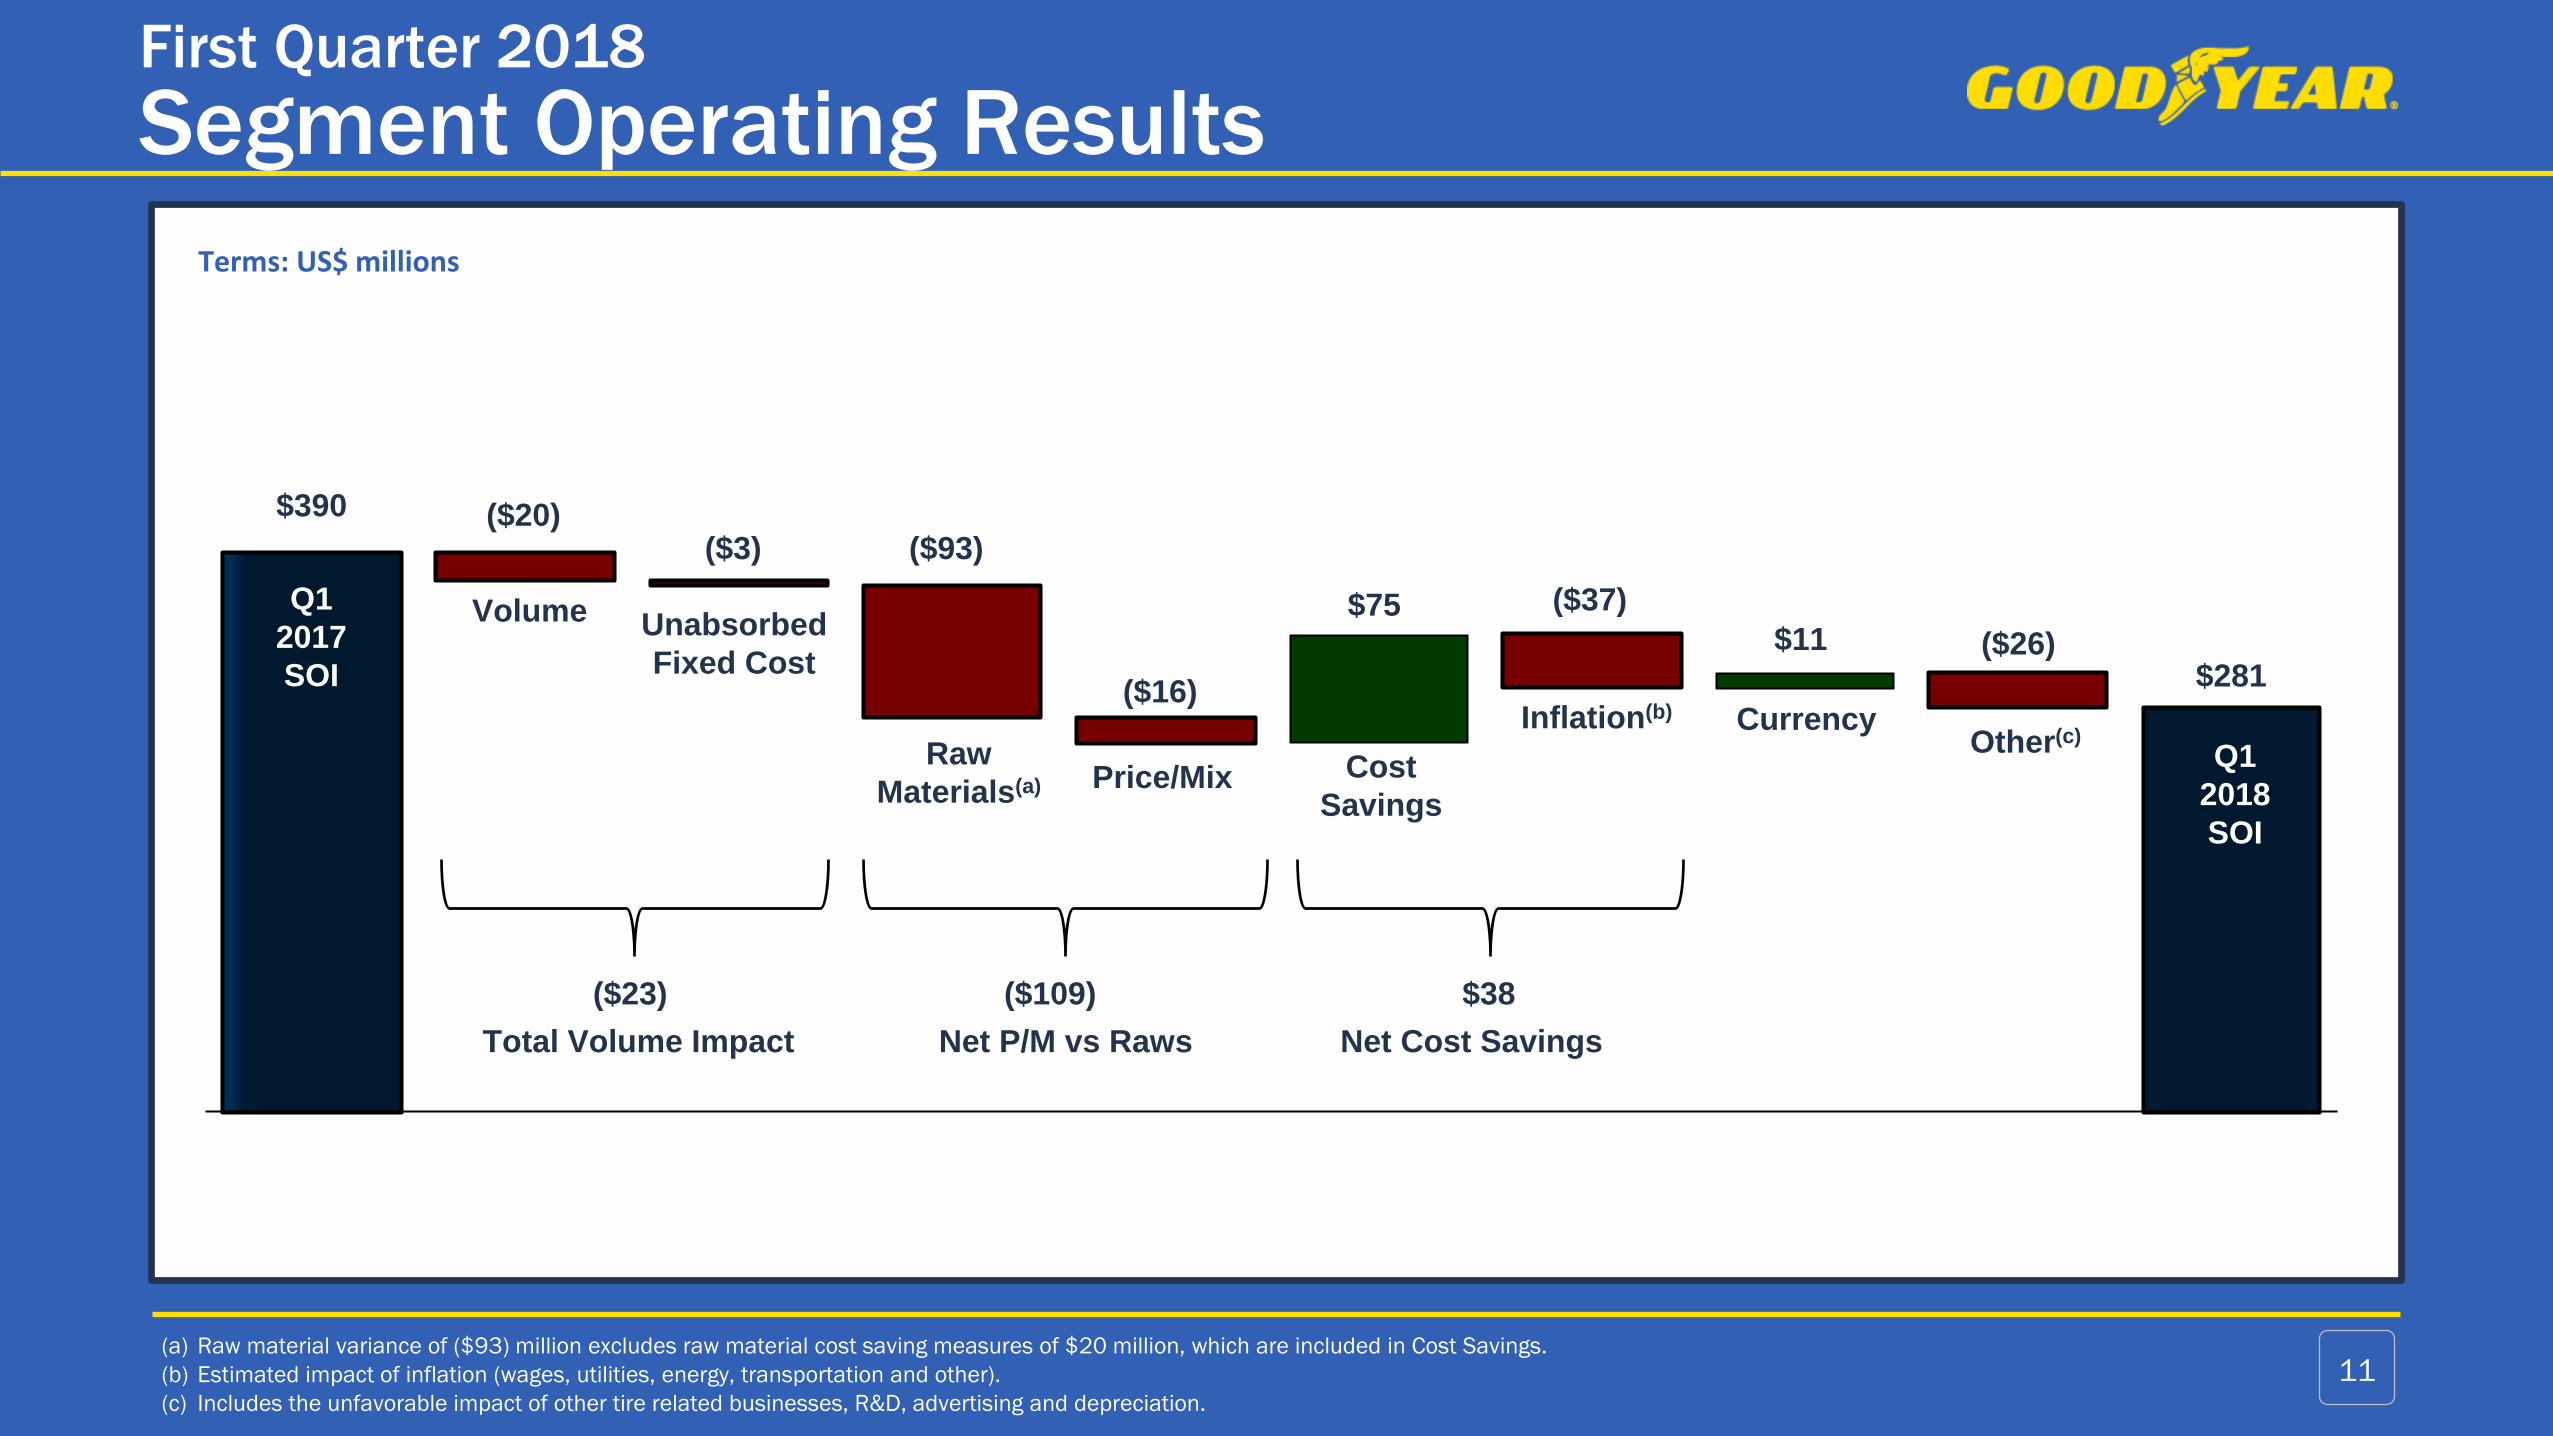
First Quarter 2018
Segment Operating Results
(a) Raw material variance of ($93) million excludes raw material cost saving measures of $20 million, which are included in Cost Savings.
(b) Estimated impact of inflation (wages, utilities, energy, transportation and other).
(c) Includes the unfavorable impact of other tire related businesses, R&D, advertising and depreciation.
11
Q1
2017
SOI
Q1
2018
SOI
Volume Unabsorbed
Fixed Cost
Raw
Materials(a) Price/Mix Cost
Savings
Inflation(b) CurrencyOther(c)
Total Volume Impact Net P/M vs Raws Net Cost Savings
$390 ($20)
$281
($3) ($93)
($16)
$75 ($37)
$11 ($26)
Terms: US$ millions
($23) ($109) $38
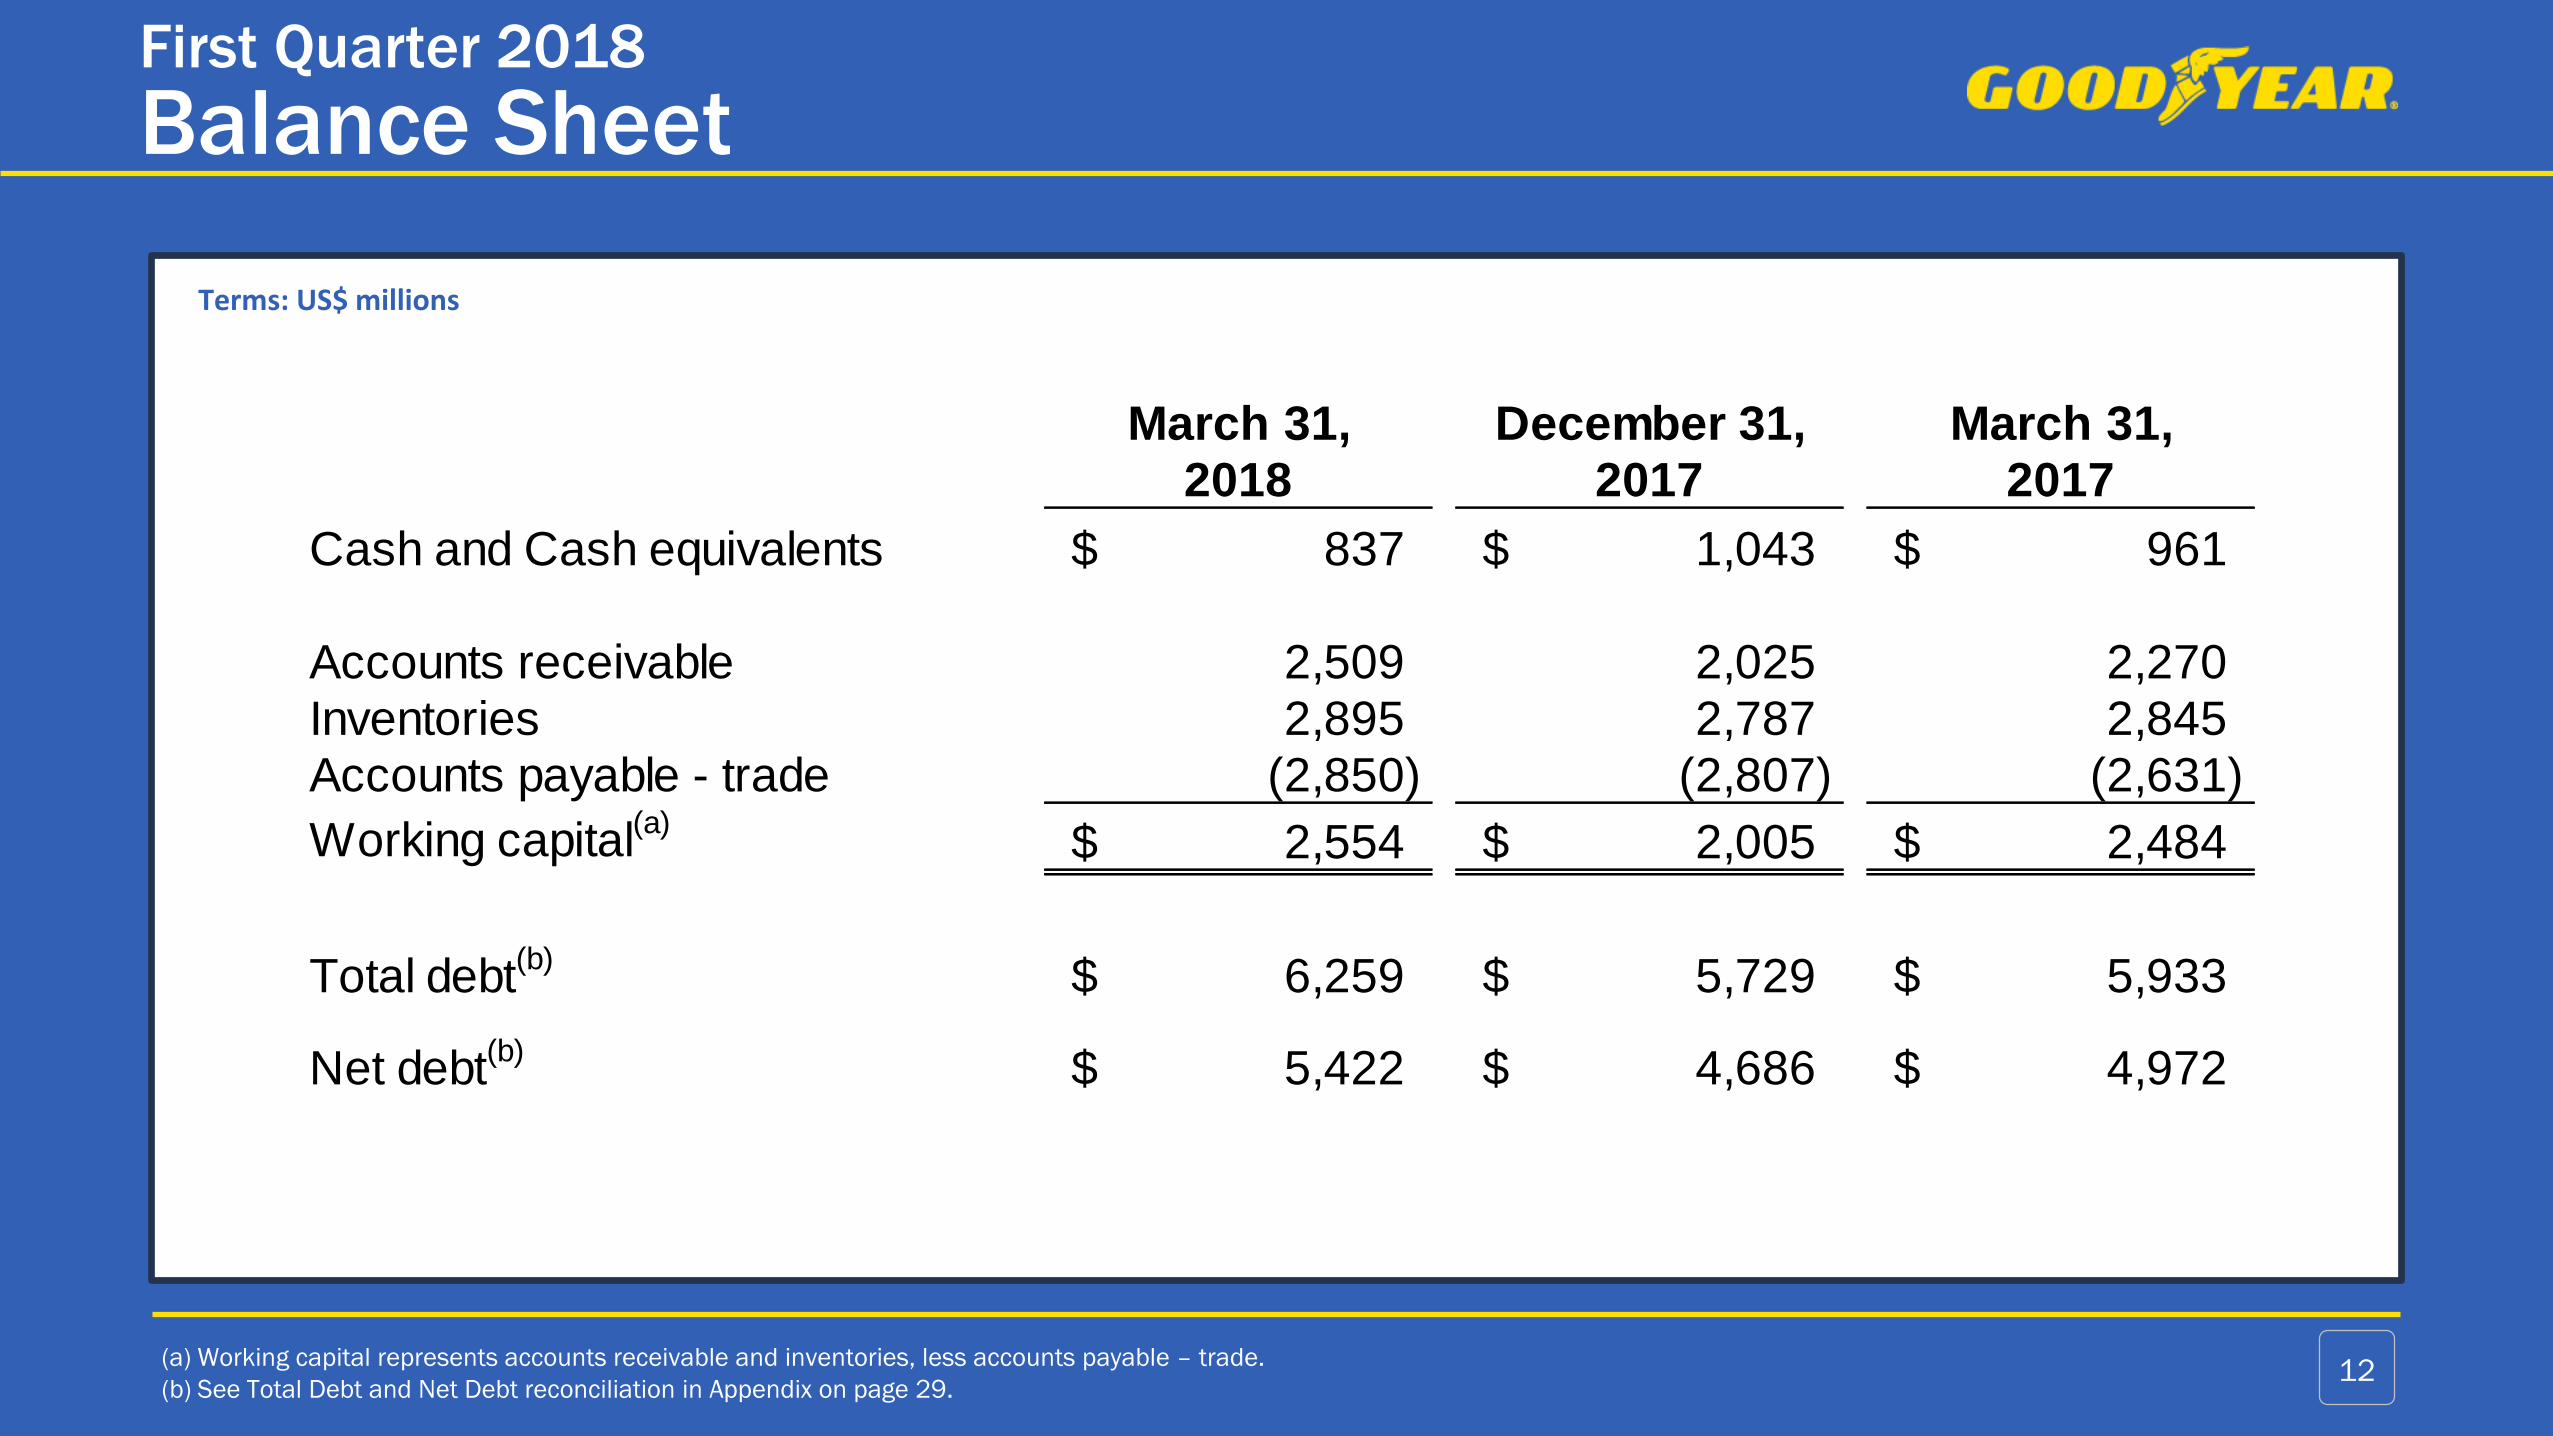
First Quarter 2018
Balance Sheet
(a) Working capital represents accounts receivable and inventories, less accounts payable – trade.
(b) See Total Debt and Net Debt reconciliation in Appendix on page 29.12
Terms: US$ millions
March 31, December 31, March 31,
2018 2017 2017
Cash and Cash equivalents 837$ 1,043$ 961$
Accounts receivable 2,509 2,025 2,270
Inventories 2,895 2,787 2,845
Accounts payable - trade (2,850) (2,807) (2,631)
Working capital(a)
2,554$ 2,005$ 2,484$
Total debt(b)
6,259$ 5,729$ 5,933$
Net debt(b)
5,422$ 4,686$ 4,972$

First Quarter 2018
Free Cash Flow
(a) Other includes amortization and write-off of debt issuance costs, net pension curtailments and settlements, net rationalization charges, net (gains) losses on asset sales, compensation
and benefits less pension expense, other current liabilities, and other assets and liabilities.13
Terms: US$ millionsTrailing Twelve
Months Ended
2018 2017 March 31, 2018
Net Income 80$ 169$ 276$
Depreciation and Amortization 199 185 795
Change in Working Capital (449) (596) 41
Pension Expense 28 22 94
Pension Contributions and Direct Payments (21) (25) (86)
Provision for Deferred Income Taxes (17) 40 328
Rationalization Payments (106) (18) (242)
Other(a)
(103) (63) (151)
Cash Flow from Operating Activities (GAAP) (389)$ (286)$ 1,055$
Capital Expenditures (248) (271) (858)
Free Cash Flow (non-GAAP) (637)$ (557)$ 197$
Cash Flow from Investing Activities (GAAP) (248)$ (270)$ (857)$
Cash Flow from Financing Activities (GAAP) 399$ 398$ (414)$
Three Months Ended
March 31,

• Brazil volumes up 8% with growth in
both consumer and commercial
• OE volume up over 30%
• U.S. consumer replacement volume
better than USTMA members; U.S. OE
volume in line with lower OE production
• U.S commercial replacement volume
lower, expect growth going forward
First Quarter 2018 - Segment Results
Americas
14
Terms: US$ millionsUnits in millions
First Quarter
2018 2017 Change
Units 16.7 17.2 (2.9%)
Net Sales $1,929 $1,958 (1.5%)
Operating
Income$127 $216 (41.2%)
Margin 6.6% 11.0%

• Volume driven by declines in
consumer OE < 17” rim size segment
• Continuing to lower exposure
to this less profitable segment
• Share gains in consumer replacement,
both large and small rim size segments
• Slow start to summer sell-in given
long winter
• Commercial replacement volume
lower, expect growth going forward
First Quarter 2018 - Segment Results
Europe, Middle East & Africa
15
Terms: US$ millionsUnits in millions
First Quarter
2018 2017 Change
Units 14.7 15.5 (5.4%)
Net Sales $1,330 $1,239 7.3%
Operating
Income$78 $101 (22.8%)
Margin 5.9% 8.2%

• Volume growth driven by both
consumer OE and Replacement
• Consumer replacement growth
in key markets of India, Japan
and China
• Consumer OE driven by +14%
growth in China
• Continuing to expect double digit
volume growth and margin expansion
First Quarter 2018 - Segment Results
Asia Pacific
16
Terms: US$ millionsUnits in millions
First Quarter
2018 2017 Change
Units 7.6 7.3 4.5%
Net Sales $571 $502 13.7%
Operating
Income$76 $73 4.1%
Margin 13.3% 14.5%

Excluding the impact of transition volume from the launchof TireHub, continue to expect 2018 SOI of $1.8 to $1.9 billion
2018 Key Segment Operating Income Drivers (a)
(a) For information on our use of non-GAAP financial measures, including forward-looking non-GAAP financial measures, see Appendix on page 25.
DriverFebruary Outlook
2018 vs 2017
Current Outlook
2018 vs 2017Comments
Global Volume ~3% ~2%Temporary volume reduction as a
result of TireHub transition
Net Price/Mix vs Raw
Materials~$25 million ~($25) million
Raw materials based on current spot rates;
Expecting ~($65) million headwind in Q2 2018,
given difficult price comparable
Overhead Absorption ~$60 million ~$55 million Adjusted for TireHub transaction; ~Flat in Q2
Cost Savings vs Inflation ~$130 million ~$130 million No change
Foreign Exchange ~$15 million ~$40 million Based on current spot rates
Other ~($90) million ~($65) million ~($25) million headwind in Q2
17
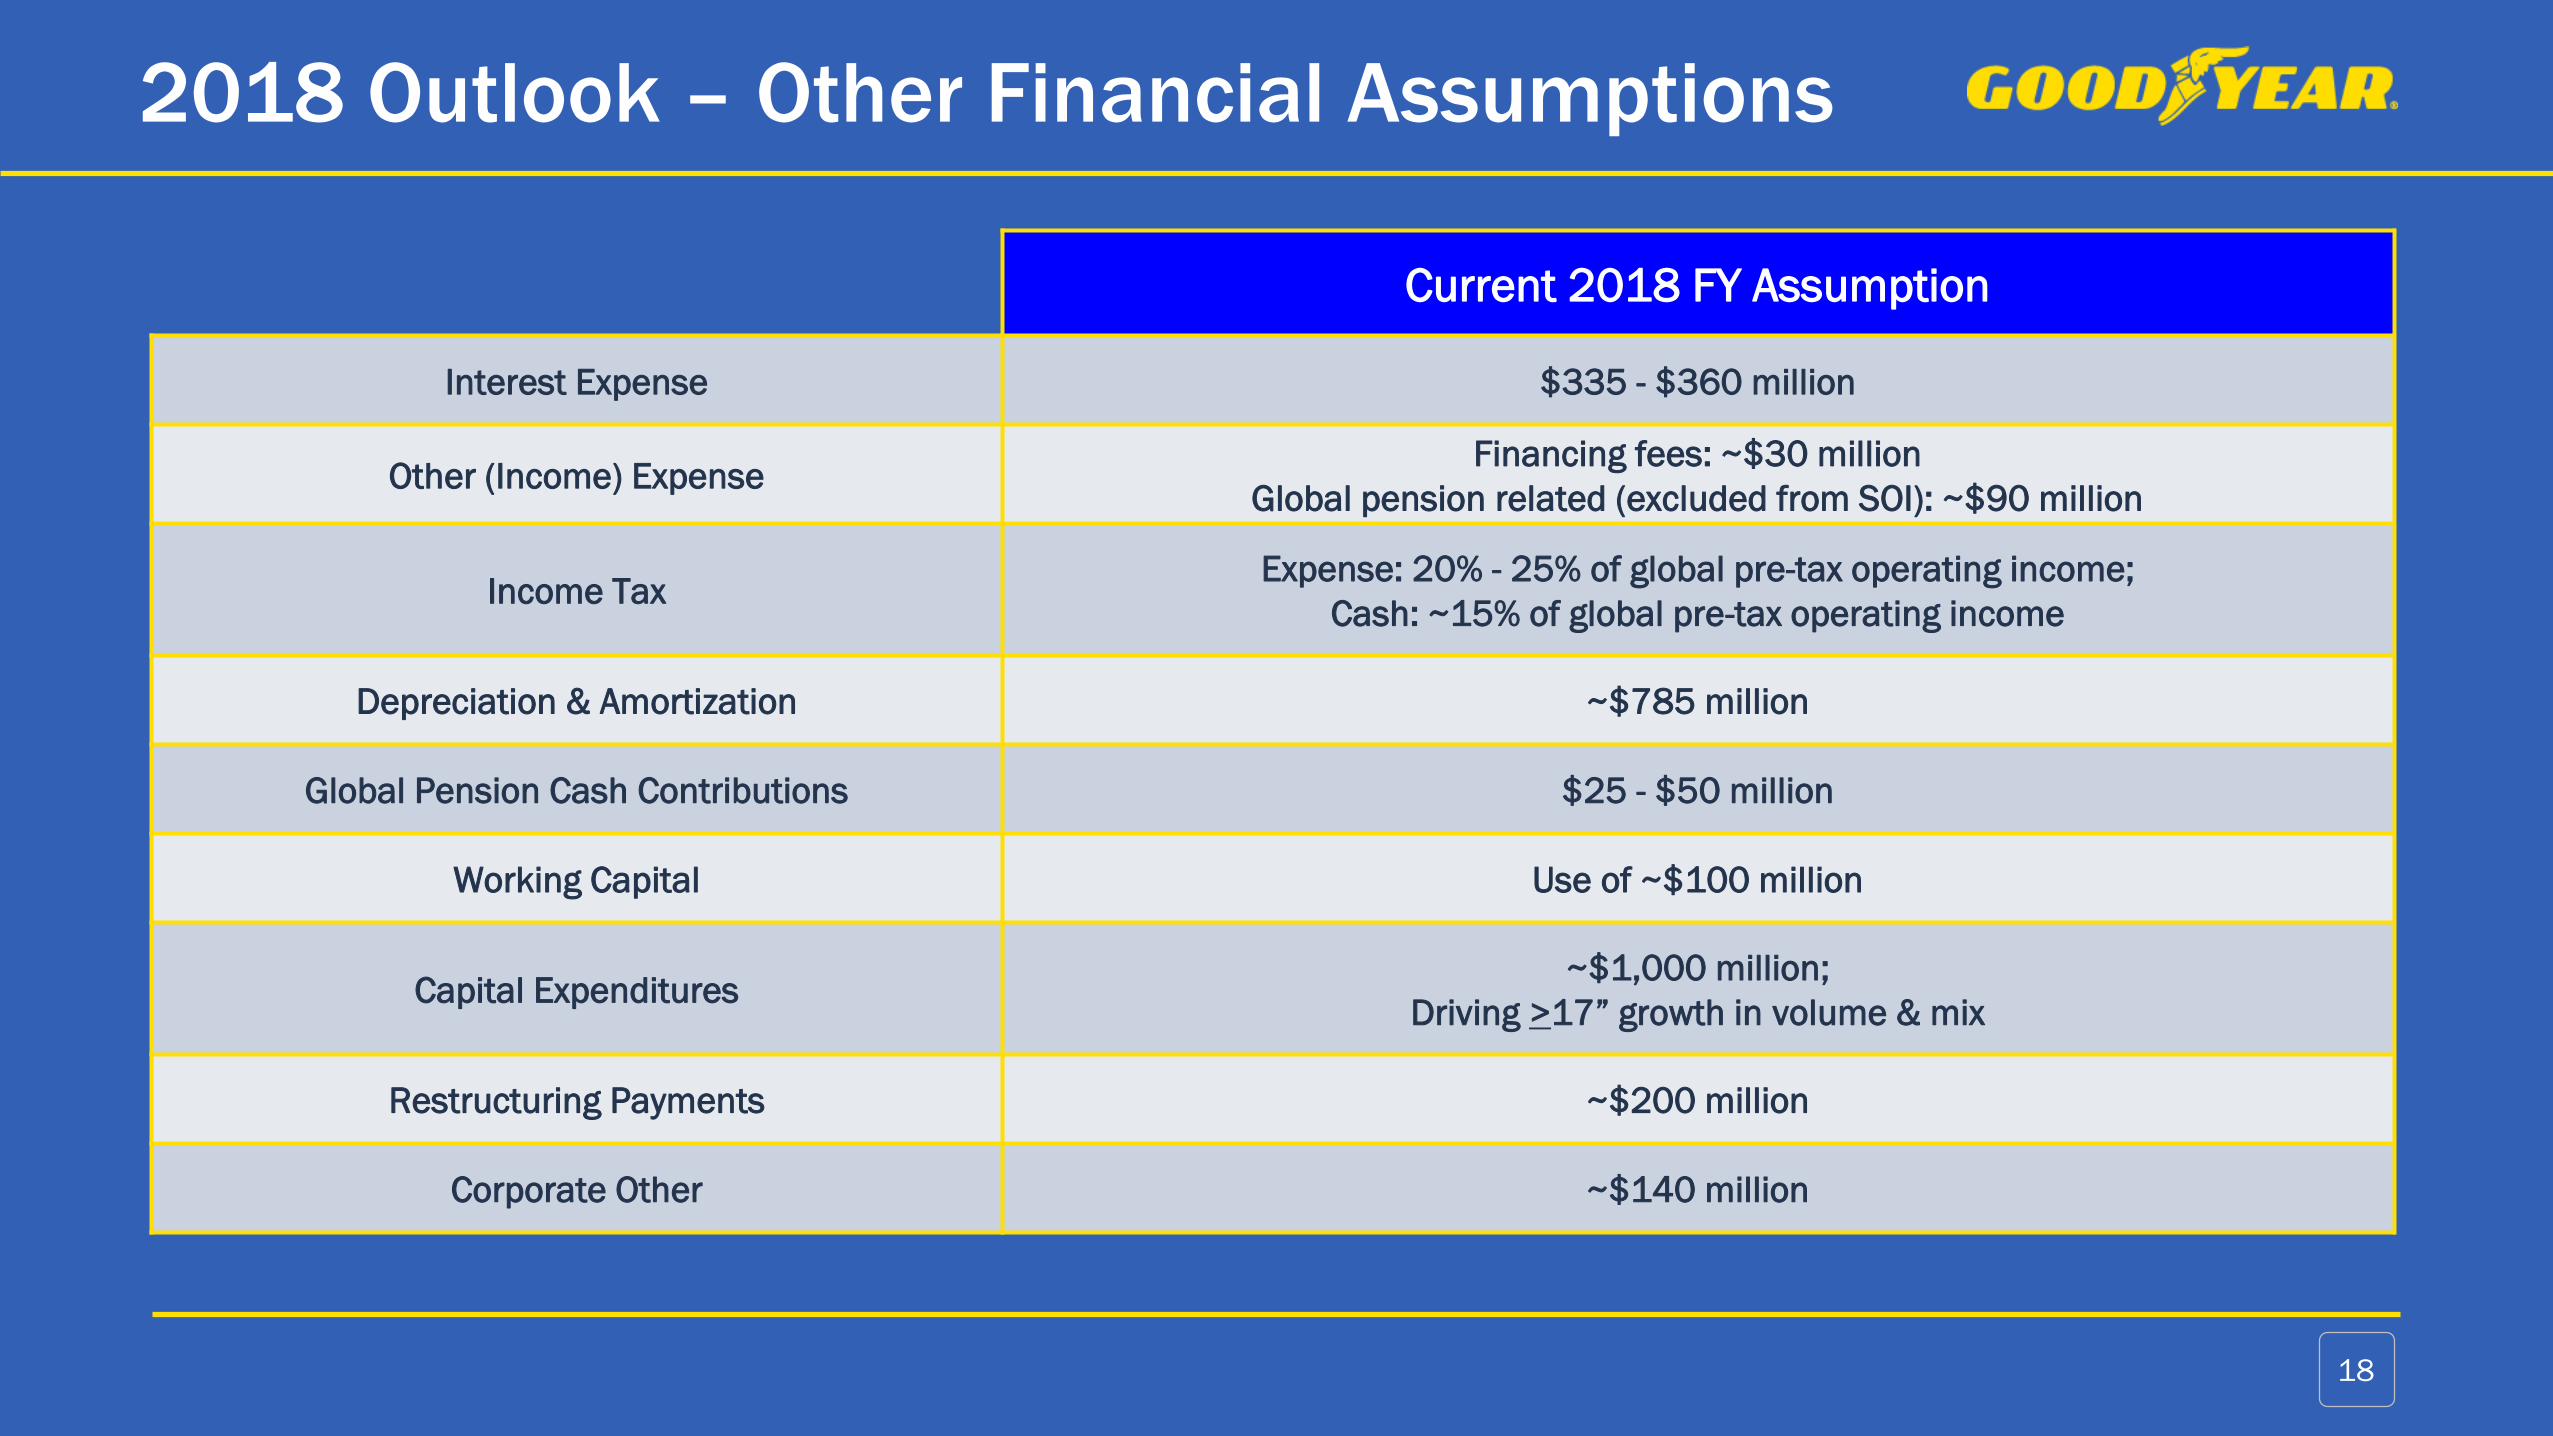
2018 Outlook – Other Financial Assumptions
18
Current 2018 FY Assumption
Interest Expense $335 - $360 million
Other (Income) ExpenseFinancing fees: ~$30 million
Global pension related (excluded from SOI): ~$90 million
Income TaxExpense: 20% - 25% of global pre-tax operating income;
Cash: ~15% of global pre-tax operating income
Depreciation & Amortization ~$785 million
Global Pension Cash Contributions $25 - $50 million
Working Capital Use of ~$100 million
Capital Expenditures~$1,000 million;
Driving >17” growth in volume & mix
Restructuring Payments ~$200 million
Corporate Other ~$140 million

Of

Appendix

Now expecting raw materials to be up ~$50 million for the year
2018 Raw Materials
(a) Impact to cost of goods sold before raw material cost saving measures. Based on raw material input costs holding at April 20, 2018 spot rates for the balance of 2018 21
Terms: US$ millions
$93
~$35
~$(80)
~$0
~$50
Q1 Q2E Q3E Q4E Full Year Est
+1%
-7%
0%
+3%
+9%
Raw Material Cost(a)
2018 vs 2017

First Quarter 2018 – Liquidity Profile
(a) Total liquidity comprised of $837 million of cash and cash equivalents, as well as $2,439 million of unused availability under various credit agreements. 22
Available
Credit Lines
Cash &
Equivalents
$3.3(a)
Terms: US$ billions
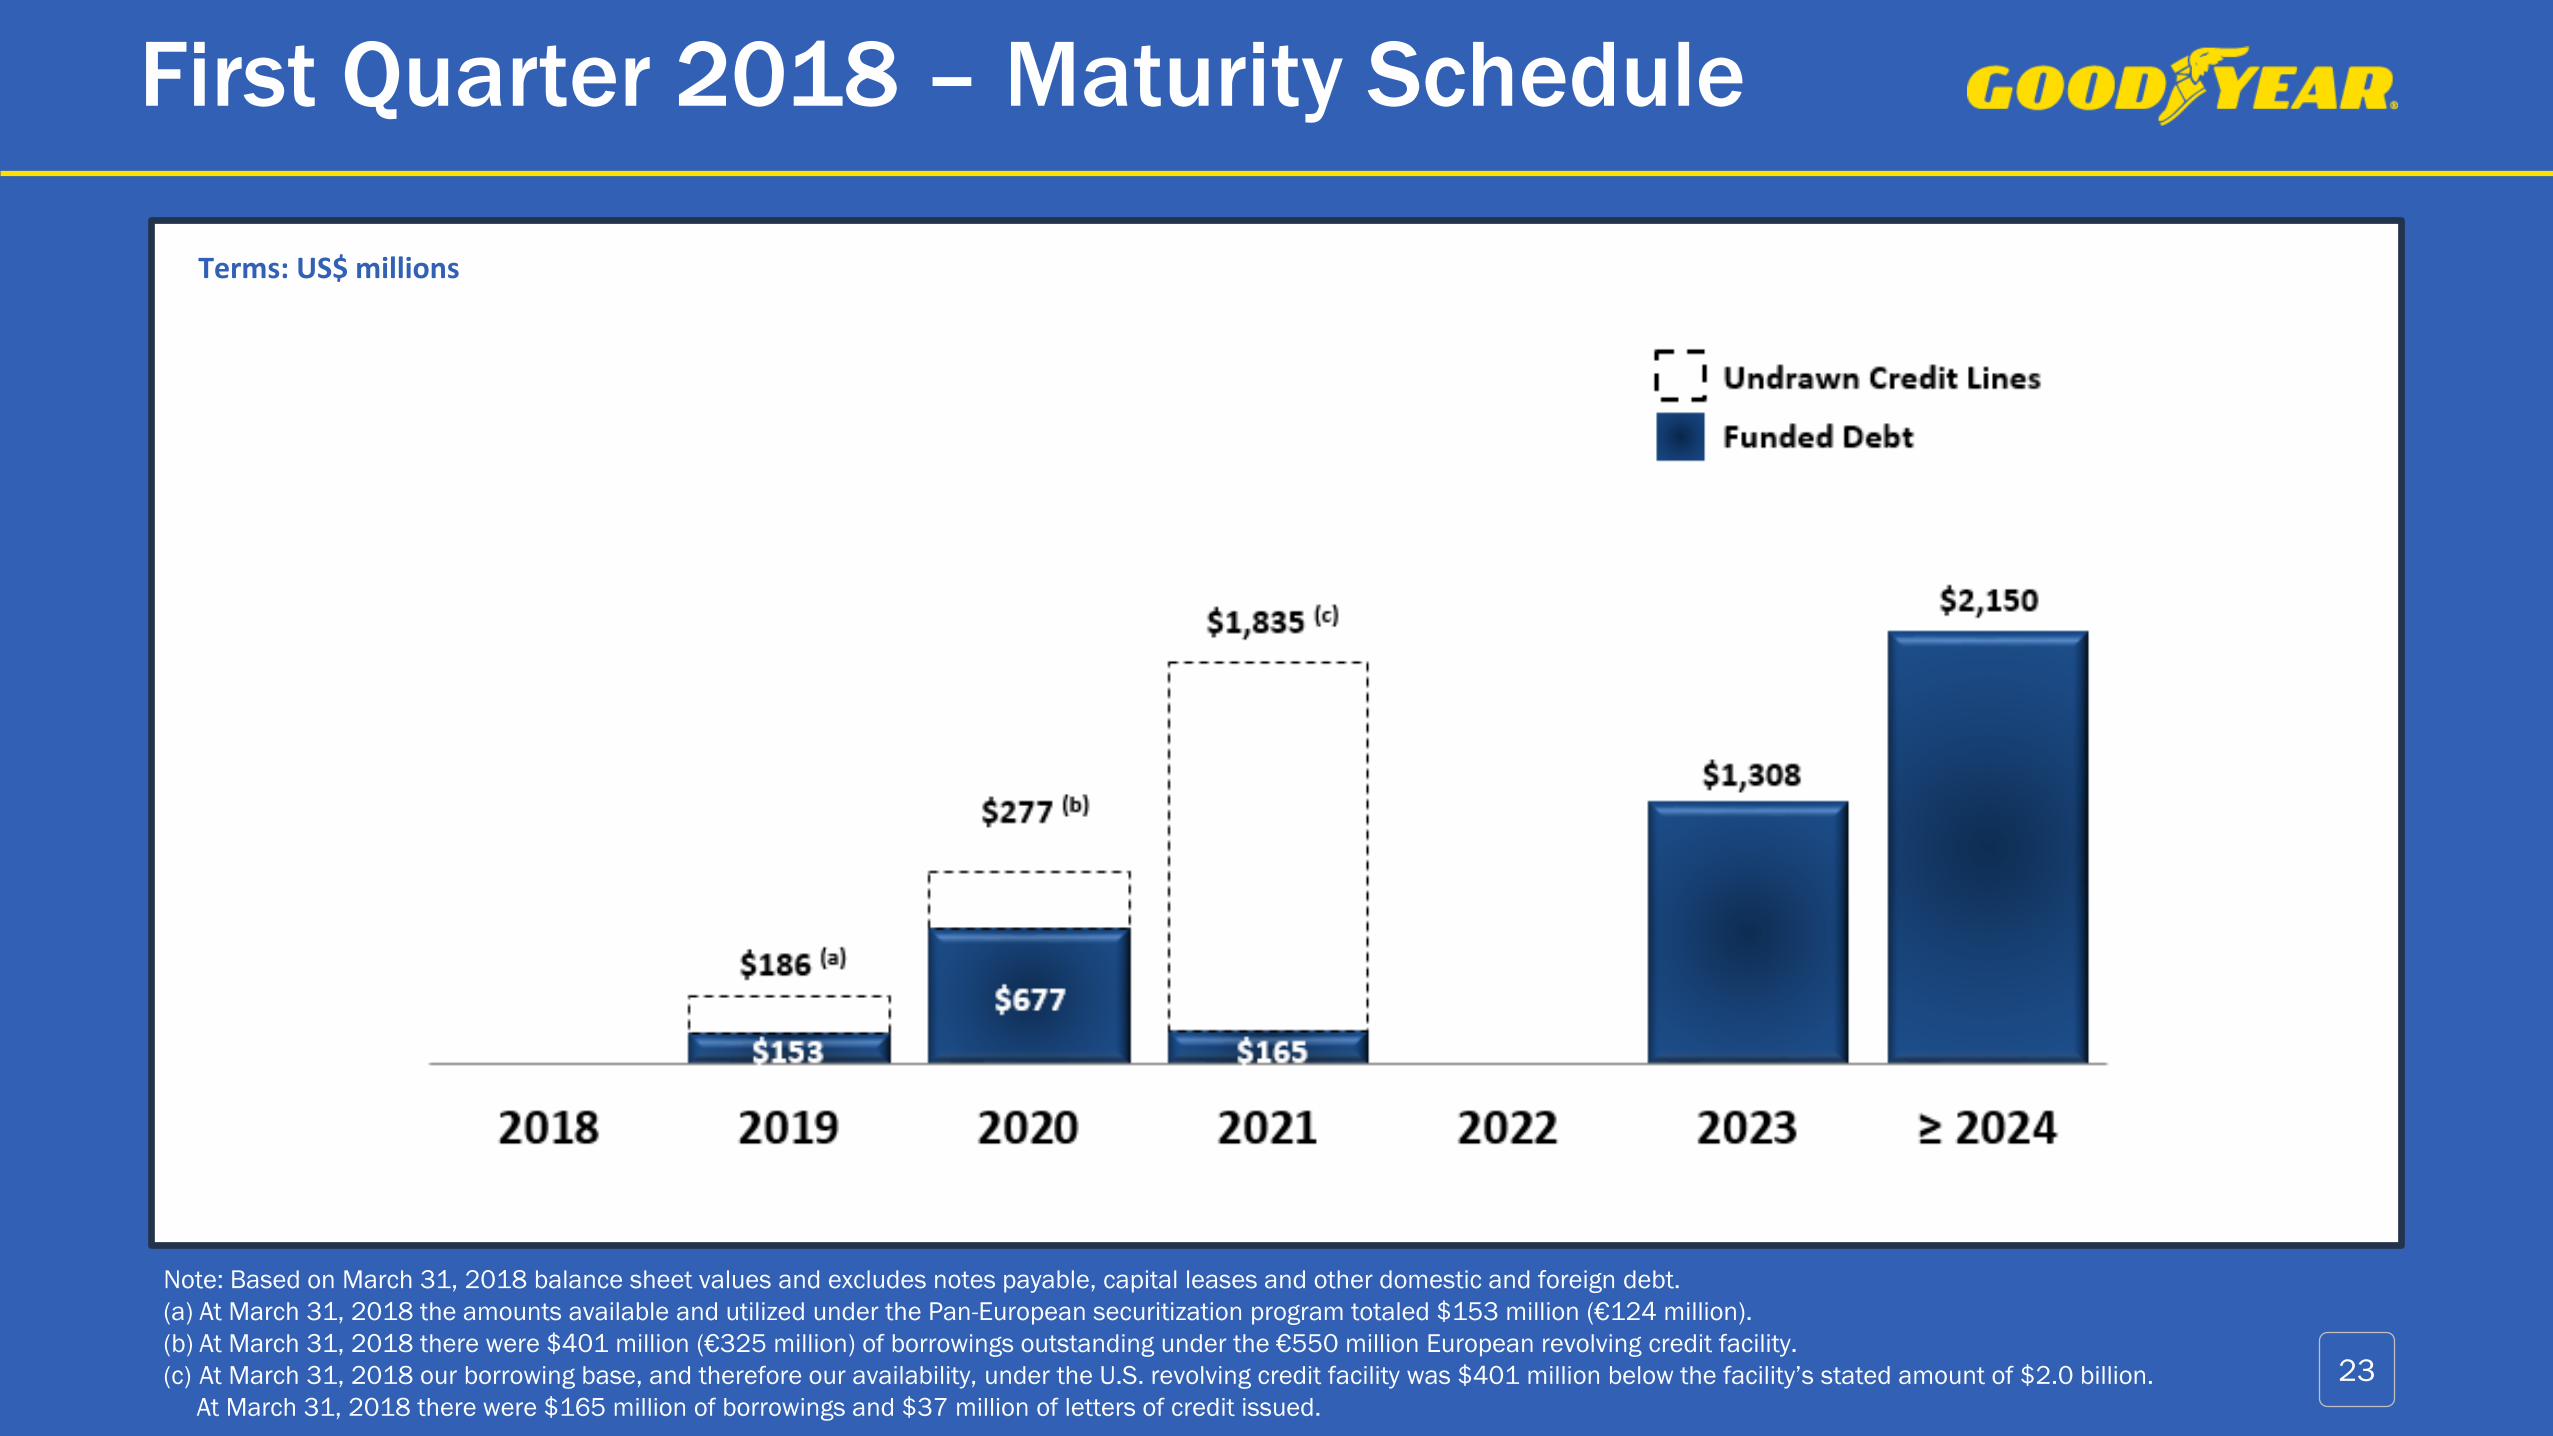
First Quarter 2018 – Maturity Schedule
Note: Based on March 31, 2018 balance sheet values and excludes notes payable, capital leases and other domestic and foreign debt.
(a) At March 31, 2018 the amounts available and utilized under the Pan-European securitization program totaled $153 million (€124 million).
(b) At March 31, 2018 there were $401 million (€325 million) of borrowings outstanding under the €550 million European revolving credit facility.
(c) At March 31, 2018 our borrowing base, and therefore our availability, under the U.S. revolving credit facility was $401 million below the facility’s stated amount of $2.0 billion.
At March 31, 2018 there were $165 million of borrowings and $37 million of letters of credit issued.
23
Terms: US$ millions

2018 Full-Year Industry Outlook
(a) For replacement, Western Europe is Europool and Turkey. For OE, Western Europe is total EMEA. 24
Full-Year 2018 Guidance
United States Western Europe (a)
Consumer Replacement ~Flat – 2% ~Flat – 2%
Consumer OE ~Flat ~Flat – 2%
Commercial Replacement ~1 – 3% ~2 – 4%
Commercial OE ~10% ~1 – 3%
Use of Historical and Forward-Looking Non-GAAP Financial MeasuresThis presentation contains historical and forward-looking non-GAAP financial measures, including Total Segment Operating Income and Margin, Free Cash Flow, Adjusted Net
Income and Adjusted Diluted Earnings Per Share (EPS), which are important financial measures for the company but are not financial measures defined by U.S. GAAP, and should
not be construed as alternatives to corresponding financial measures presented in accordance with U.S. GAAP.
Total Segment Operating Income is the sum of the individual strategic business units’ (SBUs’) Segment Operating Income as determined in accordance with U.S. GAAP. Total
Segment Operating Margin is Total Segment Operating Income divided by Net Sales as determined in accordance with U.S. GAAP. Management believes that Total Segment
Operating Income and Margin are useful because they represent the aggregate value of income created by the company’s SBUs and exclude items not directly related to the SBUs
for performance evaluation purposes. The most directly comparable U.S. GAAP financial measures to Total Segment Operating Income and Margin are Goodyear Net Income and
Return on Net Sales (which is calculated by dividing Goodyear Net Income by Net Sales).
Free Cash Flow is the company’s Cash Flows from Operating Activities as determined in accordance with U.S. GAAP, less capital expenditures. Management believes that Free
Cash Flow is useful because it represents the cash generating capability of the company’s ongoing operations, after taking into consideration capital expenditures necessary to
maintain its business and pursue growth opportunities. The most directly comparable U.S. GAAP financial measure is Cash Flows from Operating Activities.
Adjusted Net Income is Goodyear Net Income as determined in accordance with U.S. GAAP adjusted for certain significant items. Adjusted Diluted EPS is the company’s Adjusted
Net Income divided by Weighted Average Shares Outstanding-Diluted as determined in accordance with U.S. GAAP. Management believes that Adjusted Net Income and Adjusted
Diluted EPS are useful because they represent how management reviews the operating results of the company excluding the impacts of rationalizations, asset write-offs,
accelerated depreciation, asset sales and certain other significant items.
It should be noted that other companies may calculate similarly-titled non-GAAP financial measures differently and, as a result, the measures presented herein may not be
comparable to such similarly-titled measures reported by other companies.
We are unable to present a quantitative reconciliation of our forward-looking non-GAAP financial measures, other than Free Cash Flow, to the most directly comparable U.S. GAAP
financial measures because management cannot reliably predict all of the necessary components of those U.S. GAAP financial measures without unreasonable effort. Those
forward-looking non-GAAP financial measures, or components thereof, would be reconciled to Goodyear Net Income, which includes several significant items that are not included
in the comparable non-GAAP financial measures, such as rationalization charges, other (income) expense, pension curtailments and settlements, and income taxes. The decisions
and events that typically lead to the recognition of these and other similar non-GAAP adjustments, such as a decision to exit part of our business, acquisitions and dispositions,
foreign currency exchange gains and losses, financing fees, actions taken to manage our pension liabilities, and the recording or release of tax valuation allowances, are inherently
unpredictable as to if or when they may occur. The inability to provide a reconciliation is due to that unpredictability and the related difficulty in assessing the potential financial
impact of the non-GAAP adjustments. For the same reasons, we are unable to address the probable significance of the unavailable information, which could be material to our
future financial results.
25

First Quarter 2018 Significant Items(After Tax and Minority Interest)
26
Terms: US$ millions, (except EPS)
As
Reported
Rationalizations,
Asset Write-offs, and
Accelerated
Depreciation
Discrete Tax
Items
Pension
Standard
Change
TireHub
Transaction
Costs Hurricane Effect As Adjusted
Net Sales 3,830$ -$ -$ -$ -$ -$ 3,830$
Cost of Goods Sold 2,976 (1) - - - - 2,975
Gross Margin 854 1 - - - - 855
SAG 591 - - - - - 591
Rationalizations 37 (37) - - - - -
Interest Expense 76 - - - - - 76
Other (Income) Expense 37 - - (9) (4) (3) 21
Pre-tax Income 113 38 - 9 4 3 167
Taxes 33 11 (7) 2 1 - 40
Minority Interest 5 - - - - - 5
Goodyear Net Income 75$ 27$ 7$ 7$ 3$ 3$ 122$
EPS 0.31$ 0.11$ 0.03$ 0.03$ 0.01$ 0.01$ 0.50$
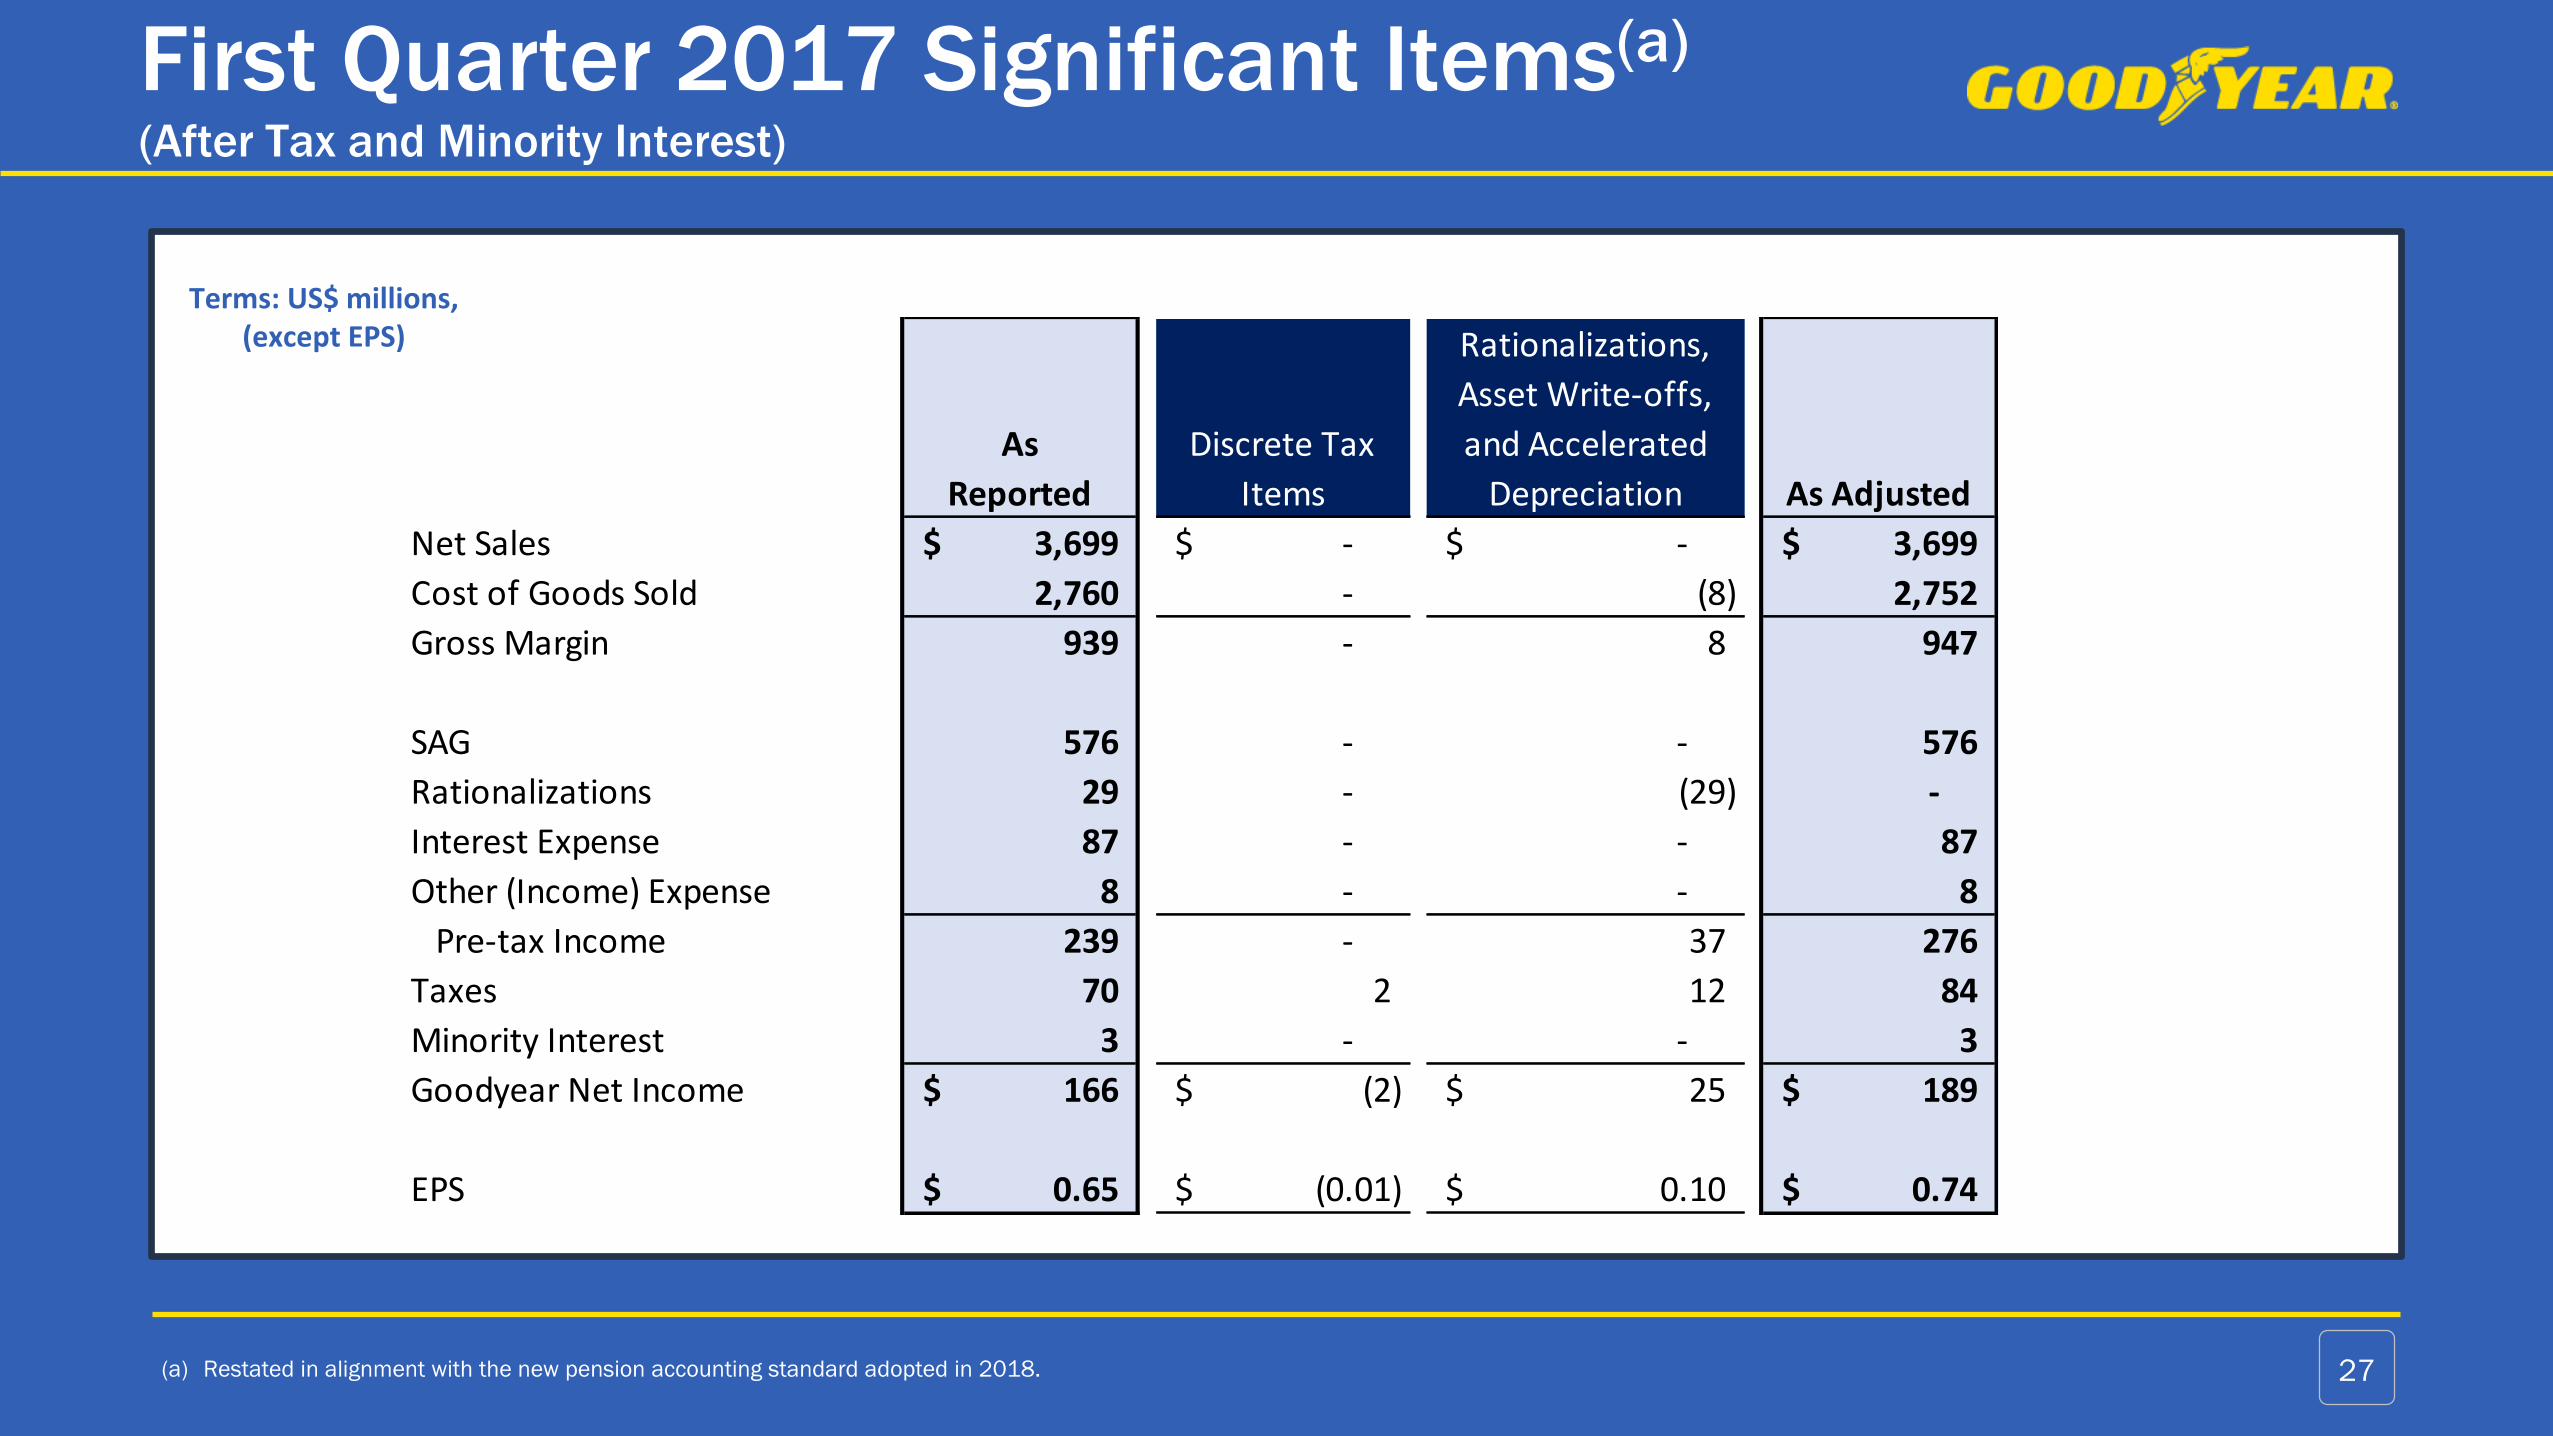
First Quarter 2017 Significant Items(a)
(After Tax and Minority Interest)
(a) Restated in alignment with the new pension accounting standard adopted in 2018. 27
Terms: US$ millions, (except EPS)
As
Reported
Discrete Tax
Items
Rationalizations,
Asset Write-offs,
and Accelerated
Depreciation As Adjusted
Net Sales 3,699$ -$ -$ 3,699$
Cost of Goods Sold 2,760 - (8) 2,752
Gross Margin 939 - 8 947
SAG 576 - - 576
Rationalizations 29 - (29) -
Interest Expense 87 - - 87
Other (Income) Expense 8 - - 8
Pre-tax Income 239 - 37 276
Taxes 70 2 12 84
Minority Interest 3 - - 3
Goodyear Net Income 166$ (2)$ 25$ 189$
EPS 0.65$ (0.01)$ 0.10$ 0.74$

Reconciliation for Segment Operating Income/Margin
28(a) Restated in alignment with the new pension accounting standard adopted in 2018.
Terms: US$ millions
2018 2017(a)
Total Segment Operating Income 281$ 390$
Rationalizations (37) (29)
Interest expense (76) (87)
Other expense (37) (8)
Asset write-offs and accelerated depreciation (1) (8)
Corporate incentive compensation plans (4) (15)
Intercompany profit elimination 3 3
Retained expenses of divested operations (3) (3)
Other (13) (4)
Income before Income Taxes 113$ 239$
United States and Foreign Tax Expense 33 70
Less: Minority Shareholders Net Income 5 3
Goodyear Net Income 75$ 166$
Net Sales (as reported) $3,830 $3,699
Return on Net Sales (as reported) 2.0% 4.5%
Total Segment Operating Margin 7.3% 10.5%
March 31,
Three Months Ended
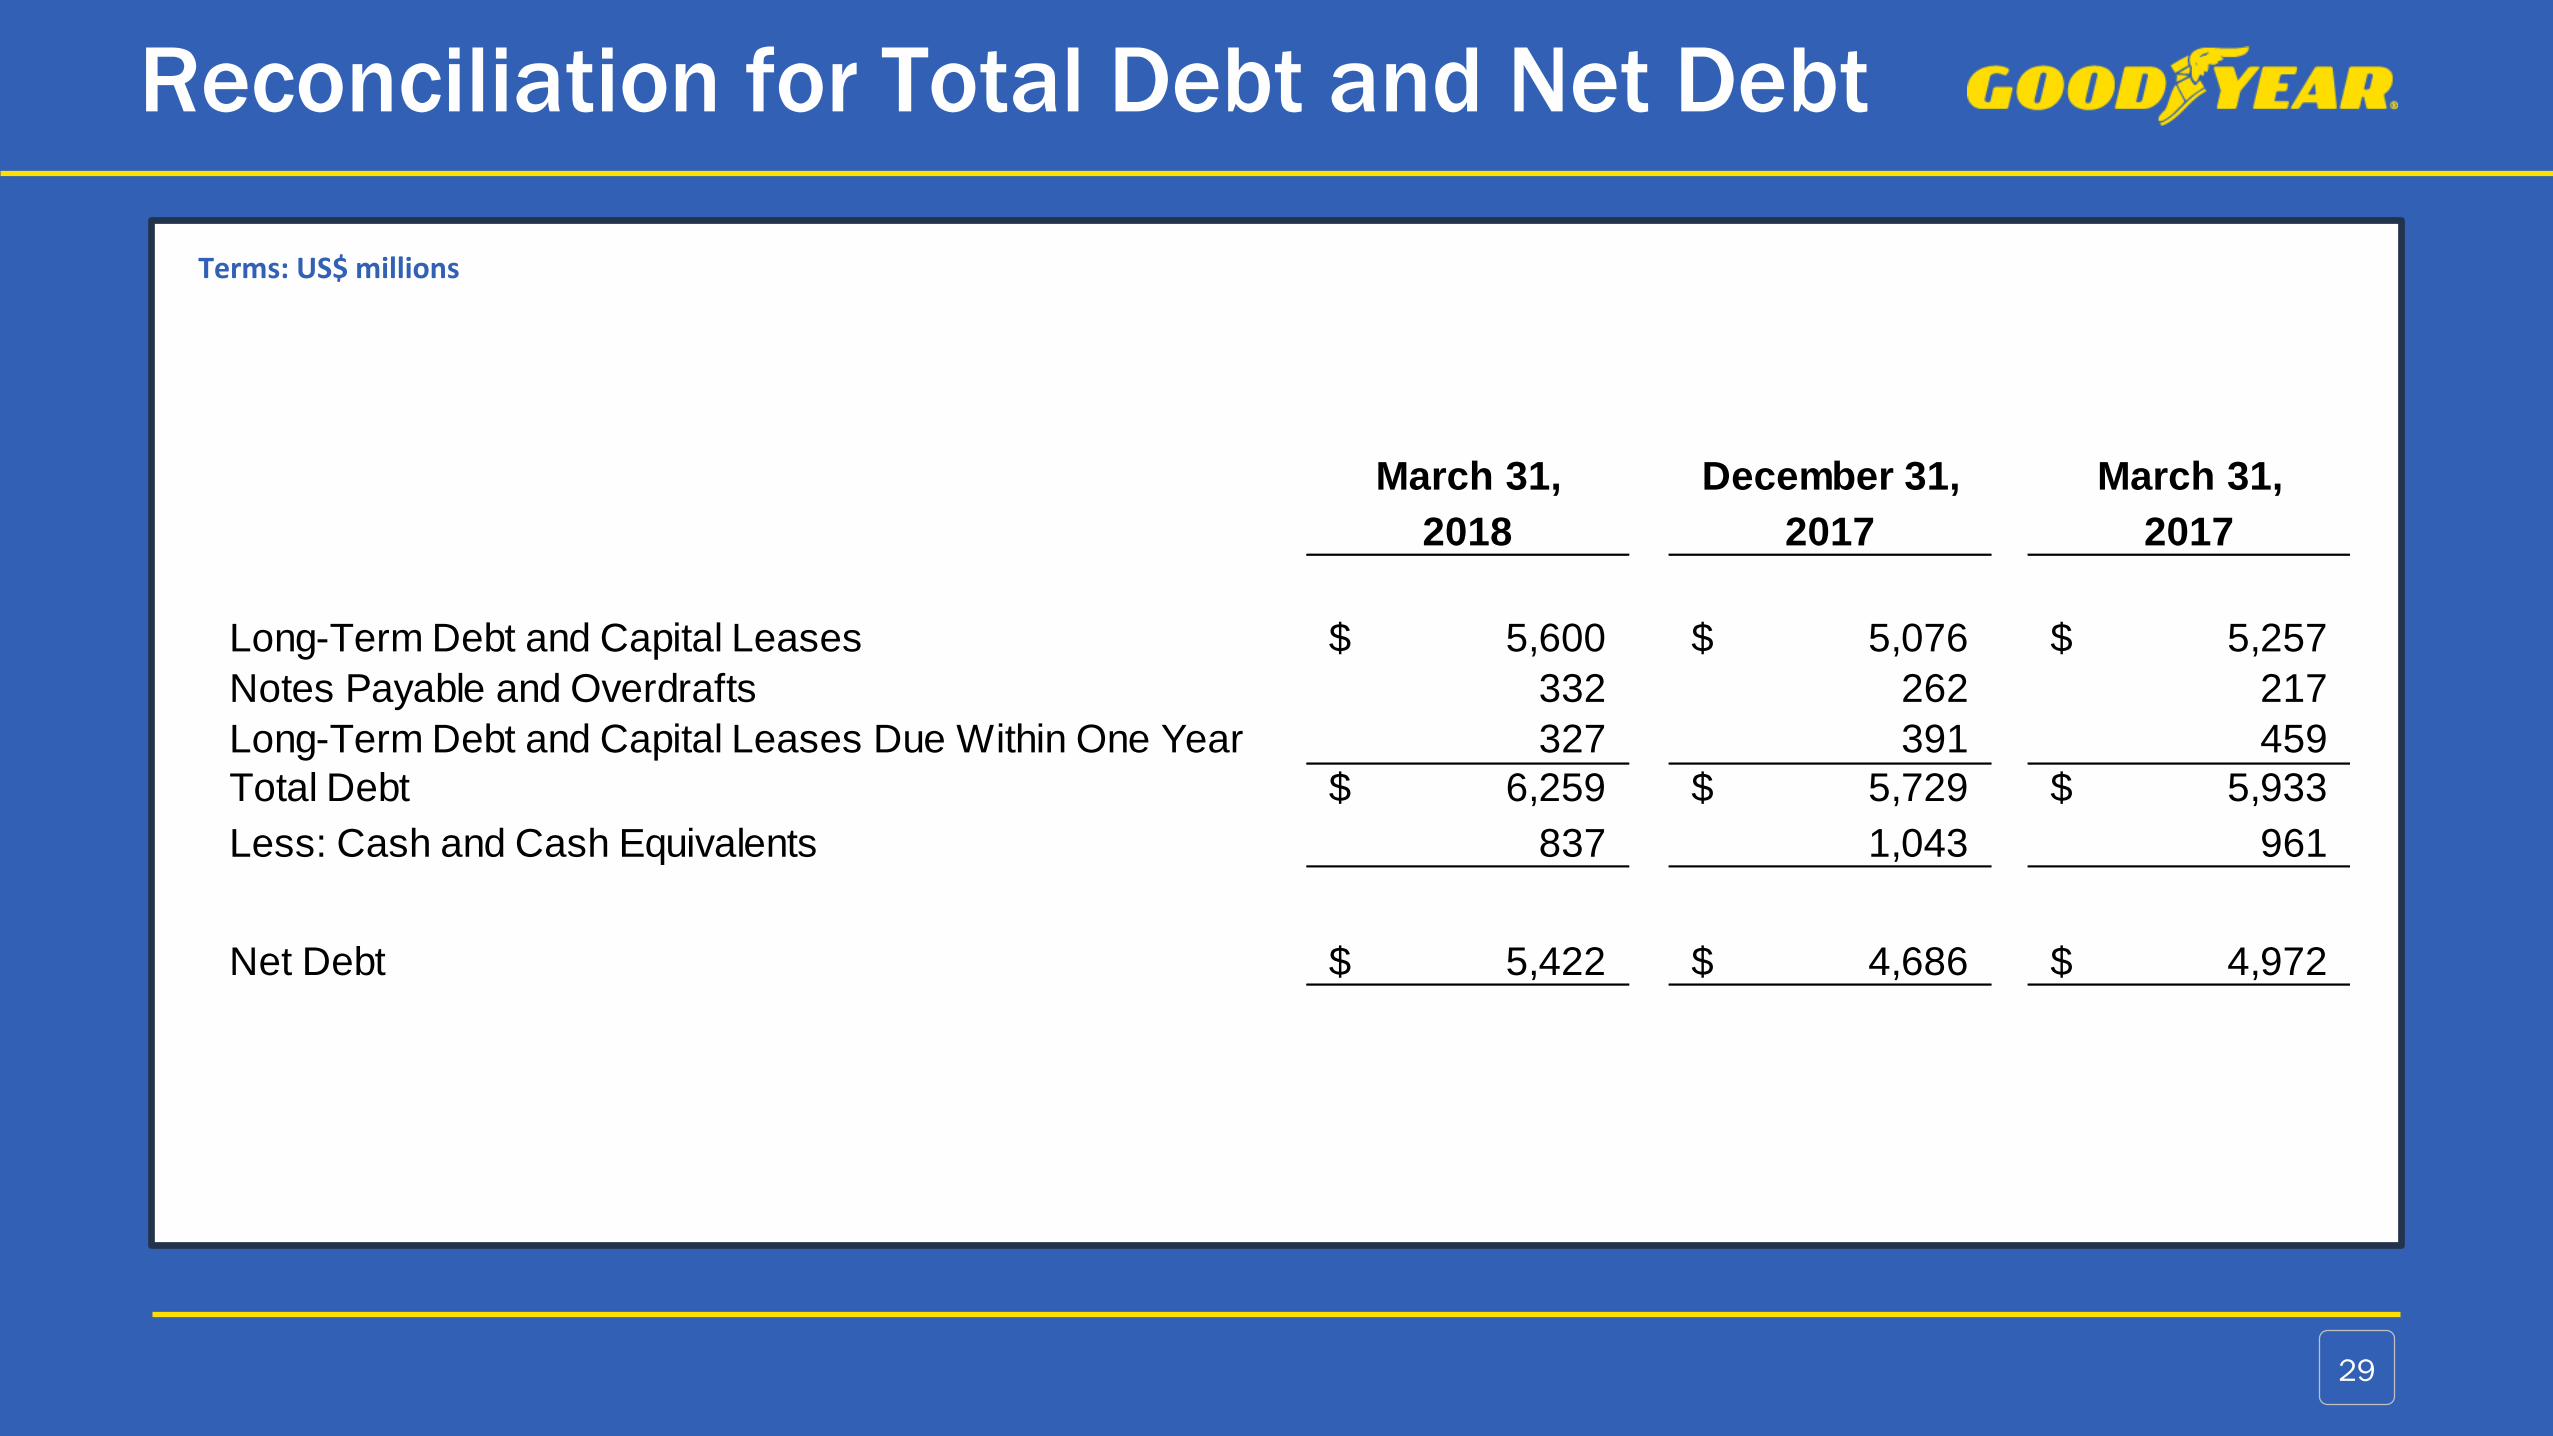
Reconciliation for Total Debt and Net Debt
29
Terms: US$ millions
March 31, December 31, March 31,
2018 2017 2017
Long-Term Debt and Capital Leases 5,600$ 5,076$ 5,257$
Notes Payable and Overdrafts 332 262 217
Long-Term Debt and Capital Leases Due Within One Year 327 391 459
Total Debt 6,259$ 5,729$ 5,933$
Less: Cash and Cash Equivalents 837 1,043 961
Net Debt 5,422$ 4,686$ 4,972$
