first quarter earnings presentation · first quarter 2018 financial summary 4 ($ in millions unless...
TRANSCRIPT

First QuarterEarnings Presentation
May 4, 2018
Safe Harbor Statement and Other Matters
2
This presentation contains forward-looking statements, within the meaning of the safe harbor provisions of the U.S. Private Securities Litigation Reform Act of 1995, which involve risks and uncertainties. Forward-looking statements provide current expectations of future events based on certain assumptions and include any statement that does not directly relate to a historical or current fact. The words "believe," "expect," “will,” "anticipate," "plan," "estimate," "target," "project" and similar expressions, among others, generally identify "forward-looking statements," which speak only as of the date such statements were made. These forward-looking statements may address, among other things, the outcome or resolution of any pending or future environmental liabilities, the commencement, outcome or resolution of any regulatory inquiry, investigation or proceeding, the initiation, outcome or settlement of any litigation, changes in environmental regulations in the U.S. or other jurisdictions that affect demand for or adoption of our products, anticipated future operating and financial performance, business plans and prospects, capital investments and projects, plans for dividends or share repurchases, sufficiency or longevity of intellectual property protection, cost savings targets, plans to increase profitability and growth, our ability to make acquisitions, integrate acquired businesses or assets into our operations, and achieve anticipated synergies or cost savings, and our outlook for net sales, Adjusted EBITDA, Adjusted EPS, Free Cash Flow and Return on Invested Capital (ROIC), all of which are subject to substantial risks and uncertainties that could cause actual results to differ materially from those expressed or implied by such statements. Forward-looking statements are based on certain assumptions and expectations of future events that may not be accurate or realized. These statements are not guarantees of future performance. Forward-looking statements also involve risks and uncertainties that are beyond Chemours' control. Additionally, there may be other risks and uncertainties that Chemours is unable to identify at this time or that Chemours does not currently expect to have a material impact on its business. Factors that could cause or contribute to these differences include the risks, uncertainties and other factors discussed in our filings with the Securities and Exchange Commission, including in our Annual Report on Form 10-K for the year ended December 31, 2017. Chemours assumes no obligation to revise or update any forward-looking statement for any reason, except as required by law.
We prepare our financial statements in accordance with Generally Accepted Accounting Principles (“GAAP”). Within this presentation we may make reference to Adjusted Net Income, Adjusted EPS, Adjusted EBITDA, Adjusted EBITDA margin, Adjusted Pre-tax Operating Income, Free Cash Flow, Return on Invested Capital (ROIC) and Net Leverage Ratio which are non-GAAP financial measures. The company includes these non-GAAP financial measures because management believes they are useful to investors in that they provide for greater transparency with respect to supplemental information used by management in its financial and operational decision making. Further information with respect to and reconciliations of such measures to the nearest GAAP measure can be found in the appendix hereto.
Management uses Adjusted Net Income, Adjusted EPS, Adjusted EBITDA, Adjusted EBITDA margin, Adjusted Pre-tax Operating Income, Free Cash Flow, ROIC and Net Leverage Ratio to evaluate the company’s performance excluding the impact of certain noncash charges and other special items which we expect to be infrequent in occurrence in order to have comparable financial results to analyze changes in our underlying business from quarter to quarter.
Additional information for investors is available on the company’s website at investors.chemours.com.
Highlights
3
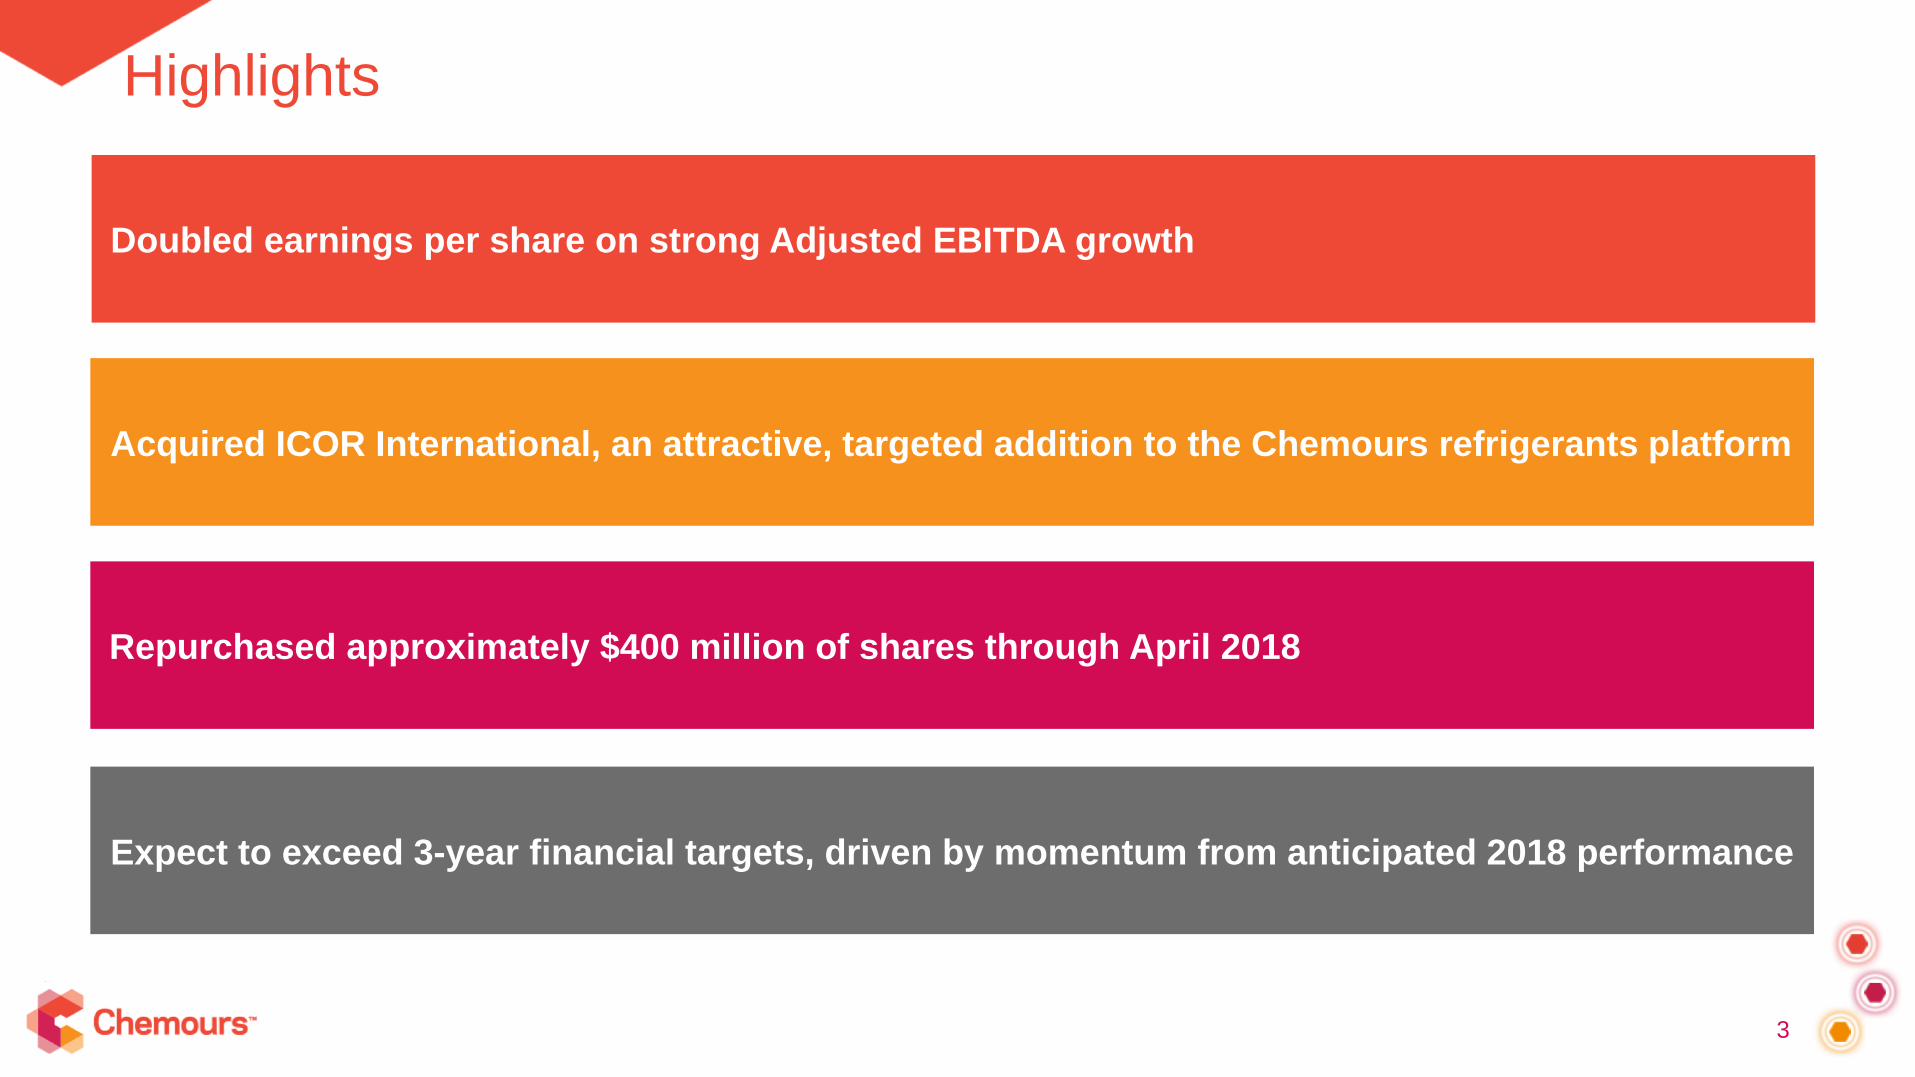
Doubled earnings per share on strong Adjusted EBITDA growth
Acquired ICOR International, an attractive, targeted addition to the Chemours refrigerants platform
Repurchased approximately $400 million of shares through April 2018
Expect to exceed 3-year financial targets, driven by momentum from anticipated 2018 performance

First Quarter 2018 Financial Summary
4
($ in millions unless otherwise noted)
1Q18 1Q17∆
Yr/Yr
Net Sales $1,730 $1,437 293
Net Income1 297 150 147
Adj. Net Income 266 131 135
EPS2 $1.58 $0.79 $0.79
Adj. EPS2 $1.41 $0.70 $0.71
Adj. EBITDA 468 285 183
Adj. EBITDA Margin (%) 3 27 20 7
Free Cash Flow4 94 (28) 122
Pre-Tax ROIC (%)5 40 21 19
Year-Over-Year
Strong financial performance
driven by contributions from all
three businesses
Doubled EPS on Adjusted
EBITDA margin improvement of
approximately 700 basis points
Significant Free Cash Flow
despite seasonal working capital
use and elevated capital
expenditures
Pre-tax ROIC expansion to 40%
1 Net Income attributable to Chemours2 Calculation based on diluted share count3 Defined as Adjusted EBITDA divided by Net Sales4 Defined as Cash from Operations minus cash used for PP&E purchases5 Defined as Adjusted EBITDA on a trailing twelve-month basis less depreciation & amortization divided by average invested capital over the last five quarters
See reconciliation of Non-GAAP measures in the Appendix

Adjusted EBITDA Bridge: 1Q18 versus 1Q17
5See reconciliation of Non-GAAP measures in the Appendix
$285
$468
$47
$140
$47
$43
0
100
200
300
400
500
1Q17 Local Price Volume Currency Cost/Other 1Q18
Positive Impact
Negative Impact• Ti-Pure™ global average price up 22%
• Contractual pricing adjustments for
mobile Opteon™ products offset by
higher base refrigerant and
Fluoropolymers pricing
• Continued adoption of
Opteon™ refrigerants
• Increased demand for
fluoropolymer products and
Ti-Pure™ titanium dioxide
• Higher raw material
and distribution costs
• Water treatment costs
($ in millions unless otherwise noted)

Adjusted EPS Bridge: 1Q18 versus 1Q17
6See reconciliation of Non-GAAP measures in the Appendix
$0.70
$1.41
$0.26
$0.97
$0.00
0
0.2
0.4
0.6
0.8
1
1.2
1.4
1.6
1.8
2
1Q17 Pre-Tax Mix Shares 1Q18
Positive Impact
Negative Impact
($ per share unless otherwise noted)
Adjusted
Operating Income
Change in Effective
Tax Rate
Change in
Diluted Shares1
1 Based on average shares outstanding in 1Q18
• Geographic mix of earnings
• Discrete tax items

Liquidity Position
7
$1,556
$1,434
$192
$102 $31
$185
$297
$73
$18
4Q17Cash
Balance
1Q18Net
Income*
Depr.,Amort.
Impairment
DeferredTax &Other
WorkingCapital
CAPEX Dividend Other 1Q18Cash
Balance
Negative Impact
Positive Impact
Operating Cash Flow $196M
March 31, 2018 ending cash
of $1.4B
Free Cash Flow of $94M1
versus ($28M) in 1Q17
Capital expenditures of $102M
Completed $400M of share
repurchases since inception,
including $240M in 1Q18
Total Liquidity of ~$2.2B,
including revolver availability of
$800M2
Net debt of $2.7B, net leverage
ratio3 of ~1.7 times on a trailing
twelve month basis
Amended and restated Credit
Agreement in April 2018
1 Includes cash restructuring payments of $13M in 1Q182 Based on new revolving credit facility. Chemours had $106M in letters of credit outstanding as of March 31, 20183 Senior Secured Net Debt/EBITDA is 0.4 based on Credit Agreement definition4 Reflects cash used for share repurchases and proceeds from the sales of property
* Net Income attributable to Chemours
4
($ in millions unless otherwise noted)
See reconciliation of Non-GAAP measures in the Appendix

8
Fluoroproducts Business Summary
Financial Summary ($ in millions)
Adoption of Opteon™ stationary blends in Europe and
mobile refrigerants in US drove strong year-over-year
volume increase
Higher price for base refrigerants due to tightening
regulations and global supply constraints
Broad-based Fluoropolymers demand growth and
improved price across most product lines
Anticipate continued transition to Opteon™ stationary
blends in Europe and mobile refrigerants in US
Expect sales of base refrigerants to benefit from
improved price with flat volume
Anticipate Fluoropolymers demand slightly above GDP
Planned maintenance at Fluoropolymer facilities in
second and third quarters
See reconciliation of Non-GAAP measures in the Appendix
2018 Outlook CommentaryFirst Quarter Highlights
$652
$732
1Q17 1Q18
Net Sales
$155
$206
24%28%
0
0.1
0.2
0.3
0.4
0.5
0.6
0.7
0.8
0
50
100
150
200
1Q17 1Q18
Adjusted EBITDA
Adjusted EBITDA Margin
Yr/Yr
% ∆
Price 0
Currency 4
Volume 8
Sales Drivers
9
Chemical Solutions Business Summary
Financial Summary ($ in millions)
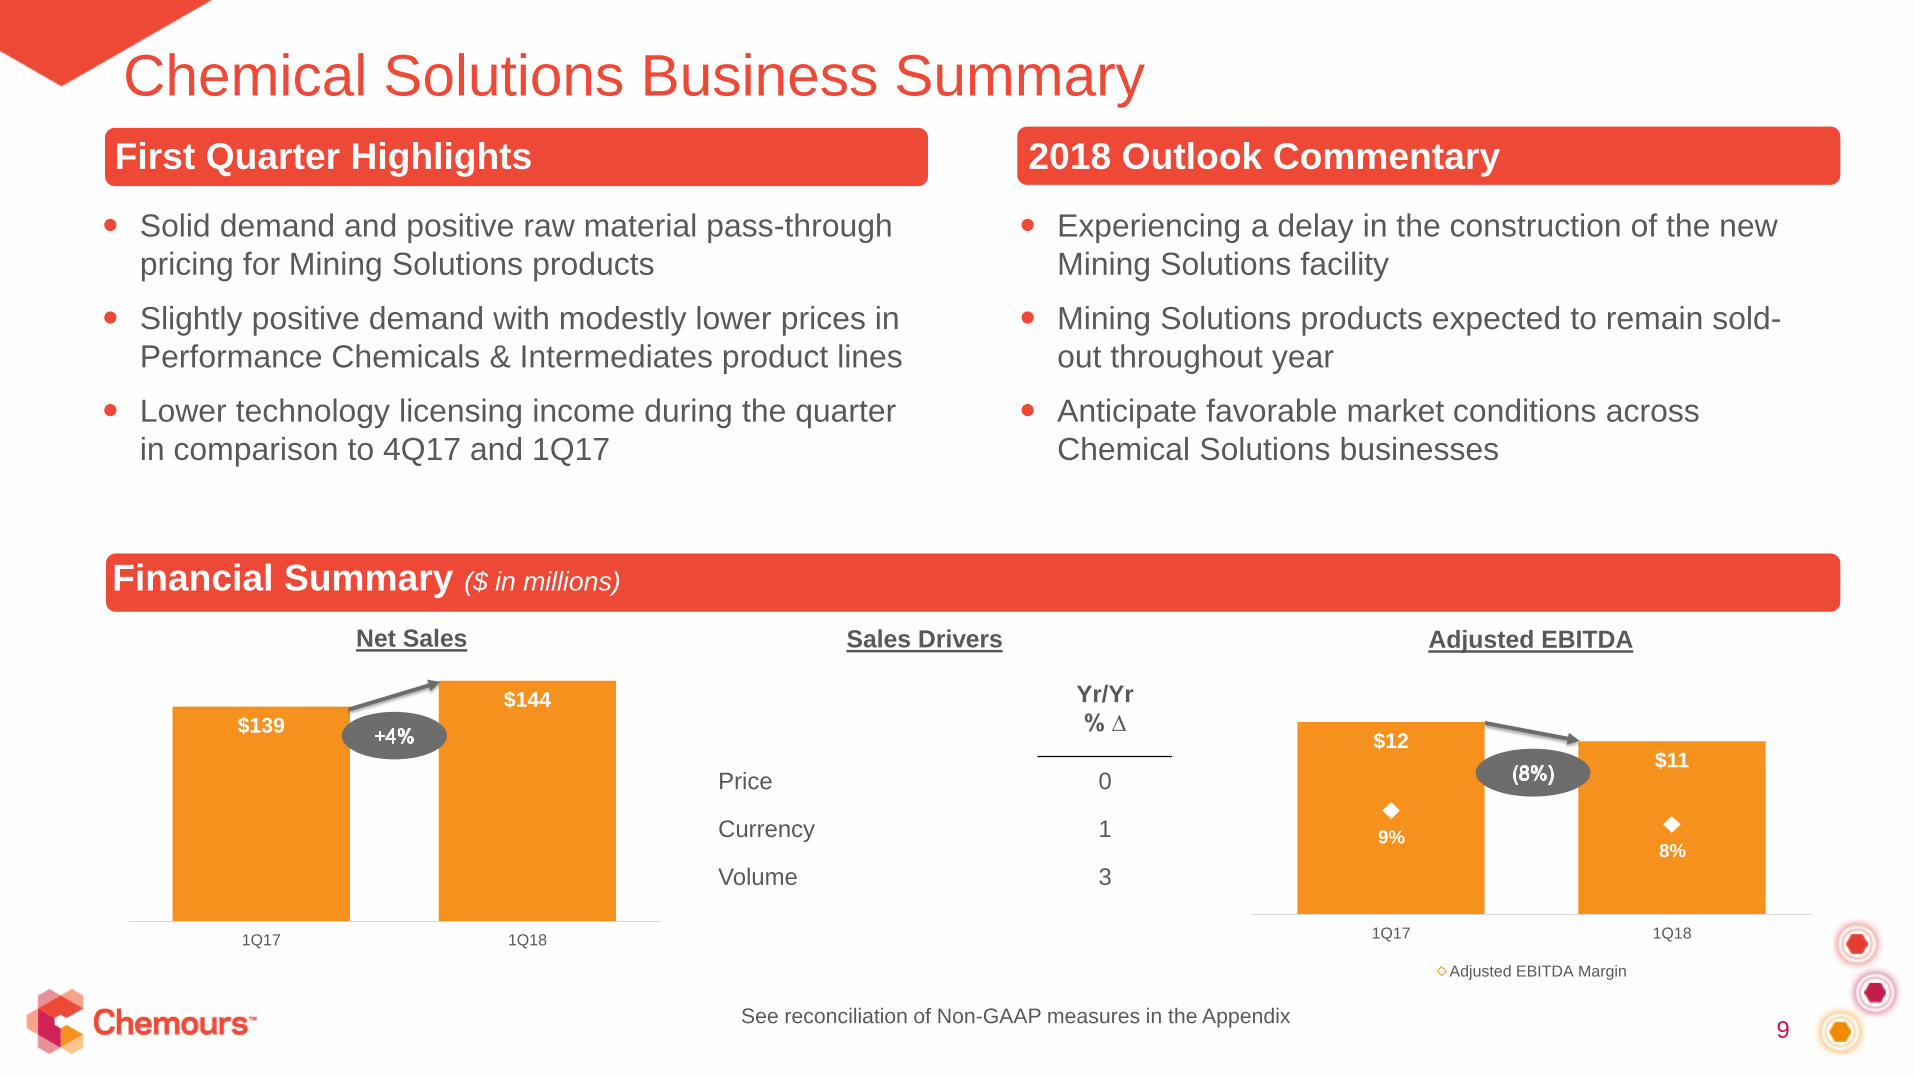
Solid demand and positive raw material pass-through
pricing for Mining Solutions products
Slightly positive demand with modestly lower prices in
Performance Chemicals & Intermediates product lines
Lower technology licensing income during the quarter
in comparison to 4Q17 and 1Q17
Experiencing a delay in the construction of the new
Mining Solutions facility
Mining Solutions products expected to remain sold-
out throughout year
Anticipate favorable market conditions across
Chemical Solutions businesses
See reconciliation of Non-GAAP measures in the Appendix
First Quarter Highlights
$139
$144
1Q17 1Q18
Net Sales
$12$11
9%8%
0
0.02
0.04
0.06
0.08
0.1
0.12
0.14
0.16
0.18
0.2
0
2
4
6
8
10
12
14
1Q17 1Q18
Adjusted EBITDA
Adjusted EBITDA Margin
Yr/Yr
% ∆
Price 0
Currency 1
Volume 3
Sales Drivers
2018 Outlook Commentary

10
Titanium Technologies Business Summary
Financial Summary ($ in millions)
Year-over-year higher global average price reflected
implementation of previously-communicated
increases in 2017
Communicated price increases to specific customers
in North America and Asia Pacific, effective April 1st
Robust year-over-year growth in key market
segments
Expect volume for Ti-Pure™ pigment to be modestly
above GDP
Working with customers to implement previously-
communicated price increases while supporting their
growing needs
Anticipate global circuit to be highly utilized
throughout 2018
See reconciliation of Non-GAAP measures in the Appendix
First Quarter Highlights
$646
$854
400
450
500
550
600
650
700
750
800
850
900
1Q17 1Q18
Net Sales
$159
$294
25%
34%
0
0.1
0.2
0.3
0.4
0.5
0.6
0.7
0.8
0
50
100
150
200
250
300
1Q17 1Q18
Adjusted EBITDA
Adjusted EBITDA Margin
Yr/Yr
% ∆
Price 22
Currency 5
Volume 5
Sales Drivers
2018 Outlook Commentary

2018 Outlook
Adjusted
EBITDA $1.70 - $1.85 Billion
AdjustedEPS $5.00 - $5.75
1 Subject to risks, uncertainties and assumptions, all of which are described in our public filings and safe harbor statement
2018 Ti-Pure™ realized average price
above 2017 average price
Continued Opteon™ adoption
Fluoropolymers volume growth
Changes to Adjusted EPS include
benefit from ~$400M in completed
share repurchases
Key Factors and Assumptions1
See reconciliation of Non-GAAP measures in the Appendix
Free Cash Flow > $700 Million
11
Top End Of:

Expect to Meet or Exceed Three-Year Targets
1212
1x – 2x GDP growth rate
15% – 20% CAGR
REVENUE
ADJUSTED
EBITDA MARGINS
ADJUSTED EPS
ROIC
CUMULATIVE FCF
Improvement by ~500 basis points
Maintain above 30%
Generate $2 – $3 billion
CASH RETURN
TO SHAREHOLDERS
~$125 million per year dividend1
$500 million share repurchase
1. Based on $0.17/share, subject to quarterly Board approval
See reconciliation of Non-GAAP measures in the Appendix
Subject to risks, uncertainties and assumptions, all of which are described in our public filings and safe harbor statement

13
Appendix
Segment Net Sales and Adjusted EBITDA (Unaudited)
14
($ in millions unless otherwise noted) Three months ended
December 31,
2018 2017 2017
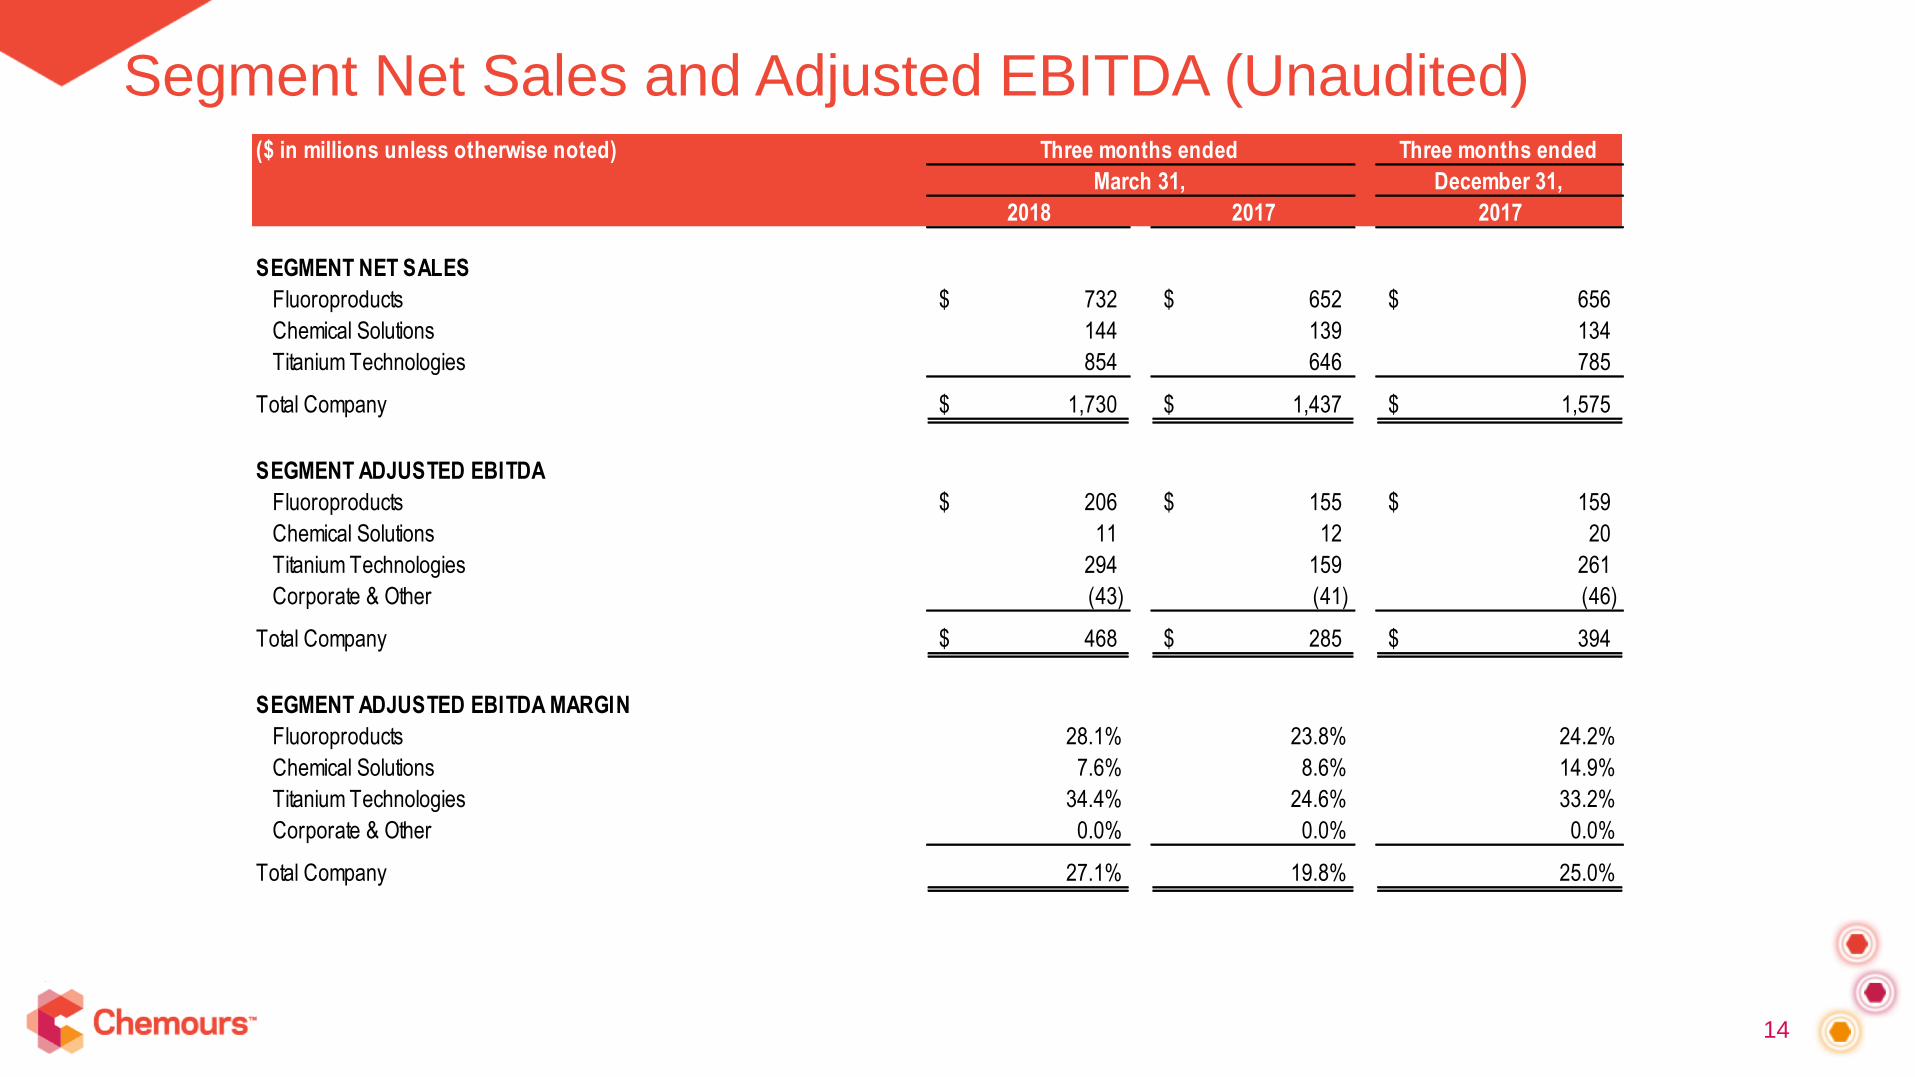
SEGMENT NET SALES
Fluoroproducts 732$ 652$ 656$
Chemical Solutions 144 139 134
Titanium Technologies 854 646 785
Total Company 1,730$ 1,437$ 1,575$
SEGMENT ADJUSTED EBITDA
Fluoroproducts 206$ 155$ 159$
Chemical Solutions 11 12 20
Titanium Technologies 294 159 261
Corporate & Other (43) (41) (46)
Total Company 468$ 285$ 394$
SEGMENT ADJUSTED EBITDA MARGIN
Fluoroproducts 28.1% 23.8% 24.2%
Chemical Solutions 7.6% 8.6% 14.9%
Titanium Technologies 34.4% 24.6% 33.2%
Corporate & Other 0.0% 0.0% 0.0%
Total Company 27.1% 19.8% 25.0%
March 31,
Three months ended

GAAP Net Income to Adjusted Net Income and Adjusted
EBITDA Reconciliations (Unaudited)
15
($ in millions except per share amounts)
$ amounts $ per share $ amounts $ per share $ amounts $ per share
Net income attributable to Chemours 297$ 1.58$ 150$ 0.79 228$ 1.19$
Non-operating pension and other post-retirement employee benefit income (7) (0.04) (8) (0.04) (10) (0.05)
Exchange gains — — (5) (0.03) — —
Restructuring, asset-related, and other charges, net 10 0.05 12 0.06 26 0.14
Gain on sale of assets or businesses (1) (42) (0.22) (16) (0.08) (8) (0.04)
Legal and other charges (2) 4 0.02 7 0.04 — —
Adjustments made to income taxes (3,5) (5) (0.03) (10) (0.05) (3) (0.02)
Provision for (benefit from) income taxes relating to reconciling items (4,5) 9 0.05 1 0.01 (4) (0.02)
Adjusted Net Income 266$ 1.41$ 131$ 0.70$ 229$ 1.19$
Net income attributable to non-controlling interests — 1 —
Interest expense, net 52 51 54
Depreciation and amortization 70 71 69
All remaining provision for income taxes (5) 80 31 42
Adjusted EBITDA 468$ 285$ 394$
Weighted-average number of common shares outstanding - basic 182,069,982 183,408,309 185,445,024
Weighted-average number of common shares outstanding - diluted 188,333,197 189,149,930 191,998,959
Earnings per share - basic 1.63$ 0.82$ 1.23$
Earnings per share - diluted (6) 1.58 0.79 1.19
Adjusted earnings per share - basic 1.46 0.72 1.23
Adjusted earnings per share - diluted (6) 1.41 0.70 1.19
(4) The income tax impacts included in this caption are determined using the applicable rates in the tax ing jurisdictions in w hich income or ex pense occurred and include both current and deferred income tax ex pense or benefit based on the nature of the non-GAAP financial measure.
(5) The total prov ision for income tax es reconciles to the amount reported in the consolidated statements of operations for the three months ended March 31, 2018 and 2017 and for the three months ended December 31, 2017.
* Note: Summation of per share columns may not sum due to rounding.
(6) Diluted earnings per share is calculated using net income av ailable to common shareholders div ided by diluted w eighted-av erage common shares outstanding during each period, w hich includes unv ested restricted shares. Diluted earnings per share considers the impact of potentially
dilutiv e securities ex cept in periods in w hich there is a loss because the inclusion of the potential common shares w ould hav e an anti-dilutiv e effect.
2017
Three months endedThree months ended
March 31,
(3) Includes the remov al of certain discrete income tax impacts w ithin the Company ’s prov ision for income tax es. For the three months ended March 31, 2018 and 2017, the adjustment is primarily attributable to w indfall benefits on the Company ’s share-based pay ments of $5 and $10,
respectiv ely . For the three months ended December 31, 2017, the adjustment is primarily attributable to a benefit for the net impact of U.S. tax reform, w hich amounted to $3.
(2) Includes litigation settlements, w ater treatment accruals, and other charges.
2018 2017
December 31,
(1) For the three months ended March 31, 2018, gain on sale includes a $42 gain associated w ith the sale of the Company ’s Linden, New Jersey site. For the three months ended March 31, 2017, gain on sale includes a $12 gain associated w ith the sale of the Company ’s Edge Moor,
Delaw are site and a $4 gain associated w ith the sale of the Company ’s land in Repauno, New Jersey that w as prev iously deferred and realized upon meeting certain milestones. For the three months ended December 31, 2017, gain on sale includes a $9 gain associated w ith the sale of
the Company ’s land in Repauno, New Jersey that w as prev iously deferred and realized upon meeting certain milestones, net of certain losses on other disposals.
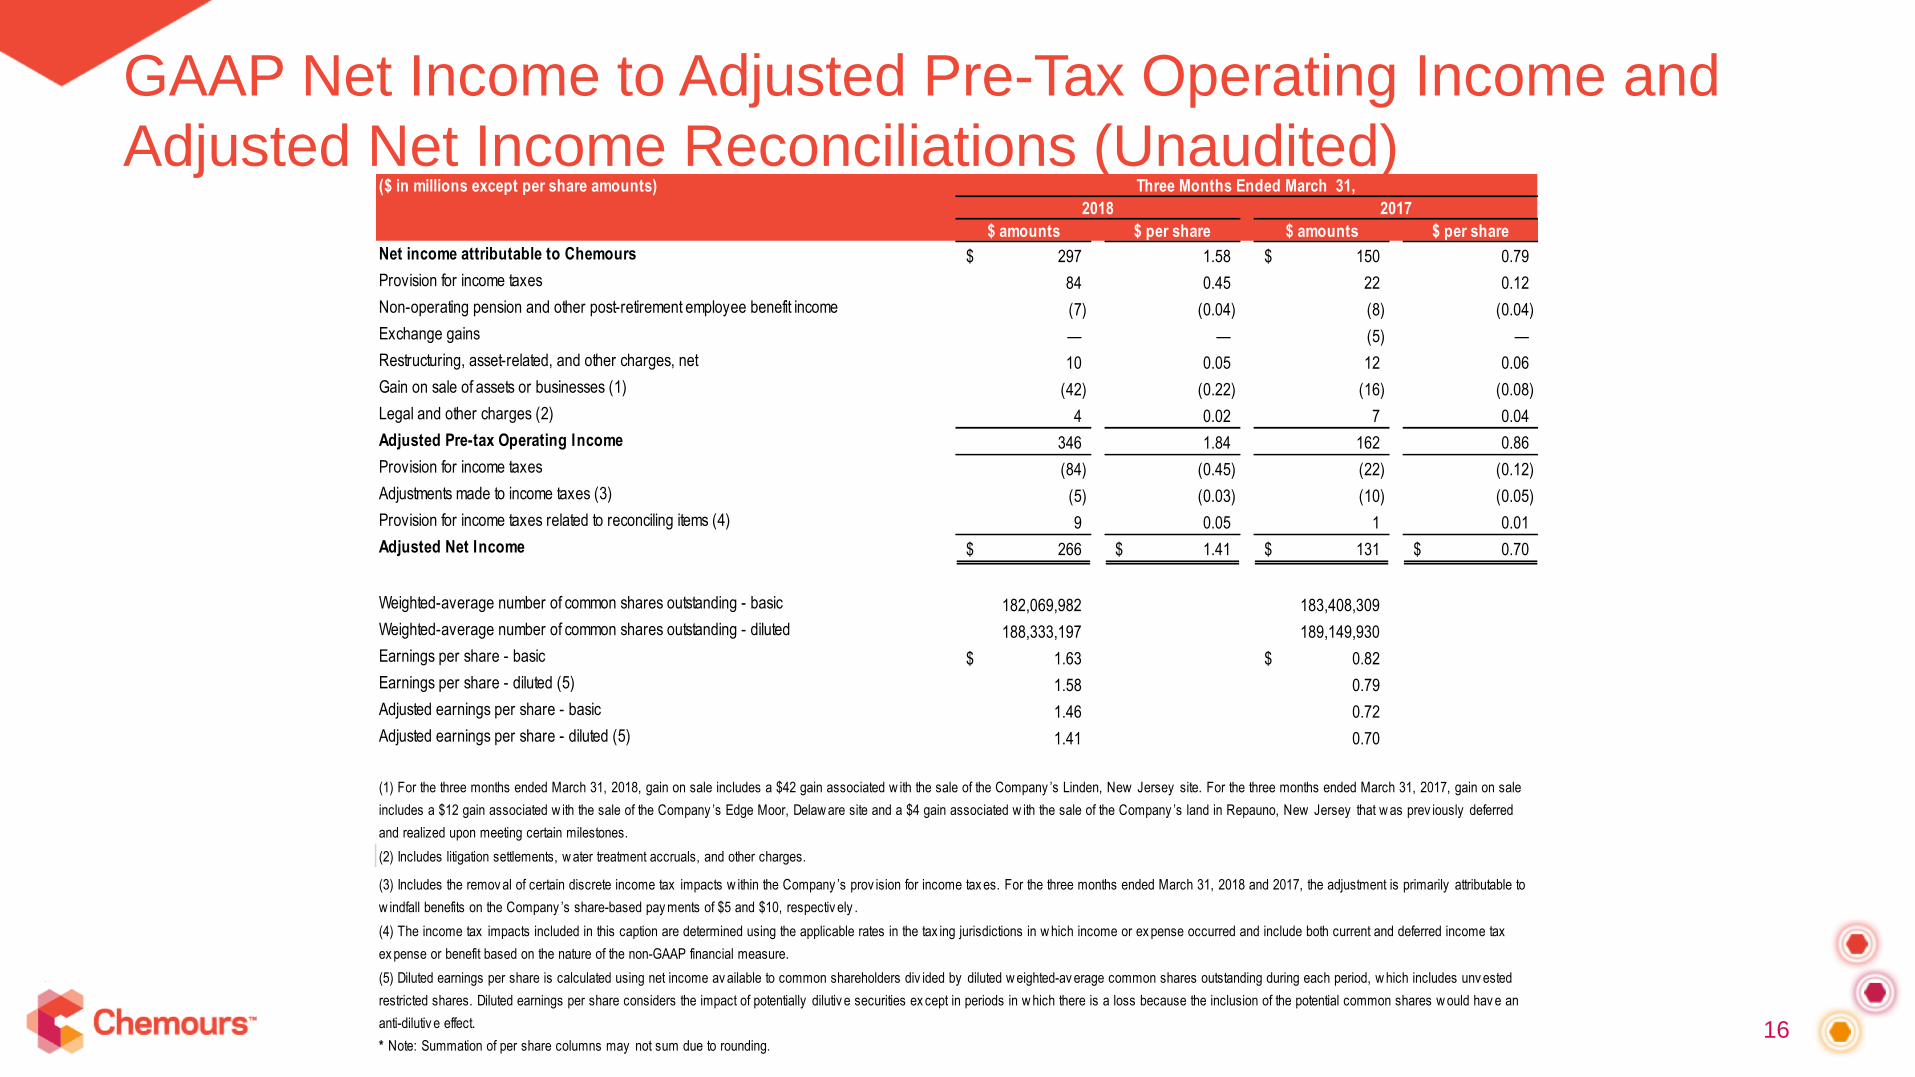
GAAP Net Income to Adjusted Pre-Tax Operating Income and
Adjusted Net Income Reconciliations (Unaudited)
16
($ in millions except per share amounts)
$ amounts $ per share $ amounts $ per share
Net income attributable to Chemours 297$ 1.58 150$ 0.79
Provision for income taxes 84 0.45 22 0.12
Non-operating pension and other post-retirement employee benefit income (7) (0.04) (8) (0.04)
Exchange gains — — (5) —
Restructuring, asset-related, and other charges, net 10 0.05 12 0.06
Gain on sale of assets or businesses (1) (42) (0.22) (16) (0.08)
Legal and other charges (2) 4 0.02 7 0.04
Adjusted Pre-tax Operating Income 346 1.84 162 0.86
Provision for income taxes (84) (0.45) (22) (0.12)
Adjustments made to income taxes (3) (5) (0.03) (10) (0.05)
Provision for income taxes related to reconciling items (4) 9 0.05 1 0.01
Adjusted Net Income 266$ 1.41$ 131$ 0.70$
Weighted-average number of common shares outstanding - basic 182,069,982 183,408,309
Weighted-average number of common shares outstanding - diluted 188,333,197 189,149,930
Earnings per share - basic 1.63$ 0.82$
Earnings per share - diluted (5) 1.58 0.79
Adjusted earnings per share - basic 1.46 0.72
Adjusted earnings per share - diluted (5) 1.41 0.70
(4) The income tax impacts included in this caption are determined using the applicable rates in the tax ing jurisdictions in w hich income or ex pense occurred and include both current and deferred income tax
ex pense or benefit based on the nature of the non-GAAP financial measure.
(5) Diluted earnings per share is calculated using net income av ailable to common shareholders div ided by diluted w eighted-av erage common shares outstanding during each period, w hich includes unv ested
restricted shares. Diluted earnings per share considers the impact of potentially dilutiv e securities ex cept in periods in w hich there is a loss because the inclusion of the potential common shares w ould hav e an
anti-dilutiv e effect.
* Note: Summation of per share columns may not sum due to rounding.
Three Months Ended March 31,
2018 2017
(1) For the three months ended March 31, 2018, gain on sale includes a $42 gain associated w ith the sale of the Company ’s Linden, New Jersey site. For the three months ended March 31, 2017, gain on sale
includes a $12 gain associated w ith the sale of the Company ’s Edge Moor, Delaw are site and a $4 gain associated w ith the sale of the Company ’s land in Repauno, New Jersey that w as prev iously deferred
and realized upon meeting certain milestones.
(2) Includes litigation settlements, w ater treatment accruals, and other charges.
(3) Includes the remov al of certain discrete income tax impacts w ithin the Company ’s prov ision for income tax es. For the three months ended March 31, 2018 and 2017, the adjustment is primarily attributable to
w indfall benefits on the Company ’s share-based pay ments of $5 and $10, respectiv ely .

Return on Invested Capital (ROIC) (Unaudited)
17
($ in millions unless otherwise noted)
2018 2017
Adjusted EBITDA (1) 1,605$ 979$
Less: Depreciation and amortization (1) (272) (289)
Adjusted EBIT 1,333 690
Total debt 4,155 3,552
Total equity 1,002 358
Less: Cash and cash equivalents (1,434) (898)
Invested capital, net 3,723$ 3,012$
Average invested capital (2) 3,327$ 3,257$
Return on Invested Capital 40.1% 21.2%
Three Months Ended March 31,
(1) Based on amounts for the trailing tw elv e months ended March 31, 2018 and 2017. Reconciliations of Adjusted EBITDA to net income
(loss) attributable to Chemours are prov ided on a quarterly basis. See the preceding table for the reconciliation of Adjusted EBITDA to net
income attributable to Chemours for the three months ended March 31, 2018 and 2017.
(2) Av erage inv ested capital is based on a fiv e-quarter trailing av erage of inv ested capital, net.

Free Cash Flow Reconciliations (Unaudited)
18
($ in millions unless otherwise noted)
December 31,
2018 2017 2017
Cash flow provided by operating activities 196$ 41$ 303$
Less: Purchases of property, plant, and equipment (102) (69) (165)
Free Cash Flow 94$ (28)$ 138$
March 31,
Three months ended

GAAP Net Income Attributable to Chemours to Adjusted Net Income, Adjusted
EBITDA and Adjusted EPS Reconciliations (Unaudited)
19
($ in millions unless otherwise noted)
Low High
Net income attributable to Chemours 985$ 1,080$
Other adjustments (45) (45)
Restructuring, asset-related, and other charges, net 35 25
Provision for income taxes relating to reconciling items (1) 5 5
Adjusted Net Income 980 1,065
Interest expense, net 220 220
Depreciation and amortization 280 280
All remaining provision for income taxes 295 285
Adjusted EBITDA 1,775$ 1,850$
Weighted-average number of common shares outstanding - basic (2) 179 179
Dilutive effects of Chemours' employee compensation plans (2,3) 6 6
Weighted-average number of common shares outstanding - diluted (2,3) 185 185
Earnings per share - basic 5.50$ 6.03$
Earnings per share - diluted (3) 5.32 5.84
Adjusted earnings per share - basic 5.47 5.95
Adjusted earnings per share - diluted (3) 5.30 5.76
(1) The income tax impacts included in this caption are determined using the applicable rates in the tax ing jurisdictions in w hich income or ex pense occurred and include both current and
deferred income tax ex pense or benefit based on the nature of the non-GAAP financial measure.
(2) The Company ’s estimates for the w eighted-av erage number of common shares outstanding - basic and diluted reflect results for the y ear ended December 31, 2017, w hich are carried
forw ard for the projection period and updated for the estimated impacts of the Company ’s 2018 share repurchase and other activ ity on a w eighted-av erage basis.
(3) Diluted earnings per share is calculated using net income av ailable to common shareholders div ided by diluted w eighted-av erage common shares outstanding during each period,
w hich includes unv ested restricted shares. Diluted earnings per share considers the impact of potentially dilutiv e securities ex cept in periods in w hich there is a loss because the inclusion
of the potential common shares w ould hav e an anti-dilutiv e effect.
The Company ’s estimates reflect its current v isibility and ex pectations of market factors, such as, but not limited to: currency mov ements, titanium diox ide prices, and end-market
demand. Actual results could differ materially from the current estimates due to market factors and unknow n or uncertain other factors, such as non-operating pension and other post-
retirement employ ee benefit activ ity w ith respect to the Company ’s foreign pension plans, including settlements or curtailments, cost sav ings actions that may be taken in the future, the
impact of currency mov ements on the Company ’s results, including ex change gains and losses, and the related tax effects, or the impact of new accounting pronouncements.
Year Ended December 31, 2018
(Estimated)

GAAP Cash Flow Provided by Operating Activities to Free Cash
Flow Reconciliations (Unaudited)
20
($ in millions unless otherwise noted) (Estimated)
Year Ended December 31,
2018
Cash flow provided by operating activities > $1,225
Less: Purchases of property, plant, and equipment (525) - (475)
Free Cash Flow > $700

21©2018 The Chemours Company. Chemours™ and the Chemours Logo are trademarks or registered trademarks of The Chemours Company