first quarter report for the period ended september …
TRANSCRIPT

NAGINA
NAGINA GROUP
FIRST QUARTER REPORT
FOR THE PERIOD ENDED
SEPTEMBER 30, 2018
(Un-Audited)
ELLCOT SPINNING MILLS LTD.
1
NAGINA
NAGINA GROUP
ELLCOT SPINNING MILLS LIMITED
NAGINA
NAGINA GROUP
ELLCOT SPINNING MILLS LIMITED
2
COMPANY INFORMATION
C O N T E N T S
Company Information
Directors’ Review
2
3
5
7
8
9
10
11
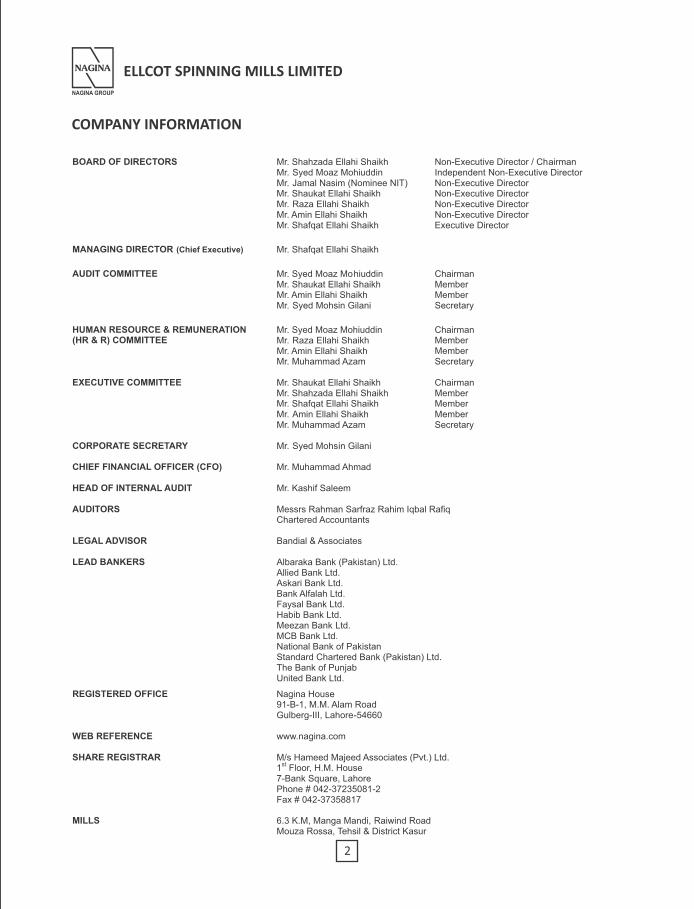
BOARD OF DIRECTORS
MANAGING DIRECTOR (Chief Executive)
AUDIT COMMITTEE
HUMAN RESOURCE & REMUNERATION (HR & R) COMMITTEE
EXECUTIVE COMMITTEE
CORPORATE SECRETARY
CHIEF FINANCIAL OFFICER (CFO)
HEAD OF INTERNAL AUDIT
AUDITORS
LEGAL ADVISOR
LEAD BANKERS
REGISTERED OFFICE
WEB REFERENCE
SHARE REGISTRAR
MILLS
Mr. Shahzada Ellahi Shaikh Mr. Syed Moaz Mohiuddin
Mr. Jamal Nasim (Nominee NIT)
Mr. Shaukat Ellahi Shaikh
Mr. Raza Ellahi Shaikh
Mr. Amin Ellahi Shaikh
Mr. Shafqat Ellahi Shaikh
Non-Executive Director / Chairman Independent Non-Executive Director Non-Executive DirectorNon-Executive DirectorNon-Executive DirectorNon-Executive DirectorExecutive Director
Mr. Shafqat Ellahi Shaikh
Mr. Syed Moaz Mohiuddin
Mr. Shaukat Ellahi Shaikh
Mr. Amin Ellahi Shaikh
Mr. Syed Mohsin Gilani
ChairmanMemberMemberSecretary
Mr. Amin Ellahi Shaikh
Mr. Syed Moaz Mohiuddin
Mr. Raza Ellahi Shaikh
Mr. Muhammad Azam
ChairmanMemberMemberSecretary
Mr. Shaukat Ellahi Shaikh
Mr. Shahzada Ellahi Shaikh
Mr. Shafqat Ellahi Shaikh
Mr. Amin Ellahi Shaikh
Mr. Muhammad Azam
Chairman MemberMemberMemberSecretary
Mr. Syed Mohsin Gilani
Mr. Muhammad Ahmad
Mr. Kashif Saleem
Messrs Rahman Sarfraz Rahim Iqbal RafiqChartered Accountants
Bandial & Associates
Albaraka Bank (Pakistan) Ltd.
Allied Bank Ltd.
Askari Bank Ltd.
Bank Alfalah Ltd.
Faysal Bank Ltd.
Habib Bank Ltd.
Meezan Bank Ltd.
MCB Bank Ltd.
National Bank of Pakistan
Standard Chartered Bank (Pakistan) Ltd.The Bank of PunjabUnited Bank Ltd.
Nagina House91-B-1, M.M. Alam RoadGulberg-III, Lahore-54660
www.nagina.com
M/s Hameed Majeed Associates (Pvt.) Ltd. 1
stFloor, H.M. House
7-Bank Square, Lahore Phone # 042-37235081-2 Fax # 042-37358817
6.3 K.M, Manga Mandi, Raiwind RoadMouza Rossa, Tehsil & District Kasur
Condensed Interim Statement of Financial Position
Condensed Interim Statement of Profit or Loss
Condensed Interim Statement of Comprehensive Income
Condensed Interim Statement of Cash Flows
Condensed Interim Statement of Changes in Equity
Notes to the Condensed Interim Financial Statements
1
NAGINA
NAGINA GROUP
ELLCOT SPINNING MILLS LIMITED
NAGINA
NAGINA GROUP
ELLCOT SPINNING MILLS LIMITED
2
COMPANY INFORMATION
C O N T E N T S
Company Information
Directors’ Review
2
3
5
7
8
9
10
11
BOARD OF DIRECTORS
MANAGING DIRECTOR (Chief Executive)
AUDIT COMMITTEE
HUMAN RESOURCE & REMUNERATION (HR & R) COMMITTEE
EXECUTIVE COMMITTEE
CORPORATE SECRETARY
CHIEF FINANCIAL OFFICER (CFO)
HEAD OF INTERNAL AUDIT
AUDITORS
LEGAL ADVISOR
LEAD BANKERS
REGISTERED OFFICE
WEB REFERENCE
SHARE REGISTRAR
MILLS
Mr. Shahzada Ellahi Shaikh Mr. Syed Moaz Mohiuddin
Mr. Jamal Nasim (Nominee NIT)
Mr. Shaukat Ellahi Shaikh
Mr. Raza Ellahi Shaikh
Mr. Amin Ellahi Shaikh
Mr. Shafqat Ellahi Shaikh
Non-Executive Director / Chairman Independent Non-Executive Director Non-Executive DirectorNon-Executive DirectorNon-Executive DirectorNon-Executive DirectorExecutive Director
Mr. Shafqat Ellahi Shaikh
Mr. Syed Moaz Mohiuddin
Mr. Shaukat Ellahi Shaikh
Mr. Amin Ellahi Shaikh
Mr. Syed Mohsin Gilani
ChairmanMemberMemberSecretary
Mr. Amin Ellahi Shaikh
Mr. Syed Moaz Mohiuddin
Mr. Raza Ellahi Shaikh
Mr. Muhammad Azam
ChairmanMemberMemberSecretary
Mr. Shaukat Ellahi Shaikh
Mr. Shahzada Ellahi Shaikh
Mr. Shafqat Ellahi Shaikh
Mr. Amin Ellahi Shaikh
Mr. Muhammad Azam
Chairman MemberMemberMemberSecretary
Mr. Syed Mohsin Gilani
Mr. Muhammad Ahmad
Mr. Kashif Saleem
Messrs Rahman Sarfraz Rahim Iqbal RafiqChartered Accountants
Bandial & Associates
Albaraka Bank (Pakistan) Ltd.
Allied Bank Ltd.
Askari Bank Ltd.
Bank Alfalah Ltd.
Faysal Bank Ltd.
Habib Bank Ltd.
Meezan Bank Ltd.
MCB Bank Ltd.
National Bank of Pakistan
Standard Chartered Bank (Pakistan) Ltd.The Bank of PunjabUnited Bank Ltd.
Nagina House91-B-1, M.M. Alam RoadGulberg-III, Lahore-54660
www.nagina.com
M/s Hameed Majeed Associates (Pvt.) Ltd. 1
stFloor, H.M. House
7-Bank Square, Lahore Phone # 042-37235081-2 Fax # 042-37358817
6.3 K.M, Manga Mandi, Raiwind RoadMouza Rossa, Tehsil & District Kasur
Condensed Interim Statement of Financial Position
Condensed Interim Statement of Profit or Loss
Condensed Interim Statement of Comprehensive Income
Condensed Interim Statement of Cash Flows
Condensed Interim Statement of Changes in Equity
Notes to the Condensed Interim Financial Statements

DIRECTORS' REVIEW
The Directors are pleased to present the un-audited condensed interim financial statements of the Company for the 1st quarter ended on September 30, 2018. The comparative figures for the corresponding quarter ended on September 30, 2017 are included for comparison, except in statement of financial position where comparative figures are for the year ended on June 30, 2018.
Company Performance
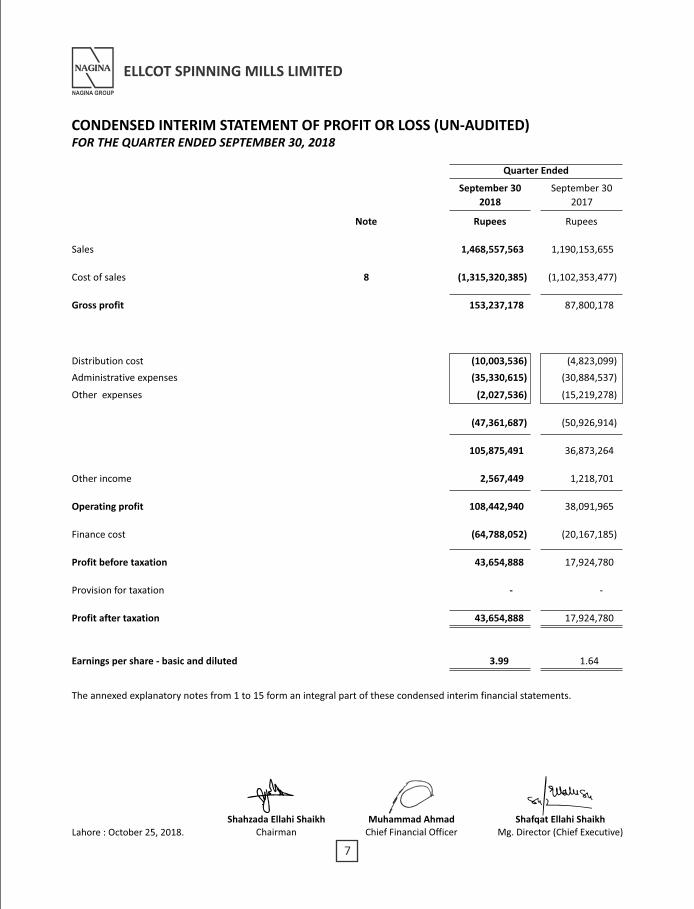
Alhamdullilah, despite turbulent operating environment your Company has managed to earn after tax profit of Rs.43,654,888 compared to Rs.17,924,780 during same quarter of last year. This has been possible mainly due to better marketing strategies and effective cost controls. Earning per share for the quarter is Rs. 3.99 compared to Rs. 1.64 during same quarter of last year.
Because of better selling prices sales revenue for the quarter under review increased to Rs.1,468,557,563 compared to Rs.1,190,153,655 during same quarter of last year. Cost of sales decreased from 92.62% of sales during the same quarter of last year to 89.57% of sales during the quarter under review. Increase in sales revenue and decrease in cost of sales resulted in increase in Gross Profit (GP) from 7.38% of sales during the same quarter of last year to 10.43% of sales during the quarter under review.
Overall operating expenses decreased from 4.28% of sales to 3.23% of sales. The Company has been able to generate stable cash flows and discharged all its operating and financial liabilities in time. Finance cost increased from 1.69% of sales during same quarter of last year to 4.41% of sales during quarter under review. This increase is mainly due to increase in short term borrowings for cotton procurement and rising interest rate environment in the country.
According to the figures issued by the Pakistan Cotton Ginners Association, for the crop year 2018-19, Kapas, (seed cotton) arrivals upto October 15, 2018, at the Ginneries totalled 6.044 million bales compared to 5.984 million bales of same period of previous year showing increase in arrival of 1%.
Future Outlook
The company has earned reasonable profits during this quarter. Margins improved on the back of better yarn prices. However, it may be difficult to maintain margins in the rest of the year due to sudden and significant fall in yarn prices. Trade tensions between USA and CHINA is damaging demand for yarn especially from China. Pakistani spinning mills faced with declining exports are diverting products to the domestic market and reducing prices. In order to boost exports of the country the Government has promised many incentives for the textile sector such as reduction in gas and electricity tariff. It is hoped that the Government would bring in business friendly policies such as uninterrupted and cost effective energy supplies, refund of outstanding sales tax, income tax, DLTL and technology upgradation funds so that cash flows improve and allow spinning mills to stock raw cotton. Management is also apprehensive about the prospects for rising interest rates. Higher financial costs are to be expected going forward and this will affect future margins. The Pakistani rupee may devalue further and lead to an inflationary environment. Inflation effects on raw materials especially cotton and polyester can reduce margins. Management is vigilantly reviewing the ever changing conditions in order to enhance company profits. The raw cotton production in the year 2018-19 is likely to be around 11 million bales. Therefore, cotton imports would be required to meet the raw material requirements of the spinning industry.
Acknowledgement
Despite adverse conditions profitable results have been possible due to continued diligence and devotion of the staff and workers of the Company. The continued good human relations at all levels deserve acknowledgement. The Directors also wish to place on record their gratitude to the bankers for their continued support to the company.
3
NAGINA
NAGINA GROUP
ELLCOT SPINNING MILLS LIMITED NAGINA
NAGINA GROUP
ELLCOT SPINNING MILLS LIMITED
4
Lahore : October 25, 2018.
On behalf of the Board.
Mg. Director (Chief Executive)
Shafqat Ellahi Shaikh
Chairman
Shahzada Ellahi Shaikh

DIRECTORS' REVIEW
The Directors are pleased to present the un-audited condensed interim financial statements of the Company for the 1st quarter ended on September 30, 2018. The comparative figures for the corresponding quarter ended on September 30, 2017 are included for comparison, except in statement of financial position where comparative figures are for the year ended on June 30, 2018.
Company Performance
Alhamdullilah, despite turbulent operating environment your Company has managed to earn after tax profit of Rs.43,654,888 compared to Rs.17,924,780 during same quarter of last year. This has been possible mainly due to better marketing strategies and effective cost controls. Earning per share for the quarter is Rs. 3.99 compared to Rs. 1.64 during same quarter of last year.
Because of better selling prices sales revenue for the quarter under review increased to Rs.1,468,557,563 compared to Rs.1,190,153,655 during same quarter of last year. Cost of sales decreased from 92.62% of sales during the same quarter of last year to 89.57% of sales during the quarter under review. Increase in sales revenue and decrease in cost of sales resulted in increase in Gross Profit (GP) from 7.38% of sales during the same quarter of last year to 10.43% of sales during the quarter under review.
Overall operating expenses decreased from 4.28% of sales to 3.23% of sales. The Company has been able to generate stable cash flows and discharged all its operating and financial liabilities in time. Finance cost increased from 1.69% of sales during same quarter of last year to 4.41% of sales during quarter under review. This increase is mainly due to increase in short term borrowings for cotton procurement and rising interest rate environment in the country.
According to the figures issued by the Pakistan Cotton Ginners Association, for the crop year 2018-19, Kapas, (seed cotton) arrivals upto October 15, 2018, at the Ginneries totalled 6.044 million bales compared to 5.984 million bales of same period of previous year showing increase in arrival of 1%.
Future Outlook
The company has earned reasonable profits during this quarter. Margins improved on the back of better yarn prices. However, it may be difficult to maintain margins in the rest of the year due to sudden and significant fall in yarn prices. Trade tensions between USA and CHINA is damaging demand for yarn especially from China. Pakistani spinning mills faced with declining exports are diverting products to the domestic market and reducing prices. In order to boost exports of the country the Government has promised many incentives for the textile sector such as reduction in gas and electricity tariff. It is hoped that the Government would bring in business friendly policies such as uninterrupted and cost effective energy supplies, refund of outstanding sales tax, income tax, DLTL and technology upgradation funds so that cash flows improve and allow spinning mills to stock raw cotton. Management is also apprehensive about the prospects for rising interest rates. Higher financial costs are to be expected going forward and this will affect future margins. The Pakistani rupee may devalue further and lead to an inflationary environment. Inflation effects on raw materials especially cotton and polyester can reduce margins. Management is vigilantly reviewing the ever changing conditions in order to enhance company profits. The raw cotton production in the year 2018-19 is likely to be around 11 million bales. Therefore, cotton imports would be required to meet the raw material requirements of the spinning industry.
Acknowledgement
Despite adverse conditions profitable results have been possible due to continued diligence and devotion of the staff and workers of the Company. The continued good human relations at all levels deserve acknowledgement. The Directors also wish to place on record their gratitude to the bankers for their continued support to the company.
3
NAGINA
NAGINA GROUP
ELLCOT SPINNING MILLS LIMITED NAGINA
NAGINA GROUP
ELLCOT SPINNING MILLS LIMITED
4
Lahore : October 25, 2018.
On behalf of the Board.
Mg. Director (Chief Executive)
Shafqat Ellahi Shaikh
Chairman
Shahzada Ellahi Shaikh
5
NAGINA
NAGINA GROUP
ELLCOT SPINNING MILLS LIMITED NAGINA
NAGINA GROUP
ELLCOT SPINNING MILLS LIMITED
6
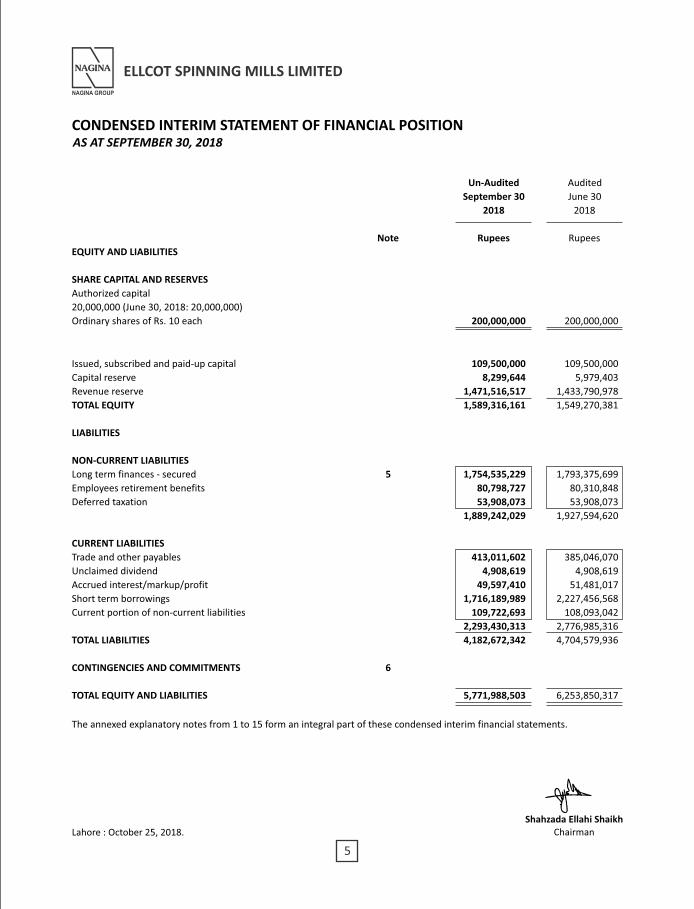
EQUITY AND LIABILITIES
SHARE CAPITAL AND RESERVES
Authorized capital
20,000,000 (June 30, 2018: 20,000,000)
Ordinary shares of Rs. 10 each
Issued, subscribed and paid-up capital
Capital reserve
Revenue reserve
TOTAL EQUITY
LIABILITIES
NON-CURRENT LIABILITIES
Long term finances - secured 5
Employees retirement benefits
Deferred taxation
CURRENT LIABILITIES
Trade and other payables
Unclaimed dividend
Accrued interest/markup/profit
Short term borrowings
Current portion of non-current liabilities
TOTAL LIABILITIES
CONTINGENCIES AND COMMITMENTS 6
TOTAL EQUITY AND LIABILITIES
The annexed explanatory notes from 1 to 15 form an integral part of these condensed interim financial statements.
200,000,000
200,000,000
109,500,000 109,500,000
8,299,644 5,979,403
1,471,516,517 1,433,790,978
1,589,316,161 1,549,270,381
1,754,535,229 1,793,375,699 80,798,727 80,310,848 53,908,073 53,908,073
1,889,242,029 1,927,594,620
413,011,602 385,046,070 4,908,619 4,908,619
49,597,410
51,481,017
1,716,189,989
2,227,456,568
109,722,693
108,093,042
2,293,430,313
2,776,985,316
4,182,672,342
4,704,579,936
5,771,988,503
6,253,850,317
Note
Un-Audited Audited
September 30 June 30
2018 2018
Rupees Rupees
ASSETS
NON-CURRENT ASSETS
Fixed Assets 7 2,587,944,298
2,644,543,927
Long term deposits 7,090,700
7,090,700
2,595,034,998
2,651,634,627
CURRENT ASSETS
Stores, spares and loose tools 58,802,718 66,084,857
Stock-in-trade 1,708,787,243 1,821,067,965
Trade debts 490,623,949 738,488,296
Advances, prepayments and other receivables 285,003,434 406,638,325
Short term investments 487,602,556 451,033,523
Advance income tax 114,457,354 101,949,715
Cash and bank balances 31,676,251 16,953,009
3,176,953,505 3,602,215,690
TOTAL ASSETS 5,771,988,503 6,253,850,317
Note
Un-Audited Audited
September 30 June 30
2018 2018
Rupees Rupees
CONDENSED INTERIM STATEMENT OF FINANCIAL POSITIONAS AT SEPTEMBER 30, 2018
Shafqat Ellahi ShaikhMg. Director (Chief Executive)Lahore : October 25, 2018.
Shahzada Ellahi ShaikhChairman
Muhammad AhmadChief Financial Officer

5
NAGINA
NAGINA GROUP
ELLCOT SPINNING MILLS LIMITED NAGINA
NAGINA GROUP
ELLCOT SPINNING MILLS LIMITED
6
EQUITY AND LIABILITIES
SHARE CAPITAL AND RESERVES
Authorized capital
20,000,000 (June 30, 2018: 20,000,000)
Ordinary shares of Rs. 10 each
Issued, subscribed and paid-up capital
Capital reserve
Revenue reserve
TOTAL EQUITY
LIABILITIES
NON-CURRENT LIABILITIES
Long term finances - secured 5
Employees retirement benefits
Deferred taxation
CURRENT LIABILITIES
Trade and other payables
Unclaimed dividend
Accrued interest/markup/profit
Short term borrowings
Current portion of non-current liabilities
TOTAL LIABILITIES
CONTINGENCIES AND COMMITMENTS 6
TOTAL EQUITY AND LIABILITIES
The annexed explanatory notes from 1 to 15 form an integral part of these condensed interim financial statements.
200,000,000
200,000,000
109,500,000 109,500,000
8,299,644 5,979,403
1,471,516,517 1,433,790,978
1,589,316,161 1,549,270,381
1,754,535,229 1,793,375,699 80,798,727 80,310,848 53,908,073 53,908,073
1,889,242,029 1,927,594,620
413,011,602 385,046,070 4,908,619 4,908,619
49,597,410
51,481,017
1,716,189,989
2,227,456,568
109,722,693
108,093,042
2,293,430,313
2,776,985,316
4,182,672,342
4,704,579,936
5,771,988,503
6,253,850,317
Note
Un-Audited Audited
September 30 June 30
2018 2018
Rupees Rupees
ASSETS
NON-CURRENT ASSETS
Fixed Assets 7 2,587,944,298
2,644,543,927
Long term deposits 7,090,700
7,090,700
2,595,034,998
2,651,634,627
CURRENT ASSETS
Stores, spares and loose tools 58,802,718 66,084,857
Stock-in-trade 1,708,787,243 1,821,067,965
Trade debts 490,623,949 738,488,296
Advances, prepayments and other receivables 285,003,434 406,638,325
Short term investments 487,602,556 451,033,523
Advance income tax 114,457,354 101,949,715
Cash and bank balances 31,676,251 16,953,009
3,176,953,505 3,602,215,690
TOTAL ASSETS 5,771,988,503 6,253,850,317
Note
Un-Audited Audited
September 30 June 30
2018 2018
Rupees Rupees
CONDENSED INTERIM STATEMENT OF FINANCIAL POSITIONAS AT SEPTEMBER 30, 2018
Shafqat Ellahi ShaikhMg. Director (Chief Executive)Lahore : October 25, 2018.
Shahzada Ellahi ShaikhChairman
Muhammad AhmadChief Financial Officer
NAGINA
NAGINA GROUP
ELLCOT SPINNING MILLS LIMITED
87
NAGINA
NAGINA GROUP
ELLCOT SPINNING MILLS LIMITED
FOR THE QUARTER ENDED SEPTEMBER 30, 2018CONDENSED INTERIM STATEMENT OF PROFIT OR LOSS (UN-AUDITED)
Note
Sales
Cost of sales 8
Gross profit
Distribution cost
Administrative expenses
Other expenses
Other income
Operating profit
Finance cost
Profit before taxation
Provision for taxation
Profit after taxation
Earnings per share - basic and diluted
The annexed explanatory notes from 1 to 15 form an integral part of these condensed interim financial statements.
September 30
2018
September 30
2017
1,468,557,563 1,190,153,655
(1,315,320,385)
(1,102,353,477)
153,237,178
87,800,178
(10,003,536)
(4,823,099)
(35,330,615)
(30,884,537)
(2,027,536) (15,219,278)
(47,361,687) (50,926,914)
105,875,491
36,873,264
2,567,449
1,218,701
108,442,940
38,091,965
(64,788,052)
(20,167,185)
43,654,888
17,924,780
- -
43,654,888 17,924,780
3.99 1.64
Quarter Ended
Rupees
Rupees
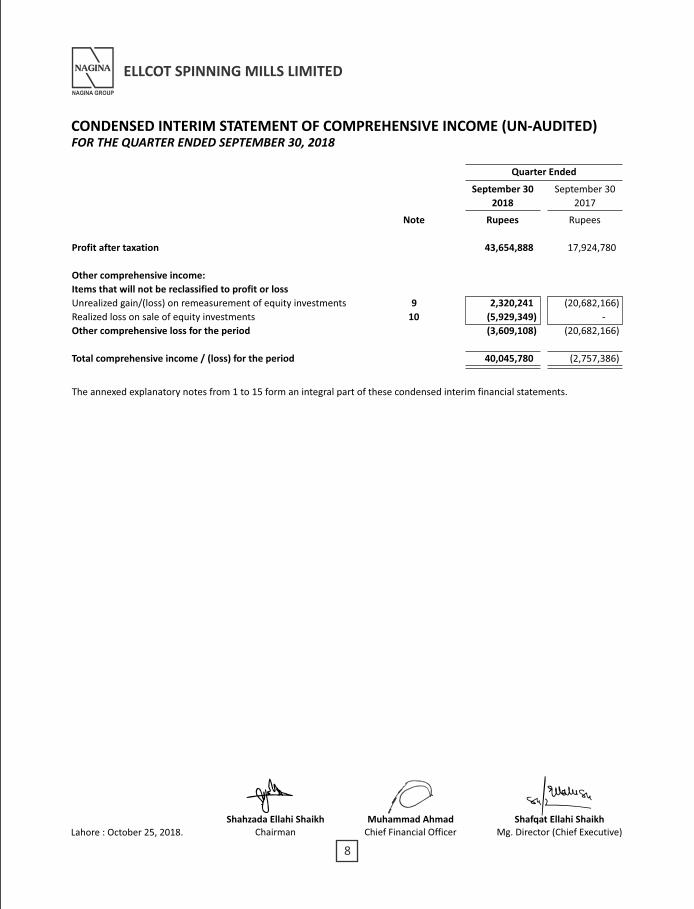
FOR THE QUARTER ENDED SEPTEMBER 30, 2018CONDENSED INTERIM STATEMENT OF COMPREHENSIVE INCOME (UN-AUDITED)
September 30 September 30
2018 2017
Note
Profit after taxation 43,654,888 17,924,780
Other comprehensive income:
Items that will not be reclassified to profit or loss
Unrealized gain/(loss) on remeasurement of equity investments 9 2,320,241
(20,682,166) Realized loss on sale of equity investments 10 (5,929,349)
-
Other comprehensive loss for the period (3,609,108)
(20,682,166)
Total comprehensive income / (loss) for the period 40,045,780
(2,757,386)
The annexed explanatory notes from 1 to 15 form an integral part of these condensed interim financial statements.
Quarter Ended
Rupees
Rupees
Shafqat Ellahi ShaikhMg. Director (Chief Executive)Lahore : October 25, 2018.
Shahzada Ellahi ShaikhChairman
Muhammad AhmadChief Financial Officer
Shafqat Ellahi ShaikhMg. Director (Chief Executive)Lahore : October 25, 2018.
Shahzada Ellahi ShaikhChairman
Muhammad AhmadChief Financial Officer
NAGINA
NAGINA GROUP
ELLCOT SPINNING MILLS LIMITED
87
NAGINA
NAGINA GROUP
ELLCOT SPINNING MILLS LIMITED
FOR THE QUARTER ENDED SEPTEMBER 30, 2018CONDENSED INTERIM STATEMENT OF PROFIT OR LOSS (UN-AUDITED)
Note
Sales
Cost of sales 8
Gross profit
Distribution cost
Administrative expenses
Other expenses
Other income
Operating profit
Finance cost
Profit before taxation
Provision for taxation
Profit after taxation
Earnings per share - basic and diluted
The annexed explanatory notes from 1 to 15 form an integral part of these condensed interim financial statements.
September 30
2018
September 30
2017
1,468,557,563 1,190,153,655
(1,315,320,385)
(1,102,353,477)
153,237,178
87,800,178
(10,003,536)
(4,823,099)
(35,330,615)
(30,884,537)
(2,027,536) (15,219,278)
(47,361,687) (50,926,914)
105,875,491
36,873,264
2,567,449
1,218,701
108,442,940
38,091,965
(64,788,052)
(20,167,185)
43,654,888
17,924,780
- -
43,654,888 17,924,780
3.99 1.64
Quarter Ended
Rupees
Rupees
FOR THE QUARTER ENDED SEPTEMBER 30, 2018CONDENSED INTERIM STATEMENT OF COMPREHENSIVE INCOME (UN-AUDITED)
September 30 September 30
2018 2017
Note
Profit after taxation 43,654,888 17,924,780
Other comprehensive income:
Items that will not be reclassified to profit or loss
Unrealized gain/(loss) on remeasurement of equity investments 9 2,320,241
(20,682,166) Realized loss on sale of equity investments 10 (5,929,349)
-
Other comprehensive loss for the period (3,609,108)
(20,682,166)
Total comprehensive income / (loss) for the period 40,045,780
(2,757,386)
The annexed explanatory notes from 1 to 15 form an integral part of these condensed interim financial statements.
Quarter Ended
Rupees
Rupees
Shafqat Ellahi ShaikhMg. Director (Chief Executive)Lahore : October 25, 2018.
Shahzada Ellahi ShaikhChairman
Muhammad AhmadChief Financial Officer
Shafqat Ellahi ShaikhMg. Director (Chief Executive)Lahore : October 25, 2018.
Shahzada Ellahi ShaikhChairman
Muhammad AhmadChief Financial Officer
10
NAGINA
NAGINA GROUP
ELLCOT SPINNING MILLS LIMITED
9
NAGINA
NAGINA GROUP
ELLCOT SPINNING MILLS LIMITED
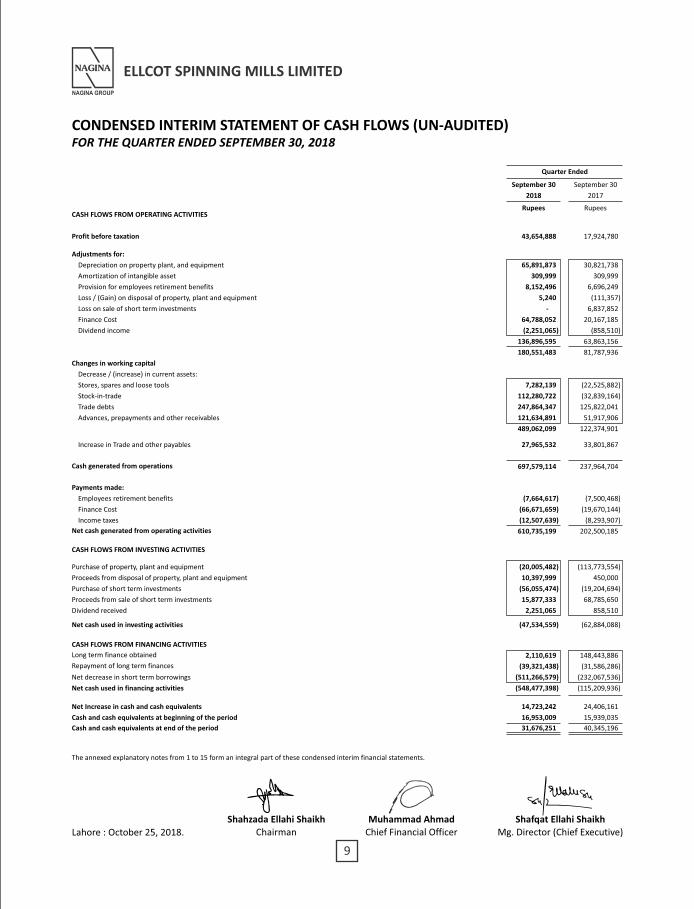
CONDENSED INTERIM STATEMENT OF CASH FLOWS (UN-AUDITED)FOR THE QUARTER ENDED SEPTEMBER 30, 2018
September 30 September 30
2018 2017
43,654,888 17,924,780
65,891,873 30,821,738
309,999 309,999
8,152,496 6,696,249
5,240 (111,357)
- 6,837,852
64,788,052 20,167,185
(2,251,065) (858,510)
136,896,595 63,863,156
180,551,483 81,787,936
7,282,139 (22,525,882)
112,280,722 (32,839,164)
247,864,347 125,822,041
121,634,891 51,917,906
489,062,099 122,374,901
27,965,532 33,801,867
697,579,114 237,964,704
(7,664,617) (7,500,468)
(66,671,659) (19,670,144)
(12,507,639) (8,293,907)
610,735,199 202,500,185
(20,005,482) (113,773,554)
10,397,999 450,000
(56,055,474) (19,204,694)
15,877,333 68,785,650
2,251,065 858,510
(47,534,559) (62,884,088)
2,110,619 148,443,886
(39,321,438) (31,586,286)
(511,266,579) (232,067,536)
(548,477,398) (115,209,936)
14,723,242 24,406,161
16,953,009 15,939,035
31,676,251 40,345,196
Quarter Ended
Rupees RupeesCASH FLOWS FROM OPERATING ACTIVITIES
Profit before taxation
Adjustments for:
Depreciation on property plant, and equipment
Amortization of intangible asset
Provision for employees retirement benefits
Loss / (Gain) on disposal of property, plant and equipment
Loss on sale of short term investments
Finance Cost
Dividend income
Changes in working capital
Decrease / (increase) in current assets:
Stores, spares and loose tools
Stock-in-trade
Trade debts
Advances, prepayments and other receivables
Increase in Trade and other payables
Cash generated from operations
Payments made:
Employees retirement benefits
Finance Cost
Income taxes
Net cash generated from operating activities
CASH FLOWS FROM INVESTING ACTIVITIES
Purchase of property, plant and equipment
Proceeds from disposal of property, plant and equipment
Purchase of short term investments
Proceeds from sale of short term investments
Dividend received
Net cash used in investing activities
CASH FLOWS FROM FINANCING ACTIVITIES
Long term finance obtained
Repayment of long term finances
Net cash used in financing activities
Net Increase in cash and cash equivalents
Cash and cash equivalents at beginning of the period
Cash and cash equivalents at end of the period
The annexed explanatory notes from 1 to 15 form an integral part of these condensed interim financial statements.
Net decrease in short term borrowings
CONDENSED INTERIM STATEMENT OF CHANGES IN EQUITY (UN-AUDITED)FOR THE QUARTER ENDED SEPTEMBER 30, 2018
Balance as at June 30, 2017 (Audited) 109,500,000
7,760,000
(10,504,398)
1,342,268,486
1,449,024,088
Comprehensive income
Profit after taxation -
-
-
17,924,780
17,924,780
Other comprehensive loss -
-
(20,682,166)
-
(20,682,166)
-
-
(20,682,166)
17,924,780
(2,757,386)
Balance as at September 30, 2017 (Un-audited) 109,500,000
7,760,000
(31,186,564)
1,360,193,266
1,446,266,702
Transactions with owners
Final dividend for the year ended June 30, 2017 -
-
-
(38,325,000)
(38,325,000)
@ 35% i.e. Rs. 3.50 per ordinary share
Comprehensive income
Profit after taxation -
-
-
112,589,816
112,589,816
Other comprehensive income/(loss) - net of tax -
-
29,405,967
(667,104)
28,738,863
-
-
29,405,967
111,922,712
141,328,679
Balance as at June 30, 2018 (Audited) 109,500,000
7,760,000
(1,780,597)
1,433,790,978
1,549,270,381
Comprehensive income / (loss)
Profit after taxation -
-
-
43,654,888
43,654,888
Other comprehensive income / (loss) -
-
2,320,241
(5,929,349)
(3,609,108)
-
-
2,320,241
37,725,539
40,045,780
Balance as at September 30, 2018 (Un-audited) 109,500,000 7,760,000 539,644 1,471,516,517 1,589,316,161
The annexed explanatory notes from 1 to 15 form an integral part of these condensed interim financial statements.
Total comprehensive income
-------------------------------Rupees-------------------------------
Total comprehensive income/(loss)
Total comprehensive income
Share Capital Revenue reserve
TotalReserve on merger
Changes in fair
value of equity
investments
Capital reserve
Accumulated profit
Issued, subscribed
and paid-up share
capital
Shafqat Ellahi ShaikhMg. Director (Chief Executive)Lahore : October 25, 2018.
Shahzada Ellahi ShaikhChairman
Muhammad AhmadChief Financial Officer
Shafqat Ellahi ShaikhMg. Director (Chief Executive)Lahore : October 25, 2018.
Shahzada Ellahi ShaikhChairman
Muhammad AhmadChief Financial Officer

10
NAGINA
NAGINA GROUP
ELLCOT SPINNING MILLS LIMITED
9
NAGINA
NAGINA GROUP
ELLCOT SPINNING MILLS LIMITED
CONDENSED INTERIM STATEMENT OF CASH FLOWS (UN-AUDITED)FOR THE QUARTER ENDED SEPTEMBER 30, 2018
September 30 September 30
2018 2017
43,654,888 17,924,780
65,891,873 30,821,738
309,999 309,999
8,152,496 6,696,249
5,240 (111,357)
- 6,837,852
64,788,052 20,167,185
(2,251,065) (858,510)
136,896,595 63,863,156
180,551,483 81,787,936
7,282,139 (22,525,882)
112,280,722 (32,839,164)
247,864,347 125,822,041
121,634,891 51,917,906
489,062,099 122,374,901
27,965,532 33,801,867
697,579,114 237,964,704
(7,664,617) (7,500,468)
(66,671,659) (19,670,144)
(12,507,639) (8,293,907)
610,735,199 202,500,185
(20,005,482) (113,773,554)
10,397,999 450,000
(56,055,474) (19,204,694)
15,877,333 68,785,650
2,251,065 858,510
(47,534,559) (62,884,088)
2,110,619 148,443,886
(39,321,438) (31,586,286)
(511,266,579) (232,067,536)
(548,477,398) (115,209,936)
14,723,242 24,406,161
16,953,009 15,939,035
31,676,251 40,345,196
Quarter Ended
Rupees RupeesCASH FLOWS FROM OPERATING ACTIVITIES
Profit before taxation
Adjustments for:
Depreciation on property plant, and equipment
Amortization of intangible asset
Provision for employees retirement benefits
Loss / (Gain) on disposal of property, plant and equipment
Loss on sale of short term investments
Finance Cost
Dividend income
Changes in working capital
Decrease / (increase) in current assets:
Stores, spares and loose tools
Stock-in-trade
Trade debts
Advances, prepayments and other receivables
Increase in Trade and other payables
Cash generated from operations
Payments made:
Employees retirement benefits
Finance Cost
Income taxes
Net cash generated from operating activities
CASH FLOWS FROM INVESTING ACTIVITIES
Purchase of property, plant and equipment
Proceeds from disposal of property, plant and equipment
Purchase of short term investments
Proceeds from sale of short term investments
Dividend received
Net cash used in investing activities
CASH FLOWS FROM FINANCING ACTIVITIES
Long term finance obtained
Repayment of long term finances
Net cash used in financing activities
Net Increase in cash and cash equivalents
Cash and cash equivalents at beginning of the period
Cash and cash equivalents at end of the period
The annexed explanatory notes from 1 to 15 form an integral part of these condensed interim financial statements.
Net decrease in short term borrowings
CONDENSED INTERIM STATEMENT OF CHANGES IN EQUITY (UN-AUDITED)FOR THE QUARTER ENDED SEPTEMBER 30, 2018
Balance as at June 30, 2017 (Audited) 109,500,000
7,760,000
(10,504,398)
1,342,268,486
1,449,024,088
Comprehensive income
Profit after taxation -
-
-
17,924,780
17,924,780
Other comprehensive loss -
-
(20,682,166)
-
(20,682,166)
-
-
(20,682,166)
17,924,780
(2,757,386)
Balance as at September 30, 2017 (Un-audited) 109,500,000
7,760,000
(31,186,564)
1,360,193,266
1,446,266,702
Transactions with owners
Final dividend for the year ended June 30, 2017 -
-
-
(38,325,000)
(38,325,000)
@ 35% i.e. Rs. 3.50 per ordinary share
Comprehensive income
Profit after taxation -
-
-
112,589,816
112,589,816
Other comprehensive income/(loss) - net of tax -
-
29,405,967
(667,104)
28,738,863
-
-
29,405,967
111,922,712
141,328,679
Balance as at June 30, 2018 (Audited) 109,500,000
7,760,000
(1,780,597)
1,433,790,978
1,549,270,381
Comprehensive income / (loss)
Profit after taxation -
-
-
43,654,888
43,654,888
Other comprehensive income / (loss) -
-
2,320,241
(5,929,349)
(3,609,108)
-
-
2,320,241
37,725,539
40,045,780
Balance as at September 30, 2018 (Un-audited) 109,500,000 7,760,000 539,644 1,471,516,517 1,589,316,161
The annexed explanatory notes from 1 to 15 form an integral part of these condensed interim financial statements.
Total comprehensive income
-------------------------------Rupees-------------------------------
Total comprehensive income/(loss)
Total comprehensive income
Share Capital Revenue reserve
TotalReserve on merger
Changes in fair
value of equity
investments
Capital reserve
Accumulated profit
Issued, subscribed
and paid-up share
capital
Shafqat Ellahi ShaikhMg. Director (Chief Executive)Lahore : October 25, 2018.
Shahzada Ellahi ShaikhChairman
Muhammad AhmadChief Financial Officer
Shafqat Ellahi ShaikhMg. Director (Chief Executive)Lahore : October 25, 2018.
Shahzada Ellahi ShaikhChairman
Muhammad AhmadChief Financial Officer
12
NAGINA
NAGINA GROUP
ELLCOT SPINNING MILLS LIMITED
11
NAGINA
NAGINA GROUP
ELLCOT SPINNING MILLS LIMITED
FOR THE QUARTER ENDED SEPTEMBER 30, 2018
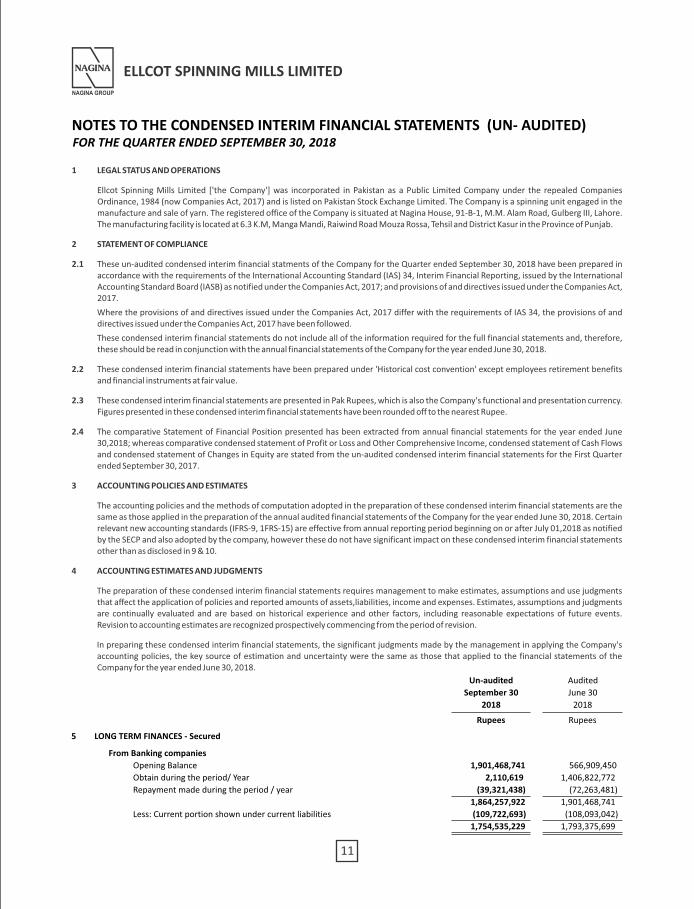
1 LEGAL STATUS AND OPERATIONS
Ellcot Spinning Mills Limited ['the Company'] was incorporated in Pakistan as a Public Limited Company under the repealed Companies Ordinance, 1984 (now Companies Act, 2017) and is listed on Pakistan Stock Exchange Limited. The Company is a spinning unit engaged in the manufacture and sale of yarn. The registered office of the Company is situated at Nagina House, 91-B-1, M.M. Alam Road, Gulberg III, Lahore. The manufacturing facility is located at 6.3 K.M, Manga Mandi, Raiwind Road Mouza Rossa, Tehsil and District Kasur in the Province of Punjab.
2 STATEMENT OF COMPLIANCE
2.1 These un-audited condensed interim financial statments of the Company for the Quarter ended September 30, 2018 have been prepared in accordance with the requirements of the International Accounting Standard (IAS) 34, Interim Financial Reporting, issued by the International Accounting Standard Board (IASB) as notified under the Companies Act, 2017; and provisions of and directives issued under the Companies Act, 2017.
Where the provisions of and directives issued under the Companies Act, 2017 differ with the requirements of IAS 34, the provisions of and directives issued under the Companies Act, 2017 have been followed.
These condensed interim financial statements do not include all of the information required for the full financial statements and, therefore, these should be read in conjunction with the annual financial statements of the Company for the year ended June 30, 2018.
2.2 These condensed interim financial statements have been prepared under 'Historical cost convention' except employees retirement benefits and financial instruments at fair value.
2.3 These condensed interim financial statements are presented in Pak Rupees, which is also the Company's functional and presentation currency. Figures presented in these condensed interim financial statements have been rounded off to the nearest Rupee.
2.4 The comparative Statement of Financial Position presented has been extracted from annual financial statements for the year ended June 30,2018; whereas comparative condensed statement of Profit or Loss and Other Comprehensive Income, condensed statement of Cash Flows and condensed statement of Changes in Equity are stated from the un-audited condensed interim financial statements for the First Quarter ended September 30, 2017.
3 ACCOUNTING POLICIES AND ESTIMATES
The accounting policies and the methods of computation adopted in the preparation of these condensed interim financial statements are the same as those applied in the preparation of the annual audited financial statements of the Company for the year ended June 30, 2018. Certain relevant new accounting standards (IFRS-9, 1FRS-15) are effective from annual reporting period beginning on or after July 01,2018 as notified by the SECP and also adopted by the company, however these do not have significant impact on these condensed interim financial statements other than as disclosed in 9 & 10.
4 ACCOUNTING ESTIMATES AND JUDGMENTS
The preparation of these condensed interim financial statements requires management to make estimates, assumptions and use judgments that affect the application of policies and reported amounts of assets,liabilities, income and expenses. Estimates, assumptions and judgments are continually evaluated and are based on historical experience and other factors, including reasonable expectations of future events. Revision to accounting estimates are recognized prospectively commencing from the period of revision.
In preparing these condensed interim financial statements, the significant judgments made by the management in applying the Company's accounting policies, the key source of estimation and uncertainty were the same as those that applied to the financial statements of the Company for the year ended June 30, 2018.
NOTES TO THE CONDENSED INTERIM FINANCIAL STATEMENTS (UN- AUDITED) 6 CONTINGENCIES AND COMMITMENTS
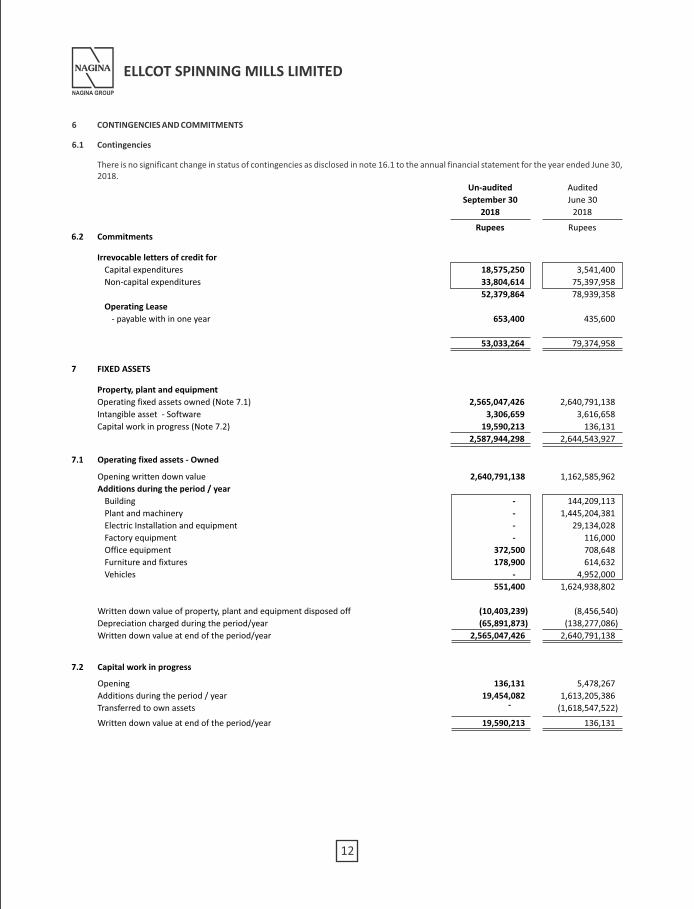
6.1 Contingencies
There is no significant change in status of contingencies as disclosed in note 16.1 to the annual financial statement for the year ended June 30, 2018.
5 LONG TERM FINANCES - Secured
From Banking companies
Opening Balance
Obtain during the period/ Year
Repayment made during the period / year
Less: Current portion shown under current liabilities
1,901,468,741 566,909,450
2,110,619 1,406,822,772
(39,321,438) (72,263,481)
1,864,257,922 1,901,468,741
(109,722,693) (108,093,042)
1,754,535,229 1,793,375,699
Un-audited Audited
September 30 June 30
2018 2018
Rupees Rupees
6.2
7
18,575,250
3,541,400
33,804,614
75,397,958
52,379,864
78,939,358
653,400 435,600
53,033,264
79,374,958
2,565,047,426
2,640,791,138
3,306,659 3,616,658
19,590,213 136,131
2,587,944,298 2,644,543,927
Un-audited Audited
September 30 June 30
2018 2018
Rupees Rupees
7.1
2,640,791,138
-
-
-
-
372,500
178,900
-
551,400
(10,403,239)
(65,891,873)
2,565,047,426
1,162,585,962
144,209,113
1,445,204,381
29,134,028
116,000
708,648
614,632
4,952,000
1,624,938,802
(8,456,540)
(138,277,086)
2,640,791,138
7.2
Commitments
Irrevocable letters of credit for
Capital expenditures
Non-capital expenditures
Operating Lease
- payable with in one year
FIXED ASSETS
Property, plant and equipment
Operating fixed assets owned (Note 7.1)
Intangible asset - Software
Capital work in progress (Note 7.2)
Operating fixed assets - Owned
Opening written down value
Additions during the period / year
Building
Plant and machinery
Electric Installation and equipment
Factory equipment
Office equipment
Furniture and fixtures
Vehicles
Written down value of property, plant and equipment disposed off
Depreciation charged during the period/year
Written down value at end of the period/year
Capital work in progress
Opening
Additions during the period / year
Transferred to own assets
Written down value at end of the period/year
136,131
19,454,082-
19,590,213
5,478,267
1,613,205,386
(1,618,547,522)
136,131
12
NAGINA
NAGINA GROUP
ELLCOT SPINNING MILLS LIMITED
11
NAGINA
NAGINA GROUP
ELLCOT SPINNING MILLS LIMITED
FOR THE QUARTER ENDED SEPTEMBER 30, 2018
1 LEGAL STATUS AND OPERATIONS
Ellcot Spinning Mills Limited ['the Company'] was incorporated in Pakistan as a Public Limited Company under the repealed Companies Ordinance, 1984 (now Companies Act, 2017) and is listed on Pakistan Stock Exchange Limited. The Company is a spinning unit engaged in the manufacture and sale of yarn. The registered office of the Company is situated at Nagina House, 91-B-1, M.M. Alam Road, Gulberg III, Lahore. The manufacturing facility is located at 6.3 K.M, Manga Mandi, Raiwind Road Mouza Rossa, Tehsil and District Kasur in the Province of Punjab.
2 STATEMENT OF COMPLIANCE
2.1 These un-audited condensed interim financial statments of the Company for the Quarter ended September 30, 2018 have been prepared in accordance with the requirements of the International Accounting Standard (IAS) 34, Interim Financial Reporting, issued by the International Accounting Standard Board (IASB) as notified under the Companies Act, 2017; and provisions of and directives issued under the Companies Act, 2017.
Where the provisions of and directives issued under the Companies Act, 2017 differ with the requirements of IAS 34, the provisions of and directives issued under the Companies Act, 2017 have been followed.
These condensed interim financial statements do not include all of the information required for the full financial statements and, therefore, these should be read in conjunction with the annual financial statements of the Company for the year ended June 30, 2018.
2.2 These condensed interim financial statements have been prepared under 'Historical cost convention' except employees retirement benefits and financial instruments at fair value.
2.3 These condensed interim financial statements are presented in Pak Rupees, which is also the Company's functional and presentation currency. Figures presented in these condensed interim financial statements have been rounded off to the nearest Rupee.
2.4 The comparative Statement of Financial Position presented has been extracted from annual financial statements for the year ended June 30,2018; whereas comparative condensed statement of Profit or Loss and Other Comprehensive Income, condensed statement of Cash Flows and condensed statement of Changes in Equity are stated from the un-audited condensed interim financial statements for the First Quarter ended September 30, 2017.
3 ACCOUNTING POLICIES AND ESTIMATES
The accounting policies and the methods of computation adopted in the preparation of these condensed interim financial statements are the same as those applied in the preparation of the annual audited financial statements of the Company for the year ended June 30, 2018. Certain relevant new accounting standards (IFRS-9, 1FRS-15) are effective from annual reporting period beginning on or after July 01,2018 as notified by the SECP and also adopted by the company, however these do not have significant impact on these condensed interim financial statements other than as disclosed in 9 & 10.
4 ACCOUNTING ESTIMATES AND JUDGMENTS
The preparation of these condensed interim financial statements requires management to make estimates, assumptions and use judgments that affect the application of policies and reported amounts of assets,liabilities, income and expenses. Estimates, assumptions and judgments are continually evaluated and are based on historical experience and other factors, including reasonable expectations of future events. Revision to accounting estimates are recognized prospectively commencing from the period of revision.
In preparing these condensed interim financial statements, the significant judgments made by the management in applying the Company's accounting policies, the key source of estimation and uncertainty were the same as those that applied to the financial statements of the Company for the year ended June 30, 2018.
NOTES TO THE CONDENSED INTERIM FINANCIAL STATEMENTS (UN- AUDITED) 6 CONTINGENCIES AND COMMITMENTS
6.1 Contingencies
There is no significant change in status of contingencies as disclosed in note 16.1 to the annual financial statement for the year ended June 30, 2018.
5 LONG TERM FINANCES - Secured
From Banking companies
Opening Balance
Obtain during the period/ Year
Repayment made during the period / year
Less: Current portion shown under current liabilities
1,901,468,741 566,909,450
2,110,619 1,406,822,772
(39,321,438) (72,263,481)
1,864,257,922 1,901,468,741
(109,722,693) (108,093,042)
1,754,535,229 1,793,375,699
Un-audited Audited
September 30 June 30
2018 2018
Rupees Rupees
6.2
7
18,575,250
3,541,400
33,804,614
75,397,958
52,379,864
78,939,358
653,400 435,600
53,033,264
79,374,958
2,565,047,426
2,640,791,138
3,306,659 3,616,658
19,590,213 136,131
2,587,944,298 2,644,543,927
Un-audited Audited
September 30 June 30
2018 2018
Rupees Rupees
7.1
2,640,791,138
-
-
-
-
372,500
178,900
-
551,400
(10,403,239)
(65,891,873)
2,565,047,426
1,162,585,962
144,209,113
1,445,204,381
29,134,028
116,000
708,648
614,632
4,952,000
1,624,938,802
(8,456,540)
(138,277,086)
2,640,791,138
7.2
Commitments
Irrevocable letters of credit for
Capital expenditures
Non-capital expenditures
Operating Lease
- payable with in one year
FIXED ASSETS
Property, plant and equipment
Operating fixed assets owned (Note 7.1)
Intangible asset - Software
Capital work in progress (Note 7.2)
Operating fixed assets - Owned
Opening written down value
Additions during the period / year
Building
Plant and machinery
Electric Installation and equipment
Factory equipment
Office equipment
Furniture and fixtures
Vehicles
Written down value of property, plant and equipment disposed off
Depreciation charged during the period/year
Written down value at end of the period/year
Capital work in progress
Opening
Additions during the period / year
Transferred to own assets
Written down value at end of the period/year
136,131
19,454,082-
19,590,213
5,478,267
1,613,205,386
(1,618,547,522)
136,131

NAGINA
NAGINA GROUP
ELLCOT SPINNING MILLS LIMITED
13
Nature of Relationship Nature of Transaction
Associated companies Purchases
Sales
Rent Paid
Key Management Personnel Remuneration and other benefits
September 30 September 30
2018 2017
72,334,000
22,000
362,853,225 216,105,274
217,800 198,000
2,567,283 2,147,957
Quarter Ended (Un-audited)
Rupees Rupees
14
NAGINA
NAGINA GROUP
ELLCOT SPINNING MILLS LIMITED
8 COST OF SALES
Raw material consumed
Fuel and power
Stores, spares and loose tools consumed
Salaries, wages and benefits
Insurance
Repair and maintenance
Depreciation
Other manufacturing overheads
Manufacturing cost
Work-in-process:
At beginning of period
At end of period
Cost of goods manufactured
Finished goods:
At beginning of period
Purchases
At end of period
September 30 September 30
2018 2017
945,127,442
139,741,179
43,828,087
93,395,035
2,303,629
2,087,856
64,350,755
4,251,674 1,295,085,657
58,649,452
(63,299,280)
(4,649,828)
1,290,435,829
61,759,790
72,310,000
(109,185,234)
24,884,556
1,315,320,385
872,975,319
118,906,692
39,020,920
93,938,311
1,551,038
2,530,543
29,093,231
4,457,802
1,162,473,856
46,147,798
(45,656,585)
491,213
1,162,965,069
52,883,593
-
(113,495,185)
(60,611,592)
1,102,353,477
Rupees
Quarter Ended (Un-audited)
Rupees
10 This represents realized loss on "Sale of Equity Investments measured at fair value through Other Comprehensive Income" as per IFRS-9.
11 FAIR VALUE OF FINANCIAL INSTRUMENTS
Financial instruments are carried at fair value, by valuation method. The different levels have been defined as follows:
Level 1: Quoted prices (unadjusted) in active markets for identical assets or liabilities. Level 2: Inputs other than quoted prices included within Level 1 that are observable for the asset or liability, either directly (i.e., as prices) or
indirectly (i.e., derived from prices). Level 3: Inputs for the asset or liability that are not based on observable market data i.e.; (unobservable inputs).
The Following table presents the Funds / Company's financial assets which are carried at fair value:
Reason
IFRS-9
Rupees
20,682,166 Items that will not bereclassified to profit or loss
Reclassified toReclassified from
Items that may be reclassified
subsequently to profit or loss
9 Reclassifications
The corresponding figures of unrealized loss on remeasurement of equity investments have been reclassified to comply with the requirements of IFRS-9 as per following:
Financial assets
at fair value through OCI
- Mutual funds
- Listed equity securities
- - 12,703,262.00
- - 474,899,294
- - 487,602,556
---------------------------------- Rs -------------------------------------
September 30, 2018
12,703,262
474,899,294
487,602,556
Level 2 Level 3 TotalLevel 1
Level 2 Level 3 Total
Financial assets
at fair value through OCI
- Mutual funds - - 13,184,825
- Listed equity securities - - 437,848,698
- - 451,033,523
June 30, 2018
---------------------------------- Rs -------------------------------------
Level 1
13,184,825
437,848,698
451,033,523
At 30 September, 2018, the Company holds short term investments where the company has used Level 1 inputs for the measurement of fair values and there is no transfer between levels.
12 FINANCIAL RISK MANAGEMENT
The Company’s financial risk management objectives and policies are consistent with those disclosed in the audited annual published financial statements of the Company for the year ended June 30, 2018.
13 TRANSACTIONS WITH RELATED PARTIES
The related parties comprise of associated companies, directors and key management pesonnels of the Company. Transaction with related parties are carried out at arm's length in the normal course of business. The consideration is determined on commercial terms and conditions. The transactions with related parties during the period generally consist of sales and purchases.
Nature and description of related party transactions during the period along with monetary values are as follows:
There is no balance outstanding with or from associated undertakings, as at reporting date.
14 OTHERS
The Board of directors in its meeting held on September 27, 2018, proposed to distribute to the shareholders of the Company, cash dividend at the rate of 60 percent (i.e. Rs.6/- per ordinary share). The dividend is subject to the approval by the shareholders of the Company in its forthcoming Annual General Meeting to be held on October 26, 2018.
15 DATE OF AUTHORIZATION FOR ISSUE
These un-audited condensed interim financial statements have been approved by the Board of Directors of the Company and authorized for issue on October 25, 2018.
Shafqat Ellahi ShaikhMg. Director (Chief Executive)Lahore : October 25, 2018.
Shahzada Ellahi ShaikhChairman
Muhammad AhmadChief Financial Officer

NAGINA
NAGINA GROUP
ELLCOT SPINNING MILLS LIMITED
13
Nature of Relationship Nature of Transaction
Associated companies Purchases
Sales
Rent Paid
Key Management Personnel Remuneration and other benefits
September 30 September 30
2018 2017
72,334,000
22,000
362,853,225 216,105,274
217,800 198,000
2,567,283 2,147,957
Quarter Ended (Un-audited)
Rupees Rupees
14
NAGINA
NAGINA GROUP
ELLCOT SPINNING MILLS LIMITED
8 COST OF SALES
Raw material consumed
Fuel and power
Stores, spares and loose tools consumed
Salaries, wages and benefits
Insurance
Repair and maintenance
Depreciation
Other manufacturing overheads
Manufacturing cost
Work-in-process:
At beginning of period
At end of period
Cost of goods manufactured
Finished goods:
At beginning of period
Purchases
At end of period
September 30 September 30
2018 2017
945,127,442
139,741,179
43,828,087
93,395,035
2,303,629
2,087,856
64,350,755
4,251,674 1,295,085,657
58,649,452
(63,299,280)
(4,649,828)
1,290,435,829
61,759,790
72,310,000
(109,185,234)
24,884,556
1,315,320,385
872,975,319
118,906,692
39,020,920
93,938,311
1,551,038
2,530,543
29,093,231
4,457,802
1,162,473,856
46,147,798
(45,656,585)
491,213
1,162,965,069
52,883,593
-
(113,495,185)
(60,611,592)
1,102,353,477
Rupees
Quarter Ended (Un-audited)
Rupees
10 This represents realized loss on "Sale of Equity Investments measured at fair value through Other Comprehensive Income" as per IFRS-9.
11 FAIR VALUE OF FINANCIAL INSTRUMENTS
Financial instruments are carried at fair value, by valuation method. The different levels have been defined as follows:
Level 1: Quoted prices (unadjusted) in active markets for identical assets or liabilities. Level 2: Inputs other than quoted prices included within Level 1 that are observable for the asset or liability, either directly (i.e., as prices) or
indirectly (i.e., derived from prices). Level 3: Inputs for the asset or liability that are not based on observable market data i.e.; (unobservable inputs).
The Following table presents the Funds / Company's financial assets which are carried at fair value:
Reason
IFRS-9
Rupees
20,682,166 Items that will not bereclassified to profit or loss
Reclassified toReclassified from
Items that may be reclassified
subsequently to profit or loss
9 Reclassifications
The corresponding figures of unrealized loss on remeasurement of equity investments have been reclassified to comply with the requirements of IFRS-9 as per following:
Financial assets
at fair value through OCI
- Mutual funds
- Listed equity securities
- - 12,703,262.00
- - 474,899,294
- - 487,602,556
---------------------------------- Rs -------------------------------------
September 30, 2018
12,703,262
474,899,294
487,602,556
Level 2 Level 3 TotalLevel 1
Level 2 Level 3 Total
Financial assets
at fair value through OCI
- Mutual funds - - 13,184,825
- Listed equity securities - - 437,848,698
- - 451,033,523
June 30, 2018
---------------------------------- Rs -------------------------------------
Level 1
13,184,825
437,848,698
451,033,523
At 30 September, 2018, the Company holds short term investments where the company has used Level 1 inputs for the measurement of fair values and there is no transfer between levels.
12 FINANCIAL RISK MANAGEMENT
The Company’s financial risk management objectives and policies are consistent with those disclosed in the audited annual published financial statements of the Company for the year ended June 30, 2018.
13 TRANSACTIONS WITH RELATED PARTIES
The related parties comprise of associated companies, directors and key management pesonnels of the Company. Transaction with related parties are carried out at arm's length in the normal course of business. The consideration is determined on commercial terms and conditions. The transactions with related parties during the period generally consist of sales and purchases.
Nature and description of related party transactions during the period along with monetary values are as follows:
There is no balance outstanding with or from associated undertakings, as at reporting date.
14 OTHERS
The Board of directors in its meeting held on September 27, 2018, proposed to distribute to the shareholders of the Company, cash dividend at the rate of 60 percent (i.e. Rs.6/- per ordinary share). The dividend is subject to the approval by the shareholders of the Company in its forthcoming Annual General Meeting to be held on October 26, 2018.
15 DATE OF AUTHORIZATION FOR ISSUE
These un-audited condensed interim financial statements have been approved by the Board of Directors of the Company and authorized for issue on October 25, 2018.
Shafqat Ellahi ShaikhMg. Director (Chief Executive)Lahore : October 25, 2018.
Shahzada Ellahi ShaikhChairman
Muhammad AhmadChief Financial Officer

ELLCOT SPINNING MILLS LTD.Nagina House, 91-B-1, M.M. Alam Road,Gulberg-III Lahore-54660
If undelivered please return to: