fiscal policy and economic development in sub saharan
TRANSCRIPT
www.theijbmt.com 62 | Page
The International Journal of Business Management and Technology, Volume 4 Issue 1 January–February 2020
ISSN: 2581-3889
Research Article Open Access
Fiscal Policy and Economic Development in Sub Saharan
Africa; Emphasis on Poverty in Ghana and Nigeria
*1Njoku Charles Odinakachi, 2Ozurumba Benedict Anayo, 3Chris-EjioguUzoamaka
Gloria & 4Chigbu, Ezeji Emmanuel, 1,2,3,4Department of Financial Management Technology, Federal University of Technology, Owerri, Imo State, Nigeria.
ABSTRACT: This work examines the effect of fiscal policy on the economic development of Sub Saharan Africa with emphasis on
poverty reduction in Ghana and Nigeria. The research covers the period of 1986-2017 for both countries. The secondary data needed
for the research were collected and the analysis was conducted using e-views 10. The preliminary analysis on the data showed that
the variables were stationary at first difference which confirmed the absence of unit root in the variables. The Johansen Cointegration
test suggested that a long run relationship exist between fiscal policy and poverty reduction in both Ghana and Nigeria. The Vector
Error Correction Mechanism confirmed that the relationship between fiscal policy and poverty reduction in Nigeria in short run
form. But, the short run relationship between fiscal policy and poverty reduction in Nigeria is not statistically significant at 5%
level of significance with F. Statistic value of 2.186 and Probability of 0.088. The result revealed that a unit change in tax revenue
results to a 0.01046 unit reduction in poverty in Nigeria in the short run. Meanwhile, the result for Ghana reveled that a long run
relationship existing between fiscal policy and poverty reduction is not statistically significant at 5% significance level with F.Stat.
(1.477) and F.Stat.(Prob.P) 0.224. The results have revealed that Sub Saharan African economies have not significantly done
enough in their lip service fight against poverty in the region. There is urgent need to tackle this menace of poverty by settle out
programs that have direct effect on the people. An increase recurrent expenditure through income (salaries and wages) would benefit
the poor the more. Increased funding to the Agricultural sector would help in reducing the poverty rate, as majority of the poor
people in Sub Sahara Africa are predominantly farmers, as recurrent expenditure has a positive significant effect on poverty at 10%
level of significance in the short run in Nigeria. There is need for a restructured revenue base in Nigeria and Ghana to finance fiscal
policy expansion rather than embarking on borrowing which increases the burden on the poor. Government should as well distribute
its social welfare program in a way that it would directly benefit the poor.
KEY WORDS: Fiscal Policy, Economic Development, Poverty Reduction, Government Revenue, Government
Expenditure, Deficit Financing.
I. INTRODUCTION
The use of fiscal policy is essentialin every economy especially in developing countries as a major tool that enhances
economic growth and enhances fast economic development.
Fiscal policy means the government’s use of its receipts (revenue, usually tax), expenditure and deficit financing to
regulate the level of economic activities in the countries in order to income distribution and reduce the rate of poverty in
any country. The main fiscal policy tools are the changes in the level and composition of taxation, government spending
in various sectors and government deficit financing. Fiscal policy is the main key to economic development as
government use fiscal policy to regulate and stimulate the economy, without it there won’t be functional government
(Singh,2018).
Fiscal policy measure could be contractionary, expansionary or neutral. Nigeria and Ghana have adopted expansionary
fiscal policy over the years in order to stimulate economic growth, and achieve other macro-economic objectives
(O’Nwachukwu, 2017).
So, in the theory of Wagner, it is believed that there is a functional relationship between increasing economic activities
and government fiscal activities. Economic development is the process by which the general economic wellbeing and
quality of life the citizens of a nation is enhanced. Economic development occurs with the reduction of poverty,
inequality and unemployment within an economy with enhanced standard of living (Ogiogio, 1996)

www.theijbmt.com 63 | Page
Fiscal Policy and Economic Development in Sub Saharan Africa; Emphasis on Poverty in Ghana and Nigeria
According to Farayibi and Owuru (2016), reducing government spending may have adverse effect on the economy, yet
excess government spending due to recurrent expenditure or unproductive use of revenue creates deficit. Fiscal deficit
crowds out private investment and lead to inefficient allocation of resources.
But, fiscal deficit can still help to reduce poverty in the long run, if it leads to increase in productivity and employment
generation (Fofack 2010).
Crowding out occurs when government’s involvements in a sector of the economy eliminates private sector
involvement in that sector.
In spite of government fiscal policy measures aimed at enhancing growth and the standard of living of the people,
reducing unemployment and poverty, Sub Sahara African countries are still underdeveloped. The United Nations
Human Development Index (2012) has shown that 34 of the 50 nations of the UN list of least developed countries are in
Sub Saharan Africa.
With low life expectancy, little or no access to education and low standard of living. Life expectancy in Nigeria 52years,
Ghana 63.91years with an average of 61 years in Sub Saharan Africa.
The average rate of poverty in sub Saharan Africa stood at 41% in 2018,and of the world’s poorest 28 countries, 27 are in
Sub Saharan Africa, all with a poverty rate above 30% (World Bank 2018).
With the 2018 Word bank extreme poverty definition as those living below $1.90 dollars per day, a vast majority of those
in extreme poverty are in Sub Saharan Africa, with Nigeria becoming the extreme poverty capital of the world with
more than 86million Nigeria living in extreme poverty despite its abundant resources. While 21.4% of Ghanaians live
below the poverty line (world bank 2018).
Youth unemployment has been a major challenge facing Sub Saharan Africa with an average rate of 22.8% in 2017.
Nigeria has 23.10% youth unemployment rate while Ghana has 2.4% unemployment rate in 2017 (World Bank 2018).
Youth unemployment is dangerous to the development of any nation.
Despite government fiscal policy measures aimed at addressing the economic problems in Sub Saharan Africa,
unemployment rate remains high, poverty level continue to increase, with low life expectancy, little or no access to
education, low standard of living and a declining economic growth. The question is: How have these fiscal policy
measures (increase in government revenue, government expenditure and deficit financing) influenced the level of
economic development in Sub Sahara African Countries.
II. CONCEPTUAL REVIEW
The Concept of Fiscal Policy
Anyanwu (1997) defined Fiscal Policy as the use of the powers of taxation, public expenditure and other financial
programs embodied in annual budgets by government to achieve earmarked national goal.
In other words, Fiscal Policy is a main economic stabilizer that involves government actions taken to regulate and
control the level and volume of money in an economy in order to achieve broad macroeconomic objective and to control
unwanted economic trends in the economy of a nation (Hassan, et al. 2003).
According to Tanzi and Zee (1996), there are three cardinal indicators of fiscal policy: government spending, taxes and
deficits. Okafor (2012) opined that economic policy instruments such as fiscal money, foreign trade, price and
employment had been used to achieve specific macroeconomic objectives of full employment, production, and price-
stability, balance of payment, development and redistribution of income. The fiscal policy, as an economic measure is
the deliberate use of government spending and taxes to achieve macro-economic growth. So, it describes the
combination of measures in government revenue, expenditure and deficit to achieve overall economic objectives of a
nation. The government fiscal policy measures are categorized into two: Automatic Stabilizers and Discretionary Fiscal
Policy Measures. The Automatic stabilizers are government expenditure or taxation actions that take place without any
deliberate government control and which tend to dampen the business cycle. Whereas, the discretionary fiscal policy are
government expenditure and taxation actions that have been deliberately taken to achieve specified macroeconomics
goals (Appah, 2010).
The three main stances of fiscal policy are:
Neutral fiscal policy is mainly undertaken when an economy is in equilibrium. Government expenditure is
fully funded by taxrevenue and overall the budget outcome has a neutral effect on the level of economic
activity.
Expansionary fiscal policy involves government expenditure exceeding tax revenue; it is usually undertaken
during recessions. It is also known as reflationary fiscal policy.

www.theijbmt.com 64 | Page
Fiscal Policy and Economic Development in Sub Saharan Africa; Emphasis on Poverty in Ghana and Nigeria
Contractionary fiscal policy occurs if government spending is lower than tax revenue, and is usually
undertaken to pay down government debt (Okafor 2012).
Tobynomics: This involves a change in government policy with the aim of maximizing revenue and increasing
taxes without increasing spending. This helps the economy to settle its outstanding debts or enhance its capital
reserves. But, this Tobynomics is usually unpopular (Audu2012).
Economic development is the process by which a nation improves the economic, political, and social well-being of its
citizens and it occurs with the reduction of poverty, inequality and unemployment within an economy (Ogiogio, 1996).
Whereas, Economic development is a process whereby the policy intervention endeavor of a nation aim at improving
the economic and social well-being of people, economic growth is just a phenomenon that involves
market productivity and rise in Gross Domestic Product. Audu (2012) defined Economic development is a process of
prolonged and sustained increases in the real national income of a country accompanied by positive changes in the
economic, technological, political and social structures of the economy with the result that the real income per capita of
the people increases over a long period of time, subject to the stipulation that the number of people below the poverty
line does not increase, the distribution of income does not become more unequal and development does not become less
sustainable environmentally.
Economic development is seen as a factor of economic growth. It was believed that economic development occurred
when there was high level of industrialization and economic growth (Ogiogio, 1996). Social factor such as poverty &
unemployment were of lesser importance.
The Nigerian economy has been severely affected by external shocks, in particular a fall in the global price of crude oil.
Growth slowed sharply from 6.2% in 2014 to an estimated 3.0% in 2015 (CBN, 2016). The sluggish growth is mainly as a
result of a slowdown in economic activity which has been adversely impacted by the shortage of supply of foreign
exchange and aggravated by the foreign exchange restrictions targeted at a list of 41 imports, some of which are
manufacturing and agro-industry inputs. This has led to a cut in production and shedding of labor in some sectors. As a
result, with the increasing policy concern over the fall in growth, the central bank has moved to reduce the cost of
borrowing for government and the private sector to stimulate the economy (Agu, 2014).
Glomm and Ravikumar (1994), opines that the ultimate objective of fiscal and monetary policy is to promote sound
economic performance and high living standards of the citizens. He posits that this gives the citizens confidence in the
currency as a store of value, unit of account and medium of exchange, so that they can make sound economic and
financial decisions. Money policy impacts on the well-being of individuals depending on the policy measures put in
place (Aghion, 2009).
Poverty is indeed the most unfavorable economic problem facing any developing nation. As a result of high level of
inequality, for a certain income level, poverty has continued to increase; the unequal distribution of income is the major
cause. At the same time, fiscal and monetary policy is the main government tools for managing the economy. Given the
importance of poverty and the influence of fiscal policy, it is natural to ask if fiscal policy can be used as a tool to help
the poor Rasheed, (2010). Rasheed, examined the influence of fiscal policy on poverty and inequality both over the
business cycle in the United States and over the longer run in large sample of countries and concluded that there are
indeed important links between monetary policy and the well-being of the poor in both the short-run and the long-run,
but that short and long-run relationships go in opposite directions. Expansionary fiscal policy aimed at rapid output
growth is associated with improved conditions for the poor in the short run, but prudent fiscal policy aimed at low
inflation and steady output growth is associated with enhanced well-being of the poor in the long-run. They maintained
that fiscal policy can affect output, unemployment and inflation in the short run.
As a result, if poverty and inequality respond to these variables, fiscal policy can affect the well-being of the poor.
Furthermore, because unanticipated inflation can redistribute wealth from creditors to debtors, fiscal policy can also
affect distribution through this channel (Levine & Renelt, 2016).
The central role of fiscal policy in addressing poverty and inequality has long been acknowledged in the literature, yet
empirical work on it, particularly in Africa, is very limited. Medee & Nenbee, (2011) explained that Fiscal policies affect
poverty and inequality through progressivity of taxes, well- targeted transfers and quality of public expenditure. The
relationship is, however, not linear; it requires adroit management of policymakers. On the other hands, fiscal policy can
also be used to influence other structural factors affecting poverty and inequality especially human capital
accumulation, factor endowment and labor market development. Simon Kuznets in 1955 brought to prominence the
linkage between economic growth and inequality by hypothesizing that economic growth at the initial stage raises and
later reduces income inequality. Since then, several studies have tried to unearth key drivers of inequality–factors
contributing to lopsided wealth and income distributions (Barro, 1986). Other important determinants of inequality
include human capital accumulation (Petrakos, et al. 2007); labor and capital endowments and their returns (Mauro,
www.theijbmt.com 65 | Page
Fiscal Policy and Economic Development in Sub Saharan Africa; Emphasis on Poverty in Ghana and Nigeria
1995); trade openness. (Barro, 1996) using wages and employment as the transmission mechanisms; and economic
integration leading to the adoption of common currency in Europe, which limits national governments to pursue their
own income redistribution objectives (Solow, 1956).The key question, therefore, is how can we use fiscal policies to
influence these factors that shape poverty and inequality? Fiscal space enhances economic efficiency and better
distributional coverage.
Fiscal policies affect poverty and inequality through taxes, transfers and public expenditure. The relationship is not
automatic or linear. The progressivity of direct taxes (such as those leviedon income, wealth and inheritance) and
indirect taxes (such as on consumption) is an important channel.
Efficient and well-targeted public spending on education, vocational and entrepreneurial training, and basic health
services are vehicles to reduce poverty and income inequality. For instance, public spending that proactively supports
girls and women’s education could help address inter-generational poverty while those directed at vocational skills of
unskilled labor could accelerate reduction in income inequality.
Heavy and quality investment in human capital accumulation and development could drive poverty and inequality
reduction. The ability of fiscal policies to substantially influence social change and labor market mobility, for instance,
portends whether the impact on poverty and inequality is short or long term in orientation. For instance, transition from
vulnerable groups to a middle class status is a social movement. Enhancing knowledge and cognitive skills of girls and
women provides opportunity to transit from the excluded and marginalized groups to empowered groups that hold the
key to propel fortunes of households (Liu, 1999).
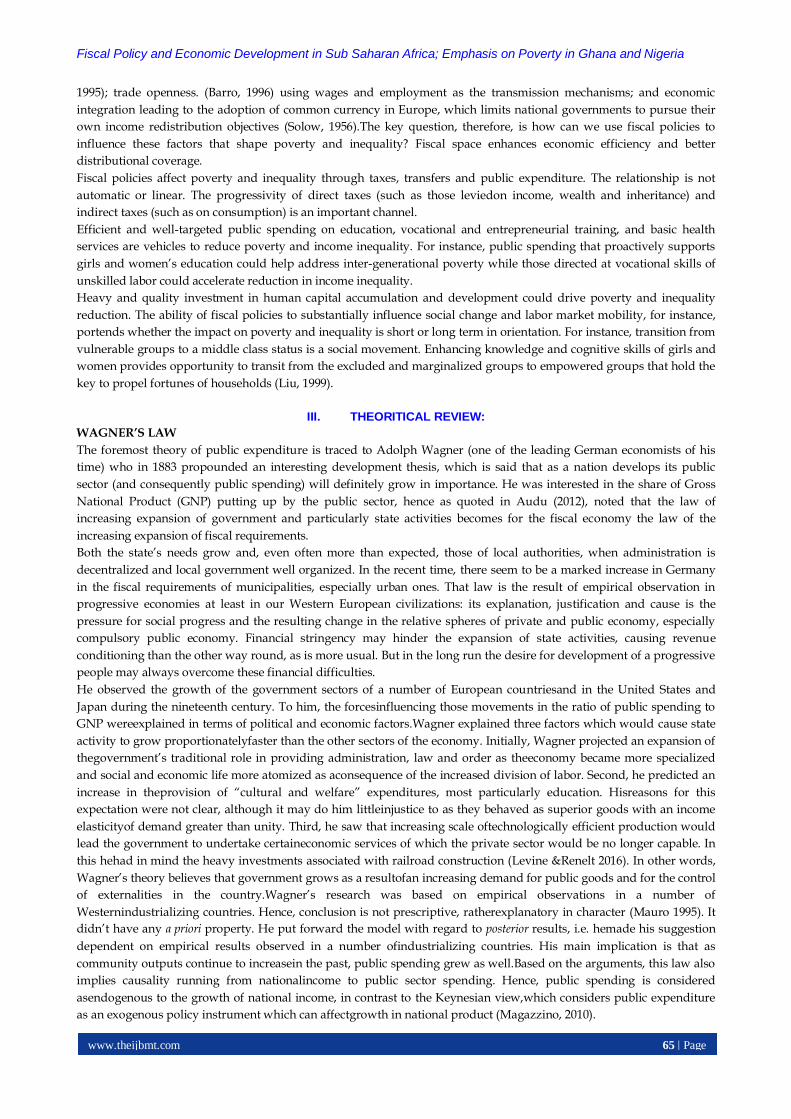
III. THEORITICAL REVIEW:
WAGNER’S LAW
The foremost theory of public expenditure is traced to Adolph Wagner (one of the leading German economists of his
time) who in 1883 propounded an interesting development thesis, which is said that as a nation develops its public
sector (and consequently public spending) will definitely grow in importance. He was interested in the share of Gross
National Product (GNP) putting up by the public sector, hence as quoted in Audu (2012), noted that the law of
increasing expansion of government and particularly state activities becomes for the fiscal economy the law of the
increasing expansion of fiscal requirements.
Both the state’s needs grow and, even often more than expected, those of local authorities, when administration is
decentralized and local government well organized. In the recent time, there seem to be a marked increase in Germany
in the fiscal requirements of municipalities, especially urban ones. That law is the result of empirical observation in
progressive economies at least in our Western European civilizations: its explanation, justification and cause is the
pressure for social progress and the resulting change in the relative spheres of private and public economy, especially
compulsory public economy. Financial stringency may hinder the expansion of state activities, causing revenue
conditioning than the other way round, as is more usual. But in the long run the desire for development of a progressive
people may always overcome these financial difficulties.
He observed the growth of the government sectors of a number of European countriesand in the United States and
Japan during the nineteenth century. To him, the forcesinfluencing those movements in the ratio of public spending to
GNP wereexplained in terms of political and economic factors.Wagner explained three factors which would cause state
activity to grow proportionatelyfaster than the other sectors of the economy. Initially, Wagner projected an expansion of
thegovernment’s traditional role in providing administration, law and order as theeconomy became more specialized
and social and economic life more atomized as aconsequence of the increased division of labor. Second, he predicted an
increase in theprovision of “cultural and welfare” expenditures, most particularly education. Hisreasons for this
expectation were not clear, although it may do him littleinjustice to as they behaved as superior goods with an income
elasticityof demand greater than unity. Third, he saw that increasing scale oftechnologically efficient production would
lead the government to undertake certaineconomic services of which the private sector would be no longer capable. In
this hehad in mind the heavy investments associated with railroad construction (Levine &Renelt 2016). In other words,
Wagner’s theory believes that government grows as a resultofan increasing demand for public goods and for the control
of externalities in the country.Wagner’s research was based on empirical observations in a number of
Westernindustrializing countries. Hence, conclusion is not prescriptive, ratherexplanatory in character (Mauro 1995). It
didn’t have any a priori property. He put forward the model with regard to posterior results, i.e. hemade his suggestion
dependent on empirical results observed in a number ofindustrializing countries. His main implication is that as
community outputs continue to increasein the past, public spending grew as well.Based on the arguments, this law also
implies causality running from nationalincome to public sector spending. Hence, public spending is considered
asendogenous to the growth of national income, in contrast to the Keynesian view,which considers public expenditure
as an exogenous policy instrument which can affectgrowth in national product (Magazzino, 2010).

www.theijbmt.com 66 | Page
Fiscal Policy and Economic Development in Sub Saharan Africa; Emphasis on Poverty in Ghana and Nigeria
This law has been used to assess a number of developing and developed economies using time series and cross sectional
data sets in the analysis. The role of the public sector is usually criticized on the grounds that the private sector is more
efficient than the government in allocating scarce economic resources. Again, to the regulatory process and, for that
matter, both monetary and fiscal policies can potentially hinder the incentive and reward system. A rapid expansion of
public spending usually results to structural changes which affect the relative growth of the public sector in any
economy(Mankiw 2013).
Theodore William Schultz Development Theory
This theory believes that the speed of recovery of an economy depends mostly on its healthy and well educated
population. The theory shows that education makes citizens to be productive and good health care keeps the education
investment within and able to produce. In conducting the research, among the poor farming nations of Europe, relating
to farmers and political leaders in small towns, He was "not scared to get his shoes a little muddy." He observed that the
help the United States sent in the form of food or money was not only of little assistance, but, actually dangerous to such
nations, as the farmers and agricultural producers within those nations were unable to compete well with the free prices
of the "aid" sent, and they were not able to sustain themselves or even invest the money they got from crops back into
the economy (Anyafor, 1996). His theory has it that, the U.S.A. instead used its resources to assist educate these rural
producers and provide them with technology and innovations they would be more stable, productive and be self-
sustaining in the long run. This was another major part of his work titled: "Investment in Human Capital". He concluded
that it is better to develop the human capital of any nation than to give the poor food and little “aid” for food (Sigh,
2018).
Schultz summarized that foreign assistance was actually destroying the local economies in Europe, because as aid were
distributed for free, economies of local nations were distorted and smothered as they could not compete with price
(Audu, 2012).
IV. EMPIRICAL REVIEW
Barro (1989) found that government expenditure in education, health, and other services could contribute indirectly
towards raising the marginal productivity of private sectors via their contribution on human capital accumulation.
Chen and Gupta (2006) examine the government expenditure in health and education and other structural factors that
may have an effect on economic growth. They apply the GMM estimation technique which is the set explanatory
variables included in the growth regression specification are based on the endogenous growth theory and can all be
considered to be important determinants of economic growth. The results show that the coefficient on government
expenditure in health and education is negative but is small in absolute value. Many other studies on the relationship
between fiscal policy and growth were conducted before the relevant endogenous growth models were developed, i.e.
from the early 1980s.
Ebiringa and Charles-Anyaogu (2012) studied impact of government sectorial expenditure on the economic growth of
Nigeria. The research revealed that expenditure on telecommunication, Defence and security, Education and Health
Sector have significant positive effect on economic growth in Nigeria. Transportation and agricultural expenditures had
negatively significant effecton the economic growth of Nigeria. They concluded that the level of government
expenditures for transportation and agricultural development are inadequate to build the expected capacity in the
sectors that will positively enhance economic growth in the country.
Agu, (2014) studied fiscal policy and economic growth in Nigeria: emphasison various components of public
expenditure. The research findings revealed that total government expenditures tends towards increasing government
revenue, with expenditures increasing faster than revenue. Investment expenditures were seen to be lower than
recurrent expenditures indicating poor growth of the economy. The result showed a positive correlation between
government expenditure on economic services and economic growth for the period under review. An increase in
budgetary allocation to economic serviceswill result to an increase in economic stability of the country. So, in
government spending, it is essential to know that the effectiveness of the private sector solely depends on the stability
and predictability of the public incentive, which promotes and or crowds in/out private investment.
Benos (2009) examined the effect of expenditure on education on economic growth in Nigeria using thirty-one (31)
years’ time series data from 1977 to 2007. The study usedCointegration and error correction approached. The result
revealed positive significant effect of educational expenditure on economic growth of Nigeria.
Obi (2007) in his study titled: “Fiscal policy and poverty alleviation: Some policy options for Nigeria” using static real-
side computable general equilibrium model on Uganda concluded that a relationship exist between fiscal policy and
poverty alleviation. The study observed that targeting of government expenditure seems to be the most potent tool for
effective poverty reduction. But, tariff adjustment tends to aggravate income disparity/ poverty amongst households.

www.theijbmt.com 67 | Page
Fiscal Policy and Economic Development in Sub Saharan Africa; Emphasis on Poverty in Ghana and Nigeria
Havi, &Enu, (2014) in their stud on the Effect of Fiscal Policy and monetary Policy on Ghana’s Economic Growth to
determine which policy is more potent, covering the period1980-2012, reveals that fiscal and, monetary policy affects
economic growth positively. Their study recommends that Bank of Ghana should use fiscal and monetary policy in
promoting favorable investment atmosphere that will stabilize interest rates, lending rates, inflationary rates, and
exchange rates so as to promote and ensure economic growth, economic stability, economic sustainability and
economic development of Ghana.
Enyim (2013) studied on government spending and poverty reduction in Nigerian’s economic growth (1980-2009) using
Ordinary Least Square method. The regression result shows that public spending has significant impact on Poverty
reduction in Nigeria.
Farayibi&Owuru(2016) investigated the linkage between fiscal policy and poverty reduction in Nigeria using
descriptive statistics. Theirfindings revealed that government capital and recurrent expenditures have not significantly
reduced the level of poverty in Nigeria. This they revealed happened as a result of a weak linkage, which has not
allowed fiscal policy to show its true opportunity cost. The study concludes that the level of government capital
expenditures in Nigeria have weak significant effect on the level of poverty in the country foe the period under review.
RESEARCH GAP:
It is evident that there is no agreement between the researchers on whether a relationship exists between fiscal policy
and economic development. And where a relationship was found to exist, researchers failed to ascertain the direction of
the relationship.
Most of the researchers in measuring the effect of fiscal policy did not include deficit financing in his model of fiscal
policy, which is an important instrument for fiscal policy. This research includes the following fiscal policy tools: Tax
Revenue, Oil Revenue, Capital Expenditure, Recurrent Expenditure and Deficit Financing in order to close the gap.
The conclusion is therefore trite that existing state of research shows some conceptual and statistical weaknesses
providing further impetus for this study. It is very necessary to take cognizance of the above pitfalls in the present
study. This is with the intention of making the right policy recommendations and taking the right policy decisions.
V. Methodology:
This research made use of data which were collected from secondary sources as Secondary data constitutes the main
data needed for this research. The needed data were collected from the (CBN) Central Bank of Nigeria Statistical
Bulletin, National Bureau of Statistics (NBS), Bank of Ghana Statistical Bulletin, Ghana Statistical Services, International
Monetary (IMF) Fund financial statistics Year Book and World Bank’s African Database (CD – ROM).
The data collected were analyzed using the following mechanisms:
i. Philips-Perron Unit Root Test: This is conducted to determine if the variables are stationary at level, first
difference or at second difference to avoid spurious regression results.
ii. Johansen CointegrationTest: This was conducted to determine if there are cointegrating equations, the
number of cointegrating equations, in the model to suggest the existence of a short run or long run
relationship in the model.
iii. Vector Error Correction Model (VECM): This confirms the existenceof a long run relationship in the model
and to estimate the coefficients that explains the effect of the explanatory variables in the model.
This study builds regression models and makes use of econometric procedure in estimating the relationship existing
between fiscal policy and Poverty reduction in Sub Sahara Africa. Equation (i) below is for Nigeria while equation (ii) is
for Ghana. Therefore, the the models are specified as follows:
POVINn =B0+ B1OREVnt+B2TAXREVnt+ B3CEXPnt +B4REXPnt + B5DEFnt + Ut……..(i)
POVINg = B0+ B1OREVgt+B2TAXREVgt+B3CEXPgt+B4REXPgt + B5DEFgt + Ut……..(ii)
Where:
POVIN= PovertyRate
OREV= Oil Revenue
TAXREV= Tax Revenue,
CEXP= Capital Expenditure,
REXP= Recurrent Expenditure,
www.theijbmt.com 68 | Page
Fiscal Policy and Economic Development in Sub Saharan Africa; Emphasis on Poverty in Ghana and Nigeria
DEF= Deficit Financing
g= Ghana
n= Nigeria
Β0= constant
β1-B5= parameters to be estimated from the regression equation
μ1= random error term.
Unit Root Result:
VI. PRESENTATION OF RESULTS:
PHILIPS-PERRON UNIT ROOT RESULTS:
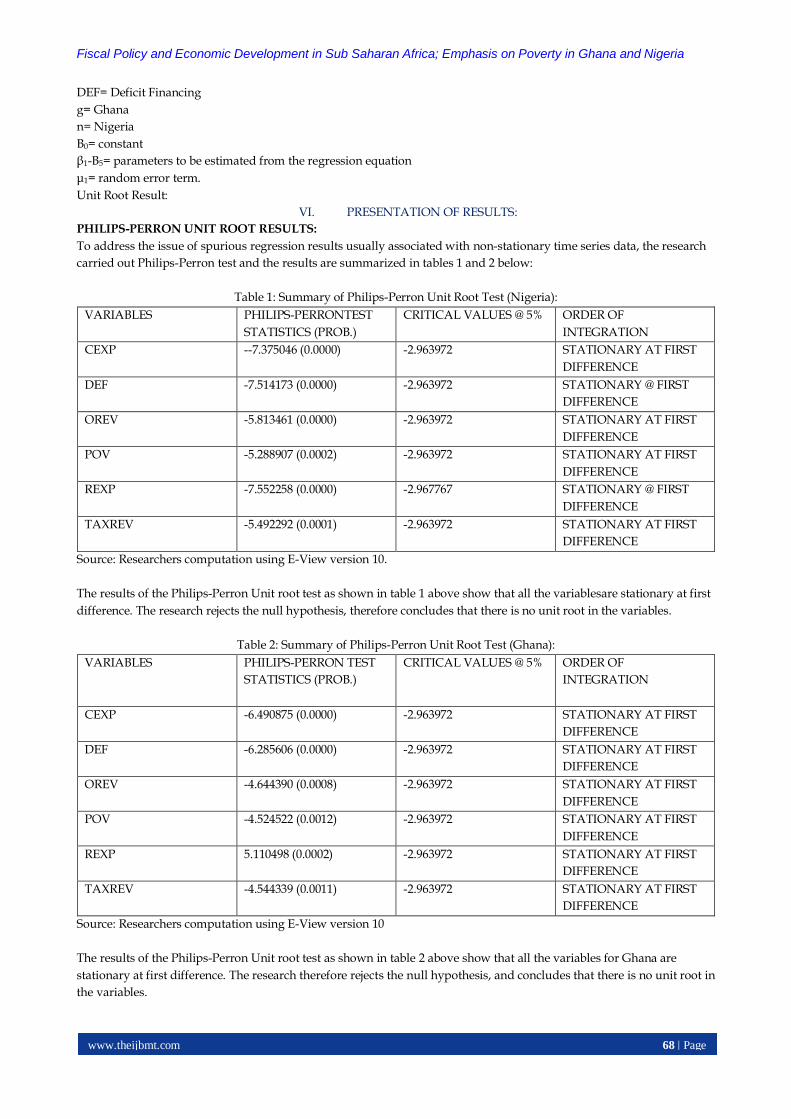
To address the issue of spurious regression results usually associated with non-stationary time series data, the research
carried out Philips-Perron test and the results are summarized in tables 1 and 2 below:
Table 1: Summary of Philips-Perron Unit Root Test (Nigeria):
VARIABLES PHILIPS-PERRONTEST
STATISTICS (PROB.)
CRITICAL VALUES @ 5% ORDER OF
INTEGRATION
CEXP --7.375046 (0.0000) -2.963972 STATIONARY AT FIRST
DIFFERENCE
DEF -7.514173 (0.0000) -2.963972 STATIONARY @ FIRST
DIFFERENCE
OREV -5.813461 (0.0000) -2.963972 STATIONARY AT FIRST
DIFFERENCE
POV -5.288907 (0.0002) -2.963972 STATIONARY AT FIRST
DIFFERENCE
REXP -7.552258 (0.0000) -2.967767 STATIONARY @ FIRST
DIFFERENCE
TAXREV -5.492292 (0.0001) -2.963972 STATIONARY AT FIRST
DIFFERENCE
Source: Researchers computation using E-View version 10.
The results of the Philips-Perron Unit root test as shown in table 1 above show that all the variablesare stationary at first
difference. The research rejects the null hypothesis, therefore concludes that there is no unit root in the variables.
Table 2: Summary of Philips-Perron Unit Root Test (Ghana):
VARIABLES PHILIPS-PERRON TEST
STATISTICS (PROB.)
CRITICAL VALUES @ 5% ORDER OF
INTEGRATION
CEXP -6.490875 (0.0000) -2.963972 STATIONARY AT FIRST
DIFFERENCE
DEF -6.285606 (0.0000) -2.963972 STATIONARY AT FIRST
DIFFERENCE
OREV -4.644390 (0.0008) -2.963972 STATIONARY AT FIRST
DIFFERENCE
POV -4.524522 (0.0012) -2.963972 STATIONARY AT FIRST
DIFFERENCE
REXP 5.110498 (0.0002) -2.963972 STATIONARY AT FIRST
DIFFERENCE
TAXREV -4.544339 (0.0011) -2.963972 STATIONARY AT FIRST
DIFFERENCE
Source: Researchers computation using E-View version 10
The results of the Philips-Perron Unit root test as shown in table 2 above show that all the variables for Ghana are
stationary at first difference. The research therefore rejects the null hypothesis, and concludes that there is no unit root in
the variables.
www.theijbmt.com 69 | Page
Fiscal Policy and Economic Development in Sub Saharan Africa; Emphasis on Poverty in Ghana and Nigeria
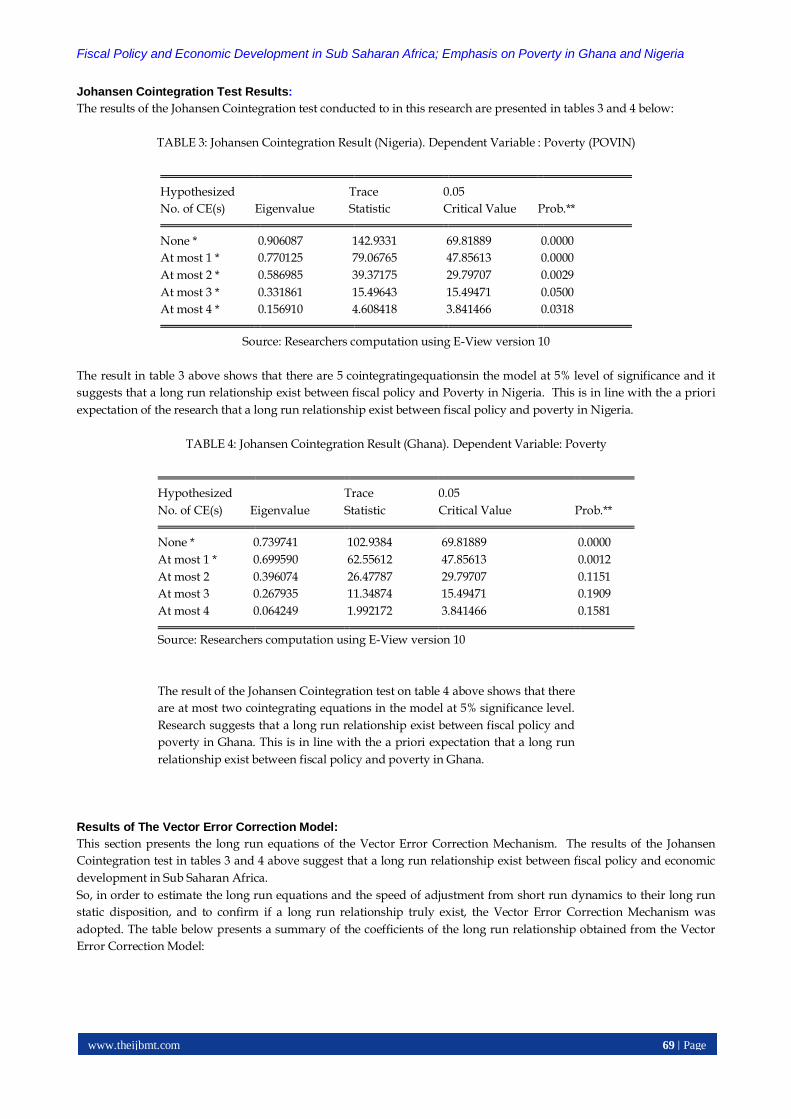
Johansen Cointegration Test Results:
The results of the Johansen Cointegration test conducted to in this research are presented in tables 3 and 4 below:
TABLE 3: Johansen Cointegration Result (Nigeria). Dependent Variable : Poverty (POVIN)
Hypothesized Trace 0.05
No. of CE(s) Eigenvalue Statistic Critical Value Prob.**
None * 0.906087 142.9331 69.81889 0.0000
At most 1 * 0.770125 79.06765 47.85613 0.0000
At most 2 * 0.586985 39.37175 29.79707 0.0029
At most 3 * 0.331861 15.49643 15.49471 0.0500
At most 4 * 0.156910 4.608418 3.841466 0.0318
Source: Researchers computation using E-View version 10
The result in table 3 above shows that there are 5 cointegratingequationsin the model at 5% level of significance and it
suggests that a long run relationship exist between fiscal policy and Poverty in Nigeria. This is in line with the a priori
expectation of the research that a long run relationship exist between fiscal policy and poverty in Nigeria.
TABLE 4: Johansen Cointegration Result (Ghana). Dependent Variable: Poverty
Hypothesized Trace 0.05
No. of CE(s) Eigenvalue Statistic Critical Value Prob.**
None * 0.739741 102.9384 69.81889 0.0000
At most 1 * 0.699590 62.55612 47.85613 0.0012
At most 2 0.396074 26.47787 29.79707 0.1151
At most 3 0.267935 11.34874 15.49471 0.1909
At most 4 0.064249 1.992172 3.841466 0.1581
Source: Researchers computation using E-View version 10
The result of the Johansen Cointegration test on table 4 above shows that there
are at most two cointegrating equations in the model at 5% significance level.
Research suggests that a long run relationship exist between fiscal policy and
poverty in Ghana. This is in line with the a priori expectation that a long run
relationship exist between fiscal policy and poverty in Ghana.
Results of The Vector Error Correction Model:
This section presents the long run equations of the Vector Error Correction Mechanism. The results of the Johansen
Cointegration test in tables 3 and 4 above suggest that a long run relationship exist between fiscal policy and economic
development in Sub Saharan Africa.
So, in order to estimate the long run equations and the speed of adjustment from short run dynamics to their long run
static disposition, and to confirm if a long run relationship truly exist, the Vector Error Correction Mechanism was
adopted. The table below presents a summary of the coefficients of the long run relationship obtained from the Vector
Error Correction Model:

www.theijbmt.com 70 | Page
Fiscal Policy and Economic Development in Sub Saharan Africa; Emphasis on Poverty in Ghana and Nigeria
Table 5: Summary of Vector Error Correction Model Results
POVERTY
NIG. GHANA
VARIABLES COEF.
(T.STAT)
COEF.
(T.STAT)
SPEED OF
ADJ.
+0.1796
(short
run)
Without
lag
-0.0886
(long run)
POVINt-1
-0.0886
(-0.723)
TAXREVt-1 -0.0105
(-2.802)
0.2147
(4.859)
OREVt-1 -0.00090
(0.4532)
-1.2932
(-0.0439)
CEXPt-1 0.01168
(1.12243)
0.28755
(1.4506)
REXPt-1 0.00826
(1.8277)
0.83323
(5.2547)
DEFt-1 0.00944
(1.342)
2.1918
(0.0624)
F-Stat
(Prob.)
2.1857
(0.0879)
1.4773
(0.2243)
Source: Researchers computation using E-View version 10
Fiscal Policy and Poverty Reduction In Nigeria:
The speed of adjustment of the Vector error correction mechanism has a positive coefficient. So, the short run equation is
estimated. The regression equation and the short model that explains the short run relationship between fiscal policy
and poverty reduction in Nigeria is shown in equation 4.01 below:
POVNnt= 49.682- 0.01046TAXREVnt-0.000901OREVnt+0.0117CEXPnt+0.0083REXPnt+0.00944DEFnt……….(iii)
From the equation above, a unit change in Tax revenue in the short run is associated with a 1.01% reduction in poverty
on average ceteris paribus in the short run. This is statistically significant at 5% level of significance. On the other hand,
a unit change in Oil Revenue is associated with a 0.0009 unit change in poverty on average ceteris paribus in the short
run, but not statistically significant at 5% level of significance. A unit change in Capital Expenditure in Nigeria is
associated with a 1.2% change in poverty on average ceteris paribus in the short run, but not statistically significant at
5% level of significance. A unit change in Recurrent Expenditure is associated with a 0.8% change in poverty on average
ceteris paribus in the short run, but not statistically significant at 5% level of significance. While a unit change in Deficit
Financing is associated with a 0.9% change in poverty, but not statistically significant at 5% significance level.
Fiscal Policy and Poverty Reduction In Ghana
The error correction model that explains the long run relationship between fiscal policy and poverty reduction in Ghana
is expressed in the equation below:
∆POVgt=-0.886POVgt-10.2147TAXREVgt-1-1.2932OREVgt-1+0.2876CEXPgt-1+0.8332REXPgt-1+ 2.1918DEFgt-
1+28.732……………………….(iv)
From equation (iv) above, a unit change in Tax Revenue is associated with a 0.214 unit change in poverty level on
average ceteris paribus in the long run in Ghana. A unit change in Oil Revenue is associated with a 1.293 unit change in
Poverty on average ceteris paribus in Ghana in the long run. In the long run, a unit change in Capital Expenditure in
www.theijbmt.com 71 | Page
Fiscal Policy and Economic Development in Sub Saharan Africa; Emphasis on Poverty in Ghana and Nigeria
Ghana is associated with a 0.288 unit change in Poverty on average ceteris paribus. Also, a unit change in Recurrent
Expenditure in Ghana is associated with a 0.833unit change in the level of Poverty in Ghana on average ceteris paribus
in the long run. While a unit change in Deficit Financing in Ghana is associated with a 2.192 unit variation in Poverty in
the long run on average ceteris paribus. The previous period’s deviation from long run equilibrium is corrected in the
current period at an adjustment speed of 9 percent in the short run.
Test of Hypotheses:
To aid the understanding of this research work, the research hypotheses of this research were tested. All hypotheses
were tested at 5% level of significance.
H0:Fiscal policy has no significant effect on poverty reduction in Sub Saharan Africa.
FOR NIGERIA:
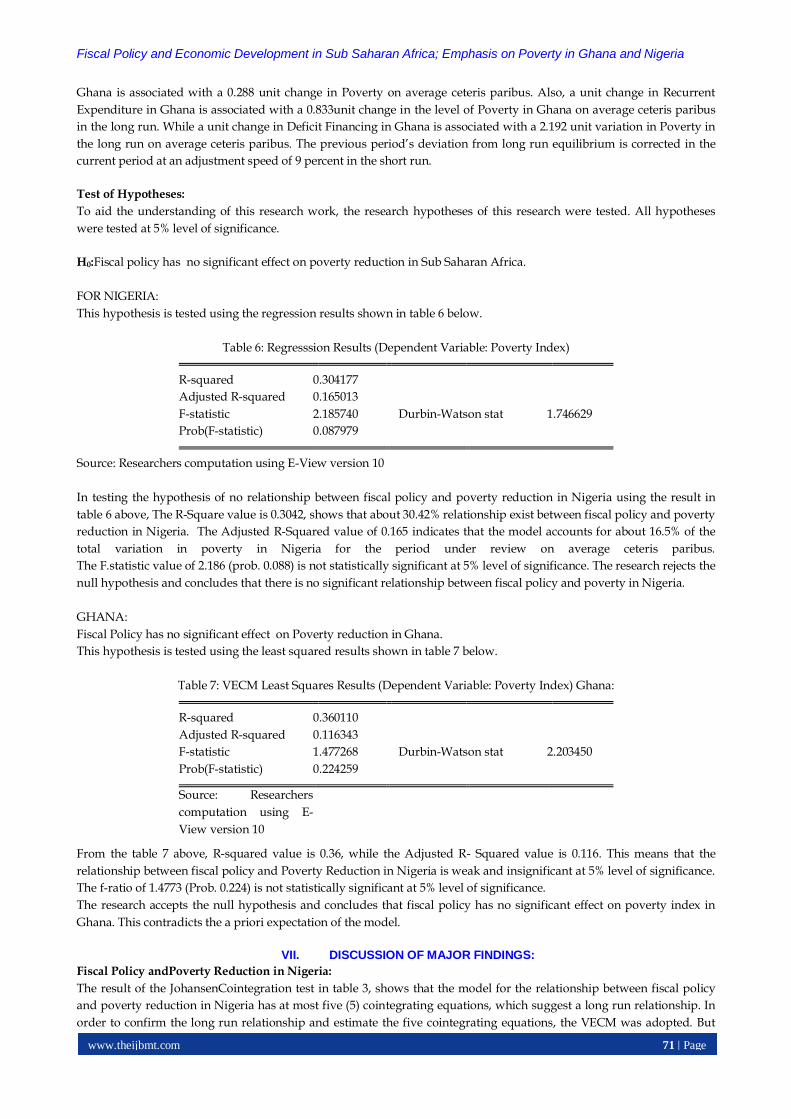
This hypothesis is tested using the regression results shown in table 6 below.
Table 6: Regresssion Results (Dependent Variable: Poverty Index)
R-squared 0.304177
Adjusted R-squared 0.165013
F-statistic 2.185740 Durbin-Watson stat 1.746629
Prob(F-statistic) 0.087979
Source: Researchers computation using E-View version 10
In testing the hypothesis of no relationship between fiscal policy and poverty reduction in Nigeria using the result in
table 6 above, The R-Square value is 0.3042, shows that about 30.42% relationship exist between fiscal policy and poverty
reduction in Nigeria. The Adjusted R-Squared value of 0.165 indicates that the model accounts for about 16.5% of the
total variation in poverty in Nigeria for the period under review on average ceteris paribus.
The F.statistic value of 2.186 (prob. 0.088) is not statistically significant at 5% level of significance. The research rejects the
null hypothesis and concludes that there is no significant relationship between fiscal policy and poverty in Nigeria.
GHANA:
Fiscal Policy has no significant effect on Poverty reduction in Ghana.
This hypothesis is tested using the least squared results shown in table 7 below.
Table 7: VECM Least Squares Results (Dependent Variable: Poverty Index) Ghana:
R-squared 0.360110
Adjusted R-squared 0.116343
F-statistic 1.477268 Durbin-Watson stat 2.203450
Prob(F-statistic) 0.224259
Source: Researchers
computation using E-
View version 10
From the table 7 above, R-squared value is 0.36, while the Adjusted R- Squared value is 0.116. This means that the
relationship between fiscal policy and Poverty Reduction in Nigeria is weak and insignificant at 5% level of significance.
The f-ratio of 1.4773 (Prob. 0.224) is not statistically significant at 5% level of significance.
The research accepts the null hypothesis and concludes that fiscal policy has no significant effect on poverty index in
Ghana. This contradicts the a priori expectation of the model.
VII. DISCUSSION OF MAJOR FINDINGS:
Fiscal Policy andPoverty Reduction in Nigeria:
The result of the JohansenCointegration test in table 3, shows that the model for the relationship between fiscal policy
and poverty reduction in Nigeria has at most five (5) cointegrating equations, which suggest a long run relationship. In
order to confirm the long run relationship and estimate the five cointegrating equations, the VECM was adopted. But

www.theijbmt.com 72 | Page
Fiscal Policy and Economic Development in Sub Saharan Africa; Emphasis on Poverty in Ghana and Nigeria
the result of the VECM confirmed that the relationship between fiscal policy and poverty reduction in Nigeria only exist
in the short run. So, the relationship was estimated in the short run. The short run least squares result shows F-Statistic
value of 2.186 (Prob.0.08798), which is not statistically significant at 5% level of significance. Therefore, the relationship
between fiscal policy and poverty reduction in Nigeria only exist in the short run, but not statistically significant at 5%
level of significance. This means that government fiscal policy measures aimed at reducing poverty in Nigeria are not
sustained in the long run, this is why poverty continues to increase in Nigeria with many Nigerians joining the penury
level per day. It is obvious the fiscal policy programs of the government of Nigeria only benefit the political class.
The t-statistic values of the individual explanatory variables show that only Tax Revenue is statistically significant at 5%
level of significance in the short run. While, Recurrent Expenditure is statistically significant in explaining the variation
in poverty in Nigeria at 10% level of significance in the short run. Other explanatory variables (Oil Revenue, Capital
Expenditure, and Deficit Financing) are not statistically significant in explaining the short run variation in Poverty in
Nigeria.
The coefficient Tax Revenue is -0.01046 and t-statistic value -2.80215 (prob. 0.009) is statistically significant at 5% level of
significance in the short run. A unit change in Tax Revenue reduces poverty by a significant 0.01046 unit in the short
run. This is in line with the a priori expectation of the model and in line with existing literature. It is also in line with the
research of Ojijo and Oluwatosin (2018) which revealed that tax has a significant effect on the economy of Nigeria in the
short run. This result also conforms to the research of Amos, et al. (2017) which reveals that taxes have significant effect
on the Nigerian economy. Progressive tax system in place in Nigeria has helped in reducing the gap between the rich
and the poor in the short run. This has stimulated consumer spending by middle and lower income earners while the
wealthy who can afford to pay a fair share of public service cost, enjoy this tax system that is skewed to their favor. So,
higher tax on luxury goods should be encouraged.
Fiscal Policy and Poverty Reduction In Ghana:
In table 4 above, the result of the Johansen Cointegration test shows that the model has at most two (2) cointegrating
equations, which suggests a long run relationship. To confirm the long run relationship existing between fiscal policy
and poverty reduction in Ghana, the Vector Error Correction Mechanism was adopted. The speed of adjustment in the
VECM shows -0.088599, which confirms the existence of a long run relationship between fiscal policy and poverty
reduction in Ghana.But, the F-Statistics value of 1.0477 with probability of 0.2243 is not statistically significant at 5%
level of significance. This means that the long run relationship existing between fiscal policy and poverty reduction in
Ghana is not statistically significant at 5% level of significance. The Squared result of 0.36011 indicates a weak
relationship in the long run. And the Adjusted R-Squared indicates that the model accounts for only 11.6% of the total
variation in the model on average ceteris paribus in the long run. This means that government fiscal policy in Ghana
have impacted significantly on Poverty reduction in Ghana in the long run. This has contributed to the growing level of
poverty in sub Saharan Africa. The t-stat values and probabilities of the individual explanatory variables show that
Government Deficit is statistically significant at 5% level of significance while other explanatory variables (Tax Revenue,
Oil Revenue, Capital Expenditure and Recurrent Expenditure) have t.stat. (Prob.) greater than 0.05, so are not
statistically significant at 5% level of significance. This occurs when government borrow to finance agricultural inputs
like fertilizer, provide improved seedlings that ensures greater harvest. These have direct effect on low income earners
who are mostly poor. Raising farm income is known as the core of antipoverty as majority of the poor depend on farm
produce. Growth in agricultural productivity of peasant farmers is more effective in benefiting the poorest majority of a
country’s population than growth from other nonagricultural sectors. When government borrowed funds are used to
enhance productivity, it generates employment and reduces poverty in the country. Making available employment
opportunities is more important than increasing income and access to basic needs.The result of this research is in line
with the result of Okon and Onoja, (2017). Again the crowding out effect of deficit financing on government spending is
another channel through which it affects poverty. Debt can also affect poverty by reducing the economic growth
through the investment channel by reducing government expenditures and increasing uncertainties. The servicing of
debts is another channel as it diverts budgetary resources from investment which is needed to stimulate economic
growth in a country.
In explaining the result of the effect of fiscal policy (Tax Revenue, Oil Revenue, Capital Expenditure, Recurrent
Expenditure, deficit financing) on Poverty reduction in the sub Saharan African, the result of the analysis shows that the
relationship between fiscal policy and poverty reduction in Nigeria is a short run relationship and it is not statistically
significant at 5% level of significance with f.stat.(2.186) and prob.(0.08798). Tax Revenue has a negative coefficient of -
0.01046, t. stat of -2.802 and prob. (0.0097). This means that a unit change in tax revenue reduces poverty by a 0.0105 on
average ceteris paribus in the short run. The other individual explanatory variables (Oil Revenue, Capital Expenditure,

www.theijbmt.com 73 | Page
Fiscal Policy and Economic Development in Sub Saharan Africa; Emphasis on Poverty in Ghana and Nigeria
Recurrent Expenditure and Deficit Financing) are not statistically significant at 5% level of significance in explaining the
variation in the model. This accounts for the increase in the number of people living below the poverty line in Nigeria
and its continuous increase. But, government fiscal policy is expected to impact on poverty by reducing the number of
people living below the poverty line. In the Nigeria of today, the billions of naira spent on programs targeted at
reducing poverty only benefit the political elites at the corridors of power. The rich continue to grow rich while the poor
wallow in penury. There is no justifiable increase in income of the individuals in the country, but government
expenditure and revenue continue to increase. The money ends up in privates pockets while poverty continues to
increase. In the case of Ghana, the long run relationship between fiscal policy and poverty reduction is not statistically
significant at 5% level of significance. This is confirmed by the f.stat. value of 1.47727 (prob.0.2243) which is not
statistically significant at 5% level of significance in the long run. Deficit Financing has a negative coefficient of -0.00155,
t.stat-2.4006 (prob.0.056) which is statistically significant at 5% level of significance in the long run. If government
increases borrowing by a unit, poverty reduces by a 0.00155 unit in the long run. This occurs when government borrow
to finance projects that benefit the poor. As government finances projects that benefit the poor through borrowing,
poverty tend to reduce. In summary, fiscal policy has no significant long run effect on poverty reduction in Sub Saharan
Africa.
VIII. CONCLUSION AND RECOMMENDATIONS
The result of the analysis revealed that fiscal policy has no significant long run effect on poverty reduction in Sub
Saharan Africa. This means that government revenue, expenditure and borrowing have not significantly impacted on
reducing poverty in Sun Saharan Africa. Little wonder poverty has continued to increase in Sub Saharan Africa, with
Nigeria as the world poverty capital. And poverty is the mother of all crimes. It begets insurgency, corruption, rape,
smuggling, drug abuse etc. There is urgent need to tackle this menace of poverty by settle out programs that have direct
effect on the people. An increase recurrent expenditure through income (salaries and wages) would benefit the poor the
more. Increased funding to the Agricultural sector would help in reducing the poverty rate, as majority of the poor
people in Sub Sahara Africa are predominantly farmers. As recurrent expenditure has a positive significant effect on
poverty at 10% level of significance in the short run. There is need for a restructured revenue base in Nigeria and Ghana
to finance fiscal policy expansion rather than embarking on borrowing which increases the burden on the poor.
Government should as well distribute its social welfare program in a way that it would directly benefit the poor. There
is also a desire for a sound macroeconomic policy that is robust enough to handle the issue of poverty which will
promote productivity that would benefit the poor in Nigeria and Ghana. There should be a law that pronounce death
sentence on corrupt politicians in Nigeria, who embezzle the funds meant to provide facilities that better the lives of the
poor.
REFERENCES
[1.] Aghion, P. &Howit, P. (1998).Endogenous Growth Theory, London, England: The MIT Press, Cambridge,
Massachusetts.
[2.] Aghion, P. and Howit, P. (2009), The Economics of Growth, London, England: The MIT Press, Cambridge,
Massachusetts.
[3.] Agu, S. (2014).Fiscal Policy and Economic Growth in Nigeria: Emphasison Various Components of Public
Expenditure,Singaporean Journal Of Business Economics, and Management Studies VOl.2, NO.12, 2014
[4.] Amos, O. A., Uniamikogho, E. &Aigienohuwa, O. O. (2017).Tax Revenue and Economic Growth in
Nigeria.Scholars Journal of Economics, Business and Management, Vol.:4 (10) 2017.
[5.] Anyafo, A. M. O. (1996).Public Finance in a Developing economy; The Nigerian case,Department of Banking and
Finance, University of Nigeria Enugu Campus, Indiana University Press Enugu Nigeria.
[6.] Anyanwu, J. C. (1997).Nigerian Public Finance.Onisha: Joanee Educational Publishers Ltd.
[7.] Appah, E. (2010).The Relationship Between Fiscal Policy andEconomic Growth in Nigeria (1991 - 2005).
International Journal of Economic Development Research and Investment, Vol. 1 Nos. 2& 3 2010
[8.] Barro, R. (1990).Government Spending in a Simple Model of Endogenous Growth, Journal of political economy, No.
98(5), Part 2, S103-26.

www.theijbmt.com 74 | Page
Fiscal Policy and Economic Development in Sub Saharan Africa; Emphasis on Poverty in Ghana and Nigeria
[9.] Barro, R.J &Sala-i-Martin, X. (1992).Public finance in models of economic growth, Review of Economic Studies,Vol.6.
(1) 59:645-661.
[10.] Barro, R. J. (1996). Democracy and Growth, Boston: Journal of Economic growth, 1, pp 1-27.
[11.] Barro, R. J. (1991).Economic Growth and a Cross Section of Countries.Quarterly Journal of Economics 106 (2), pp.
407-441.
[12.] Barro, J. (1978). The Impact of Social Security on Private Saving: Evidence from the U.S. Time Series, Washington
DC: American Enterprise Institute.
[13.] Barro, R.J. (2000).Economic Growth in a Cross Section of Countries, NBER Working paper.
[14.] Benos, N. (2009).Fiscal Policy and Economic Growth: Empirical Evidence from EU Countries.Journal of Finance
and Econonics, 5 (12)
[15.] CBN, (2016), Central Bank of Nigeria, Statistical Bulletin CBN Abuja 2016.
[16.] CBN, (2016), Central Bank of Nigeria, Annual Report, CBN 2016
[17.] Chen, P. & Gupta, R. (2006).An Investigation Of Openness And Economic Growth Using Panel Estimation, University
of Pretoria, Working Paper, 22.
[18.] Ebiringa, O. T.& Charles-Anyaogu, N. B. (2012).Impact of Government Sectorial Expenditure On The Economic
Growth Of Nigeria, International Journal of economic Research, v36, (2) – 92 (2012) ISSN: 2229-6158
[19.] Enyim, O. B (2013).Government Spending and Poverty Reduction in Nigerian’s Economic Growth.International
Journal of Social Sciences and Humanities Reviews Vol.4 No.1,May., 2013; p.103 – 115
[20.] Farayibi, A. &Owuru,J. (2016). Linkage between Fiscal Policy and Poverty Reduction in Nigeria.Munich Personal RePEc
Archive, & Centre for Allied Research & Economic Development,Vol.6 (2) Ibadan
[21.] Fofack, H. (2010).Fiscal Adjustment and Growth in Sub-Saharan Africa Overview and Lessons from the Current
Downturn, The World Bank World Bank Institute Poverty Reduction and Economic Management Division May
2010
[22.] Glomm, G. &Ravikumar, B. (1994).Public Investment in Infrastructure in a Simple GrowthModel,Journal of
Economic Dynamics and Control, 18, 1173-1188.
[23.] Hassan, M.K., Waheeduzzaman, M. &Rahman, A.(2003). Defense Expenditure and EconomicGrowth in the
SAARC Countries,The Journal of Social, Political, and Economic Studies,28(3), 275-293.
[24.] Havi, E. D. K.&Enu, P. (2014).Growth: The Effect of Fiscal Policy and monetary Policy on Ghana’s Economic
Growth: Which Policy Is More Potent?, International Journal of Empirical Finance, Research Academy of Social Sciences
Vol. 3, No. 2, 2014.
[25.] Levine, R. &Renelt, D. (2016).A Sensitivity Analysis of Cross-country Growth Regressions,American Economic
Review, Vol. 82, pp. 942-63.
[26.] Liu, Z. &Stengos, T. (1999).Non-Linearity in Cross-Country Regressions: A SemiparametricApproach. Journal of
Applied Econometrics, 14, 527-538.
[27.] Magazzino, C. (2010). Wagner’s Law and Augmented Wagner’s Law in EU-27. A Time-Series Analysis on
Stationarity,Cointegration and Causality”, MunichPersonalRePEc Archive (MPRA) Paper No. 26668.
www.theijbmt.com 75 | Page
Fiscal Policy and Economic Development in Sub Saharan Africa; Emphasis on Poverty in Ghana and Nigeria
[28.] Mankiw, N. G. (2003). Macroeconomics.(5th ed.). New York: Worth. A textbook presentation aimed at
undergraduates.
[29.] Mauro, P. (1995). Corruption and Growth, Quarterly Journal of Economics 110 (3), 681-712.
[30.] Medee, P. N and Nenbee, S. G.(2011).Econometric Analysis Of The Impact Of Fiscal Policy Variables On Nigeria's
Economic Growth (1970 - 2009), International Journal of Economic Development Research and Investment, Vol. 2 No. 1;
April 2011172
[31.] Obi, B. O. (2007).Fiscal policy and poverty alleviation: Some policy options for Nigeria, African Economic Research
Consortium, Nairobi,February 2007
[32.] Omoniyi, B. B. (2018). An examination of the causes of poverty on economic growth in Nigeria.Africa’s Public
Service Delivery and Performance Review-Africa’s Development Watch, Vol. 6 No. 1 Jan. 2018
[33.] O’Nwachukwu, I. C. (2017). Determinants of the Rate of Unemployment in Nigeria, International Journal of
Information Research and Review http://www.ijirr.com Vol. 04, Issue, 01, pp.3593-3595, January, 2017
[34.] Ogiogio, G. O. (1996).Planning Horizon, Government Expenditure and Economic Growth in Nigeria, In Economic
Reform and Macroeconomic Management in Nigeria, Arijo (ed.) Ibadan: University Press, Ibadan.
[35.] Ojijo, O. &Oluwatosin, O. (2018). Tax and Economic Growth in a Resource-Rich Country: The case of Nigeria.
Intech Open Journal, Vol.:8 (12) 2018.
[36.] Okafor, U. O. (2012).Analysis of the impact of Fiscal Policy Measures on Capital Formation in Nigeria,Nigerian
Journal of Management and Administration, 5(7): 34-56.
[37.] Okon, E.O.,Onoja, I.M. (2017). Empirical and evidence Based Investigation: External Debt, Poverty and Economic
Growth Nexus. International Journal of Applied Economics, Finance and Accounting, Vol. 1.(1)pp 37-47 2017
[38.] Rasheed, O. A. (2010).Productivity in the Nigerian Manufacturing Sub-Sector, EuropeanJournal of Economics,
Finance and Administrative Sciences, 6(8): 1450-2275.
[39.] Singh, R., (2018). Impact of GDP and Inflation on Unemployment Rate: A Study of Indian Economy in 2011-
2018.International Journal of Management, IT & Engineering Vol. 8 Issue 3, March 2018, ISSN: 2249-0558 Impact
Factor: 7.119 Journal Homepage: http://www.ijmra.us,
[40.] Solow, R.M. (1956). Investment and technical progress,In: Arrow, K.J., Karlin. S. and Suppes, P. (Eds.) Mathematical
Methods in the Social Sciences,
[41.] Tanzi, V., Zee, H. H. (1997).Fiscal Policy and Long-Run Growth,International Monetary Fund StaffPapers, 44, 2,
June, 1997, p. 179-209.
[42.] Tanzi, V., Zee, H. (1996).Fiscal policy and long-run growth, IMF Working Paper No. 96/119.
[43.] World Bank, (2018). World Development indicators

www.theijbmt.com 76 | Page
Fiscal Policy and Economic Development in Sub Saharan Africa; Emphasis on Poverty in Ghana and Nigeria
APPENDIX:
The table of Tax Revenue (TAXREVn), Oil Revenue (OREVn), Capital Expenditure (CEXPn), Recurrent Expenditure
(REXPn), Deficit Financing (DEFn) and Poverty Index (POVnfor Nigeria:
YEAR TAXREVn OREVn CEXPn REXPn DEFn POVINn
1986 4.49 8.11 8.53 7.7 -8.25 43.4
1987 6.35 19.03 6.37 15.65 -5.89 44.4
1988 7.77 19.83 8.34 19.41 -12.16 42.3
1989 14.74 39.13 15.03 25.99 -15.13 44.6
1990 26.22 71.89 24.05 36.22 -22.12 46.9
1991 18.33 82.67 28.34 38.24 -35.76 44.7
1992 26.38 164.08 39.76 53.03 -39.53 57.1
1993 30.67 162.1 54.5 136.73 -65.16 56.6
1994 41.72 160.19 70.92 89.97 -70.27 54.3
1995 135.44 324.55 121.14 127.63 0 65.6
1996 114.81 408.78 212.93 124.24 0 63.5
1997 166 416.81 269.65 158.56 -5 55.5
1998 139.3 324.31 309.02 178.1 -133.39 53.1
1999 224.77 724.42 498.03 449.66 -285.1 50.6
2000 314.48 1591.68 239.45 461.6 -103.78 40.6
2001 903.46 1707.56 438.7 579.3 -221.05 34.6
2002 500.99 1230.85 321.38 696.8 -301.4 50.6
2003 500.82 2074.28 241.69 984.3 -202.72 53.5
2004 565.7 3354.8 351.3 1032.7 -172.6 54.4
2005 785.1 4762.4 519.5 1223.7 -161.4 53.4
2006 677.54 5287.57 552.39 1290.2 -101.4 53.5
2007 1264.6 4462.91 759.32 1589.27 -117.24 53.6
2008 1336 6530.6 960.89 2117.36 -47.38 54.1
2009 1652.65 3191.94 1152.8 2127.97 -810,01 53.5
2010 1907.58 5396.09 883.87 3109.38 -1105.4 54.2
2011 2237.88 8878.97 918.55 3314.51 -1158.52 44.6
2012 2628.78 8025.97 874.83 3325.16 -975.78 43.5
2013 2950.56 6809.23 1108.39 3689.06 -1153.49 44.4
2014 3275.03 6793.82 783.12 3426.9 -835.68 42.1
2015 3082.41 3830.1 818.37 3831.95 -1557.79 42.4
2016 2985.13 2693.91 634.8 5762.7 -2208.22 46.7
2017 3207.9 4109.8 979.5 7138.9 -3679.5 48.7
Source: CBN Statistical Bulletin 2018, National Bureau of Statistics, International Monetary (IMF) Fund financial
statistics Year Book and World Bank’s African Database

www.theijbmt.com 77 | Page
Fiscal Policy and Economic Development in Sub Saharan Africa; Emphasis on Poverty in Ghana and Nigeria
The table of Tax Revenue (TAXREVg), Oil Revenue (OREVg), Capital Expenditure (CEXPg), Recurrent Expenditure
(REXPg), Deficit Financing (DEFg) and Poverty Index (POVg) for Ghana
YEAR TAXREVg OREVg CEXPg REXPg DEFg POVg
1986 10.3 0 17.1 82.9 -224 39.95
1987 9.2 0 21.9 78.1 -130 39.9
1988 8.8 0 23.9 76.1 -149 39.74
1989 8.7 0 22.5 77.5 -111 39.6
1990 7.6 0 21.9 78.1 -307 40.5
1991 7.8 0 22.4 77.6 -272 47.38
1992 6.1 0 21.6 78.4 -801 46.5
1993 8.8 0 17.1 82.9 -786 44.7
1994 11.2 0 18.8 81.2 -670 43
1995 11.3 0 25.8 74.2 -709 42
1996 11.4 0 27.1 72.9 -936 42.1
1997 9.5 0 19.6 70.6 -1045 36.2
1998 9.9 0 21.3 67.9 -978 34.7
1999 9 0 22.3 66.8 -1079 32.4
2000 11 0 17.4 54.8 -492 30.6
2001 12.3 0 14.7 56.9 -478 28.81
2002 11.4 0 11.8 40.8 -416 26.9
2003 13.7 0 18.7 34.9 -375 26.6
2004 13.2 0 10.8 24.6 -441 26.12
2005 14 0 11.8 20.4 -494 25.19
2006 14 0 9.8 17.9 -961 25.19
2007 13.6 0 8.7 13.9 -1791 25.8
2008 13.2 0 9.1 14.8 -2281 29.6
2009 12.5 0 7.1 13.3 -1845 29.8
2010 13.8 0 6.3 16.1 -3234 28.1
2011 14.9 2925 6.5 15.1 -2949 26.8
2012 15.6 3300 7.3 15.6 -4732 25.1
2013 16.4 3300 7 16.1 -5738 27.2
2014 16.7 3300 6.9 15.9 -4240 29.1
2015 17.2 3300 22.8 14.3 -1981 29.6
2016 17.6 2775 20.5 13.8 -3788 21.9
2017 22.3 2437.5 22.7 11 -2396 21.4
Source: Bank of Ghana, Ghana Statistical Services, International Monetary (IMF) Fund financial statistics Year Book
and World Bank’s African Database