fiscal space for health in malawi and revenue potential of ‘innovative...
TRANSCRIPT

FISCAL SPACE FOR HEALTH IN MALAWI AND REVENUE
POTENTIAL OF ‘INNOVATIVE FINANCING’
Pub
lic D
iscl
osur
e A
utho
rized
Pub
lic D
iscl
osur
e A
utho
rized
Pub
lic D
iscl
osur
e A
utho
rized
Pub
lic D
iscl
osur
e A
utho
rized

i
Table of Contents
LIST OF FIGURES .................................................................................................................................................. III
LIST OF TABLES .................................................................................................................................................... III
ACRONYMS ............................................................................................................................................................. IV
ACKNOWLEDGEMENT ....................................................................................................................................... VI
1. INTRODUCTION .............................................................................................................................................. 1
2. COUNTRY CONTEXT ...................................................................................................................................... 5
2.1 POPULATION AND DEMOGRAPHIC CHARACTERISTICS................................................................................... 5
2.2 HEALTH SERVICE DELIVERY......................................................................................................................... 5
2.3 MACRO-FISCAL SITUATION .......................................................................................................................... 8
2.4 HEALTH FINANCING.................................................................................................................................... 10
3. FISCAL SPACE ANALYSIS ........................................................................................................................... 12
3.1 CONDUCIVE MACROECONOMIC ENVIRONMENT .......................................................................................... 12
3.2 RE-PRIORITIZATION FOR HEALTH ............................................................................................................... 14
3.3 GENERATING ADDITIONAL RESOURCES FOR HEALTH ................................................................................. 15
3.4 INCREASED HEALTH SECTOR-SPECIFIC FOREIGN AID ................................................................................. 16
3.5 IMPROVED EFFICIENCY IN THE HEALTH SECTOR ........................................................................................ 17
4. ANALYSIS OF PROPOSED AREAS FOR EARMARKED TAXATION ................................................. 24
4.1 METHODOLOGY .......................................................................................................................................... 24
4.2 ARGUMENTS FOR AND AGAINST HYPOTHECATING (EARMARKING) TAX REVENUE FOR HEALTH .................. 25
4.3 EXPERT OPINION ON EARMARKED TAXES FOR HEALTH IN MALAWI ............................................................ 26
4.4 REVENUE FORECASTING ............................................................................................................................. 33
4.4.1 Fuel Levy ............................................................................................................................................... 33
Demand for Fuel ............................................................................................................................................. 33
Effects of introducing a new fuel health levy ................................................................................................. 34
Revenue generation potential: sharing resources from MAREP and replacing the storage levy .................... 35
4.4.2 Motor Vehicle Insurance Levy ............................................................................................................... 36
Demand for Motor Vehicle Insurance ............................................................................................................ 36
Effects of introducing health levy on motor vehicle insurance ...................................................................... 36
Health and economic justification for introducing a levy on motor vehicle insurance ................................... 37
Revenue Generation Potential – Tax/levy on Motor Vehicles Insurance ....................................................... 40
Revenue Generation Potential – Establishment of a Third Party Motor Compensation Fund (TPMCF) ....... 41
5. SUMMARY - REVENUE GENERATION POTENTIAL OF PROPOSED MEASURES ........................ 43
6. CONCLUSIONS AND RECOMMENDATIONS .......................................................................................... 46
REFERENCES .......................................................................................................................................................... 47
ANNEXES .................................................................................................................................................................. 52
ANNEX 1: EXTRACTIVES INDUSTRY ......................................................................................................................... 52
Mining activities in Malawi ............................................................................................................................ 52
Effects of introducing a health levy in the Extractives Industry ..................................................................... 53
Revenue generation potential - Extractives Industry ...................................................................................... 53
ANNEX 2: ALCOHOL ................................................................................................................................................ 54
Demand for alcohol in Malawi ....................................................................................................................... 54
Effects of introducing a health levy on alcohol .............................................................................................. 54
Revenue generation potential – health levy on Alcohol ................................................................................. 55
ANNEX 3: TOBACCO ................................................................................................................................................. 56
Demand for tobacco products in Malawi ........................................................................................................ 56
Effects of introducing a health levy on tobacco ............................................................................................. 56
Revenue generation potential – health levy on Tobacco ................................................................................ 57
ii
ANNEX 4: DETAILED DATA INPUTS AND OUTPUTS .................................................................................................. 48
A.4.1: Fuel .......................................................................................................................................................... 48
A.4.2: Motor Vehicle Insurance .......................................................................................................................... 49
A.4.3: Extractive Industries ................................................................................................................................ 50
A.4.4: Alcohol ..................................................................................................................................................... 51
A.4.5: Tobacco .................................................................................................................................................... 52

iii
List of Figures
Figure 1: Provision of Maternal and Child Health Services ................................................................................. 7
Figure 2: Percentage of Health Facilities in Malawi with Essential Services ....................................................... 8
Figure 3: Composition of Total Health Expenditure: Proportions and Nominal Figures ................................... 11
Figure 4: Elasticity of Health Expenditures to GDP in Malawi: 2007/08- 2014/15 ........................................... 13
Figure 5: Distribution of Total Government Expenditures by key sectors ......................................................... 15
Figure 6: Government and Total Health Expenditures (% of GDP): 2014 ......................................................... 15
Figure 7: Trends in External (Donor) Health Expenditure – US$ millions ........................................................ 17
Figure 8: Breakdown of Government Health Budget by Key Line Items .......................................................... 20
Figure 9: Domestic Demand for Fuel and Evolution of Fuel Pump Prices ......................................................... 33
Figure 10: Potential Revenue from Storage Levy (SL) (MK millions) .............................................................. 35
Figure 11: Potential Revenue from MAREP and Storage Levy (SL) (MK millions) ......................................... 35
Figure 12: No. of Vehicles Vs Gross Premiums from motor vehicle insurance ................................................. 36
Figure 13: Gross Premiums Vs Aggregate Insurance Claims ............................................................................. 37
Figure 14: No. of Vehicles vs Accidents: Malawi 1995-2015 ............................................................................ 38
Figure 15: Road traffic fatality rates per 100,000 population (2013) ................................................................. 39
Figure 16: Road Accident related Injuries and Deaths and insurance claims ..................................................... 39
Figure 17: Projected Revenue - Tax/Levy on Motor Vehicle Insurance Premiums (MK) ................................. 41
Figure 18: Potential Revenue - Third Party Motor Compensation Fund (MK) .................................................. 42
Figure 19: MAREP, Storage and MV Insurance (MK million) .......................................................................... 45
Figure A.1: Production value vs Revenues – Malawi Extractive Sector 2012/13-2015/16 ................................ 52
Figure A.2: Production, sales, and tax revenue from alcohol in Malawi ............................................................ 54
Figure A.3: Production, sales, and tax revenue from Cigarettes in Malawi........................................................ 56
List of Tables
Table 1. Health Outcome indicators – Malawi vs Low Income Countries ........................................................... 6
Table 2: Macroeconomic, Fiscal, and Health Financing Indicators: Malawi 2012-2016 ..................................... 9
Table 3: Health Expenditures: Malawi vs Sub-Sahara Africa and Low Income Countries - 2014 ..................... 11
Table 4: Financing Agents by share of Total Health Expenditure ...................................................................... 17
Table 5: Sources of inefficiency in Malawi’s health sector and Potential Savings Per Capita (US$) ................ 20
Table 6: Summary – Analysis of Fiscal Space for Health in Malawi ................................................................. 21
Table 7: Proposed Tax Rate ................................................................................................................................ 24
Table 8: Responses from Stakeholders and Document Reviews on the Proposed Sources of Earmarking ........ 30
Table 9: Accident Statistics: Malawi 2013/14-2015/16 ...................................................................................... 38
Table 10: Projections Summary - Storage levy, Motor Vehicle Insurance, and MAREP (MK) ........................ 44
Table A.1.1: Potential Mining Projects ............................................................................................................... 53
Table A.1.2: Projected Revenue - Extractive Health Levy (MK million) .......................................................... 53
Table A.2.1: Projected Revenue - Health Levy on Alcohol (MK millions) ....................................................... 55
Table A.3.1: Projected Revenue - Health Levy on Tobacco (Cigarettes) (MK millions) ................................... 57

iv
Acronyms
AfDB African Development Bank
ANC Antenatal Care
APM Automatic Pricing Mechanism
ART Antiretroviral Therapy
BoP Balance of Payments
CHAM Christian Health Association of Malawi
CIT Corporate Income Tax
CPI Consumer Price Index
DALY Disability Adjusted Life Year
EHP Essential Health Package
EITI Extractive Industries Transparency Initiative
EPC Energy Pricing Committee
ETR Effective Tax Rate
FOB Free on Board
GDP Gross Domestic Product
GoM Government of Malawi
GSMA Global System for Mobile communication Association
HIV/AIDS Human Immunodeficiency Virus and Acquired Immune Deficiency Syndrome
HNP Health, Nutrition and Population
IBLC In-Bond Landed Cost
IFMIS Integrated Financial Management Information System
IMF International Monetary Fund
MAREP Malawi Rural Electrification Programme
MDG Millennium Development Goal
MERA Malawi Energy Regulatory Authority
MK Malawi Kwacha
MMR Maternal Mortality Ratio
MNCH Maternal, Newborn and Child Health
MoFED Ministry of Finance, Economic Planning and Development
MoH Ministry of Health
MRA Malawi Revenue Authority
NGO Non-Governmental Organization
NHA National Health Accounts
NHIS National Health Insurance Scheme
NSO National Statistics Office
OOPS Out of Pocket Spending

v
PE Personal Emoluments
PFM Public Finance Management
RAF Road Accident Fund
RBM Reserve Bank of Malawi
RH Reproductive Health
SADC Southern African Development Community
SHI Social Health Insurance
SSA sub-Saharan Africa
TB Tax Base
TFR Total Fertility Rate
THE Total Health Expenditure
TPMCF Third Party Motor Compensation Fund
TR Tax Revenue
UHC Universal Health Coverage
UNFPA United Nations Population Fund
UNICEF United Nations Children’s Fund
USAID United States Agency for International Development
VAT Value Added Tax
WHO World Health Organization

vi
Acknowledgement
This analytical work was prepared on request from the Government of Malawi by Bank staff from the
Health, Nutrition and Population Global Practice with support from the Macro Economics and Fiscal
Management Global Practice, and Abt Associates (SSDI-Systems Project). The work is consistent with
the national health reform agenda, and builds on an initial report by the Ministry of Health and Abt
Associates which looked at international and local experiences of Health Funds, and prospects for
introducing a Health Fund in Malawi. The principal author is Collins Chansa, co-Task Team Leader and
Health Specialist, GHN01; with significant input from Pachalo Mwanza, Consultant, GHN01; Priscilla
Flaness Kandoole, Country Economist, GMF07; and Thulani Matsebula, Senior Public Health Specialist,
GNH01.
Contributions and comments were made by several Bank staff, development partners, and government
officials including: Richard James Lowden Record, Senior Country Economist, GMF07; Pia Schneider,
Lead Economist, GHN01; Tillmann Von Carnap-Bornheim, Consultant, GMF07; Ziauddin Hyder, co-
Task Team Leader and Senior Nutrition Specialist, GHN01; John Bosco Makumba, Senior Operations
Officer, GHN01; Marelize Gorgens, Senior Monitoring & Evaluation Specialist, GHN05; Takondwa
Mwase, Chief of Party/Health Financing Advisor, SSDI-Systems/Abt Associates; Mark Malema, Health
Financing Officer, SSDI-Systems/Abt Associates; Dominic Nkhoma, Head of Health Policy, Ministry of
Health; Emma Jipson Mabvumbe, Director of Planning and Policy Development, Ministry of Health; and
Crispin Kulemeka, Director of Revenue, Ministry of Finance, Economic Planning and Development.
The following peer reviewers provided comments that have significantly enhanced the quality of the
report: Owen K. Smith, Senior Economist, GHN06; Caryn Bredenkamp, Senior Economist, GHN07; and
Paul Revill, Research Fellow –Centre for Health Economics, University of York.
Valuable guidance was provided by Laura Kullenberg, Country Manager, Malawi Country Office,
AFMMW; Magnus Lindelow, Practice Manager, GHN01; Abebe Adugna Dadi, Practice Manager,
GMF07; Gayle Martin, Program Leader, AFCE1; Edit Velenyi, Health Economist, GHN01; and Helmuth
Michael Josef Adelhardt, Senior Health Specialist, GHN05. Gertrude Mulenga Banda, Senior Program
Assistant, GHN01; Esther Angellah Lozo, Operations Assistant, AFMMW; Deliwe Ziyendammanja,
Team Assistant, AFMMW; and Yvette Atkins, Senior Program Assistant, GHN01 provided
administrative support.
1
1. INTRODUCTION
1. Since 2013, Malawi has considered significant health financing and organizational reforms. The proposed reforms are based on the principle of solidarity whereby every citizen pays according to
his/her ability to pay, and not according to need. The main goal of these reforms is to increase access to
quality health services through increased domestic financing to the health sector, efficiency, service
availability, and equity. The health reform process consists of four areas, namely: (1) Establishing a
Social Health Insurance (SHI) scheme; (2) Creating a Health Fund; (3) Decentralizing district and
central hospital level service provision; and (4) Reviewing institutional arrangements between the
Government of Malawi (GoM) and the Christian Health Association of Malawi (CHAM). The health
reforms are backed by the highest level of political commitment signified by: i) A Health Financing
Summit in 2014 which was presided by the President of Malawi, A. P. Mutharika; and ii) A
performance contract between the President of Malawi and the Minister for Health that was entered into
in 2015. These reforms are being managed by the Vice President while implementation is being
executed by the Ministry of Health (MoH) in collaboration with the Ministry of Finance and other
government ministries and departments, and development partners.
2. In line with the health reforms outlined above, various proposals have been made to expand
domestic revenues for health. This includes the development of contributory SHI as well as proposals
for “innovative financing” and earmarked taxes. Revenue from domestic sources of financing would
then be pooled through a Health Fund and used to finance health services. To spearhead the
establishment of the Health Fund, the GoM requested Abt Associates (SSDI-Systems Project) to
examine the revenue generation potential and sustainability of introducing earmarked taxes for health.
This work was completed in May 2015 and a report was produced which identified eleven (11) areas1
for earmarking. To build on this study as well as other studies in the other reform areas, the GoM then
requested development partners to review the quality of the work particularly if there are any gaps in
the methodology and data, recommendations, and feasibility of implementation. Development partners
were also requested to generate more data in areas where the evidence is weak. Based on the outcome
of this review, the GoM would then make a decision on the reform areas to implement.
3. In July 2015, a request was made to the World Bank to participate in the health reforms,
specifically to review the work on the revenue potential for earmarked taxes for health, and
creation of the health fund. This request was conceived on the understanding that analyses of
earmarked taxes need to be embedded in the broader macroeconomic and fiscal context of which the
World Bank has the expertise to engage beyond the health sector and put health financing into the
overall macro-economic context. As such, the Bank team extended the analysis by further examining
the adverse effects that may be triggered by the introduction of the proposed earmarked taxes. This was
achieved by adding price/cost data, supply and demand-side data (i.e. production, sales and revenue
figures), and health statistics. Moreover, considering that proposals for SHI and earmarked taxes for
health have been motivated by a perception that the health sector is under-financed and overly reliant on
external financing, the report also includes a fiscal space for health analysis. In a nutshell, this report
examines the following:
i. Potential to expand fiscal space in the health sector by critically examining all the five pillars;
and drilling-down on the revenue generation potential for twelve (12)2 areas proposed for
earmarked taxes;
ii. Risks and potential downsides of earmarked taxation, and adverse effects that may be triggered
by the introduction of the proposed earmarked taxes; and
1 The eleven (11) areas are: (i) fuel; (ii) tobacco products; (iii) alcohol; (iv) mobile phone talktime; (v) corporate businesses; (vi) value added
tax; (vii) extractive industries; (viii) moneys received from loans applied through parliament; (ix) donations received from developing partners, foundations etc; (x) annual earnings paid by employees and employers to private health insurance schemes, and (xi) moneys earned by
investments made by or on behalf of the Malawi Health Fund. 2 This is a combination of the eleven (11) areas initially identified and an analysis of revenue potential of a tax on motor vehicle insurance

2
iii. Provides recommendations on the viable options for increasing fiscal space for health in
Malawi.
4. The report highlights huge gaps in service coverage and poor quality of services which are
symptomatic of a poorly financed and/or inefficient health system. Despite notable improvements in
maternal and child health outcomes, Malawi still has a huge disease burden that can be attributed to low
coverage/access, and poor quality of essential services. For example, coverage of the key maternal and
child health services at 53 percent nationwide is low while there are also inequalities in service
coverage by urban-rural setting. The underlying health system bottlenecks are: critical shortage of key
health systems inputs (human resources, medicines and medical supplies, and poor/inadequate
infrastructure); and poor governance and accountability (including poor public finance management).
Some of the bottlenecks in the health system could be a result of inadequate funding i.e. only 13 percent
of the government health budget is allocated to drugs and medical supplies, far below the spending
norms in other African countries which is estimated at 33 percent (Bennett et al. 1997). Inadequate
spending on health has also prompted the Malawian government to explore the introduction of fee-
paying wards and bypass fees at secondary and tertiary hospitals but this move has generated resistance
from civil society groups who argue that such payments are having a catastrophic impact on the poor.
On the other hand, inefficiencies are also high, and reduce the total amount of financial resources
available to adequately finance the health system. As a consequence, the health sector is currently not
able to deliver on key policy commitments of access and affordability as enshrined in the country’s
Constitution which seeks to “provide adequate health care, commensurate with the health needs of
Malawian society and international standards of health care”.
5. Domestic financing for health and total health expenditures as shares of GDP are relatively
high in Malawi as compared to peer countries. This suggests that increasing health financing through
a re-prioritizaiton of the budget is unlikely. However, in absolute terms, Government health expenditure
per capita of US$11.20 in 2014/15 is less than one-third of the country’s total health expenditure per
capita of US$39.2 in 2014/15. The implication is that the GoM has already adequately prioritized health
yet the resources being provided are inadequate due to the small size of the GDP. Consequently,
external development partners are the major financiers of health care in Malawi and contribute an
average of US$27 per capita per annum over the period 2009/10-2014/15. But 62 percent of the
external funding is spent on three diseases (HIV/AIDS, Malaria, and Reproductive Health) which
leaves the other components of the health system underfunded. In particular, earmarking donor funding
to disease programmes reduces government’s flexibility in resource allocation, and ability to re-
prioritize funding to emergent needs. Furthermore, donor resources are uncertain and commitments are
made for short periods and this makes it difficult to implement sustainable long-term strategies.
6. The potential for increasing fiscal space for health in most of the key areas is limited
particularly due to the weak macro-economic environment. While the economy is expected to
growth modestly at about 3.7 percent on average between 2016 and 20183, high fiscal deficit (estimated
at 4.3 percent of GDP in 2016/17) and huge total public debt (estimated at 52.1 percent of GDP in
2016/17) will make it difficult to adequately provide public services particularly health and other social
services. As such, it would also be difficult to re-prioritize the national budget given the high debt-
service ratio, competing priorities from other sectors, and increasing public wage bill as a share of
GDP. In addition, the scope for expanding funding and coverage through SHI is limited due to the poor
macroeconomic environment, and high levels of informalization in the labour market i.e. 89 percent of
total labour force is in informal employment. Given that SHI is often contributory, whereby premiums
towards the SHI scheme are usually deducted through the payroll, evidence shows that collecting
contributions from the informal sector is often difficult. Secondly, low wages in the formal sector, mean
and median of US$113 and US$37, respectively, is also indicative of an economy which is not yet
ready to accommodate SHI. Thirdly, high levels of poverty and existence of a large pool of “working
poor” also make the implementation of SHI unfeasible4.
3 World Bank Staff estimate using MFMod 4 Only 5 percent of the Malawians live for US$4-20 a day, compared to the sub-Sahara Africa (SSA) average of 10 percent. Wages in the
formal sector are more than 50 percent lower in value (DTUC, 2015).

3
7. The report further concludes that the potential for raising significant additional revenues for
health through earmarked taxes is limited. If all the viable earmarked taxes on fuel and motor
vehicle insurance are introduced, an average of MK8.4 billion (equivalent to US$11.6 million) could be
raised per annum over the period 2016/17 to 2021/22 based on the high scenario. This is equivalent to
ten (10) percent of the 2014/15 Government Health Expenditure or US$0.63 per capita per year over
the period 2016/17 to 2021/22. This suggests that the amount of revenue that would be raised from
earmarked taxes would only make a small contribution to expanding financing for health. Furthermore,
earmarked taxes are associated with some risks that are summarized in the report. In particular, a
reduction in flexibility of public finances and resource allocation, and the possibility that health budgets
are reduced by the corresponding increase in earmarked taxes.
8. With respect to external financing, the report shows that it is the most substantial and
important source of health financing in Malawi. However, the declining trend in external financing
poses the greatest threat to future financing and provision of better health care in Malawi. Our analysis
shows that the level of external funding has been declining in recent years particularly after the
‘Cashgate5’ scandal. In particular, external financing declined by US$118 million in two years or
annual average of US$3.7 per capita over the period 2013/14-2014/15. As most of the public health
commodities are externally financed, Malawi is exposed to high dependence and vulnerability to
external and internal shocks. At macro level, there has also been a loss of budget support and reduced
confidence in the use of Government systems. Given the low levels of on-budget foreign financing at
levels previously available to Government, authorities continue to borrow heavily from domestic
sources to close the gap. This creates risk of further pushing up inflation and lending rates, crowding
out private sector investment and constraining economic growth. As such, it is critical to mitigate the
reducing inflow of external resources as the country endeavours to overcome the current
macroeconomic challenges.
9. The most viable option for expanding resources and improving results in the health sector is
enhancing efficiency of spending and promoting greater predictability and effectiveness of
external financing for health. The report provides evidence of inefficiencies in the health system, key
areas being: health system leakages (corruption and fraud), high expenditure on human resources, low
utilization of hospital services, and sub-optimal intervention mix. Given the current levels of
inefficiency in the health sector in Malawi, available financing is inadequate to meet health system
goals particularly access to health care, and quality of preventive and curative health care. The results
suggest that it is probable to achieve some of the unmet needs in the health sector if inefficiencies are
addressed. For instance, using global estimates, we provide a crude efficiency savings estimate of
US$10.6 per capita per annum which could be generated if all the four (4) main sources of
inefficiencies in the health sector in Malawi are addressed. However, these results should be used with
caution given the considerable uncertainty associated with using global estimates when calculating the
cost of health sector inefficiencies. More studies ought to be conducted to examine the sources of
inefficiencies in the health sector. On the other hand, predictability and execution of the public health
budget is low while financial disbursements are input-based rather than results-based. There is also
inconsistency in the allocation of public resources due to the absence of an objectively defined or
needs-based resource allocation formula.
10. Based on the results, the report recommends that efforts to increase government spending in
the health sector should be implemented through the broader tax system. Tax revenue as a share of
GDP which is currently estimated at 16.1 percent could be raised to 20 percent to generate more
revenue at macro level. Consequently, emphasis should be on improving efficiency in overall revenue
collection by Malawi Revenue Authority (MRA). For example, considering that the Malawian
Government is in the process of reviewing the overall tax system, it will be extremely important to align
5 In 2013, there was a high-level corruption scandal in which an estimated $31 million was stolen from government coffers. This scandal is
commonly referred to as the “Cashgate” scandal. The Cashgate has become the main reference point for corruption in Malawi, and has eroded
investor and donor confidence.

4
all proposals on earmarked taxes in the health sector to the overall tax reform process. However, if
earmarked taxes are used, decisions should be made on whether this intervention will be temporal or
long term, and with a full understanding of the broader constraints and priorities. Secondly, improving
efficiency in the health sector provides the best option for increasing fiscal space for health because the
potential savings could be much more than what could be raised from earmarked taxes for health. A
dedicated study should be conducted to examine in detail, the sources of inefficiencies, ways of
addressing them, and actual potential efficiency savings. Thirdly, the declining trend in external
financing should be averted. The Government could achieve this by regaining the confidence and trust
of development partners by putting in place robust governance and accountability systems. On the other
hand, development partners should also reduce fragmentation, and increase predictability and flexibility
in resource allocation.
11. This report is organized as follows. The next section of this paper (Section 2) outlines the
country context including the population and demographic characteristics, health service delivery,
macro-fiscal situation, and the health financing profile. Section 3 presents the results from the fiscal
space for health analysis for each of the five pillars namely: (i) Conducive macroeconomic
environment; (ii) Re-prioritization for health; (iii) Generating additional resources for health; (iv)
Increased health sector-specific foreign aid; and (v) Improved efficiency in the health sector. Section 4
provides the results from the review of the proposed areas for earmarked taxation while Section 5
summaries these results. Suffices to say that revenue forecasts on fuel and motor vehicle insurance are
provided in the main body of the report while the analyses on extractives industry, alcohol, and tobacco
products are provided in the Annexes. Lastly, Section 6 outlines the key conclusions and
recommendations from the study.

5
2. COUNTRY CONTEXT
2.1 Population and Demographic Characteristics
12. Malawi’s population has grown rapidly from almost 3.6 million in 1960 to around 16.3
million in 2015 with about 85 percent of the population residing in rural areas (NSO, 2010).
Almost half (46.4 percent) of this population is below the age of 15 years, and owing to an estimated
growth rate of 3.2 percent per annum in 2015, Malawi’s total population is expected to reach 26.1
million by 2030 (ibid). The population’s growth is mainly driven by a high total fertility rate (TFR),
estimated at 4.4 children per woman in 2015 (NSO and ICF International, 2016). Therefore, even
though there has been a decline in the total fertility rate, under-five mortality rate, and maternal
mortality ratio (MMR) (Table 1), the transition from high to low birth and death rates is moving at a
slow pace for Malawi to reap the benefits of a Demographic Dividend6. One of the key reasons for high
TFR is limited supply of family planning commodities. For example, even though 80 percent of the
health facilities in Malawi offer modern methods of family planning, less than half of the facilities
actually have all the methods they provide available (MoH and ICF International, 2014). This
contributes to a high percentage of women aged 15-49 with unmet need for family planning estimated
at 18.7 percent for currently married women and 39.8 percent for sexually active unmarried women
(NSO and ICF International, 2016). Given the high fertility rate and large youth cohort, it is anticipated
that Malawi will continue experiencing significant population growth as more and more youths enter
the reproductive age, and this will weaken Malawi’s economic growth prospects7. This is because high
population growth increases total and child dependency which leads to a high demand for jobs, health
and other social services which the economy cannot provide. For example, Malawi has a high total and
child dependency burden estimated at 98 and 92 dependents, respectively, for every 100 working-age
persons in 2015 (NSO, 2010). And while the number of youths entering the labour force has been
growing rapidly, employment opportunities are few (NSO, 2014). As a result, overall youth
unemployment8 estimated at 23 percent in 2012/13 is very high (ibid).
2.2 Health Service Delivery
13. During the past twenty-five years, Malawi has made significant progress in increasing
coverage for key maternal, child health and nutrition services, leading to improvements in several
health outcomes (Table 1). Notably, Malawi is among the 62 countries worldwide (and among the 11
countries9) which met the Millennium Development Goal (MDG) 4 target of a two-thirds reduction in
under-five mortality rate between 1990 and 2015. Despite the attainment of MDG 4 in Malawi,
progress was insufficient to reach MDG 5. As such, at 634 deaths per 100,000 live births in 2015,
Malawi is estimated to have one of the highest MMR in the SSA region and in the world (WHO et al,
2015). Malawi is also one of the countries with a high prevalence of HIV, with 10 percent of the adult
population or 1.1 million people living with HIV. With a TB prevalence rate of 363 cases per 100,000
population, Malawi is above the WHO threshold for TB emergency. In addition, 54 percent of TB
patients with an HIV test are HIV positive and as such, Malawi is among the 41 priority countries for
the global TB/HIV response (WHO, 2015d). On the other hand, HIV tops the list of the ten leading
causes of years-of-life lost due to illness in Malawi followed by malaria which ranks second (GBD
Collaborators, 2016a). HIV and malaria, ranked sixth and seventh, respectively, were also among the
leading ten causes of years lived with disability in 2015 (GBD Collaborators, 2016b). Chronic
malnutrition is also high with at least 37 percent of children under five suffering from stunting. Stunting
is greater among children in rural areas (39 percent) than urban areas (25 percent); and higher among
children in the lowest wealth quintile (46 percent) compared to those in the highest wealth quintile (24
percent) (NSO and ICF International, 2016).
6 The Demographic Dividend is a temporary opportunity for accelerated economic growth that is made possible by a sustained decline in birth
and deaths rates, which leads to an increase in the ratio of working-age population relative to young dependents. 7 Teenage pregnancy (women 15-19 who have begun childbearing) was estimated at 29 percent in 2015/16 (NSO and ICF International, 2016) 8 Unemployment rates for youths age 15-34 years (broad definition) 9 The 11 countries are Egypt, Ethiopia, Eritrea, Liberia, Madagascar, Malawi, Mozambique, Niger, Rwanda, Uganda, and Tanzania.

6
Table 1. Health Outcome indicators – Malawi vs Low Income Countries
Health outcome/output 1990 2015
Low
Income
Countries
(2015)
MDG
Target
for
Malawi
Infant Mortality Rate (deaths per 1,000 live births)* 143 43 53 48
Under-five Mortality Rate (deaths per 1,000 live births)* 242 64 76 81
Maternal Mortality Ratio (deaths per 100,000 live births)** 957 634 495 239
Total Fertility Rate (No. of children per women)# 7 4.4^ 4.8
(2014)
Prevalence of Stunting in children under-five (%) 48.7##
(1992)
37^ 37.6#
(2014)
Prevalence of HIV (population 15-49 years) (%)# 8.8 10
(2014)
2.9
(2014)
Data Sources: *United Nations Inter-Agency Group for Child Mortality Estimation (2015); **WHO et al. (2015); #World Development Indicators;
##Malawi Demographic and Health Survey (MDHS) 1992; ^MDHS 2015-16 Key
Indicators Report
14. As outlined above, Malawi’s disease burden is significant. The 2013-14 Service Provision
Assessment and the 2015-16 Demographic and Health Survey provide national and sub-national
information on the availability, service coverage, and quality of services at health facilities in Malawi.
Some of the underlying causes for the high disease burden in Malawi is low coverage and access to
essential services coupled with poor quality for the services available. For instance, coverage for most
of the key maternal and child health coverage indicators (national average of 53 percent10
) is low except
for births occurring in a health facility (91 percent) and births attended by a skilled provider (90
percent) (figure 1). Besides low coverage, there are also inequalities in service coverage by urban-rural
setting (figure 1). And while the percentage of births occurring in a health facility (91 percent) and
percentage of births attended by a skilled provider (90 percent) are high, the quality of antenatal and
maternal delivery services are poor, which partially explains the high MMR (MoH and ICF
International, 2014). The high percentage of women aged 15-19 who have begun childbearing (29
percent), and women aged 15-49 with anemia (33 percent) also contribute to the high MMR in Malawi
(NSO and ICF International, 2016).
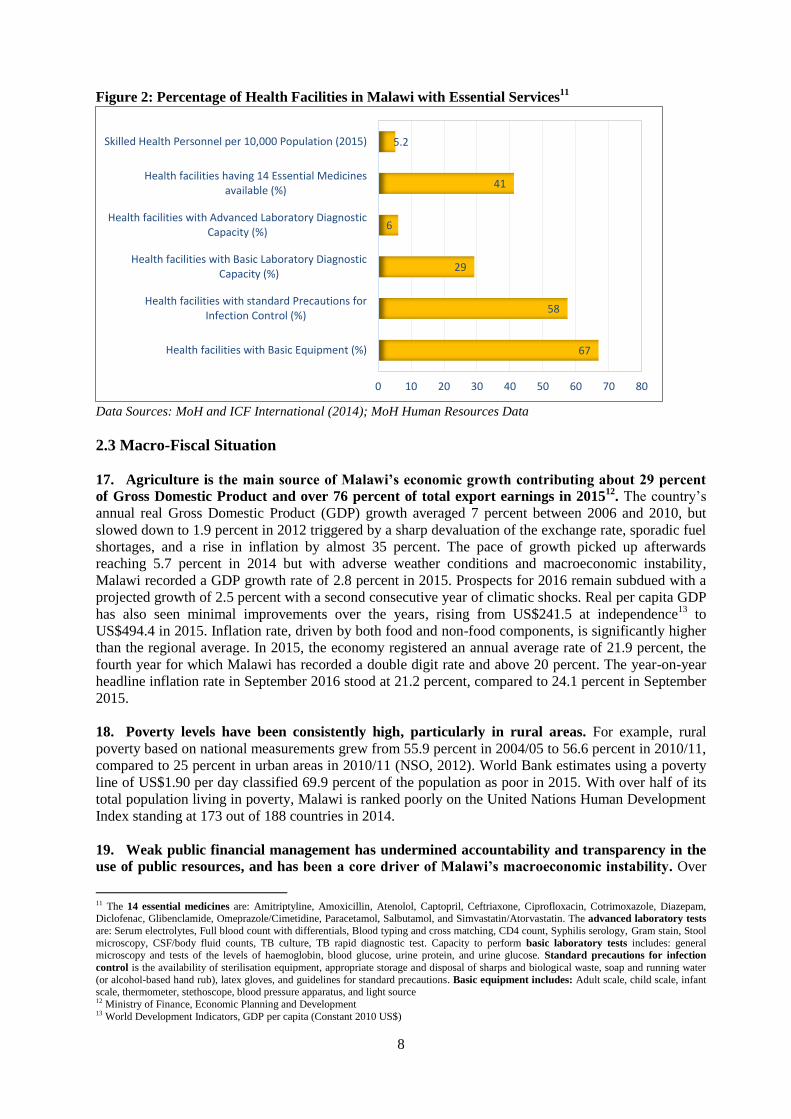
15. Significant health system bottlenecks limit service coverage and provision of quality health
care. This includes: critical shortage of key health systems inputs (human resources, medicines and
medical supplies, and poor/inadequate infrastructure); and poor governance and accountability
(including poor public finance management). For example, in 2013/14, only 67 percent of the health
facilities in Malawi had basic equipment; only 29 percent had basic laboratory diagnostic capacity; and
only 41 percent of the health facilities reported adequate stocks of essential medicines (figure 2).
Detailed analysis of the percentage of health facilities having all the 14 essential medicines available by
managing authority shows that only 30 percent of the Government facilities were adequately stocked as
compared to 53 percent of the health facilities managed by the CHAM (MoH and ICF International,
2014). With regards to human resources, the vacancy rate estimated at 70 percent is high and this
increases staff workload. In other words, the number of skilled health personnel (doctors, clinical
officers, nurses, and midwives) per 10,000 population was 5.2 in 2015 which is far below the WHO
recommended 23 skilled health workers per 10,000 population (figure 2). Shortage of essential drugs
and health workers compromises quality.
16. Gaps in service coverage and poor quality of service are symptomatic of a poorly financed
and/or inefficient health system. Some of the bottlenecks in the health system could be a result of
10 The national average of 53 percent was for the following indicators: Children age 12-23 months fully vaccinated, Pregnant women with 4+
ANC visits, Children with fever who sought treatment from a health facility/provider, Households with at least one insecticide-treated net
(ITN), Pregnant women aged 15-49 who slept under an ITN last night, and Pregnant women age 15-49 who received 3+ doses of malaria IPT

7
inadequate funding i.e. only 13 percent of the government health budget is allocated to drugs and
medical supplies, far below the spending norms in other African countries which is estimated at 33
percent (Bennett et al. 1997). In adequate spending on health has also prompted the Malawian
government to explore the introduction of fee-paying wards and bypass fees at secondary and tertiary
hospitals but this move has generated resistance from civil society groups who argue that such
payments are having a catastrophic impact on the poor (Oxfam, 2016). However, inefficiency is also
high and reduces the total amount of financial resources available to adequately finance the health
system and produce better health outcomes. As a consequence, the health sector is currently not able to
deliver on key policy commitments of access and affordability as enshrined in the country’s
Constitution which postulates to “provide adequate health care, commensurate with the health needs of
Malawian society and international standards of health care”.
Figure 1: Provision of Maternal and Child Health Services
Data Sources: NSO and ICF International (2016)
0 10 20 30 40 50 60 70 80 90 100
Children age 12-23 months fully vaccinated (%)
Pregnant women with 4+ ANC visits (%)
Deliveries by a Skilled Provider (%)
Deliveries in a Health Facility (%)
Children with fever, % who sought treatment from a healthfacility/provider
Households with at least one insecticide-treated net [ITN] (%)
Pregnant women aged 15-49 who slept under an ITN last night(%)
Pregnant women age 15-49 who received 3+ doses of malariaIPT (%)
Rural Urban
8
Figure 2: Percentage of Health Facilities in Malawi with Essential Services11
Data Sources: MoH and ICF International (2014); MoH Human Resources Data
2.3 Macro-Fiscal Situation
17. Agriculture is the main source of Malawi’s economic growth contributing about 29 percent
of Gross Domestic Product and over 76 percent of total export earnings in 201512
. The country’s
annual real Gross Domestic Product (GDP) growth averaged 7 percent between 2006 and 2010, but
slowed down to 1.9 percent in 2012 triggered by a sharp devaluation of the exchange rate, sporadic fuel
shortages, and a rise in inflation by almost 35 percent. The pace of growth picked up afterwards
reaching 5.7 percent in 2014 but with adverse weather conditions and macroeconomic instability,
Malawi recorded a GDP growth rate of 2.8 percent in 2015. Prospects for 2016 remain subdued with a
projected growth of 2.5 percent with a second consecutive year of climatic shocks. Real per capita GDP
has also seen minimal improvements over the years, rising from US$241.5 at independence13
to
US$494.4 in 2015. Inflation rate, driven by both food and non-food components, is significantly higher
than the regional average. In 2015, the economy registered an annual average rate of 21.9 percent, the
fourth year for which Malawi has recorded a double digit rate and above 20 percent. The year-on-year
headline inflation rate in September 2016 stood at 21.2 percent, compared to 24.1 percent in September
2015.
18. Poverty levels have been consistently high, particularly in rural areas. For example, rural
poverty based on national measurements grew from 55.9 percent in 2004/05 to 56.6 percent in 2010/11,
compared to 25 percent in urban areas in 2010/11 (NSO, 2012). World Bank estimates using a poverty
line of US$1.90 per day classified 69.9 percent of the population as poor in 2015. With over half of its
total population living in poverty, Malawi is ranked poorly on the United Nations Human Development
Index standing at 173 out of 188 countries in 2014.
19. Weak public financial management has undermined accountability and transparency in the
use of public resources, and has been a core driver of Malawi’s macroeconomic instability. Over
11 The 14 essential medicines are: Amitriptyline, Amoxicillin, Atenolol, Captopril, Ceftriaxone, Ciprofloxacin, Cotrimoxazole, Diazepam, Diclofenac, Glibenclamide, Omeprazole/Cimetidine, Paracetamol, Salbutamol, and Simvastatin/Atorvastatin. The advanced laboratory tests
are: Serum electrolytes, Full blood count with differentials, Blood typing and cross matching, CD4 count, Syphilis serology, Gram stain, Stool
microscopy, CSF/body fluid counts, TB culture, TB rapid diagnostic test. Capacity to perform basic laboratory tests includes: general microscopy and tests of the levels of haemoglobin, blood glucose, urine protein, and urine glucose. Standard precautions for infection
control is the availability of sterilisation equipment, appropriate storage and disposal of sharps and biological waste, soap and running water
(or alcohol-based hand rub), latex gloves, and guidelines for standard precautions. Basic equipment includes: Adult scale, child scale, infant scale, thermometer, stethoscope, blood pressure apparatus, and light source 12 Ministry of Finance, Economic Planning and Development 13 World Development Indicators, GDP per capita (Constant 2010 US$)
67
58
29
6
41
5.2
0 10 20 30 40 50 60 70 80
Health facilities with Basic Equipment (%)
Health facilities with standard Precautions forInfection Control (%)
Health facilities with Basic Laboratory DiagnosticCapacity (%)
Health facilities with Advanced Laboratory DiagnosticCapacity (%)
Health facilities having 14 Essential Medicinesavailable (%)
Skilled Health Personnel per 10,000 Population (2015)

9
the recent years, the national budget has come under immense pressure with reduced levels of foreign
financing as developments partners have withdrawn support disbursed through the Government system.
This is in light of revelations of misappropriation of public funds through fraudulent transactions
carried out in the government’s Integrated Financial Management Information System (IFMIS) in
September 2013. Consequently, private sector confidence and the country’s global reputation have
deteriorated. Following the withdrawal of budget support, Government has persistently run large fiscal
deficits. Spending pressures have risen from increasing debt service costs; a rising public sector wage
bill; costly subsidy schemes; and the need to settle outstanding arrears. For example, the public sector
wage bill as a share of GDP increased from 5.7 percent in 2012/13 to 6.4 percent in 2016/17, and this
raises questions on the sustainability of the public sector wage bill (World Bank, 2017). To finance
fiscal deficits, authorities have borrowed heavily from domestic sources. This has exerted an upward
pressure on inflation and lending rates, crowding out private sector investment. For example, by
November 2016, overall revenues and grants were estimated at 20.2 percent of GDP, and expenditures
at 24.4 percent of GDP (Table 2). Domestic revenue were estimated at 17.9 percent of GDP of which
16.1 percent was from taxes and 1.8 percent from non-taxes. Grants were estimated at 2.3 percent of
GDP mostly from project and dedicated grants.
20. The financing gap continues to be met through long-term, highly concessional foreign
project loans, with the Government now striving to control its domestic borrowing. By November
2016, the fiscal deficit was estimated at 4.3 percent of GDP. Meanwhile, Malawi’s level of debt has
also increased significantly in recent years. The total value of the public debt at the end of 2015 was
estimated at 53.8 percent of GDP. Of this amount, the total value of external debt stood at 37.0 percent
of GDP whilst the value of domestic debt was 16.8 percent of GDP. With increases in both domestic
and external debt, the cost of servicing the debt is also high. And although the total stock of external
debt is higher than that of domestic debt, the cost of servicing external debt is much lower, due to the
highly concessional terms on which most of Malawi’s foreign debt is contracted.
Table 2: Macroeconomic, Fiscal, and Health Financing Indicators: Malawi 2012-2016 2012 2013 2014 2015 2016
Macroeconomic Indicators
Nominal GDP USD (millions) 6,028.49 5,518.88 6,047.81 6,565.38
Real GDP USD, 2010 base (millions) 7,435.10 7,821.72 8,267.56 8,511.45
GDP per capita, constant 2010 USD 473.6 483.1 495.2 494.4
Real GDP growth rate (%) 1.9 5.2 5.7 2.8 2.5
Inflation (annual %) 21.3 27.3 23.8 21.9
Unemployment Rate 6.4
Fiscal Indicators
Gross Debt (% of GDP)* 40.2 50.6 48 53.8 52.1
Deficit (including grants) % of GDP^ -4.8 -0.5 -5.7 -5.7 -4.3
Total Government Revenue (% of GDP)^ 18.7 27.5 23.2 21.4 20.2
Domestic Revenue (% of GDP)^ 15.6 17.3 19.7 18.7 17.9
Tax revenue (% of GDP)^ 13.7 15.7 17.3 16.3 16.1
Non-tax revenue (% of GDP)^ 1.9 1.6 2.4 2.4 1.8
Total Government Spending (% of GDP)^ 23.5 28 28.9 27.1 24.4
Health Financing Indicators**
Total Health Expenditure per capita (average US$ ex. rates) 39.3 43.5 37.6 39.2
Donor Health Expenditure per capita (average US$ ex. rates) 29.9 30.8 24.5 21.7
Government Health Expenditure per capita (average US$ ex.
rates) 6.3 9.7 9.3 11.2
Total Health Expenditure (THE) % of GDP 9.0 11.6 11.3 11.1
Government Health Expenditure % of GDP 1.8 2.8 2.5 2.9
Government Health Expenditure % of THE 16.1 22.3 24.6 28.6
Government Health Expenditure % of Total Government
Expenditure 6.2 10.9 9.5 10.8
Household Expenditure % of THE 10.5 6.8 8.3 10.9
Data Sources: World Development Indicators except for: *Malawi Debt Sustainability Analysis;

10
^World Bank MFMod; **
Malawi National Health Accounts (MoH 2014; 2016b). Expenditure refers to the actual
amount of money spent.
2.4 Health Financing
21. Total health expenditure in Malawi increased by 29 percent from about US$520 million in
2009/10 to about US$670 million in 2014/15 (MoH 2104; 2016b). However, in per capita terms, total
health expenditure (US$ at average ex. rate) was equivalent to US$39.2 per annum14
in 2014/15 which
is significantly below the average of US$98 in SSA (excluding South Africa); and the average of
US$147 in the Southern African Development Community (SADC) region. Health financing in Malawi
is predominantly donor dependent, and over the period 2009/10-2014/15, development partners made
the largest contribution to total health expenditure at an annual average of 63 percent, followed by
Government at 23 percent, Households at 10 percent, and Employers and Local NGOs at 4 percent
(figure 3). In comparison with countries with the same level of income and those in SSA, external
financing on health as a proportion of total health expenditure in Malawi is higher (Table 3). In per
capita terms, total donor health expenditure was on average US$27 per capita per annum over the
period 2009/10-2014/15, as compared to Government total health expenditure which was only US$9
per capita per annum over the same period. This suggests that the bulk of health programmes in Malawi
are donor financed, and this renders health financing unsustainable and vulnerable to internal and
external shocks. For example, following revelations of financial mismanagement (known as the
“Cashgate scandal”) in 2013, several donors contributing to the health sector through the pooled
funding mechanism (including sector budget support) suspended/withdrew their funding. This
contributed to a considerable drop in donor expenditure as a proportion of total health expenditure from
63 percent in 2013/14 to 54 percent in 2014/15 (figure 3).
22. The Government, Employers, Local NGOs, and Households have responded to the reduced
funding by donors by increasing their expenditures but their contribution is inadequate.
Consequently, the health sector in Malawi is currently faced with liquidity problems, fragmentation of
funding, and reduction in programme implementation. While it was expected that Donors who stopped
channeling funds through the pooled funding mechanism would use alternate funding mechanisms,
evidence from Figure 3 suggests that the level of donor financing has declined. Considering that
measures to tighten fiduciary control systems and to regain donor confidence takes time, Malawi’s
health programme could be at risk if alternative measures to mobilize additional domestic resources are
not implemented urgently. As a matter of fact, even before the Cashgate scandal, health financing in
Malawi has been problematic and it had been recommended that Malawi needs to identify and
implement alternative options to finance the health sector (MoH, 2014).
14 Malawi has an Essential Health Package (EHP) which was costed at US$44.4 per capita in 2011. The EHP contains a total of 11 key public
health interventions to address the most common causes of mortality and morbidity in Malawi in a cost-effective manner. Given that total health expenditure per capita was estimated at US$39.4 in 2014/15, some scholars argue that is reflective of a financing gap since the EHP is
design to cater for a limited number of interventions. i.e. the US$44.4 per capita outlined in the EHP should be a subset of the total health
expenditure per capita (US$39.4).

11
Figure 3: Composition of Total Health Expenditure: Proportions and Nominal Figures
Data sources: Malawi National Health Accounts (MoH 2014; 2016b). Expenditure refers to the actual amount of money
spent.
Table 3: Health Expenditures: Malawi vs Sub-Sahara Africa and Low Income Countries - 2014
Govt. Health
Expenditure
(% of Total
Govt.
Expenditure)
Govt. Health
Expenditure
(% of GDP)
External
Funding on
Health (% of
Total Health
Expenditure)
Total Health
Expenditure
(% of GDP)
Total Health
Expenditure
per capita
(average US$
ex. rate)
Low income* 10.2 2.4 28.3 5.8 37.1
Sub-Saharan Africa**
(excl. high income)
10 2.3 11.2 5.5 97.6
Malawi^ 10.8 2.9 54.0 11.1 39.2
Data sources: *WHO Global Health Expenditure Database; **World Development Indicators; ^Malawi National
Health Accounts (MoH 2016b). Expenditure refers to the actual amount of money spent.
23% 22% 17%
23% 25%
29%
23%
61% 63%
69% 68% 63%
54%
63%
4% 4% 3% 2% 4% 6%
4%
13% 10% 11% 7% 8%
11% 10%
2009/10 2010/11 2011/12 2012/13 2013/14 2014/15 PERIOD AVERAGE
Government Donors
Employers & Local NGOs Households
2009/10
2010/11
2011/12
2012/13
2013/14
2014/15
Government 125,091 141,726 107,816 155,414 153,520 191,172
Donors 333,217 413,350 443,872 471,004 387,739 353,491
Employers & LocalNGOs
20,716 28,225 19,636 16,427 21,999 42,524
Households 68,462 68,152 72,782 47,183 51,613 73,100
0
50,000
100,000
150,000
200,000
250,000
300,000
350,000
400,000
450,000
500,000
US
$ '0
00

12
3. FISCAL SPACE ANALYSIS
23. The MoH in Malawi has made a commitment to achieve Universal Health Coverage (UHC)
by ensuring that services in the Essential Health Package (EHP) are available to all Malawians
(MoH, 2011). Government’s desire to achieving UHC is also enshrined in the Republican Constitution
which commits “to provide adequate health care, commensurate with the health needs of the Malawian
society and international standards of health care.” However, commitment to UHC is being threatened
by a health sector financing crisis in the country (Oxfam, 2016). For example, for a while now, Malawi
has substantially depended on donors to fund health services but the level of support is currently
dwindling. Low public spending on health results in high out-of-pocket (OOP) spending which in turn,
imposes financial barriers to accessing healthcare services and exposes individuals and households to
the potential for catastrophic expenditures when illness occurs (McIntyre and Kutzin, 2016). Recent
experiments by the government to scale up paying services and introduce bypass fees in secondary and
tertiary hospitals have generated resistance, led by civil society groups who are arguing that such
payments are having a catastrophic impact on the poor (Oxfam, 2016).
24. An important goal of UHC is to increase public spending on health so that there is less
dependence by the population on OOP payments to fund health services (McIntyre and Kutzin,
2016). In this context it becomes imperative that the limited resources are used most effectively to
attain the best possible outcomes for the country. It is important that the country engages in a
continuous process of priority-setting, which refers to a systematic approach to distribute resources
among competing demands to deliver a combination of activities and health programs that can be
afforded by the limited budget (Hauck et al. 2004). The country should also mobilize additional public
revenues in general, which would allow it to spend more money on public services and programs,
including health, a concept termed as fiscal capacity (ibid). However, the possibility of allocating a
greater share of resources to the health sector is affected by the existing fiscal space, which refers to the
ability of the government to devote more resources to the health sector without threatening the
sustainability of its financial position (Heller 2005). When the overall government budget is not
growing, it becomes increasingly difficult for the health sector to secure a greater share of expenditure
as doing so will imply a decrease in spending on other sectors.
25. This section examines the potential for increasing fiscal space for health in Malawi using an
established framework for assessing fiscal space in the health sector (Tandon and Cashin, 2010). This framework covers five pillars namely:
i. Conducive macroeconomic conditions including increased economic growth and overall
government revenue with possibilities of increased government expenditure on health;
ii. Re-prioritization of health within the government budget;
iii. Generating additional resources for the health sector through earmarked taxes, health insurance,
etc;
iv. Increased health sector-specific foreign aid; and
v. Improved efficiency in the government allocation and expenditure.
3.1 Conducive Macroeconomic Environment
26. From a macro-fiscal perspective, prospects for additional public resources for health are
limited (Section 2, Table 2). The country’s annual real GDP growth averaged 7 percent between 2006
and 2010, but dropped to 1.9 percent in 2012, rose to 5.7 percent in 2014, and then dropped to 2.8
percent in 2015. Real GDP growth for Malawi is projected at 2.5 percent in 2016, 4.2 percent in 2017,
and 4.5 percent in 201815
. Over the past five years, Malawi’s fiscal situation has also deteriorated
rapidly, leading to a fiscal deficit of 4.3 percent of GDP by November 2016; total public debt of 52.1
percent of GDP as at November 2016; and resurgent food and non-food inflation estimated at 27.0
percent and 15.9 percent, respectively, as at September 2016. While increases in GDP have generally
15 World Bank staff estimates using MFMod

13
led to increased government health spending, responsiveness of government health expenditure to GDP
growth over the period 2007/08-2014/15 was less than unitary. For example, over the period 2007/08-
2014/15, the elasticity of government spending with respect to GDP growth in Malawi is estimated at
0.87 (figure 4). This means that on average, a 1 percent increase in GDP growth yields a 0.87 percent
increase in government health spending. Considering that the elasticity of government spending to GDP
growth is estimated at 1.16 on average for low-income countries (Tandon and Cashin, 2010),
responsiveness of government expenditure to GDP growth in Malawi is relatively low.
27. At 16.1 percent of GDP, tax revenue as a percentage of GDP in Malawi is above the average
of 15.8 percent for SSA (excl. high income countries). While this performance is good, an arbitrary
but often suggested benchmark is for the share of tax revenue to GDP to be 20 percent. If this happens,
existing evidence suggests that an additional $US28 per capita per annum could be raised by low
income countries such as Malawi16
. But tax shares of 20 percent of GDP may be difficult to achieve
given the limited tax administrative capacity in Malawi. Tax administration is relatively inefficient and
this contributes to a narrow tax base, high taxation, and low revenue yield. For example, in comparison
to its neighbours and other low-income countries, Malawi depends heavily on income taxes (IMF
2016a). To remedy the situation, the Malawian Government is in the process of reviewing the tax
system with the aim of broadening the tax base, rationalising tax incentives, improving the tax refund
system, harmonizing tax administration procedures, and introduction of a tax appeals tribunal to
expedite resolution of tax disputes (MoFED, 2016). The proposed tax reforms are in line with the
requirements of the 2012 Extended Credit Facility from the IMF which implores the Malawian
government to increase revenues to a minimum of 1–1.5 percent of GDP over a 3–5 year period. If
these revenue gains are realized, and assuming that the health share of the government budget either
increases or remains at the current 10 percent, this could potentially lead to additional fiscal space for
health. However, given the current weak macro and fiscal position in the country, the degree to which
economic growth can be translated into increased resources for health in Malawi is limited.
Figure 4: Elasticity of Health Expenditures to GDP in Malawi: 2007/08- 2014/15
Data sources: MoH, 2014; and MoH, 2016b
16 Background Paper for the First Universal Health Coverage (UHC) Forum: Raising Funds for Health
0.34
0.87
-0.09
-0.20
0.00
0.20
0.40
0.60
0.80
1.00
Income elasticity of Total Health Expenditure Income elasticity of Govt Health Expenditure
Income elasticity of Donor Health Expenditure

14
3.2 Re-prioritization for Health
28. Government health expenditure17
as a percentage of total government expenditure grew
from 6.9 percent in 2009/10 to 10.8 percent in 2014/15 (period average 8.5 percent). The 2014/15
figure is below the Abuja target of 15 percent but comparable to the SSA average of 10 percent and low
income countries’ average of 10.2 percent (Table 3). This suggests that the Malawian Government is
performing relatively well in this aspect. However, comparing the share of Government spending on
health with other key sectors (figure 5), shows higher expenditure shares in the education and
agriculture sectors; ranging from 12-18 percent (period average of 15 percent) and 13-22 percent
(period average of 16.6 percent) of total government expenditure, respectively, over the period 2009/10
and 2014/15. This suggests that the share of Government expenditure on Education in Malawi is
relatively similar to the spending norms in low income countries and the SSA region, estimated at 16.7
percent and 16.6 percent, respectively18
. On the other hand, the share of Government expenditure on
Agriculture in Malawi is more than twice the SSA average of 6.3 percent, and three times more than the
African average of 5 percent (Fan et al. 2009). The share of Government expenditure on Agriculture in
Malawi is also far above the 10 percent Maputo target (ibid). This is no surprise, however, given the
importance of agriculture to economic development in Malawi. As stated earlier, agriculture is the main
source of Malawi’s economic growth contributing about 29 percent of Gross Domestic Product and
over 76 percent of total export earnings in 201519
. Therefore, growth in agriculture provides a key
means for poverty reduction, good health and nutrition, and overall economic growth. Furthermore, the
high expenditure on agriculture could also be attributed to increased expenditure on the humanitarian
crisis due to consecutive years of adverse weather conditions (World Bank, 2017).
29. Government and Total Health Expenditures as a share of GDP at 2.9 percent and 11.1
percent, respectively, are above the average for low-income countries and SSA (figure 6). More
importantly, in Malawi, GDP growth is associated with increased government health spending as
demonstrated in Figure 4 above. However, Government’s contribution to total health expenditure in
absolute terms is low. For instance, Government per capita health expenditure (in nominal terms) only
increased from US$9.0 in 2009/10 to US$11.20 in 2014/15. In other words, Government’s contribution
to the US$39.2 per capita total health expenditure in 2014/15 was less than one-third. The bulk of the
financial resources in the health sector in Malawi are provided by external development partners who
contributed an average of US$27 per capita per annum over the period 2009/10-2014/15. Nonetheless,
62 percent of the external resources are earmarked for the provision of HIV/AIDS, Malaria, and
Reproductive Health (RH) services which makes it difficult to re-prioritize (MoH, 2016b); and to fund
other components of the EHP.
30. Our analysis suggests that Government spending on health is already high, and it would be
difficult to re-prioritize the Government budget given the unfavourable macro-fiscal environment
and competing demands from other sectors. With a low GDP per capita (US$494.40 in 2014/15),
Government per capita health spending in absolute terms (US$11.20 in 2014/15) is also low but in line
with Government’s spending capacity. As highlighted in Section 2, Government continues to run a
large fiscal deficit with expenditure under pressure due to a rising cost of debt service, increasing wage
demands, high cost subsidy schemes, and the need to settle outstanding arrears. Henceforth, prospects
for increasing fiscal space for health by increasing the share of the Government budget on health seems
limited in the short-to-medium term. And while external financing is the largest source of financing in
the health sector, a large amount is already earmarked for three diseases leaving the other components
of the health system largely unfunded.
17 This refers to the actual amount of domestically generated government resources spent on health 18 Statistics obtained from World Development Indicators 19 Ministry of Finance, Economic Planning and Development

15
Figure 5: Distribution of Total Government Expenditures by key sectors
Data Source: Ministry of Finance. Expenditure refers to the actual amount of money spent.
Figure 6: Government and Total Health Expenditures (% of GDP): 2014
Data Sources: Malawi data was obtained from Malawi’s National Health Accounts (2016b). Other data from
WHO Global Health Expenditure Database
3.3 Generating Additional Resources for Health
31. The GoM has instituted some health reforms aimed at increasing access to quality services
through increased domestic financing to the health sector, service availability, and equity. The
process consists of four reforms as follows: (1) Establishing a health insurance scheme; (2) Creating a
Health Fund; (3) Decentralizing district and central hospital level service provision; and (4) Reviewing
institutional arrangements between the GoM and CHAM. To date, the feasibility of establishing a
Health Fund has been reviewed and finalised as documented in the later parts of this document. Our
analysis shows that additional money could potentially be raised for health from a dedicated medical
levy on fuel through the existing rural electrification and fuel storage levies, and introduction of a tax
on motor vehicle insurance (Table 10, Section 5). If all the viable earmarked taxes are introduced as
analyzed in the later parts of this paper, an additional US$0.63 per capita per year could be raised over
the period 2016/17 to 2021/22. However, this amount would only make a small contribution to
expanding financing for health.
7% 7% 8%
10% 9%
10%
12%
15% 14%
16% 15%
18% 17%
14% 13%
17% 17%
22%
2009/10 2010/11 2011/12 2012/13 2013/14 2014/15
Health Education Agriculture
2.4
5.8
2.3
5.5
2.9
11
.1
G O V T . H E A L T H E X P ( % O F G D P ) T O T A L H E A L T H E X P ( % O F G D P )
Low income Sub-Saharan Africa (excl. high income) Malawi

16
32. Regarding the proposed establishment of a national Social Health Insurance (SHI) scheme in
Malawi, the prevailing demographic, macro-economic, and employment situation are
unfavourable. Firstly, a large share of the total employed persons in Malawi (89 percent) is engaged in
informal employment (NSO, 2014). Given that SHI is often contributory, whereby both employees and
employers pay premiums towards the SHI scheme through mandatory payroll deductions, evidence
shows that collecting contributions from the informal sector is often difficult (Wagstaff, 2007).
Therefore, people working in the informal sector in Malawi who are mainly associated with low wages,
low productivity, and poverty may not enroll in the SHI scheme due to lack of finances. Other studies
also show that informality increases when social protection programs such as SHI are introduced.
Secondly, wages in the formal sector are low (mean and median wages of US$113 and US$37,
respectively, (NSO, 2014)), with some studies further suggesting that the real average wages are
actually more than 50 percent lower in value (DTUC, 2015). Low wages in the formal sector also make
it hard for the majority of Malawians to meet monthly expenses. For example, 40 percent of Malawians
have just enough income to meet expenses, 13 percent need to supplement their incomes with savings
to meet expenses, and 27 percent need to supplement their incomes with borrowed money to meet
expenses (NSO, 2012). Consequently, Malawi has a large pool of “working poor” and the smallest
middle classes in SSA, with only 4 percent living for US$2-4 a day and 5 percent for US$4-20 a day,
compared to the SSA average of 14 percent who live for US$2-4 a day and 10 percent for US$4-20 a
day (DTUC, 2015). Lastly, considering that the SHI scheme would need to be supplemented with
additional resources beyond the contributions from the employers and employees, the government may
not have means to raise additional money from alternative means.
33. Given the above, there is limited potential for health insurance growth in Malawi. Health
insurance as a proportion of Total Health Expenditure was estimated at 3.3 percent in 2014/15 (MoH,
2016b), and by the end of 2015, only 1.2 percent20
of the Malawian population had any form of health
insurance cover through private health insurance, corporate, and other risk-pooling schemes. In
summary, our analysis supports the views of the MoH (2014) which identified the small size of the
formal sector, low wages in the formal sector, widespread poverty in the general population, and
predominance of the “free public health care system” as the main factors inhibiting the growth of the
health insurance market in Malawi.
3.4 Increased Health Sector-specific Foreign Aid
34. The health sector in Malawi has over the years been reliant on external financing but this
support has been declining over the years particularly after the Cashgate scandal. External
financing as a share of Total Health Expenditure (THE) rose from 61 percent in 2009/10 to 69 percent
in 2011/12 after which it started declining (figure 3). From 2012/13 onwards, the proportion of external
financing to THE has been declining consistently but the most notable decline was recorded post
Cashgate from 63 percent in 2013/14 to 54 percent in 2014/15 (figure 3). In absolute terms, external
financing declined by 18 percent in 2013/14 and 9 percent in 2014/15 (figure 7) which represents a total
reduction of US$118 million or an annual average of US$3.7 per capita between 2013/14 and 2014/15.
At macro level, there has also been a loss of budget support and reduced confidence in the use of
Government systems. Given the low levels of on-budget foreign financing at levels previously available
to Government, authorities continue to borrow heavily from domestic sources to close the gap. This
creates risk of further pushing up inflation and lending rates, crowding out private sector investment
and constraining economic growth. As most of the public health commodities are externally financed,
Malawi is exposed to high dependence and vulnerability to external shocks (World Bank, 2013).
Examples are in 2011/12 when the donors only released 25 percent of the pledges following the global
financial crisis, and a decline in external financing in 2013/14 and 2014/15 after the Cashgate scandal.
20 Authors’ calculation based on annual subscriptions through the Medical Aid Society of Malawi and Metropolitan Health Malawi which have over 95 percent of the health insurance market in Malawi. These schemes mostly cover formal sector employees in parastatals and industrial
companies; groups; individuals; and families. Informal sector workers and the general population rely on the public health service, traditional
healers, and out of pocket payments.

17
35. The other challenge is that the bulk of external resources are earmarked for the provision of
HIV/AIDS, Malaria, and Reproductive Health (RH) services which makes it difficult to re-
prioritize (figure 7). HIV/AIDS (35 percent), Malaria (16 percent), and RH (11 percent) consumed an
average of 62 percent of the total external health expenditure between 2012/13 and 2014/15 (MoH,
2016b); and this creates rigidities in resources allocation. In particular, earmarking donor funding to
disease programmes reduces government’s flexibility in resource allocation, and ability to re-prioritize
funding to emergent needs. In addition, donor resources are uncertain and commitments are made for
short periods and this makes it difficult to implement sustainable long-term strategies. Furthermore, a
large amount of financial resources in the health sector (45 percent) are managed by development
partners and NGOs (Table 4).
36. Our analysis suggests that external financing for health in Malawi is already high and
chances of further expansion are limited on account of the declining trend in recent years. In
particular, external financing declined by US$118 million in two years or annual average of US$3.7 per
capita over the period 2013/14-2014/15. Therefore, given the importance of external financing to
Malawi, emphasis should be on mitigating further decline in external financing.
Figure 7: Trends in External (Donor) Health Expenditure – US$ millions
Data source: Malawi National Health Accounts (2016b). Expenditure refers to the actual amount of money
spent.
Table 4: Financing Agents by share of Total Health Expenditure
2012/13 2013/14 2014/15 Average
Government 48% 42% 41% 44%
Donors and NGOs 44% 47% 45% 45%
Households 7% 8% 11% 9%
Other 2% 3% 3% 3% Data source: Malawi National Health Accounts (MoH 2014; 2016b).
3.5 Improved Efficiency in the Health Sector
37. In several countries, a huge amount of health expenditure is lost due to waste and other
forms of inefficiency. Achieving more with the available resources can lead to increased coverage,
provision of quality health care, financial protection, and improved health outcomes21
. To understand
the status of efficiency in the health sector in Malawi, we conducted a comprehensive literature review
21 Background paper – Second Annual UHC Financing Forum
25
7
28
4
33
6
33
3 41
3
44
4
47
1
38
8
35
3
11% 18% -1% 24% 7% 6% -18% -9%
Total External Expenditure on Health
Annual Change in Donor Expenditure
180 120 123
75
65 57
49
43 40
167
160 133
2 0 1 2 / 1 3 2 0 1 3 / 1 4 2 0 1 4 / 1 5
E x p e n d i t u r e B y D i s e a s e
HIV/AIDS & STIs Malaria
Reproductive Health Other Diseases

18
of studies on efficiency in Malawi. Based on the results from the literature review, we then calculated
the total potential per capita efficiency saving for Malawi covering all the four (4) main sources of
inefficiencies in the health sector22
. This analysis was done using Chisholm and Evans’ (2010)
framework for analyzing efficiency. However, given the considerable uncertainty associated with using
global estimates when calculating the cost of health sector inefficiencies, this analysis only indicative.
A dedicated study should be conducted to examine in detail, sources of inefficiencies, ways of
addressing them, and potential savings. Priorities for further analysis of efficiency could include: health
financing and health systems organization, drug supply and use, and health services provision.
38. Malawi is widely acknowledged in the literature as a good performer in maternal and child
health coverage; and financial protection despite its low level of per capita public spending on
health (Jowett et al. 2016). Other scholars further observe that programmatic focus on the most cost-
effective interventions have contributed to improvements in child health outcomes in Malawi (Kanyuka
et al. 2016; World Bank; 2013). However, other studies have highlighted significant inefficiencies in
the health sector in Malawi which could be addressed to increase fiscal space. This includes the
2009/10−2011/12 and 2012/2013–2014/2015 National Health Accounts (NHA) surveys, the 2013
Public Expenditure Review, HIV/AIDS efficiency studies, hospital efficiency studies, and a dedicated
analysis on Health Sector Efficiency in Malawi by Carlson et al. (2014).
39. Part of the underlying causes for inefficiencies in the health sector in Malawi is lack of
compliance to the rules and systems governing the management of public funds (Carlson et al.
2014). For example, there have been several cases of corruption and mismanagement of funds in the
health sector (i.e. the 2013 Cashgate scandal), and pilferage of medicines. Other analyses highlight
several allocative and technical inefficiencies which can be attributed to the absence and/or inadequate
use of a needs-based resources allocation formula, low budget execution, and continued use of an input
based financing mechanism rather than an output based financing mechanism (MoH, 2014; World
Bank, 2013). For example, analysis of the Government health budget by factors of provisions shows
that the allocation to wages (including salaries and other personal emoluments) was 49 percent on
average over the period 2009/10-2016/17 (figure 8). For the overall public sector, the wage bill as a
share of GDP increased from 5.7 percent in 2012/13 to 6.4 percent in 2016/17, and this raises questions
on its sustainability (World Bank, 2017). Increase in the public sector wage bill could be as a result of
an increase in the number of public workers from 111,000 in 2008 to 186,000 in 2016; and weaknesses
in establishment and personnel controls which have made the payroll vulnerable to fraud (ibid).
40. Allocation to drugs and medical supplies averaging 13 percent between 2009/10 and 2016/17
is far below the spending norms in other African countries. Bennett et al. (1997) show that
expenditure on drugs as a percentage of total government health spending in Africa is about 33 percent.
Furthermore, the percentage of Government recurrent expenditures attributable at district level
increased from 48 percent in 2010/11 to 60 percent in 2014/15; while there was a decline at Central
Hospitals from 15 percent in 2010/11 to 9 percent in 2014/15; and at MoH headquarters from 37
percent in 2010/11 to 31 percent in 2014/15. The underlying cause of these inconsistencies in the
allocation of resources is due to of lack of an optimal resource allocation formula.
41. An assessment of technical efficiency at 40 district-level public and mission hospitals in
Malawi shows that only 27.5 percent of the hospitals had desirable bed turnover ratios (patients
per bed), and bed occupancy rates (Asbu et. al., 2012). And despite a large number of hospitals
having a low bed density, there is a gross underutilization of the existing supply of inpatient beds, with
public primary level hospitals performing better in comparison to mission hospitals (ibid). This could
be attributed to demand-side barriers (e.g. financial, geographical, or cultural) that negatively influence
the utilization of hospital services (World Bank, 2013). Absence of equipment, health workers, and
drugs could also explain the low utilization of hospitals and other health facilities in Malawi (ibid). At
disease level, studies analyzing the delivery of the HIV/AIDS programme in Malawi suggests that 11
percent of the current expenditure on HIV/AIDS could be saved with improved efficiency in HIV/AIDS
22 The areas are: Health care workers, Hospital services, Health system leakages, and Health care services

19
spending (Kardan et al. 2012). Specifically, efficiency gains could be made by streamlining service
delivery modalities in the provision of ART, HIV Counselling and Testing, and ANC and laboratory
services (World Bank, 2015).
42. As observed from the literature review above, improving efficiency of health spending in the
health sector in Malawi is paramount given that most of the alternative avenues for increasing
fiscal space for health are limited. Using Chisholm and Evans’ framework for analyzing efficiency,
we calculated the total potential per capita efficiency saving for Malawi. This was done by multiplying
the estimated minimum low-income group potential efficiency saving rates (as a percentage of total
health spending) by the 2014/15 total per capita health expenditure for Malawi. The low-income group
potential efficiency saving rates were adopted from Chisholm and Evans (2010). These results are
presented in Table 5, and they show that it is probable to raise US$10.6 per capita per annum through
efficiency improvements. This is more than the US$0.63 per capita per annum that could be raised if
the targeted earmarked taxes for health are introduced. Evidence from other studies on expected
efficiency savings in Africa show a median potential efficiency gain of US$8 per capita per annum
(Mathonnat cited by Barroy et al. 2016).
43. The other way of assessing efficiency in resource utilization is by reviewing budget
performance or execution by looking at compliance to disbursing budgeted resources on time and
according to the allocated amounts. A study by the World Bank (2017) shows low predictability and
execution of the government budget due to diminishing resources at macro level, and persistently large
fiscal deficits. To further validate these findings, we reviewed the performance of the public budget
over the period 2011/12-2015/16, and observed that at national level expenditures have been above the
budget except for 2015/16. On the other hand, recurrent public health expenditures over the same
period have been below the budget except for 2012/13 and 2013/14. Over expenditure at national level
leads to huge budget overruns, which makes it difficult for the government to release the full health
budget according to the agreed timelines. On the other hand, utilization of external funding allocated
through the public system is low and this also affects health service delivery. For example, the
utilization of health funding from the Global Fund is below the planned utilization levels.
44. Given the above, there are several opportunities to improve the efficiency of government
health expenditures in Malawi that could ultimately increase fiscal space for health. Carlson et al.
(2014), the MoH (2014) and World Bank (2013) provide several options for improving technical and
allocative efficiency in the health sector. This includes: (i) Strengthen the public finance management
system; (ii) Transformation of budget management processes; (iii) Enhancing accountability and
oversight functions; (iv) devolution and/or contracting-out of hospital management; (v) Creation and/or
strengthening of public-private partnerships in the health sector. This includes continued partnership
with CHAM for the provision of health services in underserved areas; and (vi) Identification and
provision of appropriate demand-creating interventions to increase the utilization of hospital services.

20
Table 5: Sources of inefficiency in Malawi’s health sector and Potential Savings Per Capita
(US$)23
Source of Inefficiency Evidence of inefficiency (illustrative studies) Potential
Efficiency Savings
Per Capita (US$)
Health care workers
The overall public sector wage bill as a share of
GDP increased from 5.7% in 2012/13 to 6.4% in
2016/17 which raises questions on its
sustainability (World Bank, 2017). Increase in
the public sector wage bill could be attributed to
weaknesses in establishment and personnel
controls which have made the payroll vulnerable
to fraud (ibid).
Government allocation to wages as a share of
total government health budget was 49%
between 2009/10 and 2016/17 (Ministry of
Finance data)
Expenditure on wages increased from US$47.6m
in 2012/13 to 50% US$95.8m in 2014/15 (MoH,
2016b).
3.1
Hospital services
Low turnover and bed occupancy
rates at district level public and
mission hospitals
Assessment of technical efficiency at 40 district
hospitals shows that only 27.5% of the hospitals had
desirable bed turnover ratios, and bed occupancy
rates (Asbu et. al., 2012).
1.6
Health system leakages
Corruption and fraud
There have been several cases of corruption and
mismanagement of funds in the health sector such as
the US$32m Cashgate scandal24
, and several cases of
pilferage of medicines25
roughly estimated at that
US$7.4m annually
2.0
Health care services
Sub-optimal intervention mix, and
poor quality of care
Inefficiencies in the provision of ART, HIV
Counselling and Testing, ANC and laboratory
services (World Bank, 2015). Absence and/or
inadequate use of a needs-based resources allocation
formula, low public budget execution, and continued
use of an input-based financing mechanisms (MoH,
2014; World Bank, 2013; 2017).
3.9
TOTAL 10.6
Figure 8: Breakdown of Government Health Budget by Key Line Items
Data Source: Ministry of Finance
23 Analytical framework and estimates on potential efficiency savings adapted from Chisholm and Evans (2010) 24 http://www.economist.com/blogs/baobab/2014/02/malawi-s-cashgate-scandal 25 http://www.aidspan.org/gfo_article/drug-theft-serious-threat-malawi%E2%80%99s-health-system
32% 40%
58% 42%
67% 62% 51%
42% 49%
16% 14%
11%
15%
8% 13%
11% 14%
13% 22%
22%
11%
13%
10% 11%
1% 10% 13%
29% 24% 20% 30%
15% 13%
37% 34% 25%
2 0 0 9 / 1 0 2 0 1 0 / 1 1 2 0 1 1 / 1 2 2 0 1 2 / 1 3 2 0 1 3 / 1 4 2 0 1 4 / 1 5 2 0 1 5 / 1 6 2 0 1 6 / 1 7 A V E R A G E
Wages Drugs & Medical Supplies Capital Other Recurrent Expenses

21
Table 6: Summary – Analysis of Fiscal Space for Health in Malawi
Pillar Current Status
Prospects for
Increasing
Fiscal Space
1. Conducive
macroeconomic
environment
Real GDP growth averaged 7% between 2006 and 2010, but
dropped to 2.8% in 2015. Real GDP growth is projected at
2.5% in 2016, 4.2% in 2017, and 4.5% in 2018
Tax revenue as a share of GDP estimated at 16.1% in 2016 is
above the average of 15.8% for SSA (excl. high income
countries). But this is below the arbitrary but often suggested
benchmark for the share of tax revenue to GDP to be 20%. If
this happens, existing evidence suggests that an additional
$US28 per capita per annum could be raised by low income
countries such as Malawi. But a tax share of 20% of GDP
may be difficult to achieve given the limited tax
administrative capacity in Malawi.
By November 2016, fiscal deficit was 4.3% of GDP; total
public debt at 52.1% of GDP; and food and non-food
inflation at 27% and 15.9%, respectively, as at September
2016
Elasticity of government spending with respect to GDP
growth is estimated at 0.87
Government Health Spending (% of GDP) was 2.9% in
2014/15
The Government is in the process of reviewing the tax system
with the aim of improving tax administration procedures and
broadening the tax base
Limited
2. Re-
prioritization
for health
Government health expenditure (% of total government
expenditure) at 10.8% in 2014/15 is lower than the Abuja
target of 15%. However, this is similar to the spending norms
in sub-Saharan Africa and low income countries’. This
suggests that the Malawi is performing relatively well in this
aspect
Compared to the health sector, Government expenditures in
the education and agriculture sectors are higher (period
average of 15% and 16.6%, respectively, over the period
2009/10-2014/15). For the education sector, this trend is
similar to peer countries; while for agriculture it is much
higher but justifiable
Government and Total Health Expenditures as a share of
GDP at 2.9% and 11.1%, respectively, are above the average
for low-income countries and SSA. This suggests that
Government’s spending on health in Malawi is already high
Notwithstanding the above, in absolute terms, Government
health expenditure per capita of US$11.20 in 2014/15 is less
than one-third of the country’s total health expenditure per
capita of US$39.2 in 2014/15
Donors contribute an average of US$27 per capita per annum
but 62 percent of the donor funding is spent on three diseases
(HIV/AIDS, Malaria, and Reproductive Health). Thus,
funding the other components of the EHP is still a major
challenge
Limited
3. Generating Currently, there is no earmarked taxes for health. Introducing Limited

22
Pillar Current Status
Prospects for
Increasing
Fiscal Space
additional
resources for
health
three (3) earmarked taxes as analyzed in the later parts of this
paper would only generate an additional US$0.63 per capita
per year over the period 2016/17 to 2021/22
Prevailing macro-fiscal and labour environment are not
conducive to implement a SHI scheme
- 89% of total labor force in informal employment
- Low wages in the formal sector, mean and median of
US$113 and US$37, respectively
- Large pool of “working poor” and the smallest middle
class in SSA. Only 5% live for US$4-20 a day,
compared to the SSA average of 10%
Only 1.2% of the population had some form of health
insurance cover through private health insurance, corporate
and other risk-pooling schemes in 2014/15
Health insurance as a proportion of Total Health Expenditure
was estimated at 3.3% in 2014/15
Absence of regulation on health insurance
4. Increased
health-sector
foreign aid
External financing estimated at 63% of THE (or US$27 per
capita per annum) over the period 2009/10-2014/15 is the
main source of health financing in Malawi
However, in recent years (2013/14-2014/15), there has been a
notable decline in external health financing. The annual rate
of reduction in external financing was US$3.7 per capita per
year between 2013/14 and 2014/15. The most significant
decline was after the ‘Cashgate’ scandal by 18% in 2013/14
and by 9% in 2014/15. As such, it is critical for Government
to mitigate further loss of external financing as the country
endeavours to overcome the current macroeconomic
challenges.
While foreign aid programmes are compatible with country
needs/priorities; 62% of the total external resources are
earmarked for 3 diseases [HIV/AIDS (35%), Malaria (16%),
and RH (11%)]. This makes it difficult to for Government to
re-prioritize external funds to other priority programmes.
Limited

23
Pillar Current Status
Prospects for
Increasing
Fiscal Space
5. Improved
efficiency in the
health sector
Government and Total Health Expenditures as a proportion of
GDP are higher than other peer countries and the SSA region
On average, 49% of the Government health budget was
allocated to wages between 2009/10 and 2016/17
Overall public sector wage bill as a share of GDP increased
from 5.7% in 2012/13 to 6.4% in 2016/17. This could be
attributed to weaknesses in establishment and personnel
controls which have made the payroll vulnerable to fraud.
Allocation for drugs and medical supplies at 13% on average
over the period 2009/10-2016/17 is low
There is inconsistency in the allocation of public resources
- Percentage of Government recurrent expenditures
attributable at district level increased from 48% in
2010/11 to 60% in 2014/15; but declined at Central
Hospitals from 15% in 2010/11 to 9% in 2014/15; and
at MoH headquarters from 37% in 2010/11 to 31% in
2014/15
Inconsistency in the allocation of public resources could be
due to absence of an objectively defined or needs-based
resource allocation formula
Predictability and execution of the public health budget is
low while financial disbursements are input-based rather than
results-based
High technical inefficiencies at public and mission hospitals
at district level. This includes low turnover and bed
occupancy rates
Though key public health interventions are covered, coverage
is limited and quality is poor
Relatively high degree of corruption and mismanagement of
funds due to limited compliance to the existing public finance
management system
About US$10.6 per capita per annum could be raised through
efficiency improvements in Malawi. This is comparable to
evidence from other studies in Africa which show a median
potential efficiency gain of US$8 per capita per annum
Good

24
4. ANALYSIS OF PROPOSED AREAS FOR EARMARKED TAXATION
4.1 Methodology
45. This part of the study examines in detail, potential for generating additional resources for
health with focus on earmarked taxes for health. In sub-section 4.2, a literature review was
conducted to gather information on the advantages and disadvantages of hypothecating (earmarking)
tax revenue for health. In sub-section 4.3, expert opinion on earmarked taxes for health in Malawi is
provided. The information was generated by conducting in-depth interviews and discussions with key
stakeholders aimed at obtaining expert advice on the most feasible areas for earmarked taxation before
further analysis. These areas were drawn from a report by MoH and Abt Associates (2015) on the
proposed establishment of a Health Fund. In-depth interviews were held with key officials from the
MoH; Ministry of Finance, Economic Planning and Development; Ministry of Natural Resources,
Energy and Mining; Extractive Industries Transparency Initiative (EITI) Secretariat; MRA; Reserve
Bank of Malawi; Tobacco Control Commission; National Statistical Office; University of Malawi
(Chancellor College); USAID (Abt Associates); development partners; and Road Accident Fund of
South Africa. The Vice President’s Office also provided guidance by anchoring discussions across the
four (4) main health reform areas. To achieve greater certainty, data that was generated from the key
informant interviews was validated by documents reviews and raw data that was obtained from several
key institutions. The institutions were: the MoH, Ministry of Finance, EITI Secretariat, MRA, Reserve
Bank of Malawi, Tobacco Control Commission, National Statistical Office, Inspector General of Police,
Directorate of Road Traffic; and the International Monetary Fund. Triangulating evidence from regional
and international studies was also used to gauge the quality of the evidence in line with Malawi’s
country context and best practices.
46. Data from the various experts was grouped, and each of the proposed areas for earmarking
was evaluated using an agreed-upon inclusion criteria. The criteria was: revenue generation
capacity, health promotion potential, political feasibility, consumer acceptability, and perceived effects
on businesses and trade. Based on the information gathered from the experts and document reviews,
seven (7) of the twelve (12) initially identified areas were eliminated. As such, revenue forecasts have
only been provided for five (5) areas. These results are presented in sub-section 4.4 and the Annexes.
Revenue projections were made covering the period 2016/17 to 2021/22 based on the effective tax rate
forecasting approach. The Effective Tax Rate (ETR) is calculated as Tax Revenue (TR) divided by Tax
Base (TB); which can be rearranged to TR=TB*ETR (Bova, 2013). To forecast TR, therefore, there is
need to forecast: (i) TB and (ii) ETR. For ETR, the study relied on a report by MoH and Abt Associates
(2015) which proposes three (3) different tax rates for each of the identified areas as reflected in Table 7
below. Application of the different tax rates also made it possible to gauge the sensitivity and/or
variations in the TB and expected revenue with each change in the tax rate.
Table 7: Proposed Tax Rates
Earmarked Tax Low Medium High Tax Base
1. Proposed medical
levy from existing
fuel levies
MK8.43/litre
(10% or K3.43/litre
from MAREP plus
MK5.00/litre from
Storage Levy)
MK11.87/litre
(20% or K6.87/litre
from MAREP plus
MK5.00/litre from
Storage Levy)
MK15.30/litre (30%
or K10.30/litre from
MAREP plus
MK5.00/litre from
Storage Levy)
Litres of fuel
2. Motor Vehicle
Insurance
3% 6% 9% Gross Premiums
3. Extractives 1% 2% 3% Production Value
4. Alcohol 10% 20% 30% Sales Revenue
5. Tobacco 10% 20% 30% Sales Revenue

25
47. For TB, the conditional techniques which assume that the variable to be forecast (TB in this
case) is conditional on other variables (e.g. GDP, imports, consumption) were used. For fuel levies
(rural electrification and storage), the TB is demand for fuel in litres and the projections were made
using the following formula:
TBt = TBt-1 * [(rYt/rYt-1-1)*100%]
where TBt is the demand for fuel in current year; TBt-1 is demand for fuel in previous
year; rYt is real GDP in current year; and rYt-1 is real GDP in previous year. The basic
assumption is that the demand for fuel is proportional to growth in national income.
48. For alcohol and tobacco, the study assumed that the TB is sale revenues; for extractives the
TB is the production value; and for motor vehicle insurance the TB is gross premiums. The
increase in all these bases is usually either due to demand, price level or both elements. As such, the
projection for these bases applied the following formulae:
TBt= TBt-1*[(nYt/nYt-1-1)*100%]
where TB is tax base (separate for each item) and nY is nominal GDP while t and t-1
represents current year and previous year, respectively.
49. Forecasting of the various TBs also required that we have projections for real GDP (Yt) and
nominal GDP (nYt), and the study utilizes forecasts using MFMod prepared by the World Bank.
This is because World Bank projections use robust data and models which are generally more
acceptable on the global scene. Thus, real GDP growth for Malawi is projected at 2.5 percent in 2016,
4.2 percent in 2017, and 4.5 percent in 201826
. For conversions from Malawian Kwacha to US dollars,
the rate was: US$1=MK721.07 as at 12th October 2016. This is a mid-point rate which was obtained
from the Reserve Bank of Malawi (http://www.rbm.mw/Statistics/MajorRates).
4.2 Arguments for and against hypothecating (earmarking) tax revenue for health 50. There are various arguments in favour and against earmarked taxes. Cashin (2016)
27 defines
earmarking for health as “targeting new or existing streams of revenue for health systems, programs,
priorities, and/or populations” and maps about 85 countries worldwide which are currently earmarking
revenues for health. Earmarked revenues for health are most often derived from contributions or taxes
such as tobacco and alcohol taxes, fuel levies, VAT, lotteries, foreign personal money transfers, mobile
phone company turnover, etc (ibid). For earmarked taxes, the common feature is that tax payers know
what the Government will spend the money on, and this promotes accountability and trust for public
spending (Doetinchem (2010). In the health sector, earmarked taxes are commonly referred to as ‘sin
taxes’ because they are specifically levied on goods deemed harmful to society, such as alcohol,
tobacco, soft drinks, fast foods, coffee, fuel etc. Other than discouraging the consumption of unhealthy
foods or substances, earmarked ‘sin taxes’ for health also have the advantage of raising funds for the
health sector. For example, the Center for Global Development argues strongly for the introduction of
tobaccos taxes in developing countries which they consider to be the ‘single best health policy’
(Savedoff and Alwang, 2015). Their main argument is that tobacco taxes are very cost-effective, save
lives, and can increase government revenues while at the same time save poor households money when
their family members quit smoking (ibid). The other argument for earmarked taxes for health is that the
revenue generated can be ring-fenced and used for the intended purpose due to high public support for
such spending, and citizen’s trust that their government will spend the money on services highly
beneficial to society (Doetinchem, 2010).
26 World Bank staff estimates using MFMod 27
Accessed online from http://www.r4d.org/blog/2016-01-28/earmarking-safe-bet-finance-health on 3rd January 2017

26
51. Notwithstanding the above, Ministries of Finance in most countries are usually reluctant to
introduce earmarked taxes because they limit flexibility in allocating resources across sectors,
and according to national priorities. Appleby and Boyle (2000) further argue that earmarking can
undermine equity in resource allocation because governments are not able to fairly distribute costs
across different sectors. Furthermore, earmarking has also been critiqued for determining health
spending by how much a tax raises rather than on the health needs of the population (ibid). This could
lead to wasteful expenditures when the tax base is buoyant, and insufficient budgets when the economy
and/or tax base is depressed (ibid). Earmarked taxes can also be regressive if not well designed or
targeted. For example, Remler (2004) shows that cigarette taxes heavily burden poor smokers who do
not quit, no matter how the tax burden is assessed. Critics further argue that taxing price inelastic goods,
especially those which are addictive, is highly likely to impoverish consumers than limit consumption
(Snowdon, 2012). The other challenge is that the MoH may find it difficult to request for supplementary
funding when budgeted resources are exhausted because the treasury may argue that the MoH has its
own pool of earmarked funds. On the other hand, revenues from earmarked sources may not be
additional in the medium to long term because the Ministry of Finance could reduce the general health
budget allocation by the corresponding amount of revenue realized from earmarked taxes. This is
conceivable given the fungible nature of government money, and competing demands from other
sectors. As a matter of fact, interviews with the Ministry of Finance of Malawi revealed that other
sectors had also presented proposals for increased funding including plans for earmarked taxes.
52. In conclusion, there appears to be very strong positive and negative views on earmarking but
limited evidence to substantiate the claims28
. It is also evident that earmarking is highly context-
specific and dependent on a country’s political priorities and budget process29
. Therefore, validity of the
arguments depends on practical implementation experiences. As Doetinchem (2010) argues, earmarking
tax revenue is not inherently right or wrong and it depends on how overall government spending is
adjusted to accommodate changes. What is also clear from the preceding arguments is that earmarking
reduce government’s flexibility in resource allocation but can also secure revenues for priority
programmes, increase accountability and public support, and prevent unhealthy behaviours. As such,
depending on the magnitude of the problem to be addressed, earmarking could be applied for a short or
long period with linkages to the broader health financing context and general tax system. Close
collaboration between the MoH and the Ministry of Finance have been crucial enabling factors in
countries that successfully earmarked revenues for health30
.
4.3 Expert opinion on earmarked taxes for health in Malawi
53. A number of interviews were conducted with key stakeholders to get expert opinion on the
revenue generation capacity and potential to promote healthy lifestyles for each of the twelve (12)
areas31
which had been identified for earmarked taxes by the MoH. Key informants were also
requested to provide expert opinion on political feasibility, consumer acceptability, and perceived
effects on businesses and trade. This exercise was important because not all the areas that the MoH had
proposed for earmarking were potentially viable in Malawi. Information from the various experts was
grouped, and each of the proposed areas for earmarking was evaluated using an evaluation criteria
outlined in Table 8 below. Below is a summary of the discussion and consensus on the twelve (12)
areas. The analysis also includes evidence from document reviews from the IMF (2016a) and other
studies.
28
ibid 29 Cashin C., Sparkes S.P., and Bloom D. (forthcoming). Earmarking for Health: From Theory to Practice. A Health Financing Working Paper No. 16.5 prepared for the World Health Organization and Results for Development. 30 ibid 31 The twelve (12) areas include: (i) fuel; (ii) tobacco products; (iii) alcohol; (iv) mobile phone talktime; (v) corporate businesses; (vi) value added tax; (vii) extractive industries; (viii) moneys received from loans applied through parliament; (ix) donations received from developing
partners, foundations etc; (x) annual earnings paid by employees and employers to private health insurance schemes, (xi) moneys earned by
investments made by or on behalf of the Malawi Health Fund; and (xii) third party and comprehensive motor vehicle insurance.

27
4.3.1 A medical levy on fuel was likely to generate adequate resources but there were already eight
(8) levies and duties on fuel. Introducing an additional levy on fuel would lead to an increase in
the pump price of fuel and an inflationary pressure which would affect the entire economy;
4.3.2 Rather than introducing a new levy on fuel, the group of experts felt that replacing and/or
getting a share from two (2) already existing levies on fuel wouldn’t attract an increase in the
pump price of fuel; and would have no adverse effects on production, trade, and domestic
consumption. The proposed fuel levies and justification are:
(i) Replace the existing fuel storage levy with a medical levy. The justification was that all the
planned fuel storage units have already been built and there was therefore no need to
continue collecting money for this purpose;
(ii) Allocate a share of future revenues generated from the rural electrification levy (commonly
referred to as the Malawi Rural Electrification Programme [MAREP]) to the health sector.
It was explained that money which has already been collected could be used for rural
electrification as intended but a share of the future revenue could be allocated to the health
sector. The justification for targeting future revenue from the MAREP levy was due to the
low absorptive capacity for the funds that have been collected since the introduction of the
levy32
;
4.3.3 Notwithstanding the above, officials from the Department of Energy were of the view that
replacing the storage levy with a medical levy would be more feasible given the political nature
of rural electrification in Malawi, and existence of the Rural Electrification Act No. 21 of 2004
which provides for the establishment of a Rural Electrification Fund. It was explained that this
Act has to be repealed to allow for a share of the MAREP levy to be allocated for health.
However, a review of this Act showed that it provides for the establishment of a “Rural
Electrification Fund” but it does not explicitly say that money for the Fund has to be raised
from the rural electrification levy;
4.3.4 Experts were of the view that taxing tobacco products and alcohol would not generate enough
revenue as domestic consumption is low while it is easy to smuggle the products. Therefore, an
increase in tax in these areas would exacerbate smuggling. In particular, the Tobacco Control
Commission indicated that any tax/levy on tobacco (whether on production or domestic
consumption) ultimately affected tobacco farmer. Currently, there are more than eight (8) levies
and taxes on tobacco products targeting both domestic use and imports. The President of
Malawi is aware of this and on Wednesday 13th April, 2016 he called for the reduction of
taxes/levies on tobacco owing to the numerous complaints from tobacco farmers. The IMF
(2016a) comprehensive tax reforms report further notes that raising the excise duty on
cigarettes is unlikely to increase revenue significantly due to: (i) low prevalence rate of
smoking among adults aged over 15 in Malawi; and (ii) the retail prices of cigarettes in Malawi
are similar to those in Mozambique with whom Malawi shares a long border. Thus, any
significant difference in the retail prices of cigarettes between the two countries would
encourage smuggling (ibid). On alcohol, however, the IMF (2016a) recommends the switch of
excises taxes on alcohol from ad-valorem to specific excises based on alcoholic strength to
better correct the negative externalities associated with alcohol consumption;
4.3.5 The proposal to introduce an earmarked tax on talktime was declined out-rightly owing to the
high fiscal and regulatory levies already in place in Malawi. The experts concluded that
Government cannot take another risk in increasing taxes on talktime as it is already expensive
in Malawi compared to several countries, and cited a recent public outcry. The IMF (2016a) is
also of the view that the telecommunication sector in Malawi is heavily charged and
recommends no further increases but improvements in transparency and efficiency. For
32 About MK30 billion (US$44 million) has accumulated over the years but progress on rural electrification has been slow.

28
example, the IMF (2016a) notes that Telecoms companies in Malawi are subject to: (i) customs
duties on capital equipment (handsets are exempt); (ii) a 10 percent ad-valorem excise on call
minutes and internet data; (iii) VAT; (iv) Corporate Income Tax; (v) a 5 percent charge on the
gross revenue of telecom companies; (vi) license and spectrum fees; and (vii) a US$0.08 per
minute charge on incoming international calls. This explains why Malawi (ranked 19th) is
among the top 20 countries with the highest consumer taxes as a proportion of the total cost of
mobile ownership in the world (GSMA, 2015). On the other hand, increased taxes on talktime
would further limit mobile telecommunications access in Malawi which has been growing in
recent years but is still low by regional standards. Mobile phone penetration rate in Malawi was
estimated at 38 percent in 2015 as compared to 49 percent and 54 percent for SSA and SADC,
respectively33
.
4.3.6 Increasing tax rates on corporate income tax (CIT) and VAT was deemed undesirable as the
rates were already high. Efforts should be directed towards an increase in tax compliance in
these two areas. These observations are also in line with the IMF (2016a) comprehensive tax
reforms report where recommendations are made to reduce the CIT from the current 30 percent
to 25 percent in the medium term;
4.3.7 The extractive industry is still in its infancy and hence, negligible resources would be
generated. Compounding the problem has been the closure of production at Kayelekera
uranium mine, which is currently in maintenance;
4.3.8 Taxing moneys received from loans applied through Parliament, and donations received from
developing partners is not feasible as best practices do not advocate for taxing loans and
development aid; and
4.3.9 The experts observed that a new tax on third party and comprehensive motor insurance could
be introduced. This would have the twin goal of generating additional revenues for the health
sector while at the same time reducing the costs incurred by the health sector in addressing
deaths, injuries, and disabilities due to road traffic accidents34
. For this to be viable, a tax or
levy could be imposed on motor vehicle insurance premiums or on profits made by private
insurance companies offering this service. It was, however, observed that the Reserve Bank of
Malawi was also in the process of creating a Third Party Motor Compensation Fund to replace
the existing third party motor vehicle insurance which is currently being offered by private
insurers. The proposal by the Reserve Bank of Malawi is contained in a Concept Note dated
March 2016.
54. In conclusion, while the team of experts appreciated the need to generate additional domestic
revenues for the health sector through earmarked taxes, they observed that most of the areas
were already heavily taxed. It was further observed that it would be very difficult to increase taxes or
levies in the already existing areas without causing adverse effects on production, trade, and
consumption. The consensus was to identify and re-allocate revenue from existing taxes or levies
without increasing tax rates. It was further advised that focus should be on levies rather than taxes
because revision of taxes would require amendment of certain regulations and legislature through
parliament which might take time. In addition, it was suggested that emphasis should also be on
improving the tax administration capacity at MRA which could lead to improved revenue collection.
Furthermore, considering that the Malawian Government is in the process of reviewing the overall tax
system, it was emphasized that all proposals on earmarked taxes in the health sector should be aligned
to the overall tax reform process.
55. On the proposal to introduce a new tax or levy on third party and comprehensive motor
insurance, it was agreed that the MoH should also review the Concept Note on the establishment
33 gsmaintelligence.com and budde.com.au 34 Road Traffic Accidents are ranked 8th on the list of leading causes of Disability Adjusted Life Years (DALYs) in Malawi

29
of a Third Party Motor Compensation Fund as proposed by the Reserve Bank of Malawi. In this
regard, a decision has to be made on the feasibility of: (i) Continuing with private insurance for motor
vehicles but introducing a tax/levy on motor vehicle insurance premiums OR on profits made by private
insurance companies offering this service; and (ii) Replacing the existing third party motor vehicle
insurance currently offered by private insurers with a Third Party Motor Compensation Fund managed
by a semi-autonomous government institution. This avenue is worth exploring given that some
countries in Africa (Botswana, Namibia, and South Africa) have successfully implemented viable motor
vehicle accident funds.

30
Table 8: Responses from Stakeholders and Document Reviews on the Proposed Sources of Earmarking Proposed Sources of Revenue Revenue Generation
Potential
Health Promotion Potential Political Feasibility Consumer
Acceptability
Effects on Businesses and
Trade
Concluding
Remarks
1. Fuel
Fuel is already heavily taxed—A total of
eight (8) duties and levies are charged on
each litre of fuel. As at 4th November 2016, each litre of fuel attracted duties
and levies amounting to an average of
K208.94 per litre.
High High
Revenue generated could be
used to fund health promotion,
treatment, and social benefit programmes that could help to
reduce the high morbidity and
mortality related to road
accidents. Negative
externalities associated with
fuel consumption (congestion, noise/air pollution) could also
be reduced.
Low Low Negative Generate revenue
forecasts in the main report focusing on
revenue potential of
replacing existing fuel levies—Storage
and MAREP.
“Fuel is weighted highly in Malawi’s CPI. Any change in fuel prices has an impact on household expenditures, businesses and is therefore politically unpopular.
Compared to its neighbours and Southern Africa, prices of fuel in Malawi are
higher”.
“Best option would be to replace some of the existing levies on fuel with a health
levy. Examples are the storage and MAREP levies”.
“About MK30 billion (US$44 million) has accumulated over the years but progress on rural electrification has been slow. Therefore, Government could use
some of the future revenues from MAREP. For the storage levy, facilities have
already been built”.
2. Third party and comprehensive
motor vehicle insurance
A new tax on third party and
comprehensive motor insurance was
proposed. This would have the twin goal of generating additional revenues for the
health sector while at the same time
reducing the costs incurred by the health sector in addressing deaths, injuries, and
disabilities due to road traffic accidents.
High High
Revenue generated could be used to fund health promotion,
treatment, and social benefit
programmes that could reduce the high morbidity and
mortality related to road
accidents.
High High Positive Generate revenue
forecasts in the main
report.
The Ministry of Finance through the Reserve Bank of Malawi has already prepared a Concept Note outlining the establishment of a Third Party Motor
Compensation Fund.
The Minister of Health expressed concern on the rising number of fatal Road
Accidents and their impact on the health system.
3. Alcohol
Alcohol is already heavily taxed.
Low
Consumption of alcohol in
Malawi is very low.
Low
Potential to promote health is
high among the consumers but low countrywide.
High Moderate Negative
High potential of losing
existing revenues through smuggling if tax is increased.
Malawi shares a very long
border with Mozambique.
Generate revenue forecasts in the
Annex.
4. Tobacco products
Tobacco products are already taxed.
Currently, there are more than eight (8)
levies and taxes on tobacco products.
Low
IMF (2016a) notes that raising
the excise duty on cigarettes is
unlikely to raise significant revenue due to: (i) low
prevalence rate of smoking
among adults aged over 15 in Malawi; and (ii) retail prices
of cigarettes in Malawi are
similar to those in Mozambique with whom
Low
Potential to promote health is
high among the consumers but
low countrywide.
Low
The President of
Malawi on Wednesday
13th April, 2016 called for the reduction of
taxes/levies on tobacco
owing to the numerous complaints from
tobacco farmers.
Low Negative
High potential of losing
existing revenues through
smuggling if tax is increased. Malawi shares a very long
border with Mozambique.
Consumption of tobacco
products in Malawi is low
while the country is an exporter of tobacco products.
Generate revenue
forecasts in the Annex.

31
Proposed Sources of Revenue Revenue Generation
Potential
Health Promotion Potential Political Feasibility Consumer
Acceptability
Effects on Businesses and
Trade
Concluding
Remarks
Malawi shares a long border. Introduction of a health levy on tobacco production would be
highly undesirable given that
tobacco is the country’s key export commodity accounting
for about 50% of the country’s
total merchandise exports.
5. Extractive industries Low
The extractive industry in Malawi is still in infancy.
While it is projected that
mining activities could earn Malawi in excess of US$100
million of production value per
annum in future; by the end of 2016 most of the mining
explorations had not been
concluded. Closure of the biggest mine—Kayelekera
Uranium Mine in 2013/14—
has resulted in loss of tax revenue by 91% between
2013/14 and 2015/16
Low High High Negative Generate revenue
forecasts in the
Annex.
6. Mobile phone talktime
Mobile phone talktime in Malawi is
already subjected to very high fiscal and regulatory levies.
High
Malawi has a mobile phone
penetration rate of 38% (2015 estimate). Introducing a health
levy on talktime could yield
significant resources.
Low Low Low Negative Drop
“Government cannot take another risk in increasing taxes on talktime as it is already expensive in Malawi compared to several countries”.
“The Government is trying to increase mobile communication access. Increasing the levy on talktime would be contradictory, and there could be another public
outcry”.
“Given the already heavy fiscal burden borne by the telecoms sector, total charges
on telecommunications should not be increased.” - IMF (2016a, Page 21).
7. Corporate businesses
Malawi’s Corporate Income Tax (CIT) of
30% is average for its income level but high by international standards.
High Low Low Low Negative Drop
“Reducing the CIT rate could be especially beneficial to Malawi given its
development level, relatively high transport costs and challenging business
environment”. - IMF (2016a, Page 19).
“In the medium term, as revenue pressures permit, reduce the CIT rate to 25
percent”. - IMF (2016a, Page 20).
8. Value added tax High Low Low Low Negative Drop
9. Moneys received from loans applied High Low Low High - Drop

32
Proposed Sources of Revenue Revenue Generation
Potential
Health Promotion Potential Political Feasibility Consumer
Acceptability
Effects on Businesses and
Trade
Concluding
Remarks
through parliament.
10. Donations received from developing
partners, foundations etc
High Low Low High - Drop
11. Annual earnings paid by employees
and employers to private health insurance schemes.
Low
Only 1.2% of the population
have some form of health
insurance through private health insurance companies,
corporate, and other risk-
pooling schemes. Health insurance as a proportion of
Total Health Expenditure was
only 3.3% in 2014/15.
Low
Potential to promote health is
low countrywide given the
small number of people using private health insurance.
- Low among the
insured but high for the non-insured.
- Drop
12. Re-investing money generated
through the proposed Health Fund
To be determined High High High - Drop.
To be analyzed in a
follow-up study if the
proposed Health Fund is established.

33
4.4 Revenue Forecasting
56. Based on expert opinion and documents reviews (Table 8), only five (5) of the twelve (12)
areas which were identified for earmarked taxation were subjected to further analysis. The five (5)
areas are: fuel, motor vehicle insurance, extractives industry, alcohol, and tobacco. Presented below are
revenue forecasts on fuel and motor vehicle insurance while the analyses on extractives industry,
alcohol, and tobacco products are provided in the Annexes. This is because fuel and motor vehicle
insurance have high revenue generation potential and minimal negative consequences on consumers and
businesses as highlighted in Table 8.
4.4.1 Fuel Levy
Demand for Fuel
57. Demand for major fuel products, petrol, diesel and paraffin, declined to 293.59 million litres
in 2015/16 from 308.3 million litres in 2011/12 representing a decline of 5 percent (figure 9). The
decline was only observed in the demand for diesel and paraffin which dropped by 15 percent and 88
percent, respectively, over the period under review. This could be attributed to relatively high fuel prices
which increased by 89 percent, 100 percent, and 152 percent for petrol, diesel and paraffin, respectively,
between 2011/12 and 2015/16. While the increase in prices didn’t affect the demand for petrol35
, the
drop in demand for diesel could also be due to a slowdown in economic activities in the period under
review. The economy grew by an average of 3.9 percent between 2011/12 and 2015/16 compared to an
average of 7.1 percent between 2008/09 and 2011/12. However, paraffin is facing the lowest demand
mainly due to the fact that it is being substituted by other forms of energy for lighting, for instance,
rechargeable lamps that have proliferated on the local market. As at 4th November 2016, Malawi Energy
Regulatory Authority (MERA) increased the pump prices for petrol, diesel and paraffin to K824.70 per
litre, K815.80 per litre, and K648.70 per litre, respectively (figure 9). This is bound to have a renewed
effect on the demand for fuel, particularly diesel and paraffin.
Figure 9: Domestic Demand for Fuel and Evolution of Fuel Pump Prices
Data source: MoFED and MERA
35 Demand for petrol increased by 22% over the period 2011/12 and 2015/16
2011/12 2012/13 2013/14 2014/15 2015/16
Petrol 102.20 104.30 108.90 121.00 124.60
Diesel 197.60 208.85 186.15 163.10 167.95
Paraffin 8.50 4.15 1.60 1.01 1.04
0
50
100
150
200
250
Mill
ion
Lit
res
Demand for Fuel: 2011/12-2015/16
Petrol 290.00
Petrol 824.70
Diesel 260.00
Diesel 815.80
Paraffin 155.00
Paraffin 648.70
0
100
200
300
400
500
600
700
800
900
MK
/Lit
re
Fuel Pump Prices: Jan 2011-Nov 2016

34
Effects of introducing a new fuel health levy
58. Pricing of fuel is based on an Automatic Pricing Mechanism (APM). Under this mechanism,
pump prices are reviewed based on a minimum of five percentages change in two parameters, namely:
the exchange rate and the Free on Board (FOB) prices of petroleum products. According to MERA, the
fuel price structure in Malawi contains a total of eight (8) duties and levies which are charged on each
litre of fuel. This means that as at 4th November 2016, each litre of petrol attracts duties and levies
amounting to K260.18 while each litre of diesel and paraffin attract K257.11 and K109.52, respectively.
This amounts to K208.94 per litre on average. In other words, the eight (8) duties and levies are
responsible for 27 percent of the price of each litre of fuel. A full list of the existing fees, levies, and
duties are outlined in Annex 4 (A.4.1).
59. Owing to the above, introduction of a new levy on fuel will result in an increase in fuel prices
in the month and/or year of its introduction, holding other factors constant. However, the
magnitude of the price increase and its adverse effects will depend on the size of the levy. For instance a
1 percent levy will increase prices of fuel by 1 percent but only in the year of introduction. Still, the
major effects that are expected from persistent increases in pump prices include slowdown in economic
growth, inflation, worsening balance of payment (BoP) position and increase in inequality. Persistent
increases in fuel prices can escalate costs of transporting inputs and provision of transport services. As
such, some sectors of the economy, especially manufacturing and transport may face reduced demand
for their products as they attempt to increase their prices to recover the costs. However, the actual
magnitude is not clear in Malawi as there is no empirical study in this area. Empirical studies in other
countries show that this relationship is stronger for longer time horizons or when the price increases are
permanent (Cantore et al. 2012). For Malawi, this relationship could be examined by looking at the
weight of fuel and/or transport in the Consumer Price Index (CPI).
60. In Malawi, the weight of fuel in the CPI at 6.6 percent is third; housing, water and electricity
at 14.7 percent is second; and food and non- alcholic drinks at 50.2 percent is first. Therefore, a
significant change in fuel prices due to an increase in the tax rate or introduction of additional levies
might increase inflationary pressure considering that fuel already has a lot of levies on it. According to
Nkomo (2012), many developing countries have faced particularly strong inflation pressures from fuel
price increments mainly as a result of their large consumption shares of fuel products, which is the case
with Malawi. Increases in cost of transportation of both inputs and final products due to the increase in
fuel prices will reduce the advantage the country has over others in producing certain items. Hence, the
country will end up exporting less and importing more, and ultimately worsen the current account, which
exposes the country to several macroeconomic risks. Moreover, evidence from household surveys shows
that oil price increases tend to have a stronger effect on poorer households, as a higher proportion of
their expenditure goes on transport compared to their rich counterparts (Bacon, 2005). The poor become
poorer and this creates social problems as more people are thrown into misery.
61. In light of the high burden imposed by road accidents on the health system in Malawi, there is
a very strong argument for dedicating a fuel levy to the health sector to address this problem. Malawi has a very high road traffic fatality rate (estimated at 35 deaths per 100,000 population), and this
imposes huge costs on households, the private sector, and the government each year (figure 15). A fuel
health levy can also act as an incentive to reduce air pollution, and traffic congestion. For example, the
total number of annual deaths from ambient particulate matter pollution (mostly caused by road
transport, power generation or industry) across the African continent increased by 36% between 1990
and 2013; from 180,000 in 1990 to 250,000 in 2013 (Roy, 2016). For Africa as a whole, the estimated
economic cost of premature deaths from ambient particulate matter pollution was estimated at US$215
billion in 2013 (ibid). Thus, in addition to using fuel levies for road infrastructure maintenance (as is the
case at the moment in Malawi), they can also be used for controlling adverse health effects such as road
transport-related injuries and death, air and noise pollution, and traffic congestion. For instance, the
federal gasoline tax in USA is meant to reduce pollution and traffic congestion, as well as to fund
construction and maintenance of interstate highways and urban mass transit projects (Hines, 2007).

35
Revenue generation potential: sharing resources from MAREP and replacing the storage levy
62. As presented above, introducing an additional levy on fuel will lead to an increase in the
pump price of fuel, which would affect the entire economy. Therefore, rather than introducing a new
levy on fuel, the consensus from the MoH, MoFED, and other government ministries and departments
was to allocate a share of future revenues from the MAREP levy and to convert the existing storage levy
into a medical/health levy. The justification for this is that absorption of resources by MAREP is low
compared to the revenue that has been collected since the introduction of the levy. Secondly, fuel storage
facilities have already been constructed, and therefore, the storage levy could be converted to a
medical/health levy. Assuming that the demand for petroleum products grows in the same proportion
with economic growth, an average of MK1.7 billion or US$2.4 million per annum could be raised over
the period 2016/17 to 2021/22 if the storage levy is converted to a medical levy (figure 10). However, if
a share from the MAREP levy is also considered, the revenue would rise to about MK3.0 billion, MK4.2
billion, or MK5.5 billion on average per annum over the period 2016/17 to 2021/22 for the low, medium,
and high scenarios, respectively (figure 11). This is equivalent to US$4.1 million, US$5.9 million, or
US$7.6 million on average per annum over the period 2016/17 to 2021/22 for the low, medium, and high
scenarios, respectively.
Figure 10: Potential Revenue from Storage Levy (SL) (MK millions)
Data sources: MoFED and MERA
Figure 11: Potential Revenue from MAREP and Storage Levy (SL) (MK millions)
Data sources: MoFED and MERA.
1,5
19
1,5
84
1,6
59
1,7
47
1,8
43
1,9
40
1,7
15
2016/17 2017/18 2018/19 2019/20 2020/21 2021/22 Average
2,9
80
4,2
44
5,5
08
0
1,000
2,000
3,000
4,000
5,000
6,000
7,000
2016/17 2017/18 2018/19 2019/20 2020/21 2021/22 Average
Low (MAREP at 10% plus SL) Medium (MAREP at 20% plus SL)
High (MAREP at 30% plus SL)

36
4.4.2 Motor Vehicle Insurance Levy
Demand for Motor Vehicle Insurance
63. All vehicles in Malawi are required to have some form of insurance (either comprehensive or
third party cover) by law. The Road Traffic Act 1997 makes compulsory the insurance of third party
liability for motor vehicles, as minimum cover. As such, the demand for motor vehicle insurance
services depends on the availability of motor vehicles. Between 2012/13 and 2015/16, the gross
premiums realized from motor vehicle insurance increased by 161 percent from MK7.21 billion in
2012/13 to about MK18.8 billion in 2015/16 (figure 12). However, the increase has been at a decreasing
rate mainly due to the shift by customers from comprehensive covers to the cheaper but basic third party
insurance cover.
Figure 12: No. of Vehicles Vs Gross Premiums from motor vehicle insurance
Source: Reserve Bank of Malawi; Road Traffic Directorate
Effects of introducing health levy on motor vehicle insurance
64. The Insurance sector is governed by the Financial Services Act, Insurance Act, and regulated
by Registrar of Financial Institutions at the Reserve Bank of Malawi. Currently the only tax under
the insurance sector is the corporate income tax, and a license fee of K150,000 per insurance company.
Once granted, the license is open ended as long as the institution complies with the capital, solvency and
all other regulatory requirements. However, the insurance market is poorly regulated leading to a number
of fraudulent claims. To avert this problem, the Ministry of Finance and the Reserve Bank of Malawi are
in the process of developing a regulation on supervisory levies which will require insurers to contribute
towards the cost of supervising the sector.
65. Pricing of insurance products is determined by the individual insurance companies
particularly for comprehensive motor insurance. For third party insurance, a maximum of
MK250,000 is paid to aggrieved third parties in respect of damage to motor vehicle or articles or
death/bodily injury to persons. i.e. MK250,000 in any one accident for damage to motor vehicle or
articles; and/or MK250, 000 for death or bodily injury in any one accident. Therefore, the introduction of
a levy on motor vehicle insurance will increase the price of motor vehicle insurance premiums.
However, the demand for motor vehicle insurance is price inelastic in Malawi due to the fact that all
vehicles are required to be insured by law. This means that, should the price of motor vehicle insurance
premiums increase with the introduction of the levy, the demand for motor vehicle insurance is expected
to remain the same. However, marginal declines in demand should be expected due to the fact that some
7,2
09
,80
0,0
00
12
,07
5,0
00
,00
0
16
,32
0,7
00
,00
0
18
,85
1,2
00
,00
0
168,889
192,954
218,172 226,668
0
50000
100000
150000
200000
250000
0
2,000,000,000
4,000,000,000
6,000,000,000
8,000,000,000
10,000,000,000
12,000,000,000
14,000,000,000
16,000,000,000
18,000,000,000
20,000,000,000
2012/13 2013/14 2014/15 2015/16
Mal
awia
n K
wac
ha
Gross Premium No. of vehicles

37
road users may opt to illegally use uninsured vehicles as a result of the price increase. Nonetheless, the
value of the motor vehicle insurance premiums is still expected to be above the value of the aggregate
motor vehicle insurance claims. For example, while the value of the aggregate motor vehicle insurance
claims rose by 925 percent from MK583.5 million in 2008 to MK5.97 billion in 2014, this was only 42
percent of the MK12.1 billion gross insurance premiums from motor vehicle insurance which was
realized in 2014. Figure 13 provides the situation for 2012/13 and 2013/14. However, if the CIT at 30
percent and the licence fee for insurers of MK150,000 are removed from the overall insurance
premiums, the profit margin would reduce.
Figure 13: Gross Premiums Vs Aggregate Insurance Claims
Data Source: Reserve Bank of Malawi
Health and economic justification for introducing a levy on motor vehicle insurance
66. Globally, road traffic related injuries and deaths have become a major public health and
development problem, particularly in Malawi and other low- and mid-income level countries. The
2015 Global status report on road safety shows that low and middle-income countries account for 90
percent of global road traffic deaths with the most affected being the economically active population of
young people aged between 15 and 29 years (WHO, 2015a). Road traffic injuries place a heavy burden
on national economies and households. Economic costs at national level are huge and impose a
significant burden on health, insurance and legal systems (ibid). In low- and middle-income countries,
road traffic injuries and deaths are estimated to cause economic losses of up 5 percent of GDP (Law
2009 cited by WHO, 2015a). In Malawi, the increased number of motor vehicles over the period 1995-
2015 has contributed to a significant increase in the number of road traffic accidents i.e. about 3.4
accidents per vehicle on average over the period 1995-2015 (figure 14). And as further highlighted in
Table 9, the total number of road traffic accidents increased by 11 percent from 7,390 in 2013/14 to
8,194 in 2015/16. Out of the total number of road traffic accidents recorded between 2013/14 and
2015/16, the number of people seriously injured and killed increased by 8 percent and 9 percent,
respectively.
0
2,000,000,000
4,000,000,000
6,000,000,000
8,000,000,000
10,000,000,000
12,000,000,000
14,000,000,000
2012/13 2013/14
Mal
awi K
wac
ha
(MK
)
Value of Gross Premiums - Motor Vehicle Insurance
Aggregate value of Motor Vehicle Insurance Claims

38
Figure 14: No. of Vehicles vs Accidents: Malawi 1995-2015
Data Sources: Ali (2010), National Police Headquarters, Road Traffic Department; Log Scale Table 9: Accident Statistics: Malawi 2013/14-2015/16 2013/14 2014/15 2015/16 % Change - 2013/14
vs 2015/16
Seriously injured 909 973 982 8%
Killed 977 1,060 1,068 9%
Damage Only 2,093 1,461 2,013 -4%
Minor Injuries 3,411 3,861 4,131 21%
Total No. of Road Accidents 7,390 7,355 8,194 11%
Data Sources: National Police Headquarters, Road Traffic Department
67. Malawi’s road traffic fatality rate of 35 deaths per 100,000 population is above the African
regional average of 26.6 deaths per 100,000 population, and twice the global average of 17.4 deaths
per 100,000 population (figure 15). Given the increasing number of road traffic injuries and deaths in
Malawi, huge costs are incurred by households, health and insurance systems each year. As shown in
Figure 16, the total number of people seriously injured and killed through road traffic accidents
increased by 93 percent between 2012/13 and 2013/14, and at the same time the value of insurance
claims due to injuries and death also increased by 70 percent. Expressed differently, the monetary value
of vehicle insurance claims due to injuries and deaths as a percentage of the total monetary value of
motor vehicle insurance claims rose significantly from 5 percent in 2008 to 50 percent in 2014 (figure
16). It is not clear, however, if these claims are genuine or whether the victims were attended to at public
or private hospitals. There is also no information with regards to the impact of the money from road
traffic insurance claims on decreasing direct costs for surgery at hospitals and impact at household level.
3.78
3.80
3.82
3.84
3.86
3.88
3.90
3.92
4.70 4.80 4.90 5.00 5.10 5.20 5.30 5.40
No
. o
f A
ccid
en
ts
No. of Vehicles

39
Figure 15: Road traffic fatality rates per 100,000 population (2013)
Data Source: WHO (2015). Global Status Report on Road Safety
Figure 16: Road Accident related Injuries and Deaths and insurance claims
Data Sources: National Police Headquarters; Reserve Bank of Malawi
68. Given the high social and economic costs of Road Traffic Accidents in Malawi, there is need
to urgently address this problem. Road accident related fatalities are ranked eighth on the list of
leading causes of Disability Adjusted Life Years (DALYs) in Malawi, but action to combat this
challenge has been insufficient36
. As observed by AfDB (2013), addressing Road Traffic Accidents in
Africa is critical due to the weak health care systems, and limited social protection for those surviving
with life-changing injuries. Addressing road safety in Malawi requires solutions at several fronts:
development and implementation of a national strategic plan, strengthening the capacity of institutions,
improving data collection and dissemination, implementing measures targeted at specific groups at risk
such as children, and incorporating safety into road designs and development37
.
69. The proposed tax on motor vehicle insurance seeks to reduce economic, health, and household
costs due to road traffic injuries and deaths by generating additional money to be used exclusively
for health care provision. Once this money is available to the health sector, part of it will be used to
36 http://www.who.int/violence_injury_prevention/road_traffic/countrywork/mwi/en/ 37 ibid
0 5 10 15 20 25 30 35
World
Botswana
Zambia
South Africa
Ethiopia
Africa
Uganda
Zimbabwe
Kenya
Mozambique
Tanzania
Malawi
Deaths per 100,000 Population
2750
5,297 1418
2417
0
500
1,000
1,500
2,000
2,500
3,000
0
1000
2000
3000
4000
5000
6000
2012/13 2013/14
MK
mill
ion
No
. of
Inju
rie
s an
d D
eat
hs
No. of Injuries and Deaths
Value of Insurance claims - Injury/Death
5%
16% 17%
28% 31%
45%
50%
0%
10%
20%
30%
40%
50%
60%
2008 2009 2010 2011 2012 2013 2014
Share of claims on Injuries/Death from total value ofvehicle insurance claims

40
provide medical care to persons injured as a result of road traffic accidents, and for other illnesses. The
tax/levy on motor vehicle insurance premiums is also expected to re-invigorate the demand for insurance
cover at public and private hospitals whenever there is a road traffic accident requiring medical attention
of any sort. Sensitization of the general public on the mandate of insurance companies in an event of
road traffic related injuries and deaths will help to minimize the number of false insurance claims,
encourage the use of public and private hospitals, and compensate some of the hospital/household costs.
As stated earlier, the monetary value of insurance claims for road traffic related injuries/deaths increased
by 925 percent between 2008 and 2014, or from a share of 5 percent of the total monetary value of motor
vehicle insurance claims in 2008 to 50 percent in 2014.
70. Information on the annual number of accident victims attended to, average length of stay,
treatment costs, and compensation from insurance companies is not readily available at major
hospitals in Malawi. We visited Kamuzu Central Hospital, Likuni Hospital, and Luke Daeyoung
Hospital in Lilongwe in an attempt to get this information. This information was not available at
Kamuzu Central Hosiptal while at Luke Daeyoung Hospital an estimated 100 accident victims are
attended to each year. Out of this number, 70 percent seek treatment in the public wing, average length
of stay of 15-20 days, and about K10,000 per day is spent on each patient. In the private wing, the
hospital attends to 30 percent of the annual number of accident victims, and patients pay about K40,000
per day for an average length of stay of 15-20 days. The majority of the accident victims who are
attended to in private wings have medical insurance cover. It was also learnt that the number of accident
victims treated as outpatients was significantly higher than the number of inpatients, and the most
complicated cases are referred to Kamuzu Central Hospital. At Likuni Hospital, only 65 accident victims
were attended to between 2012 and 2015, an average of 16 people per year, while information on the
average length of stay, and costs was unavailable. Henceforth, while the monetary value of the road
traffic related injuries and deaths have been rising over the years, corresponding information with
regards to the number of accident victims attended to, average length of stay, treatment costs, and
compensation by insurance companies is not readily available at major hospitals. Ironically, as presented
in earlier sections of this report, data obtained from Malawi Police and the World Health Organization
show high and rising cases of road traffic injuries and fatalities.
Revenue Generation Potential – Tax/levy on Motor Vehicles Insurance
71. As shown earlier in Figure 12, the gross premiums realized from motor vehicle insurance
increased by 161 percent from MK7.21 billion in 2012/13 to about MK18.8 billion in 2015/16. Projecting for the next 6 years, it is assumed that the growth or demand for motor vehicle insurance is
proportional to the growth in nominal GDP. Going by this principle, an average of MK946 million;
MK1.9 billion; or MK2.8 billion would be generated on average per annum under the low, medium, and
high scenarios, respectively, through a tax/levy on motor vehicle insurance premiums over the period
2016/17-2021/22. The revenue projections are presented in Figure 17. This is equivalent to
US$1,311,863; US$2,623,726; and US$3,935,589 on average per annum under the low, medium, and
high scenarios, respectively. This money could be used to fund the health sector, particularly to
compensate for costs incurred by the health sector in addressing deaths, injuries, and disabilities due to
road traffic accidents.

41
Figure 17: Projected Revenue - Tax/Levy on Motor Vehicle Insurance Premiums (MK)
Data Sources: Reserve Bank of Malawi
Revenue Generation Potential – Establishment of a Third Party Motor Compensation Fund (TPMCF)
72. Other than introducing a tax/levy on motor vehicle insurance premiums, Malawi could
instead establish a TPMCF. The Reserve Bank of Malawi has prepared a Concept Note which seeks to
establish a motor vehicle accident fund (RBM, 2016). Other countries in Africa (e.g. Botswana,
Namibia, and South Africa) have in place dedicated Road Accident Funds which provide social security
benefits to road traffic accident victims to cater for medical and funeral expenses, loss of earnings, and
loss of support. Though their sole purpose is to provide social security benefits to affected persons, these
Funds contribute substantially towards the financing of the health system. The main funding sources for
the proposed TPMCF for Malawi are a fuel levy or revenue from all third party motor vehicle insurance
premiums. For the premiums, the Fund would take over the responsibility of providing third party motor
vehicle insurance cover on a compulsory basis for all motorists in Malawi. However, private insurers
would be allowed to provide comprehensive motor vehicle insurance cover above what is covered
through third party insurance.
73. Our projections show that an average of MK1.9 billion or US$2.6 million could potentially be
generated per annum through third party motor vehicle insurance premiums alone over the
period 2016/17-2021/22 if the TPMCF is established (figure 18). This would be lower than the MK2.8
billion or US$3.9 million that could be generated on average per annum over the period 2016/17-
2021/22 under the high scenario if a tax on motor vehicle insurance is considered instead (figure 17).
The projected revenue is lower because in Malawi, the total gross revenue from third party insurance
premiums is only 6 percent of the total gross revenue from motor vehicle insurance premiums.
Ironically, 60 percent of the motorists in Malawi have third party motor vehicle insurance cover but its
monetary premium value is far much lower than premiums for comprehensive motor vehicle insurance
cover. The use of third party motor insurance premiums alone to implement a TPMCF wouldn’t be
enough to compensate all road traffic accident victims for medical and funeral expenses, loss of
earnings, and loss of support. In other countries in Africa (Botswana, Namibia, and South Africa) where
motor vehicle accident funds have been successful, the main source of revenue has been from fuel levies.
Therefore, if the TPMCF has to be established, additional sources of funds have to be found, probably
revenue from the storage and MAREP levies as presented in this paper.
74. It is worth pointing out that even in countries like South Africa which has had a system of
compulsory motor vehicle accident insurance since 1942, implementation challenges still exist. We
interviewed officials from the Road Accident Fund (RAF) of South Africa who indicated that the Fund is
fraught with law suits from lawyers and this has had a significant impact on its ability to adequately cater
2016/17 2017/18 2018/19 2019/20 2020/21 2021/22 Average
Low 676.09 777.95 877.65 989.68 1,114.09 1,240.18 945.94
Medium 1,352.18 1,555.89 1,755.30 1,979.36 2,228.18 2,480.36 1,891.88
High 2,028.28 2,333.84 2,632.96 2,969.04 3,342.27 3,720.55 2,837.82
0
500
1,000
1,500
2,000
2,500
3,000
3,500
4,000
MK
mill
ion
s

42
for needy road traffic victims. Prior to the establishment of the RAF on 1st May 1997, a Multilateral
Motor Vehicle Accidents Fund financed through mandatory third party insurance premiums was in
place. However, since the establishment of the RAF in May 1997, the main source of revenue is from a
fuel levy. But despite the availability of funds to finance insurance claims, the Fund has a backlog of
payments particularly to lawyers and hospitals. The main problem is that the system of claims against the
Fund is fault-based, meaning that only the party not at fault of the accident can claim successfully. The
fault element necessitates the involvement of courts where proof has to be established of the party at
fault. Often, this leads to the involvement of attorneys at a substantial cost to the Fund and claimants. A
key concern is that even though the Contingency Act allows lawyers a maximum of 25 percent of the
claim amount as fees, they routinely take more than this, leaving claimants vulnerable when they require
care in future. For example, we were informed that the RAF currently has 122,000 medical certificates
but less than 20,000 of these are active because claimants are not using them for a variety of reasons. In
some cases attorneys have not handed claimants their medical certificates because they have no interest.
In other instances healthcare providers do not accept RAF medical certificates citing delays in
reimbursement of claims.
Figure 18: Potential Revenue - Third Party Motor Compensation Fund (MK)
Data Sources: Reserve Bank of Malawi
1,3
52
,18
3,4
96
1,5
55
,89
4,3
78
1,7
55
,30
3,6
22
1,9
79
,35
7,8
41
2,2
28
,17
6,8
75
2,4
80
,36
4,7
44
1,8
91
,88
0,1
59
2016/17 2017/18 2018/19 2019/20 2020/21 2021/22 Average

43
5. SUMMARY - REVENUE GENERATION POTENTIAL OF PROPOSED
MEASURES
75. Our analysis shows that additional financing for the health sector could be generated through
earmarked taxes. Other than the proposed tax/levy on motor vehicle insurance premiums, it must be
emphasized that the proposal is to maintain the status quo by simply earmarking funds to health from
some of the already existing levies and thereby limiting potential adverse effects. Ultimately, additional
finances for health could be mobilized from domestic sources by: (i) Allocating a share of the existing
rural electrification (MAREP) levy to health; (ii) Replacing the existing storage levy with a medical
levy; and (iii) Imposing a health tax on third party and comprehensive motor vehicle insurance cover.
Using the three (3) areas (MAREP levy, Storage levy, and motor vehicle insurance), we present different
scenarios showing the amount of revenue that could be generated for health.
76. The results show that on average, MK1.7 billion (equivalent to US$2.4 million) could be
raised per annum over the period 2016/17 to 2021/22 if the storage levy alone is converted to a
medical levy (Table 10). This is equivalent to two (2) percent of the 2014/15 Government Health
Expenditure. However, if the storage levy is converted to a medical levy and a tax on motor vehicle
insurance is introduced, an average of MK4.6 billion (equivalent to US$6.3 million) could be raised per
annum over the period 2016/17 to 2021/22 based on the high scenario. This is equivalent to five (5)
percent of the 2014/15 Government Health Expenditure. Table 10 further shows that if both the MAREP
and storage levies are considered, an average of MK5.5 billion (equivalent to US$7.6 million) could be
raised per annum over the period 2016/17 to 2021/22 based on the high scenario. This is equivalent to
six (6) percent of the 2014/15 Government Health Expenditure or US$0.42 per capita per year over the
period 2016/17 to 2021/22.
77. Lastly, if MAREP, storage levy, and motor vehicle insurance are considered, an average of
MK8.4 billion (equivalent to US$11.6 million) could be raised per annum over the period 2016/17
to 2021/22 based on the high scenario. This is equivalent to ten (10) percent of the 2014/15
Government Health Expenditure or US$0.63 per capita per year over the period 2016/17 to 2021/22. A
graphical analysis of the revenue generation potential from MAREP, storage levy, and motor vehicle
insurance over the period 2016/17 to 2021/22 is presented in Figure 19.

44
Table 10: Projections Summary - Storage levy, Motor Vehicle Insurance, and MAREP (MK) Storage Levy 2016/17 2017/18 2018/19 2019/20 2020/21 2021/22 Average
Projected Revenue (MK millions) 1,519 1,584 1,659 1,747 1,843 1,940 1,715
Storage Levy as % of 2014/15
Govt. Health Exp
2% 2% 2% 2% 2% 2% 2%
Per Capita (US$) 0.13 0.13 0.13 0.13 0.13 0.14 0.13
MV Insurance 2016/17 2017/18 2018/19 2019/20 2020/21 2021/22 Average
Projected Revenue (MK millions)
Low 676 778 878 990 1,114 1,240 946
Medium 1,352 1,556 1,755 1,979 2,228 2,480 1,892
High 2,028 2,334 2,633 2,969 3,342 3,721 2,838
MV Insurance as % of 2014/15 Govt. Health Exp - High Scenario
2.3% 2.7% 3.0% 3.4% 3.9% 4.3% 3.3%
Per Capita (US$) 0.17 0.19 0.20 0.22 0.24 0.26 0.21
Storage and MV Insurance 2016/17 2017/18 2018/19 2019/20 2020/21 2021/22 Average
Projected Revenue (MK millions)
Low 2,196 2,362 2,537 2,736 2,957 3,180 2,661
Medium 2,872 3,140 3,415 3,726 4,071 4,420 3,607
High 3,548 3,918 4,292 4,716 5,185 5,660 4,553
Storage and MV Insurance as % of 2014/15 Govt. Health Exp - High
Scenario
4% 5% 5% 5% 6% 7% 5%
Per Capita (US$) 0.29 0.31 0.33 0.35 0.38 0.40 0.34
MAREP and Storage 2016/17 2017/18 2018/19 2019/20 2020/21 2021/22 Average
Projected Revenue (MK millions)
Low 2,639 2,752 2,883 3,034 3,201 3,369 2,980
Medium 3,759 3,919 4,106 4,321 4,559 4,799 4,244
High 4,879 5,087 5,329 5,609 5,917 6,229 5,508
MAREP and Storage as % of 2014/15 Govt. Health Exp - High
Scenario
6% 6% 6% 6% 7% 7% 6%
Per Capita (US$) 0.40 0.41 0.41 0.42 0.43 0.44 0.42
MAREP, Storage and MV
Insurance
2016/17 2017/18 2018/19 2019/20 2020/21 2021/22 Average
Projected Revenue (MK millions)
Low 3,315 3,530 3,760 4,024 4,315 4,609 3,926
Medium 5,111 5,475 5,861 6,301 6,787 7,279 6,136
High 6,908 7,421 7,962 8,578 9,260 9,949 8,346
MAREP, Storage and MV Insurance as % of 2014/15 Govt.
Health Exp - High Scenario
8% 9% 9% 10% 11% 12% 10%
Per Capita (US$) 0.57 0.59 0.62 0.64 0.67 0.70 0.63
Data Sources: MoFED; Reserve Bank of Malawi, MERA, and National Police Headquarters. For per capita estimates, 1US$=MK 721.07
MV=Motor Vehicle; Govt. Health Exp = Government Health Expenditure

45
Figure 19: MAREP, Storage and MV Insurance (MK million)
Data Sources: MoFED; Reserve Bank of Malawi, MERA, and National Police Headquarters.
MV=Motor Vehicle Insurance. For per capita estimate, 1US$=MK 721.07
2016/17 2017/18 2018/19 2019/20 2020/21 2021/22 Average
Low 3,315 3,530 3,760 4,024 4,315 4,609 3,926
Medium 5,111 5,475 5,861 6,301 6,787 7,279 6,136
High 6,908 7,421 7,962 8,578 9,260 9,949 8,346
MAREP, Storage and MV as % of2014/15 Govt. Health Exp - High
Scenario8% 9% 9% 10% 11% 12% 10%
Per Capita (US$) 0.6 0.6 0.6 0.6 0.7 0.7 0.6
8% 9% 9% 10% 11% 12% 10%
0.6 0.6
0.6 0.6
0.7 0.7
0.6
0%
10%
20%
30%
40%
50%
60%
70%
80%
0
2,000
4,000
6,000
8,000
10,000
12,000

46
6. CONCLUSIONS AND RECOMMENDATIONS
78. Despite recent improvements in key maternal and child health outcomes, there are huge gaps
in service coverage and poor quality of services which are symptomatic of a poorly financed and/or
inefficient health system. The underlying health system bottlenecks are: critical shortage of key health
systems inputs (human resources, medicines and medical supplies, and poor/inadequate infrastructure);
and poor governance and accountability (including poor public finance management). As a consequence,
the health sector is currently not able to deliver on key policy commitments of access and affordability as
enshrined in the country’s Constitution which seeks to “provide adequate health care, commensurate
with the health needs of Malawian society and international standards of health care”.
79. The study concludes that domestic financing for health and total health expenditures as
shares of GDP are relatively high but the actual amount of money available is inadequate. For
instance, Government health expenditure per capita is less than one-third of the country’s total health
expenditure per capita. Thus, while the GoM has already adequately prioritized health, the resources
being provided are inadequate due to the small size of the GDP.
80. A systematic analysis of the potential for increasing fiscal space for health in most of the key
areas are limited particularly due to the weak macro-economic environment. Despite these
challenges, fiscal space for health could still be increased by: (i) Improving efficiency in the health
sector, and (ii) Generating additional resources through earmarked taxes. Improving efficiency provides
the best option for increasing fiscal space for health in Malawi given that the potential savings could be
much more than the US$0.63 per capita that could be raised from introducing earmarked taxes for
health. A dedicated study should be conducted to examine in detail, the sources of inefficiencies, ways of
addressing them, and actual potential efficiency savings.
81. Though low, earmarked taxes on fuel and motor vehicle insurance could provide the health
system with some resources to address some of the bottlenecks in the health system. However,
earmarked taxes are associated with some risks that are highlighted in the report. This includes a
reduction in flexibility of public finances and resource allocation, and the possibility that health budgets
are reduced by the corresponding increase in funding from earmarked taxes. Therefore, if earmarked
taxes are used, decisions should be made on whether this intervention will be temporal or long term, and
linked to the overall tax reform process. Furthermore, the Malawian Government should strive to
increase overall government funding to the health sector through the broader tax system. Consequently,
emphasis should be on improving efficiency in overall revenue collection by MRA. Given that the
Malawian Government is in the process of reviewing the overall tax system, it will be extremely
important to align all proposals on earmarked taxes in the health sector to the overall tax reform process.
82. External financing is the most substantial and important source of health financing in
Malawi. However, the declining trend in external financing poses the greatest threat to future financing
and provision of better health care in Malawi. Therefore, there is need for external financing for health to
continue for a couple of years to avert a further decline in funding levels and intervention coverage. The
Government could achieve this by regaining the confidence and trust of development partners by putting
in place robust governance and accountability systems. On the other hand, 62 percent of the funding
from external development partners is spent on three diseases (HIV/AIDS, Malaria, and Reproductive
Health) which leaves the other components of the health system largely underfunded. Thus, development
partners should reduce fragmentation, and increase predictability and flexibility in resource allocation.
The study also shows that predictability and execution of the public health budget is low while financial
disbursements are input-based rather than results-based. There is also inconsistency in the allocation of
public resources due to the absence of a needs-based resource allocation formula. Therefore, the study
recommends for an increase in predictability and budget execution, transition to results-based financing,
and development and use of a needs-based resource allocation formula.

47
References
Action on smoking and health [ash]. (2007). Global trends in tobacco consumption and production.
Accessed from http://www.ash.org.uk/files/documents/ASH_562.pdf on 1st September 2016
African Development Bank (AfDB). (2013). Mortality in Africa: The Share of Road Traffic Fatalities.
Accessed from
http://www.afdb.org/fileadmin/uploads/afdb/Documents/Publications/Economic%20Brief%20-
%20Mortality%20in%20Africa%20%20The%20Share%20of%20Road%20Traffic%20Fatalities.pdf on
1st September 2016
Ali G.A., (2010). Traffic accidents and road safety management; A comparative analysis and evaluation
in industrial, developing and rich-developing countries. Accessed from
http://repository.up.ac.za/bitstream/handle/2263/14865/Ali_Traffic(2010).pdf?...1 on 21st August 2016
Appleby J., and Boyle S. (2000). “Blair's billions: where will he find the money for the NHS?’ British
Medical Journal. 320(7238), pp. 865-867
Asbu E.Z., Walker O., Kirigia J.M., Zawaira F., et al (2012). ‘Assessing the efficiency of hospitals in
Malawi: An application of the Pabón Lasso technique’. Health systems and reproductive health in the
African Region. African Health Monitor Issue #14. Accessed from
https://www.aho.afro.who.int/sites/default/files/ahm/reports/31/ahm-issue-14-assessing-efficiency-
hospitals-malawi.pdf on 25th August 2016
Bacon R., (2005). ‘The Impact of higher oil prices on Low-Income Countries and the Poor: Impacts and
Policies’. ESMAP Knowledge Exchange Series No. 1. Accessed from
https://www.esmap.org/sites/esmap.org/files/KES01_The%20Impact%20of%20Higher%20Oil%20Price
s%20on%20Low%20Income%20Countries%20and%20the%20Poor.pdf on 27th September 2016.
Barroy H., Sparkes S., Dale E. (2016). Projecting fiscal space for health in low and middle income
countries: a review of the evidence. Geneva: World Health Organization
Bennett S, Quick J, Velásquez G. 1997. ‘Public-private roles in the pharmaceutical sector: implications
for equitable access and rational drug use’. DAP Series No. 5. Geneva: World Health Organization.
Bird R.M., and Wallace S. (2010). ‘Taxing Alcohol in Africa: Reflections and Updates’. International
Studies Program, Working Paper 10-31. Accessed from
http://icepp.gsu.edu/files/2015/03/ispwp1031.pdf on 10th June 2016
Bonu N.S., and Motau P.P. (2009). ‘The impact of income tax rates (ITR) on the economic development
of Botswana’. Journal of Accounting and Taxation Vol.1 (1), pp. 008-022. Accessed from
http://www.academicjournals.org/journal/JAT/article-full-text-pdf/EFB0C77667 on 25th August 2016
Bova E. (2013). ‘Expenditure Forecasting and Elements of Expenditure Policy’. Training materials
delivered during an International Monetary Fund course on Fiscal Analysis and Forecasting. Accessed
from http://www.pftac.org/filemanager/files/Macro/L5.pdf on 1st June 2016
Cantore N., Antimiani A., and Anciaes P.R. (2012). ‘Energy price shocks: Sweet and sour consequences
for developing countries’. Working Paper 355, Overseas Development Institute. Accessed from
https://www.odi.org/sites/odi.org.uk/files/odi-assets/publications-opinion-files/7794.pdf on 12th June
2016
Carlson C., Chirwa W.C., Hall N., and Cammack D. (2014). Study of Health Sector Efficiency in
Malawi. Lilongwe: MoH

48
Centre for Tobacco Control in Africa. (2015). Taxation in Africa; Factsheet on Tobacco, Centre for
Tobacco Control in Africa. Accessed from http://ctc-
africa.org/images/docments/factsheets/ENTAXFACTSHEET.pdf on 1st August 2016
Chisholm D., and Evans D.B. (2010). ‘Improving health system efficiency as a means of moving
towards universal coverage’. World Health Report 2010 Background Paper No. 28. Accessed from
http://cdrwww.who.int/healthsystems/topics/financing/healthreport/28UCefficiency.pdf on 5th December
2016
Chiumia A., and Simwaka K. (2012). ‘Tax policy developments, donor inflows and economic growth in
Malawi’. Journal of Economics and International Finance Vol. 4(7), pp. 159–172. Accessed from
http://www.academicjournals.org/journal/JEIF/article-full-text-pdf/9B8747B27409 on 25th August 2016
Danish Trade Union Council for International Development Corporation (DTUC). (2015). Malawi
Labour Market Profile 2014. Accessed from
http://www.ulandssekretariatet.dk/sites/default/files/uploads/public/PDF/LMP/lmp_malawi_2014_final_
version.pdf on 12th July 2016
Doetinchem O. (2010). Hypothecation of tax revenue for health. Background paper No. 51 for the World
Health report (2010). Geneva: WHO. Accessed from
http://www.who.int/healthsystems/topics/financing/healthreport/51Hypothecation.pdf on 1st November
2016
Fan S., Omilola B., and Lambert M. (2009). Public Spending for Agriculture in Africa: Trends and
Composition. Regional Strategic Analysis and Knowledge Support System (ReSAKSS) Working Paper
No. 28. Accessed online from http://pdf.usaid.gov/pdf_docs/Pnads602.pdf on 20th December 2016
Framework Convention Alliance. (n.d.). ‘Taxation and Price: Essential Facts’. Accessed online from
http://www.fctc.org/media-and-publications/fact-sheets/price-and-tax/1309-taxation-and-price-essential-
facts on 14th September 2016
GDB collaborators (2016a). ‘Global, regional, and national life expectancy, all-cause mortality, and
cause-specific mortality for 249 causes of death, 1980–2015: a systematic analysis for the Global Burden
of Disease Study 2015’. Lancet; 388: 1459–544
GDB collaborators (2016b). Global, regional, and national incidence, prevalence, and years lived with
disability for 310 diseases and injuries, 1990–2015: a systematic analysis for the Global Burden of
Disease Study 2015’. Lancet; 388: 1545–602
GSMA Association [GSMA] (2008). Taxation and the growth of mobile services in sub-Saharan Africa.
Accessed online from http://www.gsma.com/publicpolicy/wp-
content/uploads/2012/03/taxgrowthsubsaharanafrica.pdf on 14th September 2016
GSM Association [GSMA]. (2015). Digital inclusion and mobile sector taxation 2015. Accessed from
http://www.gsma.com/mobilefordevelopment/wp-content/uploads/2015/06/Digital-Inclusion-Mobile-
Sector-Taxation-2015.pdf on 28th August 2016
Hauck K., Smith P.C., and Goddard M. (2004). The Economics of Priority Setting for Healthcare: A
Literature Review. A HNP Discussion Paper. Washington D.C: The World Bank
Heller P. (2005). Understanding fiscal space. Washington, DC: International Monetary Fund. Assessed
from http://www.imf.org/external/pubs/ft/pdp/2005/pdp04.pdf on 5th August 2016
Heller P. (2006). ‘The prospects of creating fiscal space for the health sector. Health Policy and
Planning 21 (2): 75-79. Accessed from http://heapol.oxfordjournals.org/ on August 30, 2016

49
Hines J.R. (2007). Taxing Consumption and Other Sins. University of Michigan Law School Scholarship
Repository. Accessed from
http://repository.law.umich.edu/cgi/viewcontent.cgi?article=1643&context=articles on 13th November
2016
International Monetary Fund [IMF]. (2015). Revenue and expenditure forecasting techniques for a PER
Spending: Annex 3. Accessed from
http://www.cepal.org/sites/default/files/project/files/annex_3_revenue_and_expenditure_forecasting_met
hods_for_the_sector_per.pdf on 30th August 2016
International Monetary Fund [IMF]. (2016a). Strategy for Comprehensive Tax Reform to Raise Revenue
and Promote Growth. Washington DC: IMF, Fiscal Affairs Department
International Monetary Fund (2016b). World Economic Outlook: Too Slow for Too Long. Accessed from
http://www.imf.org/external/pubs/ft/weo/2016/01/pdf/text.pdf on 25th August 2016
International Telecommunication Union [ITU]. (2014). Measuring the Information Society Report 2014.
Accessed from https://www.itu.int/en/ITU-
D/Statistics/Documents/publications/mis2014/MIS2014_without_Annex_4.pdf on 25th June 2016
Jha P., Chaloupka F.J., Moore J., Gajalakshmi V., Gupta P.C., Peck R., et al. ‘Tobacco addiction’. In:
Jamison D.T., Breman J.G., Measham A.R., Alleyne G., Claeson M., Evans D.B., et al., editors. Disease
Control Priorities in Developing Countries, 2nd ed. New York: Oxford University Press and The World
Bank; 2006:869–885. Accessed from http://www.who.int/surgery/challenges/disease-control-
priorities.pdf on 21st September 2016
Jowett M., Brunal M.P., Flores G., and Cylus J. (2016). Spending targets for health: no magic number.
Geneva: World Health Organization. Accessed online from
http://apps.who.int/iris/bitstream/10665/250048/1/WHO-HIS-HGF-HFWorkingPaper-16.1-eng.pdf on
15th December 2016
Kanyuka M., Ndawala J., Mleme T, Chisesa L., and others (2016). ‘Malawi and Millennium
Development Goal 4: A Countdown to 2015 country case study’. Lancet Global Health; 4: e201–214.
Accessed from http://dx.doi.org/10.1016/S2214-109X(15)00294-6 on 21st September 2016
Kardan A., Lievens T., Ngoma P., and Humphrey E. (2012). Sustainable Financing for HIV/AIDS in
Malawi. Oxford: Oxford Policy Management
Katharina K., Peter, C.S, and Maria G. (2004). The Economics of Priority Setting for Healthcare: A
Literature Review. Washington D.C. International Bank for Reconstruction and Development.
McIntyre D., and Kutzin J. (2016). Health financing country diagnostic: A foundation for national
strategy development. Health Systems Governance & Finance. Geneva: WHO
Ministry of Finance, Economic Planning and Development (2016). Project Proposal: Comprehensive
Review of the Tax System. Lilongwe: MoH
Ministry of Finance, Economic Planning and Development. Economic Reports. Various publications,
2011-2016
Ministry of Health (MoH) [Malawi] (2011). Malawi Health Sector Strategic Plan 2011 – 2016.
Lilongwe: Ministry of Health.
Ministry of Health (MoH) [Malawi] (2014). Malawi National Heath Accounts with subaccounts for
HIV/AIDS, Malaria, Reproductive Health, and Child Health for Financial Years 2009/10, 2010/11, and
2011/12. Lilongwe: MoH

50
Ministry of Health (MoH) [Malawi] and ICF International. (2014). Malawi Service Provision
Assessment
(MSPA) 2013-14. Lilongwe, Malawi, and Rockville, Maryland, USA: MoH and ICF International
Ministry of Health (MoH) [Malawi] and Abt Associates (2015). A comprehensive review of literature on
international and local experiences of Health Fund and Proposed Malawi Health Fund. Lilongwe: MoH
Ministry of Health (MoH) [Malawi] (2016a). Minutes of the Consultative Meeting on the Creation of a
Health Fund Held on 12th April 2016 at the World Bank Malawi Country Office. Lilongwe: MoH
Ministry of Health (MoH) [Malawi] (2016b). Malawi National Heath Accounts Report for Fiscal Years
2012/13, 2013/14 and 2014/15. Lilongwe: MoH
National Statistical Office (NSO) [Malawi] (2010). Population Projections Malawi. Accessed from
http://www.nsomalawi.mw/images/stories/data_on_line/demography/census_2008/Main%20Report/The
maticReports/Population%20Projections%20Malawi.pdf on 30th August 2016
National Statistical Office (NSO) [Malawi] (2012). Integrated Household Survey 2010-2011: Household
Socio-Economic Characteristics Report. Zomba: NSO
National Statistical Office (NSO) [Malawi] (2014). Malawi Labour Force Survey 2013. Zomba: NSO
National Statistical Office (NSO) [Malawi] and ICF International. (2016). Malawi Demographic and
Health Survey 2015-16: Key Indicators Report. Zomba, Malawi, and Rockville, Maryland, USA. NSO
and ICF International
Oxfam (2016). ‘The Right Choices: Achieving Universal Health Coverage in Malawi’. Oxfam Briefing
Note. Lilongwe: Oxfam
Parliament of Malawi (2004). Rural Electrification Act No. 21 of 2004. Accessed from
http://www.malawilii.org/mw/legislation/num-act/2004/21/numact200421.pdf on 30th August 2016
Remler D., K. (2004). ‘Poor smokers, poor quitters, and cigarette tax regressivity’. American Journal of
Public Health. Vol 94, No. 2. Accessed from
https://www.ncbi.nlm.nih.gov/pmc/articles/PMC1448232/pdf/0940225.pdf on 1st November 2016.
Reserve Bank of Malawi (RBM) (2016). Concept Note: Third Party Motor Compensation Fund for
Malawi. Lilongwe: MoH
Roy R., (2016). ‘The cost of air pollution in Africa’. OECD Working Paper No. 333. Paris: OECD
Publishing. Accessed from
http://www.un.org/africarenewal/sites/www.un.org.africarenewal/files/The_cost_%20of_air%20pollutio
n_in_%20Africa.pdf on 2nd November 2016
Savedoff W., and Alwang A. (2015). "The Single Best Health Policy in the World: Tobacco Taxes."
CGD Policy Paper 062. Washington DC: Center for Global Development. Accessed from
http://www.cgdev.org/publication/single-best-health-policy-world-tobacco-taxes on 2nd November 2016
Snowdon C., (2012). The Wages of Sin Taxes. Adam Smith Institute. Accessed from
https://static1.squarespace.com/static/56eddde762cd9413e151ac92/t/573da5009f7266965c8d6369/14636
57737237/The+Wages+of+Sin+Taxes+CJ+Snowdon+ASI_0.pdf on 2nd
November 2016.
Tandon A., and Cashin C. (2010). Assessing Public Expenditure on Health from a Fiscal Space
Perspective. Health, Nutrition, and Population (HNP) Discussion Paper. Washington, DC: The World
Bank

51
United Nations Inter-Agency Group for Child Mortality Estimation (2015). Levels & Trends in Child
Mortality: Report 2015. New York: United Nations Children’s Fund. Accessed from
http://www.childmortality.org/files_v20/download/IGME%20report%202015%20child%20mortality%2
0final.pdf on 30th August 2016
U.S. Department of the Interior (2015). U.S. Geological Survey Minerals 2013 Yearbook—
Malawi. Accessed from http://minerals.usgs.gov/minerals/pubs/country/2013/myb3-2013-mi.pdf on
30th August 2016
Wagstaff, W. (2007). Social health insurance re-examined. World Bank Policy Research Working Paper
4111. Washington, DC: World Bank.
World Bank (2013). Malawi Public Expenditure Review. Washington DC: World Bank.
World Bank (2015). ‘Improving the efficiency of HIV service implementation in Malawi: Summary of
results from Phase 1 of HIV efficiency analysis’. Lilongwe: World Bank
World Bank (2016a). Background Paper presented during the First Universal Health Coverage
Financing: Forum Raising Funds for Health. Washington DC. 14-15 April 2016. Retrieved from
http://pubdocs.worldbank.org/en/103621460561160053/DRM-policy-note-041216-clean.pdf
World Bank (2016b). Malawi Economic Monitor: Absorbing Shocks, Building Resilience. Lilongwe:
World Bank
World Bank (2017). Malawi Economic Monitor: Harnessing the Urban Economy. Lilongwe: World
Bank
World Health Organization (WHO), United Nations Children’s Fund (UNICEF), United Nations
Population Fund (UNFPA), World Bank, United Nations Population Division (2015). Trends in
Maternal Mortality: 1990 to 2015. Geneva: WHO. Accessed from
http://apps.who.int/iris/bitstream/10665/194254/1/9789241565141_eng.pdf?ua=1 on 30th August 2016
World Health Organization [WHO]. (2011). WHO Technical Manual on Tobacco Tax Administration.
Accessed from http://apps.who.int/iris/bitstream/10665/44316/1/9789241563994_eng.pdf on 30th August
2016
World Health Organization [WHO]. (2015a). Global Status Report on Road Safety 2015. Geneva: WHO
World Health Organization [WHO]. (2015b). WHO Report on the Global Tobacco Epidemic, 2015:
Raising Taxes on Tobacco. Geneva: WHO
World Health Organization [WHO]. (2015c). World Health Statistics 2015. Geneva: WHO
World Health Organization [WHO], (2015d). 2015 Global Tuberculosis Report. Geneva: WHO

52
Annexes
Annex 1: Extractives Industry
Mining activities in Malawi
Mining activity in Malawi is dominated by the extraction of uranium, coal, cement, agricultural lime;
and gemstones and ornamental stones such as amethyst, garnet, ruby, sapphire, tourmaline, agate, rose
quartz, aquamarine, and corundum (U.S. Department of the Interior, 2015). The mining sector accounted
for only 0.8% of the GDP in 2009 but in 2010, the value of output increased by 524.8 percent because of
increased production from Kayelekera Uranium Mine (ibid). In 2013, the mining sector accounted for
5.2 percent of the GDP (ibid). And according to the Malawian Government, mining has potential to
significantly contribute to Malawi’s GDP and is projected to overtake agriculture as the major
contributor to GDP. However, since 2013/14, there has been a significant reduction in uranium mining
activities particularly due to the suspension of production at Kayelekera Uranium Mine in 2014. As
shown in Figure A.1, the production value reduced from MK 52 billion in 2013/14 to MK 3 billion in
2015/16. Revenues collected also reduced from MK1.6 billion in 2013/14 to MK 145 million in 2015/16.
Figure A.1: Production value vs Revenues – Malawi Extractive Sector 2012/13-2015/16
MERA and MoF (Revenue Division)
Looking ahead, the mining sector is expected to continue experiencing modest growth estimated at 0.4
percent in 2016 and 1.6 percent in 2017. This is because it will take some time for potential exploration
to take place and bear fruit. In addition, resumption in production at the Kayelekera Uranium Mine is not
expected to take place in the course of 2016 and 2017 as international uranium prices remain low38
.
Still, the country has mineral potential as demonstrated by the number of companies that are actively
engaged in mineral exploration and mining development. The minerals being sought after include rare
earth elements, Niobium, Uranium, Zircon, Tantalite, Limestone and heavy mineral sands. The major
projects in the pipeline (Table A.1.1) include: (i) the Kanyika multi-commodity project: and (ii)
Mangochi cement production by Bwanje Cement Company and Cement Products Limited. Globe Metals
and Mining Company is also expected to start mining niobium at Kanyika in Mzimba district in 2016.
The project has an estimated deposit of around 50 million tonnes of various minerals comprising
niobium, tantalum, zircon and uranium. This could earn Malawi in excess of US$100 million per annum.
38
MoFED - Economic Report, 2016
2012/13 2013/14 2014/15 2015/16
Production Value 36,204 51,954 16,520 3,006
Revenues Collected 1,578 1,601 460 145
-
200
400
600
800
1,000
1,200
1,400
1,600
1,800
0
10,000
20,000
30,000
40,000
50,000
60,000
MK
Mill
ion
s
MK
Mill
ion
s
Production Value Revenues Collected

53
Table A.1.1: Potential Mining Projects
Company Minerals to be Mined Status
Globe Metals & Mining Niobium, Uranium, Zircon and
Tantalite
Mining Agreement
Negotiation
The Bwanje Cement Project Limestone Bankable Feasibility Study
Lynas Corporation Rare earth elements Bankable Feasibility Study
Tengani Titanium Minerals Ltd Heavy mineral sands Bankable Feasibility Study
Mkango Resources limited Rare Earth Metals Feasibility Study
Source: MoFED Economic Report, 2016
Effects of introducing a health levy in the Extractives Industry
The MoH is proposing the introduction of a health levy on extractives ranging from 1% to 3% to finance
the health sector. If the new levy is considered as an investment or as an allowable deduction for tax
purposes, then the mining companies could willingly contribute. But generally, imposing an additional
levy in the extractives industry may render the fiscal regime unattractive. This is because an additional
levy on extractives may increase the cost of investment in the sector and affect the financial viability of
companies in the sector. For example, other than mineral royalties and the corporate income tax that
companies in the mining sector are already paying, they are also contributing to corporate social
responsibility activities such as provision of water, schools, and clinics, among others. Although, these
activities are philanthropic, they affect the funds available for investment into core mining operations.
Furthermore, depending on the design of the new levy i.e. whether the levy is applied on production or
profitability, there is a potential of introducing regressivity in the fiscal regime. Lastly, the extractive
industry is a highly volatile sector and may not be able to provide a stable flow of income.
Revenue generation potential - Extractives Industry
According to the Department of Mines, Globe Metals and Mining Company is expected to start mining
operations in 2016 which could earn Malawi in excess of US$100 million per annum. Assuming this
materializes at 60 percent production over the period 2016/17-2021/22, a health levy on extractives
would generate an average of MK1.4 billion (US$1.9 million), MK2.7 billion (US$3.8 million), or
MK4.1 billion (US$5.6 million) per annum at the low, medium, and high case scenarios, respectively
(Table A.1.2). For more details see Annex 4 (A.4.3).
Table A.1.2: Projected Revenue - Extractive Health Levy (MK million) 2016/17 2017/18 2018/19 2019/20 2020/21 2021/22 Average
Low (1%) 1,355.66 1,355.49 1,355.32 1,355.15 1,354.98 1,354.82 1,355.66
Medium (2%) 2,711.31 2,710.97 2,710.64 2,710.30 2,709.97 2,709.63 2,711.31
High (3%) 4,066.97 4,066.46 4,065.96 4,065.45 4,064.95 4,064.45 4,066.97
Data Source: Department of Mines and MoFED (Revenue Division)

54
Annex 2: Alcohol
Demand for alcohol in Malawi
Consumption of alcohol in Malawi is considerably low. A 2009 nationwide survey showed that among
people aged 24 to 64, 30.1 percent of males and 4.1 percent of females consume alcohol while 19.2
percent and 2.3 percent of males and females, respectively, are considered heavy drinkers39
. WHO
(2015c) further shows that in Malawi, consumption of pure alcohol for people aged ≥15 years is about
2.5 litres per person which is significantly lower than the African average of 6 litres per person, and the
global average of 6.2 litres person. Consumption of alcohol has a direct impact on domestic production,
importation, and sale of alcohol. In Malawi, between 2012/13 and 2015/16, sales quantities for alcohol
decreased by an average of 2.2 percent from 1,250 thousand hectoliters of alcohol in 2012/13 to 1,222
thousand hectoliters of alcohol in 2015/16 (figure A.2). This is could be attributed to an increase in the
prices of alcohol due to high taxes as well as inflation. High taxation has contributed to a high sales price
of alcohol which has also contributed to a nominal increase in total sales revenue which rose by 62
percent from MK 22 billion in 2012/13 to MK35 billion in 2015/16 (figure A.2). Total tax revenue from
both domestic produce and imports fluctuated over the reference period but was higher in 2015/16 as
compared to 2012/13.
Figure A.2: Production, sales, and tax revenue from alcohol in Malawi
Data sources: National Statistics Office
Effects of introducing a health levy on alcohol
In many countries, public policies on alcohol taxation are designed to: (i) discourage individuals from
consuming excess amounts of alcohol and in the process avert crime, injury, and illnesses; and (ii)
generate a sustainable source of public financing as alcohol consumption is price inelastic (Bird and
Wallace, 2010). The MoH in Malawi is proposing an additional 10 to 30 percent levy on alcohol in line
with these principles. However, taxing alcohol is often not progressive due to the fact that in most
countries lower income individuals are likely to bear a relatively larger share of the tax burden (ibid). As
such, the overall distributive effect of taxing alcohol is often regressive both between and within income
groups (ibid). This explains why some people in Malawi are forced to consume cheap and illegally
brewed alcohol which doesn’t meet minimum health standards, and defeats the objective of introducing a
tax on alcohol to promote health. On the other hand, introducing an additional levy on alcohol could
increase smuggling and reduce overall tax revenue. Interviews with officials from the Reserve Bank of
Malawi, MoFED, and MRA revealed that there is currently a lot of smuggling of alcohol in Malawi such
that an additional tax on alcohol would further increase smuggling and reduce the overall tax revenue
from alcohol. And although alcohol taxes are generally considered to be a good source of revenue due to
39 http://saapa.net/countries/malawi/alcohol-consumption-and-its-effects-in-malawi
200
400
600
800
1,000
1,200
1,400
2012/13 2013/14 2014/15 2015/16
Tho
usa
nd
Hec
tolit
res
Sales - Domestic Produce Sales - Imports
Total Sales Quantity
2012/13 2013/14 2014/15 2015/16
0
5,000
10,000
15,000
20,000
25,000
30,000
35,000
40,000
MK
Mill
ion
Sales Value Domestic Revenue Import Revenue

55
the in-elasticity of alcohol consumption, Bird and Wallace (2010) observe that total tax revenues from
alcohol are not significant in Mauritius, Malawi, Gambia, Ghana, Mozambique, Nigeria, and Zimbabwe
probably due to a high consumption of non-market alcoholic beverages. Thus, they conclude that a
health tax on alcohol can only offer a sustainable tax base in developing countries if there is a high
consumption of alcoholic beverages that are taxed through the market (ibid).
Revenue generation potential – health levy on Alcohol
Over the period 2016/17-2021/22, the health levy on alcohol would generate an average of MK5.9
billion (US$8.2 million), MK11.8 billion (US$16.3 million), or MK17.7 billion (US$24.5 million) per
annum at the low, medium, and high case scenarios, respectively (Table A.2.1). For more details see
Annex 4 (A.4.4).
Table A.2.1: Projected Revenue - Health Levy on Alcohol (MK millions) 2016/17 2017/18 2018/19 2019/20 2020/21 2021/22 Average
Low (10%) 4,208.12 4,842.09 5,462.67 6,159.94 6,934.29 7,719.12 5,887.70
Medium (20%) 8,416.24 9,684.17 10,925.33 12,319.89 13,868.58 15,438.25 11,775.41
High (30%) 12,624.36 14,526.26 16,388.00 18,479.83 20,802.87 23,157.37 17,663.11
Data Source: National Statistics Office

56
Annex 3: Tobacco Demand for tobacco products in Malawi
According to WHO (2015c), the prevalence of smoking any tobacco product among adults aged ≥15
years in Malawi is estimated at 26.6 percent for males and 6.6 percent for females. This is lower than the
global average of 36.1 percent for males and 6.8 percent for women; but higher than the African average
of 24.2 percent for males and 2.4 percent for women (ibid). Supply of cigarettes in Malawi has been
increasing since 2013/14 with domestic production of cigarettes increasing from 16.3 million sticks in
2013/14 to 42 million sticks in 2015/16; and imported cigarettes increasing from 250 million sticks in
2013/14 to 421 million sticks in 2015/16 (figure A.3). Sales volumes also increased by 74 percent
between 2013/14 and 2015/16 from 266.3 million sticks in 2013/14 to 463 million sticks in 2015/16.
Nevertheless, the Malawian Government has not realized significant tax revenues from the sale of
cigarettes as it has been declining over the period. This could be attributed to poor tax administration
since sales quantities and values have been increasing. Tax revenue collected through imported
cigarettes decreased from MK 3.9 billion in 2013/14 to MK 2.3 billion in 2015/16 while tax revenue
from domestically produced cigarettes increased from MK 89 million in 2013/14 to MK 246 million in
2015/16. See Figure A.3 below and Annex 4 (A.4.5) for more details.
Figure A.3: Production, sales, and tax revenue from Cigarettes in Malawi
Data sources: National Statistics Office; Domestic production estimated from only one cigarette manufacturer
(Nyasa Cigarettes Limited)
Effects of introducing a health levy on tobacco
Empirical evidence suggests that raising tobacco taxes improves population health by reducing
consumption of cigarettes, and at the same time boosts government revenue. WHO (2015b) observes that
the most effective policy for reducing tobacco consumption is to increase the price of tobacco products
through tax increases. This is because higher taxes on tobacco products are very effective in reducing
smoking and saving lives among vulnerable populations such as the youth, pregnant women, and low-
income smokers (ibid). The Centre for Tobacco Control in Africa (2015) further reveals that high
tobacco prices prevents initiation among potential users, induces cessation among current users, and
reduces the frequency of consumption and amount consumed by continuing users. This leads to a
reduction in health care expenses due to smoking related illness while on the other hand tax revenue
increases. It is estimated that increasing tobacco taxes to achieve a 10 percent increase in tobacco prices
will decrease tobacco consumption by 4 percent in high-income countries and by about 5 percent in low-
and middle-income countries (WHO, 2015b). The cost per Disability Adjusted Life Year (DALY) saved
from implementing a 33 percent price increase through higher tobacco taxation ranges from US$3–42
per DALY saved in low-income countries, and US$ 13–195 per DALY saved globally (Jha et al. 2006).
0
50
100
150
200
250
300
350
400
450
500
2013/14 2014/15 2015/16
Mill
ion
sti
cks
Domestic Production Import Quantity Sales Quantity
0
1,000
2,000
3,000
4,000
5,000
6,000
7,000
8,000
9,000
10,000
2013/14 2014/15 2015/16
MK
mill
ion
Domestic Revenue Imports Revenue Sales value

57
To make a difference with respect to lives saved as well as to raise maximum possible revenues from
tobacco products, WHO (2015b) observes that Governments can collect more revenue if an excise tax40
is used, and if taxes on tobacco are at least 75 percent of the retail price of a packet of cigarettes.
Furthermore, it is more effective to use specific excise taxes, a simple tobacco tax structure, and to tax
all tobacco products comparably so that the incentive for substitution is reduced (ibid). Best practices in
tobacco taxation also require taxes to be increased regularly so that tobacco remains relatively
unaffordable. By reviewing tobacco taxes regularly, the effects of inflation, rising incomes and
purchasing power are offset.
Still, one argument that has been raised against increasing tobacco taxes is that a major reduction in
tobacco consumption will translate into a reduction in employment as the tobacco industry shrinks.
However, the effect depend on whether a country is a net importer or exporter of tobacco products.
Another argument is that it leads to tax evasion and avoidance which reduces government revenue but
not smoking. To counter this argument, WHO (2015c) suggests that having a strong tax administration
system, control over the distribution chain, and curbing illicit trade (i.e. smuggling) are critical to
maximizing the public health impact of tobacco taxes.
In the case of Malawi, there seems to be a huge potential to increase taxes on tobacco and raise revenue
for health. This is because total tax as a percentage of the retail price of a 20-cigarette pack of the most
sold brand of cigarettes in Malawi is only 21 percent, far below the recommended minimum of 75
percent (WHO, 2015b). However, consumption of tobacco products in Malawi is low, and wouldn’t
make a huge difference in raising sufficient revenues (IMF 2016a). Secondly, the retail prices of
cigarettes in Malawi are comparable to those in Mozambique and since Malawi shares a long border
with Mozambique, any significant difference in the retail prices of cigarettes between the two countries
would encourage smuggling (ibid). Third, as shown in Figure A.3 above, domestic production of
cigarettes in Malawi is very low and most of the tax revenue is from imported cigarettes. Thus, an
increase in tobacco taxation could lead to reduced consumption and importation of cigarettes, and
ultimately a reduction in revenue. The other option could be the introduction of a health levy on tobacco
production as proposed by Kardan et al. (2012). However, this option would be highly undesirable given
that tobacco (commonly referred to as the “green gold” in Malawi), is the country’s key export
commodity accounting for almost half of the country’s total merchandise exports (World Bank 2016b).
And as observed by WHO (2011) tobacco tax increases in agrarian countries like Malawi which depend
heavily on tobacco leaf exports would lead to a reduction in the global demand for tobacco products that
would in turn lead to significant job losses in Malawi.
Revenue generation potential – health levy on Tobacco
Over the period 2016/17-2021/22, the health levy on tobacco would generate an average of MK1.5
billion (US$2.1 million), MK3.1 billion (US$4.3 million), or MK4.6 billion (US$6.4 million) per annum
at the low, medium, and high case scenarios, respectively (Table A.3.1). For more details see Annex 4
(A.4.5).
Table A.3.1: Projected Revenue - Health Levy on Tobacco (Cigarettes) (MK millions) 2016/17 2017/18 2018/19 2019/20 2020/21 2021/22 Average
Low (10%) 1,096.74 1,261.97 1,423.71 1,605.44 1,807.25 2,011.80 1,534.48
Medium (20%) 2,193.48 2,523.94 2,847.41 3,210.87 3,614.50 4,023.59 3,068.97
High (30%) 3,290.22 3,785.91 4,271.12 4,816.31 5,421.75 6,035.39 4,603.45
Data Source: National Statistics Office
40An excise tax can be levied as a specific tax per pack of cigarettes or as an ad valorem tax based on value.

48
Annex 4: Detailed Data Inputs and Outputs
A.4.1: Fuel
Fuel Duties and Levies
Fuel pump price: 4th November 2016
Duties Cost Unit
Petrol 824.70 Mk/Litre
Import Duty (average) 36.61 Mk/Litre
Diesel 815.80 Mk/Litre
Exercise Duty (average) 39.91 Mk/Litre
Paraffin 648.70 Mk/Litre
Levies
Fuel Storage Levy 5.00 Mk/Litre http://www.meramalawi.mw/index.php/resource-center/pump-prices-history
Rural Electrification (MAREP) Levy (average) 34.34 Mk/Litre
Petrol 37.11 Mk/Litre Proposed Scenarios Diesel 36.71 Mk/Litre Share MAREP Levy at 10%, 20% or 30%
Paraffin 29.19 Mk/Litre Replace Storage Levy
Road Levy (average) 90.25 Mk/Litre Assumptions on projected revenue
Petrol 90.76 Mk/Litre
Growth in demand for fuel in line with overall economic growth
Diesel 89.74 Mk/Litre
Revenue from fuel levy depends on (i) volume of fuel sold per annum, (ii) rate of the fuel levy
Price Stabilization Fund Levy (average) 22.04 Mk/Litre Energy Regulation Levy 10.00 Mk/Litre
MBS CESS Levy (average) 0.87 Mk/Litre
Financial Year 2011/12 2012/13 2013/14 2014/15 2015/16 2016/17 2017/18 2018/19 2019/20 2020/21 2021/22
ACTUAL FUEL IMPORTS AND DOMESTIC CONSUMPTION PROJECTED FUEL IMPORTS AND DOMESTIC CONSUMPTION
1. Fuel import volumes (million litres) 308.30 317.30 296.65 285.11 293.59 303.89 316.82 331.89 349.33 368.54 387.93
2. Domestic consumption (million litres) 308.30 317.30 296.65 285.11 293.59 303.89 316.82 331.89 349.33 368.54 387.93
Petrol 102.20 104.30 108.90 121.00 124.60 128.97 134.46 140.85 148.26 156.41 164.64
Diesel 197.60 208.85 186.15 163.10 167.95 173.84 181.24 189.86 199.84 210.83 221.92
Paraffin 8.50 4.15 1.60 1.01 1.04 1.08 1.12 1.18 1.24 1.31 1.37
REVENUE COLLECTED PROJECTED TOTAL REVENUE
3. Rural Electrification Levy (million MK) 9,902.88 10,207.88 9,557.48 9,195.89 9,469.50 11,199.31 11,675.83 12,231.08 12,873.95 13,582.02 14,296.41
Petrol 3,327.63 3,396.01 3,545.78 3,939.76 4,056.98 4,786.09 4,989.74 5,227.02 5,501.76 5,804.36 6,109.65
Diesel 6,333.08 6,693.64 5,966.11 5,227.36 5,382.89 6,381.80 6,653.34 6,969.74 7,336.07 7,739.56 8,146.64
Paraffin 242.17 118.23 45.58 28.77 29.63 31.42 32.76 34.32 36.12 38.11 40.11
4. Storage levy (million MK) 1,541.50 1,586.50 1,483.25 1,425.55 1,467.97 1,519.45 1,584.10 1,659.44 1,746.66 1,842.72 1,939.65
5. Projected Revenue (million MK): Base is value of volumes of fuel sold PROJECTED HEALTH REVENUE
Storage levy (million MK) 1,519.45 1,584.10 1,659.44 1,746.66 1,842.72 1,939.65
Rural Electrification Levy (MAREP) (million MK)
Low scenario (10% of MAREP) 1,119.93 1,167.58 1,223.11 1,287.40 1,358.20 1,429.64
Medium scenario (20% of MAREP) 2,239.86 2,335.17 2,446.22 2,574.79 2,716.40 2,859.28
High scenario (30% of MAREP) 3,359.79 3,502.75 3,669.32 3,862.19 4,074.61 4,288.92
Input data sources: 2011/12- 2015/16: MERA and MoF (Revenue Division); 2016/17-2021/22 projected estimates

49
A.4.2: Motor Vehicle Insurance
Motor Vehicle Insurance Taxes and Levies Proposed Scenarios on Gross premiums
License fee for insurers of MK150,000.00 Low 3%
Corporate Income Tax at 30% Medium 6%
High 9%
Assumption on projected revenue
Growth in gross premiums in line with growth in nominal
GDP
Projection on motor vehicles use 4 year moving averages
Financial Year 2013/14 2014/15 2015/16 2016/17 2017/18 2018/19 2019/20 2020/21 2021/22
ACTUAL NO. OF VEHICLES PROJECTED NO. OF VEHICLES
1. No. of vehicles in Malawi by category 192,954 218,172 226,668 251,310 271,165 291,021 310,876 330,732 350,587
less than 1000cc 32,309 37,241 38,876 43,529 47,305 51,080 54,856 58,631 62,407
1000 – 1500cc 28,348 34,916 37,115 42,796 47,521 52,246 56,971 61,696 66,422
1500 – 1999cc 49,429 54,798 56,610 62,147 66,549 70,951 75,354 79,756 84,159
1999 – 2500cc 30,689 33,766 34,831 38,083 40,661 43,240 45,818 48,397 50,975
2500 – 3000cc 15,745 17,379 17,930 19,678 21,056 22,433 23,811 25,188 26,566
Exceeding 3000cc 36,434 40,072 41,306 45,077 48,074 51,070 54,067 57,063 60,060
ACTUAL GROSS PREMIUMS PROJECTED TOTAL REVENUE - GROSS PREMIUMS
2. Gross Premium (MK million) 12,075.00 16,320.70 18,851.20 22,536.39 25,931.57 29,255.06 32,989.30 37,136.28 41,339.41
3. Total No. of Road Accidents 7,390.00 7,355.00 8,194.00
Killed 977 1,060 1,068
Seriously injured 909 973 982
Minor Injuries 3,411 3,861 4,131
Vehicle damage only 2,093 1,461 2,013
4. Value of insurance claims - Third Party Injury/Death (MK Million) 2,417
PROJECTED HEALTH REVENUE
5. Projected Revenue (MK million): Base is Gross Premiums 2016/17 2017/18 2018/19 2019/20 2020/21 2021/22
Low scenario 676.09 777.95 877.65 989.68 1,114.09 1,240.18
Medium scenario 1,352.18 1,555.89 1,755.30 1,979.36 2,228.18 2,480.36
High scenario 2,028.28 2,333.84 2,632.96 2,969.04 3,342.27 3,720.55
Input data sources: 2013/14- 2015/16: National Police Headquarters & Reserve Bank of Malawi; 2016/17-2021/22 projected estimates

50
A.4.3: Extractive Industries
Levies and Taxes – Extractives Industry
Mineral Royalty 5% This may change with new mines and mineral Act, where commercial minerals will attract a royalty rate of 7.5%, precious and semi-
precious minerals 10%, and other minerals 5%
Application for mining license 100,000.00 Mk Exclusive prospecting license 50,000.00 Mk Application for mining claim 3,000.00 Mk
Proposed Scenarios on Production Value
Reserve mineral license 10,000.00 Mk/Year
Low 1%
Application for non-exclusive prospecting license 2,000.00 Mk/district, max 3 districts Medium 2%
Ground fees mining license 50,000.00 Mk/ Sq. km per year High 3%
Ground rental fees exclusive prospecting license 10,000.00 Mk/Sq. km
Assumptions
Growth in revenues in line with nominal GDP growth
Growth in production assumed to continue at current rate & policy
Financial Year 2012/13 2013/14 2014/15 2015/16 2016/17 2017/18 2018/19 2019/20 2020/21 2021/22
1. Production figures (tonnes) 1,321,071 1,255,238 1,192,266 1,279,623 1,319,891 1,253,891 1,191,201 1,279,623 1,319,891 1,253,891
Paladin 1,180 1,347 1,065 - - - - - - -
All other mines 1,319,891 1,253,891 1,191,201 1,279,623 1,319,891 1,253,891 1,191,201 1,279,623 1,319,891 1,253,891
ACTUAL PRODUCTION VALUE PROJECTED PRODUCTION VALUE
2. Production Value (MK million) 36,204 51,954 16,520 3,006 135,566 135,549 135,532 135,515 135,498 135,482
Paladin 33,190 49,090 13,800 - 132,706 132,706 132,706 132,706 132,706 132,706
All other mines 3,014 2,864 2,720 3,006 2,859 2,842 2,825 2,809 2,792 2,775
3. Revenue collected (MK million) 1,578 1,601 460 145 173 199 225 253 285 317
Paladin 1,238 1,354 292 - - - - - - -
All other mines 340 247 168 145 173 199 225 253 285 317
PROJECTED HEALTH REVENUE
Projected revenue (MK million): Base is Production Value 2016/17 2017/18 2018/19 2019/20 2020/21 2021/22
Low scenario 1,355.66 1,355.49 1,355.32 1,355.15 1,354.98 1,354.82
Medium scenario 2,711.31 2,710.97 2,710.64 2,710.30 2,709.97 2,709.63
High scenario 4,066.97 4,066.46 4,065.96 4,065.45 4,064.95 4,064.45
Input data sources: 2012/13- 2015/16: Department of Mines and MoF (Revenue Division); 2016/17-2021/22 projected estimates

51
A.4.4: Alcohol
Alcohol Taxes and Levies
Imported Alcohol
Proposed Scenarios on volume of domestic production and imports Import duty 25%
Low 10%
Import excise
Medium 20%
If packaged in sachets or plastic bottles 250%
High 30%
Otherwise 95%
Assumptions
Import VAT 16.5% Growth in sales quantity in line with Real GDP growth
Domestic Alcohol
Growth in sales value in line with nominal GDP growth Excise
Beer 90%
Opaque 40%
VAT 16.5%
Financial Year 2012/13 2013/14 2014/15 2015/16 2016/17 2017/18 2018/19 2019/20 2020/21 2021/22
1. Production DOMESTIC PRODUCTION AND IMPORTS PROJECTED - DOMESTIC PRODUCTION AND IMPORTS
Domestic Production (Thousand Hectolitres) 318.41 308.66 313.04 285.65 295.67 308.25 322.91 339.88 358.58 377.44
Import Quantity (Thousand Hectolitres) 931.59 938.34 955.96 936.35 969.19 1,010.43 1,058.48 1,114.11 1,175.39 1,237.21
2. Sales Quantity - (Thousand Hectolitres) 1,250.00 1,247.00 1,269.00 1,222.00 1,264.86 1,318.68 1,381.39 1,454.00 1,533.97 1,614.65
ACTUAL SALES VALUE PROJECTED SALES VALUE
3. Sales value (MK million) 21,780.00 32,450.00 31,240.00 35,200.00 42,081.19 48,420.86 54,626.66 61,599.43 69,342.91 77,191.23
Domestic Tax Revenue (MK million) 7,964.20 16,167.95 10,935.80 13,364.80 15,977.46 18,384.52 20,740.75 23,388.19 26,328.24 29,308.11
Excise (MK million) 4,370.50 10,813.70 5,781.20 7,556.80 9,034.07 10,395.08 11,727.35 13,224.28 14,886.66 16,571.55
VAT (MK million) 3,593.70 5,354.25 5,154.60 5,808.00 6,943.40 7,989.44 9,013.40 10,163.91 11,441.58 12,736.55
Revenue collected from imports (MK million) 949.90 1,974.30 2,173.60 1,481.40 1,771.00 2,037.80 2,298.98 2,592.43 2,918.31 3,248.61
Import duty (MK million) 81.60 79.70 105.90 90.70 108.43 124.77 140.76 158.72 178.68 198.90
Import VAT (MK million) 646.40 550.20 587.60 671.30 802.53 923.44 1,041.79 1,174.76 1,322.44 1,472.12
Import Excise (MK million) 221.90 1,344.40 1,480.10 719.40 860.03 989.60 1,116.43 1,258.94 1,417.20 1,577.60
TOTAL REVENUE 8,914.10 18,142.25 13,109.40 14,846.20 17,748.46 20,422.32 23,039.73 25,980.61 29,246.56 32,556.72
4. Projected Revenue (MK million): Base is Sales Value PROJECTED HEALTH REVENUE
Low scenario 4,208.12 4,842.09 5,462.67 6,159.94 6,934.29 7,719.12
Medium scenario 8,416.24 9,684.17 10,925.33 12,319.89 13,868.58 15,438.25
High scenario 12,624.36 14,526.26 16,388.00 18,479.83 20,802.87 23,157.37
Input data sources: 2012/13- 2015/16: National Statistics Office; 2016/17-2021/22 projected

52
A.4.5: Tobacco
Tobacco Taxes and Levies41
Proposed Scenarios – Sales of domestic and imported cigarettes
Domestic Low 10%
Excise 15.00 USD/1000 Sticks Medium 20%
VAT 16.5% High 30%
Imported Assumptions
Import duty 25% Growth in quantity in line with Real GDP growth
Import excise 15.00 USD/1000 Sticks Growth in sales value of domestic production & imports in line with nominal GDP growth
Import VAT 16.5%
Financial Year 2013/14 2014/15 2015/16 2016/17 2017/18 2018/19 2019/20 2020/21 2021/22
1. Production and Importation of Cigarettes
Domestic Production (Million sticks) 16.30 35.00 42.00 43.47 45.32 47.48 49.97 52.72 55.50
Imports Quantity (Million sticks) 250.00 250.00 421.00 435.77 454.31 475.91 500.93 528.48 556.27
Sales Quantity (Million sticks) 266.30 285.00 463.00 479.24 499.63 523.39 550.90 581.20 611.77
ACTUAL SALES VALUE PROJECTED SALES VALUE
2. Sales Value (MK million)
4,821.00 5,500.00 9,174.00 10,967.41 12,619.69 14,237.07 16,054.35 18,072.50 20,117.96
Domestic Tax Revenue (MK million) 88.87 176.64 246.07 294.17 338.49 381.87 430.62 484.75 539.61
Excise (MK million) 58.67 143.64 206.47 246.83 284.02 320.42 361.32 406.74 452.77
VAT (MK Million) 30.20 33.00 39.60 47.34 54.47 61.45 69.30 78.01 86.84
Imports Tax Revenue (MK million) 3,932.60 2,788.40 2,261.00 2,703.00 3,110.22 3,508.83 3,956.71 4,454.10 4,958.22
Import duty (MK million) 34.80 37.10 28.10 33.59 38.65 43.61 49.17 55.36 61.62
Import VAT (MK million) 710.70 542.90 466.70 557.93 641.99 724.27 816.72 919.38 1,023.44
Import Excise (MK million) 3,187.10 2,208.40 1,766.20 2,111.47 2,429.57 2,740.95 3,090.82 3,479.36 3,873.16
2016/17 2017/18 2018/19 2019/20 2020/21 2021/22
3. Projected Revenue (MK million): Base is Sales Value PROJECTED HEALTH REVENUE
Low scenario 1,096.74 1,261.97 1,423.71 1,605.44 1,807.25 2,011.80
Medium scenario 2,193.48 2,523.94 2,847.41 3,210.87 3,614.50 4,023.59
High scenario 3,290.22 3,785.91 4,271.12 4,816.31 5,421.75 6,035.39
Input data Source: 2012/13-2015/16 National Statistics Office; Domestic production estimated from only one cigarette manufacturer (Nyasa Cigarettes Limited); 2016/17-2021/22 projected
41 According to IMF (2016a), cigarettes are subject to a specific excise of US$15 per 1,000 cigarettes regardless of the type of packaging; and whether domestically produced and imported. This is aimed at increasing
tax compliance and avoiding smuggling in line with rules set by WTO and the Common Market for Eastern and Southern Africa (COMESA).