fiscal space forsocial protection a handbook for …
TRANSCRIPT
This practical handbook is an essential companion to assess financing options to extend social protection coverage and benefits. It is often argued that universal social protection systems, including floors, are not affordable and that there is insufficient budget to cover all children, women and men. This guide demonstrates that there are alternatives even in the poorest countries. These include eight options: (1) expanding social security coverage and contributory revenues; (2) increasing tax revenues; (3) eliminating illicit financial flows; (4) re-allocating public expenditures; (5) using fiscal and central bank foreign exchange reserves; (6) borrowing and restruc-turing existing debt; (7) adopting a more accommodating macroeconomic fram work; and (8) increasing aid and transfers. All of the financing options described in this handbook are supported by policy statements of the United Nations and international financial institutions – and governments around the world have been applying them for decades, showing a wide variety of revenue choices. National dialogue, with government, employers and workers as well as civil society, academics, UN agencies and others, is fundamental to generate political will to exploit all possible fiscal space options in a country, and adopt the optimal mix of public policies for inclusive growth with jobs and social protection.
Isabel Ortiz
Anis Chowdhury
Fabio Durán-Valverde
Taneem Muzaffar
Stefan UrbanILO
- UN
WOM
EN
FIS
CAL
SPAC
E FO
R SO
CIAL
PRO
TECT
ION
A H
andb
ook
for
Ass
essi
ng F
inan
cing
Opt
ions
FISCAL SPACE FOR SOCIAL PROTECTIONA Handbook for Assessing Financing Options

FISCAL SPACE FOR SOCIAL PROTECTIONA Handbook for Assessing Financing Options
Copyright © International Labour Organization 2019First published 2019
Publications of the International Labour Office enjoy copyright under Protocol 2 of the Universal Copyright Convention. Nevertheless, short excerpts from them may be reproduced without authorization, on condition that the source is indicated. For rights of reproduction or translation, application should be made to ILO Publi-cations (Rights and Permissions), International Labour Office, CH-1211 Geneva 22, Switzerland, or by email: [email protected]. The International Labour Office welcomes such applications.
Libraries, institutions and other users registered with reproduction rights organizations may make copies in accordance with the licences issued to them for this purpose. Visit www.ifrro.org to find the reproduction rights organization in your country.
FISCAL SPACE FOR SOCIAL PROTECTION: A Handbook for Assessing Financing Options
ISBN 978-92-2-134084-3 (print)ISBN 978-92-2-134085-0 (web pdf)
The designations employed in ILO publications, which are in conformity with United Nations practice, and the presentation of material therein do not imply the expression of any opinion whatsoever on the part of the International Labour Office concerning the legal status of any country, area or territory or of its authorities, or concerning the delimitation of its frontiers.
The responsibility for opinions expressed in signed articles, studies and other contributions rests solely with their authors, and publication does not constitute an endorsement by the International Labour Office of the opinions expressed in them.
Reference to names of firms and commercial products and processes does not imply their endorsement by the International Labour Office, and any failure to mention a particular firm, commercial product or process is not a sign of disapproval.
ILO publications and electronic products can be obtained through major booksellers or ILO local offices in many countries, or direct from ILO Publications, International Labour Office, CH-1211 Geneva 22, Switzer-land. Catalogues or lists of new publications are available free of charge from the above address, or by email: [email protected]
Visit our web site: www.ilo.org/publns.
This publication was produced by the Document and Publications Production, Printing and Distribution Branch (PRODOC) of the ILO.
Graphic and typographic design, layout and composition, manuscript preparation, copy editing, proofreading, printing, electronic publishing and distribution.PRODOC endeavours to use paper sourced from forests managed in an
environmentally sustainable and socially responsible manner.
Code: CPG-REP
III
AUTHORS
Isabel OrtizFormer Director, Social Protection Department, ILO Anis ChowdhuryFormer Director, Macroeconomic Policy and Development Division, UN ESCAPFabio Durán Valverde Head, Public Finance, Actuarial and Statistics Unit, Social Protection Department, ILOTaneem MuzaffarPublic Finance Economist, Social Protection Department, ILOStefan UrbanSocial Protection Financing Expert, Social Protection Department, ILO

V
ACKNOWLEDGEMENTS
This Handbook is a new update of the original Identifying Fiscal Space: Options for Social and Economic Development for Children and Poor Households in 184 Countries published by UNICEF in 2012, and its later 2017 revision, Fiscal Space for Social Protection and the SDGs: Options to Expand Social Investments in 187 Countries, co-published by the ILO, UNICEF and UNWOMEN, and translated into several languages.
The Handbook also benefits from an earlier ILO work, Fiscal Space and the Extension of Social Protection: Lessons Learnt From Developing Countries: Bolivia, Botswana, Brazil, Costa Rica, Lesotho, Namibia, Thailand and South Africa, published in 2012.
In this version, the authors appreciate the guidance and support received from Deborah Greenfield (Deputy Director General for Policy, ILO), Valerie Schmitt (Deputy Director, SOCPRO, ILO), Christina Behrendt (Head, Social Policy Unit, SOCPRO, ILO), Karuna Pal (Head, Programming, Partnerships, and Knowledge-sharing Unit, SOCPRO, ILO), Sergio Velasco (Senior Social Security Economist, SOCPRO, ILO), Nuno Cunha (Senior Social Protection Technical Specialist, ILO), Helmut Schwarzer (Senior Social Protection and Economic Development Specialist, ILO), Celine Peyron Bista (Senior Social Protection Specialist, ILO), Veronika Wodsak (Social Protection Policy Specialist, ILO), Andres Acuna-Ulate (Social Security Actuary, ILO), Lou Tessier (Health Protection Specialist, ILO), Henrik Moller (Senior Relations Specialist, ACTEMP, ILO), Ursula Kulke (Specialist in Workers’ Activities, ACTRAV, ILO), Anuradha Seth (Senior Economist, UNWOMEN), Mamadou Bobo Diallo (Economist, UNWOMEN), Evelyn Astor (Economic and Social Policy Advisor, International Trade Union Confed-eration) and Matthew Cummins (Public Finance Specialist, UNICEF); as well as the contributions from José Francisco Pacheco (Senior Public Finance Specialist/consultant), Kroum Markov (Social Protection Policy Specialist, ILO), Valeria Nesterenko (Social Protection Officer and Statistician, ILO) and Victoria Giroud-Castiella (Social Protection Officer, ILO). A note of appreciation needs to be extended to Christoph Ernst (Senior Employment and Productive Development Specialist, ILO), Tomas Damerau (Economist/consultant) and Laura Schmitt (former intern, ILO) for earlier work, including on an unpublished fiscal space comparator.
The options and approach of the Handbook benefited from discussions at the United Nations Inter-Agency Task Force on Financing Social Protection, led by the ILO Social Protection Department (SOCPRO) for the UN Financing for Development Office; side events at the IMF/World Bank Spring Meetings 2018 in Washington DC, and a conference in Brussels organized by the International Trade Union Confederation (ITUC) in September 2018 including participants from the IMF, the World Bank, the OECD, the European Commission, as well as from civil society organizations and trade unions from all continents.
FISCAL SPACE FOR SOCIAL PROTECTION | A Handbook for Assessing Financing OptionsVI
The earlier publications benefited from comments and contributions from colleagues and partners worldwide, though they have not contributed to this update. The authors would like to thank the following persons in particular (by alphabetical order, with the titles held at the time): Roberto Benes (Regional Adviser on Social Policy, UNICEF Regional Office for the Middle East and North Africa), Jingqing Chai (Chief Economic and Social Analysis, UNICEF), Michael Clark (Interregional Adviser, United Nations Conference on Trade and Development, UNCTAD), Degol Hailu (Economic Policy Advisor, United Nations Development Program, UNDP), Gail Hurley (Policy Specialist, United Nations Development Program, UNDP), Gabriele Koehler (Visiting Fellow, University of Sussex), Lisa Kurbiel (Senior Social Policy Specialist, UNICEF Mozambique), Fatou Lo (Program Specialist, UNWOMEN), Alberto Minujin (Professor, New School), Richard Morgan (Director Policy and Practice, UNICEF), Jose Antonio Ocampo (Professor at Columbia University and ILO Goodwill Ambassador for Social Protection), Wolfgang Scholz (former Senior Economist, ILO), Oscar Ugarteche (Senior Researcher, National Autonomous University of Mexico), Rolph van der Hoeven (Professor of Employment and Development Economics, Erasmus University), Matías Vernengo (Associate Professor, University of Utah) and Richard Wolff (Professor of Economics Emeritus, University of Massachusetts, Amherst).
VII
LIST OF ABBREVIATIONS
ABC OECD Anti Bribery ConventionABND assessment-based national dialogueADB Asian Development BankAFESD Arab Fund for Economic and Social DevelopmentAIIB Asian Infrastructure Investment BankALBA Bolivarian Alliance for the People of the AmericasASEAN Association of Southeast Asian NationsAU (C) African Union (Commission)BANDES Bank for Economic and Social Development of VenezuelaBIS Bank for International SettlementsBNDES Bank for National Economic and Social Development of BrazilBoP balance of paymentsBRICS Brazil, Russian Federation, India, China, South AfricaCAF Andean Development CorporationCAN Andean CommunityCARICOM Caribbean CommunityCCSS Costa Rican Social Insurance Fund (Spanish acronym)CT cash transferCEACR ILO Committee of Experts on the Application of Conventions and RecommendationsCOFOG classification of the functions of governmentCPA country programmable aidCPIA World Bank’s Country Policy and Institutional AssessmentsCRS Common Reporting StandardCSO civil society organizationCUP contracted unit for primary careDAC OECD Development Assistance CommitteeDB defined benefitDC defined contributionDFID Department for International Development (United Kingdom)DOD debt outstanding and disbursedDRC Democratic Republic of CongoDSA debt sustainability assessmentEAC East African CommunityECLAC UN Economic Commission for Latin America and the CaribbeanECOSOC United Nations Economic and Social CouncilECOWAS Economic Community of West African StatesEITI Extractive Industries Transparency InitiativeERP European Recovery ProgramESCAP UN Economic and Social Commission for Asia and the PacificESCWA UN Economic and Social Commission for West AsiaESPROSS European System of Integrated Social Protection StatisticsETI employment tax incentiveETUI European Trade Union InstituteEU European UnionFAO Food and Agriculture Organization of the United NationsFATCA Foreign Account Tax Compliance ActFATF financial action task force
FISCAL SPACE FOR SOCIAL PROTECTION | A Handbook for Assessing Financing OptionsVIII
FES Friedrich Ebert Stiftung FLAR Latin American Reserve Fund (Spanish acronym)FTAA Free Trade Association of the AmericasFTT financial transaction taxGBS general budget supportGDP gross domestic product GNI gross national incomeHDI human development indexHIPC Heavily Indebted Poor Countries InitiativeIADB Inter-American Development BankIAEG Inter Agency and Expert GroupIDA World Bank’s International Development Association Concessional FundIDB Inter-American Development BankIEO IMF Independent Evaluation OfficeIFC International Finance CorporationIFF illicit financial flowsIFIs international financial institutionsIIP international investment positionILO International Labour OrganizationIMF International Monetary FundIOE International Organization of EmployersIPD implicit pension debtIRS United States Internal Revenue ServiceISSA International Social Security Association ITCILO International Training Centre of the ILOITO International Tax OrganizationITUC International Trade Union ConfederationJEDH joint external debt hubLAC Latin America and the CaribbeanLAS League of Arab StatesLDCs least developed countriesLEAP Livelihood Employment against Poverty Programme (Ghana)LICs low-income countriesLMICs lower middle income countriesMERCOSUR South American Common Market (Spanish)MDGs Millennium Development GoalsMHI mandatory health insuranceMHSP Ministry of Health and Social Protection (Republic of Tajikistan)MISSOC Mutual Information System on Social Protection (European Commission)MNCs multinational corporations MTEF medium term expenditure frameworkNAIRU non-accelerating inflation rate of unemploymentNGO non-governmental organizationNSO national statistical officeODA official development assistanceODI Overseas Development Institute (United Kingdom)OECD Organisation for Economic Co-operation and Development OOP out-of-pocket paymentsOPEC Organization of the Petroleum Exporting CountriesPAYG pay-as-you-go (pensions)PBB performance-based budgetingPCC pension crediting for caregiversPEERs public environmental expenditure reviews
IXLIST OF ABBREVIATIONS
PERs public expenditure reviewsPPP public-private partnershipRAP rapid assessment protocolR&D research and developmentSAARC South Asian Association for Regional CooperationSADC Southern African Development CommunitySAS social accounting systemSASSA South Africa Social Security AgencySDGs Sustainable Development Goals SDR special drawing rightsSI social insuranceSIB social impact bondSIDS small island developing statesSME small and medium enterpriseSOE state owned enterpriseSPF-I One-UN Social Protection Floor InitiativeSPI Social Protection IndexSPIAC-B Social Protection Inter-Agency Cooperation Board SSA Social Security Administration (United States)SSI ILO Social Security Inquiry StAR Stolen Asset Recovery InitiativeSWAp sector wide approachSWFI Sovereign Wealth Fund InstituteSWFs sovereign wealth fundsTA technical assistanceTIKA Turkish Cooperation and Development AgencyUAE United Arab EmiratesUBI universal basic incomeUHC universal health coverageUN United NationsUNCTAD United Nations Conference on Trade and DevelopmentUNDAF United Nations Development Agreement FrameworkUNDESA United Nations Department of Economic and Social AffairsUNDG United Nations Development GroupUNDOCO United Nations Development Operations Coordination OfficeUNDP United Nations Development ProgrammeUNESCAP United Nations Economic and Social Commission for Asia and the PacificUNFPA United Nations Population FundUNHCR United Nations High Commissioner for Refugees UNICEF United Nations International Children’s Fund UNODC United Nations Office on Drugs and CrimeUNRISD United Nations Research Institute for Social Development UNSSC United Nations System Staff CollegeUN WIDER UN World Institute for Development Economics ResearchUNWPP UN World Population ProspectsUSAID United States Agency for International Development VAT value-added taxWB World BankWEF World Economic ForumWFP World Food ProgrammeWHO World Health Organization

XI
TABLE OF CONTENTS
Chapter 1. Fiscal space for social protection . . . . . . . . . . . . . . . . . . . . . . . . . . . . . . . . . 1
1.1 Introduction . . . . . . . . . . . . . . . . . . . . . . . . . . . . . . . . . . . . . . . . . . . . . . . . . . . 21.2 The Handbook . . . . . . . . . . . . . . . . . . . . . . . . . . . . . . . . . . . . . . . . . . . . . . . . . 31.3 Key social protection issues . . . . . . . . . . . . . . . . . . . . . . . . . . . . . . . . . . . . . . . . 4
1.3.1 The investment case: The importance of social protection for national development . . . 41.3.2 Universal social protection for all . . . . . . . . . . . . . . . . . . . . . . . . . . . . . . . . . . . 61.3.3 Social protection floor and minimum social security standards . . . . . . . . . . . . . . . . 7
1.4 The concept of fiscal space . . . . . . . . . . . . . . . . . . . . . . . . . . . . . . . . . . . . . . . . 91.5 Fiscal space options . . . . . . . . . . . . . . . . . . . . . . . . . . . . . . . . . . . . . . . . . . . . 101.6 Timing, feasibility and impact of the different fiscal space options . . . . . . . . . . . . . 121.7 Concluding remarks . . . . . . . . . . . . . . . . . . . . . . . . . . . . . . . . . . . . . . . . . . . . 161.8 Key documents . . . . . . . . . . . . . . . . . . . . . . . . . . . . . . . . . . . . . . . . . . . . . . . 16
Chapter 2. Social protection financing: Indicators and trends . . . . . . . . . . . . . . . . . . 19
2.1 Expenditure indicators and sources of data . . . . . . . . . . . . . . . . . . . . . . . . . . . . 202.1.1 Expenditure indicators . . . . . . . . . . . . . . . . . . . . . . . . . . . . . . . . . . . . . . . . 202.1.2 Data sources . . . . . . . . . . . . . . . . . . . . . . . . . . . . . . . . . . . . . . . . . . . . . . 212.1.3 Limitations of existing data sources . . . . . . . . . . . . . . . . . . . . . . . . . . . . . . . . 21
2.2 Trends in public social protection expenditure . . . . . . . . . . . . . . . . . . . . . . . . . . . 232.2.1 Fiscal space: Necessary for public social protection spending and other social policies 262.2.2 Public social protection spending: Affordability and political will . . . . . . . . . . . . . . 28
2.3 Trends in government revenue . . . . . . . . . . . . . . . . . . . . . . . . . . . . . . . . . . . . . . 292.4 Concluding remarks . . . . . . . . . . . . . . . . . . . . . . . . . . . . . . . . . . . . . . . . . . . . . 312.5 Key documents and data sources . . . . . . . . . . . . . . . . . . . . . . . . . . . . . . . . . . . 31
Chapter 3. Key concepts to understand national budgets . . . . . . . . . . . . . . . . . . . . . 33
3.1 Structure of national budget . . . . . . . . . . . . . . . . . . . . . . . . . . . . . . . . . . . . . . . 343.1.1 Revenue . . . . . . . . . . . . . . . . . . . . . . . . . . . . . . . . . . . . . . . . . . . . . . . . . 343.1.2 Classification and composition of revenues . . . . . . . . . . . . . . . . . . . . . . . . . . . 343.1.3 Expenditures . . . . . . . . . . . . . . . . . . . . . . . . . . . . . . . . . . . . . . . . . . . . . . 353.1.4 Classification and composition of expenditures . . . . . . . . . . . . . . . . . . . . . . . . . 353.1.5 Current and capital expenditure . . . . . . . . . . . . . . . . . . . . . . . . . . . . . . . . . . 373.1.6 Typology and composition of social protection revenue and expenditures . . . . . . . . 403.1.7 Below-the-line items . . . . . . . . . . . . . . . . . . . . . . . . . . . . . . . . . . . . . . . . . . 403.1.8 Surplus/deficit and debt . . . . . . . . . . . . . . . . . . . . . . . . . . . . . . . . . . . . . . . 40
3.2 Identifying fiscal consolidation/adjustment or austerity cuts . . . . . . . . . . . . . . . . . . 423.3 Improving budget outcomes . . . . . . . . . . . . . . . . . . . . . . . . . . . . . . . . . . . . . . . 45
3.3.1 Principles of good budgeting . . . . . . . . . . . . . . . . . . . . . . . . . . . . . . . . . . . . 453.3.2 Performance-based budgeting . . . . . . . . . . . . . . . . . . . . . . . . . . . . . . . . . . . 463.3.3 Social budgeting . . . . . . . . . . . . . . . . . . . . . . . . . . . . . . . . . . . . . . . . . . . 473.3.4 Gender budgeting . . . . . . . . . . . . . . . . . . . . . . . . . . . . . . . . . . . . . . . . . . . 49
XII
XII
3.4 The budgetary process . . . . . . . . . . . . . . . . . . . . . . . . . . . . . . . . . . . . . . . . . . 493.5 National social dialogue and the budget process . . . . . . . . . . . . . . . . . . . . . . . . . 513.6 Concluding remarks . . . . . . . . . . . . . . . . . . . . . . . . . . . . . . . . . . . . . . . . . . . . 533.7 Key documents and data sources . . . . . . . . . . . . . . . . . . . . . . . . . . . . . . . . . . . 53
Chapter 4. Social security contributions . . . . . . . . . . . . . . . . . . . . . . . . . . . . . . . . . . . . 55
4.1 Why social contributions? . . . . . . . . . . . . . . . . . . . . . . . . . . . . . . . . . . . . . . . . . 564.2 Understanding controversies about social security contributions . . . . . . . . . . . . . . 574.3 Positive impacts of social security contributions on aggregated demand, growth, productivity, and household income . . . . . . . . . . . . . . . . . . . . . . . . . . . . . . . . . . 614.4 Women in social security contributory systems: Advancing gender equality . . . . . . . 634.5 Creating fiscal space through social contributions in practice . . . . . . . . . . . . . . . . . 65
4.5.1 Extending legal coverage: developing comprehensive social protection systems . . . . 654.5.2 Extending effective coverage . . . . . . . . . . . . . . . . . . . . . . . . . . . . . . . . . . . . 664.5.3 Extending coverage. Overcoming challenges: Regional and country experiences . . . 674.5.4 Adjusting social security contribution rates . . . . . . . . . . . . . . . . . . . . . . . . . . . . 72
4.6 Concluding remarks . . . . . . . . . . . . . . . . . . . . . . . . . . . . . . . . . . . . . . . . . . . . . 744.7 Key documents and data sources . . . . . . . . . . . . . . . . . . . . . . . . . . . . . . . . . . . 75
Chapter 5. Taxation . . . . . . . . . . . . . . . . . . . . . . . . . . . . . . . . . . . . . . . . . . . . . . . . . . . . . . 77
5.1 Why this option? . . . . . . . . . . . . . . . . . . . . . . . . . . . . . . . . . . . . . . . . . . . . . . . 785.1.1 Taxation in developing countries . . . . . . . . . . . . . . . . . . . . . . . . . . . . . . . . . . 785.1.2 Overall tax performance . . . . . . . . . . . . . . . . . . . . . . . . . . . . . . . . . . . . . . . 795.1.3 Performance of different types of taxes . . . . . . . . . . . . . . . . . . . . . . . . . . . . . . 80
5.2 Types of taxes: Scope for enhancing tax revenues . . . . . . . . . . . . . . . . . . . . . . . 825.2.1 Tax potential or capacity: Tax gap . . . . . . . . . . . . . . . . . . . . . . . . . . . . . . . . . 835.2.2 Personal income and corporate tax . . . . . . . . . . . . . . . . . . . . . . . . . . . . . . . . 845.2.3 Taxes on the financial sector, Financial Transaction Tax (FTT) . . . . . . . . . . . . . . . . 855.2.4 Property tax . . . . . . . . . . . . . . . . . . . . . . . . . . . . . . . . . . . . . . . . . . . . . . . 875.2.5 Taxation of natural resources or extractive industries . . . . . . . . . . . . . . . . . . . . . 885.2.6 Consumption taxes, VAT . . . . . . . . . . . . . . . . . . . . . . . . . . . . . . . . . . . . . . 915.2.7 Excise duties and trade taxes . . . . . . . . . . . . . . . . . . . . . . . . . . . . . . . . . . . . 915.2.8 Innovative taxes: Sin taxes, airport and hotel taxes, arms and carbon taxes . . . . . . . 92
5.3 Tax reforms . . . . . . . . . . . . . . . . . . . . . . . . . . . . . . . . . . . . . . . . . . . . . . . . . . . 945.3.1 Issues in tax reforms . . . . . . . . . . . . . . . . . . . . . . . . . . . . . . . . . . . . . . . . . 945.3.2 Tackling corruption and tax evasion; regional and international cooperation . . . . . . . 975.3.3 General taxation or earmarked taxes? . . . . . . . . . . . . . . . . . . . . . . . . . . . . . . 98
5.4 Concluding remarks . . . . . . . . . . . . . . . . . . . . . . . . . . . . . . . . . . . . . . . . . . . . 985.5 Key documents and data sources . . . . . . . . . . . . . . . . . . . . . . . . . . . . . . . . . . . 99
Chapter 6. Illicit financial flows and corruption . . . . . . . . . . . . . . . . . . . . . . . . . . . . . . . 101
6.1 What are illicit financial flows? . . . . . . . . . . . . . . . . . . . . . . . . . . . . . . . . . . . . . . 1026.2 Why combat illicit financial flows and corruption? . . . . . . . . . . . . . . . . . . . . . . . . . 102
6.2.1 Extent of illicit financial flows . . . . . . . . . . . . . . . . . . . . . . . . . . . . . . . . . . . . . 1056.3 Measures to combat IIFs. . . . . . . . . . . . . . . . . . . . . . . . . . . . . . . . . . . . . . . . . . 1066.4 Some challenges . . . . . . . . . . . . . . . . . . . . . . . . . . . . . . . . . . . . . . . . . . . . . . . 111
CONTENTS XIII
6.5 Concluding remarks . . . . . . . . . . . . . . . . . . . . . . . . . . . . . . . . . . . . . . . . . . . . 1136.6 Key documents and data sources . . . . . . . . . . . . . . . . . . . . . . . . . . . . . . . . . . . 113
Chapter 7. Public expenditure reprioritization . . . . . . . . . . . . . . . . . . . . . . . . . . . . . . . . 115
7.1 Why expenditure reprioritization? . . . . . . . . . . . . . . . . . . . . . . . . . . . . . . . . . . . . 1167.1.1 The political economy of expenditure reprioritization . . . . . . . . . . . . . . . . . . . . . . 1197.2.1 Criteria for evaluation . . . . . . . . . . . . . . . . . . . . . . . . . . . . . . . . . . . . . . . . . 1217.2.2 Reviewing the effectiveness, efficiency and sustainability of public policies . . . . . . . 1227.2.3 Value for money: Beyond simple financial cost-benefit analysis . . . . . . . . . . . . . . . 1237.2.4 Challenges of PERs . . . . . . . . . . . . . . . . . . . . . . . . . . . . . . . . . . . . . . . . . . 125
7.3 Concluding remarks . . . . . . . . . . . . . . . . . . . . . . . . . . . . . . . . . . . . . . . . . . . . . 1257.4 Key documents and data sources . . . . . . . . . . . . . . . . . . . . . . . . . . . . . . . . . . . 126
Chapter 8. Using fiscal and foreign exchange reserves. . . . . . . . . . . . . . . . . . . . . . . . 129
8.1 Why use fiscal and foreign exchange reserves . . . . . . . . . . . . . . . . . . . . . . . . . . . 1308.2 Fiscal reserves . . . . . . . . . . . . . . . . . . . . . . . . . . . . . . . . . . . . . . . . . . . . . . . . 131
8.2.1 Sovereign wealth funds . . . . . . . . . . . . . . . . . . . . . . . . . . . . . . . . . . . . . . . 1318.2.2 Arguments for SWFs . . . . . . . . . . . . . . . . . . . . . . . . . . . . . . . . . . . . . . . . . 1348.2.3 Disadvantages of SWFs . . . . . . . . . . . . . . . . . . . . . . . . . . . . . . . . . . . . . . . 135
8.3 Central bank foreign exchange reserves . . . . . . . . . . . . . . . . . . . . . . . . . . . . . . . 1368.3.1 Foreign exchange reserves of developing countries . . . . . . . . . . . . . . . . . . . . . . . 1368.3.2 Arguments for accumulating foreign exchange reserves . . . . . . . . . . . . . . . . . . . . 1378.3.3 Disadvantages of accumulating foreign reserves . . . . . . . . . . . . . . . . . . . . . . . . 138
8.4 Using foreign reserves for development: Public investments, National and Regional Development Banks . . . . . . . . . . . . . . . . . . . . . . . . . . . . . . . . . . 1418.5 Concluding remarks . . . . . . . . . . . . . . . . . . . . . . . . . . . . . . . . . . . . . . . . . . . . 1438.6 Key resources and data sources . . . . . . . . . . . . . . . . . . . . . . . . . . . . . . . . . . . . 143
Chapter 9. Managing sovereign debt: Borrowing and debt restructuring . . . . . . . . . 145
9.1 Borrowing or restructuring sovereign debt for fiscal space . . . . . . . . . . . . . . . . . . . 1469.2 Optimal debt level? . . . . . . . . . . . . . . . . . . . . . . . . . . . . . . . . . . . . . . . . . . . . . 1469.3 Room to borrow . . . . . . . . . . . . . . . . . . . . . . . . . . . . . . . . . . . . . . . . . . . . . . . 148
9.3.1 Options to borrow: Loans and government securities/bonds . . . . . . . . . . . . . . . . 1499.4 Debt restructuring . . . . . . . . . . . . . . . . . . . . . . . . . . . . . . . . . . . . . . . . . . . . . . 151
9.4.1 Illegitimate debt . . . . . . . . . . . . . . . . . . . . . . . . . . . . . . . . . . . . . . . . . . . . . 1529.4.2 Options to restructure debt: Renegotiation, debt relief, debt swaps, repudiation and default . . . . . . . . . . . . . . . . . . . . . . . . . . . . . . . . . . . . . . . . . . . . . . . 1539.4.3 Debt audits and the need for an international debt work-out mechanism . . . . . . . . . 156
9.5 Concluding remarks . . . . . . . . . . . . . . . . . . . . . . . . . . . . . . . . . . . . . . . . . . . . . 1579.6 Key documents and data sources . . . . . . . . . . . . . . . . . . . . . . . . . . . . . . . . . . . 157
Chapter 10. A more accommodating macroeconomic framework . . . . . . . . . . . . . . . . 159
10.1 Why accommodative macroeconomic policies? . . . . . . . . . . . . . . . . . . . . . . . . . 16010.2 Macroeconomic policies: Historical roles and new orthodoxy . . . . . . . . . . . . . . . . 161
10.2.1 Historical roles of macroeconomic policies . . . . . . . . . . . . . . . . . . . . . . . . . . . 16210.2.2 New orthodoxy and shrinking of macroeconomic policy’s developmental role . . . . . . 163
FISCAL SPACE FOR SOCIAL PROTECTION | A Handbook for Assessing Financing OptionsXIV
10.3 Key hypotheses of new orthodoxy: A critical evaluation . . . . . . . . . . . . . . . . . . . . 16410.3.1 Government deficits crowd-out or crowd-in private investment? . . . . . . . . . . . . . . 16410.3.2 Debt and growth . . . . . . . . . . . . . . . . . . . . . . . . . . . . . . . . . . . . . . . . . . . . 16410.3.3 Inflation and growth . . . . . . . . . . . . . . . . . . . . . . . . . . . . . . . . . . . . . . . . . . 16510.3.4 Aid and real exchange rate . . . . . . . . . . . . . . . . . . . . . . . . . . . . . . . . . . . . . 166
10.4 Accommodative macroeconomic policies for fiscal space . . . . . . . . . . . . . . . . . . 16710.4.1 Fiscal policy . . . . . . . . . . . . . . . . . . . . . . . . . . . . . . . . . . . . . . . . . . . . . . . 16710.4.2 Monetary policy . . . . . . . . . . . . . . . . . . . . . . . . . . . . . . . . . . . . . . . . . . . . 17010.4.3 Capital account, exchange rate and financial sector policies . . . . . . . . . . . . . . . . . 172
10.5 Concluding remarks . . . . . . . . . . . . . . . . . . . . . . . . . . . . . . . . . . . . . . . . . . . . 17310.6 Key documents and data sources . . . . . . . . . . . . . . . . . . . . . . . . . . . . . . . . . . 174
Chapter 11. Foreign aid . . . . . . . . . . . . . . . . . . . . . . . . . . . . . . . . . . . . . . . . . . . . . . . . . . . . 175
11.1 Why scale up foreign aid? . . . . . . . . . . . . . . . . . . . . . . . . . . . . . . . . . . . . . . . . 17611.2 North-South transfers: Official Development Assistance (ODA) . . . . . . . . . . . . . . . 177
11.2.1 Trends in ODA and social protection . . . . . . . . . . . . . . . . . . . . . . . . . . . . . . . . 17711.2.2 ODA Issues: Conditionality, transaction costs, predictability, aid concentration and donor herd behaviour . . . . . . . . . . . . . . . . . . . . . . . . . . . . . . . . . . . . . . 18011.2.3 Aid modalities and social protection . . . . . . . . . . . . . . . . . . . . . . . . . . . . . . . . 18411.2.4 Foreign aid, gender equity and social protection . . . . . . . . . . . . . . . . . . . . . . . . 185
11.3 South-South cooperation . . . . . . . . . . . . . . . . . . . . . . . . . . . . . . . . . . . . . . . . 18611.3.1 South-South transfers . . . . . . . . . . . . . . . . . . . . . . . . . . . . . . . . . . . . . . . . . 18711.3.2 South-South regional integration . . . . . . . . . . . . . . . . . . . . . . . . . . . . . . . . . . 188
11.4 Triangular cooperation . . . . . . . . . . . . . . . . . . . . . . . . . . . . . . . . . . . . . . . . . . . 18911.5 Concluding remarks . . . . . . . . . . . . . . . . . . . . . . . . . . . . . . . . . . . . . . . . . . . . 19111.6 Key resources and data sources . . . . . . . . . . . . . . . . . . . . . . . . . . . . . . . . . . . . 191
Chapter 12. Social dialogue for fiscal space options . . . . . . . . . . . . . . . . . . . . . . . . . . . 193
12.1 What is social dialogue? . . . . . . . . . . . . . . . . . . . . . . . . . . . . . . . . . . . . . . . . . 19412.2 Social protection Assessment-based National Dialogue (ABND) . . . . . . . . . . . . . . 196
12.2.1 Establishment of a national working group on social protection . . . . . . . . . . . . . . 19712.2.2 The main steps of ABND process . . . . . . . . . . . . . . . . . . . . . . . . . . . . . . . . . 198
12.3 Conditions for success and sustainability . . . . . . . . . . . . . . . . . . . . . . . . . . . . . . 20512.4 Concluding remarks . . . . . . . . . . . . . . . . . . . . . . . . . . . . . . . . . . . . . . . . . . . . 20512.5 Key resources . . . . . . . . . . . . . . . . . . . . . . . . . . . . . . . . . . . . . . . . . . . . . . . . 206
Annex: Glossary . . . . . . . . . . . . . . . . . . . . . . . . . . . . . . . . . . . . . . . . . . . . . . . . . 207
Bibliography . . . . . . . . . . . . . . . . . . . . . . . . . . . . . . . . . . . . . . . . . . . . . . . . . . . . 213
CONTENTS XV
List of Figures
Figure 1.1 | Positive impacts of the extension of social protection on sustainable development . . . . . 4
Figure 1.2a | Social protection and poverty . . . . . . . . . . . . . . . . . . . . . . . . . . . . . . . . . . . . . . 5
Figure 1.2b | Social protection and inequality . . . . . . . . . . . . . . . . . . . . . . . . . . . . . . . . . . . . 5
Figure 1.3a | Social protection and productivity growth (OECD countries), 2000-2013 . . . . . . . . . . . 6
Figure 1.3b | Social protection and growth (developing countries) . . . . . . . . . . . . . . . . . . . . . . . . 6
Figure 1.4 | The social protection or social security system agreed by world governments, employers and workers . . . . . . . . . . . . . . . . . . . . . . . . . . . . . . . . . . . . . . . . . . . . . . . . . . . . . 8
Figure 2.1 | Composition of public social spending in 2014, by world regions . . . . . . . . . . . . . . . 24
Figure 2.2 | Trends in public social protection expenditure (income groups; per cent of GDP) . . . . . 25
Figure 2.3 | Public social protection expenditure (excluding health) by world regions,
latest available year, in per cent of GDP . . . . . . . . . . . . . . . . . . . . . . . . . . . . . . . . . . . . 26
Figure 2.4 | Tax revenues and social spending (per cent of GDP) . . . . . . . . . . . . . . . . . . . . . . . 27
Figure 2.5 | Coverage of old age pensions by region and type of scheme, latest available year . . . . 27
Figure 2.6 | Government expenditure and per capita GDP, 2000-2016, by income group . . . . . . . . 28
Figure 2.7 | Public social protection expenditure allocation and the size of budgeting in selected countries, 2015 . . . . . . . . . . . . . . . . . . . . . . . . . . . . . . . . . . . . . . . . . . . . . 29
Figure 2.8 | Average tax revenue in per cent of GDP; world regions, 1990-2016 . . . . . . . . . . . . . . 30
Figure 2.9 | Median tax-GDP ratio (per cent), 1990-2014 . . . . . . . . . . . . . . . . . . . . . . . . . . . . 30
Figure 3.1 | Classification of different sources of government revenues . . . . . . . . . . . . . . . . . . . 34
Figure 3.2 | Share of public employee compensations or wage bill . . . . . . . . . . . . . . . . . . . . . . 38
Figure 3.3 | Incidence of austerity measures in 183 countries, 2010-2015 . . . . . . . . . . . . . . . . . . 44
Figure 3.4 | The budget decision-making process . . . . . . . . . . . . . . . . . . . . . . . . . . . . . . . . 50
Figure 4.1 | Social contributions as a percentage of public social protection expenditure . . . . . . . . 57
(including healthcare), 2016, selected countries . . . . . . . . . . . . . . . . . . . . . . . . . . . . . . 57
Figure 4.2a | Social contributions (total) rates vs. informal employment share in total employment, selected countries . . . . . . . . . . . . . . . . . . . . . . . . . . . . . . . . . . . . . . . . . . . . . . . . . 59
Figure 4.2b | Social contributions (employer) rates vs. informal employment share in total employment, selected countries . . . . . . . . . . . . . . . . . . . . . . . . . . . . . . . . . . . . . . . . 59
Figure 4.3a | Social contributions (total) rates vs. unemployment rate . . . . . . . . . . . . . . . . . . . . 60
Figure 4.3b | Social contributions (employer) rates vs. unemployment rate . . . . . . . . . . . . . . . . . 60
Figure 4.4 | Social security contribution rates to pension systems, by region, latest years . . . . . . . . 73
Figure A.1 | Country-level taxes and income . . . . . . . . . . . . . . . . . . . . . . . . . . . . . . . . . . . 80
Figure A.2 | Global-level taxes and income . . . . . . . . . . . . . . . . . . . . . . . . . . . . . . . . . . . . . 81
Figure B.1 | Income taxes vs. trade taxes and income . . . . . . . . . . . . . . . . . . . . . . . . . . . . . . 81
Figure B.2 | Income taxes vs. indirect taxes . . . . . . . . . . . . . . . . . . . . . . . . . . . . . . . . . . . . 82
Figure 5.1 | Declining corporate profit tax rates (per cent of GDP) . . . . . . . . . . . . . . . . . . . . . . . 85
Figure 5.2 | Government revenue from extractive industries, 2000-2011 . . . . . . . . . . . . . . . . . . . 88
Figure 5.3 | Fiscal revenues from the mining sector in Zambia . . . . . . . . . . . . . . . . . . . . . . . . . 90
Figure 5.4 | Tariff rates by country income groupings, 1996-2010 . . . . . . . . . . . . . . . . . . . . . . . 92
Figure 5.5a | Corruption and tax revenues . . . . . . . . . . . . . . . . . . . . . . . . . . . . . . . . . . . . . 97
Figure 5.5b | Corruption and VAT collection efficiency . . . . . . . . . . . . . . . . . . . . . . . . . . . . . . 97
Figure 6.1 | IFFs vs. ODA, 2004-13 (in billions of current US$) . . . . . . . . . . . . . . . . . . . . . . . . . 106
FISCAL SPACE FOR SOCIAL PROTECTION | A Handbook for Assessing Financing OptionsXVI
Figure 6.2 | Key actors involved in combating IFFs . . . . . . . . . . . . . . . . . . . . . . . . . . . . . . . . 106
Figure 7.1 | Public expenditure in Indonesia by function, 2010-2014 . . . . . . . . . . . . . . . . . . . . . 117
Figure 7.2 | Public expenditure in Indonesia by economic classification, 2014 . . . . . . . . . . . . . . . 118
Figure 8.1 | Assets under management by sovereign wealth funds, 2002-2015 . . . . . . . . . . . . . . 132
Figure 8.2 | Foreign exchange reserve accumulation by region, 1995-2015 . . . . . . . . . . . . . . . . . 136
Figure 8.3 | Reasons for building excess reserves . . . . . . . . . . . . . . . . . . . . . . . . . . . . . . . . 137
Figure 8.4 | Methods used by countries to estimate foreign reserve adequacy . . . . . . . . . . . . . . . 139
Figure 8.5 | Stock of foreign reserves in terms of months of imports, external debt and share of GDP 140
Figure 9.1 | Possible borrowing candidates, 2017 (total external debt as per cent of GDP) . . . . . . . 148
Figure 9.2 | Public bonds by developing regions, 1980-2014 . . . . . . . . . . . . . . . . . . . . . . . . . . 150
Figure 9.3 | Debt and health spending, 2012-14 . . . . . . . . . . . . . . . . . . . . . . . . . . . . . . . . . . 152
Figure 9.4 | Poor country debt at a glance . . . . . . . . . . . . . . . . . . . . . . . . . . . . . . . . . . . . . 154
Figure 10.1 | Government debt and per capita GDP growth . . . . . . . . . . . . . . . . . . . . . . . . . . 165
Figure 10.2 | Inflation-growth relationship by income group (1966-2017) . . . . . . . . . . . . . . . . . . . 166
Figure 10.3 | Projected and actual fiscal deficits in developing countries, 2007-15 . . . . . . . . . . . . 169
Figure 10.4 | Fiscal surplus and health spending, 2015 (average values) . . . . . . . . . . . . . . . . . . . 170
Figure 11.1 | Total ODA from OECD Countries 1960-2018, in billion US$ . . . . . . . . . . . . . . . . . . 177
Figure 11.2 | ODA as per cent of GNI, 1960-2018 . . . . . . . . . . . . . . . . . . . . . . . . . . . . . . . . . 178
Figure 11.3 | ODA for social protection: total disbursements as per cent of GNI, 2010-2016 . . . . . . 178
Figure 11.4 | Sectoral distribution of ODA in 2016 (Social protection included in “other social”) . . . . . 179
Figure 11.5 | Disbursed ODA for social protection as a percentage of GNI among donor countries . . 180
Figure 11.6 | ODA for social protection as a per cent of GDP, 15 highest beneficiary countries . . . . . 183
Figure 11.7 | Partners in triangular cooperation . . . . . . . . . . . . . . . . . . . . . . . . . . . . . . . . . . 189
Figure 11.8 | South-South cooperation partners in triangular cooperation (number mentioned) . . . . 190
Figure 12.1 | Degrees of social dialogue . . . . . . . . . . . . . . . . . . . . . . . . . . . . . . . . . . . . . . . 195
Figure 12.2 | Typical social dialogue cycle . . . . . . . . . . . . . . . . . . . . . . . . . . . . . . . . . . . . . 196
Figure 12.3 | The ABND Assessment Matrix . . . . . . . . . . . . . . . . . . . . . . . . . . . . . . . . . . . . 198
Figure 12.4 | Structure of the Rapid Assessment Protocol (RAP) costing tool . . . . . . . . . . . . . . . 199
CONTENTS XVII
List of tables
Table 1.1 Matrix of fiscal space strategies in selected countries . . . . . . . . . . . . . . . . . . . . . . . . 12
Table 1.2 Feasibility of various options and challenges involved – summary . . . . . . . . . . . . . . . . 13
Table 2.1 Indicators of social protection financing . . . . . . . . . . . . . . . . . . . . . . . . . . . . . . . . . 20
Table 3.1 Government’s revenues and expenditure and social protection . . . . . . . . . . . . . . . . . . 36
Table 3.2 Cross-classification of government expenditure . . . . . . . . . . . . . . . . . . . . . . . . . . . 37
Table 5.1 Taxation by income groups (2011-2014 average) . . . . . . . . . . . . . . . . . . . . . . . . . . . 79
Table 5.2 Taxes and their potential efficiency and equity impact. . . . . . . . . . . . . . . . . . . . . . . . 96
Table 6.1 IFFs and health spending in developing countries, 2013 (per cent of GDP) . . . . . . . . . . . 105
Table 8.1 Sovereign wealth funds based on fiscal reserves (billion US$), April 2017 . . . . . . . . . . . . 132
Table 8.2 Foreign exchange reserve adequacy in selected developing countries, 2015 (excluding gold) . . . . . . . . . . . . . . . . . . . . . . . . . . . . . . . . . . . . . . . . . . . . . . . . . . . 140
Table 10.1 Real fiscal deficits and health spending in 38 Sub-Saharan African countries, 2015 . . . . 168
Table 10.2 Inflation thresholds for developing countries . . . . . . . . . . . . . . . . . . . . . . . . . . . . . 171
Table 10.3 Developing countries with low inflation rates, 2016 . . . . . . . . . . . . . . . . . . . . . . . . . 172
Table 11.1 Aid concentration and neglect, 2010 – 2015 (average values) . . . . . . . . . . . . . . . . . . . 182
FISCAL SPACE FOR SOCIAL PROTECTION | A Handbook for Assessing Financing OptionsXVIII
List of boxes
Box 1.1 Social Security (Minimum Standards) Convention, 1952 (No. 102) . . . . . . . . . . . . . . . . . . 8
Box 1.2 Identifying fiscal space: A rapid comparison of two countries . . . . . . . . . . . . . . . . . . . . 14
Box 2.1 The need for different social sector expenditures in National Development Strategies . . . . . 24
Box 3.1 IMF’s Article IV consultations and the relationship between capital and current expenditure: The issue of employee compensations and the wage bill . . . . . . . . . . . . . . . . . . . . . . . . . 39
Box 3.2 Various concepts of budget surplus/deficit . . . . . . . . . . . . . . . . . . . . . . . . . . . . . . . 41
Box 3.3 A performance-based results chain in the healthcare sector . . . . . . . . . . . . . . . . . . . . 47
Box 3.4 The European system of integrated social protection statistics (ESSPROS) . . . . . . . . . . . 48
Box 3.5 Key national and global social protection stakeholders . . . . . . . . . . . . . . . . . . . . . . . . 52
Box 4.1 Measures to improve contribution collection and compliance – national experiences . . . . . 69
Box 4.2 Monotax in Brazil: Extending social protection to micro-enterprises and the self-employed . 70
Box 4.3 Social contributions and Indonesia’s universal health care coverage . . . . . . . . . . . . . . . 71
Box 4.4 Thailand’s universal healthcare scheme (UCS) . . . . . . . . . . . . . . . . . . . . . . . . . . . . . 71
Box 4.5 Social consensus on gradual increase in contribution rate to ensuring sustainability for the pension system in Costa Rica . . . . . . . . . . . . . . . . . . . . . . . . . . . . . 72
Box 5.1 Taxation and development . . . . . . . . . . . . . . . . . . . . . . . . . . . . . . . . . . . . . . . . . 80
Box 5.2 Tax gaps in developing countries . . . . . . . . . . . . . . . . . . . . . . . . . . . . . . . . . . . . . 83
Box 5.3 Financial transactions tax in Brazil . . . . . . . . . . . . . . . . . . . . . . . . . . . . . . . . . . . . . 86
Box 5.4 Recent property tax reforms and plans . . . . . . . . . . . . . . . . . . . . . . . . . . . . . . . . . 87
Box 5.5 Plurinational State of Bolivia: Taxing hydrocarbons key for national social development . . . . 89
Box 5.6 Natural resources and taxation in Zambia . . . . . . . . . . . . . . . . . . . . . . . . . . . . . . . . 90
Box 5.7 Tobacco tax in developing countries: Saving lives and raising revenues . . . . . . . . . . . . . 93
Box 5.8 Gender equality and taxation . . . . . . . . . . . . . . . . . . . . . . . . . . . . . . . . . . . . . . . . 95
Box 6.1 Illicit financial flows and sustainable development . . . . . . . . . . . . . . . . . . . . . . . . . . . 104
Box 6.2 Fighting tax evasion - The US Foreign Account Tax Compliance Act (FATCA) . . . . . . . . . . 108
Box 6.3 Progress in measuring and tackling IFFs . . . . . . . . . . . . . . . . . . . . . . . . . . . . . . . . . 109
Box 6.4 OECD and other international mechanisms for combatting IFFs . . . . . . . . . . . . . . . . . . 110
Box 7.1 Why expenditure reprioritization: An illustration using Indonesian data . . . . . . . . . . . . . . . 117
Box 7.2 Thailand: Reallocating military expenditures for the Universal Health Care Scheme . . . . . . 119
Box 7.3 Policy implications of using fuel subsidies to expand social protection systems . . . . . . . . . 120
Box 8.2 When resources and poverty abound: The paradox of Timor-Leste . . . . . . . . . . . . . . . . 135
Box 8.3 Estimating adequate foreign reserves . . . . . . . . . . . . . . . . . . . . . . . . . . . . . . . . . . . 139
Box 8.4 Developmental opportunity cost of excess reserves . . . . . . . . . . . . . . . . . . . . . . . . . 141
Box 9.1 South Africa: Subnational bonds financed basic social infrastructure and services . . . . . . . 150
Box 9.2 Colombia’s Social Impact Bond: An innovative public-private partnership (PPP) . . . . . . . . 151
Box 9.3 Debt repudiation: Iraq and Iceland . . . . . . . . . . . . . . . . . . . . . . . . . . . . . . . . . . . . . 155
Box 9.4 Debt audits: The case of Ecuador . . . . . . . . . . . . . . . . . . . . . . . . . . . . . . . . . . . . . 156
Box 10.1 Social protection and social policies’ supporting role for stabilization and growth . . . . . . . 162
Box 10.2 More accommodative macroeconomic frameworks: Developing countries’ deficit spending during the Global Recession 2007-2015 . . . . . . . . . . . 169
Box 11.1 Main forms of ODA . . . . . . . . . . . . . . . . . . . . . . . . . . . . . . . . . . . . . . . . . . . . . . 184
CONTENTS XIX
Box 11.2 South-South cooperation: Turkey`s development cooperation in Africa . . . . . . . . . . . . . 187
Box 11.3 South-South bilateral cooperation in Guinea-Bissau . . . . . . . . . . . . . . . . . . . . . . . . . 188
Box 11.4 ALBA South-South regional transfers in El Salvador . . . . . . . . . . . . . . . . . . . . . . . . . 188
Box 11.5 Triangular Cooperation in the field of social protection . . . . . . . . . . . . . . . . . . . . . . . . 190
Box 12.1 Degrees of social dialogue . . . . . . . . . . . . . . . . . . . . . . . . . . . . . . . . . . . . . . . . . 195
Box 12.2 Social protection assessment-based national dialogue in Ghana . . . . . . . . . . . . . . . . . 197
Box 12.3 Egypt: Assessment-based national dialogue, costing a social protection floor and identification of fiscal space . . . . . . . . . . . . . . . . . . . . . . . . . . . . . . . . . . . . . . . . 201
Box 12.4 ABND process in the Republic of Tajikistan . . . . . . . . . . . . . . . . . . . . . . . . . . . . . . 203
Box 12.5 Social dialogue for gender equality: The Southern cone countries of Latin America . . . . . 204

CHAPTER 1 | FISCAL SPACE FOR SOCIAL PROTECTION 1
CHAPTER 1. FISCAL SPACE FOR SOCIAL PROTECTION
LEARNING OBJECTIVES
• Familiarize with this Handbook
• Understand key issues on social protection
• Learn the concept of fiscal space
• Know the options for creating fiscal space
CONTENTS
• Purpose of the Handbook
• Key issues on social protection – universal social protection systems, social protection floors, the importance of social protection for national development
• Concept of fiscal space
• Options for creating fiscal space
• Timing, feasibility and impact of the different fiscal space options
• Key resources
2 FISCAL SPACE FOR SOCIAL PROTECTION | A Handbook for Assessing Financing Options
1.1 INTRODUCTION
In September 2015, the international community has agreed on an inspiring and transformative Agenda 2030 for Sustainable Development Goals (SDGs) “to leave no-one behind.” The Agenda 2030 has recognized social protection’s critical role in achieving the “world we want” by 2030, char-acterized by shared prosperity, peace and security.
SDG 1.3 commits countries to implement nationally appropriate social protection systems for all, including floors, for reducing and preventing poverty. This commitment reaffirms the global agree-ment on the extension of social security achieved by the ILO Social Protection Floors Recommenda-tion (No. 202) adopted in 2012 by workers, employers and governments from all countries.
Social protection, or social security,1 is defined as the set of policies and programmes designed to reduce and prevent poverty and vulnerability throughout the life cycle. Social protection includes child and family benefits, maternity protection, unemployment support, employment injury, sickness and health protection, as well as old-age, disability benefits and survivors’ pensions. Social protec-tion systems typically address all these policy areas by a mix of public social insurance (paid from employers’ and workers’ contributions) and social assistance (paid from the government budget).
Social protection is a human right,2 but is not yet a reality for a majority of the world’s population, despite some progress over the last few years. As many low- and middle-income countries have established social protec-tion systems, and extended coverage, 45 per cent of the global population is now protected in at least one social protection policy area. Yet the majority – 55 per cent – of the global population remains unprotected. If we consider all the areas of social protection, from child/family bene-fits to old-age pensions, only 29 per cent of the global population has access to comprehensive social security systems, whereas 71 per cent is covered partially or not at all.3 The coverage gaps are associated with a signif-icant underinvestment in social protection, particularly in Africa, Asia and the Arab States. According to the ILO World Social Protection Database, public social protec-tion expenditures (excluding health), as a percentage of GDP, in Asia and the Pacific, Arab States, and Africa were 7.4, 4.9, and 5.9 per cent, respectively, compared to 16.5 per cent in Europe and Central Asia.
By 2030, governments have agreed to make significant progress towards implementing nationally appropriate social protection systems for all, including floors, as part of the SDG agenda. States have the legal obligation to protect and promote human rights, including the right to social security. Many countries have come a long way in strengthening their social protection systems, and in building
1 Social protection should not be confused with other social sectors such as education and health. As discussed in chapter 2, public investments in all social sectors are needed as part of National Development Strategies and governments should aim to expand fiscal space to have adequate investments in all sectors.
2 Universal Declaration of Human Rights, 1948 (Art. 22 and 25); International Covenant of Economic, Social and Cultural Rights, 1966 (Art. 9 and 11); as well as the Convention on the Elimination of all Forms of Discrimination against Women (Art. 11 and 14); the Convention on the Rights of the Child (Art. 26 and 27); and the Convention on the Rights of Persons with Disabilities (Art. 28). Most specifically, see the ILO Social Security (Minimum Standards) Convention, 1952 (No. 102) and the Social Protection Floors Recommendation, 2012 (No. 202), the two main social protection international standards.
3 ILO is the custodian of SDG 1.3. Data can be downloaded at the recurrent ILO World Social Protection Report, the latest edition at the time this handbook is produced is 2017-19.
Social protection, or social security, is de- fined as the set of policies and programmes designed to reduce and prevent poverty and vulnerability throughout the life cycle. Social protection includes child and family benefits, maternity protection, unemploy-ment support, employment injury, sickness and health protection, as well as old-age, disability and survivors’ pensions. Social protection systems, including floors (SDG 1.3) typically address all these policy areas by a combination of public social insurance (paid from employers’ and workers’ contri-butions) and social assistance (paid from the government budget).
CHAPTER 1 | FISCAL SPACE FOR SOCIAL PROTECTION 3
nationally-adapted social protection floors (SPFs) to guarantee at least a basic level of social security to all. In many countries, this process has been effective and inclusive through a broad national dialogue, which has brought together governments with social partners and other stakeholders to chart a way forward in extending social protection, including the identification of the necessary financing resources.
After explaining the purpose of this Handbook and stating briefly what each chapter contains, this introductory chapter deals with some definitional issues regarding fiscal space. It then provides an overview of various options that countries may have in sustainably financing their social protection systems.
1.2 THE HANDBOOK
This volume provides practical guidance, elaborated with case studies, on how additional fiscal space can be created for a universal social protection system. The analyses should help govern-ments on how they can increase spending on priority sectors for women, children and vulnerable groups. Each chapter in this Handbook will clearly mention:
• learning objectives of the chapter;
• contents of the chapter;
• specific options, with their advantages and disadvantages;
• accomplishments after reading the chapter; and
• key readings relating to the content of the chapter.
However, it has to be noted that no one country’s experience can be replicated one to one. It is not a “one-size-fits-all” handbook; there are always country-specific conditions that have to be taken into consideration in trying to create additional fiscal space. For instance, some countries have room to borrow more, while others may be too indebted and should consider restructuring their debt. The priorities will also change depending on the countries, e.g. most African and Arab countries are experiencing demographic boom thus requiring a need to scale up public investment in sectors that benefit children (UNICEF, 2018); in high income countries, clearly it is necessary to address the needs of rapidly ageing populations; and in all countries, it is essential that social protection systems support groups with special needs such as persons with disabilities and that they promote gender equality as women represent half of the population. A good fiscal space analysis helps to address such funding demands. Social protection interventions often function as an element in an integral and complex social and economic system. To ensure fiscal sustainability of a well-functioning social protection system, a combination of actions is needed, often entailing both social security (contri-bution-based social insurance schemes) and social assistance programmes, financed from the government budget.
Chapter 2 presents trends in public social protection financing and discusses problems associated with expenditure indicators and data. Concepts to understand national budgets are explained in chapter 3. Understanding these issues is essential for stakeholders to track developments and influ-ence policies in the area of social protection. Chapters 4-11 discuss each of the options for creating fiscal space in greater detail, supplemented with country examples. The Handbook ends with a chapter on multi-stakeholder social dialogue involving governments, trade unions, employers and civil society organizations and other stakeholders for arriving at a national consensus on policy and expenditure priorities for a fiscally sustainable, politically feasible and socially endurable universal social protection system.
4 FISCAL SPACE FOR SOCIAL PROTECTION | A Handbook for Assessing Financing Options
1.3 KEY SOCIAL PROTECTION ISSUES
1.3.1 The investment case: The importance of social protection for national development
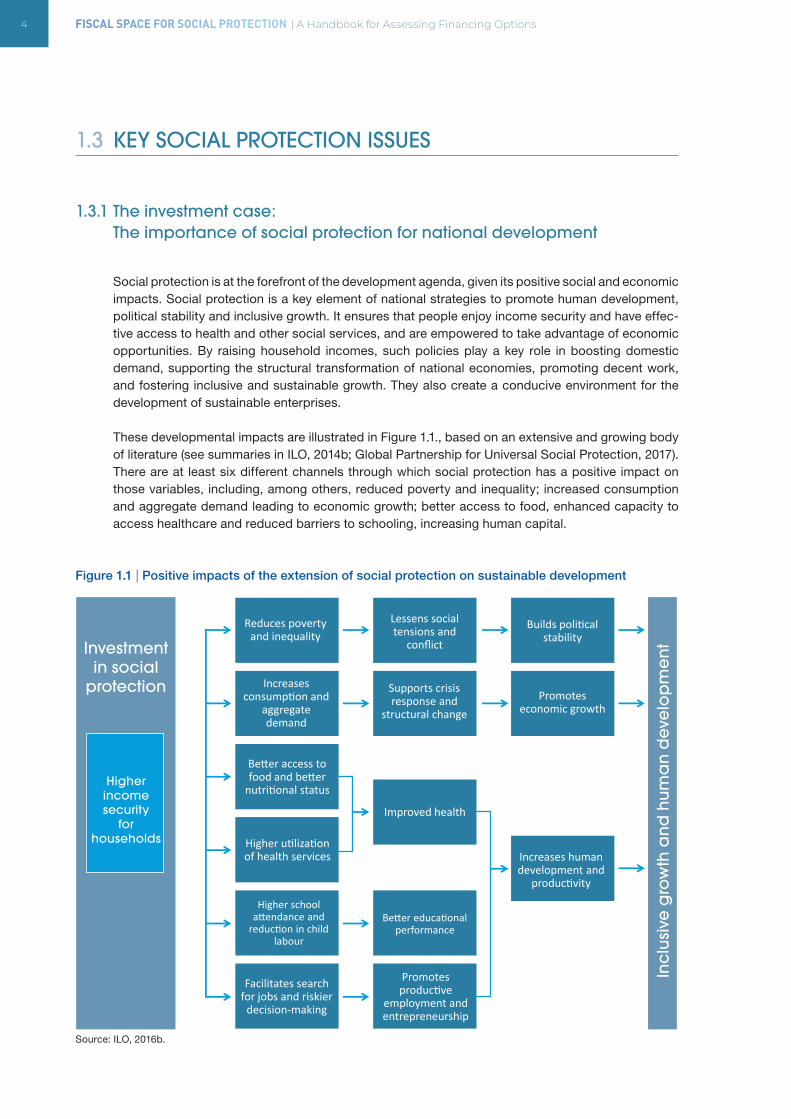
Social protection is at the forefront of the development agenda, given its positive social and economic impacts. Social protection is a key element of national strategies to promote human development, political stability and inclusive growth. It ensures that people enjoy income security and have effec-tive access to health and other social services, and are empowered to take advantage of economic opportunities. By raising household incomes, such policies play a key role in boosting domestic demand, supporting the structural transformation of national economies, promoting decent work, and fostering inclusive and sustainable growth. They also create a conducive environment for the development of sustainable enterprises.
These developmental impacts are illustrated in Figure 1.1., based on an extensive and growing body of literature (see summaries in ILO, 2014b; Global Partnership for Universal Social Protection, 2017). There are at least six different channels through which social protection has a positive impact on those variables, including, among others, reduced poverty and inequality; increased consumption and aggregate demand leading to economic growth; better access to food, enhanced capacity to access healthcare and reduced barriers to schooling, increasing human capital.
Figure 1.1 | Positive impacts of the extension of social protection on sustainable development
Source: ILO, 2016b.
Investmentin social
protection
Higherincomesecurity
forhouseholds
Inc
lusi
ve g
row
th a
nd
hu
ma
n d
eve
lop
me
nt
Higher utilization of health services
Facilitates search for jobs and riskier
decision-making
Increases human development and
productivity
Reduces poverty and inequality
Promotesproductive
employment and entrepreneurship
Builds political stability
Increases consumption and
aggregate demand
Supports crisis response and
structural changePromotes
economic growth
Higher school attendance and
reduction in child labour
Better educational performance
Better access to food and better
nutritional status
Improved health
Lessens social tensions and
conflict
CHAPTER 1 | FISCAL SPACE FOR SOCIAL PROTECTION 5
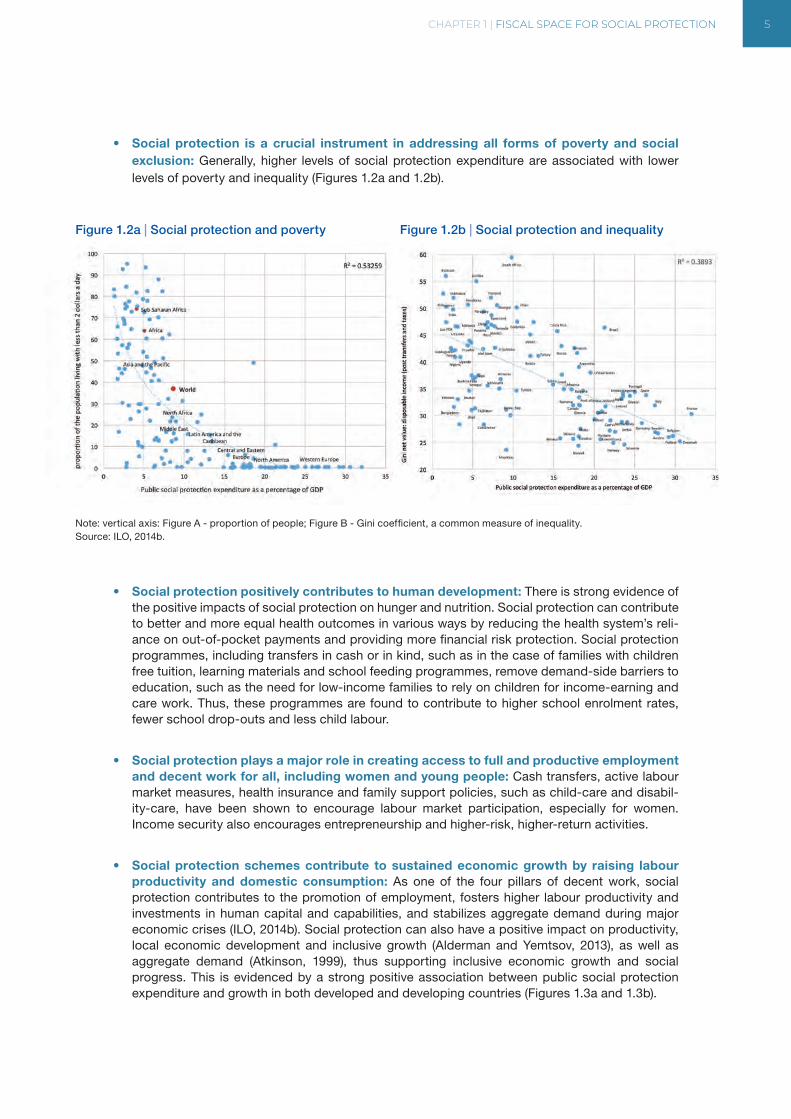
• Social protection is a crucial instrument in addressing all forms of poverty and social exclusion: Generally, higher levels of social protection expenditure are associated with lower levels of poverty and inequality (Figures 1.2a and 1.2b).
Figure 1.2a | Social protection and poverty Figure 1.2b | Social protection and inequality
Note: vertical axis: Figure A - proportion of people; Figure B - Gini coefficient, a common measure of inequality.Source: ILO, 2014b.
• Social protection positively contributes to human development: There is strong evidence of the positive impacts of social protection on hunger and nutrition. Social protection can contribute to better and more equal health outcomes in various ways by reducing the health system’s reli-ance on out-of-pocket payments and providing more financial risk protection. Social protection programmes, including transfers in cash or in kind, such as in the case of families with children free tuition, learning materials and school feeding programmes, remove demand-side barriers to education, such as the need for low-income families to rely on children for income-earning and care work. Thus, these programmes are found to contribute to higher school enrolment rates, fewer school drop-outs and less child labour.
• Social protection plays a major role in creating access to full and productive employment and decent work for all, including women and young people: Cash transfers, active labour market measures, health insurance and family support policies, such as child-care and disabil-ity-care, have been shown to encourage labour market participation, especially for women. Income security also encourages entrepreneurship and higher-risk, higher-return activities.
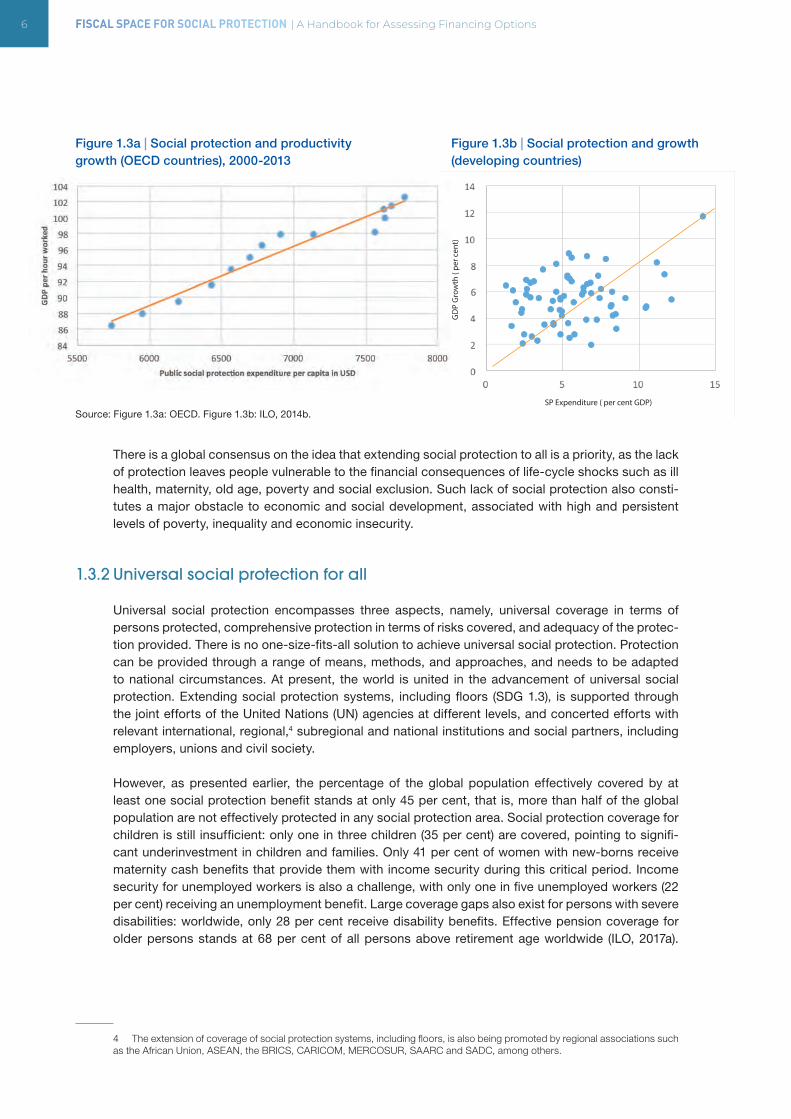
• Social protection schemes contribute to sustained economic growth by raising labour productivity and domestic consumption: As one of the four pillars of decent work, social protection contributes to the promotion of employment, fosters higher labour productivity and investments in human capital and capabilities, and stabilizes aggregate demand during major economic crises (ILO, 2014b). Social protection can also have a positive impact on productivity, local economic development and inclusive growth (Alderman and Yemtsov, 2013), as well as aggregate demand (Atkinson, 1999), thus supporting inclusive economic growth and social progress. This is evidenced by a strong positive association between public social protection expenditure and growth in both developed and developing countries (Figures 1.3a and 1.3b).
6 FISCAL SPACE FOR SOCIAL PROTECTION | A Handbook for Assessing Financing Options
Figure 1.3a | Social protection and productivity growth (OECD countries), 2000-2013
Source: Figure 1.3a: OECD. Figure 1.3b: ILO, 2014b.
There is a global consensus on the idea that extending social protection to all is a priority, as the lack of protection leaves people vulnerable to the financial consequences of life-cycle shocks such as ill health, maternity, old age, poverty and social exclusion. Such lack of social protection also consti-tutes a major obstacle to economic and social development, associated with high and persistent levels of poverty, inequality and economic insecurity.
1.3.2 Universal social protection for all
Universal social protection encompasses three aspects, namely, universal coverage in terms of persons protected, comprehensive protection in terms of risks covered, and adequacy of the protec-tion provided. There is no one-size-fits-all solution to achieve universal social protection. Protection can be provided through a range of means, methods, and approaches, and needs to be adapted to national circumstances. At present, the world is united in the advancement of universal social protection. Extending social protection systems, including floors (SDG 1.3), is supported through the joint efforts of the United Nations (UN) agencies at different levels, and concerted efforts with relevant international, regional,4 subregional and national institutions and social partners, including employers, unions and civil society.
However, as presented earlier, the percentage of the global population effectively covered by at least one social protection benefit stands at only 45 per cent, that is, more than half of the global population are not effectively protected in any social protection area. Social protection coverage for children is still insufficient: only one in three children (35 per cent) are covered, pointing to signifi-cant underinvestment in children and families. Only 41 per cent of women with new-borns receive maternity cash benefits that provide them with income security during this critical period. Income security for unemployed workers is also a challenge, with only one in five unemployed workers (22 per cent) receiving an unemployment benefit. Large coverage gaps also exist for persons with severe disabilities: worldwide, only 28 per cent receive disability benefits. Effective pension coverage for older persons stands at 68 per cent of all persons above retirement age worldwide (ILO, 2017a).
4 The extension of coverage of social protection systems, including floors, is also being promoted by regional associations such as the African Union, ASEAN, the BRICS, CARICOM, MERCOSUR, SAARC and SADC, among others.
SP Expenditure ( per cent GDP)
GD
P G
row
th (
per c
ent)
Figure 1.3b | Social protection and growth(developing countries)
CHAPTER 1 | FISCAL SPACE FOR SOCIAL PROTECTION 7
Despite significant progress in the extension of social protection coverage, many are left unprotected; renewed efforts are needed to realize the human right to social security and achieve the SDGs.
The objective of building social protection systems for all, including floors, can only be achieved through joint efforts at the national, regional and international levels. This is why UN agencies Work-as-One to deliver social protection floors in many countries.5 Also, the Global Partnership for Universal Social Protection was launched in New York during the 71st UN General Assembly by the ILO and the World Bank on 21 September 2016, showcasing 23 country cases as evidence that universal social protection is feasible in developing countries. Today the Global Partnership for Universal Social Protection (or USP2030) has a large number of development partners.6
Generally, countries achieve universal coverage by a combination of public social insurance (also called national insurance) and social assistance. In addition, mandatory or voluntary private savings mechanisms may be in place for those with saving capacity to complement benefits provided by public social insurance. Public social insurance schemes are generally financed from workers’ and employers’ contributions, with sometimes contributions from the government budget, and are meant to compensate lost income due to the occurrence of a contingency. Social assistance is financed by the general budget (often through general taxation and other government revenue) and provides transfers to those who are unable to work or excluded from employment and who are deemed eligible (e.g. older persons, all children, all persons with severe disabilities or people whose means are below a certain threshold). Public employment programmes aimed at guaranteeing an income through the provision of work at the service of the community also constitute a form of social assis-tance resulting from coordination of employment and social protection policies.
1.3.3 Social protection floor and minimum social security standards
Social protection floors are nationally defined sets of basic social security guarantees that should ensure, at a minimum that, over the life cycle, all in need have access to essential health care and to basic income security which together secure effective access to goods and services defined as necessary at the national level. They are aimed at preventing or alleviating poverty, vulnerability and social exclusion.
The ILO strategy on the extension of social protection is based on the two-dimensional strategy adopted by governments, employers and workers at the 100th Session of the International Labour Conference in 2011. In the following year, this strategy was reflected in the Social Protection Floors Recommendation, 2012 (No. 202) which aims at the rapid implementation of national social protec-tion floors containing basic social security guarantees that ensure universal access to essential health care and income security at least at a nationally defined minimum level (horizontal dimension) and the progressive achievement of higher levels of protection (vertical dimension) within compre-hensive social security systems according to the Social Security (Minimum Standards) Convention, 1952 (No. 102) and the other more advanced ILO standards.
5 See the UN Social Protection Floor Initiative (SPF-I) at https://un.social-protection.org/
6 See www.usp2030.org
Figure 1.3b | Social protection and growth(developing countries)
8 FISCAL SPACE FOR SOCIAL PROTECTION | A Handbook for Assessing Financing Options
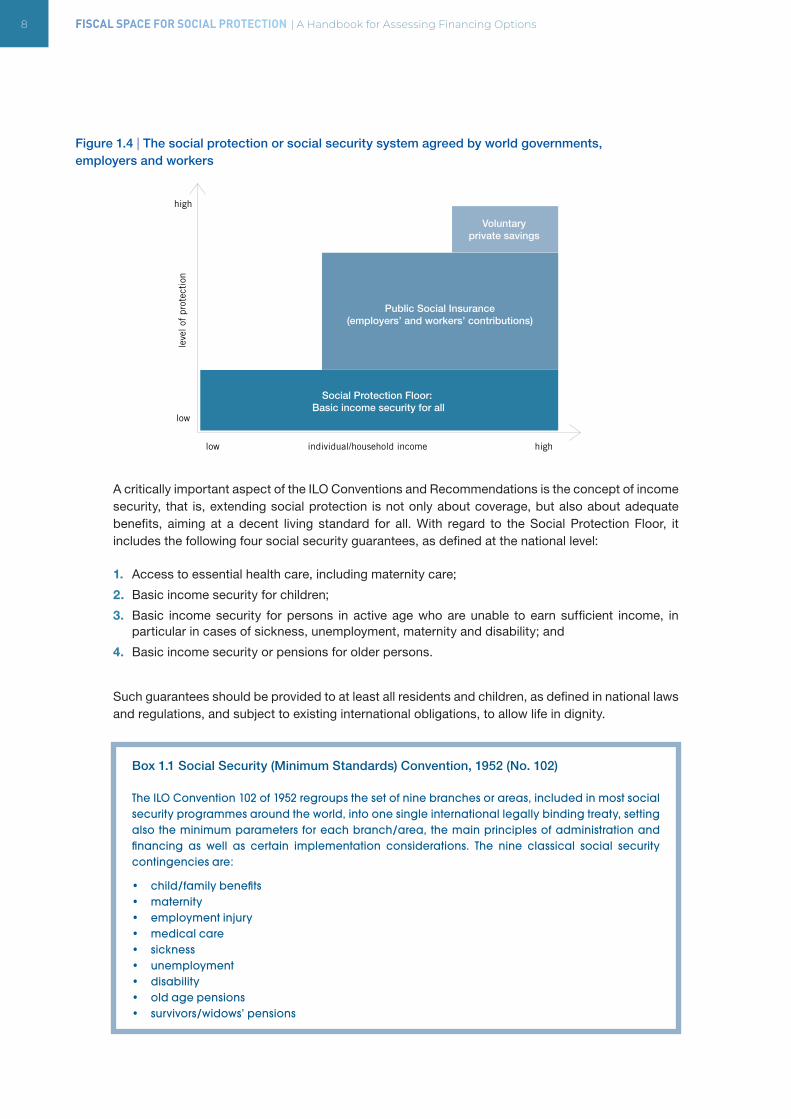
Figure 1.4 | The social protection or social security system agreed by world governments, employers and workers
A critically important aspect of the ILO Conventions and Recommendations is the concept of income security, that is, extending social protection is not only about coverage, but also about adequate benefits, aiming at a decent living standard for all. With regard to the Social Protection Floor, it includes the following four social security guarantees, as defined at the national level:
1. Access to essential health care, including maternity care;
2. Basic income security for children;
3. Basic income security for persons in active age who are unable to earn sufficient income, in particular in cases of sickness, unemployment, maternity and disability; and
4. Basic income security or pensions for older persons.
Such guarantees should be provided to at least all residents and children, as defined in national laws and regulations, and subject to existing international obligations, to allow life in dignity.
Box 1.1 Social Security (Minimum Standards) Convention, 1952 (No. 102)
The ILO Convention 102 of 1952 regroups the set of nine branches or areas, included in most social security programmes around the world, into one single international legally binding treaty, setting also the minimum parameters for each branch/area, the main principles of administration and financing as well as certain implementation considerations. The nine classical social security contingencies are:
• child/family benefits• maternity• employment injury • medical care • sickness • unemployment • disability• old age pensions• survivors/widows’ pensions
Social Protection Floor: Basic income security for all
Public Social Insurance(employers’ and workers’ contributions)
Voluntaryprivate savings
individual/household income highlow
low
high
leve
l of
prot
ecti
on
CHAPTER 1 | FISCAL SPACE FOR SOCIAL PROTECTION 9
Convention 102 sets qualitative and quantitative benchmarks for each of these contingencies, which together determine the minimum standards of social security protection to be provided by social security schemes with regard, inter alia, to:
• definition of the contingency (what must be covered?)
• persons protected (who must be covered?)
• type and rate of benefits (what should be provided?)
• entitlement conditions, including qualifying period (what should a person do to get the right to a benefit?)
• duration of benefit and waiting period (how long must the benefit be paid/provided for?)
In addition, it establishes the general responsibility of the State for securing the proper functioning of the system and the due provision of benefits based on the core principles of collective financing and participative management, and lays down principles for guarantee of defined benefits, adjust-ment of pensions, right of complaint and appeal, risk-pooling, and periodical actuarial valuations. Convention No. 102 continues to serve as a yardstick and reference in the gradual development of comprehensive social security systems at the national level and as a means to prevent the levelling down of social security systems worldwide.
Source: ILO and Schmitt, 2011.
1.4 THE CONCEPT OF FISCAL SPACE
The argument that social protection is unaffordable is becoming less common in international devel-opment forums. Finding fiscal space for critical economic and social investments is necessary for achieving the SDGs, for sustained human development of children and women, and for realizing human rights, particularly during downtimes.
Fiscal space is defined as the resources available as a result of the active exploration and utilization of all possible revenue sources by a government, according to the ILO, UNICEF and UNWOMEN (Ortiz et al., 2017). These UN agencies provide eight financing options that all countries should consider in national dialogues: (i) expanding social security coverage and contribu-tory revenues, (ii) increasing tax revenues, (iii) elim-inating illicit financial flows, (iv) improving efficiency and reallocating public expenditures from socially less desirable areas, (v) tapping into fiscal and foreign exchange reserves, (vi) borrowing or restructuring debt, (vii) adopting a more accommodative macroeconomic framework, and (viii) increasing aid and transfers.
Fiscal Space is a relatively new terminology and is understood differently. It was first introduced by Peter Heller at the International Monetary Fund (IMF). He defined fiscal space as “the availability of budgetary room that allows a government to provide resources for the desired purpose without any prejudice to the sustainability of a government’s financial position” (Heller, 2005, p.3). The basic rationale is that such space needs to exist or be created in order for governments to increase spending on national
Fiscal space is defined as the resources available as a result of the active explora-tion and utilization of all possible revenue sources by a government, according to the ILO, UNICEF and UNWOMEN. These UN agencies provide eight financing options that all countries should consider in national dialogues: (i) expanding social security coverage and contributory revenues, (ii) increasing tax revenues, (iii) eliminating illicit financial flows, (iv) reallocating public expenditures, (v) tapping into fiscal and foreign exchange reserves, (vi) Managing debt: borrowing or restructuring, (vii) adopting a more accommodative macro-economic framework, and (viii) increasing aid and transfers.
10 FISCAL SPACE FOR SOCIAL PROTECTION | A Handbook for Assessing Financing Options
priority areas, which may include social protection, in a sustainable manner. The IMF considered this concept as “simpler, starker definition —namely, fiscal space is the difference between the current level of public debt and the debt limit implied by the country’s historical record of fiscal adjustment” (Ostry et al., 2010) with regards to debt. In other words, “fiscal space exists if a government can raise spending or lower taxes without endangering market access and putting debt sustainability at risk” (IMF, 2016a). The IMF-World Bank Development Committee (2006) defined fiscal space as “the gap between the current level of expenditure and the maximum level of expenditures a government can undertake without impairing its solvency” (Development Committee, 2006).
Heller´s definition has not been free of controversies and opposing views. The UNDP re-defined fiscal space as “the financing that is available to government as a result of concrete policy actions for enhancing resource mobilization, and the reforms necessary to secure the enabling governance, institutional and economic environments for these policy actions to be effective, for a specified set of development objectives” (Roy et al., 2009). Roy, Heuty and Letouze (2007) emphasize the need for a dynamic approach for the treatment of fiscal space, which takes into account the effect of fiscal expansion both on economic growth and on human development, and provide four main financing options: (i) official development assistance (ODA) through aid and debt relief, (ii) domestic revenue mobilisation through improved tax administration or tax policy reforms, (iii) deficit financing through domestic and external borrowing, and (iv) reprioritisation and raising efficiency of expenditures.
1.5 FISCAL SPACE OPTIONS
It is essential to understand that some governments utilize all possible sources for development, and others do not. A fundamental human rights principle is that States must utilize all possible resources to realize human rights; however, many countries do not, they keep government revenues and public expenditures at lower levels by a deliberate public policy choice.
Today, at a time of slow growth and austerity, the need to create fiscal space has never been greater. It is imperative that governments aggressively explore all possible alternatives to expand fiscal space to promote national socio-economic development with jobs and social protection.
Fiscal space became strained during economic downturns both because of declines in revenue collection and increased expenditure for supporting the vulnerable section of the population, for example, those who lose jobs or livelihoods. This poses a challenge for most governments, especially in developing countries. However, fiscal space is limited in many countries because governments did not explore all possible financing sources.
A consensus has emerged among the international community, especially within the United Nations system and the International Financial Institutions (IFIs) to explore options to extend fiscal space for national development. In this handbook, eight financing options endorsed by policy statements of both the UN and IFIs are presented to extend social protection: (i) expanding social security coverage and contributory revenues,
(ii) increasing tax revenues,
(iii) eliminating illicit financial flows,
(iv) improving efficiency and reallocating public expenditures,
(v) tapping into fiscal and foreign exchange reserves,
(vi) managing debt: borrowing or restructuring sovereign debt,
CHAPTER 1 | FISCAL SPACE FOR SOCIAL PROTECTION 11
(vii) adopting a more accommodative macroeconomic framework, and
(viii) increasing aid and transfers.
Options (i)-(iii) and (v-viii) deal with raising domestic revenues to enlarge fiscal envelope, while option (iv) concerns about improving the effectiveness of existing fiscal envelope.
Each of these options for creating fiscal space for social protection is described briefly below:
(i) Expanding social security coverage and contributory revenues: iincreasing coverage and therefore the collection of contributions of social security systems is a main reliable way to finance social protection; social protection benefits linked to employment-based contributions are linked to formalization of the informal economy.
(ii) Increasing tax revenue: this is another main channel for generating domestic resources and is achieved by expanding the tax base and altering different types of tax rates - e.g. on consump-tion, corporate profits, financial activities, personal income, property, imports or exports, natural resource extraction, etc. – and/or by strengthening the efficiency of tax collection methods and overall compliance.
(iii) Eliminating illicit financial flows: a vast amount of resources, estimated at more than ten times the total aid received, escape developing countries each year illegally. Therefore, policy-makers should crack down on money laundering, bribery, tax evasion, trade mis-invoicing and other financial crimes that are illegal and deprive governments of revenues needed for social and economic development.
(iv) Re-allocating public expenditures: this is the most orthodox option, which includes assessing on-going budget allocations through a review of public expenditure and other types of thematic budget analyses, replacing high-cost, low-impact investments with those with larger socio-eco-nomic impacts, eliminating spending inefficiencies and/or tackling corruption.
(v) Using fiscal and central bank foreign exchange reserves: this includes drawing down fiscal savings and other state revenues stored in special funds, such as sovereign wealth funds, and/or using excess foreign exchange reserves in the central bank for domestic and regional devel-opment.
(vi) Managing debt – borrowing or restructuring sovereign debt: this involves an active explo-ration of domestic and foreign borrowing options at low cost, including concessional loans, following a careful assessment of debt sustainability. For countries under high debt distress, restructuring existing debt may be possible and justifiable if the legitimacy of the debt is ques-tionable or the opportunity cost in terms of worsening deprivations of vulnerable groups is high.
(vii) Adopting a more accommodating macroeconomic framework: this creates an enabling macroeconomic condition to consider options (v), (vi), and (viii). It may also entail allowing for higher budget deficit paths and higher levels of inflation without jeopardizing macroeconomic stability.
(viii) Increasing aid and transfers: this requires either engaging with different donor governments or international organizations in order to ramp up North-South or South-South transfers.
All of the above options are recognized either directly or indirectly in the Addis Ababa Action Agenda for sustainable development goals which contain targets for universal social protection. Most coun-tries adopt a mix of policies to generate fiscal space, as reflected in Table 1.1.
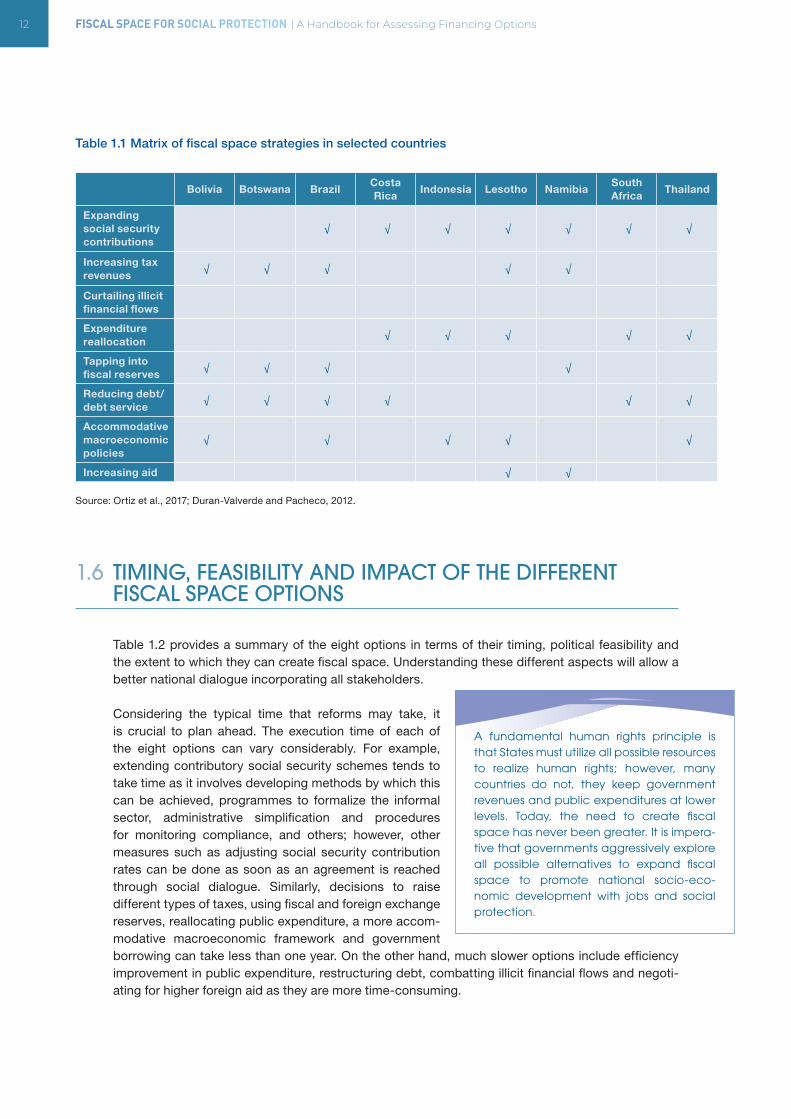
12 FISCAL SPACE FOR SOCIAL PROTECTION | A Handbook for Assessing Financing Options
Table 1.1 Matrix of fiscal space strategies in selected countries
Bolivia Botswana BrazilCosta Rica
Indonesia Lesotho NamibiaSouth Africa
Thailand
Expanding social security contributions
√ √ √ √ √ √ √
Increasing tax revenues
√ √ √ √ √
Curtailing illicit financial flows
Expenditure reallocation
√ √ √ √ √
Tapping into fiscal reserves
√ √ √ √
Reducing debt/debt service
√ √ √ √ √ √
Accommodative macroeconomic policies
√ √ √ √ √
Increasing aid √ √
Source: Ortiz et al., 2017; Duran-Valverde and Pacheco, 2012.
1.6 TIMING, FEASIBILITY AND IMPACT OF THE DIFFERENT FISCAL SPACE OPTIONS
Table 1.2 provides a summary of the eight options in terms of their timing, political feasibility and the extent to which they can create fiscal space. Understanding these different aspects will allow a better national dialogue incorporating all stakeholders.
Considering the typical time that reforms may take, it is crucial to plan ahead. The execution time of each of the eight options can vary considerably. For example, extending contributory social security schemes tends to take time as it involves developing methods by which this can be achieved, programmes to formalize the informal sector, administrative simplification and procedures for monitoring compliance, and others; however, other measures such as adjusting social security contribution rates can be done as soon as an agreement is reached through social dialogue. Similarly, decisions to raise different types of taxes, using fiscal and foreign exchange reserves, reallocating public expenditure, a more accom-modative macroeconomic framework and government borrowing can take less than one year. On the other hand, much slower options include efficiency improvement in public expenditure, restructuring debt, combatting illicit financial flows and negoti-ating for higher foreign aid as they are more time-consuming.
A fundamental human rights principle is that States must utilize all possible resources to realize human rights; however, many countries do not, they keep government revenues and public expenditures at lower levels. Today, the need to create fiscal space has never been greater. It is impera-tive that governments aggressively explore all possible alternatives to expand fiscal space to promote national socio-eco-nomic development with jobs and social protection.
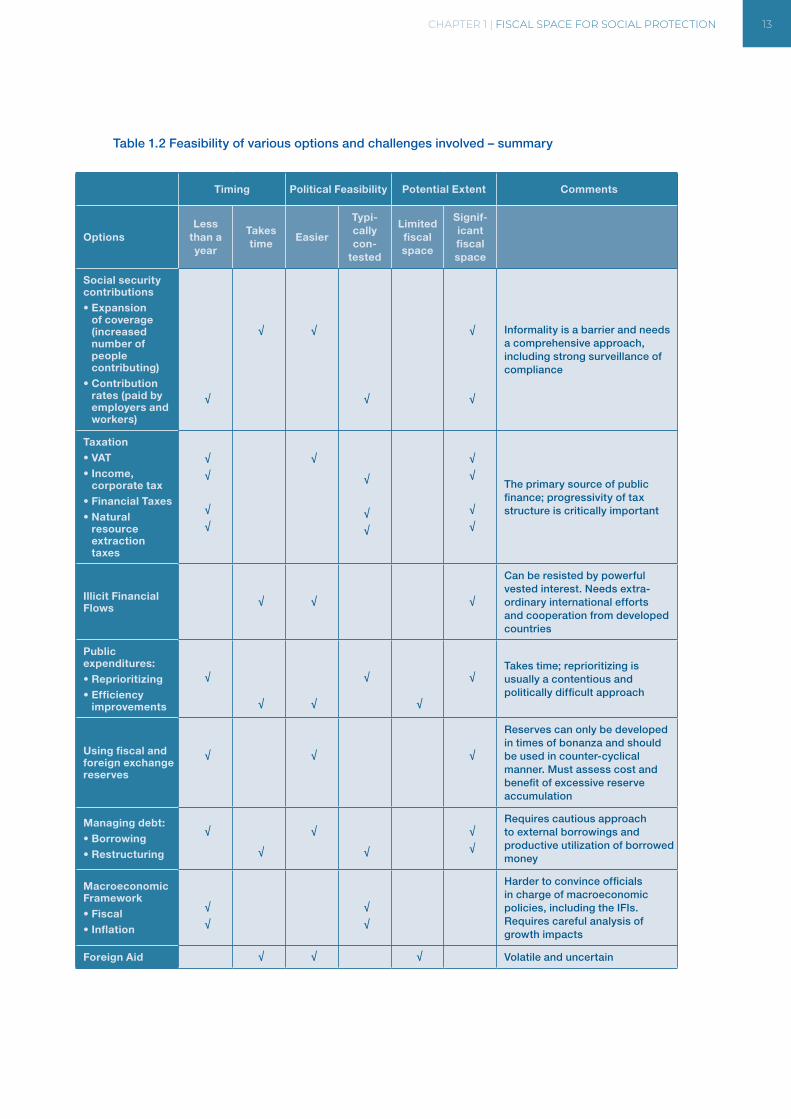
CHAPTER 1 | FISCAL SPACE FOR SOCIAL PROTECTION 13
Table 1.2 Feasibility of various options and challenges involved – summary
Timing Political Feasibility Potential Extent Comments
Options Less
than a year
Takes time
Easier
Typi-cally con-
tested
Limited fiscal space
Signif-icant fiscal space
Social security contributions• Expansion
of coverage (increased number of people contributing)
• Contribution rates (paid by employers and workers)
√
√ √
√
√
√
Informality is a barrier and needs a comprehensive approach, including strong surveillance of compliance
Taxation• VAT• Income,
corporate tax• Financial Taxes• Natural
resource extraction taxes
√
√
√
√
√
√
√
√
√
√
√
√
The primary source of public finance; progressivity of tax structure is critically important
Illicit Financial Flows
√ √ √
Can be resisted by powerful vested interest. Needs extra- ordinary international efforts and cooperation from developed countries
Public expenditures:• Reprioritizing • Efficiency
improvements
√
√ √
√
√
√ Takes time; reprioritizing is usually a contentious and politically difficult approach
Using fiscal and foreign exchange reserves
√ √ √
Reserves can only be developed in times of bonanza and should be used in counter-cyclical manner. Must assess cost and benefit of excessive reserve accumulation
Managing debt:• Borrowing• Restructuring
√
√
√
√
√
√
Requires cautious approach to external borrowings and productive utilization of borrowed money
Macroeconomic Framework• Fiscal• Inflation
√
√
√
√
Harder to convince officials in charge of macroeconomic policies, including the IFIs. Requires careful analysis of growth impacts
Foreign Aid √ √ √ Volatile and uncertain
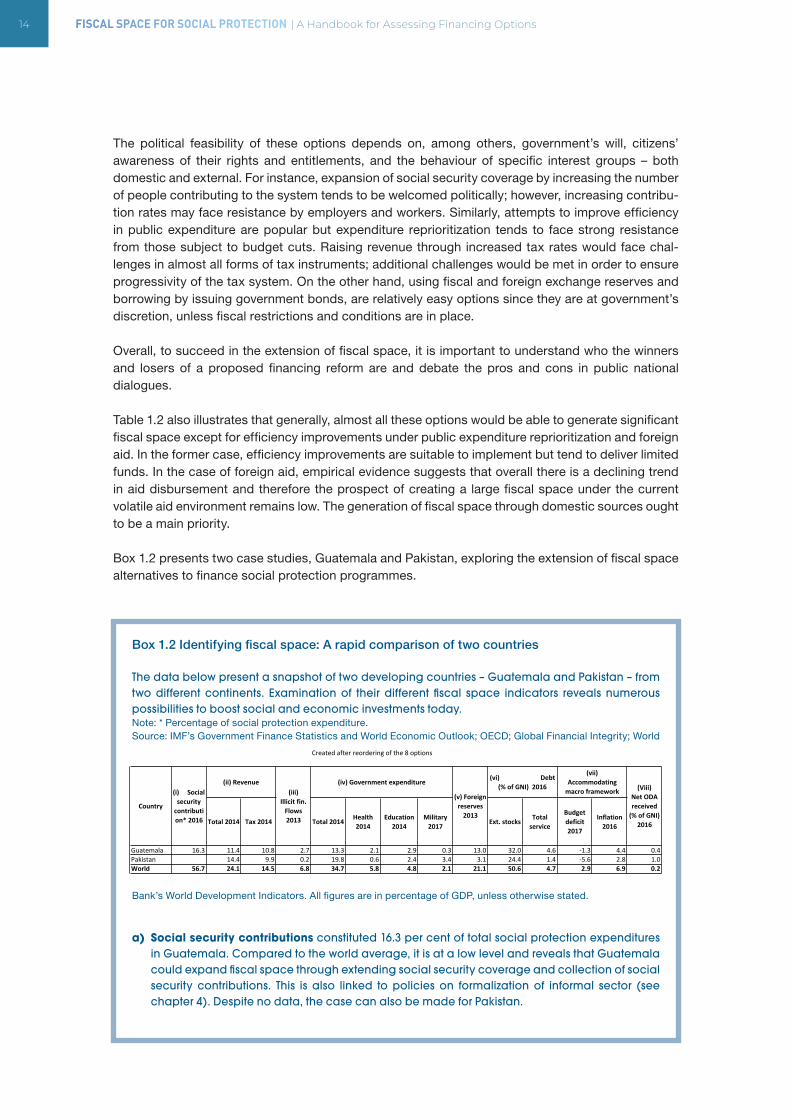
14 FISCAL SPACE FOR SOCIAL PROTECTION | A Handbook for Assessing Financing Options
The political feasibility of these options depends on, among others, government’s will, citizens’ awareness of their rights and entitlements, and the behaviour of specific interest groups – both domestic and external. For instance, expansion of social security coverage by increasing the number of people contributing to the system tends to be welcomed politically; however, increasing contribu-tion rates may face resistance by employers and workers. Similarly, attempts to improve efficiency in public expenditure are popular but expenditure reprioritization tends to face strong resistance from those subject to budget cuts. Raising revenue through increased tax rates would face chal-lenges in almost all forms of tax instruments; additional challenges would be met in order to ensure progressivity of the tax system. On the other hand, using fiscal and foreign exchange reserves and borrowing by issuing government bonds, are relatively easy options since they are at government’s discretion, unless fiscal restrictions and conditions are in place.
Overall, to succeed in the extension of fiscal space, it is important to understand who the winners and losers of a proposed financing reform are and debate the pros and cons in public national dialogues.
Table 1.2 also illustrates that generally, almost all these options would be able to generate significant fiscal space except for efficiency improvements under public expenditure reprioritization and foreign aid. In the former case, efficiency improvements are suitable to implement but tend to deliver limited funds. In the case of foreign aid, empirical evidence suggests that overall there is a declining trend in aid disbursement and therefore the prospect of creating a large fiscal space under the current volatile aid environment remains low. The generation of fiscal space through domestic sources ought to be a main priority.
Box 1.2 presents two case studies, Guatemala and Pakistan, exploring the extension of fiscal space alternatives to finance social protection programmes.
Box 1.2 Identifying fiscal space: A rapid comparison of two countries
The data below present a snapshot of two developing countries – Guatemala and Pakistan – from two different continents. Examination of their different fiscal space indicators reveals numerous possibilities to boost social and economic investments today.Note: * Percentage of social protection expenditure.Source: IMF’s Government Finance Statistics and World Economic Outlook; OECD; Global Financial Integrity; World
Bank’s World Development Indicators. All figures are in percentage of GDP, unless otherwise stated.
a) Social security contributions constituted 16.3 per cent of total social protection expenditures in Guatemala. Compared to the world average, it is at a low level and reveals that Guatemala could expand fiscal space through extending social security coverage and collection of social security contributions. This is also linked to policies on formalization of informal sector (see chapter 4). Despite no data, the case can also be made for Pakistan.
Createdafterreorderingofthe8options
Total2014 Tax2014 Total2014 Health2014
Education2014
Military2017
Ext.stocks Totalservice
Budgetdeficit2017
Inflation2016
Guatemala 16.3 11.4 10.8 2.7 13.3 2.1 2.9 0.3 13.0 32.0 4.6 -1.3 4.4 0.4Pakistan 14.4 9.9 0.2 19.8 0.6 2.4 3.4 3.1 24.4 1.4 -5.6 2.8 1.0World 56.7 24.1 14.5 6.8 34.7 5.8 4.8 2.1 21.1 50.6 4.7 2.9 6.9 0.2
Source: IMFGFS&OECDWDI WDI GFI WEO WDI WDI WDI WDI WDI WDI WDI WDInotupdated notupdated
*percentageofsocialprotectionexpenditure
(Viii)NetODAreceived(%ofGNI)
2016
(vii)Accommodatingmacroframework
Country
(iv)Governmentexpenditure(ii)Revenue
(v)Foreignreserves2013
(i)Socialsecuritycontribution*2016
(iii)Illicitfin.Flows2013
(vi)Debt(%ofGNI)2016
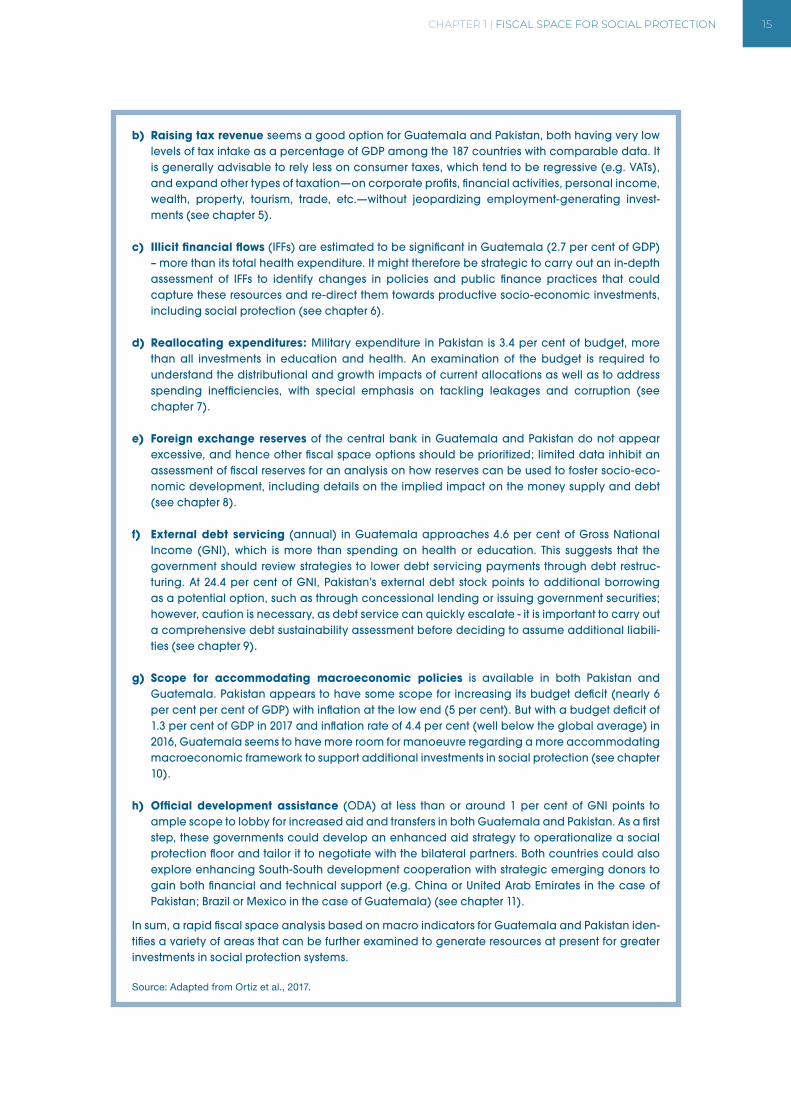
CHAPTER 1 | FISCAL SPACE FOR SOCIAL PROTECTION 15
b) Raising tax revenue seems a good option for Guatemala and Pakistan, both having very low levels of tax intake as a percentage of GDP among the 187 countries with comparable data. It is generally advisable to rely less on consumer taxes, which tend to be regressive (e.g. VATs), and expand other types of taxation—on corporate profits, financial activities, personal income, wealth, property, tourism, trade, etc.—without jeopardizing employment-generating invest-ments (see chapter 5).
c) Illicit financial flows (IFFs) are estimated to be significant in Guatemala (2.7 per cent of GDP) – more than its total health expenditure. It might therefore be strategic to carry out an in-depth assessment of IFFs to identify changes in policies and public finance practices that could capture these resources and re-direct them towards productive socio-economic investments, including social protection (see chapter 6).
d) Reallocating expenditures: Military expenditure in Pakistan is 3.4 per cent of budget, more than all investments in education and health. An examination of the budget is required to understand the distributional and growth impacts of current allocations as well as to address spending inefficiencies, with special emphasis on tackling leakages and corruption (see chapter 7).
e) Foreign exchange reserves of the central bank in Guatemala and Pakistan do not appear excessive, and hence other fiscal space options should be prioritized; limited data inhibit an assessment of fiscal reserves for an analysis on how reserves can be used to foster socio-eco-nomic development, including details on the implied impact on the money supply and debt (see chapter 8).
f) External debt servicing (annual) in Guatemala approaches 4.6 per cent of Gross National Income (GNI), which is more than spending on health or education. This suggests that the government should review strategies to lower debt servicing payments through debt restruc-turing. At 24.4 per cent of GNI, Pakistan’s external debt stock points to additional borrowing as a potential option, such as through concessional lending or issuing government securities; however, caution is necessary, as debt service can quickly escalate - it is important to carry out a comprehensive debt sustainability assessment before deciding to assume additional liabili-ties (see chapter 9).
g) Scope for accommodating macroeconomic policies is available in both Pakistan and Guatemala. Pakistan appears to have some scope for increasing its budget deficit (nearly 6 per cent per cent of GDP) with inflation at the low end (5 per cent). But with a budget deficit of 1.3 per cent of GDP in 2017 and inflation rate of 4.4 per cent (well below the global average) in 2016, Guatemala seems to have more room for manoeuvre regarding a more accommodating macroeconomic framework to support additional investments in social protection (see chapter 10).
h) Official development assistance (ODA) at less than or around 1 per cent of GNI points to ample scope to lobby for increased aid and transfers in both Guatemala and Pakistan. As a first step, these governments could develop an enhanced aid strategy to operationalize a social protection floor and tailor it to negotiate with the bilateral partners. Both countries could also explore enhancing South-South development cooperation with strategic emerging donors to gain both financial and technical support (e.g. China or United Arab Emirates in the case of Pakistan; Brazil or Mexico in the case of Guatemala) (see chapter 11).
In sum, a rapid fiscal space analysis based on macro indicators for Guatemala and Pakistan iden-tifies a variety of areas that can be further examined to generate resources at present for greater investments in social protection systems.
Source: Adapted from Ortiz et al., 2017.
16 FISCAL SPACE FOR SOCIAL PROTECTION | A Handbook for Assessing Financing Options
1.7 CONCLUDING REMARKS
The eight options for fiscal space listed in this chapter reveal that financing social protection and achieving universal coverage are possible even in the poorest countries. These options are rooted in the Addis Ababa Action Agenda in recognition of their critical roles in tapping potential sources of fiscal space (not just for social protection, but for any sector). After reading this Handbook, readers will be able to challenge the conventional view that universal social protection systems, including floors, are not affordable and that there is insufficient budget to cover all children, women, and men. The key message is that there are multiple options for expanding fiscal space to finance for social protection. All the financing options described here are based on observed practices in different countries around the world and are supported by policy statements of the United Nations and inter-national financial institutions. The uniqueness of each country requires that fiscal space options be carefully examined at the national level and alternatives fully explored through social dialogue.
1.8 KEY DOCUMENTS
Ortiz, I.; Cummins, M.; Karunanethy, K. 2017. “Fiscal Space for Social Protection and the SDGs: Options to Expand Social Investments in 187 Countries”, Extension of Social Security (ESS) Paper No. 48 (Geneva and New York, International Labour Organization, UNICEF and UNWOMEN).
The current handbook is based on this paper, published first in 2011 by the UNICEF, presenting financing alternatives available even in the poorest countries, and offers the eight options that can be explored to expand fiscal space and generate resources for social investments.
Duran-Valverde, F.; Pacheco, J. F. 2012. “Fiscal space and the extension of social protection: Lessons from developing countries”, Extension of Social Security (ESS) Paper No. 33 (Geneva, International Labour Organization).
This paper presents the results of studies conducted in eight developing countries that successfully extended social protection including floors for national social protection systems in recent years. It shows that the selected countries were able to extend one or more components of their social protection systems by typically using a combination of diverse strategies to create fiscal space.
ILO. 2017. World Social Protection Report 2017/19: Universal social protection to achieve the Sustainable Development Goals (Geneva).
This ILO flagship report provides a global overview of recent trends in social protection systems, including social protection floors. It analyses the current state of social protection for children, for women and men of working age, and for older persons, following a life-cycle approach. Based on updated data, the report offers a broad range of global, regional and country data on social protec-tion coverage, benefits, and public expenditures on social protection. It also presents new estimates on effective social protection coverage for a comprehensive monitoring of social protection systems, including floors, thereby providing the 2015 baseline for the SDG indicator 1.3.1. With its global scope and valuable statistical annexes, it is an essential reference for anyone interested in social protection.
CHAPTER 1 | FISCAL SPACE FOR SOCIAL PROTECTION 17
Learning accomplishments
After completing this chapter, the reader should:
• Know the purpose of this Handbook.
• Understand the concept of universal social protection, social protection floors and minimum social security standards, and the SDG 1.3.
• Understand the concept of fiscal space and know the options for creating fiscal space.
• Know about key resources relating to the topics discussed in the chapter.

CHAPTER 2 | SOCIAL PROTECTION FINANCING: INDICATORS AND TRENDS 19
CHAPTER 2. SOCIAL PROTECTION FINANCING: INDICATORS AND TRENDS
LEARNING OBJECTIVES
• Familiarize with the main indicators to monitor social protection expenditure
• Learn about the sources of data and understand their limitations
• Understand the trends in public social protection expenditure and government revenues
• Know key resources and data sources
CONTENTS
• Expenditure indicators and data sources
• Limitations of data coverage, quality and reporting
• Trends in public social protection expenditure
• Trends in government revenue
• Key resources and data sources
This chapter presents the main indicators to monitor social protection expenditure, examines the trends in public social protection spending and government revenue at the global level, and allows the reader to understand the challenges associated with indicators and sources of data.
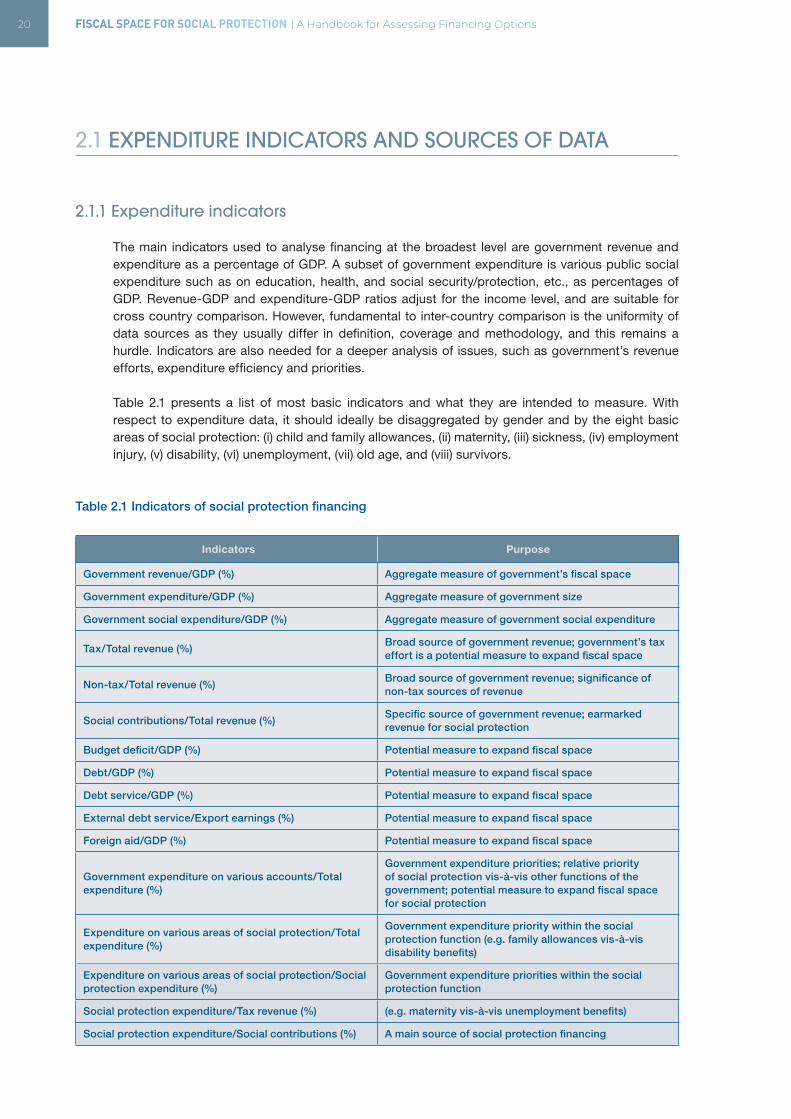
20 FISCAL SPACE FOR SOCIAL PROTECTION | A Handbook for Assessing Financing Options
2.1 EXPENDITURE INDICATORS AND SOURCES OF DATA
2.1.1 Expenditure indicators
The main indicators used to analyse financing at the broadest level are government revenue and expenditure as a percentage of GDP. A subset of government expenditure is various public social expenditure such as on education, health, and social security/protection, etc., as percentages of GDP. Revenue-GDP and expenditure-GDP ratios adjust for the income level, and are suitable for cross country comparison. However, fundamental to inter-country comparison is the uniformity of data sources as they usually differ in definition, coverage and methodology, and this remains a hurdle. Indicators are also needed for a deeper analysis of issues, such as government’s revenue efforts, expenditure efficiency and priorities.
Table 2.1 presents a list of most basic indicators and what they are intended to measure. With respect to expenditure data, it should ideally be disaggregated by gender and by the eight basic areas of social protection: (i) child and family allowances, (ii) maternity, (iii) sickness, (iv) employment injury, (v) disability, (vi) unemployment, (vii) old age, and (viii) survivors.
Table 2.1 Indicators of social protection financing
Indicators Purpose
Government revenue/GDP (%) Aggregate measure of government’s fiscal space
Government expenditure/GDP (%) Aggregate measure of government size
Government social expenditure/GDP (%) Aggregate measure of government social expenditure
Tax/Total revenue (%)Broad source of government revenue; government’s tax effort is a potential measure to expand fiscal space
Non-tax/Total revenue (%)Broad source of government revenue; significance of non-tax sources of revenue
Social contributions/Total revenue (%)Specific source of government revenue; earmarked revenue for social protection
Budget deficit/GDP (%) Potential measure to expand fiscal space
Debt/GDP (%) Potential measure to expand fiscal space
Debt service/GDP (%) Potential measure to expand fiscal space
External debt service/Export earnings (%) Potential measure to expand fiscal space
Foreign aid/GDP (%) Potential measure to expand fiscal space
Government expenditure on various accounts/Total expenditure (%)
Government expenditure priorities; relative priority of social protection vis-à-vis other functions of the government; potential measure to expand fiscal space for social protection
Expenditure on various areas of social protection/Total expenditure (%)
Government expenditure priority within the social protection function (e.g. family allowances vis-à-vis disability benefits)
Expenditure on various areas of social protection/Social protection expenditure (%)
Government expenditure priorities within the social protection function
Social protection expenditure/Tax revenue (%) (e.g. maternity vis-à-vis unemployment benefits)
Social protection expenditure/Social contributions (%) A main source of social protection financing
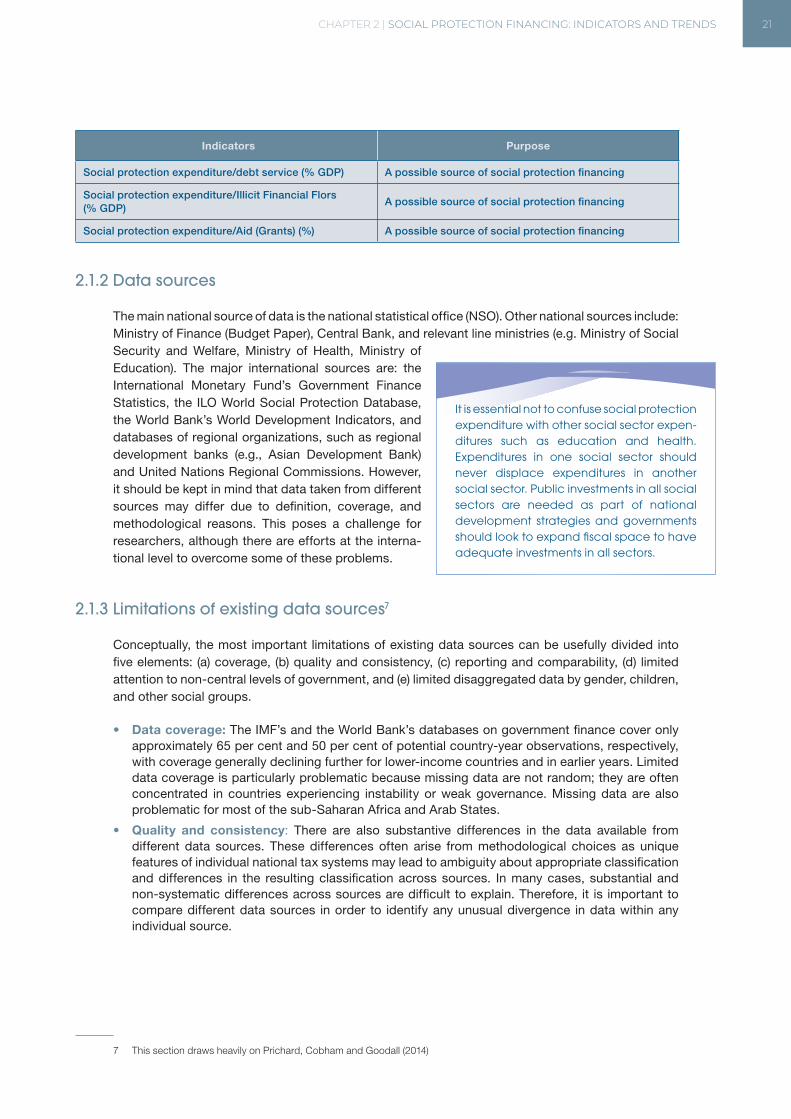
CHAPTER 2 | SOCIAL PROTECTION FINANCING: INDICATORS AND TRENDS 21
Indicators Purpose
Social protection expenditure/debt service (% GDP) A possible source of social protection financing
Social protection expenditure/Illicit Financial Flors (% GDP)
A possible source of social protection financing
Social protection expenditure/Aid (Grants) (%) A possible source of social protection financing
2.1.2 Data sources
The main national source of data is the national statistical office (NSO). Other national sources include: Ministry of Finance (Budget Paper), Central Bank, and relevant line ministries (e.g. Ministry of Social Security and Welfare, Ministry of Health, Ministry of Education). The major international sources are: the International Monetary Fund’s Government Finance Statistics, the ILO World Social Protection Database, the World Bank’s World Development Indicators, and databases of regional organizations, such as regional development banks (e.g., Asian Development Bank) and United Nations Regional Commissions. However, it should be kept in mind that data taken from different sources may differ due to definition, coverage, and methodological reasons. This poses a challenge for researchers, although there are efforts at the interna-tional level to overcome some of these problems.
2.1.3 Limitations of existing data sources7
Conceptually, the most important limitations of existing data sources can be usefully divided into five elements: (a) coverage, (b) quality and consistency, (c) reporting and comparability, (d) limited attention to non-central levels of government, and (e) limited disaggregated data by gender, children, and other social groups.
• Data coverage: The IMF’s and the World Bank’s databases on government finance cover only approximately 65 per cent and 50 per cent of potential country-year observations, respectively, with coverage generally declining further for lower-income countries and in earlier years. Limited data coverage is particularly problematic because missing data are not random; they are often concentrated in countries experiencing instability or weak governance. Missing data are also problematic for most of the sub-Saharan Africa and Arab States.
• Quality and consistency: There are also substantive differences in the data available from different data sources. These differences often arise from methodological choices as unique features of individual national tax systems may lead to ambiguity about appropriate classification and differences in the resulting classification across sources. In many cases, substantial and non-systematic differences across sources are difficult to explain. Therefore, it is important to compare different data sources in order to identify any unusual divergence in data within any individual source.
7 This section draws heavily on Prichard, Cobham and Goodall (2014)
It is essential not to confuse social protection expenditure with other social sector expen-ditures such as education and health. Expenditures in one social sector should never displace expenditures in another social sector. Public investments in all social sectors are needed as part of national development strategies and governments should look to expand fiscal space to have adequate investments in all sectors.
22 FISCAL SPACE FOR SOCIAL PROTECTION | A Handbook for Assessing Financing Options
• Reporting and comparability: (i) The case or natural resource revenue and social contributions. The treatment of natural resource revenue is quite complex and challenging. Both countries and sources vary dramatically in whether revenue from the natural resource sector is recorded as tax or non-tax revenue. Countries generally record corporate taxes paid by private sector resource companies as taxes and record royalties, export taxes, profit sharing and the profits of state-owned enterprises (SOEs) as non-tax revenue. International databases also do not distinguish between the resource and non-resource components of different revenue categories; thus, it is difficult to assess the composition of government revenue in a meaningful way. (ii) Social contri-butions: The treatment of social contributions is more straightforward, but both countries and data sources vary in whether social contributions are included in revenue statistics at all, and, in turn, whether they are classified as tax revenue, direct government revenue, or neither of the two. With social contributions amounting to as much as 20 per cent of government revenue in some cases, these classification choices can have huge implications for social protection fiscal space, and can lead to major inconsistencies in seeking to draw comparisons across countries, or even within countries over time.
• Levels of government: Researchers frequently rely on central government data because infor-mation from local governments is most often not available for lower-income countries. While pragmatic, however, a focus on central government data can be misleading for federal states, where large shares of government revenue are collected at the state/provincial and local levels. Thus, central government revenue vastly understates revenue collection in states like India, Brazil and Nigeria.
• Disaggregated data by gender, children, older persons and other social groups: Addition-ally, scarcity of gender disaggregated data poses serious limitations to understand gender biases within, for example, taxation system and contributory social protection schemes, consequently to assess distributional impact on women (see chapter 4 and 5). A collaborative research by the UN Women and the World Bank in 2017, covering 89 countries and representing an estimated 84 per cent of the population of the developing world, showed that households with children are among the poorest, and that single parents with children, and predominantly single mothers with children, face a far higher risk of poverty (UN Women, 2018a). Availability of disaggregated data on social protection financing indicators would be beneficial in undertaking in-depth analyses of policy impacts on women and their resulting vulnerabilities compared to men through a gender-based lens. A similar conclusion can be drawn in the context of availability of disaggregated data by children, youth, older persons and other social groups, and its importance to direct government investments, to shape service delivery and policy and, ultimately, to fulfil human rights (UNICEF, 2017).
In recognition of the seriousness of the problems discussed in this sub-section, there are height-ened efforts to improve data availability, data quality, data frequency, and insufficient disaggregated levels of data in recent years, especially following the adoption of the Agenda 2030 with a strong monitoring and evaluation framework. The Inter Agency and Expert Group (IAEG), led by the United Nations Statistical Commission, and coordinated by the United Nations Statistics Division, is playing a leading role in this matter.
Meanwhile within the IMF’s Statistics Department, efforts have been going on to review and improve the quality of the IMF GFS data to the extent possible. More ambitiously, a template has been devel-oped to allow for much more systematic collection of data on natural resource revenue, with a view to drawing consistent distinctions between the resource and non-resource components of key revenue categories. The IMF’s Fiscal Affairs Department has pursued an initiative to merge data from multiple different sources (IMF GFS, World Economic Outlook, OECD and Article IV reports) in order to improve data coverage.
CHAPTER 2 | SOCIAL PROTECTION FINANCING: INDICATORS AND TRENDS 23
The ILO is the custodian of the SDG indicator 1.3 that monitors progress on the extension of coverage by social protection systems, including floors, through the World Social Protection Database, based on the ILO Social Security Inquiry (SSI), which includes an administrative questionnaire sent to all countries since the 1950s, validated with information from other sources such as household surveys from other development agencies. The World Social Protection Report provides detailed data by social protection schemes, the eight basic areas of social protection: (i) child and family allowances, (ii) maternity, (iii) sickness, (iv) employment injury, (v) disability, (vi) unemployment, (vii) old age, and (viii) survivors.
While the efforts to improve data continue, researchers need to be cognizant about the problems, especially when dealing with cross-country comparisons. When a serious break is observed in the data series from a particular source, researchers should cross check with other sources if available, and try to find out the reasons for discontinuity or breaks in the series to provide qualitative assess-ments of their findings.
2.2 TRENDS IN PUBLIC SOCIAL PROTECTION EXPENDITURE
There are three main components of public social spending: (i) education, (ii) health and (iii) social protection (social insurance and social assistance). It is crucial to understand that there is a difference between public expenditure on social protection and public expenditure on other social sectors such as education and health. Besides, unlike other social sectors such as education, social protection expenditure is frequently financed by social security contributions from employers and workers (see definition in chapter 1 and discussion in chapter 4). It is essential not to confuse social protection expenditure with other social sector expenditures, and to separate social protection from other social sectors when doing expenditure analysis. However, this does not mean that a choice has to be made to allocate resources amongst these social sectors – expenditures in one social sector should never displace expenditures in another social sector. Public investments in all social sectors are needed and governments should look to expand fiscal space to have adequate investments in all sectors.
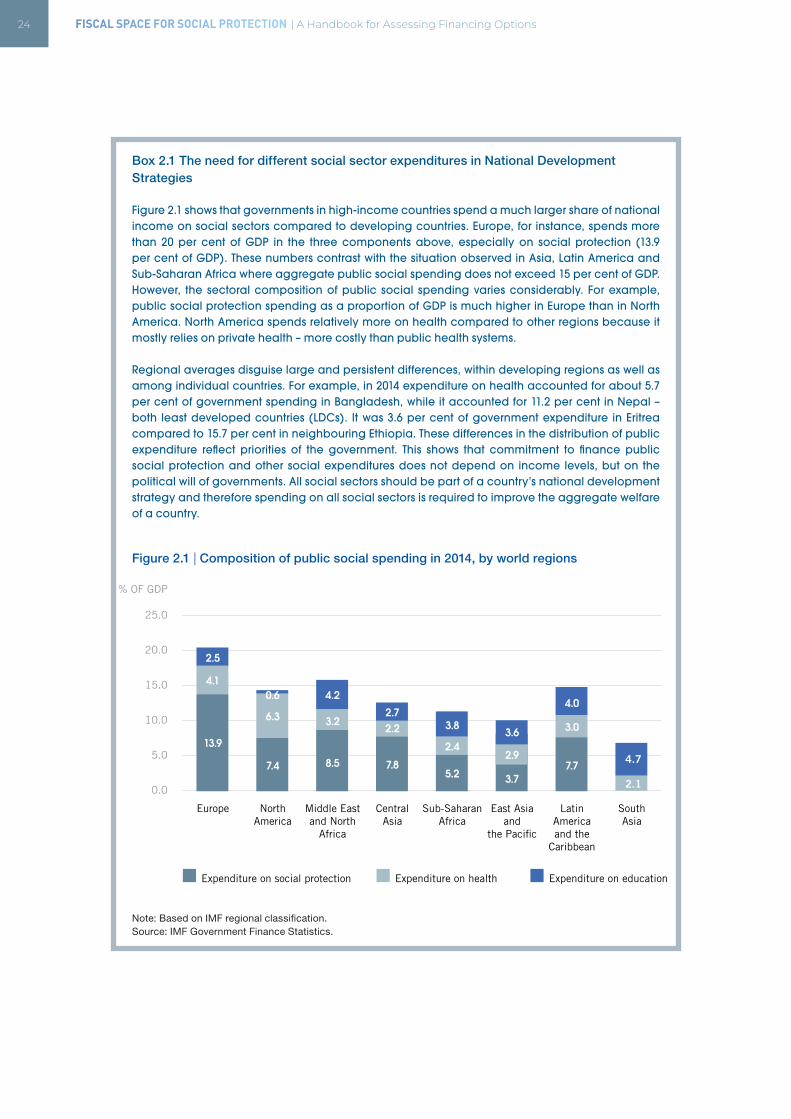
24 FISCAL SPACE FOR SOCIAL PROTECTION | A Handbook for Assessing Financing Options
Box 2.1 The need for different social sector expenditures in National Development Strategies
Figure 2.1 shows that governments in high-income countries spend a much larger share of national income on social sectors compared to developing countries. Europe, for instance, spends more than 20 per cent of GDP in the three components above, especially on social protection (13.9 per cent of GDP). These numbers contrast with the situation observed in Asia, Latin America and Sub-Saharan Africa where aggregate public social spending does not exceed 15 per cent of GDP. However, the sectoral composition of public social spending varies considerably. For example, public social protection spending as a proportion of GDP is much higher in Europe than in North America. North America spends relatively more on health compared to other regions because it mostly relies on private health – more costly than public health systems.
Regional averages disguise large and persistent differences, within developing regions as well as among individual countries. For example, in 2014 expenditure on health accounted for about 5.7 per cent of government spending in Bangladesh, while it accounted for 11.2 per cent in Nepal – both least developed countries (LDCs). It was 3.6 per cent of government expenditure in Eritrea compared to 15.7 per cent in neighbouring Ethiopia. These differences in the distribution of public expenditure reflect priorities of the government. This shows that commitment to finance public social protection and other social expenditures does not depend on income levels, but on the political will of governments. All social sectors should be part of a country’s national development strategy and therefore spending on all social sectors is required to improve the aggregate welfare of a country.
Figure 2.1 | Composition of public social spending in 2014, by world regions
Note: Based on IMF regional classification.Source: IMF Government Finance Statistics.
25.0
% OF GDP
20.0
15.0
10.0
5.0
0.0
Europe
2.5
4.1
13.9
NorthAmerica
0.6
6.3
7.4
Middle Eastand North
Africa
3.2
4.2
8.5
CentralAsia
2.72.2
7.8
Sub-SaharanAfrica
2.4
3.8
5.2
East Asiaand
the Paci�c
3.6
2.9
3.7
LatinAmericaand the
Caribbean
4.0
3.0
7.7
SouthAsia
4.7
2.1
Expenditure on social protection Expenditure on health Expenditure on education
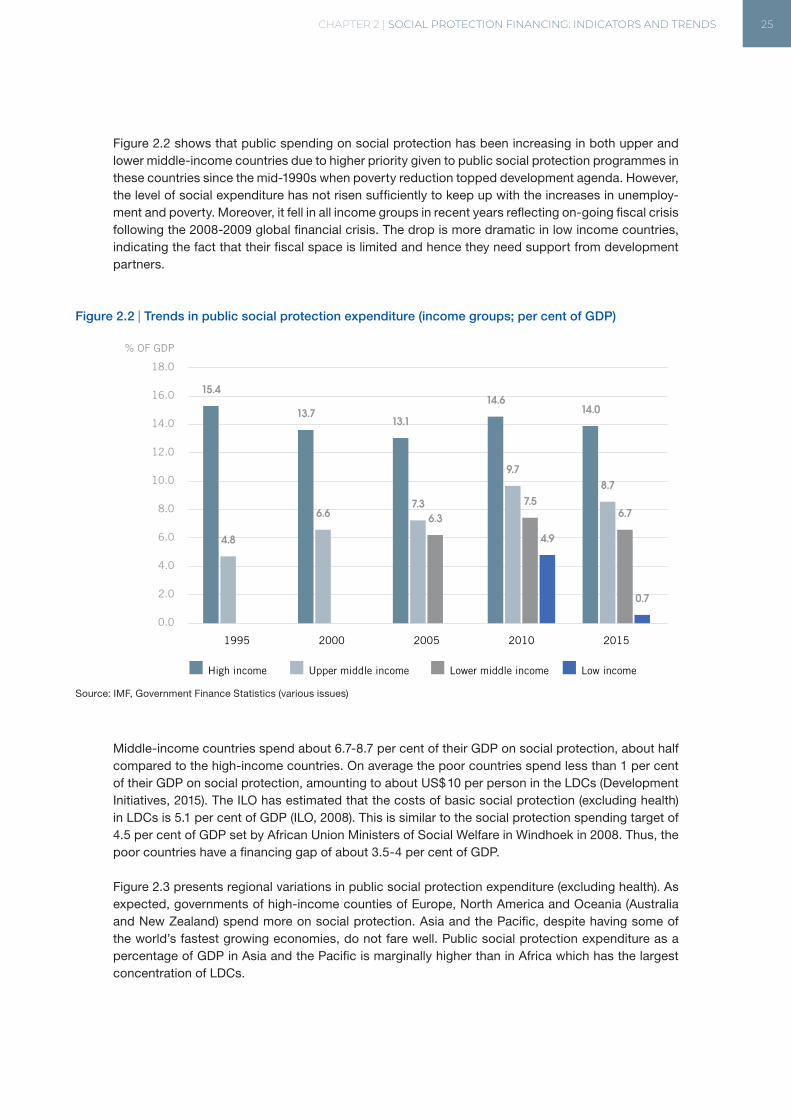
CHAPTER 2 | SOCIAL PROTECTION FINANCING: INDICATORS AND TRENDS 25
Figure 2.2 shows that public spending on social protection has been increasing in both upper and lower middle-income countries due to higher priority given to public social protection programmes in these countries since the mid-1990s when poverty reduction topped development agenda. However, the level of social expenditure has not risen sufficiently to keep up with the increases in unemploy-ment and poverty. Moreover, it fell in all income groups in recent years reflecting on-going fiscal crisis following the 2008-2009 global financial crisis. The drop is more dramatic in low income countries, indicating the fact that their fiscal space is limited and hence they need support from development partners.
Figure 2.2 | Trends in public social protection expenditure (income groups; per cent of GDP)
Source: IMF, Government Finance Statistics (various issues)
Middle-income countries spend about 6.7-8.7 per cent of their GDP on social protection, about half compared to the high-income countries. On average the poor countries spend less than 1 per cent of their GDP on social protection, amounting to about US$ 10 per person in the LDCs (Development Initiatives, 2015). The ILO has estimated that the costs of basic social protection (excluding health) in LDCs is 5.1 per cent of GDP (ILO, 2008). This is similar to the social protection spending target of 4.5 per cent of GDP set by African Union Ministers of Social Welfare in Windhoek in 2008. Thus, the poor countries have a financing gap of about 3.5-4 per cent of GDP.
Figure 2.3 presents regional variations in public social protection expenditure (excluding health). As expected, governments of high-income counties of Europe, North America and Oceania (Australia and New Zealand) spend more on social protection. Asia and the Pacific, despite having some of the world’s fastest growing economies, do not fare well. Public social protection expenditure as a percentage of GDP in Asia and the Pacific is marginally higher than in Africa which has the largest concentration of LDCs.
% OF GDP
0.0
2.0
4.0
6.0
8.0
10.0
12.0
14.0
16.0
18.0
15.4
4.8
13.7
6.6
13.1
7.36.3
14.6
9.7
7.5
4.9
14.0
8.7
6.7
0.7
2010 2015
High income Upper middle income Lower middle income Low income
200520001995
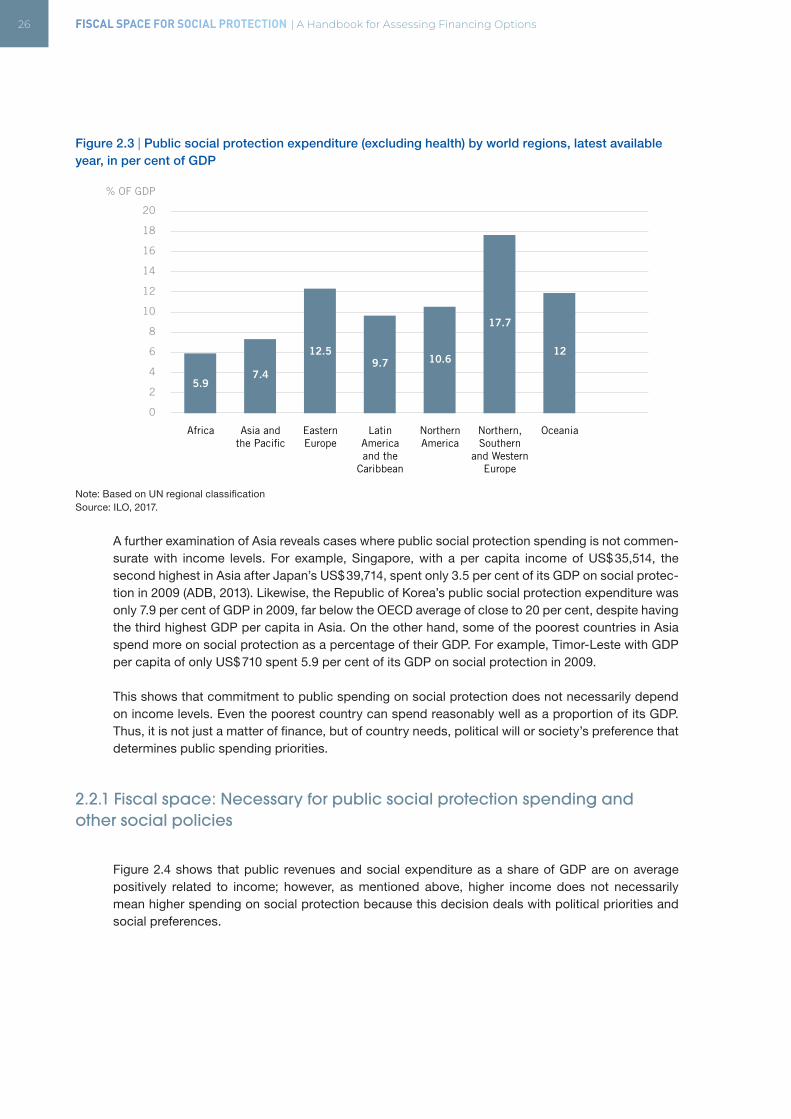
26 FISCAL SPACE FOR SOCIAL PROTECTION | A Handbook for Assessing Financing Options
Figure 2.3 | Public social protection expenditure (excluding health) by world regions, latest available year, in per cent of GDP
Note: Based on UN regional classificationSource: ILO, 2017.
A further examination of Asia reveals cases where public social protection spending is not commen-surate with income levels. For example, Singapore, with a per capita income of US$ 35,514, the second highest in Asia after Japan’s US$ 39,714, spent only 3.5 per cent of its GDP on social protec-tion in 2009 (ADB, 2013). Likewise, the Republic of Korea’s public social protection expenditure was only 7.9 per cent of GDP in 2009, far below the OECD average of close to 20 per cent, despite having the third highest GDP per capita in Asia. On the other hand, some of the poorest countries in Asia spend more on social protection as a percentage of their GDP. For example, Timor-Leste with GDP per capita of only US$ 710 spent 5.9 per cent of its GDP on social protection in 2009. This shows that commitment to public spending on social protection does not necessarily depend on income levels. Even the poorest country can spend reasonably well as a proportion of its GDP. Thus, it is not just a matter of finance, but of country needs, political will or society’s preference that determines public spending priorities.
2.2.1 Fiscal space: Necessary for public social protection spending and other social policies
Figure 2.4 shows that public revenues and social expenditure as a share of GDP are on average positively related to income; however, as mentioned above, higher income does not necessarily mean higher spending on social protection because this decision deals with political priorities and social preferences.
% OF GDP
0
2
4
6
8
10
12
14
16
18
20
Africa Asia andthe Paci�c
7.45.9
EasternEurope
12.5
LatinAmericaand the
Caribbean
9.7
NorthernAmerica
10.6
Northern,Southern
and WesternEurope
17.7
Oceania
12
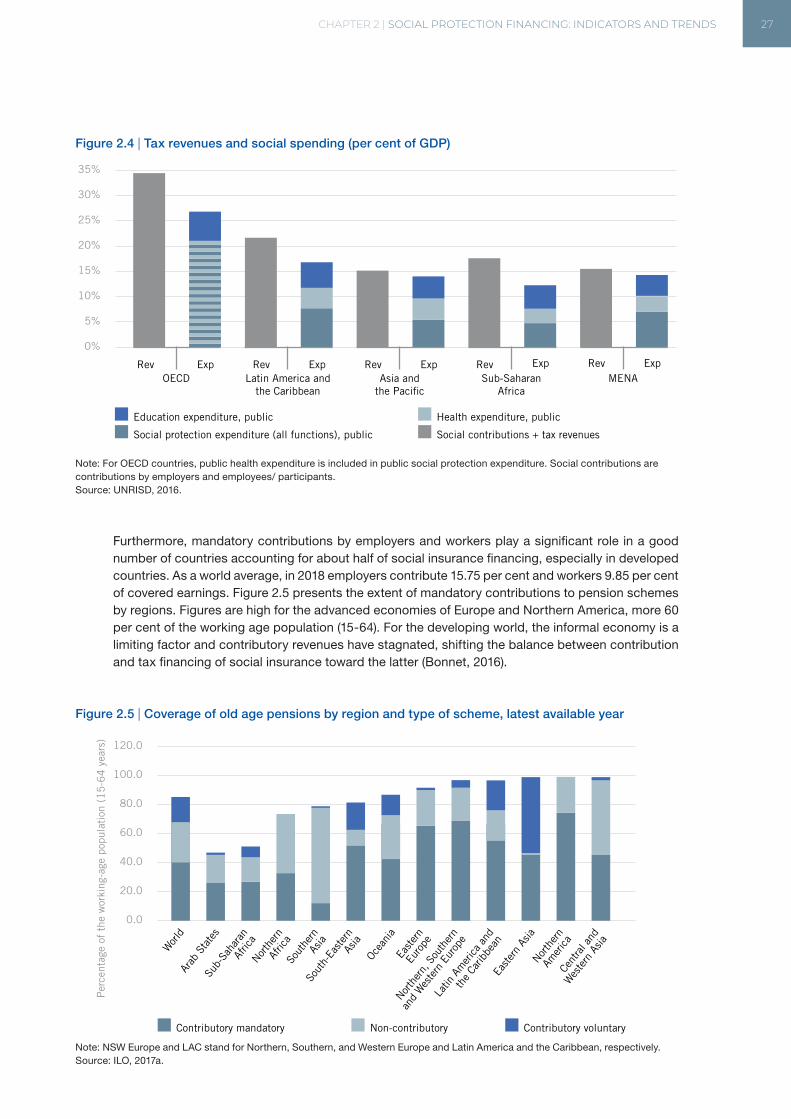
CHAPTER 2 | SOCIAL PROTECTION FINANCING: INDICATORS AND TRENDS 27
Figure 2.4 | Tax revenues and social spending (per cent of GDP)
Note: For OECD countries, public health expenditure is included in public social protection expenditure. Social contributions are contributions by employers and employees/ participants.Source: UNRISD, 2016.
Furthermore, mandatory contributions by employers and workers play a significant role in a good number of countries accounting for about half of social insurance financing, especially in developed countries. As a world average, in 2018 employers contribute 15.75 per cent and workers 9.85 per cent of covered earnings. Figure 2.5 presents the extent of mandatory contributions to pension schemes by regions. Figures are high for the advanced economies of Europe and Northern America, more 60 per cent of the working age population (15-64). For the developing world, the informal economy is a limiting factor and contributory revenues have stagnated, shifting the balance between contribution and tax financing of social insurance toward the latter (Bonnet, 2016).
Figure 2.5 | Coverage of old age pensions by region and type of scheme, latest available year
Note: NSW Europe and LAC stand for Northern, Southern, and Western Europe and Latin America and the Caribbean, respectively. Source: ILO, 2017a.
0%
5%
10%
15%
20%
25%
30%
35%
Rev Exp Rev ExpOECD
Rev Exp Rev Exp Rev Exp
Education expenditure, public Health expenditure, public
Social protection expenditure (all functions), public Social contributions + tax revenues
Latin America andthe Caribbean
Asia andthe Paci�c
Sub-SaharanAfrica
MENA
Per
cent
age
of t
he w
orki
ng-a
ge p
opul
atio
n (1
5-6
4 y
ears
)
0.0
20.0
40.0
60.0
80.0
100.0
120.0
Wor
ldAr
ab S
tate
sSu
b-Sa
hara
nAf
rica
North
ern
Afric
aSo
uthe
rnAs
iaSo
uth-
Easter
nAs
iaOc
eani
aEa
ster
nEu
rope
North
ern,
Sou
ther
n
and
Wes
tern
Eur
ope
Latin
Am
erica
and
the
Carib
bean
Easter
n As
iaNor
ther
nAm
erica
Cent
ral a
nd
Wes
tern
Asia
Contributory mandatory Non-contributory Contributory voluntary
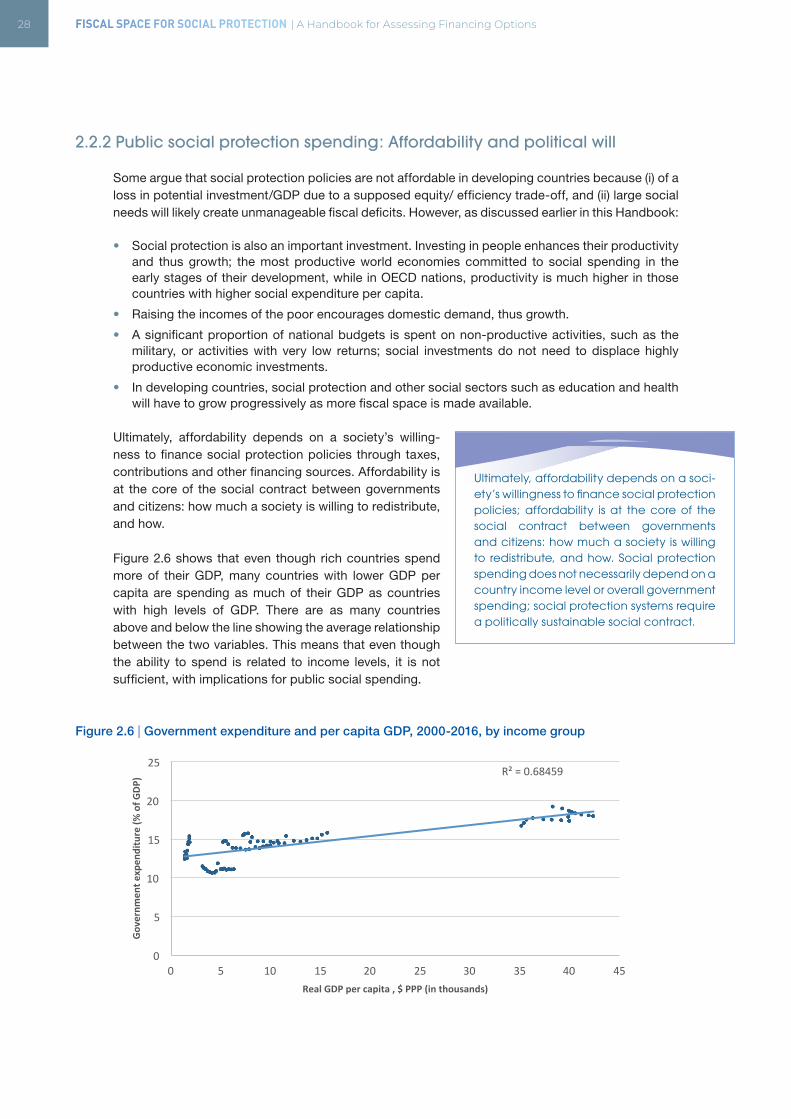
28 FISCAL SPACE FOR SOCIAL PROTECTION | A Handbook for Assessing Financing Options
2.2.2 Public social protection spending: Affordability and political will
Some argue that social protection policies are not affordable in developing countries because (i) of a loss in potential investment/GDP due to a supposed equity/ efficiency trade-off, and (ii) large social needs will likely create unmanageable fiscal deficits. However, as discussed earlier in this Handbook:
• Social protection is also an important investment. Investing in people enhances their productivity and thus growth; the most productive world economies committed to social spending in the early stages of their development, while in OECD nations, productivity is much higher in those countries with higher social expenditure per capita.
• Raising the incomes of the poor encourages domestic demand, thus growth.
• A significant proportion of national budgets is spent on non-productive activities, such as the military, or activities with very low returns; social investments do not need to displace highly productive economic investments.
• In developing countries, social protection and other social sectors such as education and health will have to grow progressively as more fiscal space is made available.
Ultimately, affordability depends on a society’s willing-ness to finance social protection policies through taxes, contributions and other financing sources. Affordability is at the core of the social contract between governments and citizens: how much a society is willing to redistribute, and how.
Figure 2.6 shows that even though rich countries spend more of their GDP, many countries with lower GDP per capita are spending as much of their GDP as countries with high levels of GDP. There are as many countries above and below the line showing the average relationship between the two variables. This means that even though the ability to spend is related to income levels, it is not sufficient, with implications for public social spending.
Figure 2.6 | Government expenditure and per capita GDP, 2000-2016, by income group
Ultimately, affordability depends on a soci-ety’s willingness to finance social protection policies; affordability is at the core of the social contract between governments and citizens: how much a society is willing to redistribute, and how. Social protection spending does not necessarily depend on a country income level or overall government spending; social protection systems require a politically sustainable social contract.
R²=0.68459
0
5
10
15
20
25
0 5 10 15 20 25 30 35 40 45
Governm
ente
xpen
diture(%
ofG
DP)
RealGDPpercapita,$PPP(inthousands)
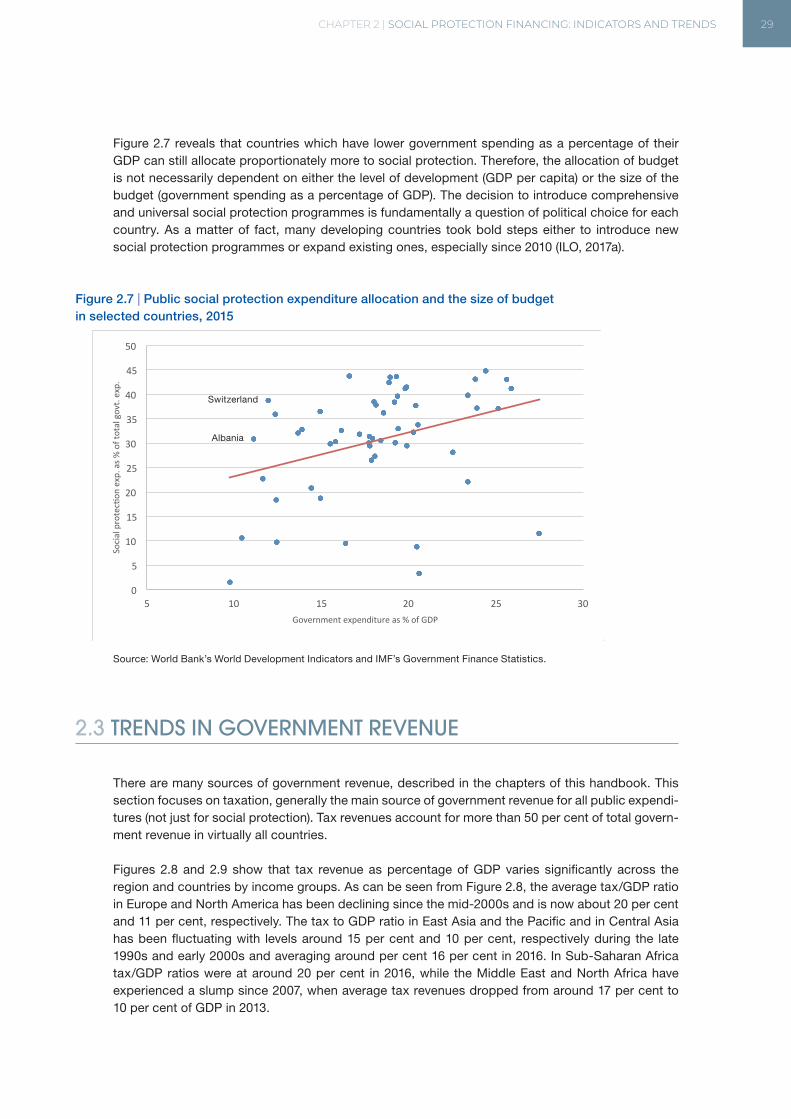
CHAPTER 2 | SOCIAL PROTECTION FINANCING: INDICATORS AND TRENDS 29
Figure 2.7 reveals that countries which have lower government spending as a percentage of their GDP can still allocate proportionately more to social protection. Therefore, the allocation of budget is not necessarily dependent on either the level of development (GDP per capita) or the size of the budget (government spending as a percentage of GDP). The decision to introduce comprehensive and universal social protection programmes is fundamentally a question of political choice for each country. As a matter of fact, many developing countries took bold steps either to introduce new social protection programmes or expand existing ones, especially since 2010 (ILO, 2017a).
Figure 2.7 | Public social protection expenditure allocation and the size of budget in selected countries, 2015
Source: World Bank’s World Development Indicators and IMF’s Government Finance Statistics.
2.3 TRENDS IN GOVERNMENT REVENUE
There are many sources of government revenue, described in the chapters of this handbook. This section focuses on taxation, generally the main source of government revenue for all public expendi-tures (not just for social protection). Tax revenues account for more than 50 per cent of total govern-ment revenue in virtually all countries.
Figures 2.8 and 2.9 show that tax revenue as percentage of GDP varies significantly across the region and countries by income groups. As can be seen from Figure 2.8, the average tax/GDP ratio in Europe and North America has been declining since the mid-2000s and is now about 20 per cent and 11 per cent, respectively. The tax to GDP ratio in East Asia and the Pacific and in Central Asia has been fluctuating with levels around 15 per cent and 10 per cent, respectively during the late 1990s and early 2000s and averaging around per cent 16 per cent in 2016. In Sub-Saharan Africa tax/GDP ratios were at around 20 per cent in 2016, while the Middle East and North Africa have experienced a slump since 2007, when average tax revenues dropped from around 17 per cent to 10 per cent of GDP in 2013.
0
5
10
15
20
25
30
35
40
45
50
5 10 15 20 25 30
Socialprotec2on
exp.as%
oftotalgovt.exp.
Governmentexpenditureas%ofGDP
AlbaniaAlbania
Switzerland
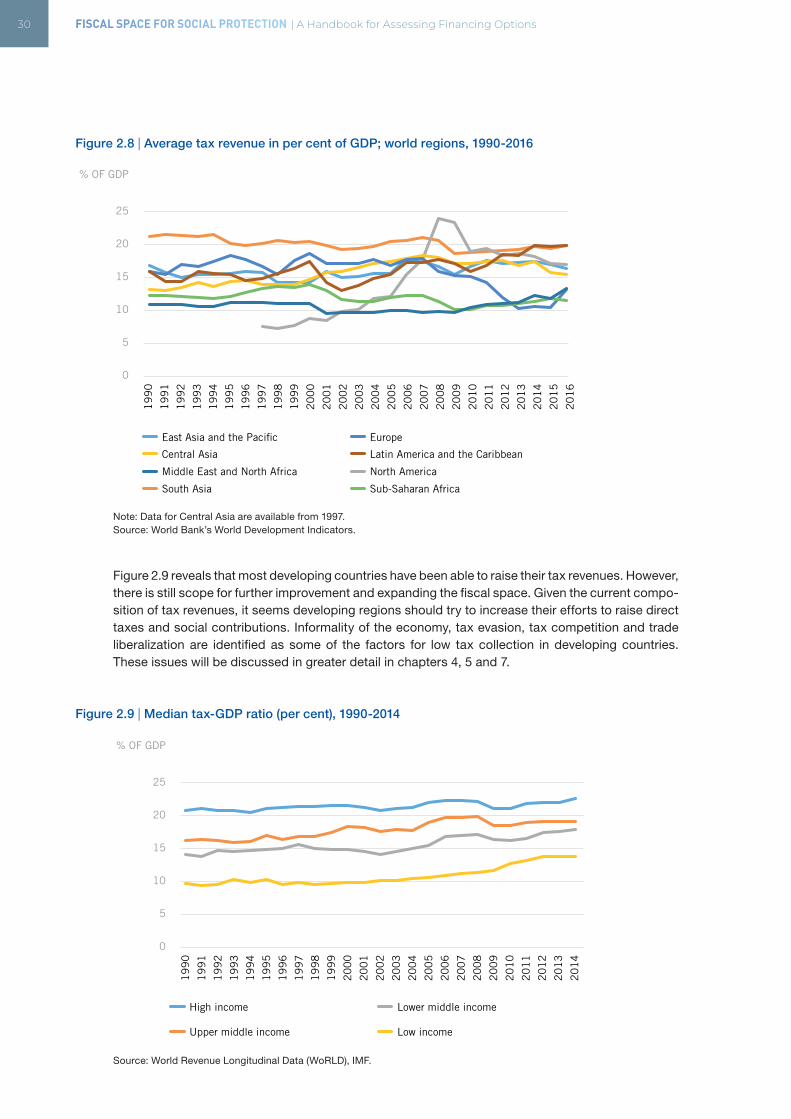
30 FISCAL SPACE FOR SOCIAL PROTECTION | A Handbook for Assessing Financing Options
Figure 2.8 | Average tax revenue in per cent of GDP; world regions, 1990-2016
Note: Data for Central Asia are available from 1997.Source: World Bank’s World Development Indicators.
Figure 2.9 reveals that most developing countries have been able to raise their tax revenues. However, there is still scope for further improvement and expanding the fiscal space. Given the current compo-sition of tax revenues, it seems developing regions should try to increase their efforts to raise direct taxes and social contributions. Informality of the economy, tax evasion, tax competition and trade liberalization are identified as some of the factors for low tax collection in developing countries. These issues will be discussed in greater detail in chapters 4, 5 and 7.
Figure 2.9 | Median tax-GDP ratio (per cent), 1990-2014
Source: World Revenue Longitudinal Data (WoRLD), IMF.
% OF GDP
0
5
10
15
20
25
19
90
19
91
19
92
19
93
19
94
19
95
19
96
19
97
19
98
19
99
20
00
20
01
20
02
20
03
20
04
20
05
20
06
20
07
20
08
20
09
20
10
20
11
20
12
20
13
20
14
20
15
20
16
East Asia and the Paci�c
Central Asia
Europe
Latin America and the Caribbean
South Asia Sub-Saharan Africa
Middle East and North Africa North America
% OF GDP
0
5
10
15
20
25
19
90
19
91
19
92
19
93
19
94
19
95
19
96
19
97
19
98
19
99
20
00
20
01
20
02
20
03
20
04
20
05
20
06
20
07
20
08
20
09
20
10
20
11
20
12
20
13
20
14
High income
Upper middle income
Lower middle income
Low income
CHAPTER 2 | SOCIAL PROTECTION FINANCING: INDICATORS AND TRENDS 31
2.4 CONCLUDING REMARKS
This chapter presents a number of public finance indicators as well as trends in public social protec-tion spending at the global and regional levels as well as in country groups by income levels. Analysing public finance – revenues and expenditures – is often hampered due to problems associated with data availability, data quality (consistency and reliability), data frequency and data disaggregation (particularly by gender, children and other social groups). The problem is compounded by the lack of uniformity in methodologies used by countries and international organizations. Thus, researchers need to qualify their findings, and try to use data from the same source; wherever different sources are used, methodologies must be checked. While efforts are underway to improve data quality and availability, useful information can be gleaned about broad trends.
Some argue that social protection policies are not affordable in developing countries. However, social protection is an important investment, it increases productivity and human capital, fosters domestic demand and promotes political stability - the most productive world economies committed to social spending in the early stages of their development. Ultimately, affordability depends on a society’s willingness to finance social protection policies. Public social protection spending does not necessarily depend on a country income level or overall government spending; social protection systems require a politically sustainable social contract.
2.5 KEY DOCUMENTS AND DATA SOURCES
IMF. 2014. Government Finance Statistics Manual 2014 (Washington DC).https://www.imf.org/external/Pubs/FT/GFS/Manual/2014/gfsfinal.pdf
This manual represents a major step forward in clarifying the standards for compiling and presenting fiscal statistics. It updates the Government Finance Statistics Manual 2001, and describes a special-ized macroeconomic statistical framework, the government finance statistics (GFS) framework, designed to support fiscal analysis. It is expected that Member Countries will adopt the guidelines of the manual as the basis for compiling and disseminating government finance statistics, and for reporting this information to the Fund. It also describes how revenues and expenditures, including those related to social protection are classified and recorded in the government finance statistics. Chapter 2 is devoted to Social Protection – the nature; boundary with private insurance; classifica-tion criteria and typology.
International relevant data sources:
ADB | Asian Development Bank• ADB Social Protection Index
https://www.adb.org/themes/social-development/social-protection/index
EU | European Union• Europa - Social Protection, https://ec.europa.eu/eurostat/web/social-protection
ILO | International Labour Office• ILOSTAT (Statistics main page), http://www.ilo.org/ilostat • ILO World Social Protection Database, https://www.social-protection.org/gimi/Wspr.action
32 FISCAL SPACE FOR SOCIAL PROTECTION | A Handbook for Assessing Financing Options
IMF | International Monetary Fund• IMF Government Finance Statistics
ISSA | International Social Security Association• ISSA Database, https://www.issa.int/en_GB/country-profiles
OECD | Organisation for Economic Co-operation and Development• Social Expenditure Database (SOCX OECD), http://www.oecd.org/social/expenditure.htm
US Social Security Administration• Social Security Programs Throughout the World, https://www.ssa.gov/policy/docs/progdesc/ssptw/
UN | United Nations• UN National Accounts, https://unstats.un.org/unsd/snaama/Introduction.asp
World Bank• World Development Indicators
Learning accomplishments
After completing this chapter, the reader should:
• Know about the indicators to monitor public social protection expenditure
• Know about relevant data sources and their limitations
• Know about the trends in public social protection expenditure
• Know about the trends in government revenue.
• Appreciate the fact that although wealthier countries can spend more on social protection, countries can spend proportionately more of their GDP or fiscal revenue on social protection regardless of their income levels if there is a political will.
• Know about the key data sources.
CHAPTER 3 | KEY CONCEPTS TO UNDERSTAND NATIONAL BUDGETS 33
CHAPTER 3. KEY CONCEPTS TO UNDERSTAND NATIONAL BUDGETS
LEARNING OBJECTIVES
• Understand the classifications of government revenues and expenditures
• Be able to read government finance and national budget tables
• Know different innovative approaches to improve budget and public finance outcomes
• Understand the budgetary process
• Recognize the role of the civil society organizations and multi-stakeholder engagements in the budgetary process
CONTENTS
• Structure of national budget
• Identifying fiscal consolidation/adjustment or austerity cuts
• Approaches to improve budget outcomes
• Budgetary process
• National social dialogue and the budget process
• Key resources and data sources
The national budget is a key instrument of implementing government policies. It not only records the government’s expected revenues and expenditure plans for the fiscal year, but more importantly, it reflects the government’s real development priorities, and how it intends to achieve them. It is important to secure adequate funding for implementing development policies. Understanding the basic features of a national budget and the budgetary process is imperative in order for various stakeholders to be able to influence national socio-economic development priorities as well as effec-tiveness of government programmes.
This chapter discusses some basic features of the central government budget – its structure and classifications of revenues and expenditure. It also discusses principles of good budgeting and some of the budgeting innovations, such as performance-based budgeting, social budgeting, that are increasingly used to improve both management of public finances and sectoral policy outcomes. The chapter also discusses how budgetary process is influenced by various actors – both internal and external and highlights the role of national social dialogues in this regard.
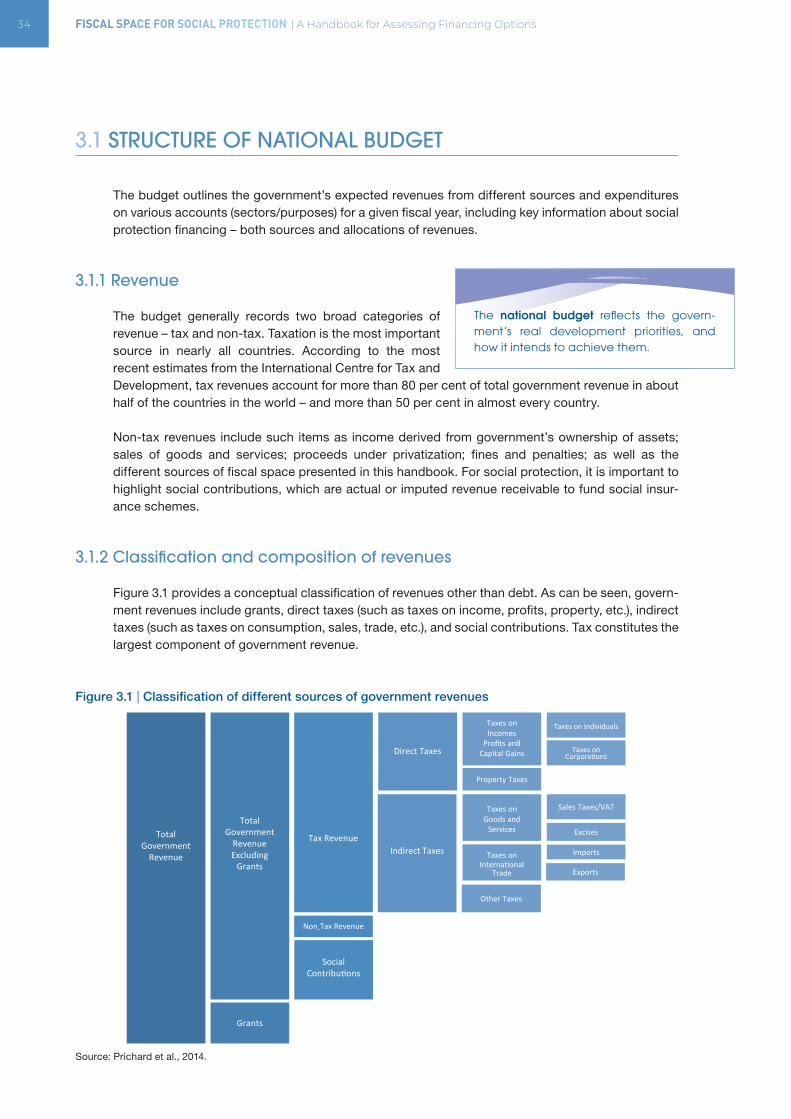
34 FISCAL SPACE FOR SOCIAL PROTECTION | A Handbook for Assessing Financing Options
3.1 STRUCTURE OF NATIONAL BUDGET
The budget outlines the government’s expected revenues from different sources and expenditures on various accounts (sectors/purposes) for a given fiscal year, including key information about social protection financing – both sources and allocations of revenues.
3.1.1 Revenue
The budget generally records two broad categories of revenue – tax and non-tax. Taxation is the most important source in nearly all countries. According to the most recent estimates from the International Centre for Tax and Development, tax revenues account for more than 80 per cent of total government revenue in about half of the countries in the world – and more than 50 per cent in almost every country.
Non-tax revenues include such items as income derived from government’s ownership of assets; sales of goods and services; proceeds under privatization; fines and penalties; as well as the different sources of fiscal space presented in this handbook. For social protection, it is important to highlight social contributions, which are actual or imputed revenue receivable to fund social insur-ance schemes.
3.1.2 Classification and composition of revenues
Figure 3.1 provides a conceptual classification of revenues other than debt. As can be seen, govern-ment revenues include grants, direct taxes (such as taxes on income, profits, property, etc.), indirect taxes (such as taxes on consumption, sales, trade, etc.), and social contributions. Tax constitutes the largest component of government revenue.
Figure 3.1 | Classification of different sources of government revenues
Source: Prichard et al., 2014.
The national budget reflects the govern-ment’s real development priorities, and how it intends to achieve them.
Total Government
Revenue
Total Government
Revenue Excluding
Grants
Grants
Tax Revenue
Social Contributions
Non-Tax Revenue
Direct Taxes
Indirect Taxes
,
Taxes onIncomes
Profits and Capital Gains
Property Taxes
Taxes on Goods and
Services
Taxes on International
Trade
Other Taxes
Taxes on Individuals
Taxes on Corporations
Sales Taxes/VAT
Excises
Imports
Exports
CHAPTER 3 | KEY CONCEPTS TO UNDERSTAND NATIONAL BUDGETS 35
While in the OECD countries, direct taxation – especially personal income taxation – is compara-tively more important, developing countries depend significantly on indirect taxes, particularly taxes on trade and consumption. Cavallo and Serebrisky (2016) shows that in advanced countries direct taxation is the most important source of revenues for the government (36.9 per cent of total taxation), something that may go up to 64.5 per cent if other direct taxes (e.g. trade taxes, property taxes and financial transactions taxes and others) are included. In contrast, developing countries have much lower revenues from direct taxation.
It is also worth noting the important role of social security revenues in higher income countries, according to the OECD, averaging at around 9 per cent of GDP (in 2014), almost 10 times larger than in developing countries. Among the OECD countries, France collects the highest – over 17 per cent of GDP in 2014 – from social security contributions, followed by Netherlands, Austria and Slovenia (above 14 per cent of GDP).
3.1.3 Expenditures
Most governments and public institutions (including international organizations) claim they do a lot for people, including the poor. The key issue is – how much? Their real priorities are reflected in their budgets’ expenditure allocations. From the point of view of social protection priorities, a crucial question is who benefits most from public expenditures? For example, is spending reaching women and vulnerable populations?
On the expenditure side, a government has two broad responsibilities which affect the budget. One is to provide a range of selected goods and services to the community (primarily on the nonmarket basis) and the other is to redistribute income and wealth through transfers. These responsibilities are mainly fulfilled through expense transactions and the classification of these are divided into economic and functional categories.
3.1.4 Classification and composition of expenditures
Public spending can be assessed using two approaches: the economic classification and the func-tional classification. The economic classification organizes expenditures according to the economic nature of the outlay and includes the following items: (i) compensation of employees, (ii) use of goods and services, (iii) consumption of fixed capital, (iii) interest, (iv) subsidies, (v) grants, (vi) social benefits, and (vii) other expenses. Compensation of employees, use of goods and services, and consumption of fixed capital all relate to the costs of producing nonmarket (and, in certain instances, market) goods and services by government. Subsidies, grants, social benefits, and transfers other than grants relate to transfers in cash or in-kind, and are aimed at redistributing income and wealth.
The functional classification provides information on the purpose for which an expense is incurred. Expenses may occur for instance in the functional area of the healthcare, education, social secu-rity or agriculture sector. Table 3.1 presents the broad classifications of revenues and expenditure according to the IMF’s Government Finance Statistics Manual 2014 (IMF GFSM, 2014). Although taxes are not highlighted, for simplicity’s sake, it should be noted that they are a key source of financing social protection. Similarly, although not all subsidies are meant for social protection, subsidies of certain type can be treated as social protection. For instance, a subsidy can be provided to increase all benefits up to an applicable social minimum for persons with a disability since childhood. The treatment of housing in the table also requires some attention. The IMF’s GFS Manual and the European System of Integrated Social Protection Statistics (ESSPROS) considers housing as part of social protection. However, the ILO does not do so on the grounds that it is not one of the basic
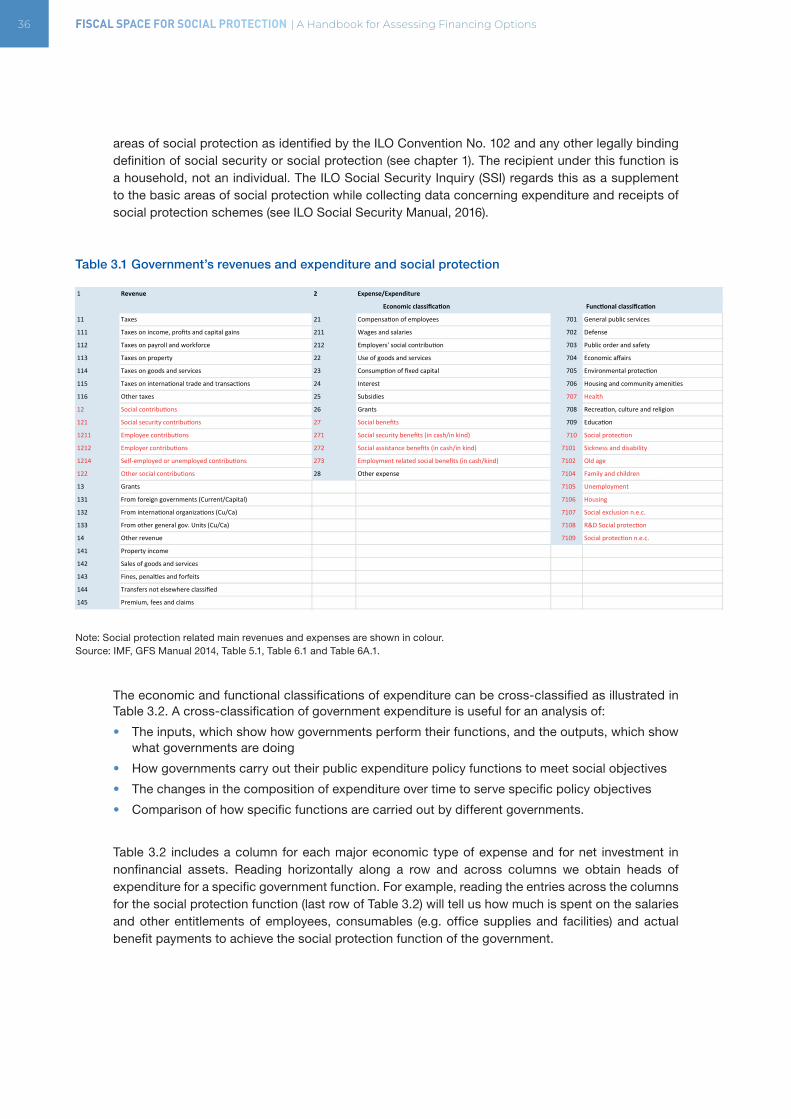
36 FISCAL SPACE FOR SOCIAL PROTECTION | A Handbook for Assessing Financing Options
areas of social protection as identified by the ILO Convention No. 102 and any other legally binding definition of social security or social protection (see chapter 1). The recipient under this function is a household, not an individual. The ILO Social Security Inquiry (SSI) regards this as a supplement to the basic areas of social protection while collecting data concerning expenditure and receipts of social protection schemes (see ILO Social Security Manual, 2016).
Table 3.1 Government’s revenues and expenditure and social protection
Note: Social protection related main revenues and expenses are shown in colour.Source: IMF, GFS Manual 2014, Table 5.1, Table 6.1 and Table 6A.1.
The economic and functional classifications of expenditure can be cross-classified as illustrated in Table 3.2. A cross-classification of government expenditure is useful for an analysis of:
• The inputs, which show how governments perform their functions, and the outputs, which show what governments are doing
• How governments carry out their public expenditure policy functions to meet social objectives
• The changes in the composition of expenditure over time to serve specific policy objectives
• Comparison of how specific functions are carried out by different governments.
Table 3.2 includes a column for each major economic type of expense and for net investment in nonfinancial assets. Reading horizontally along a row and across columns we obtain heads of expenditure for a specific government function. For example, reading the entries across the columns for the social protection function (last row of Table 3.2) will tell us how much is spent on the salaries and other entitlements of employees, consumables (e.g. office supplies and facilities) and actual benefit payments to achieve the social protection function of the government.
1 Revenue 2 Expense/Expenditure
11 Taxes 21 Compensa.onofemployees 701 Generalpublicservices111 Taxesonincome,profitsandcapitalgains 211 Wagesandsalaries 702 Defense112 Taxesonpayrollandworkforce 212 Employers'socialcontribu.on 703 Publicorderandsafety113 Taxesonproperty 22 Useofgoodsandservices 704 Economicaffairs114 Taxesongoodsandservices 23 Consump.onoffixedcapital 705 Environmentalprotec.on115 Taxesoninterna.onaltradeandtransac.ons 24 Interest 706 Housingandcommunityameni.es116 Othertaxes 25 Subsidies 707 Health12 Socialcontribu.ons 26 Grants 708 Recrea.on,cultureandreligion121 Socialsecuritycontribu.ons 27 Socialbenefits 709 Educa.on1211 Employeecontribu.ons 271 Socialsecuritybenefits(incash/inkind) 710 Socialprotec.on1212 Employercontribu.ons 272 Socialassistancebenefits(incash/inkind) 7101 Sicknessanddisability1214 Self-employedorunemployedcontribu.ons 273 Employmentrelatedsocialbenefits(incash/kind) 7102 Oldage122 Othersocialcontribu.ons 28 Otherexpense 7104 Familyandchildren13 Grants 7105 Unemployment131 Fromforeigngovernments(Current/Capital) 7106 Housing132 Frominterna.onalorganiza.ons(Cu/Ca) 7107 Socialexclusionn.e.c.133 Fromothergeneralgov.Units(Cu/Ca) 7108 R&DSocialprotec.on14 Otherrevenue 7109 Socialprotec.onn.e.c.141 Propertyincome142 Salesofgoodsandservices143 Fines,penal.esandforfeits144 Transfersnotelsewhereclassified145 Premium,feesandclaims
Economicclassifica7on Func7onalclassifica7on
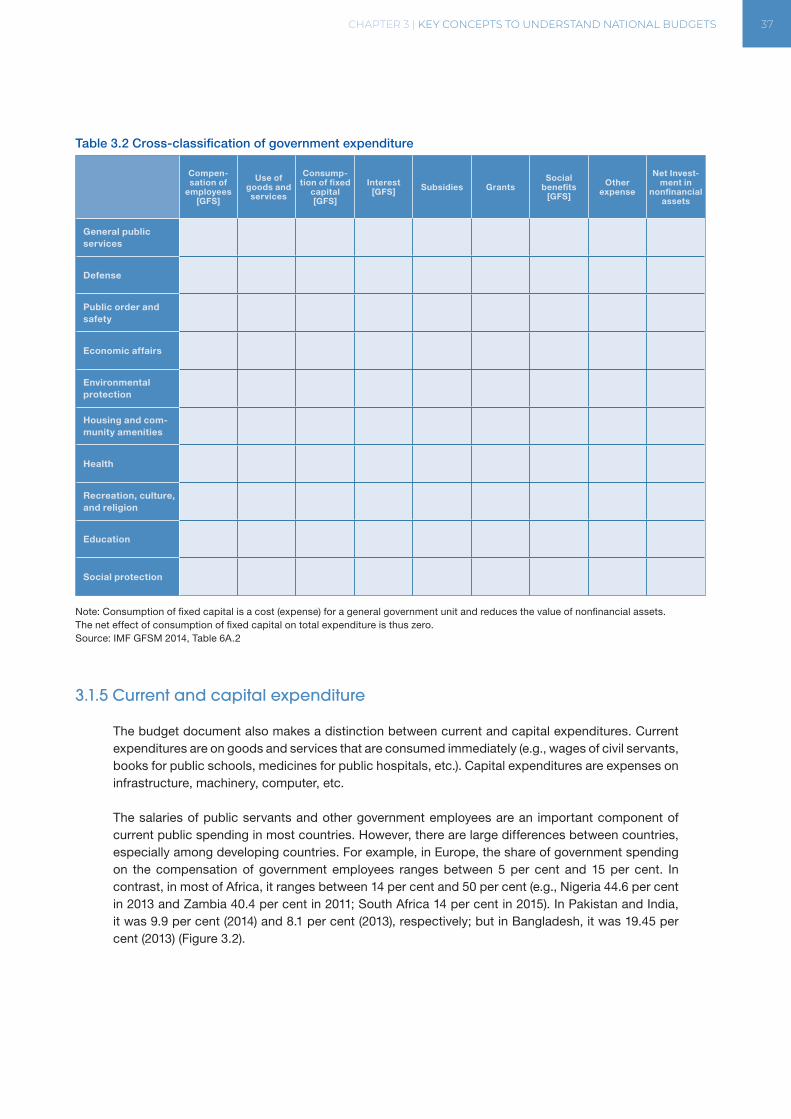
CHAPTER 3 | KEY CONCEPTS TO UNDERSTAND NATIONAL BUDGETS 37
Table 3.2 Cross-classification of government expenditure
Compen-sation of
employees [GFS]
Use of goods and services
Consump-tion of fixed
capital [GFS]
Interest [GFS] Subsidies Grants
Social benefits
[GFS]
Other expense
Net Invest-ment in
nonfinancial assets
General public services
Defense
Public order and safety
Economic affairs
Environmental protection
Housing and com- munity amenities
Health
Recreation, culture, and religion
Education
Social protection
Note: Consumption of fixed capital is a cost (expense) for a general government unit and reduces the value of nonfinancial assets. The net effect of consumption of fixed capital on total expenditure is thus zero.Source: IMF GFSM 2014, Table 6A.2
3.1.5 Current and capital expenditure
The budget document also makes a distinction between current and capital expenditures. Current expenditures are on goods and services that are consumed immediately (e.g., wages of civil servants, books for public schools, medicines for public hospitals, etc.). Capital expenditures are expenses on infrastructure, machinery, computer, etc. The salaries of public servants and other government employees are an important component of current public spending in most countries. However, there are large differences between countries, especially among developing countries. For example, in Europe, the share of government spending on the compensation of government employees ranges between 5 per cent and 15 per cent. In contrast, in most of Africa, it ranges between 14 per cent and 50 per cent (e.g., Nigeria 44.6 per cent in 2013 and Zambia 40.4 per cent in 2011; South Africa 14 per cent in 2015). In Pakistan and India, it was 9.9 per cent (2014) and 8.1 per cent (2013), respectively; but in Bangladesh, it was 19.45 per cent (2013) (Figure 3.2).
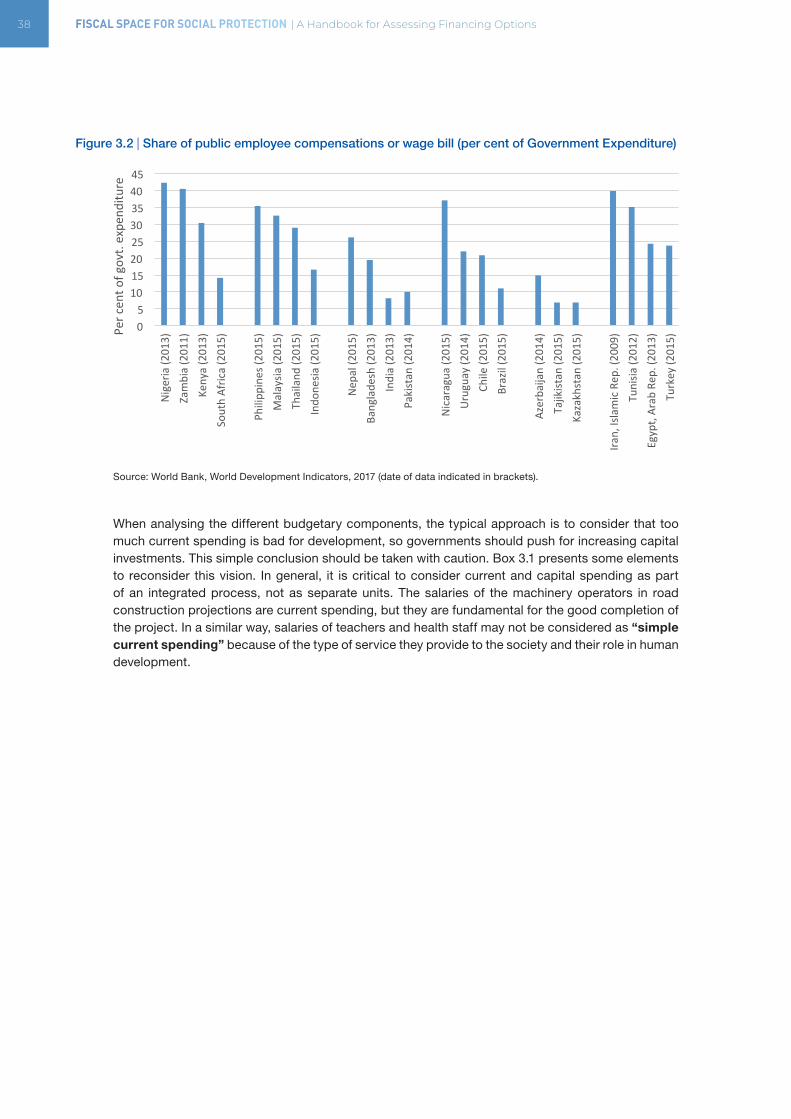
38 FISCAL SPACE FOR SOCIAL PROTECTION | A Handbook for Assessing Financing Options
Figure 3.2 | Share of public employee compensations or wage bill (per cent of Government Expenditure)
Source: World Bank, World Development Indicators, 2017 (date of data indicated in brackets).
When analysing the different budgetary components, the typical approach is to consider that too much current spending is bad for development, so governments should push for increasing capital investments. This simple conclusion should be taken with caution. Box 3.1 presents some elements to reconsider this vision. In general, it is critical to consider current and capital spending as part of an integrated process, not as separate units. The salaries of the machinery operators in road construction projections are current spending, but they are fundamental for the good completion of the project. In a similar way, salaries of teachers and health staff may not be considered as “simple current spending” because of the type of service they provide to the society and their role in human development.
05
1015202530354045
Nig
eria
(201
3)
Zam
bia
(201
1)
Keny
a(2
013)
So
uth
Afric
a(2
015)
Philipp
ines
(201
5)
Mal
aysia
(201
5)
Thai
land
(201
5)
Indo
nesia
(201
5)
Nep
al(2
015)
Ba
ngla
desh
(201
3)
Indi
a(2
013)
Pa
kist
an(2
014)
Nicar
agua
(201
5)
Uru
guay
(201
4)
Chile
(201
5)
Braz
il(2
015)
Azer
baija
n(2
014)
Ta
jikist
an(2
015)
Ka
zakh
stan
(201
5)
Iran,
Isla
micR
ep.(
2009
)Tu
nisia
(201
2)
Egyp
t,Ar
abR
ep.(
2013
)Tu
rkey
(201
5)Pe
rcen
tofg
ovt.
expe
nditu
re
CHAPTER 3 | KEY CONCEPTS TO UNDERSTAND NATIONAL BUDGETS 39
Box 3.1 IMF’s Article IV consultations and the relationship between capital and current expenditure: The issue of employee compensations and the wage bill
When a country joins the IMF, it agrees (according to Article IV) to subject its economic and finan-cial policies to the scrutiny of the international community. It also makes a commitment to pursue policies that are conducive to orderly economic growth and reasonable price stability, to avoid manipulating exchange rates for unfair competitive advantage, and to provide the IMF with data about its economy. The IMF’s regular monitoring of economies and associated provision of policy advice is intended to identify weaknesses that are causing or could lead to financial or economic instability.
During an Article IV consultation, an IMF team of economists visits a country to assess economic and financial developments and discuss the country’s economic and financial policies with government and central bank officials.
The team reports its findings to IMF management and then presents them for discussion to the Executive Board, which represents all of the IMF’s member countries. A summary of the Board’s views is subsequently transmitted to the country’s government. In this way, the views of the global community and the lessons of international experience are brought to bear on national policies. Summaries of most discussions are released in Press Releases and are posted on the IMF’s web site (www.imf.org), as are most of the country reports prepared by the staff.
Quite often government’s current expenditure comes under the spotlight, especially its employee compensations component. The IMF’s Article IV consultations are particularly critical of high employee compensations. These reports often use another term “wage bill”. Public sector wage bill includes compensation for employees from central governments, local governments, state-owned enterprises, and social security funds (IMF, 2018). It is generally argued that countries that spend proportionately more of their annual budget on employee compensations, have less to spend for development.
However, there is an important relationship between current and capital expenditures – one cannot function without the other. This can be best illustrated by an example relating to expenditures in the area of healthcare. The capital account of the budget will include allocations for building facilities and buying specialized hospital equipment. But a hospital would not function and the equipment could not be used without sufficient funds set aside for the operation of the hospital and equipment. The capital expenditure (building the hospital, buying of equipment) has to be accompanied by current expenditures (budgeting for staff/wages, medicines, medical supplies, etc.).
Although recurrent expenditures like salaries absorb most of the social budget in developing coun-tries, they remain under-funded. The United Nations has repeatedly pointed out that salaries of qualified staff must be a priority; social development happens because of human care: a teacher does not need a school to teach, and many countries correctly started by expanding low-cost medical staff (e.g. China’s “barefoot doctors”).
Therefore, as the World Bank’s guidelines for public expenditure reviews (discussed in chapter 7) suggest, the allocations for capital and recurrent expenditures should be analysed in an integrated manner within programmes and sectors. Cutting the current expenditure or employee compensa-tions to a bare-bone will not necessarily improve the development outcome or long-term growth potential. Instead, it may contribute to inefficiency and severe declines in essential public services.Unfortunately, there is no optimal ratio between capital and current expenditure. Nevertheless, governments need to carefully examine the appropriate balance, especially when allocating within a sector – how much is for employee compensations and how much is for actual functions of the sector – as part of regular reviews of expenditure reprioritization (discussed in chapter 7).
40 FISCAL SPACE FOR SOCIAL PROTECTION | A Handbook for Assessing Financing Options
3.1.6 Typology and composition of social protection revenue and expenditures
As mentioned earlier, government revenue includes social contributions, classified broadly as social security contributions and other social contributions, depending on the type of scheme receiving them. These are further classified according to the nature of the payee and the nature of the scheme that receive these contributions (Table 3.1). These receipts are from employers on behalf of their employees, from employees, or from self-employed or unemployed persons on their own behalf to secure entitlement to social benefits, payable in cash (and sometimes by in-kind benefits), to the contributors, their dependents, or their survivors. Social contributions are usually compulsory, but may also be voluntary.
Government expenditure on social protection includes expenditure on services and transfers provided to individual persons and households and expenditure on services provided on a collective basis. Expenditure on individual services and transfers includes: (i) sickness and disability bene-fits, (ii) old age pension, (iii) survivors benefit/pension, (iv) family and children benefit/allowance, (v) unemployment benefit, (vi) housing allowance/subsidy and (vii) social exclusion n.e.c. (not else-where classified), which refers to provision of social protection in the form of cash benefits and benefits in kind to persons who are socially excluded or at risk of social exclusion (such as persons who are destitute, low-income earners, immigrants, indigenous people, refugees, alcohol and substance abusers, victims of criminal violence, etc.).
Expenditure on services provided on a collective basis includes: (i) R&D social protection and (ii) social protection n.e.c. They are concerned with matters such as formulation and administration of government policy; formulation and enforcement of legislation and standards for providing social protection; and applied research and experimental development into social protection affairs and services.
In Government Finance Statistics (GFS), a social benefit expense is a transfer payment because the benefits are provided exceptionally. . Social benefits do not include transfers payable in response to events or circumstances that are not normally covered by social insurance schemes. Therefore, payments made in response to unusual events, such as natural disasters or destruction during wars, are recorded as transfers not elsewhere classified (n.e.c.).
3.1.7 Below-the-line items
These are to establish deficit/surplus relationship between revenues and expenditures; correspond-ingly, above-the-line items comprise expenditures and revenues. Below-the-line items relate to the financing of the deficit.
3.1.8 Surplus/deficit and debt
Governments generally run surplus on their current account, but deficit on the capital account. Overall the budget may be in deficit or in surplus. The component of the fiscal surplus (deficit) that is comprised of current period’s government spending less current period’s tax and non-tax revenue income, excluding interest paid on government debt, is called primary surplus (deficit). A country can have primary budget surplus, but overall budget deficit if it has a large interest bill to pay on past debts.
CHAPTER 3 | KEY CONCEPTS TO UNDERSTAND NATIONAL BUDGETS 41
Primary surplus (deficit) moves with economic cycle without any discretionary policy changes. Surplus (deficit) rises (falls) during the expansion phase as tax revenues rise and social security payments (e.g., unemployment benefits) decline; the converse happens when the economy slows down or is in a recession. Ideally, cyclically caused changes in surplus (deficit) should cancel each other out; that is, deficit caused (or additional borrowing) during the slowdown should be offset (or paid off) by the surplus created during the expansionary phase. Social security payments and progressive taxation act as automatic stabilizers.
Box 3.2 Various concepts of budget surplus/deficit
Economists also talk about structural deficit/surplus to indicate the government’s underlying fiscal stance. The structural deficit/surplus is the deficit/surplus that remains across the business cycle. It is a hypothetical construct of the budget balance that would be realized if the economy was operating at potential or full employment. Hence it is also referred to as full employment budget balance. It is obtained by adjusting the budget position (and the underlying budget parameters) against some fixed point (full capacity) to eliminate the cyclical component – the swings in activity around full employment.
The observed total budget deficit/surplus is equal to the sum of the structural deficit/surplus and the cyclical deficit/surplus. If the full employment budget is in surplus/deficit at full capacity, then it is concluded that the discretionary structure of the budget, i.e. policy stance, is contractionary/expansionary.
Generally, a country is said to have a fiscal crisis if it needs to continuously borrow to pay for its interest bill on past debts, which is an accumulation of yearly deficits. In such a situation its debt continues to grow. Fiscal crisis also arises if a country continues to have a structural budget deficit, requiring additional borrowing.
Some economists, however, criticize the distinction between cyclical and structural deficits, arguing that full employment is too difficult to measure (Mitchell, 2009). One has to depend on simplifying assumptions. It is assumed that full employment does not mean the state where there are enough jobs to satisfy the preferences of the available workforce. Instead, full employment occurs when the unemployment rate is at the level where the inflation rate remains stable.
This “benchmark” unemployment rate is referred to as the Non-accelerating inflation rate of unemployment (NAIRU). The problem is, this so-called benchmark is found to rise every time the economy slows and actual unemployment rises. That is, there is a ratchet effect of recessions on unemployment, and policy makers can find an excuse to tolerate rising unemployment for the sake of keeping the inflation rate stable. It is counter to the commitment to full employment.
Some other economists proposed “fiscal gap” as an alternative measure. The fiscal gap measures the difference between government spending and revenues over a very long term. It is calculated by taking the difference between the present value of all of government’s projected financial obligations, including future expenditures and servicing outstanding government debt, and the present value of all projected future tax and other receipts, including income accruing from the government’s current ownership of financial assets (Kotlikoff and Michel, 2015; Auerbach, Gale, and Orszag, 2004).
However, the “fiscal gap” accounting method has been criticized as fundamentally flawed (Baker, 2014). It is argued that fiscal gap accounting calculates the growth of future debt without taking into account why debt is incurrent in the first place or its use. Debt to finance infrastructure, for example, not only boosts future GDP growth, but also creates assets. Thus, future debt will fall on generations with substantially larger incomes and assets to cover the debt.
42 FISCAL SPACE FOR SOCIAL PROTECTION | A Handbook for Assessing Financing Options
3.2 IDENTIFYING FISCAL CONSOLIDATION/ADJUSTMENT OR AUSTERITY CUTS
A way to reduce budget deficits is by cutting public expenditures. This policy has been notorious in two recent periods, after the 1980s debt crisis and after the global financial crisis, 2010 onwards. The debt crisis of the 1980s created deep recessions in many developing countries; adjustment programs forced governments to cut human and economic development expenditures and led to the collapse of industrial sectors, high unemployment and poverty; these impacts were further aggra-vated by cost-recovery policies, such as levying user fees for health and education services. At the time, UNICEF responded with Adjustment with a Human Face (Cornia et al., 1987), which argued that children and families must be protected during economic crises and adjustment periods. It further reasoned that this could be achieved by adopting more expansionary macroeconomic policies, by prioritizing investments in social and economic sectors that serve vulnerable groups, and by intro-ducing or scaling up social protection programmes.
Today, the world is at a similar crossroads. This time it is a global crisis, and one that affects low- and high-income countries alike. The UNICEF responded again with A Recovery for All (Ortiz et al, 2011 and 2012), soon followed by other UN organizations such as OHCHR (2013), ILO (2014b and 2017a), UNWOMEN (2014 and 2015) and UNCTAD (2017). In higher income countries, rising debts and fiscal deficits resulted from bank bailouts to rescue the financial sector, stimulus packages, and lower govern-ment revenues due to the slowdown in economic activity. Public attention was turned to government spending, as if it were the cause of the crisis, and fiscal consolidation, the new term used for austerity cuts, was prescribed by the mainstream policy advice such as from the IMF, the OECD and the European Commission, to cut back on public policies and downsize state budgets as the main ways to reduce fiscal deficits, calm the markets and revive the economy; following this logic, the welfare state was depicted as unaffordable and a burdensome impediment to competitiveness and output growth. From 2010 onwards, these same policies were also advised to developing countries, despite the high human and developmental costs.
A contracting expenditure environment is historically associated with cuts in social spending areas, that is, health, education, and social protection. This is why it is important to spot planned public expenditure cuts and propose alternatives to promote the SDGs and national development with jobs and social protection. This may be done by looking at the national budgets and to the IMF public documents.8 Ortiz et al. (2015), after reviewing 616 IMF country reports, note that the most commonly considered current measures to contain or reduce government expenditure include:
• Eliminating or reducing subsidies, predominately on fuel, but also on electricity, food and agriculture; this adjustment measure is being implemented at a time when food and energy prices hover near record highs; if basic subsidies are withdrawn, food and transport costs increase and can become unaffordable for many households; higher energy prices also tend to contract economic activities.
• Cutting or capping the wage bill to reduce recurrent expenditure, as mentioned in section 3.1.2.2 and often carried out as part of civil service reforms; this policy may translate into the salaries of teachers, health and social workers being reduced or eroded in real value, payments in arrears, hiring freezes and/or employment retrenchment, all of which adversely impact the delivery of public services to the population. As low pay is a key factor behind teacher absenteeism,
8 Available by country https://www.imf.org/en/Countries
While a way to reduce budget deficits is cutting public expenditures, governments must look for alternative policies given the negative social impacts. Instead of imposing fiscal consolidation/adjustment or austerity cuts to populations, it is imper-ative that countries explore all possible alternatives to expand fiscal space.
CHAPTER 3 | KEY CONCEPTS TO UNDERSTAND NATIONAL BUDGETS 43
informal fees and brain drain, decisions on wage bills need to ensure that the pay, employment and retention of essential staff are safeguarded at all times to protect public services – and enhanced when fiscal situations improve – in order to support human capital development and the achievement of the SDGs.9
• Rationalising and/or further targeting social protection and welfare benefits, often by revising eligibility criteria and targeting the poorest, which is a de facto reduction of social protec-tion coverage. IMF country reports generally associate targeting with poverty reduction, as a way to reconcile poverty reduction with fiscal austerity. This policy approach runs a high risk of excluding large segments of vulnerable populations at a time of economic crisis and hardship. In most developing countries, the so-called middle classes have very low incomes, and targeting only the poor merely increases their vulnerability. Rather than targeting more and scaling down safety nets to achieve cost savings over the short term, there is a strong case for scaling up in times of crisis and building social protection floors for all.
• Reforming old-age pensions systems, such as through raising contribution rates, increasing eligibility periods, prolonging the retirement age, lowering benefits, sometimes structural reforms of contributory social security pensions. As a result, future pensioners are expected to receive lower benefits. These reforms have been contested by a number of national courts as anti- constitutional, and reforms have been reversed.
• Labour market reforms, incorporating revisions on minimum wages, limiting salary adjustments to cost of living benchmarks, decentralizing collective bargaining, and easing firing and compen-sation arrangements at the enterprise level; available evidence suggests that labour market flexibilization will not generate decent jobs; on the contrary, in a context of economic contraction, it is likely to generate labour market “precarization,” depress domestic incomes and ultimately hinder recovery efforts.
• Healthcare system reforms, generally through increasing fees and co-payments paid by patients along with cost-saving measures in public health centres. The main risk of these budget contracting options is that vulnerable groups are excluded from receiving benefits or critical assistance is diminished at a time when their needs are greatest.
Figure 3.3 summarises these findings, showing that, contrary to public perception, the incidence of these austerity measures is larger in developing countries. Additionally to the measures described above, typically two other policies are added to increase revenues, despite their generally regressive impacts:
• Increasing consumption taxes on goods and services to boost revenue by raising VAT or sales tax rates or removing exemptions; however, increasing the cost of basic goods and services can erode the already limited incomes of vulnerable households and stifle economic activity. Since this policy does not differentiate between consumers, it can be regressive, shifting the tax burden to vulnerable families and exacerbating inequalities. Alternatively, progressive tax approaches should be considered, such as taxes on income, inheritance, property and corpora-tions, including the financial sector, as we will discuss in chapter 5.
• Privatisation of public assets and services is another source of short-term revenue source according to the IMF reports; sales proceeds produce short-term gains, but also long-term losses given the lack of future revenues; additionally, privatization risks include layoffs, tariff increases, unaffordable and low quality goods and public services.
9 UNICEF (2010a), in a study carried out during the crisis period, reveals after analysing salary information on primary teachers and nurses that their pay in real terms significantly diminished by increases in local prices during 2009 in about a third of the countries for which data were available; the results also suggest that, in about half of the countries in the sample, teachers or nurses were not adequately compensated.
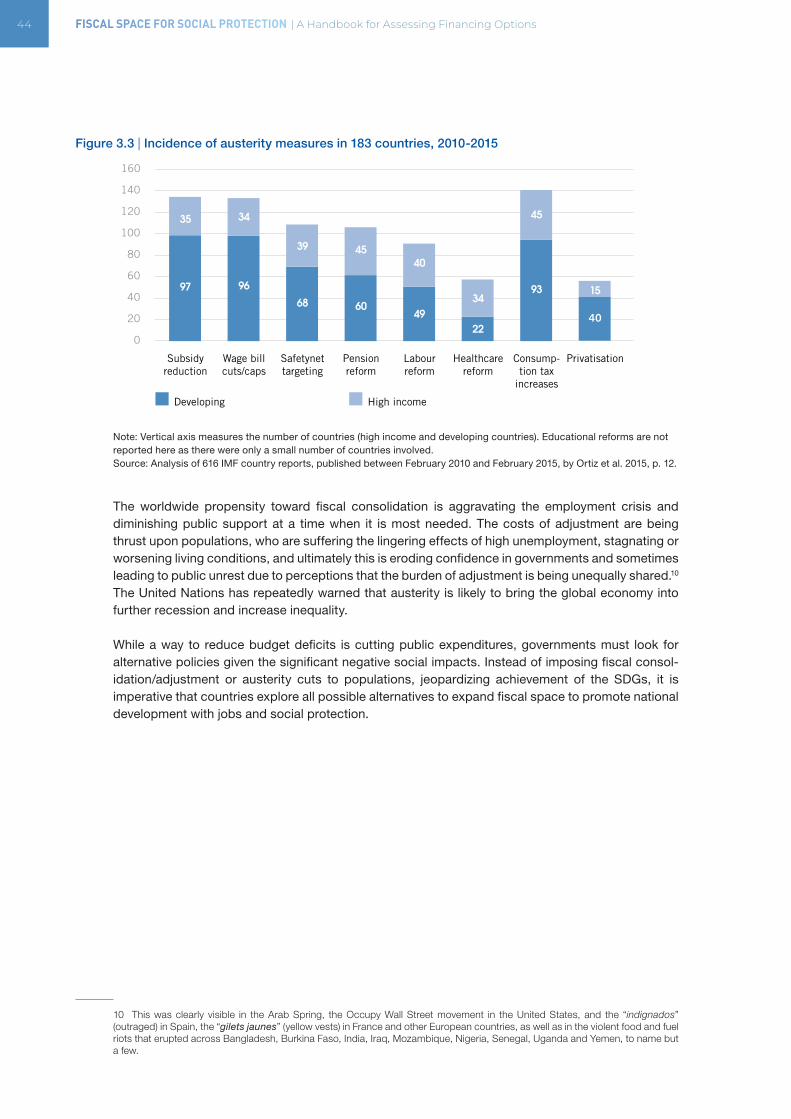
44 FISCAL SPACE FOR SOCIAL PROTECTION | A Handbook for Assessing Financing Options
Figure 3.3 | Incidence of austerity measures in 183 countries, 2010-2015
Note: Vertical axis measures the number of countries (high income and developing countries). Educational reforms are not reported here as there were only a small number of countries involved.Source: Analysis of 616 IMF country reports, published between February 2010 and February 2015, by Ortiz et al. 2015, p. 12.
The worldwide propensity toward fiscal consolidation is aggravating the employment crisis and diminishing public support at a time when it is most needed. The costs of adjustment are being thrust upon populations, who are suffering the lingering effects of high unemployment, stagnating or worsening living conditions, and ultimately this is eroding confidence in governments and sometimes leading to public unrest due to perceptions that the burden of adjustment is being unequally shared.10 The United Nations has repeatedly warned that austerity is likely to bring the global economy into further recession and increase inequality.
While a way to reduce budget deficits is cutting public expenditures, governments must look for alternative policies given the significant negative social impacts. Instead of imposing fiscal consol-idation/adjustment or austerity cuts to populations, jeopardizing achievement of the SDGs, it is imperative that countries explore all possible alternatives to expand fiscal space to promote national development with jobs and social protection.
10 This was clearly visible in the Arab Spring, the Occupy Wall Street movement in the United States, and the “indignados” (outraged) in Spain, the “gilets jaunes” (yellow vests) in France and other European countries, as well as in the violent food and fuel riots that erupted across Bangladesh, Burkina Faso, India, Iraq, Mozambique, Nigeria, Senegal, Uganda and Yemen, to name but a few.
0
20
40
60
80
100
120
140
160
Subsidyreduction
35
97
Wage billcuts/caps
34
96
Safetynettargeting
39
68
Pensionreform
45
60
Labourreform
40
49
Healthcarereform
34
22
Consump-tion tax
increases
45
1593
Privatisation
40
Developing High income
CHAPTER 3 | KEY CONCEPTS TO UNDERSTAND NATIONAL BUDGETS 45
3.3 IMPROVING BUDGET OUTCOMES
Most governments and public institutions (including international organizations) claim they do a lot for people, including the poor. The key issue is – how much? Their real priorities are reflected in their budgets’ expenditure allocations. Who benefits most from public expenditures? Is spending reaching women and vulnerable populations?
The budget is the primary instrument for turning national development objectives and aspirations into reality. More importantly, the budget is a contract between citizens and state, showing how resources are raised and allocated for the delivery of public services and development plans. There-fore, it must be clear, transparent and credible if the budget document is to command trust, and to serve as a basis of accountability (OECD, 2014b). This section briefly discusses some of the key features of a good budgeting process.
3.3.1 Principles of good budgeting
Although the Ministry of Finance typically leads the process of shaping the budget, budgeting is neither the preserve of central government only, nor is it a purely bureaucratic process. It is a process that involves all levels of government, national and subnational. It draws together the contributions from ministers, parliamentarians, public officials and other trusted advisers, civil society organiza-tions and advocacy groups and, increasingly, from citizens themselves.
An effective budgetary process is one that takes these contributions, weighs and considers them, and transforms them into a set of proposals for action for the betterment of society given a series of financial constraints and macroeconomic goals. A sound budgeting system is one which engenders trust among citizens that government is listening to their concerns, has a plan for achieving worthwhile objectives, and will use the available resources effectively, efficiently and in a sustainable manner in doing so. Good budgeting is supported by, and in turn supports, the various pillars of modern public governance: integrity, openness, participation, accountability and a strategic approach to planning and achieving national objectives.
Public finance experts assign three main functions to a good budgeting process: (i) supervision and control of public finance in order to guarantee their long term sustainability; (ii) allocative efficiency, which means being able to structure the budget in accordance to the priorities of the government and the objectives of the public policies; (iii) operational efficiency, which implies optimization in the use of available resources (Schick and OECD Senior Budget Officials, 2009).
In other words, budgeting goes beyond the phase of formulation when the financial needs of each entity are estimated. Good budgeting governance requires following a series of principles and actions along the budgeting cycle in order to improve the relationship between planning and resource allocation and make the process more transparent. The OECD (2014b) has identified the following principles for good budgeting governance:
The budget is the primary instrument for turning national development objectives and aspirations into reality. The budget is a contract between citizens and state, showing how resources are raised and allocated for the delivery of public services and development plans.
46 FISCAL SPACE FOR SOCIAL PROTECTION | A Handbook for Assessing Financing Options
• Budgets should be managed within clear, credible and predictable limits for fiscal policy
• Budgets should be closely aligned with the medium-term strategic priorities of government, responding to national development objectives for all citizens
• Budget documents and data should be open, transparent and accessible
• Debate on budgetary choices should be inclusive, participative and realistic
• Budgets should present a comprehensive, accurate and reliable account of the public finances
• Budget execution should be actively planned, managed and monitored
• Performance, evaluation and value for money should be integral to the budget process
• Longer-term sustainability and other fiscal risks should be identified, assessed and managed prudently
• The integrity and quality of budgetary forecasts, fiscal plans and budgetary implementation should be promoted through rigorous quality assurance including independent audit.
3.3.2 Performance-based budgeting
Performance-based budgeting (PBB) is defined as “budgeting linking the funds allocated to measur-able results” (OECD, 2007). It generally establishes performance targets for budget lines on the basis of various indicators of their actual achievement (see Box 3.3 for an example). The overarching objectives of PBB are the strengthening of accountability towards citizens with more transparent policy and budget information, the optimization of expenditure allocations through better budgetary decision-making processes and the improvement of the quality of public service.
Apart from efficiency gains, the introduction of performance-based budgeting is motivated often by an attempt to discipline government expenditure and to limit or avoid misappropriation of public funds. This motivation is particularly important in developing and low income countries where public financial planning is often weak and transparency in the management of public funds is low.
There are various guides on how to design performance-based budgeting tools and there is no one size fits all approach. Despite reported benefits, performance-based budgeting success is not clear and does not automatically lead to the desired results. When pursuing the objective to strengthen public spending efficiency, whatever the instrument chosen, a purely legislative approach is not a sufficient condition for success. It can fail in structurally reorienting spending and performance management at all levels of public administration. Some observers argue that the performance of governments depends more on the behaviour of politicians and civil servants than on the format of its budget, or on the dexterity in measurement, or on performance bonuses and other financial incentives. Here lies the importance of transparency and openness that help constant scrutiny by stakeholders.
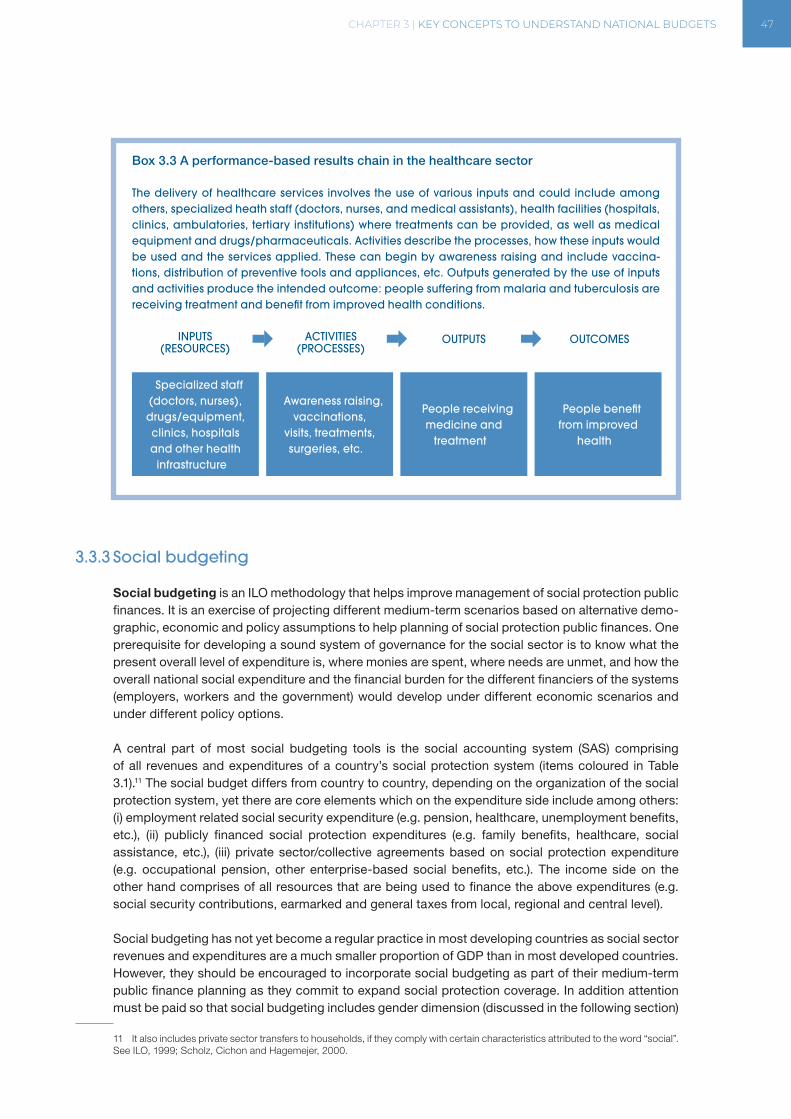
CHAPTER 3 | KEY CONCEPTS TO UNDERSTAND NATIONAL BUDGETS 47
Box 3.3 A performance-based results chain in the healthcare sector
The delivery of healthcare services involves the use of various inputs and could include among others, specialized heath staff (doctors, nurses, and medical assistants), health facilities (hospitals, clinics, ambulatories, tertiary institutions) where treatments can be provided, as well as medical equipment and drugs/pharmaceuticals. Activities describe the processes, how these inputs would be used and the services applied. These can begin by awareness raising and include vaccina-tions, distribution of preventive tools and appliances, etc. Outputs generated by the use of inputs and activities produce the intended outcome: people suffering from malaria and tuberculosis are receiving treatment and benefit from improved health conditions.
INPUTS ACTIVITIES (RESOURCES) (PROCESSES)
OUTPUTS OUTCOMES
3.3.3 Social budgeting
Social budgeting is an ILO methodology that helps improve management of social protection public finances. It is an exercise of projecting different medium-term scenarios based on alternative demo-graphic, economic and policy assumptions to help planning of social protection public finances. One prerequisite for developing a sound system of governance for the social sector is to know what the present overall level of expenditure is, where monies are spent, where needs are unmet, and how the overall national social expenditure and the financial burden for the different financiers of the systems (employers, workers and the government) would develop under different economic scenarios and under different policy options.
A central part of most social budgeting tools is the social accounting system (SAS) comprising of all revenues and expenditures of a country’s social protection system (items coloured in Table 3.1).11 The social budget differs from country to country, depending on the organization of the social protection system, yet there are core elements which on the expenditure side include among others: (i) employment related social security expenditure (e.g. pension, healthcare, unemployment benefits, etc.), (ii) publicly financed social protection expenditures (e.g. family benefits, healthcare, social assistance, etc.), (iii) private sector/collective agreements based on social protection expenditure (e.g. occupational pension, other enterprise-based social benefits, etc.). The income side on the other hand comprises of all resources that are being used to finance the above expenditures (e.g. social security contributions, earmarked and general taxes from local, regional and central level).
Social budgeting has not yet become a regular practice in most developing countries as social sector revenues and expenditures are a much smaller proportion of GDP than in most developed countries. However, they should be encouraged to incorporate social budgeting as part of their medium-term public finance planning as they commit to expand social protection coverage. In addition attention must be paid so that social budgeting includes gender dimension (discussed in the following section)
11 It also includes private sector transfers to households, if they comply with certain characteristics attributed to the word “social”. See ILO, 1999; Scholz, Cichon and Hagemejer, 2000.
Specialized staff (doctors, nurses), drugs/equipment, clinics, hospitals and other health
infrastructure
Awareness raising, vaccinations,
visits, treatments, surgeries, etc.
People receiving medicine and
treatment
People benefit from improved
health
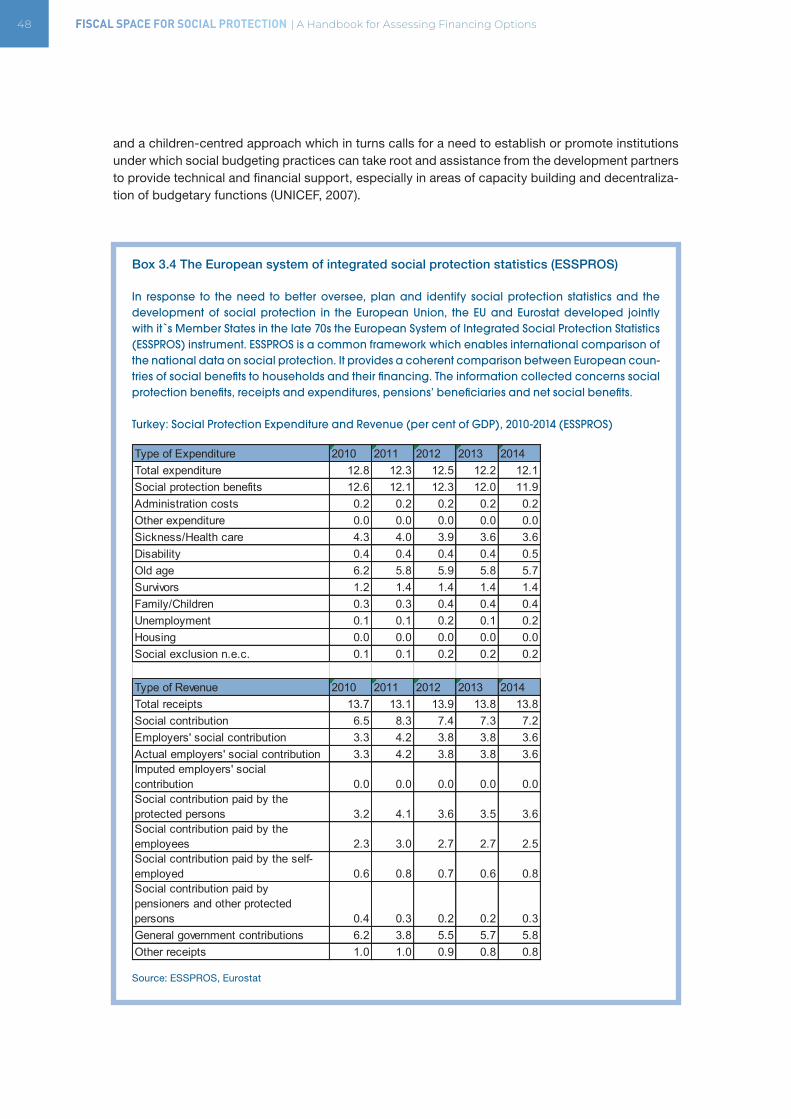
48 FISCAL SPACE FOR SOCIAL PROTECTION | A Handbook for Assessing Financing Options
and a children-centred approach which in turns calls for a need to establish or promote institutions under which social budgeting practices can take root and assistance from the development partners to provide technical and financial support, especially in areas of capacity building and decentraliza-tion of budgetary functions (UNICEF, 2007).
Box 3.4 The European system of integrated social protection statistics (ESSPROS)
In response to the need to better oversee, plan and identify social protection statistics and the development of social protection in the European Union, the EU and Eurostat developed jointly with it s Member States in the late 70s the European System of Integrated Social Protection Statistics (ESSPROS) instrument. ESSPROS is a common framework which enables international comparison of the national data on social protection. It provides a coherent comparison between European coun-tries of social benefits to households and their financing. The information collected concerns social protection benefits, receipts and expenditures, pensions’ beneficiaries and net social benefits.
Turkey: Social Protection Expenditure and Revenue (per cent of GDP), 2010-2014 (ESSPROS)
Source: ESSPROS, Eurostat
Type of Expenditure 2010 2011 2012 2013 2014Total expenditure 12.8 12.3 12.5 12.2 12.1Social protection benefits 12.6 12.1 12.3 12.0 11.9Administration costs 0.2 0.2 0.2 0.2 0.2Other expenditure 0.0 0.0 0.0 0.0 0.0Sickness/Health care 4.3 4.0 3.9 3.6 3.6Disability 0.4 0.4 0.4 0.4 0.5Old age 6.2 5.8 5.9 5.8 5.7Survivors 1.2 1.4 1.4 1.4 1.4Family/Children 0.3 0.3 0.4 0.4 0.4Unemployment 0.1 0.1 0.2 0.1 0.2Housing 0.0 0.0 0.0 0.0 0.0Social exclusion n.e.c. 0.1 0.1 0.2 0.2 0.2
Type of Revenue 2010 2011 2012 2013 2014Total receipts 13.7 13.1 13.9 13.8 13.8Social contribution 6.5 8.3 7.4 7.3 7.2Employers' social contribution 3.3 4.2 3.8 3.8 3.6Actual employers' social contribution 3.3 4.2 3.8 3.8 3.6Imputed employers' social contribution 0.0 0.0 0.0 0.0 0.0Social contribution paid by the protected persons 3.2 4.1 3.6 3.5 3.6Social contribution paid by the employees 2.3 3.0 2.7 2.7 2.5Social contribution paid by the self-employed 0.6 0.8 0.7 0.6 0.8Social contribution paid by pensioners and other protected persons 0.4 0.3 0.2 0.2 0.3General government contributions 6.2 3.8 5.5 5.7 5.8Other receipts 1.0 1.0 0.9 0.8 0.8
CHAPTER 3 | KEY CONCEPTS TO UNDERSTAND NATIONAL BUDGETS 49
3.3.4 Gender budgeting
The rationale for gender budgeting arises from the recognition of the fact that national budgets impact men and women differently through the pattern of resource allocation. In majority of the countries, women constitute at least half the population, but they lag behind men on many social indicators like health, education, economic opportunities, etc. A study by the UN Women (2018b) notes that women are over-represented in both low incomes and limited economic resources cate-gories in every country. Hence, they warrant special attention due to their vulnerability and lack of access to resources. The way government budgets allocate resources, has the potential to transform these gender inequalities. Gender budgeting requires production of a sex-disaggregated report of end users or recipients of budget programmes.
Gender budgeting is a form of social budgeting; but it is not an accounting exercise, nor just about the content of budgets. It is an ongoing process of keeping a gender perspective in policy/programme formulation, its implementation and review. It helps mainstreaming gender in the budgetary process. It requires an ongoing commitment to understanding gender, which includes analysis and consulta-tion, and ongoing budget readjustments to take account of the changing needs of women and men, boys and girls. Where analysis reveals that budget resources have not been distributed in a gender equitable way, a response from the budget is required to redress the inequity. Where the distribu-tion of budget resources does not match the government’s gender equality policies, realignment is required. Once the differential impact of the budget on women and on men is revealed, there is an obligation to incorporate gender as a category of analysis within the budgetary processes.12
3.4 THE BUDGETARY PROCESS
The first step in the formal budget process for most countries is the undertaking of strategy formula-tion, at both the national and ministry levels. Figure 3.4 represents a simplified version of the budget process. This includes taking into account guiding documents that have been produced, such as national social protection strategies, or national sustainable development strategies, to prioritize the issues for the upcoming budget period. Specifically, within the social protection sector there also exist documents that lay out objectives, constraints, and goals for the sector.
The annual budgetary expenditures should also meet the medium-term expenditure framework (MTEF)13 (Figure 3.4). The alignment of social protection strate-gies and budgetary allocations with the MTEF is crucial for moving social protection of a country forward without jeopardizing long-term sustainability of public finance as well as for avoiding under– or misallocation of fund.
12 Budgeting for Women’s Rights: Monitoring Government Budgets for Compliance with CEDAW, 2006 (authored by Diane Elson and published by UNIFEM in 2006) combines substantive analysis with country examples, and discusses how budgets and budget policy-making processes can be monitored for compliance with human rights standards, in particular with provisions in CEDAW.
13 The MTEF is annual, rolling three year-expenditure planning to set out medium-term expenditure priorities and hard budget constraints against which sector plans can be developed and refined. MTEF also contains outcome criteria for the purpose of performance monitoring.
Most governments and public institutions (including international organizations) claim they do a lot for people, including the poor. But, how much? Their real prior-ities are reflected in their budgets. Who benefits most from public expenditures? Is spending reaching women and vulnerable populations?
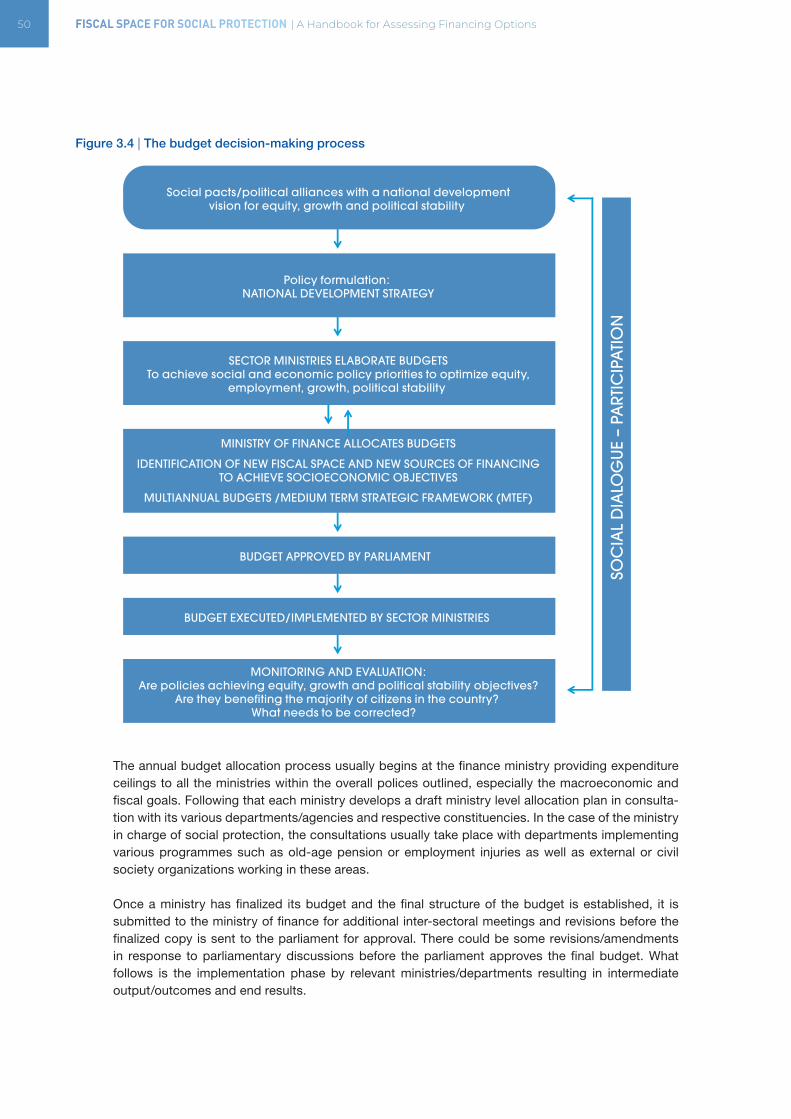
50 FISCAL SPACE FOR SOCIAL PROTECTION | A Handbook for Assessing Financing Options
Figure 3.4 | The budget decision-making process
The annual budget allocation process usually begins at the finance ministry providing expenditure ceilings to all the ministries within the overall polices outlined, especially the macroeconomic and fiscal goals. Following that each ministry develops a draft ministry level allocation plan in consulta-tion with its various departments/agencies and respective constituencies. In the case of the ministry in charge of social protection, the consultations usually take place with departments implementing various programmes such as old-age pension or employment injuries as well as external or civil society organizations working in these areas.
Once a ministry has finalized its budget and the final structure of the budget is established, it is submitted to the ministry of finance for additional inter-sectoral meetings and revisions before the finalized copy is sent to the parliament for approval. There could be some revisions/amendments in response to parliamentary discussions before the parliament approves the final budget. What follows is the implementation phase by relevant ministries/departments resulting in intermediate output/outcomes and end results.
Social pacts/political alliances with a national developmentvision for equity, growth and political stability
Policy formulation: NATIONAL DEVELOPMENT STRATEGY
SECTOR MINISTRIES ELABORATE BUDGETSTo achieve social and economic policy priorities to optimize equity,
employment, growth, political stability
MINISTRY OF FINANCE ALLOCATES BUDGETS
IDENTIFICATION OF NEW FISCAL SPACE AND NEW SOURCES OF FINANCINGTO ACHIEVE SOCIOECONOMIC OBJECTIVES
MULTIANNUAL BUDGETS /MEDIUM TERM STRATEGIC FRAMEWORK (MTEF)
BUDGET APPROVED BY PARLIAMENT
BUDGET EXECUTED/IMPLEMENTED BY SECTOR MINISTRIES
MONITORING AND EVALUATION:Are policies achieving equity, growth and political stability objectives?
Are they benefiting the majority of citizens in the country? What needs to be corrected?
SOC
IAL
DIA
LOG
UE
– PA
RTIC
IPA
TIO
N
CHAPTER 3 | KEY CONCEPTS TO UNDERSTAND NATIONAL BUDGETS 51
Figure 3.4 also shows factors outside the formal budget process that also impact both budget process and outcomes. The following section briefly discusses the role of multi-stakeholder engage-ments in the budget process.
3.5 NATIONAL SOCIAL DIALOGUE AND THE BUDGET PROCESS
The discussion in the previous section has highlighted the role of stakeholders and interest groups in influencing the budgetary allocations. Social dialogue is defined by the International Labour Office to include all types of negotiation and consultation among representatives of governments, employers and workers, on issues of common interest relating to economic and social policy. Social dialogue is the best mechanism in promoting better living and working conditions as well as social justice. It is an instrument, a tool of good governance in various areas and its relevance is not just related to social protection but in general to any effort to make the economy more performing and more competitive and to make society in general more stable and more equitable.
As mentioned earlier, the budgeting process is increasingly involving civil society, trade unions, employer organizations, CSOs, advocacy groups and citizens themselves. It is a phenomenon that coincided with the democratization process and an outcome of the demand for more transparency and participation. Multi-stakeholder social dialogue has become an integral part of national budget process in many countries – chapter 12 discusses this in greater detail. The UN and its agencies, working as-One, are also promoting national social dialogue, especially to promote social protec-tion. As a forerunner in the field of labour and social policies, the ILO has been driving national social dialogues in the area of social protection and co-leading the One-UN Social Protection Floor Initiative (ILO, 2015).
The Assessment Based National Dialogue (ABND) on Social Protection aims to build national consensus on the extension of social protection benefits, identifying priority areas for the govern-ment`s intervention, estimating the cost of these interventions, the possible sources of fiscal space and best implementation options (ILO, 2016d). This process has worked well in numerous countries. The assessment consists of three main steps:
• Step one focuses on the building of an assessment of the social protection gaps and priorities, looking at the effectiveness of different areas of social protection, from child benefits to old-age pensions.
• Step two involves the costing of policy options and identification of potential sources of fiscal space.
• Step three is the national agreement on the preferred policy options and the development of a communication strategy to seek support for endorsement and implementation.
Representatives of national dialogues include relevant line ministries (including the Ministry of Finance), national statistics offices and academia, workers and employer`s representatives, civil society organisations, local governments and UN agencies involved in the Social Protection Floor Initiative (ILO, 2013). Some key social protection CSOs are presented in Box 5. The ABND process provides the opportunity to gather all stakeholders, who oftentimes work in isolation and only deal with a part of the social protection agenda, and to come up with a common diagnosis of the social protection situation, formulate shared priority policy options, and progressively define a vision for the development of social protection. Most importantly, consensus is achieved through consultations, workshops, technical meetings where policy options are revised taking into account budgets and cost implications.
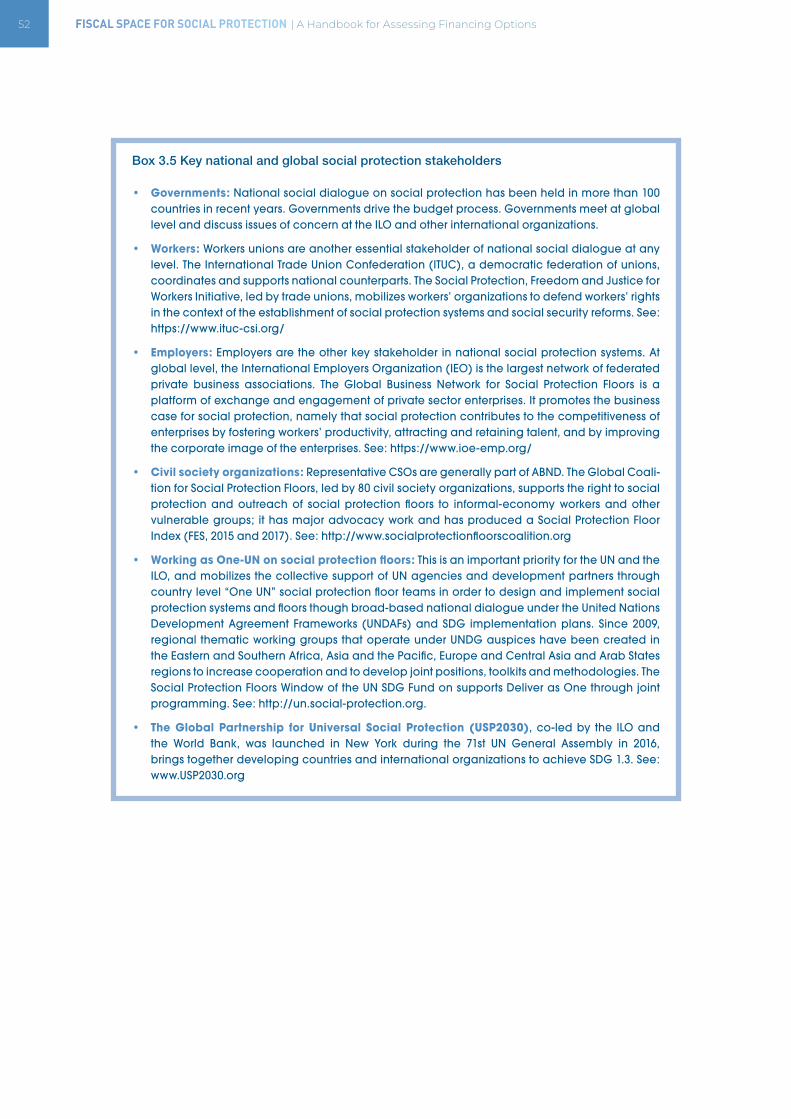
52 FISCAL SPACE FOR SOCIAL PROTECTION | A Handbook for Assessing Financing Options
Box 3.5 Key national and global social protection stakeholders
• Governments: National social dialogue on social protection has been held in more than 100 countries in recent years. Governments drive the budget process. Governments meet at global level and discuss issues of concern at the ILO and other international organizations.
• Workers: Workers unions are another essential stakeholder of national social dialogue at any level. The International Trade Union Confederation (ITUC), a democratic federation of unions, coordinates and supports national counterparts. The Social Protection, Freedom and Justice for Workers Initiative, led by trade unions, mobilizes workers’ organizations to defend workers’ rights in the context of the establishment of social protection systems and social security reforms. See: https://www.ituc-csi.org/
• Employers: Employers are the other key stakeholder in national social protection systems. At global level, the International Employers Organization (IEO) is the largest network of federated private business associations. The Global Business Network for Social Protection Floors is a platform of exchange and engagement of private sector enterprises. It promotes the business case for social protection, namely that social protection contributes to the competitiveness of enterprises by fostering workers’ productivity, attracting and retaining talent, and by improving the corporate image of the enterprises. See: https://www.ioe-emp.org/
• Civil society organizations: Representative CSOs are generally part of ABND. The Global Coali-tion for Social Protection Floors, led by 80 civil society organizations, supports the right to social protection and outreach of social protection floors to informal-economy workers and other vulnerable groups; it has major advocacy work and has produced a Social Protection Floor Index (FES, 2015 and 2017). See: http://www.socialprotectionfloorscoalition.org
• Working as One-UN on social protection floors: This is an important priority for the UN and the ILO, and mobilizes the collective support of UN agencies and development partners through country level “One UN” social protection floor teams in order to design and implement social protection systems and floors though broad-based national dialogue under the United Nations Development Agreement Frameworks (UNDAFs) and SDG implementation plans. Since 2009, regional thematic working groups that operate under UNDG auspices have been created in the Eastern and Southern Africa, Asia and the Pacific, Europe and Central Asia and Arab States regions to increase cooperation and to develop joint positions, toolkits and methodologies. The Social Protection Floors Window of the UN SDG Fund on supports Deliver as One through joint programming. See: http://un.social-protection.org.
• The Global Partnership for Universal Social Protection (USP2030), co-led by the ILO and the World Bank, was launched in New York during the 71st UN General Assembly in 2016, brings together developing countries and international organizations to achieve SDG 1.3. See: www.USP2030.org
CHAPTER 3 | KEY CONCEPTS TO UNDERSTAND NATIONAL BUDGETS 53
3.6 CONCLUDING REMARKS
The budget is the primary instrument for turning national development objectives and aspirations into reality. The budget is a contract between citizens and state, showing how resources are raised and allocated for the delivery of public services and development plans. It is thus important to understand the structure of the budget and budgeting practices. Typically, the government’s annual budgeting process is led by the Ministry of Finance, with the advice of the IMF. But the budget is too important to be decided by the central government alone; with the process of the democratization and the emphasis on inclusion, transparency and accountability, multi-stakeholder social dialogue has become an integral part of national budget process in many countries.
Therefore, when looking at possible entry points to influence social protection budgeting, it is important to understand the processes around budgeting and how government revenues and expen-ditures impact fiscal space and the allocation of public funds. Involving workers’ and employers’ organizations, as well as representative CSOs, in the budget process enhances inclusiveness, accountability, transparency and hence overall political sustainability.
3.7 KEY DOCUMENTS AND DATA SOURCES
OECD. 2014. OECD Principles of Budgetary Governance (Paris). http://www.oecd.org/gov/budgeting/Draft-Principles-Budgetary-Governance.pdf
The Principles provide a concise overview of good practices across the full spectrum of budget activity, taking into account in particular of the lessons of the recent economic crisis, and aim to give practical guidance for designing, implementing and improving budget systems to meet the challenges of the future. The overall intention is to provide a useful reference tool for policy-makers and practitioners around the world, and help ensure that public resources are planned, managed and used effectively.
Norton, A.; Elson, D. 2002. What’s behind the budget? Politics, rights and accountability in the budget process (London, Overseas Development Institute).
This paper contributes to the evolving understanding of public expenditure management as a polit-ical, rather than a purely technical, process. It identifies issues, partners, tools and methods that may help development actors to support citizen accountability and a pro-poor, gender-equitable, focus in public expenditure management. The paper aims to take this debate forward by looking at the ways in which a rights approach can contribute to strengthening pro-poor voice and outcomes in budget processes.
Scholz, W.; Cichon, M.; Hagemejer, K. 2000. Social budgeting (Geneva, International Labour Office).
This book is intended to be a practical guide on how to establish a rational tool for information about social protection expenditure and revenue. It addresses the past and the future; thus it shows how to set up a methodologically reasonable statistical basis on the financing of social protection, and it explains how to develop a meaningful mathematical projection instrument that allows a useful look into the future.
54 FISCAL SPACE FOR SOCIAL PROTECTION | A Handbook for Assessing Financing Options
Data sources
Government finance statistics – revenues and expenditures – are available from:
• Ministry of Finance, National Budget documents
• IMF, Government Finance Statistics and IMF country reports available at: https://www.imf.org/en/Countries
• World Bank, World Development Indicators
Learning accomplishments
After completing this chapter, the reader should:
• Know about the structure of national budget – different sources of revenues and types of expen-diture – and the different concepts of budget deficits and surplus;
• Know about various innovative approaches to improving budgetary outcomes, in particular about the principles of good budgeting, performance-based budgeting, social budgeting and gender-budgeting;
• Have a good idea about the budgetary process and the role different inside and outside stake-holders play in the budgetary process in influencing budgetary allocations and revenue measures;
• Understand the concept fiscal consolidation/austerity measures and its consequences;
• Recognize the critical role that trade unions, employers, civil society organizations and social dialogue can play in both influencing budgetary allocations and revenue measures;
• Know about the key resources and data sources.
CHAPTER 4 | SOCIAL SECURITY CONTRIBUTIONS 55
CHAPTER 4. SOCIAL SECURITY CONTRIBUTIONS
LEARNING OBJECTIVES
• Understand the importance of social contributions to finance social protection
• Know salient features of social contributions including its political economy
• Understand the linkages between formalization policies, the extension of coverage of social security and fiscal space for social protection
• Understand critical gender issues in social security contributory systems
• Know about key resources and data sources
CONTENTS
• The role of social contributions in financing social protection
• Understanding controversies around social contributions
• Positive impacts of social security contributions on aggregated demand, growth, productivity, and household income
• Gender perspectives in contributory systems
• Creating fiscal space through social contributions in practice
• Good international experiences
• Key documents and data sources
Collecting social security contributions is an important way to finance social protection. The ILO defines social security contributions as a prior payment that is directly linked to protection guarantees (acquired rights and entitlements) through insurance mechanisms (ILO, 2017a). Social security contri-butions may be collected from both employees and employers, linking them to the nine branches of social protection, including child and family benefits, maternity protection, unemployment support, employment injury benefits, sickness benefits, health protection, (medical care), old-age benefits, invalidity/disability benefits, and survivors’ benefits. According to the ILO Convention C102, social security contributions shall be collected in a manner which avoids hardship to persons of small means and takes into account the economic situation of the member and the classes of persons protected. Furthermore, the total of the insurance contributions borne by the employees protected shall not exceed 50 per cent of the total of the financial resources allocated to the protection of employees and their families including children.
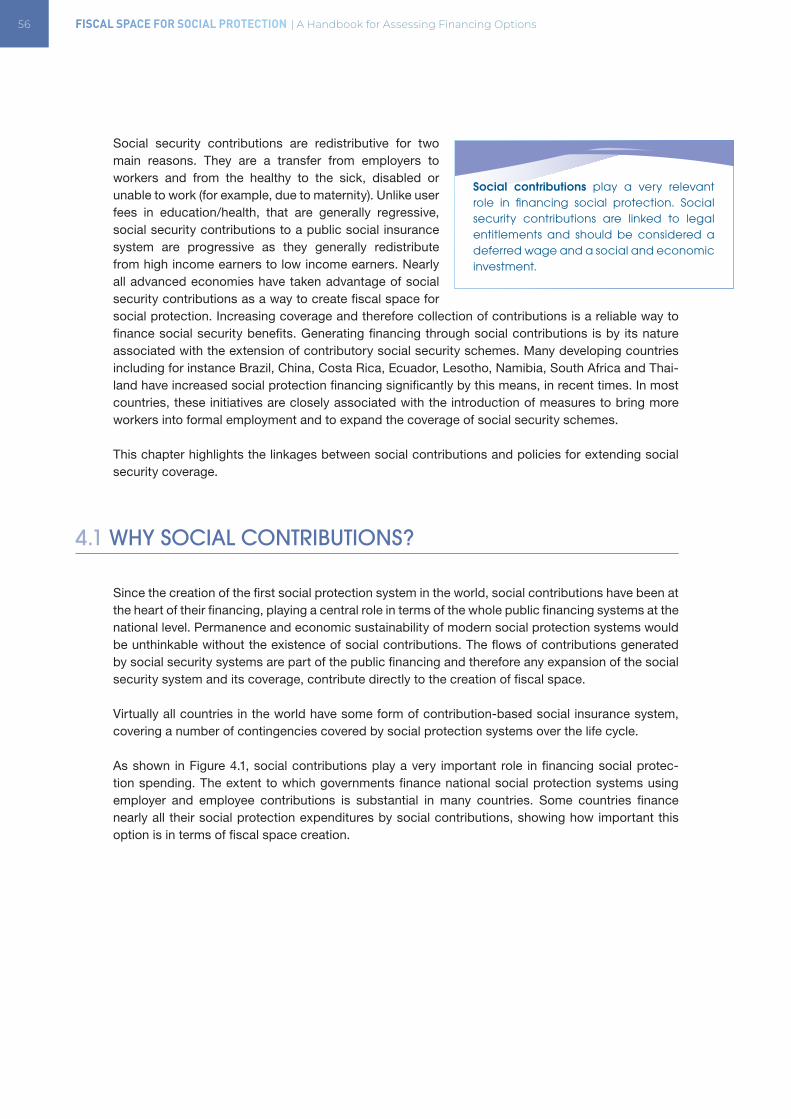
56 FISCAL SPACE FOR SOCIAL PROTECTION | A Handbook for Assessing Financing Options
Social security contributions are redistributive for two main reasons. They are a transfer from employers to workers and from the healthy to the sick, disabled or unable to work (for example, due to maternity). Unlike user fees in education/health, that are generally regressive, social security contributions to a public social insurance system are progressive as they generally redistribute from high income earners to low income earners. Nearly all advanced economies have taken advantage of social security contributions as a way to create fiscal space for social protection. Increasing coverage and therefore collection of contributions is a reliable way to finance social security benefits. Generating financing through social contributions is by its nature associated with the extension of contributory social security schemes. Many developing countries including for instance Brazil, China, Costa Rica, Ecuador, Lesotho, Namibia, South Africa and Thai-land have increased social protection financing significantly by this means, in recent times. In most countries, these initiatives are closely associated with the introduction of measures to bring more workers into formal employment and to expand the coverage of social security schemes.
This chapter highlights the linkages between social contributions and policies for extending social security coverage.
4.1 WHY SOCIAL CONTRIBUTIONS?
Since the creation of the first social protection system in the world, social contributions have been at the heart of their financing, playing a central role in terms of the whole public financing systems at the national level. Permanence and economic sustainability of modern social protection systems would be unthinkable without the existence of social contributions. The flows of contributions generated by social security systems are part of the public financing and therefore any expansion of the social security system and its coverage, contribute directly to the creation of fiscal space.
Virtually all countries in the world have some form of contribution-based social insurance system, covering a number of contingencies covered by social protection systems over the life cycle.
As shown in Figure 4.1, social contributions play a very important role in financing social protec-tion spending. The extent to which governments finance national social protection systems using employer and employee contributions is substantial in many countries. Some countries finance nearly all their social protection expenditures by social contributions, showing how important this option is in terms of fiscal space creation.
Social contributions play a very relevant role in financing social protection. Social security contributions are linked to legal entitlements and should be considered a deferred wage and a social and economic investment.
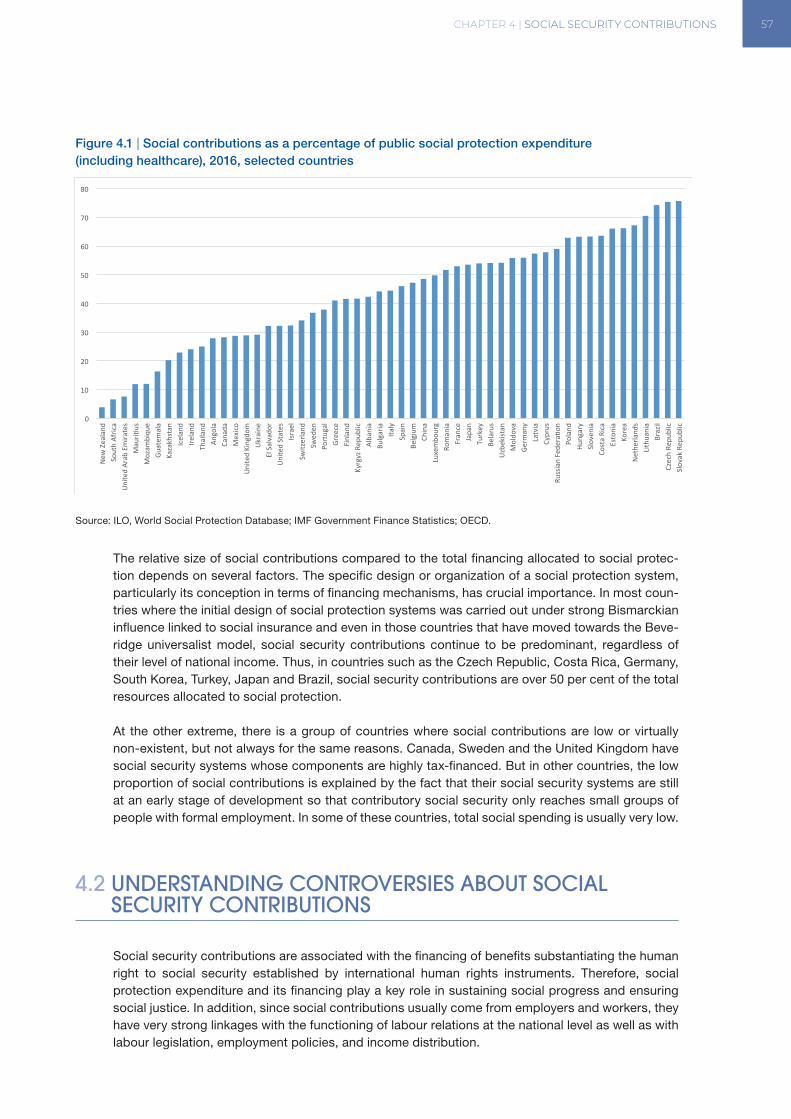
CHAPTER 4 | SOCIAL SECURITY CONTRIBUTIONS 57
Figure 4.1 | Social contributions as a percentage of public social protection expenditure(including healthcare), 2016, selected countries
Source: ILO, World Social Protection Database; IMF Government Finance Statistics; OECD.
The relative size of social contributions compared to the total financing allocated to social protec-tion depends on several factors. The specific design or organization of a social protection system, particularly its conception in terms of financing mechanisms, has crucial importance. In most coun-tries where the initial design of social protection systems was carried out under strong Bismarckian influence linked to social insurance and even in those countries that have moved towards the Beve-ridge universalist model, social security contributions continue to be predominant, regardless of their level of national income. Thus, in countries such as the Czech Republic, Costa Rica, Germany, South Korea, Turkey, Japan and Brazil, social security contributions are over 50 per cent of the total resources allocated to social protection.
At the other extreme, there is a group of countries where social contributions are low or virtually non-existent, but not always for the same reasons. Canada, Sweden and the United Kingdom have social security systems whose components are highly tax-financed. But in other countries, the low proportion of social contributions is explained by the fact that their social security systems are still at an early stage of development so that contributory social security only reaches small groups of people with formal employment. In some of these countries, total social spending is usually very low.
4.2 UNDERSTANDING CONTROVERSIES ABOUT SOCIAL SECURITY CONTRIBUTIONS
Social security contributions are associated with the financing of benefits substantiating the human right to social security established by international human rights instruments. Therefore, social protection expenditure and its financing play a key role in sustaining social progress and ensuring social justice. In addition, since social contributions usually come from employers and workers, they have very strong linkages with the functioning of labour relations at the national level as well as with labour legislation, employment policies, and income distribution.
0
10
20
30
40
50
60
70
80
NewZealand
SouthAfrica
UnitedArabEmirates
MauriCus
Mozambique
Guatemala
Kazakhstan
Iceland
Ireland
Thailand
Angola
Canada
Mexico
UnitedKingdom
Ukraine
ElSalvador
UnitedStates
Israel
Switzerland
Sweden
Portugal
Greece
Finland
KyrgyzRepublic
Albania
Bulgaria
Italy
Spain
Belgium
China
Luxembourg
Romania
France
Japan
Turkey
Belarus
Uzbekistan
Moldova
Germany
Latvia
Cyprus
RussianFederaCon
Poland
Hungary
Slovenia
CostaRica
Estonia
Korea
Netherlands
Lithuania
Brazil
CzechRepublic
SlovakRepublic
58 FISCAL SPACE FOR SOCIAL PROTECTION | A Handbook for Assessing Financing Options
One of the most controversial issues in social security financing has to do with the alleged link between the level of social contributions and informality and unemployment. Based on the neoclas-sical economic thinking, there is a school of thought which argues in favour of the idea that social contributions raise the labour cost, i.e. the relative price of labour as a productive resource, discour-aging labour demand and generating labour informality and unemployment. The classical domi-nant analysis is based on the concept of “tax wedge”, which explains the difference between the equilibrium wage in the labour market and the equilibrium-generated amount of labour demand in the labour market if there are no social contributions, and the higher salary and lower amount of labour demand that will result from introducing such contributions. The difference between the two positions of equilibrium in the labour market creates a “wedge of inefficiency” or “deadweight loss”. Following this theoretical framework, the neoclassical economics approach automatically concludes that the average tax wedge measures the extent to which tax on labour income discourages employ-ment. Therefore, from the point of view of neoclassical economics thinking, the starting point for any analysis of social contributions is surrounded by a negative connotation.
Such an argument leads directly to the conclusion that lowering informality and unemployment requires reducing social contributions; many countries are being advised in that direction. However, informality and unemployment are the results of the interaction of a set of institutional, economic and social factors; and therefore, neoclassical microeconomic models are by far incapable of explaining the phenomena. An empirical study by Williams and Kedir (2018), based on 142 coun-tries (of which 15 countries are developed) supports this claim. The findings of the study refute the tenets of neo-liberal theory and show that informality is significantly higher when there is economic under-development, a lack of modernization of governance, inadequate state intervention to protect workers from poverty and greater asymmetry between the formal and informal institutions. In fact, based on simple observation one can conclude that, in general, there is no conclusive evidence that countries with the lower levels of social security contributions rates (be it total or only employers) are those that in turn show the lower levels of informality, as can be seen in Figure 4.2 (a and b). Figures 4.3 a and b present information on the relationship between social security contributions rate (total and employer) and the unemployment rate in the economy for a selected number of countries; no clear relation is observed between the variables in question in this instance either. To overcome the challenge of informality and unemployment, careful labour market reforms might help. For instance, reform initiatives can lead to adapting social insurance mechanisms to cover new forms of employ-ment including those prevalent in the informal economy thereby ensuring smooth transitions from informal to formal work arrangements. This is, for example, evident from a number of Latin American countries adopting the Monotax scheme, discussed later in this chapter.
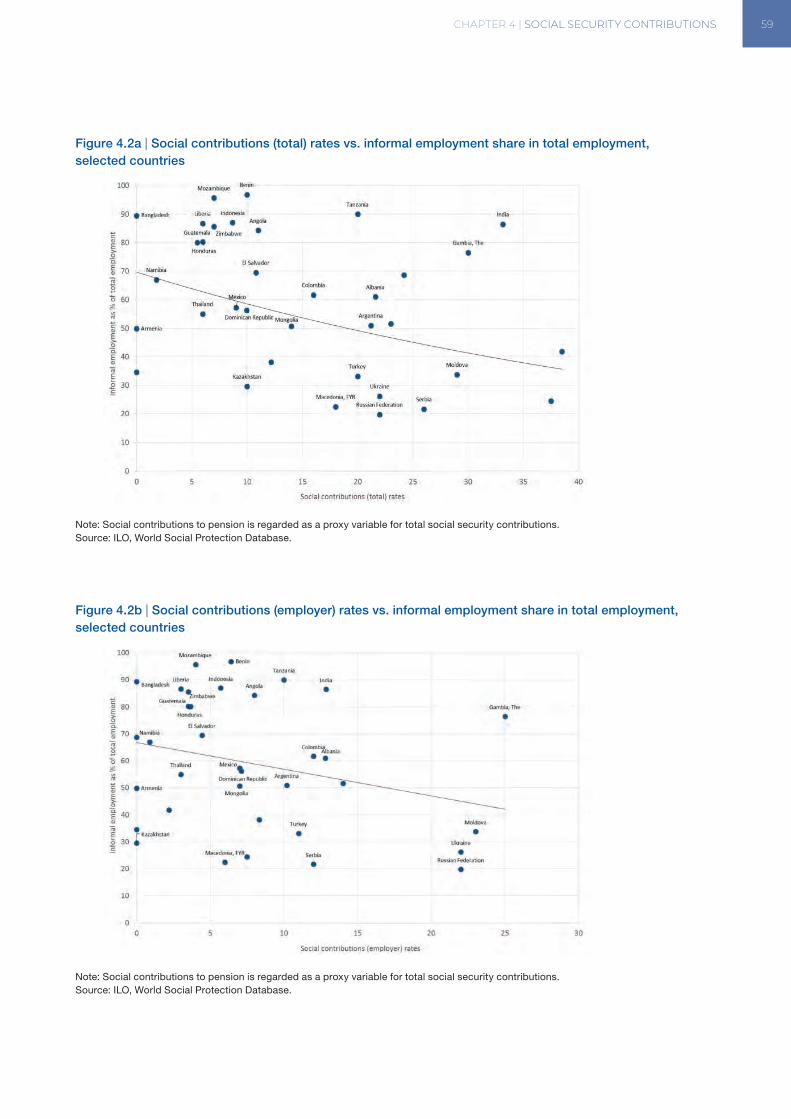
CHAPTER 4 | SOCIAL SECURITY CONTRIBUTIONS 59
Figure 4.2a | Social contributions (total) rates vs. informal employment share in total employment, selected countries
Note: Social contributions to pension is regarded as a proxy variable for total social security contributions. Source: ILO, World Social Protection Database.
Figure 4.2b | Social contributions (employer) rates vs. informal employment share in total employment, selected countries
Note: Social contributions to pension is regarded as a proxy variable for total social security contributions. Source: ILO, World Social Protection Database.
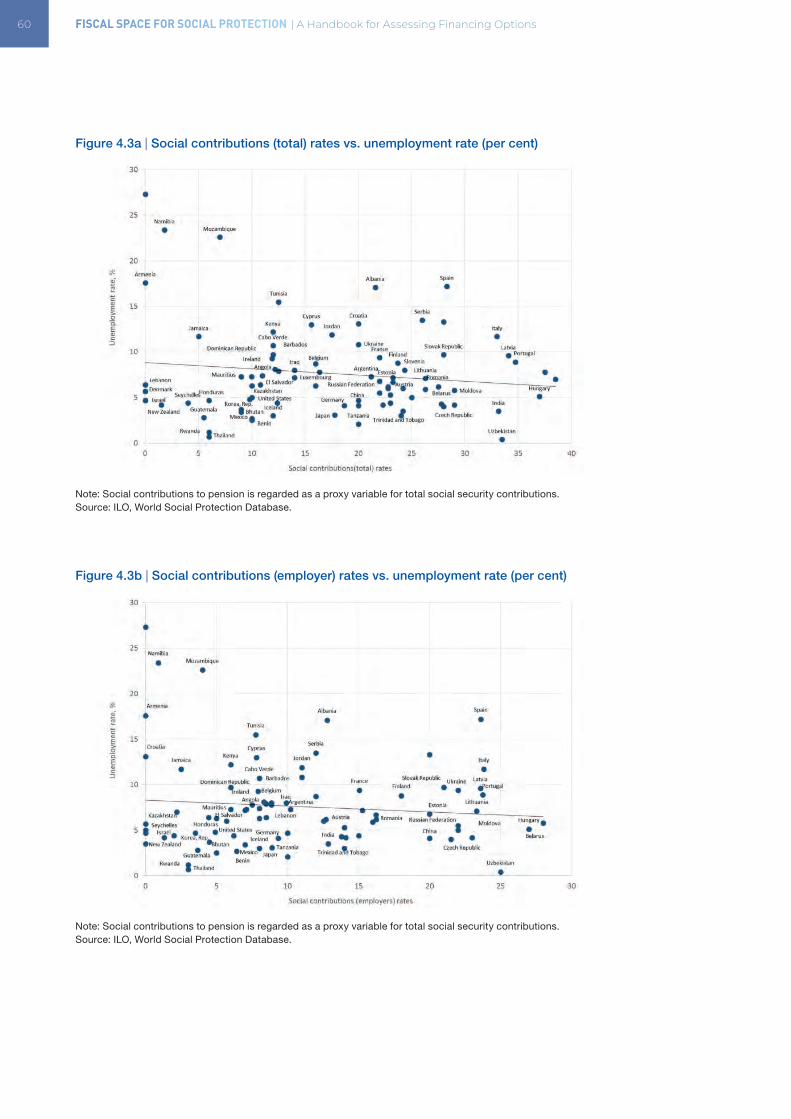
60 FISCAL SPACE FOR SOCIAL PROTECTION | A Handbook for Assessing Financing Options
Figure 4.3a | Social contributions (total) rates vs. unemployment rate (per cent)
Note: Social contributions to pension is regarded as a proxy variable for total social security contributions.Source: ILO, World Social Protection Database.
Figure 4.3b | Social contributions (employer) rates vs. unemployment rate (per cent)
Note: Social contributions to pension is regarded as a proxy variable for total social security contributions.Source: ILO, World Social Protection Database.
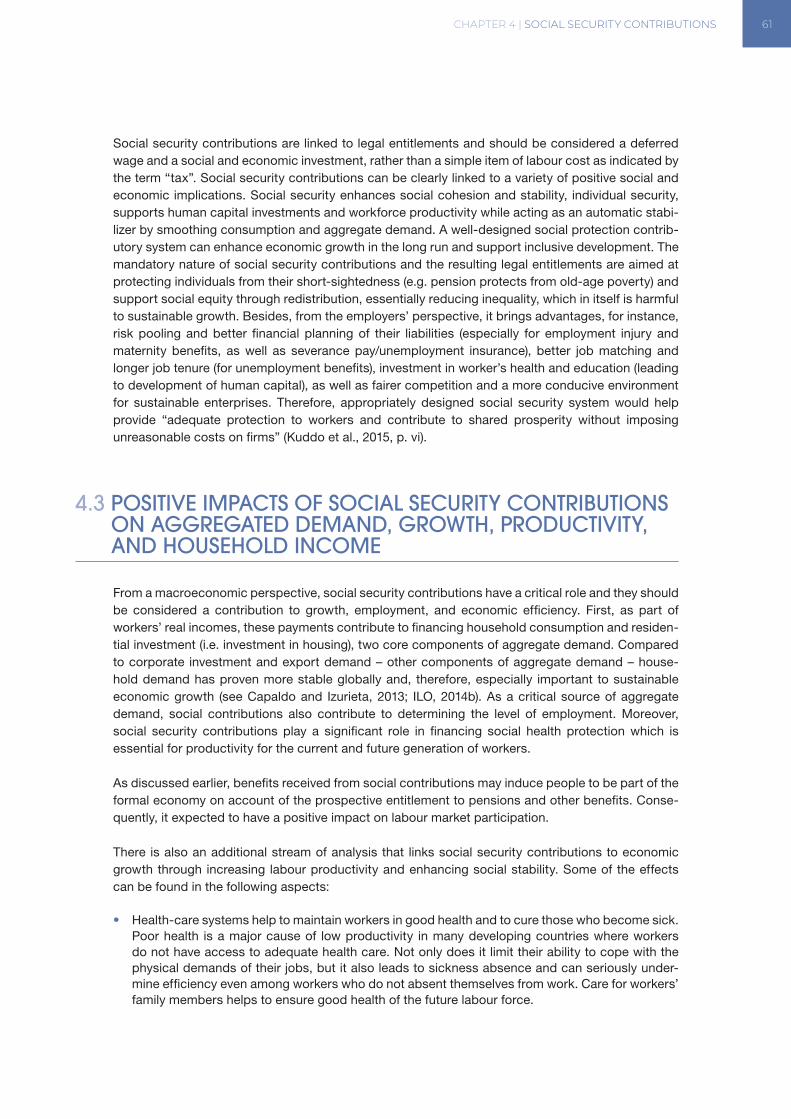
CHAPTER 4 | SOCIAL SECURITY CONTRIBUTIONS 61
Social security contributions are linked to legal entitlements and should be considered a deferred wage and a social and economic investment, rather than a simple item of labour cost as indicated by the term “tax”. Social security contributions can be clearly linked to a variety of positive social and economic implications. Social security enhances social cohesion and stability, individual security, supports human capital investments and workforce productivity while acting as an automatic stabi-lizer by smoothing consumption and aggregate demand. A well-designed social protection contrib-utory system can enhance economic growth in the long run and support inclusive development. The mandatory nature of social security contributions and the resulting legal entitlements are aimed at protecting individuals from their short-sightedness (e.g. pension protects from old-age poverty) and support social equity through redistribution, essentially reducing inequality, which in itself is harmful to sustainable growth. Besides, from the employers’ perspective, it brings advantages, for instance, risk pooling and better financial planning of their liabilities (especially for employment injury and maternity benefits, as well as severance pay/unemployment insurance), better job matching and longer job tenure (for unemployment benefits), investment in worker’s health and education (leading to development of human capital), as well as fairer competition and a more conducive environment for sustainable enterprises. Therefore, appropriately designed social security system would help provide “adequate protection to workers and contribute to shared prosperity without imposing unreasonable costs on firms” (Kuddo et al., 2015, p. vi).
4.3 POSITIVE IMPACTS OF SOCIAL SECURITY CONTRIBUTIONS ON AGGREGATED DEMAND, GROWTH, PRODUCTIVITY, AND HOUSEHOLD INCOME
From a macroeconomic perspective, social security contributions have a critical role and they should be considered a contribution to growth, employment, and economic efficiency. First, as part of workers’ real incomes, these payments contribute to financing household consumption and residen-tial investment (i.e. investment in housing), two core components of aggregate demand. Compared to corporate investment and export demand – other components of aggregate demand – house-hold demand has proven more stable globally and, therefore, especially important to sustainable economic growth (see Capaldo and Izurieta, 2013; ILO, 2014b). As a critical source of aggregate demand, social contributions also contribute to determining the level of employment. Moreover, social security contributions play a significant role in financing social health protection which is essential for productivity for the current and future generation of workers.
As discussed earlier, benefits received from social contributions may induce people to be part of the formal economy on account of the prospective entitlement to pensions and other benefits. Conse-quently, it expected to have a positive impact on labour market participation.
There is also an additional stream of analysis that links social security contributions to economic growth through increasing labour productivity and enhancing social stability. Some of the effects can be found in the following aspects:
• Health-care systems help to maintain workers in good health and to cure those who become sick. Poor health is a major cause of low productivity in many developing countries where workers do not have access to adequate health care. Not only does it limit their ability to cope with the physical demands of their jobs, but it also leads to sickness absence and can seriously under-mine efficiency even among workers who do not absent themselves from work. Care for workers’ family members helps to ensure good health of the future labour force.
62 FISCAL SPACE FOR SOCIAL PROTECTION | A Handbook for Assessing Financing Options
• Pension systems ease the departure of older workers from the labour force, thereby helping to avoid the problem of workers remaining in employment when their productivity has fallen to a low level. Besides, pensions are often shared with other members of the household, particularly with children, and thus contribute substantially to reducing child poverty and to the well-being and schooling of children.
• Cash sickness benefit contributes to the recovery of sick workers by removing the financial pressure to carry on working when ill. It also helps to maintain the productivity of other workers by countering the spread of infection.
• Maternity insurance is of particular importance for the reproduction of a healthy workforce, as well as for the maintenance of the health of working mothers.
• In many countries work injury schemes play an important role in providing resources for preventing work-related accidents and sickness and in rehabilitating workers who fall victim to these. Such activities are of considerable relevance to productivity, given the enormous numbers of days off work attributable to avoidable health risks.
• Unemployment benefit provides unemployed workers with the breathing space they need in order to find suitable work, which makes full use of their talents and potential; the associated employment and training services are also highly relevant in this respect. Besides, unemployment insurance has a positive effect associated with the increased duration of subsequent employ-ment and this beneficial effect on employment stability is pronounced in countries with relatively generous benefit systems (Tatsiramos, 2009).
• Child benefits (and other cash benefits provided when the primary income earner is unable to work) help to ensure that families with children have enough income to provide proper nutrition and a healthy living environment for their children. In developing countries, child benefits can also be a powerful instrument to combat child labour and promote school attendance. Children can thus receive an education that will permit them in the long run to attain much higher levels of productivity and income.
• Social security can be an important factor in the maintenance of effective demand and of busi-ness confidence. This effect is most evident in the case of unemployment benefits which help to maintain the purchasing power of workers who have lost their jobs. For example, Germany’s part-time unemployment benefit was one of the country’s main policy instruments during the global financial and economic crisis. This benefit allowed companies faced with a drop in demand to retain workers on shorter working hours while guaranteeing them at least a degree of income security. Partial compensation for their loss in direct earnings was made through a cash benefit paid for a maximum period of six months. As a result, the sudden downturn of the economy led to only a moderate increase in the number of unemployed people (ILO, 2014b). However, other social security benefits also act as an economic buffer during a recession or crisis. Without them, the multiplier effects of the first round of job losses could be followed by second and third rounds that could cut deep into the social fabric of the community, as well as leaving much of the economy working well below its capacity. Social security thus helps to prevent production from falling too far and to keep companies in business, with their workforce intact, ready to participate in the upswing when it comes.
In short, the impact of social contributions goes beyond their economic impact. Social security also has a positive role in enhancing change, improving living standards, increasing the produc-tivity of enterprises and economies while contributing to social cohesion and labour productivity by maintaining the good health of the labour force, easing the departure of older workers, and making workers better able to accept change (ILO, 2001).
CHAPTER 4 | SOCIAL SECURITY CONTRIBUTIONS 63
4.4 WOMEN IN SOCIAL SECURITY CONTRIBUTORY SYSTEMS: ADVANCING GENDER EQUALITY
In many countries, contributory social protection schemes were designed around a “male bread-winner” model, assuming formal employment and uninterrupted and full-time careers. Gender inequality in the social security system largely reflects gender inequality in the labour market and employment, for instance, lower labour force participation for women, shorter employment career, and women suffering from gender wage gaps. This puts women in a disadvantaged position as they tend to struggle to accrue social security rights that are equal to their male counterparts, leaving them with lower levels of accumulated contributions and eventually lower benefit levels. This is espe-cially the case for old-age pensions and unemployment benefits.
Women’s labour market participation is on average 26 percentage points lower than that of men (ILO, 2016g). Unpaid care work is the main reason why women are outside the labour force; across the world, around 21.7 per cent working-age women perform unpaid care work on a full-time basis, compared to 1.5 per cent working-age men (ILO, 2019). Also, historically, their participation in formal labour markets and wage employment have been lower than men’s and continue to be so in many parts of the world. For instance, women are more exposed to informal employment in more than 90 per cent of sub-Saharan African countries, 89 per cent of countries from Southern Asia and almost 75 per cent of Latin American countries (ILO, 2018c). There are actually more countries (55.5 per cent) in the world where the share of women in informal employment exceeds the share of men in informal employment (ILO, 2018c). Women also tend to earn less than men. The gender wage gap is still an average of 20 per cent throughout the world and the contributing factors to this include lower returns to women’s education, occupational segregation and the gender composition of the workforce (ILO, 2019). The ability to earn less inevitably lowers their contributory capacity to social security systems. Women also suffer from lower lifetime earnings as they take up a higher share of family responsibilities and unpaid work. Women still assume the main responsibility for care tasks within the household, as mentioned above (e.g. care work for family members, household work, care for children, care for the elderly, etc.), which shortens or interrupts their employment records and thus also reduces their contributory capacity to any social security scheme, unless the contributory system accounts for these years. About 75 per cent of all unpaid care work is carried out by women, with 2.5 times more time spent on these care tasks than their male counterparts (ILO, 2016f).
Women also face a higher risk of working in precarious conditions in informal employment, which also affects their ability to contribute to social security systems and limits their scope to acquire pension and other social security entitlements. Unless adequate policies are in place to eliminate these constraints, contributory schemes could benefit more men than women, leading to gender inequalities which are often already in existence in the labour market itself. It has to be noted as well that in many parts of the world women are disproportionately represented among the rural popula-tion, where paid work, even if available, is likely to be relatively poorly paid, informal and insecure, resulting in less contributory coverage and lower entitlements if acquired any at all (ILO, 2017b). Moreover, some countries are still applying differentiated retirement age requirements that can further lead to discrimination against women as they result in lower levels of accrued pension right entitlements. Globally 65 per cent of people above retirement age living without a regular pension are women (ILO, 2016f).
A comprehensive set of measures is required to remedy this situation. For example, maternity benefits were enacted in many countries since the early 20th century. They can be provided through a variety of schemes, including contributory (e.g. social insurance schemes), non-contributory (e.g. universal, tax-financed schemes), employer’s liability schemes, where the contribution is solely paid by the employer, or a combination of these methods. In order to ensure a fairer distribution of the costs and responsibility of reproduction, maternity schemes should be developed on the principles of
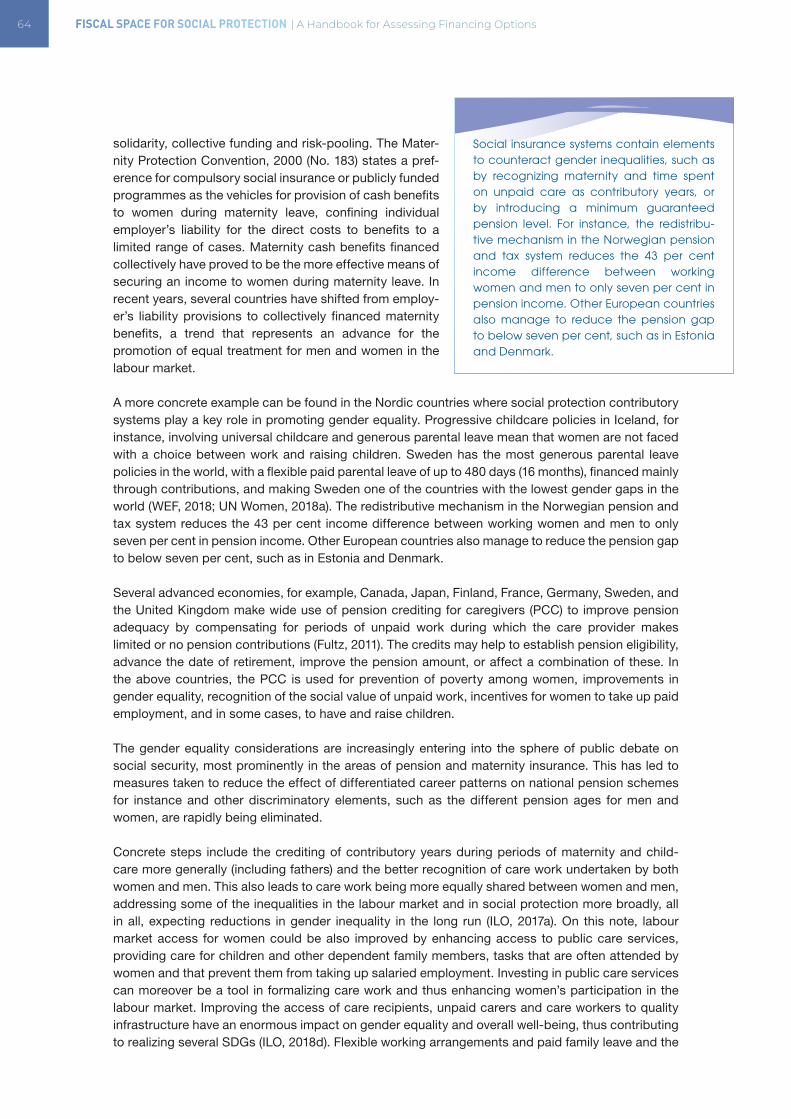
64 FISCAL SPACE FOR SOCIAL PROTECTION | A Handbook for Assessing Financing Options
solidarity, collective funding and risk-pooling. The Mater-nity Protection Convention, 2000 (No. 183) states a pref-erence for compulsory social insurance or publicly funded programmes as the vehicles for provision of cash benefits to women during maternity leave, confining individual employer’s liability for the direct costs to benefits to a limited range of cases. Maternity cash benefits financed collectively have proved to be the more effective means of securing an income to women during maternity leave. In recent years, several countries have shifted from employ-er’s liability provisions to collectively financed maternity benefits, a trend that represents an advance for the promotion of equal treatment for men and women in the labour market.
A more concrete example can be found in the Nordic countries where social protection contributory systems play a key role in promoting gender equality. Progressive childcare policies in Iceland, for instance, involving universal childcare and generous parental leave mean that women are not faced with a choice between work and raising children. Sweden has the most generous parental leave policies in the world, with a flexible paid parental leave of up to 480 days (16 months), financed mainly through contributions, and making Sweden one of the countries with the lowest gender gaps in the world (WEF, 2018; UN Women, 2018a). The redistributive mechanism in the Norwegian pension and tax system reduces the 43 per cent income difference between working women and men to only seven per cent in pension income. Other European countries also manage to reduce the pension gap to below seven per cent, such as in Estonia and Denmark.
Several advanced economies, for example, Canada, Japan, Finland, France, Germany, Sweden, and the United Kingdom make wide use of pension crediting for caregivers (PCC) to improve pension adequacy by compensating for periods of unpaid work during which the care provider makes limited or no pension contributions (Fultz, 2011). The credits may help to establish pension eligibility, advance the date of retirement, improve the pension amount, or affect a combination of these. In the above countries, the PCC is used for prevention of poverty among women, improvements in gender equality, recognition of the social value of unpaid work, incentives for women to take up paid employment, and in some cases, to have and raise children.
The gender equality considerations are increasingly entering into the sphere of public debate on social security, most prominently in the areas of pension and maternity insurance. This has led to measures taken to reduce the effect of differentiated career patterns on national pension schemes for instance and other discriminatory elements, such as the different pension ages for men and women, are rapidly being eliminated.
Concrete steps include the crediting of contributory years during periods of maternity and child-care more generally (including fathers) and the better recognition of care work undertaken by both women and men. This also leads to care work being more equally shared between women and men, addressing some of the inequalities in the labour market and in social protection more broadly, all in all, expecting reductions in gender inequality in the long run (ILO, 2017a). On this note, labour market access for women could be also improved by enhancing access to public care services, providing care for children and other dependent family members, tasks that are often attended by women and that prevent them from taking up salaried employment. Investing in public care services can moreover be a tool in formalizing care work and thus enhancing women’s participation in the labour market. Improving the access of care recipients, unpaid carers and care workers to quality infrastructure have an enormous impact on gender equality and overall well-being, thus contributing to realizing several SDGs (ILO, 2018d). Flexible working arrangements and paid family leave and the
Social insurance systems contain elements to counteract gender inequalities, such as by recognizing maternity and time spent on unpaid care as contributory years, or by introducing a minimum guaranteed pension level. For instance, the redistribu-tive mechanism in the Norwegian pension and tax system reduces the 43 per cent income difference between working women and men to only seven per cent in pension income. Other European countries also manage to reduce the pension gap to below seven per cent, such as in Estonia and Denmark.
CHAPTER 4 | SOCIAL SECURITY CONTRIBUTIONS 65
possibility of women and men to take leave to care for children or dependent family members, with the guarantee of returning to the same job afterwards, have proven to be very effective to prevent women from leaving the labour market altogether and thus enhancing their capacity to acquire higher levels of contributory benefits (ILO, 2016f).
Adopting and enforcing equal pay legislation, following the guidance of ILO Convention 100, is another measure to enhance women’s capacities to acquire pension and other social security rights equal to their male counterparts and would also support the closing of the overall gender gap. Other policies, such as increasing pay transparency, the reduction of vertical and horizontal sectoral occupational segregation, implementation of strong anti-discrimination legislation, ensuring minimum living wages and promoting collective bargaining, can further contribute to closing the gender pay gap.
Coverage gaps in social security contribution among women involved in informal work should be addressed by Governments supporting the transition to the formal economy, in line with the ILO Recommendation 204. This can be for instance achieved by creating sustainable decent jobs in the formal sector, specifically focusing on sectors affecting women and providing them with incentives for the transition from informal to formal work, simplifying procedures for registering businesses, enforcing labour laws and improving access to finance for small businesses (ILO, 2016g).
4.5 CREATING FISCAL SPACE THROUGH SOCIAL CONTRIBUTIONS IN PRACTICE
There are three main steps that, combined, can create fiscal space for social protection by using social contributions.
(i) Extending legal coverage of social security schemes, through the extension of current schemes to new population groups and the creation of social security contributory programmes (e. g. new social insurance programmes in Africa and Asia).
(ii) Extending effective coverage, which increases the contributions’ collection base. This is closely linked to the implementation of formalization policies in the areas of taxation, employment, and enterprise development.
(iii) Adjusting social security contribution rates.
Each of these strategies is addressed in the following subsections of this chapter.
4.5.1 Extending legal coverage: developing comprehensive social protection systems
Legal coverage may refer to the degree to which social protection programmes, covering each of the contingencies recognized in social security, is incorporated into legislation; it also comprises the scope of coverage of social security programmes, in terms of categories of population that are entitled to protection and benefits.
It is important to note that the concept of legal coverage also applies to non-contributory programmes. For example, in the Plurinational State of Bolivia, the Law 3791 of 2007 establishes that the universal non-contributory pension called Renta Dignidad is a right of each citizen, which is acquired automat-ically upon reaching the prescribed retirement age.
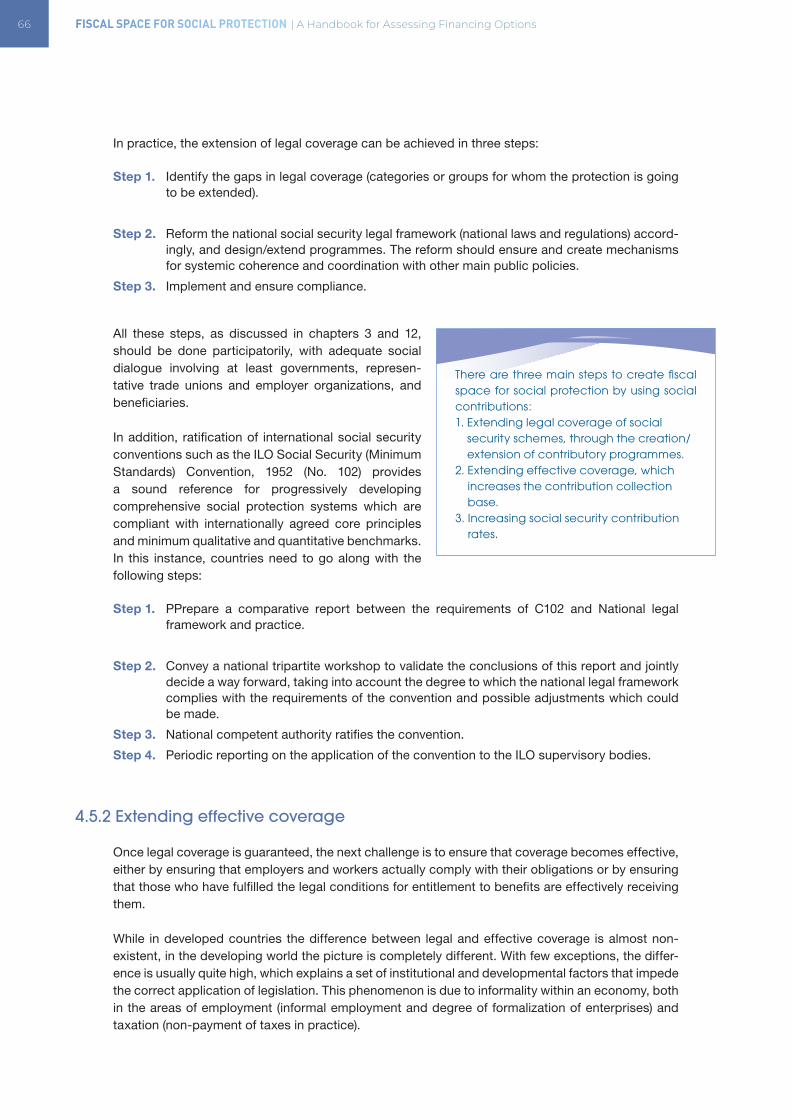
66 FISCAL SPACE FOR SOCIAL PROTECTION | A Handbook for Assessing Financing Options
In practice, the extension of legal coverage can be achieved in three steps:
Step 1. Identify the gaps in legal coverage (categories or groups for whom the protection is going to be extended).
Step 2. Reform the national social security legal framework (national laws and regulations) accord-ingly, and design/extend programmes. The reform should ensure and create mechanisms for systemic coherence and coordination with other main public policies.
Step 3. Implement and ensure compliance.
All these steps, as discussed in chapters 3 and 12, should be done participatorily, with adequate social dialogue involving at least governments, represen-tative trade unions and employer organizations, and beneficiaries.
In addition, ratification of international social security conventions such as the ILO Social Security (Minimum Standards) Convention, 1952 (No. 102) provides a sound reference for progressively developing comprehensive social protection systems which are compliant with internationally agreed core principles and minimum qualitative and quantitative benchmarks. In this instance, countries need to go along with the following steps:
Step 1. PPrepare a comparative report between the requirements of C102 and National legal framework and practice.
Step 2. Convey a national tripartite workshop to validate the conclusions of this report and jointly decide a way forward, taking into account the degree to which the national legal framework complies with the requirements of the convention and possible adjustments which could be made.
Step 3. National competent authority ratifies the convention.
Step 4. Periodic reporting on the application of the convention to the ILO supervisory bodies.
4.5.2 Extending effective coverage
Once legal coverage is guaranteed, the next challenge is to ensure that coverage becomes effective, either by ensuring that employers and workers actually comply with their obligations or by ensuring that those who have fulfilled the legal conditions for entitlement to benefits are effectively receiving them.
While in developed countries the difference between legal and effective coverage is almost non- existent, in the developing world the picture is completely different. With few exceptions, the differ-ence is usually quite high, which explains a set of institutional and developmental factors that impede the correct application of legislation. This phenomenon is due to informality within an economy, both in the areas of employment (informal employment and degree of formalization of enterprises) and taxation (non-payment of taxes in practice).
There are three main steps to create fiscal space for social protection by using social contributions: 1. Extending legal coverage of social
security schemes, through the creation/extension of contributory programmes.
2. Extending effective coverage, which increases the contribution collection base.
3. Increasing social security contribution rates.
CHAPTER 4 | SOCIAL SECURITY CONTRIBUTIONS 67
In practice, an extension of effective coverage can be achieved through the following four steps, also to be developed in a participatory manner with adequate social dialogue:
Step 1. Identify social protection gaps and the causes of informality, and generate the necessary metrics to know the magnitude and later monitor progress.
Step 2. Design specific policies and programmes to cover those without social security and tackle the causes of informality, both in terms of social security and in coordination with other public policies (employment, taxation, productive development).
Step 3. Implement specific social security extension programmes and formalization policies for the specific population groups to be covered.
Step 4. Monitor results and make appropriate adjustments over time.
4.5.3 Extending coverage. Overcoming challenges: Regional and country experiences
The main barriers to extending social security coverage are related to a number of factors including legal exclusion and failure to make coverage effective, as discussed above. Other factors include: limited contributory capacity for participating in social security systems; lack of incentives for contri-butions, for example, non-compliant employers and employees may avoid paying contributions if enforcement measures are perceived as weak and/or if the economic gain of non-compliance is perceived to outweigh the financial cost and potential damage to reputations, be it through imposed penalties or sanctions; the complexity or inadequacy of administrative procedures for enrolment and collection of contributions, or for receiving the benefits;; a lack of efficient IT system in place, which is necessary to alleviate problems of under-reporting of earnings, evasion and fraud; lack of public information on rights and responsibilities; and low level of organization among workers; among others.
There is no single best way to combat these problems; however, there is a broad consensus that in general the centralization of contribution collection methods brings economies of scale and helps to coordinate audit and record-keeping activities. This favours a unified system for collecting social security contributions over decentralized or fragmented systems. Centralizing the collection process in a single institution has been successfully implemented mainly in developed countries such as Ireland, Sweden, and the United Kingdom, as well as in developing countries, including Costa Rica and Uruguay (ISSA, 2011).
To this end, the State should create a legal and institutional framework with a clear definition of competencies and responsibilities and provide the institution in charge of collecting the contribu-tion with political, administrative, and financial autonomy, institutional capacity and coercive power. Below is a list of selected steps that can be taken in order to improve the expansion of effective coverage.
Step 1. Ensure inclusion of participants through legal and effective coverage (as discussed above).
Step 2. Make the system sustainable, equitable/adequate and affordable14 i.e. within the finan-cial reach of workers and their employers. A fine balance needs to be established to ensure that benefits are equitable and adequate for a life in dignity, the system is sustainable over time and contributions are affordable to workers and employers. The state has a key role to play to overcome the complex barriers associated with affordability. It can either subsidize the financing of social security or establish a minimum wage high enough to guarantee a minimum contributory capacity.
14 A guidance is provided in section 4.5.4 Adjusting social security contribution rates in this handbook.
68 FISCAL SPACE FOR SOCIAL PROTECTION | A Handbook for Assessing Financing Options
Step 3. Ensure that the administrative procedures that workers and their employers are required to carry out are as simple as possible. The parties involved should be adequately informed on their rights and responsibilities and how to exercise them. Guaranteeing the ease of procedures for enrolment and payment of contributions is crucial.
Step 4. Guarantee compliance, through the implementation of adequate systems of contributory control, labour inspection and social security inspection.
Step 5. Make the social security system attractive so that it can attract the largest number of potential participants possible, both employers and workers.
In respect of compliance (step 4), the following measures can be taken to improve the condition:
• Establishing a unique identification code or number for taxes and social security contributions for companies and workers.
• To simplify compliances and reduce costs for employers, establishing a one-stop-shop and a unified registration and payment process for the entry of data on both taxes and social security.
• Promoting intensive use of information technology by replacing “paper” documents with elec-tronic documents; making information available through the use of call centres and information portals; and allowing online access to certain types of services.
• Integrate labour and social security inspection and make labour inspectors check compliance of enterprises paying social security contributions – this policy proved extremely successful to reduce informality in China and some OECD countries.
• For unpaid social security contributions, segment debt collection according to the importance and complexity of the sectors, based on criteria such as total income and the total number of employees of the establishment, risks associated with the economic activity and the amount and age of the debt with social security institutions.
• Implementing systems to measure the risk and patterns of evasion by means of statistical models that will enable to quantify the effect of evasion on fiscal obligations. The system will make it possible to rank and classify patterns of evasion and implement selective auditing system.
• Establishing withholding social security contributions at source in subcontracted sectors including construction, security and surveillance, and cleaning services, etc.
• In case of procurement/contracts with the government, requesting certificates of fiscal compli-ance and social security obligations as an indispensable condition prior to the approval of work.
• Sending regular information to the workers so that they too can exercise control over their employers, applying economic incentives for workers’ complaints.
• Extending the compulsory affiliation to self-employed workers, applying specific collection mechanisms that take into account the irregularity of income and other practical barriers.
Individual countries have used a variety of innovative approaches to improve collection and compli-ance (see Box 4.1), although a lot will depend on the characteristics of the economy and the quality of its institutions.
It is possible to estimate contributory evasion from social security contributions. This will further provide an estimation of additional fiscal space that can be created by stopping evasion. Evasion is an extremely complex phenomenon. There are two basic forms of evasion: (i) when an employer does not register and report an employee on the social security payroll, and (ii) when the salary reported by the employer is lower than the salary for which it is legally required to contribute. The following steps explain how evasion of contributions can be calculated in a simple way.
Step 1. Calculate the salary mass which is average salary multiplied by the number of employed people obliged to contribute. The data on average salary and employment can be obtained from the ILO and national database.
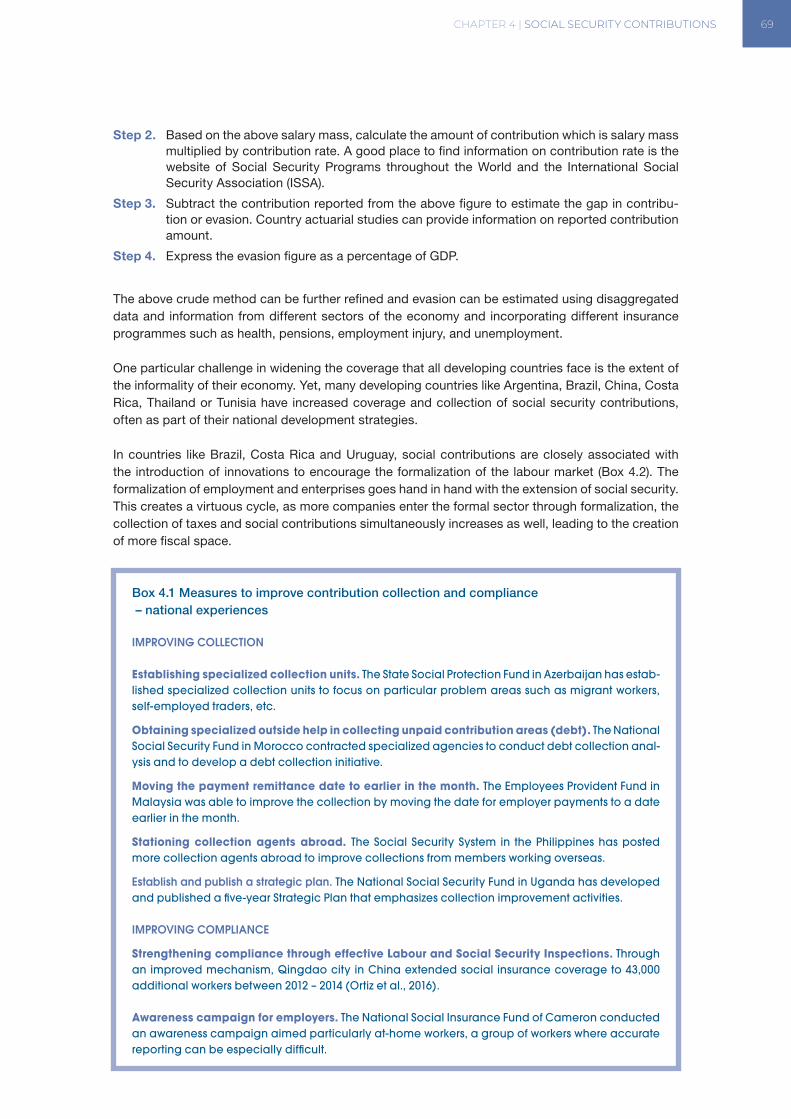
CHAPTER 4 | SOCIAL SECURITY CONTRIBUTIONS 69
Step 2. Based on the above salary mass, calculate the amount of contribution which is salary mass multiplied by contribution rate. A good place to find information on contribution rate is the website of Social Security Programs throughout the World and the International Social Security Association (ISSA).
Step 3. Subtract the contribution reported from the above figure to estimate the gap in contribu-tion or evasion. Country actuarial studies can provide information on reported contribution amount.
Step 4. Express the evasion figure as a percentage of GDP.
The above crude method can be further refined and evasion can be estimated using disaggregated data and information from different sectors of the economy and incorporating different insurance programmes such as health, pensions, employment injury, and unemployment.
One particular challenge in widening the coverage that all developing countries face is the extent of the informality of their economy. Yet, many developing countries like Argentina, Brazil, China, Costa Rica, Thailand or Tunisia have increased coverage and collection of social security contributions, often as part of their national development strategies.
In countries like Brazil, Costa Rica and Uruguay, social contributions are closely associated with the introduction of innovations to encourage the formalization of the labour market (Box 4.2). The formalization of employment and enterprises goes hand in hand with the extension of social security. This creates a virtuous cycle, as more companies enter the formal sector through formalization, the collection of taxes and social contributions simultaneously increases as well, leading to the creation of more fiscal space.
Box 4.1 Measures to improve contribution collection and compliance – national experiences
IMPROVING COLLECTION
Establishing specialized collection units. The State Social Protection Fund in Azerbaijan has estab-lished specialized collection units to focus on particular problem areas such as migrant workers, self-employed traders, etc.
Obtaining specialized outside help in collecting unpaid contribution areas (debt). The National Social Security Fund in Morocco contracted specialized agencies to conduct debt collection anal-ysis and to develop a debt collection initiative.
Moving the payment remittance date to earlier in the month. The Employees Provident Fund in Malaysia was able to improve the collection by moving the date for employer payments to a date earlier in the month.
Stationing collection agents abroad. The Social Security System in the Philippines has posted more collection agents abroad to improve collections from members working overseas.
Establish and publish a strategic plan. The National Social Security Fund in Uganda has developed and published a five-year Strategic Plan that emphasizes collection improvement activities.
IMPROVING COMPLIANCE
Strengthening compliance through effective Labour and Social Security Inspections. Through an improved mechanism, Qingdao city in China extended social insurance coverage to 43,000 additional workers between 2012 – 2014 (Ortiz et al., 2016).
Awareness campaign for employers. The National Social Insurance Fund of Cameron conducted an awareness campaign aimed particularly at-home workers, a group of workers where accurate reporting can be especially difficult.
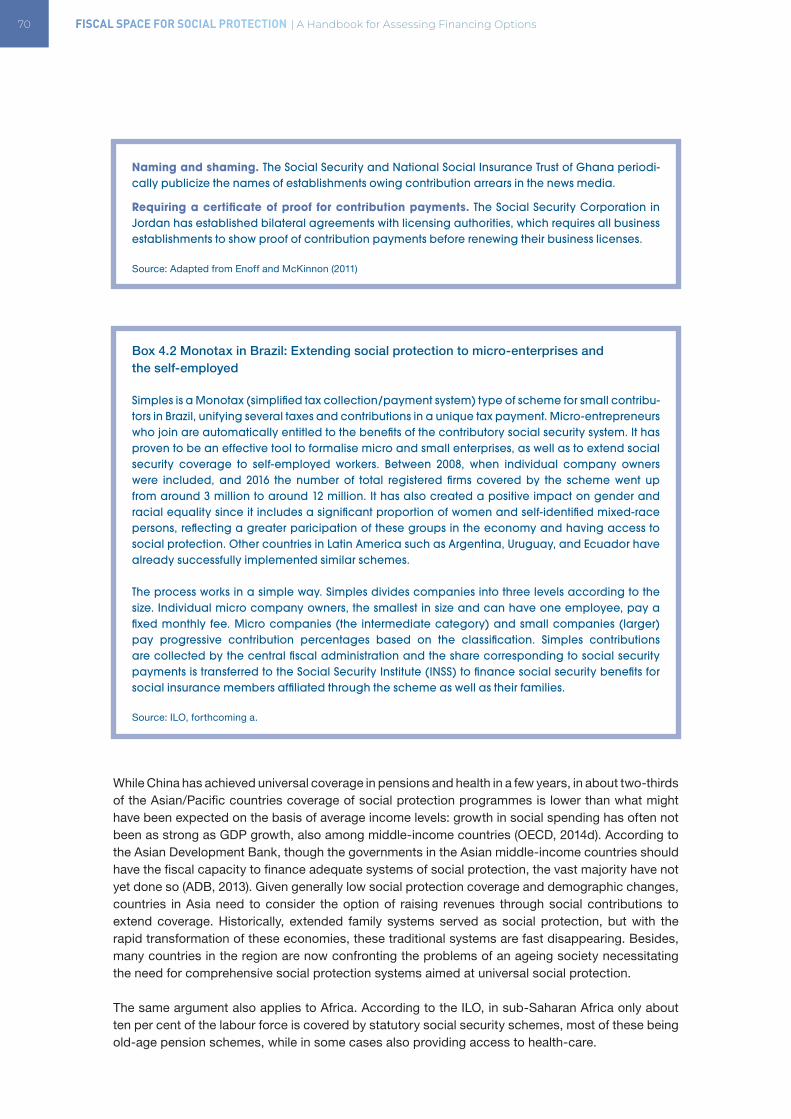
70 FISCAL SPACE FOR SOCIAL PROTECTION | A Handbook for Assessing Financing Options
Naming and shaming. The Social Security and National Social Insurance Trust of Ghana periodi-cally publicize the names of establishments owing contribution arrears in the news media.
Requiring a certificate of proof for contribution payments. The Social Security Corporation in Jordan has established bilateral agreements with licensing authorities, which requires all business establishments to show proof of contribution payments before renewing their business licenses.
Source: Adapted from Enoff and McKinnon (2011)
Box 4.2 Monotax in Brazil: Extending social protection to micro-enterprises and the self-employed
Simples is a Monotax (simplified tax collection/payment system) type of scheme for small contribu-tors in Brazil, unifying several taxes and contributions in a unique tax payment. Micro-entrepreneurs who join are automatically entitled to the benefits of the contributory social security system. It has proven to be an effective tool to formalise micro and small enterprises, as well as to extend social security coverage to self-employed workers. Between 2008, when individual company owners were included, and 2016 the number of total registered firms covered by the scheme went up from around 3 million to around 12 million. It has also created a positive impact on gender and racial equality since it includes a significant proportion of women and self-identified mixed-race persons, reflecting a greater paricipation of these groups in the economy and having access to social protection. Other countries in Latin America such as Argentina, Uruguay, and Ecuador have already successfully implemented similar schemes.
The process works in a simple way. Simples divides companies into three levels according to the size. Individual micro company owners, the smallest in size and can have one employee, pay a fixed monthly fee. Micro companies (the intermediate category) and small companies (larger) pay progressive contribution percentages based on the classification. Simples contributions are collected by the central fiscal administration and the share corresponding to social security payments is transferred to the Social Security Institute (INSS) to finance social security benefits for social insurance members affiliated through the scheme as well as their families.
Source: ILO, forthcoming a.
While China has achieved universal coverage in pensions and health in a few years, in about two-thirds of the Asian/Pacific countries coverage of social protection programmes is lower than what might have been expected on the basis of average income levels: growth in social spending has often not been as strong as GDP growth, also among middle-income countries (OECD, 2014d). According to the Asian Development Bank, though the governments in the Asian middle-income countries should have the fiscal capacity to finance adequate systems of social protection, the vast majority have not yet done so (ADB, 2013). Given generally low social protection coverage and demographic changes, countries in Asia need to consider the option of raising revenues through social contributions to extend coverage. Historically, extended family systems served as social protection, but with the rapid transformation of these economies, these traditional systems are fast disappearing. Besides, many countries in the region are now confronting the problems of an ageing society necessitating the need for comprehensive social protection systems aimed at universal social protection. The same argument also applies to Africa. According to the ILO, in sub-Saharan Africa only about ten per cent of the labour force is covered by statutory social security schemes, most of these being old-age pension schemes, while in some cases also providing access to health-care.
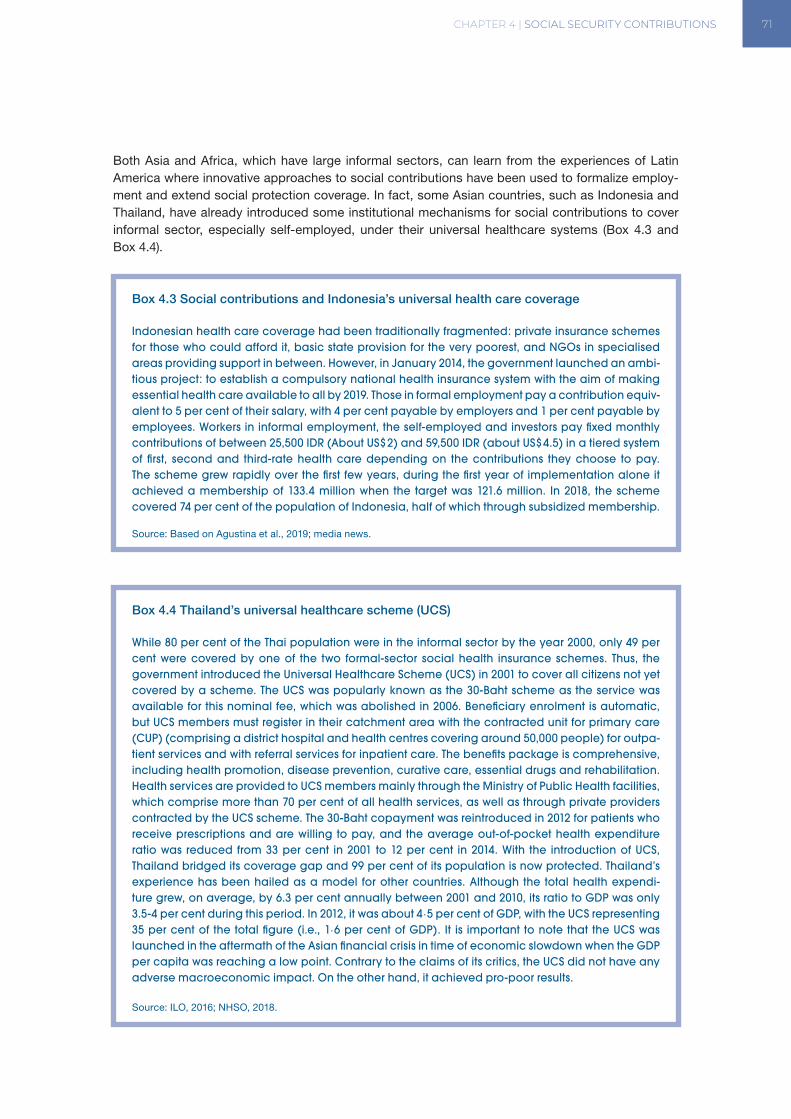
CHAPTER 4 | SOCIAL SECURITY CONTRIBUTIONS 71
Both Asia and Africa, which have large informal sectors, can learn from the experiences of Latin America where innovative approaches to social contributions have been used to formalize employ-ment and extend social protection coverage. In fact, some Asian countries, such as Indonesia and Thailand, have already introduced some institutional mechanisms for social contributions to cover informal sector, especially self-employed, under their universal healthcare systems (Box 4.3 and Box 4.4).
Box 4.3 Social contributions and Indonesia’s universal health care coverage
Indonesian health care coverage had been traditionally fragmented: private insurance schemes for those who could afford it, basic state provision for the very poorest, and NGOs in specialised areas providing support in between. However, in January 2014, the government launched an ambi-tious project: to establish a compulsory national health insurance system with the aim of making essential health care available to all by 2019. Those in formal employment pay a contribution equiv-alent to 5 per cent of their salary, with 4 per cent payable by employers and 1 per cent payable by employees. Workers in informal employment, the self-employed and investors pay fixed monthly contributions of between 25,500 IDR (About US$ 2) and 59,500 IDR (about US$ 4.5) in a tiered system of first, second and third-rate health care depending on the contributions they choose to pay. The scheme grew rapidly over the first few years, during the first year of implementation alone it achieved a membership of 133.4 million when the target was 121.6 million. In 2018, the scheme covered 74 per cent of the population of Indonesia, half of which through subsidized membership.
Source: Based on Agustina et al., 2019; media news.
Box 4.4 Thailand’s universal healthcare scheme (UCS)
While 80 per cent of the Thai population were in the informal sector by the year 2000, only 49 per cent were covered by one of the two formal-sector social health insurance schemes. Thus, the government introduced the Universal Healthcare Scheme (UCS) in 2001 to cover all citizens not yet covered by a scheme. The UCS was popularly known as the 30-Baht scheme as the service was available for this nominal fee, which was abolished in 2006. Beneficiary enrolment is automatic, but UCS members must register in their catchment area with the contracted unit for primary care (CUP) (comprising a district hospital and health centres covering around 50,000 people) for outpa-tient services and with referral services for inpatient care. The benefits package is comprehensive, including health promotion, disease prevention, curative care, essential drugs and rehabilitation. Health services are provided to UCS members mainly through the Ministry of Public Health facilities, which comprise more than 70 per cent of all health services, as well as through private providers contracted by the UCS scheme. The 30-Baht copayment was reintroduced in 2012 for patients who receive prescriptions and are willing to pay, and the average out-of-pocket health expenditure ratio was reduced from 33 per cent in 2001 to 12 per cent in 2014. With the introduction of UCS, Thailand bridged its coverage gap and 99 per cent of its population is now protected. Thailand’s experience has been hailed as a model for other countries. Although the total health expendi-ture grew, on average, by 6.3 per cent annually between 2001 and 2010, its ratio to GDP was only 3.5-4 per cent during this period. In 2012, it was about 4·5 per cent of GDP, with the UCS representing 35 per cent of the total figure (i.e., 1·6 per cent of GDP). It is important to note that the UCS was launched in the aftermath of the Asian financial crisis in time of economic slowdown when the GDP per capita was reaching a low point. Contrary to the claims of its critics, the UCS did not have any adverse macroeconomic impact. On the other hand, it achieved pro-poor results.
Source: ILO, 2016; NHSO, 2018.
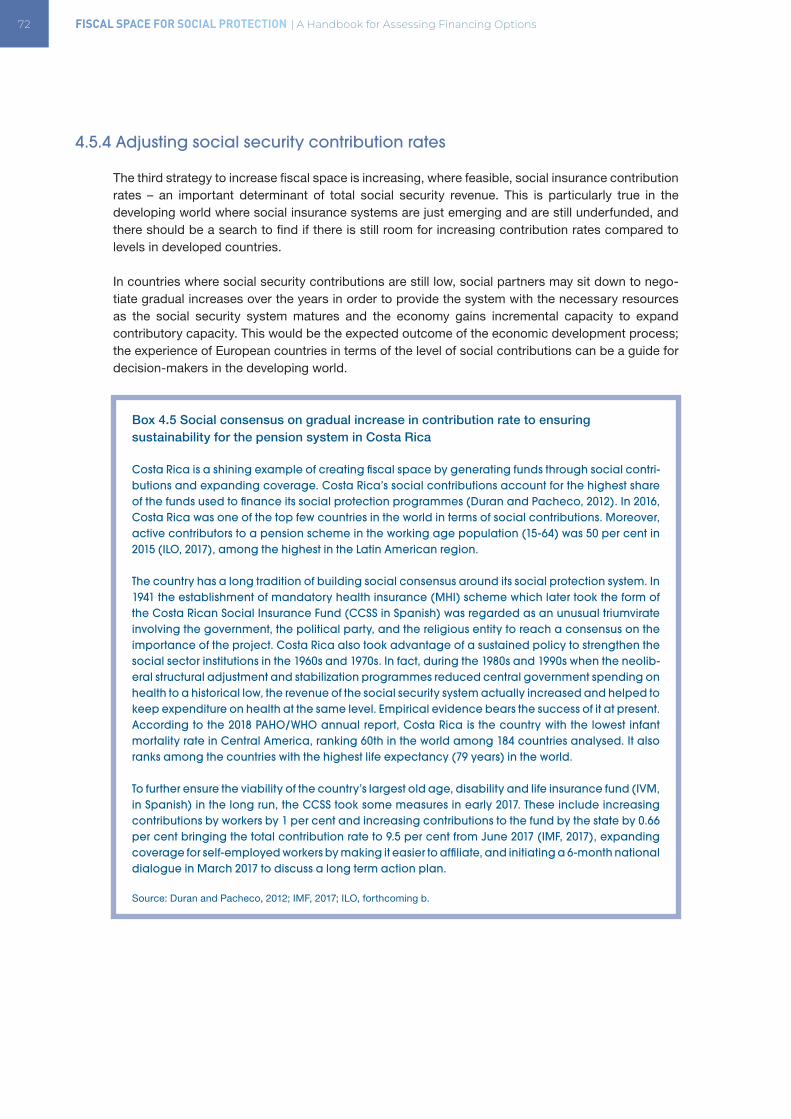
72 FISCAL SPACE FOR SOCIAL PROTECTION | A Handbook for Assessing Financing Options
4.5.4 Adjusting social security contribution rates
The third strategy to increase fiscal space is increasing, where feasible, social insurance contribution rates – an important determinant of total social security revenue. This is particularly true in the developing world where social insurance systems are just emerging and are still underfunded, and there should be a search to find if there is still room for increasing contribution rates compared to levels in developed countries.
In countries where social security contributions are still low, social partners may sit down to nego-tiate gradual increases over the years in order to provide the system with the necessary resources as the social security system matures and the economy gains incremental capacity to expand contributory capacity. This would be the expected outcome of the economic development process; the experience of European countries in terms of the level of social contributions can be a guide for decision-makers in the developing world.
Box 4.5 Social consensus on gradual increase in contribution rate to ensuring sustainability for the pension system in Costa Rica
Costa Rica is a shining example of creating fiscal space by generating funds through social contri-butions and expanding coverage. Costa Rica’s social contributions account for the highest share of the funds used to finance its social protection programmes (Duran and Pacheco, 2012). In 2016, Costa Rica was one of the top few countries in the world in terms of social contributions. Moreover, active contributors to a pension scheme in the working age population (15-64) was 50 per cent in 2015 (ILO, 2017), among the highest in the Latin American region.
The country has a long tradition of building social consensus around its social protection system. In 1941 the establishment of mandatory health insurance (MHI) scheme which later took the form of the Costa Rican Social Insurance Fund (CCSS in Spanish) was regarded as an unusual triumvirate involving the government, the political party, and the religious entity to reach a consensus on the importance of the project. Costa Rica also took advantage of a sustained policy to strengthen the social sector institutions in the 1960s and 1970s. In fact, during the 1980s and 1990s when the neolib-eral structural adjustment and stabilization programmes reduced central government spending on health to a historical low, the revenue of the social security system actually increased and helped to keep expenditure on health at the same level. Empirical evidence bears the success of it at present. According to the 2018 PAHO/WHO annual report, Costa Rica is the country with the lowest infant mortality rate in Central America, ranking 60th in the world among 184 countries analysed. It also ranks among the countries with the highest life expectancy (79 years) in the world.
To further ensure the viability of the country’s largest old age, disability and life insurance fund (IVM, in Spanish) in the long run, the CCSS took some measures in early 2017. These include increasing contributions by workers by 1 per cent and increasing contributions to the fund by the state by 0.66 per cent bringing the total contribution rate to 9.5 per cent from June 2017 (IMF, 2017), expanding coverage for self-employed workers by making it easier to affiliate, and initiating a 6-month national dialogue in March 2017 to discuss a long term action plan.
Source: Duran and Pacheco, 2012; IMF, 2017; ILO, forthcoming b.
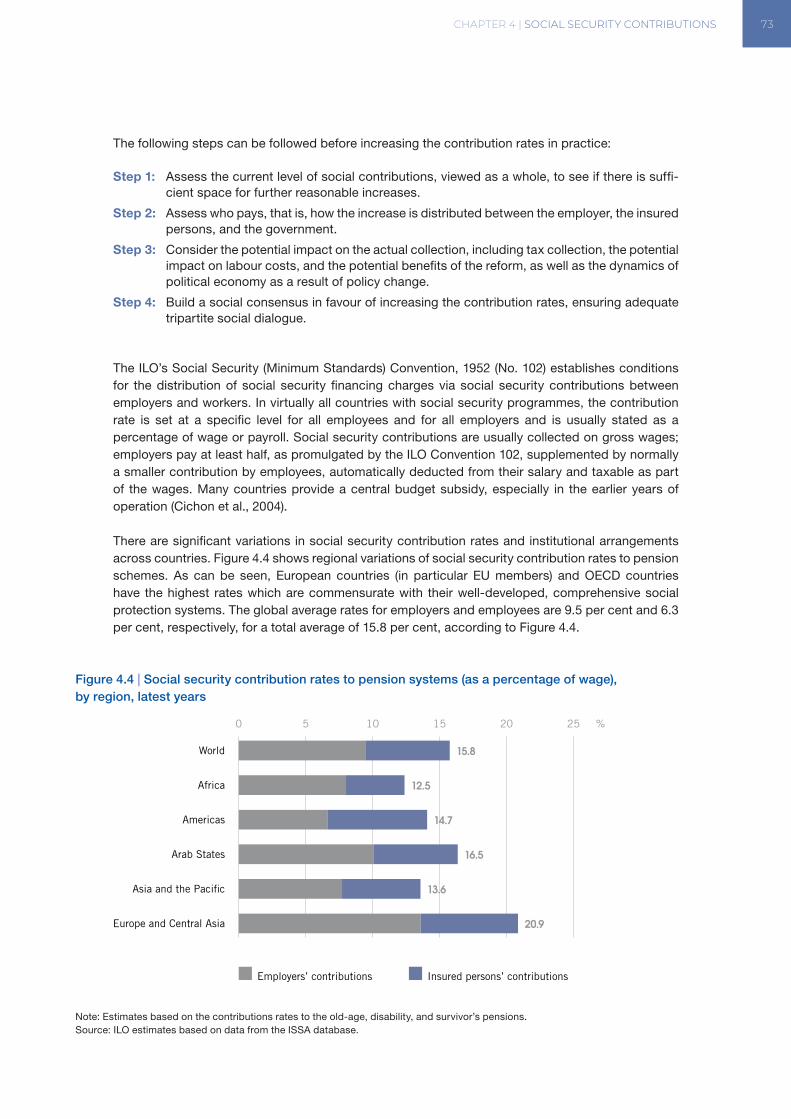
CHAPTER 4 | SOCIAL SECURITY CONTRIBUTIONS 73
The following steps can be followed before increasing the contribution rates in practice:
Step 1: Assess the current level of social contributions, viewed as a whole, to see if there is suffi-cient space for further reasonable increases.
Step 2: Assess who pays, that is, how the increase is distributed between the employer, the insured persons, and the government.
Step 3: Consider the potential impact on the actual collection, including tax collection, the potential impact on labour costs, and the potential benefits of the reform, as well as the dynamics of political economy as a result of policy change.
Step 4: Build a social consensus in favour of increasing the contribution rates, ensuring adequate tripartite social dialogue.
The ILO’s Social Security (Minimum Standards) Convention, 1952 (No. 102) establishes conditions for the distribution of social security financing charges via social security contributions between employers and workers. In virtually all countries with social security programmes, the contribution rate is set at a specific level for all employees and for all employers and is usually stated as a percentage of wage or payroll. Social security contributions are usually collected on gross wages; employers pay at least half, as promulgated by the ILO Convention 102, supplemented by normally a smaller contribution by employees, automatically deducted from their salary and taxable as part of the wages. Many countries provide a central budget subsidy, especially in the earlier years of operation (Cichon et al., 2004).
There are significant variations in social security contribution rates and institutional arrangements across countries. Figure 4.4 shows regional variations of social security contribution rates to pension schemes. As can be seen, European countries (in particular EU members) and OECD countries have the highest rates which are commensurate with their well-developed, comprehensive social protection systems. The global average rates for employers and employees are 9.5 per cent and 6.3 per cent, respectively, for a total average of 15.8 per cent, according to Figure 4.4.
Figure 4.4 | Social security contribution rates to pension systems (as a percentage of wage), by region, latest years
Note: Estimates based on the contributions rates to the old-age, disability, and survivor’s pensions.Source: ILO estimates based on data from the ISSA database.
0 5 10 15 20 25 %
World 15.8
Africa 12.5
Americas 14.7
Arab States 16.5
Asia and the Paci�c 13.6
Europe and Central Asia 20.9
Employers’ contributions Insured persons’ contributions
74 FISCAL SPACE FOR SOCIAL PROTECTION | A Handbook for Assessing Financing Options
Both Asia and Africa have low social security contribution rates, which may reflect their desire to keep overall tax rates down to attract investment, in particular, foreign direct investment (FDI). However, as highlighted in chapter 5, tax concessions are not found to be the most important determinant of FDI. On the other hand, the positive productivity and social stability impact of a comprehensive universal social protection system (as illustrated in chapter 1) may, in fact, be more encouraging for investment. However, in setting the social security contribution rates, policymakers need to keep in mind that it does add to the labour cost, and too rapid increase in the rate may adversely affect the economy as the experience of Singapore in the mid-1980s shows.15 A balance has to be found to keep the rate in line with productivity growth.
Box 4.6 Social contributions in Europe and OECD countries
Most western European and OECD countries are pioneers of comprehensive and universal social protection systems. They built their social protection system through a combination of general taxation and social security contribution revenues. Thus, it is worthwhile to look at some salient features of their social contributions for the sake of lessons for others. In the OECD countries, social security contributions comprise about 10-15 percent of GDP as opposed to a global average of 2.5 percent of GDP. This reflects highly formalized nature of these economies. Contributions are deductible from the personal income tax base in 20 OECD countries and may be claimed as a tax credit in 2 countries, thus reducing marginal personal income tax rates in most OECD countries. In the European Union (EU-28) employers’ social contributions comprised 35.3 percent of total social protection receipts, while around one fifth of social protection receipts were social contributions paid by workers. Actual or imputed employers’ social contributions accounted for two thirds or more of all social contributions in Belgium, the Czech Republic, Estonia, Spain, France, Italy, Latvia, Lithuania, Poland, Romania and Slovakia.
4.6 CONCLUDING REMARKS
Employer and employee social security contributions are predictable sources of revenue. Social security contributions do represent an important source of fiscal space that countries must monitor and enhance. The size of social security contributions will depend on the nature of the economy (i.e., the extent of informality), contribution rates, the coverage of social insurance among the active contributors and its effective extension and compliance. Of particular challenge is the coverage of the people who are not engaged in the formal sector. Many countries, especially middle-income ones, have extended coverage by requiring informal sector activities to register through incentives. Others have introduced mandatory contributory social insurance schemes for the self-employed and informal sector workers. Yet some others have universalized coverage for all citizens by using the general government revenues in the spirit of social solidarity, combining contributory and non-contributory schemes.
Social security contributions are linked to legal entitlements and should be considered a deferred wage and a social and economic investment rather than a simple labour cost item as indicated by the term “tax”. Social security contributions can be clearly linked to a variety of positive social
15 In an attempt to restructure its economy towards more high value added activities, the Singapore government in the early 1980s increased the compulsory provident fund contribution rate for the employers rapidly to 25per cent of gross salary of employees. The objective was to raise labour cost so that low skilled, low productivity activities become unprofitable and hence phase out. However, the economy could not adjust rapidly enough resulting in severe growth slowdown by mid-1980s. The government acted quickly to adjust the rate down and keeping with productivity growth.
CHAPTER 4 | SOCIAL SECURITY CONTRIBUTIONS 75
and economic implications. Social security enhances social cohesion and stability, individual secu-rity, supports human capital investments and workforce productivity while acting as an automatic stabilizer by smoothing consumption and aggregate demand. A well-designed social protection contributory system can enhance economic growth in the long run and support inclusive develop-ment. Social security contributions are directly linked to legal entitlements that protect individuals from their short-sightedness (e.g. pension protects from old age poverty) and support social equity through redistribution, essentially reducing inequality, which in itself is harmful to sustainable growth.
4.7 KEY DOCUMENTS AND DATA SOURCES
Social Security Administration (US) and International Social Security Association (various issues). Social Security Programs Throughout the World.
This publication highlights the principal features of social security programs in more than 170 coun-tries. Published in four regional volumes and issued every six months. The information contained in these volumes is crucial to the efforts of researchers to review different ways of approaching social security challenges that will enable countries to adapt their social security systems to the evolving needs of individuals, households, and families. These efforts are particularly important as each nation faces major demographic changes, especially the increasing number of aged persons, as well as economic and fiscal issues.
Enoff, L.; McKinnon, R. 2011. “Social Security Contribution Collection and Compliance: Improving Governance to Extend Social Protection”, in International Social Security Review, Vol. 64, No. 4, pp. 99-119.
Using survey evidence collected from social security organizations and contribution collection agencies, a major aim of this article is to advance knowledge sharing and good practice on contribu-tion collection and the enforcement of compliance. The evidence suggests that seven core factors combine often to form the basis of success in contribution collection and compliance. In addition to improving benefit adequacy and the financial health and public standing of programmes, such success may support also national and international efforts to extend social protection coverage.
Duran-Valverde, F.; Aguilar, J. F.; Vindas, J. F. O.; Corea, D. M.; de Lima Vieira, A. C. 2013. Innova-tions in extending social insurance coverage to independent workers: Experiences from Brazil, Cape Verde, Colombia, Costa Rica, Ecuador, Philippines, France and Uruguay, Extension of Social Security (ESS) Document No. 42 (Geneva, ILO).
The study summarizes the different mechanisms used by selected countries to increase the coverage of self-employed workers. The analysis comprehensively maps the experience of each of the countries studied, providing a characterization of their social security systems, the coverage of the self-employed and the reforms and innovations introduced to extend social insurance coverage. The study also provides a systematization of the various types of practices implemented by the countries examined, revealing the importance of establishing concrete coverage targets and incen-tives specifically aimed at reaching the self-employed.
76 FISCAL SPACE FOR SOCIAL PROTECTION | A Handbook for Assessing Financing Options
Data sources
• Social Security Administration (US) and International Social Security Association, Social Security Programs Throughout the World
• ILO, World Social Protection Report
• World Bank, World Development Indicators
• IMF, Government Finance Statistics,
• IMF, World Revenue Longitudinal Data (WoRLD)
• Eurostat, Social protection statistics
• OECD, Social security contributions.
Learning achievements
After reading this chapter, readers should have:
• An appreciation of the importance of social contributions for social protection and how it acts as a tool for creating fiscal space
• A good understanding of salient features of social contributions in various regions and countries
• Gained knowledge of how some middle-income countries have expanded social protection coverage, especially for the informal sector and self-employed.
• Understood how the contributory systems can promote gender equality
• Good familiarity with key documents and data sources
CHAPTER 5 | TAXATION 77
CHAPTER 5. TAXATION
LEARNING OBJECTIVES
• Know key facts about taxation, including the main types as well as innovative taxes
• Understand the challenges and scope for expanding taxation revenues in developing countries
• Know various issues related to taxation reforms, such as efficiency, fairness, feasibility, and administrative cost
• Learn about gender equality and taxation
• Know about key resources and data sources
CONTENTS
• Typical features of taxation
• Scope for expanding various taxation revenues
• Tax reforms
• Key documents and data sources
This chapter discusses taxation as a fiscal space option. To begin with, a list of main and commonly used types of taxes, from more progressive to more regressive, is provided below. High income inequality should make governments move away from indirect taxes such as consumption/sales and value added tax (VAT), and enforce progressive taxation such as income and corporate taxes –including taxes on the financial sector that remains widely untaxed – as well as property and inheritance taxes.
• Income taxes
• Corporate taxes, including taxes on the financial sector
• Property and inheritance taxes
• Taxing natural resource extraction
• Innovative taxes: Sin taxes, airport and hotel taxes, arms and carbon taxes
• Tariffs (imports/exports)
• Consumption and value added taxes (VAT), and tolls
78 FISCAL SPACE FOR SOCIAL PROTECTION | A Handbook for Assessing Financing Options
Together they constitute the scope for enhancing tax revenues, discussed in section 5.2. The discus-sion focuses on feasibility and challenges in expanding various types of tax revenues, including the complexities of natural resource rents in developing countries. Reforms of the taxation system are discussed in section 5.3, which lists some common recommendations for tax reforms and issues pertaining to them. The chapter begins by providing the rationale for this fiscal space option, based on the current status taxation in developing countries.
5.1 WHY THIS OPTION?
Taxation is the main source of public finance; total tax revenues account for more than 80 per cent of total government revenue in about half of the countries in the world – and more than 50 per cent in almost every country.
Domestic revenue provides the most stable source of development finance, and there has emerged a consensus about the need to enhance tax efforts. Besides huge finan-cial needs to achieve development goals, especially the Agenda 2030 for SDGs, several factors explain the height-ened focus on taxation. They include declines in foreign aid due to on-going slow global economic recovery and debt crisis in Euro zone countries, fiscal effects of trade liberalization and national ownership of development strategies. Despite considerable progress, developing countries still collect much lower proportions of their GDPs in tax revenue than the OECD countries: 10-20 per cent vis-à-vis 30-40 per cent. Their tax effort indices – revenue collections relative to estimated revenue potentials – are also lower than those of the OECD countries. Experts agree that there is considerable potential to increase tax reve-nues in developing countries. An Oxfam study on 52 developing countries found that by significantly improving the collection of tax, these countries could potentially raise an additional US$ 269 billion dollars (Itriago, 2011). Various structural, institutional, and governance related factors may explain developing countries’ low tax-GDP ratios. Introduction of new taxes and tax rate increases often face political resistance while globalization and privatization reforms have witnessed abolition or reductions in trade-related taxes and pressure to reduce corporate tax rates.
5.1.1 Taxation in developing countries
A snapshot of taxation in countries by income groups is presented in Table 5.1. As can be seen, high-income countries have higher tax-GDP ratio than lower-income countries. However, as will be highlighted later, this apparent association between income levels and tax is not very tight (see Box 5.1). Income taxes play a greater role in developed than in developing countries, where indirect taxes, e.g. VAT and trade taxes account for larger shares in GDP.
High income inequality should make governments move away from indirect taxes such as consumption and value added tax (VAT), and enforce progressive taxation such as income and corporate taxes -including taxes on the financial sector that remains widely untaxed- as well as property and inheritance taxes.
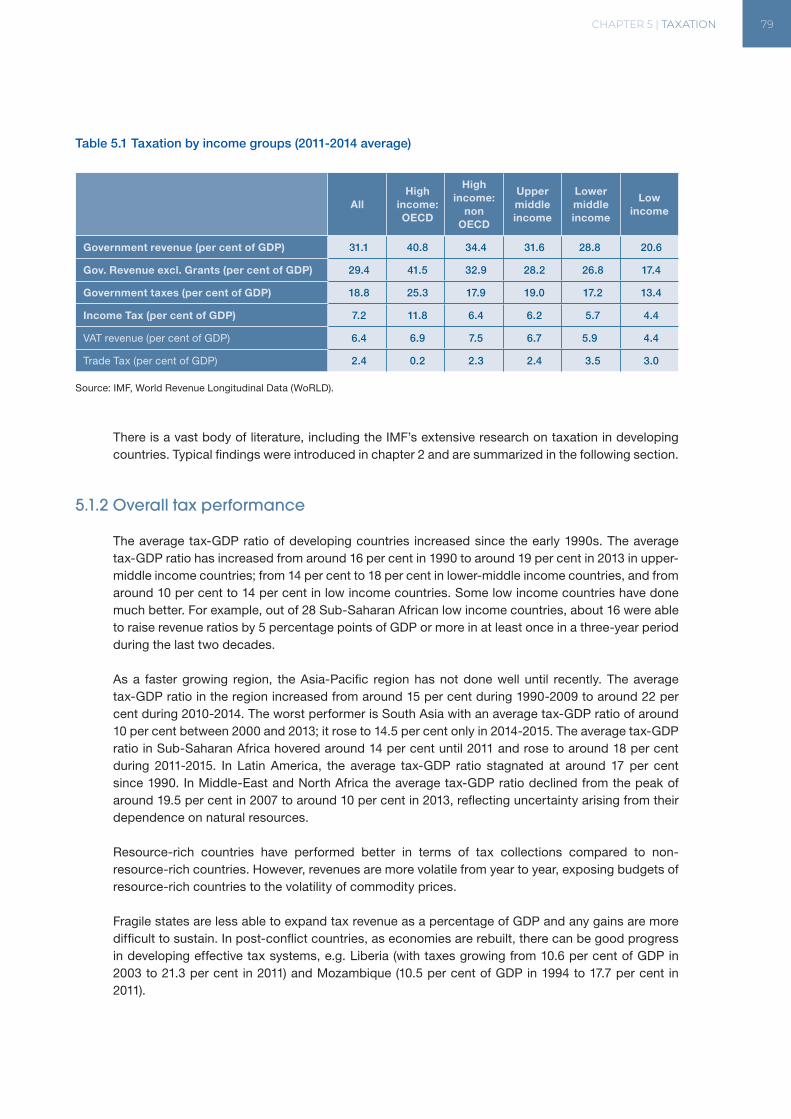
CHAPTER 5 | TAXATION 79
Table 5.1 Taxation by income groups (2011-2014 average)
AllHigh
income: OECD
High income:
non OECD
Upper middle income
Lower middle income
Low income
Government revenue (per cent of GDP) 31.1 40.8 34.4 31.6 28.88 20.6
Gov. Revenue excl. Grants (per cent of GDP) 29.4 41.5 32.9 28.2 26.8 17.4
Government taxes (per cent of GDP) 18.8 25.3 17.9 19.0 17.2 13.4
Income Tax (per cent of GDP) 7.2 11.8 6.4 6.2 5.7 4.4
VAT revenue (per cent of GDP) 6.4 6.9 7.5 6.7 5.99 4.4
Trade Tax (per cent of GDP) 2.4 0.2 2.3 2.4 3.5 3.0
Source: IMF, World Revenue Longitudinal Data (WoRLD).
There is a vast body of literature, including the IMF’s extensive research on taxation in developing countries. Typical findings were introduced in chapter 2 and are summarized in the following section.
5.1.2 Overall tax performance
The average tax-GDP ratio of developing countries increased since the early 1990s. The average tax-GDP ratio has increased from around 16 per cent in 1990 to around 19 per cent in 2013 in upper-middle income countries; from 14 per cent to 18 per cent in lower-middle income countries, and from around 10 per cent to 14 per cent in low income countries. Some low income countries have done much better. For example, out of 28 Sub-Saharan African low income countries, about 16 were able to raise revenue ratios by 5 percentage points of GDP or more in at least once in a three-year period during the last two decades.
As a faster growing region, the Asia-Pacific region has not done well until recently. The average tax-GDP ratio in the region increased from around 15 per cent during 1990-2009 to around 22 per cent during 2010-2014. The worst performer is South Asia with an average tax-GDP ratio of around 10 per cent between 2000 and 2013; it rose to 14.5 per cent only in 2014-2015. The average tax-GDP ratio in Sub-Saharan Africa hovered around 14 per cent until 2011 and rose to around 18 per cent during 2011-2015. In Latin America, the average tax-GDP ratio stagnated at around 17 per cent since 1990. In Middle-East and North Africa the average tax-GDP ratio declined from the peak of around 19.5 per cent in 2007 to around 10 per cent in 2013, reflecting uncertainty arising from their dependence on natural resources.
Resource-rich countries have performed better in terms of tax collections compared to non- resource-rich countries. However, revenues are more volatile from year to year, exposing budgets of resource-rich countries to the volatility of commodity prices.
Fragile states are less able to expand tax revenue as a percentage of GDP and any gains are more difficult to sustain. In post-conflict countries, as economies are rebuilt, there can be good progress in developing effective tax systems, e.g. Liberia (with taxes growing from 10.6 per cent of GDP in 2003 to 21.3 per cent in 2011) and Mozambique (10.5 per cent of GDP in 1994 to 17.7 per cent in 2011).
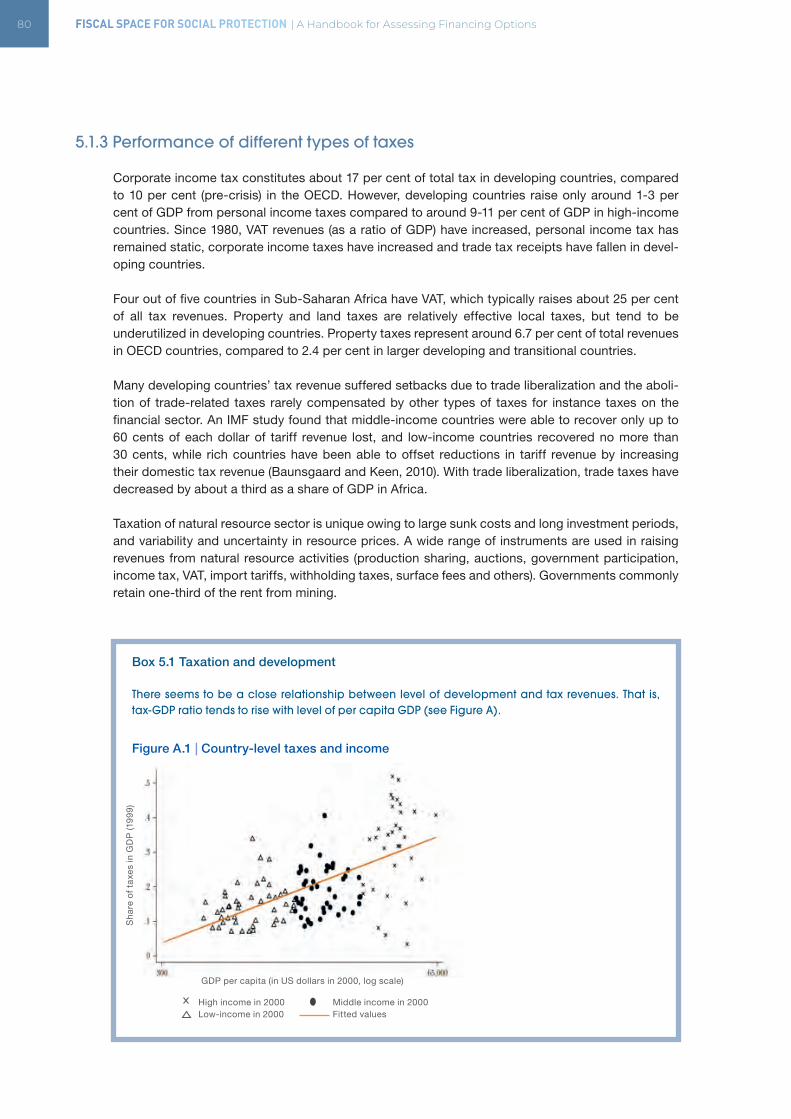
80 FISCAL SPACE FOR SOCIAL PROTECTION | A Handbook for Assessing Financing Options
5.1.3 Performance of different types of taxes
Corporate income tax constitutes about 17 per cent of total tax in developing countries, compared to 10 per cent (pre-crisis) in the OECD. However, developing countries raise only around 1-3 per cent of GDP from personal income taxes compared to around 9-11 per cent of GDP in high-income countries. Since 1980, VAT revenues (as a ratio of GDP) have increased, personal income tax has remained static, corporate income taxes have increased and trade tax receipts have fallen in devel-oping countries.
Four out of five countries in Sub-Saharan Africa have VAT, which typically raises about 25 per cent of all tax revenues. Property and land taxes are relatively effective local taxes, but tend to be underutilized in developing countries. Property taxes represent around 6.7 per cent of total revenues in OECD countries, compared to 2.4 per cent in larger developing and transitional countries.
Many developing countries’ tax revenue suffered setbacks due to trade liberalization and the aboli-tion of trade-related taxes rarely compensated by other types of taxes for instance taxes on the financial sector. An IMF study found that middle-income countries were able to recover only up to 60 cents of each dollar of tariff revenue lost, and low-income countries recovered no more than 30 cents, while rich countries have been able to offset reductions in tariff revenue by increasing their domestic tax revenue (Baunsgaard and Keen, 2010). With trade liberalization, trade taxes have decreased by about a third as a share of GDP in Africa. Taxation of natural resource sector is unique owing to large sunk costs and long investment periods, and variability and uncertainty in resource prices. A wide range of instruments are used in raising revenues from natural resource activities (production sharing, auctions, government participation, income tax, VAT, import tariffs, withholding taxes, surface fees and others). Governments commonly retain one-third of the rent from mining.
Box 5.1 Taxation and development
There seems to be a close relationship between level of development and tax revenues. That is, tax-GDP ratio tends to rise with level of per capita GDP (see Figure A).
Figure A.1 | Country-level taxes and income
Sh
are
of
taxe
s in
GD
P (1
99
9)
High income in 2000Low-income in 2000
Middle income in 2000Fitted values
GDP per capita (in US dollars in 2000, log scale)
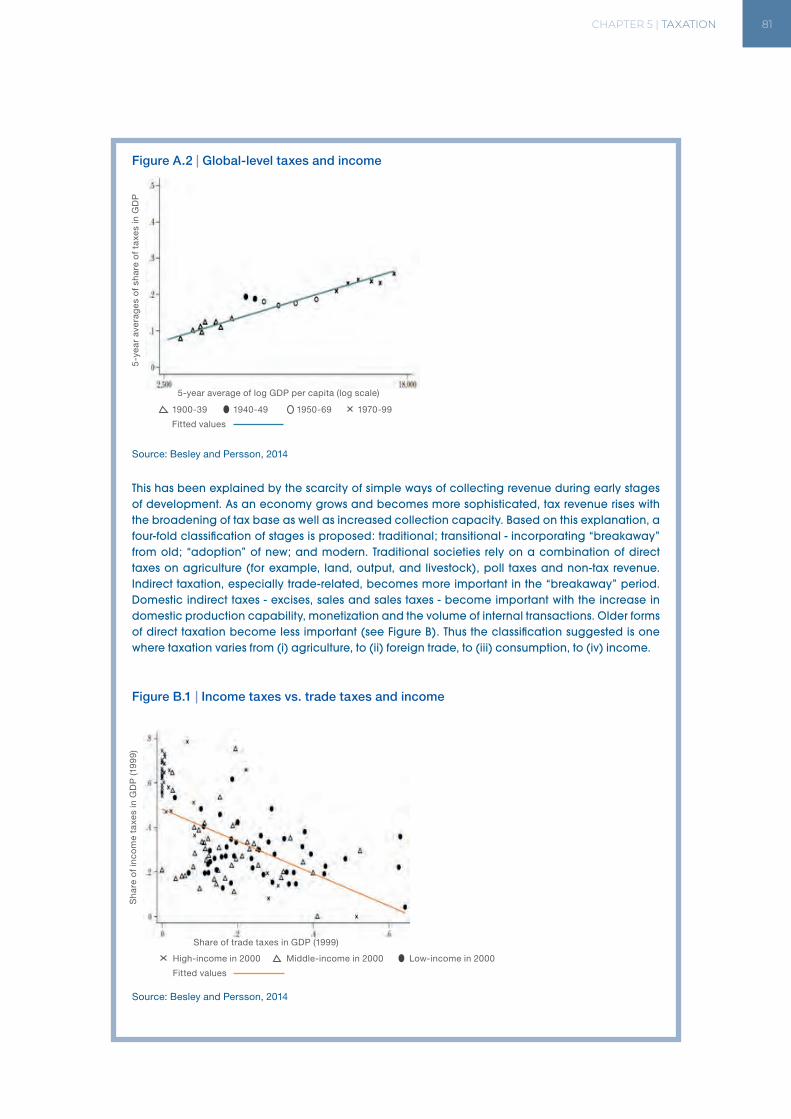
CHAPTER 5 | TAXATION 81
Figure A.2 | Global-level taxes and income
Source: Besley and Persson, 2014
This has been explained by the scarcity of simple ways of collecting revenue during early stages of development. As an economy grows and becomes more sophisticated, tax revenue rises with the broadening of tax base as well as increased collection capacity. Based on this explanation, a four-fold classification of stages is proposed: traditional; transitional - incorporating “breakaway” from old; “adoption” of new; and modern. Traditional societies rely on a combination of direct taxes on agriculture (for example, land, output, and livestock), poll taxes and non-tax revenue. Indirect taxation, especially trade-related, becomes more important in the “breakaway” period. Domestic indirect taxes - excises, sales and sales taxes - become important with the increase in domestic production capability, monetization and the volume of internal transactions. Older forms of direct taxation become less important (see Figure B). Thus the classification suggested is one where taxation varies from (i) agriculture, to (ii) foreign trade, to (iii) consumption, to (iv) income.
Figure B.1 | Income taxes vs. trade taxes and income
Source: Besley and Persson, 2014
Sh
are
of
inco
me
taxe
s in
GD
P (1
99
9)5
-yea
r av
erag
es o
f sh
are
of
taxe
s in
GD
P
Share of trade taxes in GDP (1999)
1900-39 1940-49 1950-69 1970-99
Fitted values
5-year average of log GDP per capita (log scale)
High-income in 2000 Middle-income in 2000 Low-income in 2000
Fitted values
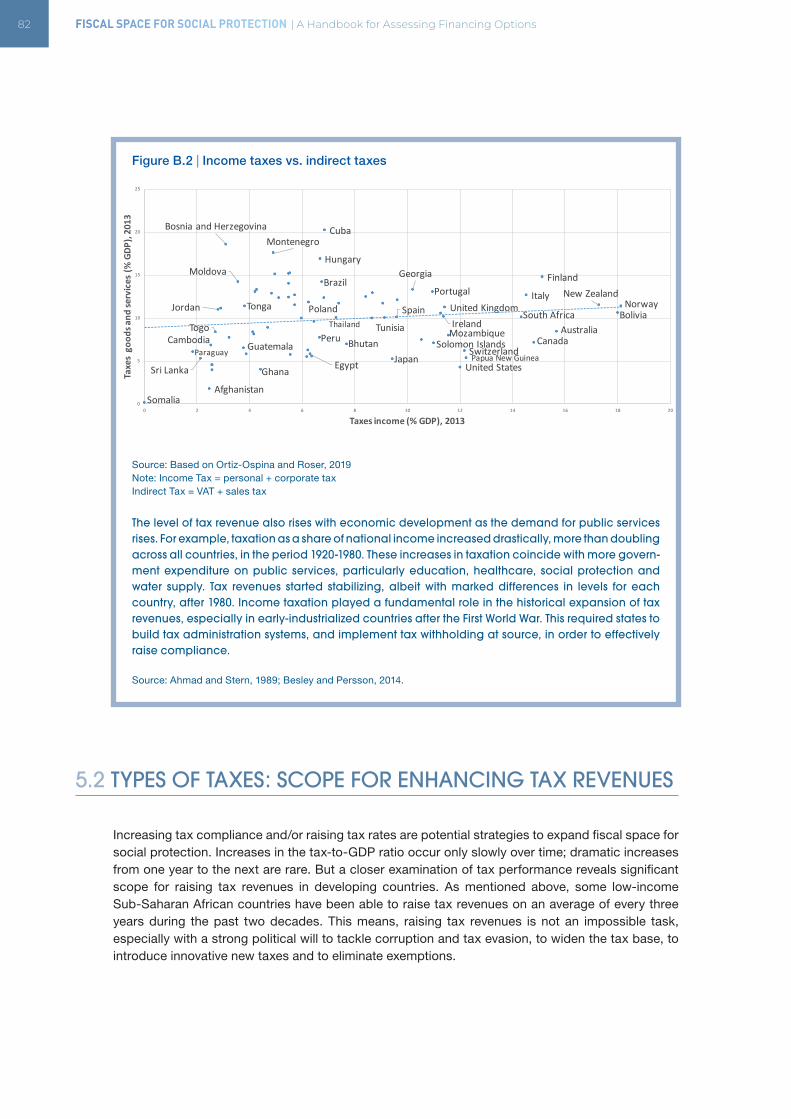
82 FISCAL SPACE FOR SOCIAL PROTECTION | A Handbook for Assessing Financing Options
Figure B.2 | Income taxes vs. indirect taxes
Source: Based on Ortiz-Ospina and Roser, 2019Note: Income Tax = personal + corporate taxIndirect Tax = VAT + sales tax
The level of tax revenue also rises with economic development as the demand for public services rises. For example, taxation as a share of national income increased drastically, more than doubling across all countries, in the period 1920-1980. These increases in taxation coincide with more govern-ment expenditure on public services, particularly education, healthcare, social protection and water supply. Tax revenues started stabilizing, albeit with marked differences in levels for each country, after 1980. Income taxation played a fundamental role in the historical expansion of tax revenues, especially in early-industrialized countries after the First World War. This required states to build tax administration systems, and implement tax withholding at source, in order to effectively raise compliance.
Source: Ahmad and Stern, 1989; Besley and Persson, 2014.
5.2 TYPES OF TAXES: SCOPE FOR ENHANCING TAX REVENUES
Increasing tax compliance and/or raising tax rates are potential strategies to expand fiscal space for social protection. Increases in the tax-to-GDP ratio occur only slowly over time; dramatic increases from one year to the next are rare. But a closer examination of tax performance reveals significant scope for raising tax revenues in developing countries. As mentioned above, some low-income Sub-Saharan African countries have been able to raise tax revenues on an average of every three years during the past two decades. This means, raising tax revenues is not an impossible task, especially with a strong political will to tackle corruption and tax evasion, to widen the tax base, to introduce innovative new taxes and to eliminate exemptions.
EgyptGhana
Mozambique
Somalia
South AfricaTogo Tunisia
Afghanistan
BhutanCambodia
Georgia
Japan
Jordan
Sri Lanka
Thailand
Bosnia and Herzegovina
Finland
Hungary
Ireland
Italy
Moldova
Montenegro
NorwayPoland
Portugal
Spain
Switzerland
United Kingdom
Canada
Cuba
Guatemala
United States
Australia
New Zealand
Papua New GuineaSolomon Islands
TongaBolivia
Brazil
ParaguayPeru
0
5
10
15
20
25
0 2 4 6 8 10 12 14 16 18 20
Taxe
s go
ods a
nd se
rvic
es (%
GDP
), 20
13
Taxes income (% GDP), 2013
CHAPTER 5 | TAXATION 83
5.2.1 Tax potential or capacity: Tax gap
Developing countries do have potential for increasing their tax revenues. There exists a significant gap between their actual tax in-take and estimated tax potential, known as tax gap. Box 5.2 lists contributory factors to developing countries’ tax gap.
Box 5.2 Tax gaps in developing countries
• Significant contributors to tax gaps in developing countries include tax evasion and avoidance, tax exemptions, and inequitable rent-sharing in the natural resource sector. Lack of administra-tive capacity, corruptions, and grey areas in the legal framework compound the problem of tax gap (see section 5.3.2 for the relationship between fiscal revenue and corruption).
• A large source of missed revenue for developing countries is the result of international issues related to multinational corporations (MNCs). Governments miss a potentially substantial amount of revenue through mispricing of goods and services that are transferred within a MNC amongst subsidiaries/affiliates or between a subsidiary and the mother company, mainly with the aim of transferring profits to low tax jurisdictions. Some estimates show that transfer mis-pricing costs developing countries US$ 160 billion in lost revenues every year (Christian Aid, 2009). (More discussion on this issue is in chapter 6).
• Tax competition (i.e. tax incentives in the form of tax holidays and a myriad of tax exemptions and exceptions) to attract foreign investment are also contributing to developing countries’ tax gap. Losses of revenue by developing countries from profit shifting by MNCs and through tax exemptions for investors are typically around the order of magnitude of 20 per cent to 30 per cent of actual revenue collections in each case.
• Availability of aid may diminish the incentive to take actions that would increase the domestic revenue base, especially in countries with endowments of easy-to-tax natural resources. One study found a broad negative association: between 1980 and 1995, when foreign aid as a share of GDP was increasing, the average tax-GDP ratio decreased. Post-1995, a decline in the share of total net ODA to GDP was accompanied by higher tax revenues as a percentage of GDP (Benedek et al., 2012).
• Besides, possible adverse exchange rate impacts, revenue volatility, reduced tax efforts and resultant fiscal instability, and ad-hoc and not very transparent revenue/rent-sharing arrange-ments in the natural resource sector are also a source of concern. When such arrangements are negotiated directly between government officials and companies, outside the tax system and without clear guidelines, the potential for corruption and for a lower share of revenue retained in the country can become high. Over exploitation and associated adverse environmental and social impacts are also of concern.
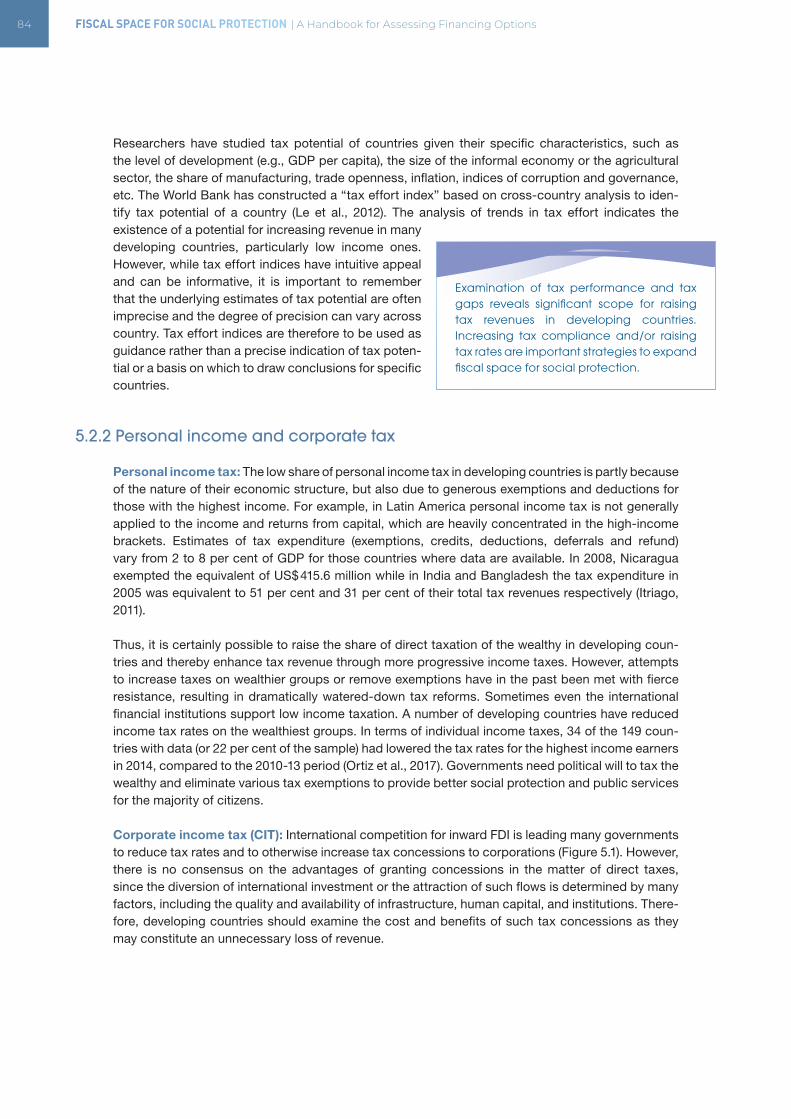
84 FISCAL SPACE FOR SOCIAL PROTECTION | A Handbook for Assessing Financing Options
Researchers have studied tax potential of countries given their specific characteristics, such as the level of development (e.g., GDP per capita), the size of the informal economy or the agricultural sector, the share of manufacturing, trade openness, inflation, indices of corruption and governance, etc. The World Bank has constructed a “tax effort index” based on cross-country analysis to iden-tify tax potential of a country (Le et al., 2012). The analysis of trends in tax effort indicates the existence of a potential for increasing revenue in many developing countries, particularly low income ones. However, while tax effort indices have intuitive appeal and can be informative, it is important to remember that the underlying estimates of tax potential are often imprecise and the degree of precision can vary across country. Tax effort indices are therefore to be used as guidance rather than a precise indication of tax poten-tial or a basis on which to draw conclusions for specific countries.
5.2.2 Personal income and corporate tax
Personal income tax: The low share of personal income tax in developing countries is partly because of the nature of their economic structure, but also due to generous exemptions and deductions for those with the highest income. For example, in Latin America personal income tax is not generally applied to the income and returns from capital, which are heavily concentrated in the high-income brackets. Estimates of tax expenditure (exemptions, credits, deductions, deferrals and refund) vary from 2 to 8 per cent of GDP for those countries where data are available. In 2008, Nicaragua exempted the equivalent of US$ 415.6 million while in India and Bangladesh the tax expenditure in 2005 was equivalent to 51 per cent and 31 per cent of their total tax revenues respectively (Itriago, 2011).
Thus, it is certainly possible to raise the share of direct taxation of the wealthy in developing coun-tries and thereby enhance tax revenue through more progressive income taxes. However, attempts to increase taxes on wealthier groups or remove exemptions have in the past been met with fierce resistance, resulting in dramatically watered-down tax reforms. Sometimes even the international financial institutions support low income taxation. A number of developing countries have reduced income tax rates on the wealthiest groups. In terms of individual income taxes, 34 of the 149 coun-tries with data (or 22 per cent of the sample) had lowered the tax rates for the highest income earners in 2014, compared to the 2010-13 period (Ortiz et al., 2017). Governments need political will to tax the wealthy and eliminate various tax exemptions to provide better social protection and public services for the majority of citizens.
Corporate income tax (CIT): International competition for inward FDI is leading many governments to reduce tax rates and to otherwise increase tax concessions to corporations (Figure 5.1). However, there is no consensus on the advantages of granting concessions in the matter of direct taxes, since the diversion of international investment or the attraction of such flows is determined by many factors, including the quality and availability of infrastructure, human capital, and institutions. There-fore, developing countries should examine the cost and benefits of such tax concessions as they may constitute an unnecessary loss of revenue.
Examination of tax performance and tax gaps reveals significant scope for raising tax revenues in developing countries. Increasing tax compliance and/or raising tax rates are important strategies to expand fiscal space for social protection.
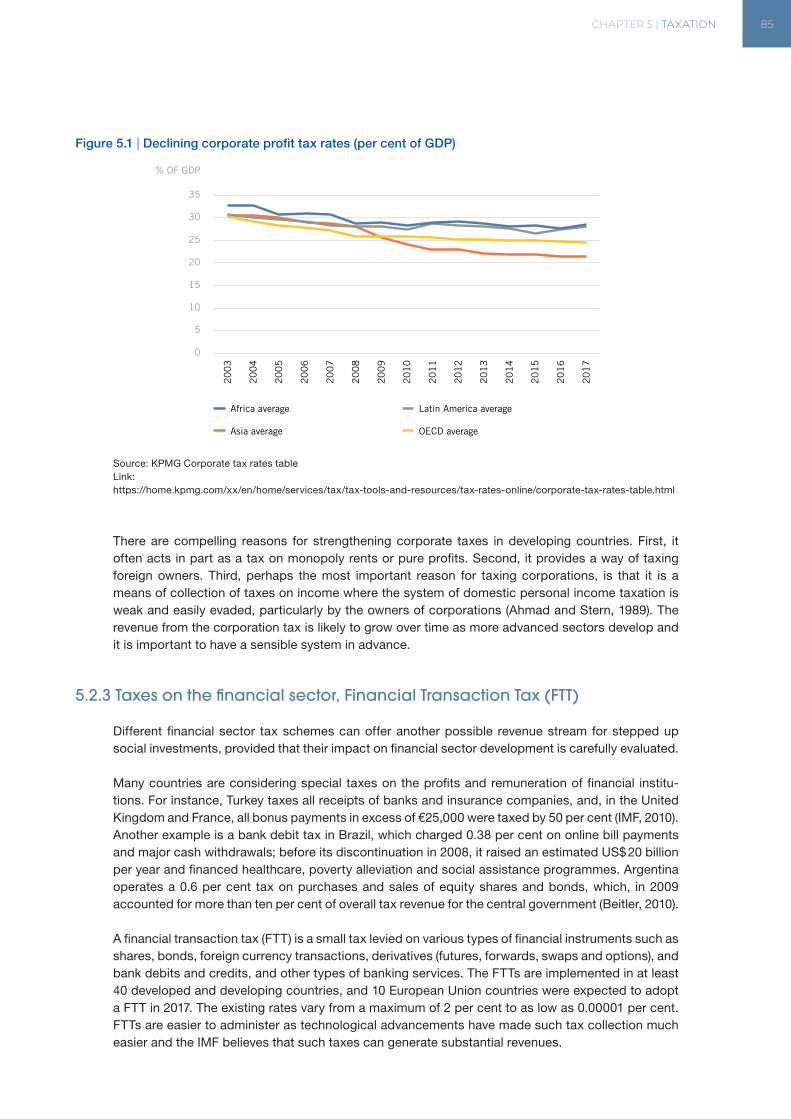
CHAPTER 5 | TAXATION 85
Figure 5.1 | Declining corporate profit tax rates (per cent of GDP)
Source: KPMG Corporate tax rates table Link: https://home.kpmg.com/xx/en/home/services/tax/tax-tools-and-resources/tax-rates-online/corporate-tax-rates-table.html
There are compelling reasons for strengthening corporate taxes in developing countries. First, it often acts in part as a tax on monopoly rents or pure profits. Second, it provides a way of taxing foreign owners. Third, perhaps the most important reason for taxing corporations, is that it is a means of collection of taxes on income where the system of domestic personal income taxation is weak and easily evaded, particularly by the owners of corporations (Ahmad and Stern, 1989). The revenue from the corporation tax is likely to grow over time as more advanced sectors develop and it is important to have a sensible system in advance.
5.2.3 Taxes on the financial sector, Financial Transaction Tax (FTT)
Different financial sector tax schemes can offer another possible revenue stream for stepped up social investments, provided that their impact on financial sector development is carefully evaluated.
Many countries are considering special taxes on the profits and remuneration of financial institu-tions. For instance, Turkey taxes all receipts of banks and insurance companies, and, in the United Kingdom and France, all bonus payments in excess of €25,000 were taxed by 50 per cent (IMF, 2010). Another example is a bank debit tax in Brazil, which charged 0.38 per cent on online bill payments and major cash withdrawals; before its discontinuation in 2008, it raised an estimated US$ 20 billion per year and financed healthcare, poverty alleviation and social assistance programmes. Argentina operates a 0.6 per cent tax on purchases and sales of equity shares and bonds, which, in 2009 accounted for more than ten per cent of overall tax revenue for the central government (Beitler, 2010).
A financial transaction tax (FTT) is a small tax levied on various types of financial instruments such as shares, bonds, foreign currency transactions, derivatives (futures, forwards, swaps and options), and bank debits and credits, and other types of banking services. The FTTs are implemented in at least 40 developed and developing countries, and 10 European Union countries were expected to adopt a FTT in 2017. The existing rates vary from a maximum of 2 per cent to as low as 0.00001 per cent. FTTs are easier to administer as technological advancements have made such tax collection much easier and the IMF believes that such taxes can generate substantial revenues.
% OF GDP
0
5
10
15
20
25
30
35
20
03
Africa average
Asia average
Latin America average
OECD average
20
04
20
05
20
06
20
07
20
08
20
09
20
10
20
11
20
12
20
13
20
14
20
15
20
16
20
17
86 FISCAL SPACE FOR SOCIAL PROTECTION | A Handbook for Assessing Financing Options
FTTs have a dual goal of raising revenues while discouraging the type of short-term financial spec-ulation that has little social value but poses high risks to the economy. One estimate shows that FTTs can generate US$ 2.9-US$ 14.5 billion in all developing countries combined depending on their design (coverage or base and rate) and the size of their financial sector (Grabel, 2005).
The IMF in its submission to the G20, has proposed Financial Activities Tax (FAT), levied on the sum of the profits and remuneration of financial institutions, and paid to general revenue. FAT seeks to target the value-added by the financial sector. It also proposed Financial Stability Contribution (FSC), linked to a credible and effective resolution mechanism. The main component of the FSC would be a levy to pay for the fiscal cost of any future government support to the sector. This could either accumulate in a fund to facilitate the resolution of weak institutions or be paid into general revenue. The FSC would be paid by all financial institutions, initially levied at a flat rate (varying though by type of financial institutions) but refined thereafter to reflect individual institutions’ riskiness and contribu-tions to systemic risk—such as those related to size, interconnectedness and substitutability—and variations in overall risk over time.
Box 5.3 Financial transactions tax in Brazil
Brazil introduced a bank debit tax first in 1993, but it was short-lived. The longest lasting bank debit tax – Contribuicao provisoria sobre movimentacao ou transmissao de valores e de creditos e direitos de natureza financiera (CPMF) – was put in place in 1997 at an initial rate of 0.20 per cent. The rate increased gradually starting in 1999 (0.22 per cent) to 0.38 per cent in 2002. Revenues raised from the CPMF was originally earmarked to finance healthcare programmes (0.2 per cent), to combat poverty (0.1 per cent) and for social assistance (0.08 per cent). The CPMF collected nearly US$ 20 billion per year. According to an IMF report, the CPMF raised about three times the amount raised by the corporate income tax (CIT) on financial companies. The CPMF was discontinued in 2008 after the Supreme Court ruled that earmarking of revenue from such taxes was unconstitutional.
As the CPMF was designed mainly to finance social protection expenditure, the mechanism was classified as a “social contribution”. During the period in which the CPMF was in place, 42 per cent of the revenue collected was used for the public unified health system, 21 per cent for social insurance, 21 per cent for Bolsa Família (a social assistance cash transfer for the poor) and 16 per cent for other social purposes. By 2007, total revenue from the CPMF amounted to 1.4 per cent of GDP, enough to cover the total cost of Bolsa Família and other non-contributory social protection programmes.
A second component of FTTs, the financial operations tax (IOF), introduced in 1999 subjected capital inflows for portfolio investments and investments in local assets to a 2 per cent tax to be paid at the point of the settlement date of the Brazilian Reals. That is, the tax is paid when foreign currency is converted into Brazilian Reals. The IOF tax was designed to offset the impact of short-term capital inflows on the Brazilian currency and to prevent speculation in the Brazilian stock and capital markets when the US pursued expansionary monetary policy in response to the 2008-2009 global financial crisis. Additionally, increases in the IOF rate compensated the loss of tax revenue caused by the abolition of the CPMF in 2008.
In December 2015, Brazil’s Congress approved the 2016 Budget which calls for the creation of a tax over financial transactions (CPMF tax). According to the Finance Minister of Brazil, Joaquim Levy, if the CPMF was not approved, certain important programmes such as unemployment benefits and workers’ protection would be at risk.
Source: Duran-Valverde and Pacheco, 2012; Ortiz, et al., 2017.
CHAPTER 5 | TAXATION 87
5.2.4 Property tax
Property tax is not well utilized in developing countries. Developing countries collect only 0.6 per cent of GDP from property taxes as opposed to 2.1 per cent of GDP in OECD. Political economy factors, such as resistance from land-owners, play a role in the reluctance of the government to seriously consider this source of revenue.
It is a good source as it is difficult to evade. In addition, it has a stabilizing impact as it can prevent speculative real estate investment and housing sector bubbles. Furthermore, it is unlikely to have adverse impacts on the poor as its burden falls mostly on middle and upper-middle income house-holds. Thus, there is a renewed and widespread interest in property tax reform globally (see Box 5.4).
Box 5.4 Recent property tax reforms and plans
Namibia recently introduced a central govern-ment land tax on the value of agricultural land (with a basic rate of 0.75 per cent) to supplement the existing municipal tax on urban property, with the primary aim of encouraging efficient utiliza-tion of agricultural land.
Liberia reformed the rate structure of the real property tax with effect from 2011 and is contem-plating further reform measures to strengthen property rights and the revenue potential of the real property tax.
Cambodia introduced a new property tax in 2011, in principle based on assessed market values of land and buildings. The tax is being piloted in a limited number of urban areas.
China decided to introduce residential property taxation starting in 2011, in part aimed at rein-ing-in speculation and strong price appreciation in the property sector, and in part to address the country’s widening wealth gap and provide local governments with a significant revenue source. Pilot projects are conducted in two cities, Shanghai and Chongqing, to be followed in due course by other cities.
Hong Kong SAR introduced in early 2013 a new special property transaction tax (the ‘buyer’s stamp duty’) at 15 per cent of the transaction price covering non-local buyers and all corpo-rate buyers, aimed at curbing speculation and high property price appreciation.
Singapore also increased stamp duties on certain home buyers, the aim of which, together with a broader set of measures, is to curb property price increases and prevent an asset-price bubble.
Vietnam adopted in June 2010 a new area-based tax on non-agricultural land (excluding housing) and is considering further reform in this area.
Croatia is in the process of introducing a new ad valorem property tax at a uniform tax rate of 1.5
per cent, to replace existing ‘utility fees’ and the second home tax.
Greece adopted in late 2011 a new square-meter tax at varying specific rates, collected over the electricity bills. The reform was part of a broader ‘crisis’ package.
Ireland abolished the residential property tax in 1997 (leaving the local ‘rates’ on commercial property as the only recurrent property tax). A new market-value-based (self-assessed) prop-erty tax came into effect in 2013 to replace the annual household charge of 100 euros put in place on January 1, 2012 as part of a broader fiscal package.
Latvia implemented reform measures in 2010 by introducing a residential property tax on build-ings to complement the existing land tax, and additional measures are considered.
Serbia plans an in-depth modernization of its property tax system to replace the system of taxes based on property rights in tandem with a planned land privatization reform.
Slovenia is replacing three pre-existing duties on property with one uniform and modern system of real property taxation based on mass appraisal of market values and a new real estate register.
Egypt adopted a new real estate law with a rate of 10 per cent applied to estimated rental income, effective 2009 but with a delayed application until 2012.
Kyrgyzstan introduced with effect from January 1, 2009 a new property tax for companies and individuals on top of the existing land tax.
El Salvador is one of the few Latin American coun-tries (together with Paraguay and Costa Rica) at present without an immovable property tax, but is considering introducing one.
Source: Norregaard, 2013.
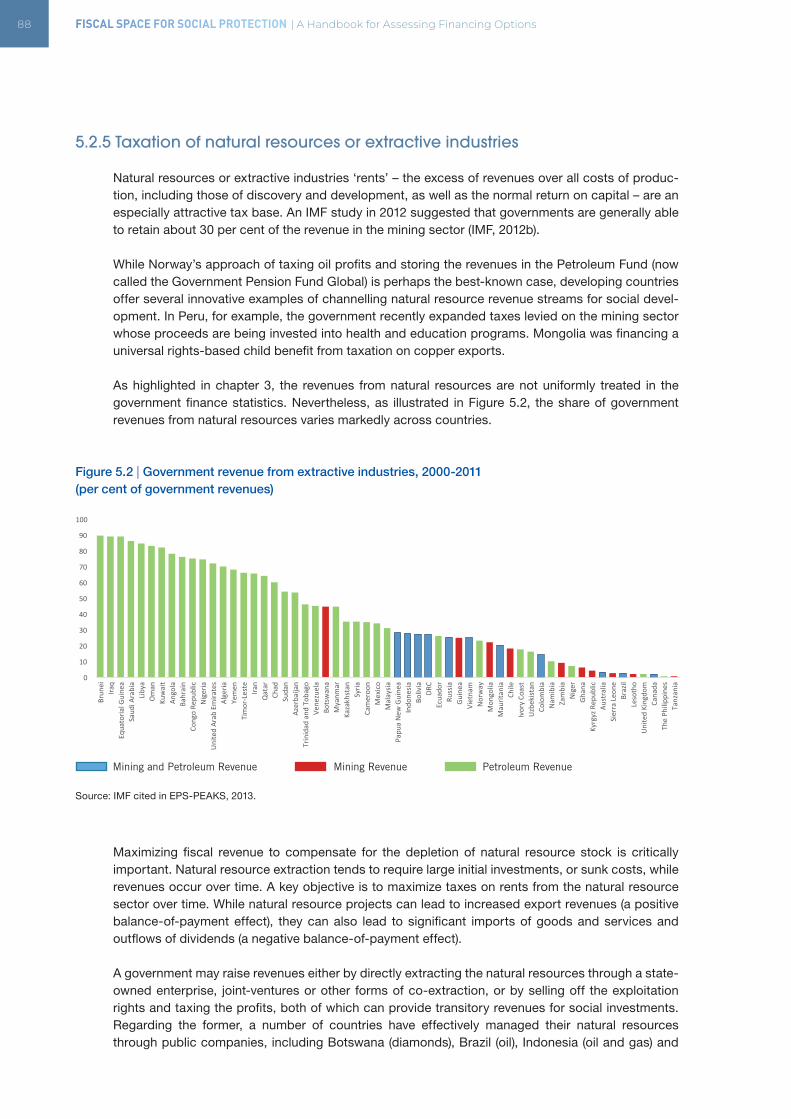
88 FISCAL SPACE FOR SOCIAL PROTECTION | A Handbook for Assessing Financing Options
5.2.5 Taxation of natural resources or extractive industries
Natural resources or extractive industries ‘rents’ – the excess of revenues over all costs of produc-tion, including those of discovery and development, as well as the normal return on capital – are an especially attractive tax base. An IMF study in 2012 suggested that governments are generally able to retain about 30 per cent of the revenue in the mining sector (IMF, 2012b).
While Norway’s approach of taxing oil profits and storing the revenues in the Petroleum Fund (now called the Government Pension Fund Global) is perhaps the best-known case, developing countries offer several innovative examples of channelling natural resource revenue streams for social devel-opment. In Peru, for example, the government recently expanded taxes levied on the mining sector whose proceeds are being invested into health and education programs. Mongolia was financing a universal rights-based child benefit from taxation on copper exports.
As highlighted in chapter 3, the revenues from natural resources are not uniformly treated in the government finance statistics. Nevertheless, as illustrated in Figure 5.2, the share of government revenues from natural resources varies markedly across countries.
Figure 5.2 | Government revenue from extractive industries, 2000-2011 (per cent of government revenues)
Source: IMF cited in EPS-PEAKS, 2013.
Maximizing fiscal revenue to compensate for the depletion of natural resource stock is critically important. Natural resource extraction tends to require large initial investments, or sunk costs, while revenues occur over time. A key objective is to maximize taxes on rents from the natural resource sector over time. While natural resource projects can lead to increased export revenues (a positive balance-of-payment effect), they can also lead to significant imports of goods and services and outflows of dividends (a negative balance-of-payment effect).
A government may raise revenues either by directly extracting the natural resources through a state-owned enterprise, joint-ventures or other forms of co-extraction, or by selling off the exploitation rights and taxing the profits, both of which can provide transitory revenues for social investments. Regarding the former, a number of countries have effectively managed their natural resources through public companies, including Botswana (diamonds), Brazil (oil), Indonesia (oil and gas) and
0
10
20
30
40
50
60
70
80
90
100
Brun
ei
Iraq
Equa
toria
lGuine
aSa
udiA
rabia
Liby
aOman
Ku
wait
Ango
la
Bahrain
Cong
oRe
public
Nigeria
UnitedAr
abEmira
tes
Alge
ria
Yemen
Timor-Leste
Iran
Qatar
Chad
Su
dan
Azerba
ijan
Trinidad
and
Tob
ago
Vene
zuela
Botswan
aMya
nmar
Kazakh
stan
Sy
ria
Cameroo
nMex
ico
Malay
sia
Papu
aNew
Guine
aIndo
nesia
Bo
livia
DRC
Ecua
dor
Russia
Guinea
Vietna
m
Norway
Mon
golia
Mau
ritan
ia
Chile
IvoryCo
ast
Uzb
ekist
an
Colombia
Nam
ibia
Zambia
Niger
Ghan
aKy
rgyzRep
ublic
Australia
SierraLeo
ne
Brazil
Leso
tho
UnitedKing
dom
Cana
da
ThePh
ilipp
ines
Tanz
ania
MiningandPetroleumRevenue
MiningRevenue
Mining and Petroleum Revenue Mining Revenue Petroleum Revenue
CHAPTER 5 | TAXATION 89
Malaysia (forestry, tin, oil and gas) (Chang, 2007). In terms of the latter, ample care must be taken to find the right types of contracts, including licenses, joint venture, production-sharing arrangements, etc. (Box 5.5). Although availability of natural resources can be an important source of revenue, natural resource rents can be volatile and may create a disincentive for raising revenues from other sources. Many developing countries may not have the capacity to handle complex negotiation with powerful MNCs in the extractive industries.
Box 5.5 Plurinational State of Bolivia: Taxing hydrocarbons key for national social development
Natural resources, including gold, tin, petroleum and gas, are the main pillar of Bolivia’s wealth and key to the country’s national development. As a result of orthodox neoliberal policies in the 1980s, the majority of production was privatized, often through foreign companies. In the process, royalty taxes were cut down to 18 per cent, which led to extremely high profits for producers (82 per cent) and very low returns to the Bolivian population. The widespread dissatisfaction with this situation led to an activist campaign named “Hydrocarbons are No Longer Ours.” After violent repression of this movement during the so-called “Gas Wars”, President Sánchez de Lozada resigned, a national referendum led to a new regulation on the distribution of hydrocarbon wealth. The previous share of 82 per cent of oil revenues for the producers and 18 per cent for the state was equalized at a 50-50 split (and a reversed 82-18 split for the largest gas field). Renegotiation of former contracts led to an increase in oil and gas income for the state from US$ 558 million in 2004 to US$ 1.53 billion in 2006. Such significant revenue increases allowed the government to expand/sustain social policies such as Renta Dignidad (Dignity Rent), a non-contributory pension to all Bolivians over 60 years old, or the Bono Juancito Pinto, a cash transfer for all children in public elementary schools (from first through eighth grade), which offsets the costs of transportation, books and uniforms to increase school attendance.
Source: Duran-Valverde and Pacheco, 2012; UNCTAD, 2014.
There are different tax instruments: direct taxes (profit-based, such as corporate income tax or variable profit tax); revenue-based taxes (such as mineral royalties or windfall taxes) and indirect taxes (VAT and customs duties).
• Corporate income tax (CIT) is applied as a fixed percentage of a company’s profits. Even though there may be headline CIT rates, the practice depends on numerous provisions such as depreciation allowances, loss-carry forward provisions, ring fencing and tax holidays.
• Profits tax varies according to some measure of profitability or return on investment. Such a resource rent tax aims to maximise revenues from mining without sacrificing the further invest-ment required for the viability of the industry and fiscal revenue in the future.
• Royalty tax is levied as a fixed percentage of the value of a company’s sales of a particular mineral. Royalties are a more reliable revenue source than profit-based taxes, because some revenue will be collected as soon as production starts, regardless of whether the firm is profitable or not.
• Windfall tax is levied on the value of a company’s sales of a particular mineral in which the rate increases with the price of the mineral. This tax can be more progressive than a fixed royalty rate.
• VAT is rarely a significant form of mining taxation.
• Customs duty is applied as a fixed percentage (usually on the value or sometimes on another metric such as the weight) of a good that is imported into or exported from a country.
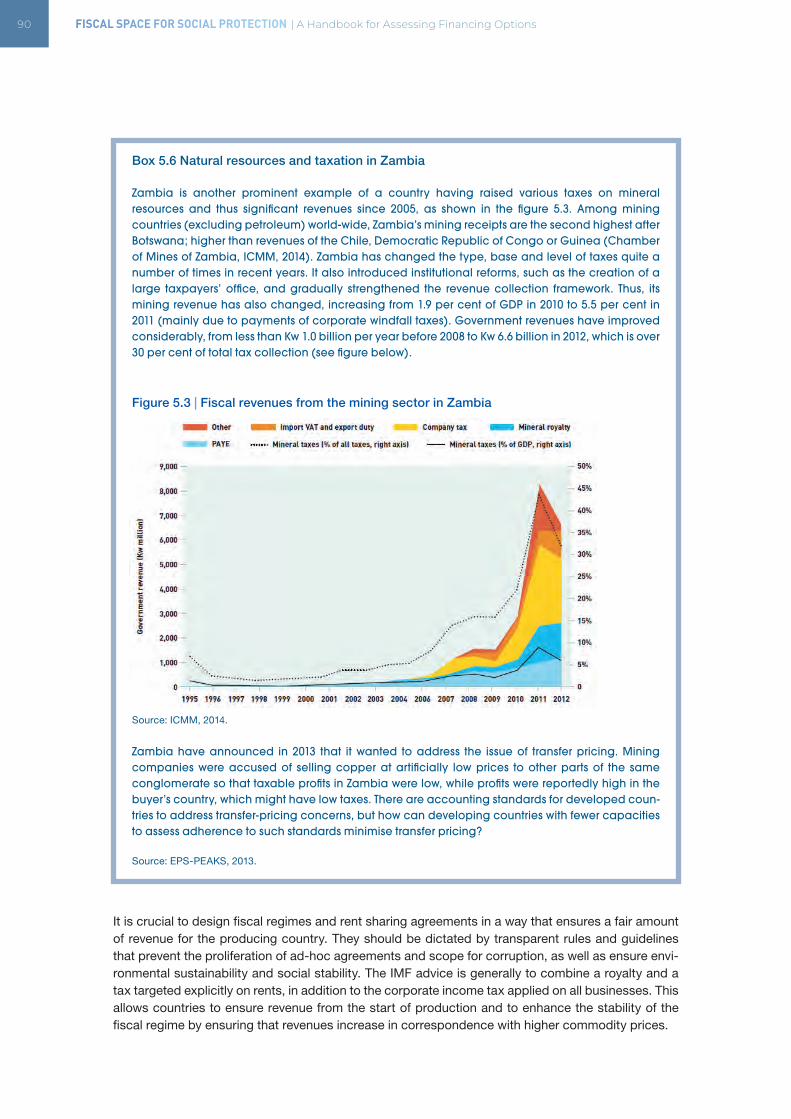
90 FISCAL SPACE FOR SOCIAL PROTECTION | A Handbook for Assessing Financing Options
Box 5.6 Natural resources and taxation in Zambia
Zambia is another prominent example of a country having raised various taxes on mineral resources and thus significant revenues since 2005, as shown in the figure 5.3. Among mining countries (excluding petroleum) world-wide, Zambia’s mining receipts are the second highest after Botswana; higher than revenues of the Chile, Democratic Republic of Congo or Guinea (Chamber of Mines of Zambia, ICMM, 2014). Zambia has changed the type, base and level of taxes quite a number of times in recent years. It also introduced institutional reforms, such as the creation of a large taxpayers’ office, and gradually strengthened the revenue collection framework. Thus, its mining revenue has also changed, increasing from 1.9 per cent of GDP in 2010 to 5.5 per cent in 2011 (mainly due to payments of corporate windfall taxes). Government revenues have improved considerably, from less than Kw 1.0 billion per year before 2008 to Kw 6.6 billion in 2012, which is over 30 per cent of total tax collection (see figure below).
Figure 5.3 | Fiscal revenues from the mining sector in Zambia
Source: ICMM, 2014.
Zambia have announced in 2013 that it wanted to address the issue of transfer pricing. Mining companies were accused of selling copper at artificially low prices to other parts of the same conglomerate so that taxable profits in Zambia were low, while profits were reportedly high in the buyer’s country, which might have low taxes. There are accounting standards for developed coun-tries to address transfer-pricing concerns, but how can developing countries with fewer capacities to assess adherence to such standards minimise transfer pricing?
Source: EPS-PEAKS, 2013.
It is crucial to design fiscal regimes and rent sharing agreements in a way that ensures a fair amount of revenue for the producing country. They should be dictated by transparent rules and guidelines that prevent the proliferation of ad-hoc agreements and scope for corruption, as well as ensure envi-ronmental sustainability and social stability. The IMF advice is generally to combine a royalty and a tax targeted explicitly on rents, in addition to the corporate income tax applied on all businesses. This allows countries to ensure revenue from the start of production and to enhance the stability of the fiscal regime by ensuring that revenues increase in correspondence with higher commodity prices.
CHAPTER 5 | TAXATION 91
Managing large inflows of foreign currencies associated with large investment projects as well as export earnings can be quite problematic for many developing countries with weak institutional capacity. Besides causing fiscal instability due to volatility of revenues associated with price fluc-tuations, large inflows of foreign currencies can cause exchange rate appreciation to the detriment of export sector. This issue will be discussed in chapter 8 on fiscal and foreign exchange reserves.
5.2.6 Consumption taxes, VAT
Raising VAT has become a common approach for many countries. For example, a recent ILO review of IMF policy discussions found that 138 governments in 93 developing and 45 high income countries were considering raising VAT or sales taxes (Ortiz et al., 2015). According to an IMF study, in lower- income countries where VAT performance is weakest, base broadening and improved compliance might raise something in the order of an additional 2 per cent of GDP. The same study also concluded that scope to raise revenue “by simply raising standard VAT rates is becoming limited, so the potential lies largely in better improving compliance and scaling back preferential treatments” (IMF, 2011, p. 5).
If the distributional impact of such a change in tax policy is not properly addressed, there is the risk of worsening income inequality given the disproportionate weight that consumption taxes place on the bottom income quintiles of society. Contrary to progressive taxes, universal taxes on goods, especially on basic food and household items, are regressive since they do not discriminate between high-income and low-income consumers.
Given the regressive nature of VAT, “scaling back of preferential treatments” must not apply to goods and services that dominate the consumption basket of the poor. Raising VAT or consumption taxes can only be prudent if targeted to the products which are used predominantly by the better-off, such as luxury goods. It is certainly possible to design a VAT system which exempts necessary basic goods many low-income families depend on, while setting higher rates for luxury goods, principally consumed by wealthier families (e.g. luxury cars).
5.2.7 Excise duties and trade taxes
Excise taxes are another important source of revenue in developing countries as they have a buoyant base and can be administered at low cost. Many countries, however, either abolished or reduced excise taxes with the introduction of VAT. But from a revenue perspective, excise duties are more convenient, involving few producers, large sales volumes, relatively inelastic demand and easy observability. Excises may be levied on quantities leaving the factory or arriving at ports, thus simpli-fying measurement and collection, ensuring coverage, limiting evasion and improving monitoring. Excise taxes currently amount to less than 2 per cent of GDP in low-income countries, compared to about 3 per cent in high-income countries.
Tariffs have been a source of development finance for centuries. However, current multilateral and bilateral free trade agreements have significantly limited/reduced tariffs. Indeed, developing coun-tries have steadily reduced tariff rates since the 1990s, implying lower capacity to generate revenues from trade. The financial implications of this trend are likely greater for low-income countries, which sliced tariffs by more than half from 36 to 12 per cent between 1996 and 2010, on average, compared to a 7 per cent average cut in middle-income countries (Figure 5.4). Some countries stood out, with India’s average tariff rate falling from 71 to 13 per cent between 1994 and 2009 and Brazil’s from 51 to 14 per cent between 1987 and 2009 (WTO, 2010).
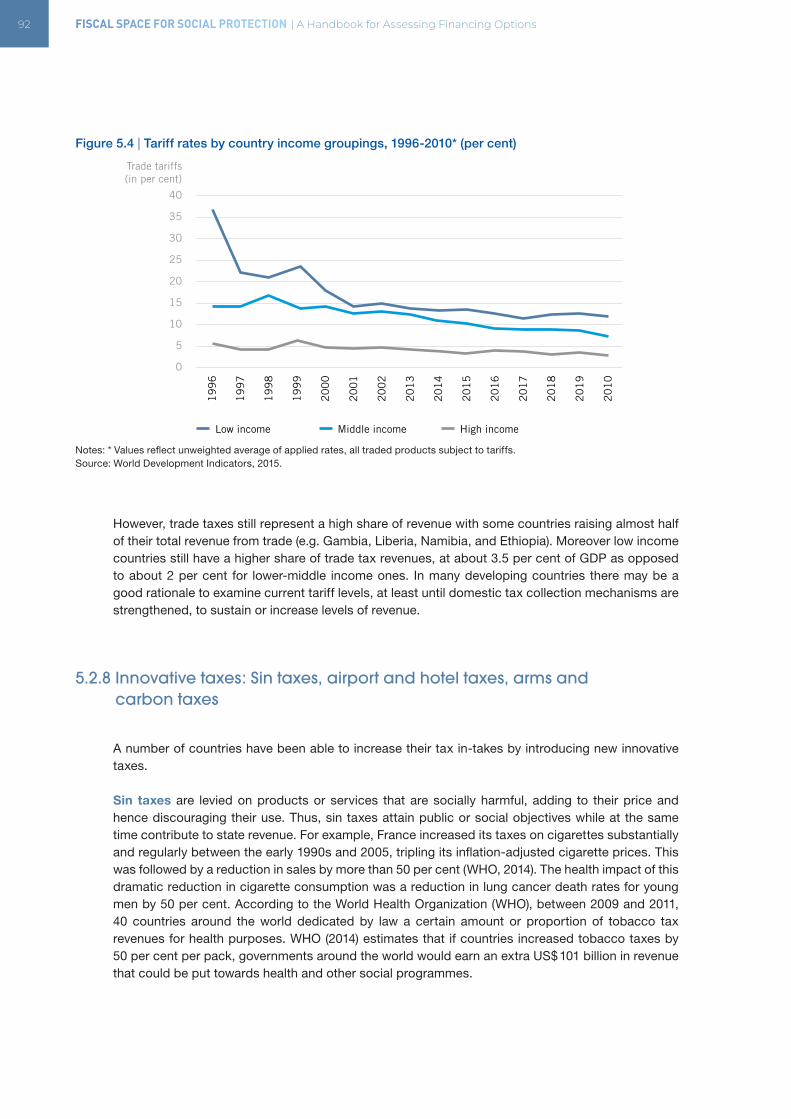
92 FISCAL SPACE FOR SOCIAL PROTECTION | A Handbook for Assessing Financing Options
Figure 5.4 | Tariff rates by country income groupings, 1996-2010* (per cent)
Notes: * Values reflect unweighted average of applied rates, all traded products subject to tariffs.Source: World Development Indicators, 2015.
However, trade taxes still represent a high share of revenue with some countries raising almost half of their total revenue from trade (e.g. Gambia, Liberia, Namibia, and Ethiopia). Moreover low income countries still have a higher share of trade tax revenues, at about 3.5 per cent of GDP as opposed to about 2 per cent for lower-middle income ones. In many developing countries there may be a good rationale to examine current tariff levels, at least until domestic tax collection mechanisms are strengthened, to sustain or increase levels of revenue.
5.2.8 Innovative taxes: Sin taxes, airport and hotel taxes, arms and carbon taxes
A number of countries have been able to increase their tax in-takes by introducing new innovative taxes.
Sin taxes are levied on products or services that are socially harmful, adding to their price and hence discouraging their use. Thus, sin taxes attain public or social objectives while at the same time contribute to state revenue. For example, France increased its taxes on cigarettes substantially and regularly between the early 1990s and 2005, tripling its inflation-adjusted cigarette prices. This was followed by a reduction in sales by more than 50 per cent (WHO, 2014). The health impact of this dramatic reduction in cigarette consumption was a reduction in lung cancer death rates for young men by 50 per cent. According to the World Health Organization (WHO), between 2009 and 2011, 40 countries around the world dedicated by law a certain amount or proportion of tobacco tax revenues for health purposes. WHO (2014) estimates that if countries increased tobacco taxes by 50 per cent per pack, governments around the world would earn an extra US$ 101 billion in revenue that could be put towards health and other social programmes.
Trade tariffs(in per cent)
0
5
10
15
20
25
30
35
401
99
6
Low income
19
97
19
98
19
99
20
00
20
01
20
02
20
13
20
14
20
15
20
16
20
17
20
18
20
19
20
10
Middle income High income
CHAPTER 5 | TAXATION 93
Box 5.7 Tobacco tax in developing countries: Saving lives and raising revenues
Turkey provides a good illustration of the impact of tobacco taxation and other policies on consumption and prevalence. Excise taxes have been steadily increasing since 2008 alongside the implementation of other policies, such as smoking and tobacco advertising bans. This led to a reduction in tobacco sales by 12 per cent between 2008 and 2012 and a reduction in the proportion of tobacco smokers in the adult population from 31.2 per cent to 27.1 per cent, during the same period.
Egypt, increased the tobacco tax by 46 per cent in 2010. This reduced sales by 14 per cent in only two years. The impact on revenues was colossal, increasing by 151 per cent, from 7 billion EGP to 17.6 EGP between 2010 and 2012.
Gambia changed the base for its excise tax on cigarettes from weight to volume in 2012. Evidence shows that basing taxes on weight of tobacco encourages the industry to produce lighter – but not less harmful – cigarettes to pay less taxes. So, in 2013, Gambia also raised the excise on all tobacco products to the same rate. This has the benefit of discouraging consumers from switching to a cheaper product when taxes are increased.
Mexico passed a significant tax increase in 2010 in the face of tobacco industry’s continued attempt to block. The government succeeded due to a well-coordinated campaign by tobacco control advocates. This increased the specific excise tax up from 0.8 to 7 pesos per pack and increased the ad valorem excise tax from 150 per cent to 160 per cent.
The Philippines implemented tobacco and alcohol tax reform in 2012. It also earmarked a signifi-cant part of increased revenues to help finance Universal Health Care (UHC) for the bottom 40 per cent of the population. The tobacco industry opposed the introduction of tobacco tax, but failed due to the support from civil society organizations – the Sin Tax Reform in the Philippines summarizes both the technical and political economy aspects of tobacco and excise tax reforms.
Source: WHO, 2014.
Airline and hotel taxes, taxes on tourism: Many developing countries have recently increased taxes charged at airports or on the sale of airline tickets. As demonstrated in recent IMF country reports, this has been most commonly observed in small island states, like Antigua and Barbuda and the Maldives, as well as in emerging tourist destinations, such as Dubai, Ghana, and Liberia—the latter which increased taxes on airlines and hotels by 3 per cent in the fiscal year 2012. A number of countries have implemented an air ticket solidarity levy that is charged to all passengers taking off from their national airports. In France, for example, this raised €160 million for additional develop-ment assistance in 2009 (Leading Group on Innovating Financing for Development, 2010).
Carbon and arms trade taxes: These innovative sources of finance, taxing products with negative externalities, could deliver billions for social protection. Charging a flat fee for every ton of CO2 emitted could lead to up to US$ 10 billion a year in development financing. A ten per cent tax on the international arms trade could accrue up to US$ 5 billion annually in new development revenue (WHO, 2009).
94 FISCAL SPACE FOR SOCIAL PROTECTION | A Handbook for Assessing Financing Options
5.3 TAX REFORMS
The preceding discussion shows that progress in raising tax revenues can be made – given a strong political will to implement reforms. There are important commonalities in reform strategies for enhancing tax revenues recommended by the IMF and others as listed below:
• Build administrations that effectively limit incentives and opportunities for rent-seeking and inap-propriate behaviour, and are capable of implementing the voluntary compliance needed to extend the tax base, including by risk management (allocating resources where the risks to revenue are greatest) and taxpayer segmentation (tailoring intervention and services to deal with the unique challenges posed by different groups, starting with a large taxpayer office);
• Adopt and make readily available clear laws and regulations embodying strong taxpayer protec-tion as well as forcefully combatting tax evasion– the main problem is often implementation;
• Eliminate exemptions that forego revenue to little public purpose – these are often still substantial and can amount to several points of GDP. Alternatively, limit exemptions to no more than certain number of years and/or compensate any exemption with a measure that would yield the same fiscal effect (either by creating a new source of financing or by reducing expenditures accordingly);
• Avoid tax competition or excessive fiscal concessions to MNCs; conduct thorough cost-benefit analysis of such concessions; establish a broad-based corporate income tax at rates competitive by international standards;
• Implement simple, but coherent regimes for taxing informal enterprises, linked to formalization policies to extend social security as described in chapter 4;
• Extend the personal income tax base, and ensure a coherent treatment of alternative forms of capital income;
• Introduce tax withholding for business and deduction of tax from pay-cheques by employers;
• Implement a broad-based VAT with a fairly high threshold (the turnover level at which registration for the tax becomes compulsory) and measures to off-set regressivity;
• Levy excises on a few key items that are adequate to revenue needs and wider social concerns (e.g. CO2 emissions, cigarettes, alcohol, sugary products, etc.);
• Implement innovative taxes, such as financial transactions tax;
• Strengthen real estate taxes – minimal in many countries, but with potential to transform local government finance in the longer term;
• Develop capacity for tax expenditure and wider policy analysis.
5.3.1 Issues in tax reforms
In considering reforms, a number of important issues need closer and rigorous examination: (i) effi-ciency, (ii) fairness or distributional impact, (iii) compliance, (iv) administrative feasibility and cost.
(i) Efficiency: New taxes or higher tax rates must not affect resource allocation or economic efficiency adversely to any significant extent. Taxes do impose real economic costs, and all coun-tries should seek to minimize such “deadweight losses,” which reduce the resources available to achieve socially desired objectives.
(ii) Fairness or distributional impact: That is, burden of tax should not fall excessively on the poor or low-income households. A standard approach to distributional effects to assess the ‘progres-sivity’ or ‘regressivity’ of a tax. A tax is considered progressive if the tax burden increases as income increases, and regressive if the burden decreases with income. In addition, the gender aspect of distributional impact needs to be considered. The tax system should not put female tax payers at a disadvantage. Box 5.8 provides an overview of potential gender inequalities that may be inherent in the tax system.
CHAPTER 5 | TAXATION 95
Box 5.8 Gender equality and taxation
Interventions in tax policy need to ensure that they do not adversely affect the desired outcomes of sustainable development goals (SDGs), particularly SDG Goal 5.C, aim of which is to achieve gender equality and empower all women and girls. As such mainstreaming a gender perspective into the tax policy can significantly improve the quality of public policy and help eliminate gender biases.
Gender biases can be both explicit and implicit in nature. Explicit gender biases occur when specific provisions of the law, regulations or proceedings treat men and women differently. This can be the case for instance when tax deductions are granted to a male but not to a female taxpayer. In contrast, implicit biases are less obvious and are related to differences in the way the tax system affects men’s and women’s well-being. For instance, countries with a joint filing in personal income tax systems with a progressive rate structure, the low income earner, who tends to be more often the women, is effectively taxed at a higher marginal tax rate. Women s lower income can be explained by discrimination against women in the labour market and partly due to discrimination in educa-tion, while the gender biases in taxation enhances these effects. Even though from a household perspective joint filing results in a financial gain as the combined income is in a lower tax bracket than compared to individual filing, it is not necessarily the case that women have control over these financial gains. The unfavourable taxation of women s income may alter their behaviour with regards to their labour market participation and time spent with child bearing, while at the same time negatively affect their economic welfare in case of a divorce.
Indirect taxes can enhance gender biases due to women’s different consumption patterns. VAT for instance is levied on consumption of goods and services and are regressive in nature as they are applicable to both rich and poor consumers. As a result indirect taxes hurt the poor disproportion-ately, and impacts women in particular as they tend to be poorer than men. Women spend propor-tionately more on household items which attract VAT. This means that a tax policy that primarily focuses on increasing indirect taxes (e.g. VAT) can potentially be more burdensome for women.
On the other side, direct tax exemptions with regards to corporate and personal income tax tends to increase gender inequality as men are more likely to run a business and tend to benefit dispro-portionately from such exemptions. Thus, raising direct taxes’ contribution to overall tax revenues will not only make current tax systems in developing countries more equitable but indirectly also reduce the relative tax burden on women.
Direct taxes on income (personal and corporate), wealth and inheritance are significantly under-utilised and under-enforced, especially in developing countries. This allows owners of wealth and assets to escape taxation and as men tend to own and control more resources, they become the primary beneficiaries.
It is important to carefully evaluate the distributional impact of tax policies vis-à-vis gender perspective. Policy makers need to take into account to what extent tax policies reinforce or break down gender inequalities. Moreover, the design of a tax system may impact both the distribution of income between women and men (distributional effect) as well as the distribution of paid and unpaid work (allocative effect).
Source: Joshi, 2017; GIZ, 2010.
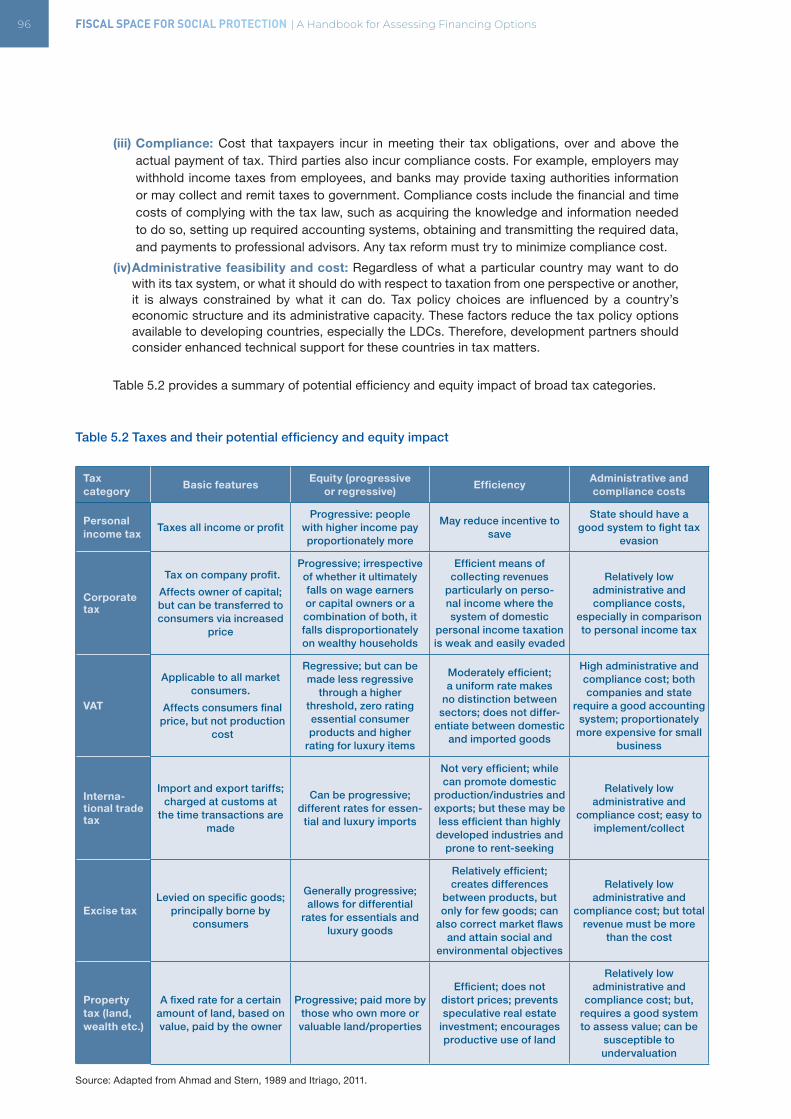
96 FISCAL SPACE FOR SOCIAL PROTECTION | A Handbook for Assessing Financing Options
(iii) Compliance: Cost that taxpayers incur in meeting their tax obligations, over and above the actual payment of tax. Third parties also incur compliance costs. For example, employers may withhold income taxes from employees, and banks may provide taxing authorities information or may collect and remit taxes to government. Compliance costs include the financial and time costs of complying with the tax law, such as acquiring the knowledge and information needed to do so, setting up required accounting systems, obtaining and transmitting the required data, and payments to professional advisors. Any tax reform must try to minimize compliance cost.
(iv) Administrative feasibility and cost: Regardless of what a particular country may want to do with its tax system, or what it should do with respect to taxation from one perspective or another, it is always constrained by what it can do. Tax policy choices are influenced by a country’s economic structure and its administrative capacity. These factors reduce the tax policy options available to developing countries, especially the LDCs. Therefore, development partners should consider enhanced technical support for these countries in tax matters.
Table 5.2 provides a summary of potential efficiency and equity impact of broad tax categories.
Table 5.2 Taxes and their potential efficiency and equity impact
Tax category
Basic featuresEquity (progressive
or regressive)Efficiency
Administrative and compliance costs
Personal income tax
Taxes all income or profit Progressive: people
with higher income pay proportionately more
May reduce incentive to save
State should have a good system to fight tax
evasion
Corporate tax
Tax on company profit.
Affects owner of capital; but can be transferred to consumers via increased
price
Progressive; irrespective of whether it ultimately falls on wage earners or capital owners or a combination of both, it falls disproportionately on wealthy households
Efficient means of collecting revenues
particularly on perso- nal income where the system of domestic
personal income taxation is weak and easily evaded
Relatively low administrative and compliance costs,
especially in comparison to personal income tax
VAT
Applicable to all market consumers.
Affects consumers final price, but not production
cost
Regressive; but can be made less regressive
through a higher threshold, zero rating essential consumer products and higher
rating for luxury items
Moderately efficient; a uniform rate makes
no distinction between sectors; does not differ-
entiate between domestic and imported goods
High administrative and compliance cost; both companies and state
require a good accounting system; proportionately
more expensive for small business
Interna-tional trade tax
Import and export tariffs; charged at customs at
the time transactions are made
Can be progressive; different rates for essen-
tial and luxury imports
Not very efficient; while can promote domestic
production/industries and exports; but these may be less efficient than highly developed industries and
prone to rent-seeking
Relatively low administrative and
compliance cost; easy to implement/collect
Excise taxLevied on specific goods;
principally borne by consumers
Generally progressive; allows for differential
rates for essentials and luxury goods
Relatively efficient; creates differences
between products, but only for few goods; can
also correct market flaws and attain social and
environmental objectives
Relatively low administrative and
compliance cost; but total revenue must be more
than the cost
Property tax (land, wealth etc.)
A fixed rate for a certain amount of land, based on value, paid by the owner
Progressive; paid more by those who own more or valuable land/properties
Efficient; does not distort prices; prevents speculative real estate
investment; encourages productive use of land
Relatively low administrative and
compliance cost; but, requires a good system to assess value; can be
susceptible to undervaluation
Source: Adapted from Ahmad and Stern, 1989 and Itriago, 2011.
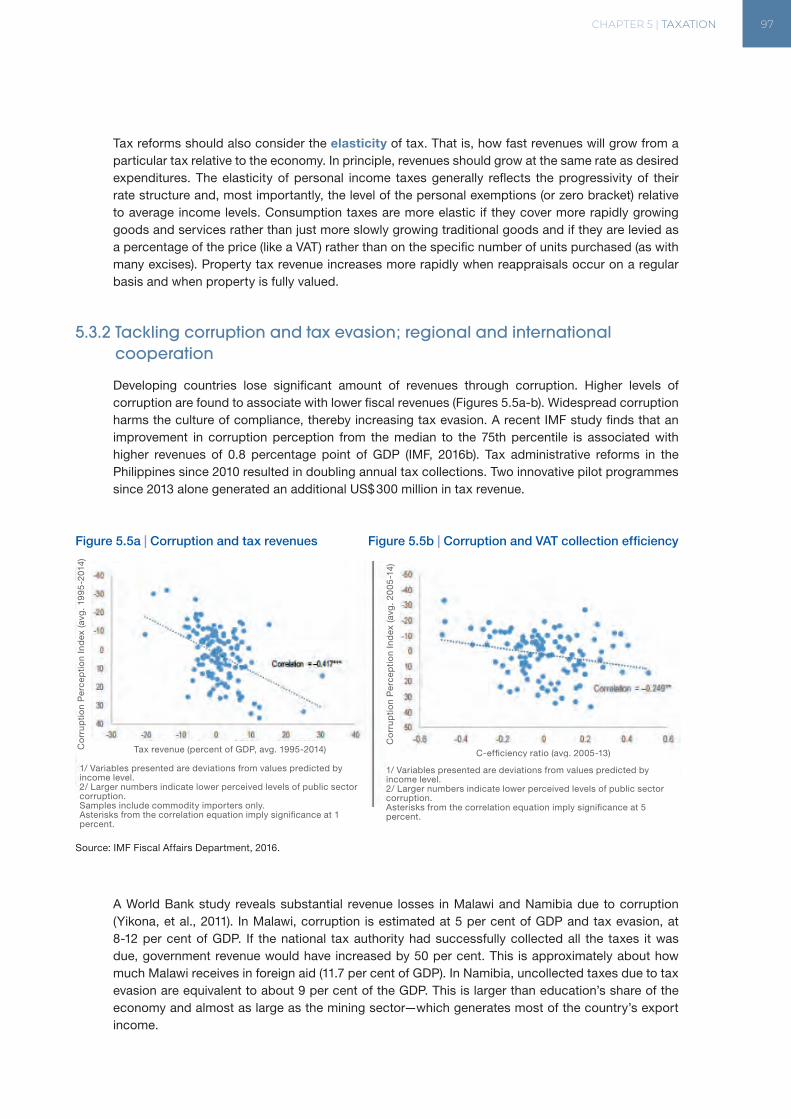
CHAPTER 5 | TAXATION 97
Tax reforms should also consider the elasticity of tax. That is, how fast revenues will grow from a particular tax relative to the economy. In principle, revenues should grow at the same rate as desired expenditures. The elasticity of personal income taxes generally reflects the progressivity of their rate structure and, most importantly, the level of the personal exemptions (or zero bracket) relative to average income levels. Consumption taxes are more elastic if they cover more rapidly growing goods and services rather than just more slowly growing traditional goods and if they are levied as a percentage of the price (like a VAT) rather than on the specific number of units purchased (as with many excises). Property tax revenue increases more rapidly when reappraisals occur on a regular basis and when property is fully valued.
5.3.2 Tackling corruption and tax evasion; regional and international cooperation
Developing countries lose significant amount of revenues through corruption. Higher levels of corruption are found to associate with lower fiscal revenues (Figures 5.5a-b). Widespread corruption harms the culture of compliance, thereby increasing tax evasion. A recent IMF study finds that an improvement in corruption perception from the median to the 75th percentile is associated with higher revenues of 0.8 percentage point of GDP (IMF, 2016b). Tax administrative reforms in the Philippines since 2010 resulted in doubling annual tax collections. Two innovative pilot programmes since 2013 alone generated an additional US$ 300 million in tax revenue.
Figure 5.5a | Corruption and tax revenues Figure 5.5b | Corruption and VAT collection efficiency
Source: IMF Fiscal Affairs Department, 2016.
A World Bank study reveals substantial revenue losses in Malawi and Namibia due to corruption (Yikona, et al., 2011). In Malawi, corruption is estimated at 5 per cent of GDP and tax evasion, at 8-12 per cent of GDP. If the national tax authority had successfully collected all the taxes it was due, government revenue would have increased by 50 per cent. This is approximately about how much Malawi receives in foreign aid (11.7 per cent of GDP). In Namibia, uncollected taxes due to tax evasion are equivalent to about 9 per cent of the GDP. This is larger than education’s share of the economy and almost as large as the mining sector—which generates most of the country’s export income.
Co
rru
pti
on
Per
cep
tio
n In
dex
(avg
. 19
95
-201
4)
Co
rru
pti
on
Per
cep
tio
n In
dex
(avg
. 20
05
-14)
Tax revenue (percent of GDP, avg. 1995-2014) C-efficiency ratio (avg. 2005-13)
1/ Variables presented are deviations from values predicted by income level.2/ Larger numbers indicate lower perceived levels of public sector corruption.Samples include commodity importers only.Asterisks from the correlation equation imply significance at 1 percent.
1/ Variables presented are deviations from values predicted by income level.2/ Larger numbers indicate lower perceived levels of public sector corruption.Asterisks from the correlation equation imply significance at 5 percent.
98 FISCAL SPACE FOR SOCIAL PROTECTION | A Handbook for Assessing Financing Options
Regional and international tax cooperation is vital for stemming tax competition, tax evasion and transfer of funds through transfer mispricing or use of tax havens. The issue is discussed in greater detail in chapter 6. Tax cooperation is also needed for sharing best practices and building capacity.
5.3.3 General taxation or earmarked taxes?
One issue that usually arises in fiscal reform debates is whether taxes should be earmarked or not. According to Buchanan (1963, p. 457), earmarking is “the practice of designating or dedicating specific revenues to the financing of specific public services”. Examples of earmarked revenues are the tobacco, alcohol and fast-food taxes to finance healthcare services and gasoline taxes for road constructions.
Several arguments exist in favor or against earmarked taxation. Arguments in favor state that earmarked taxes increase and stabilize resources for a specific sector, avoiding in that sense uncer-tainty that may come from political decisions and the pressures from other competing sectors (WHO, 2004). It is also argued that earmarking is a healthy fiscal practice because the new spending has its own source of funding.
However, there is also a series of arguments against the use of earmarking. First, earmarking erodes budget flexibility and therefore the possibility to re-allocate resources according to country needs and electoral promises. The approval of this type of legislation creates a permanent destination that is difficult to modify even if the nation’s circumstances are different and there is a need to finance other problems. Second, Teja (1988) argues that some authors criticize earmarking because its negative effects on budgetary efficiency: pre-defining the destination of a tax may not necessarily mean that the allocation of those funds will go to the most cost-effective sector.
5.4 CONCLUDING REMARKS
Increasing tax compliance and/or raising tax rates are important strategies to expand fiscal space for social protection. Countries can create/improve the following taxes: Income taxes, corporate taxes, including taxes on the financial sector, property and inheritance taxes, taxing natural resource extraction, innovative taxes (sin taxes, airport and hotel taxes, arms and carbon taxes), tariffs (imports/exports), consumption and value added taxes (VAT).
There is a positive association between income levels and tax-GDP ratios. Tax policy choices are influenced by political will, a country’s economic structure and its administrative capacity. Developing countries need to develop and implement effective and efficient tax systems, ensuring progressivity of it, for creating fiscal space needed to meet growing demand for public services, including social protection.
Equity, gender balance, efficiency, and administrative feasibility are key criteria in designing and evaluating tax systems. Countries face significant problems in tax policy due to globalization and other factors, such as illicit financial flows. Global and regional tax cooperation is needed to deal with these problems effectively.
CHAPTER 5 | TAXATION 99
5.5 KEY DOCUMENTS AND DATA SOURCES
Ahmad, E.; Stern, N. 1989. “Taxation for Developing Countries”, in H. Chenery and T.N. Srinivasan (eds): Handbook of Development Economics, Vol. II (Elsevier).
A very comprehensive survey of relevant issues. It examines the sources of government revenue in different countries, including which taxes are used and how much they provide, and the incidence of taxation on different groups. It also discusses the administrative problems with enforcement and evasion which often lie behind the choice of taxes and exercise strong influences on the revenue they raise.
Bastagli, F. 2016. Bringing taxation into social protection analysis and planning:Guidance note (London: Overseas Development Institute).
This Guidance Note provides an instrument, addressed primarily to social protection analysts and practitioners, to promote efforts to bring taxation into social protection analysis and planning.
Besley, T.; Persson, T. 2014. “Why Do Developing Countries Tax So Little?”, in Journal of Economic Perspectives, Vol. 28, No. 4, pp. 99–120.
Provides a historical context of tax in-takes in relation to level of development and discusses various socio-cultural-political and economic factors that may explain low tax-GDP ratio in developing coun-tries. The paper is presented in a non-technical manner.
EPS-PEAKS.2013. Taxation and Developing Countries Training Notes (London, Overseas Devel-opment Institute). A non-technical training guide on taxation in developing countries. It contains summaries of a number of major IMF and other studies on tax issues, including natural resource rents, in developing countries. It also presents a summary of tax performance and incidence in developing countries, trade policy reform and its impact on tax revenues, fiscal policy and inequality, tax, industrial policy and investment, and G8/G20 discussions on tax.
Itriago, D. 2011. Owning Development: Taxation to fight poverty, Oxfam Research Report (Oxford, Oxfam).
This report focuses on tax policy in developing countries: who pays tax, what taxes are paid, and how. It shows that a lot can be done to increase the amount of revenue poor countries get from tax, and that this can be done in a way that tackles inequality, making sure the richest bear the biggest burden. In the 52 developing countries analysed in this report, it finds that significantly improving the collection of tax could potentially raise an additional US$ 269bn dollars.
IMF. 2012. “Fiscal Regimes for Extractive Industries: Design and Implementation” IMF Fiscal Affairs Department (Washington DC, IMF).
This paper suggests ways how better to realize the revenue potential of extractive industries (EI—oil, gas, and mining), particularly in developing countries. This has become an increasingly important topic of IMF policy advice and technical assistance (TA), with recent discoveries in many developing countries lending it a new urgency. The paper sets out the analytical framework underpinning, and key elements of, the country-specific advice given.
100 FISCAL SPACE FOR SOCIAL PROTECTION | A Handbook for Assessing Financing Options
Data sources
Government revenue statistics are available from:
• Ministry of Finance, National Budget documents
• IMF, Government Finance Statistics
• International Centre for Tax and Development; http://www.ictd.ac/dataset; increasingly recog-nized as the best possible source of cross-country revenue data for researchers. An important motivation was the concern about the quality and transparency of data available from the IMF: Publicly available data had significant limitations, while the private data used in much IMF research was not available to other researchers, and appeared to contain significant errors.
• IMF’s World Revenue Longitudinal Dataset (WoRLD); http://data.imf.org/revenues
• IMF has recently developed a Template, based on the revenue classification of the GFSM 2014, to collect data on government revenues from natural resources. https://www.imf.org/external/pubs/ft/qna/pdf/na.pdf; https://www.imf.org/external/pubs/ft/gfs/manual/pdf/templatedata.pdf
• ActionAid Tax Treaties Dataset; http://www.ictd.ac/datasets/action-aid-tax-treaties-datasets; includes more than 500 treaties that low- and lower-middle income countries in sub-Saharan Africa and Asia have signed since 1970. It shows how lower-income countries and wealthier countries divide up the right to tax multinational corporations between each other.
Learning accomplishments
After reading this chapter, a reader should have a good grasp of:
• Types of taxes and typical facts about taxation, including their determinants
• Challenges and scope for expanding taxation revenues in developing countries
• Various concepts related to taxation reforms, such as efficiency, fairness, feasibility, and administrative cost
• Understand the gender dimension and distributional impact of taxation system
• Key documents and data sources
CHAPITRE 6 | ILLICIT FINANCIAL FLOWS AND CORRUPTION 101
CHAPTER 6. ILLICIT FINANCIAL FLOWS AND CORRUPTION
LEARNING OBJECTIVES
• Understand what illicit financial flows are and their links with corruption, tax evasion and crime
• Appreciate the extent of illicit financial flows and their impact on development
• Identify what countries can do to stem illicit financial flows and the role of international cooperation frameworks
• Appreciate the challenges and trade-offs in stemming illicit financial flows
• Know about key resources and data sources
CONTENTS
• What are illicit financial flows
• Extent of illicit financial flows
• Measures to combat illicit financial flows
• International framework to combat illicit financial flows
• Trade-offs and conflicts in stemming illicit financial flows
This chapter examines the challenges involved in tackling illicit financial flows (IFFs). In particular, it discusses what individual countries can do to stop IFFs or to recover stolen assets (section 6.2) and provides an overview of available international frameworks for combating IFFs (section 6.3). It also reflects on some of the challenges involved and policy implications in dealing with this important source of potential fiscal space (section 6.4). It begins with highlighting rationales for this fiscal space option.
102 FISCAL SPACE FOR SOCIAL PROTECTION | A Handbook for Assessing Financing Options
6.1 WHAT ARE ILLICIT FINANCIAL FLOWS?
There are various definitions of IFFs, but essentially they are generated by methods, practices and crimes aiming to transfer financial capital out of a country in contravention of national or international laws. Current literature on this issue suggests that IFFs generally involve the following practices: money laundering, bribery by international companies, tax evasion, and trade mispricing (OECD, 2014a; OECD, 2014b).
In short, IFFs are illegal, including all cross-border financial transfers that contravene national or international laws. This is a wide category that encompasses several different types of financial transfers, made for different of reasons. It can include:
• Funds with criminal origin, such as the proceeds of crime;
• Funds with a criminal destination, such as bribery, terrorist financing or conflict financing;
• Funds associated with tax evasion;
• Funds related to trade mis-invoicing and mis-pricing;
• Transfers to, by, or for, entities subject to financial sanctions; and
• Transfers which seek to evade anti-money laundering /counter-terrorist financing measures or other legal requirements (such as transparency or capital controls).
In practice, IFFs range from something as simple as a private individual transfer of funds into private accounts abroad without having paid taxes, to highly complex schemes involving criminal networks that set up multi-layered multi-jurisdictional structures to hide ownership.
6.2 WHY COMBAT ILLICIT FINANCIAL FLOWS AND CORRUPTION?
The Addis Ababa Action Agenda on Financing for Development explicitly committed to combatting IFFs (paras 18, 23, 24, and 25). Global Financial Integrity (GFI) found that developing and emerging market economies lost US$ 7.8 trillion in illicit financial flows from 2004 through 2013, with illicit outflows increasing at an average of 6.5 per cent per year in real terms — nearly twice as fast as global GDP (Kar and Spanjers, 2015, p. vii). Thus, stemming IFFs and fighting corruption can be a significant source of fiscal space for financing socio-economic development.
IFFs involve wealth that is illegally earned (e.g. through corruption) and funnelled to offshore accounts to evade income taxes and unreported movements of cash; funds transferred through trade mis-invoicing (eg. import under-invoicing to avoid higher tariffs and export over- invoicing to take advantage of export subsidies); and shifting of profits by multinational corporations (MNCs) through transfer mis-pricing of transactions with shadow entities incorporated in low tax jurisdictions or tax havens (Box 6.1). In short, IFFs relate to activities, such as trans-ferring funds abroad without paying taxes, as well as complex schemes involving sophisticated corporate structures and organized criminal groups. IFFs always break laws in their generation, utilization, or transference.
Illicit Financial Flows (IFFs) generally involve money laundering, bribery by interna-tional companies, tax evasion and trade mispricing – stemming IFFs and fighting corruption can be a significant source of fiscal space for socio-economic develop-ment.
CHAPITRE 6 | ILLICIT FINANCIAL FLOWS AND CORRUPTION 103
Corruption is estimated at more than 5 per cent of global GDP (US$ 2.6 trillion) according to the World Economic Forum (cited in OECD, 2014b, p. 2). The African Union estimates that 25 per cent of the GDP of African states, amounting to US$ 148 billion, is lost to corruption every year; yet the problem is pervasive worldwide, including in higher income countries. Despite some efforts to return assets stolen by corrupt officials and moved to offshore accounts, only US$ 147.2 million was returned by OECD members between 2010 and June 2012, and US$ 276.3 million between 2006 and 2009, a fraction of the US$ 20–40 billion estimated to have been stolen each year (Gray, et al., 2014, p.2). Strengthening transparency and good governance practices, as well as fighting illicit financial flows can increase the availability of resources for social and economic development.16
Governments also lose a large amount of tax revenue as the MNCs shift their profits through transfer mis-pricing to low tax jurisdictions or tax havens. Esti-mates suggest that total lost revenues due to transfer mis-pricing could amount to US$ 50 billion per year among developing countries (Cobham, 2005, p. 10). The Economic Commission for Africa of the United Nations (ECA) estimated that between 2001 and 2010 African countries lost up to US$ 407 billion from trade mispricing alone (African Union and Economic Commission for Africa, 2015). The Kenyan Revenue Authority successfully negotiated a transfer pricing adjustment, resulting in additional tax revenue of US$ 12.9 million (World Bank, 2016, p. 8). Recent UNCTAD estimates show that tax losses due to profit shifting represent around a third of the poten-tial total – or towards half of current MNC corporate income taxes. Adding up both lost tax revenues and the reinvested earnings that are lost as profits are shifted away from the developing country yields a total ‘development finance loss’ in the range of US$ 250 – US$ 300 billion (UNCTAD, 2015, chapter 5 and annexes). Proposals have been put forward to increase the transparency of MNCs and hold them accountable for their tax obligations, such as reporting profits, losses and taxes paid in each location where the company does business.
In many countries the volume of IFFs due to corruption, money laundering, tax evasion and avoidance exceeds the inflows of aid and foreign direct investment. Additionally, for every dollar of development assistance received by developing countries, more than ten dollars disappear from these coun-tries through unrecorded outflows (Global Financial Integrity, 2015, p.3). Thus, IFFs have pervasive effects on developing countries’ social and economic development (Box 6.1). The combination of IFFs and offshore tax havens benefits the rich and harms the middle class and poor, and hence drives inequality.
Therefore, countries committed at the Addis Ababa Action Agenda to “measures to combat corrup-tion and curb illicit financial flows” (para. 18), and to “redouble efforts to substantially reduce IFFs by 2030, with a view to eventually eliminating them, including by combating tax evasion and corruption through strengthened national regulation and increased international cooperation” (para 23). They also urged to update and ratify “regional conventions against corruption” and expressed determina-tion to “strive to eliminate safe havens that create incentives for transfer abroad of stolen assets and illicit financial flows” (para 25). The resolve of the countries in dealing with the issue is also reflected in the explicit goal (16.4) of the Agenda 2030 for sustainable development.
16 Specific strategies to address corruption are widely documented by international agencies and development partners, such as the United Nations, Transparency International and the World Bank.
Illicit outflows accounted for nearly 82 per cent of all net resource transfers from devel-oping countries. Developing countries lost US$13.4 trillion dollars through broad leak-ages in the balance of payments and trade mis-invoicing, while residents of developing countries held US$4.4 trillion in assets in tax havens —truly staggering amounts that, if adequately taxed, could be used for devel-opment with jobs and social protection.
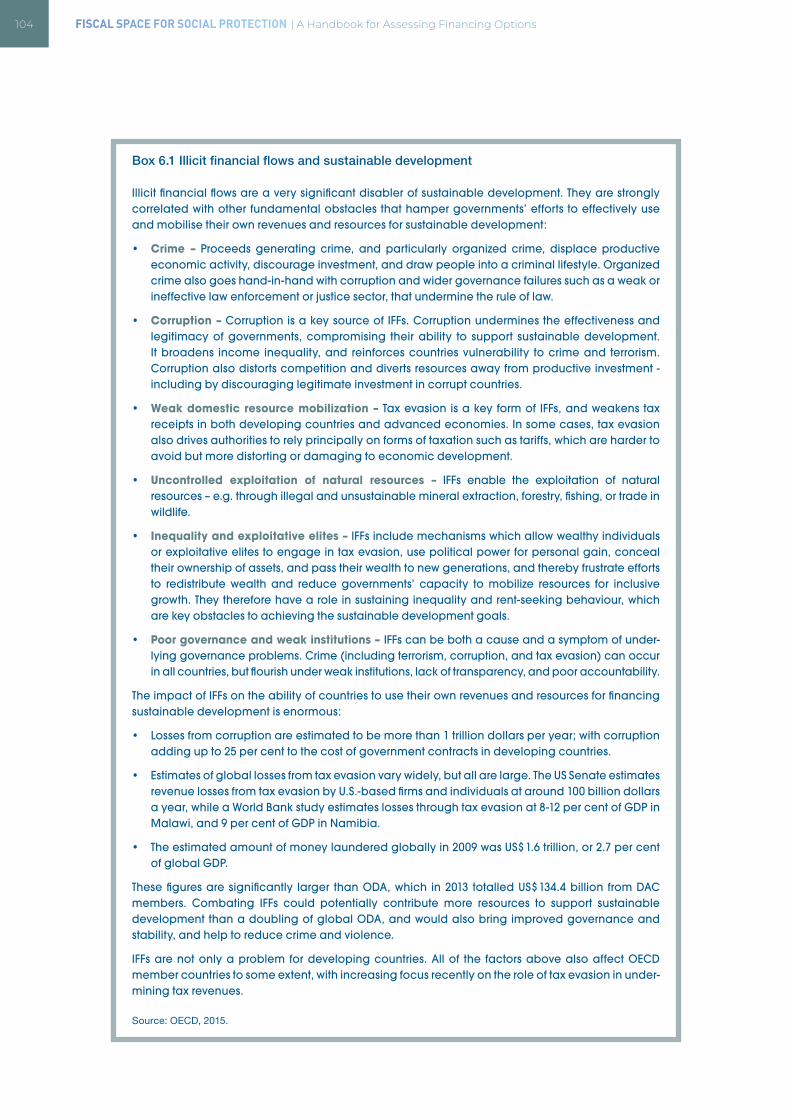
104 FISCAL SPACE FOR SOCIAL PROTECTION | A Handbook for Assessing Financing Options
Box 6.1 Illicit financial flows and sustainable development
Illicit financial flows are a very significant disabler of sustainable development. They are strongly correlated with other fundamental obstacles that hamper governments’ efforts to effectively use and mobilise their own revenues and resources for sustainable development:
• Crime – Proceeds generating crime, and particularly organized crime, displace productive economic activity, discourage investment, and draw people into a criminal lifestyle. Organized crime also goes hand-in-hand with corruption and wider governance failures such as a weak or ineffective law enforcement or justice sector, that undermine the rule of law.
• Corruption – Corruption is a key source of IFFs. Corruption undermines the effectiveness and legitimacy of governments, compromising their ability to support sustainable development. It broadens income inequality, and reinforces countries vulnerability to crime and terrorism. Corruption also distorts competition and diverts resources away from productive investment - including by discouraging legitimate investment in corrupt countries.
• Weak domestic resource mobilization – Tax evasion is a key form of IFFs, and weakens tax receipts in both developing countries and advanced economies. In some cases, tax evasion also drives authorities to rely principally on forms of taxation such as tariffs, which are harder to avoid but more distorting or damaging to economic development.
• Uncontrolled exploitation of natural resources – IFFs enable the exploitation of natural resources – e.g. through illegal and unsustainable mineral extraction, forestry, fishing, or trade in wildlife.
• Inequality and exploitative elites – IFFs include mechanisms which allow wealthy individuals or exploitative elites to engage in tax evasion, use political power for personal gain, conceal their ownership of assets, and pass their wealth to new generations, and thereby frustrate efforts to redistribute wealth and reduce governments’ capacity to mobilize resources for inclusive growth. They therefore have a role in sustaining inequality and rent-seeking behaviour, which are key obstacles to achieving the sustainable development goals.
• Poor governance and weak institutions – IFFs can be both a cause and a symptom of under-lying governance problems. Crime (including terrorism, corruption, and tax evasion) can occur in all countries, but flourish under weak institutions, lack of transparency, and poor accountability.
The impact of IFFs on the ability of countries to use their own revenues and resources for financing sustainable development is enormous:
• Losses from corruption are estimated to be more than 1 trillion dollars per year; with corruption adding up to 25 per cent to the cost of government contracts in developing countries.
• Estimates of global losses from tax evasion vary widely, but all are large. The US Senate estimates revenue losses from tax evasion by U.S.-based firms and individuals at around 100 billion dollars a year, while a World Bank study estimates losses through tax evasion at 8-12 per cent of GDP in Malawi, and 9 per cent of GDP in Namibia.
• The estimated amount of money laundered globally in 2009 was US$ 1.6 trillion, or 2.7 per cent of global GDP.
These figures are significantly larger than ODA, which in 2013 totalled US$ 134.4 billion from DAC members. Combating IFFs could potentially contribute more resources to support sustainable development than a doubling of global ODA, and would also bring improved governance and stability, and help to reduce crime and violence.
IFFs are not only a problem for developing countries. All of the factors above also affect OECD member countries to some extent, with increasing focus recently on the role of tax evasion in under-mining tax revenues.
Source: OECD, 2015.
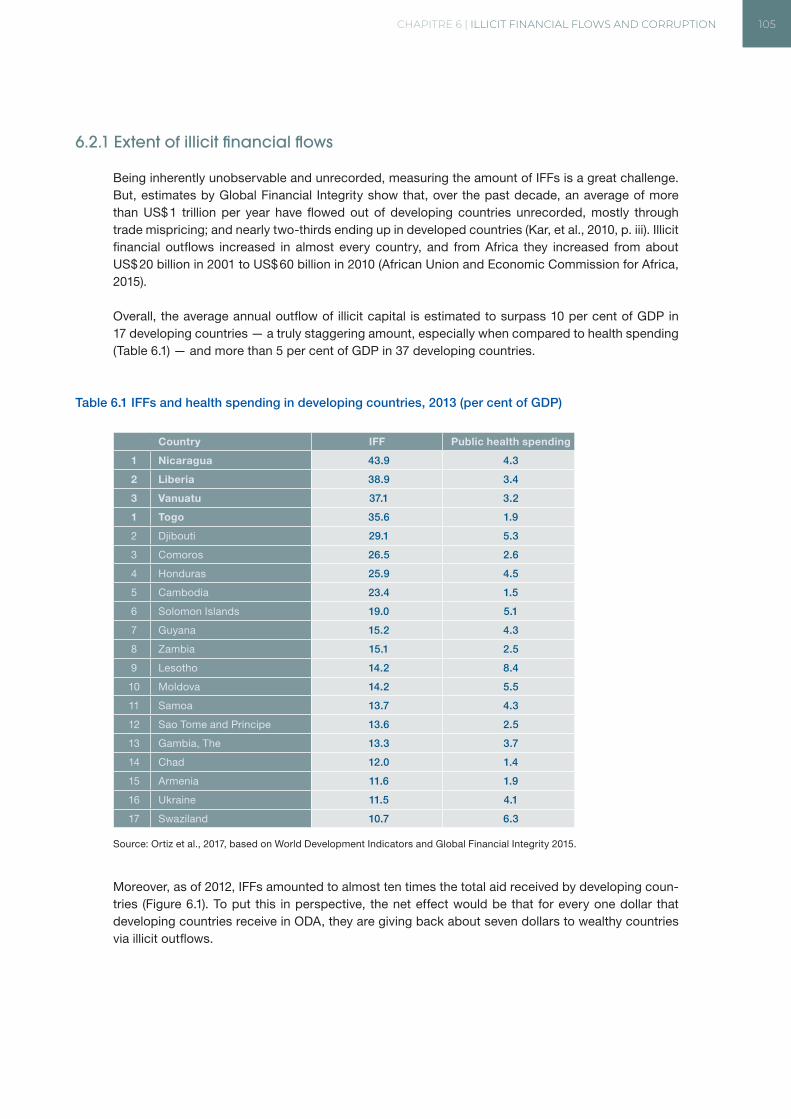
CHAPITRE 6 | ILLICIT FINANCIAL FLOWS AND CORRUPTION 105
6.2.1 Extent of illicit financial flows
Being inherently unobservable and unrecorded, measuring the amount of IFFs is a great challenge. But, estimates by Global Financial Integrity show that, over the past decade, an average of more than US$ 1 trillion per year have flowed out of developing countries unrecorded, mostly through trade mispricing; and nearly two-thirds ending up in developed countries (Kar, et al., 2010, p. iii). Illicit financial outflows increased in almost every country, and from Africa they increased from about US$ 20 billion in 2001 to US$ 60 billion in 2010 (African Union and Economic Commission for Africa, 2015).
Overall, the average annual outflow of illicit capital is estimated to surpass 10 per cent of GDP in 17 developing countries — a truly staggering amount, especially when compared to health spending (Table 6.1) — and more than 5 per cent of GDP in 37 developing countries.
Table 6.1 IFFs and health spending in developing countries, 2013 (per cent of GDP)
Country IFF Public health spending
1 Nicaragua 43.9 4.3
2 Liberia 38.9 3.4
3 Vanuatu 37.1 3.2
1 Togo 35.6 1.9
2 Djibouti 29.1 5.3
3 Comoros 26.5 2.6
4 Honduras 25.9 4.5
5 Cambodia 23.4 1.5
6 Solomon Islands 19.0 5.1
7 Guyana 15.2 4.3
8 Zambia 15.1 2.5
9 Lesotho 14.2 8.4
10 Moldova 14.2 5.5
11 Samoa 13.7 4.3
12 Sao Tome and Principe 13.6 2.5
13 Gambia, The 13.3 3.7
14 Chad 12.0 1.4
15 Armenia 11.6 1.9
16 Ukraine 11.5 4.1
17 Swaziland 10.7 6.3
Source: Ortiz et al., 2017, based on World Development Indicators and Global Financial Integrity 2015.
Moreover, as of 2012, IFFs amounted to almost ten times the total aid received by developing coun-tries (Figure 6.1). To put this in perspective, the net effect would be that for every one dollar that developing countries receive in ODA, they are giving back about seven dollars to wealthy countries via illicit outflows.
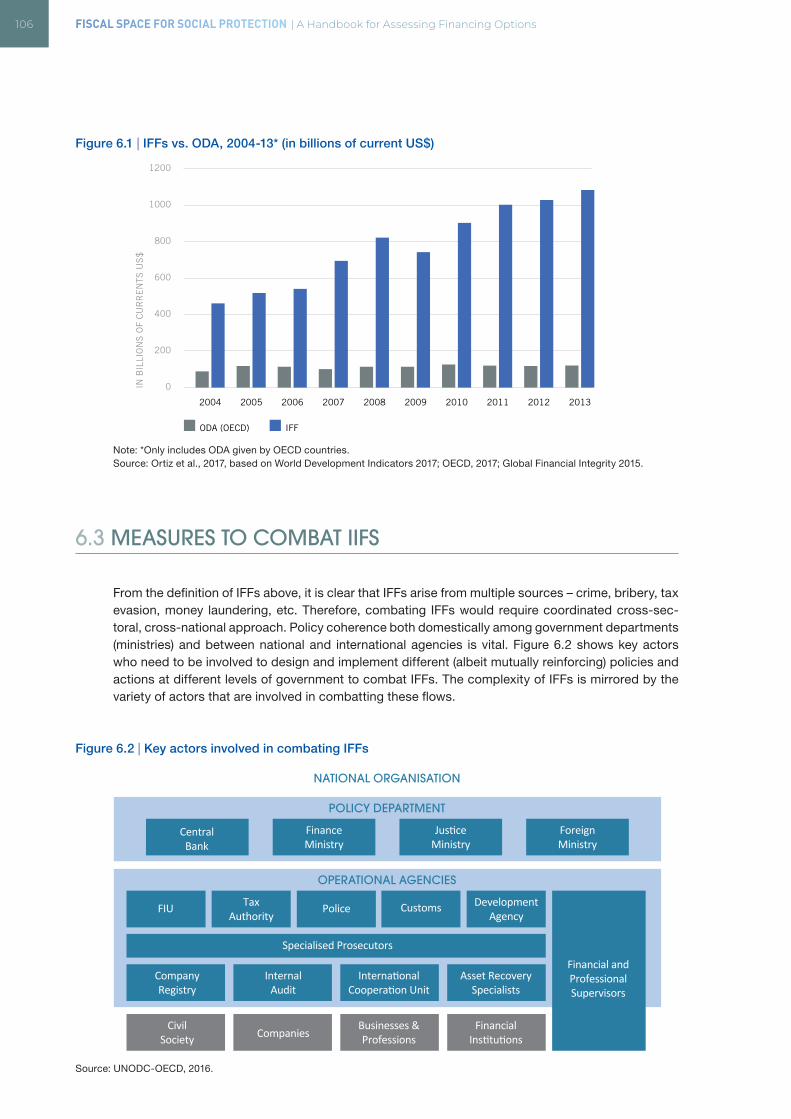
106 FISCAL SPACE FOR SOCIAL PROTECTION | A Handbook for Assessing Financing Options
Figure 6.1 | IFFs vs. ODA, 2004-13* (in billions of current US$)
Note: *Only includes ODA given by OECD countries.Source: Ortiz et al., 2017, based on World Development Indicators 2017; OECD, 2017; Global Financial Integrity 2015.
6.3 MEASURES TO COMBAT IIFS
From the definition of IFFs above, it is clear that IFFs arise from multiple sources – crime, bribery, tax evasion, money laundering, etc. Therefore, combating IFFs would require coordinated cross-sec-toral, cross-national approach. Policy coherence both domestically among government departments (ministries) and between national and international agencies is vital. Figure 6.2 shows key actors who need to be involved to design and implement different (albeit mutually reinforcing) policies and actions at different levels of government to combat IFFs. The complexity of IFFs is mirrored by the variety of actors that are involved in combatting these flows.
Figure 6.2 | Key actors involved in combating IFFs
Source: UNODC-OECD, 2016.
IN B
ILLI
ON
S O
F C
UR
RE
NTS
US
$
0
200
400
600
800
1000
1200
ODA (OECD) IFF
2004 2005 2006 2007 2008 2009 2010 2011 2012 2013
POLICY DEPARTMENT
NATIONAL ORGANISATION
OPERATIONAL AGENCIES
CentralBank
FinanceMinistry
JusticeMinistry
FIU
Specialised Prosecutors
TaxAuthority
Customs DevelopmentAgency
Asset RecoverySpecialists
InternationalCooperation Unit
InternalAudit
CompanyRegistry
FinancialInstitutions
Businesses &ProfessionsCompanies
CivilSociety
Police
ForeignMinistry
Financial andProfessionalSupervisors
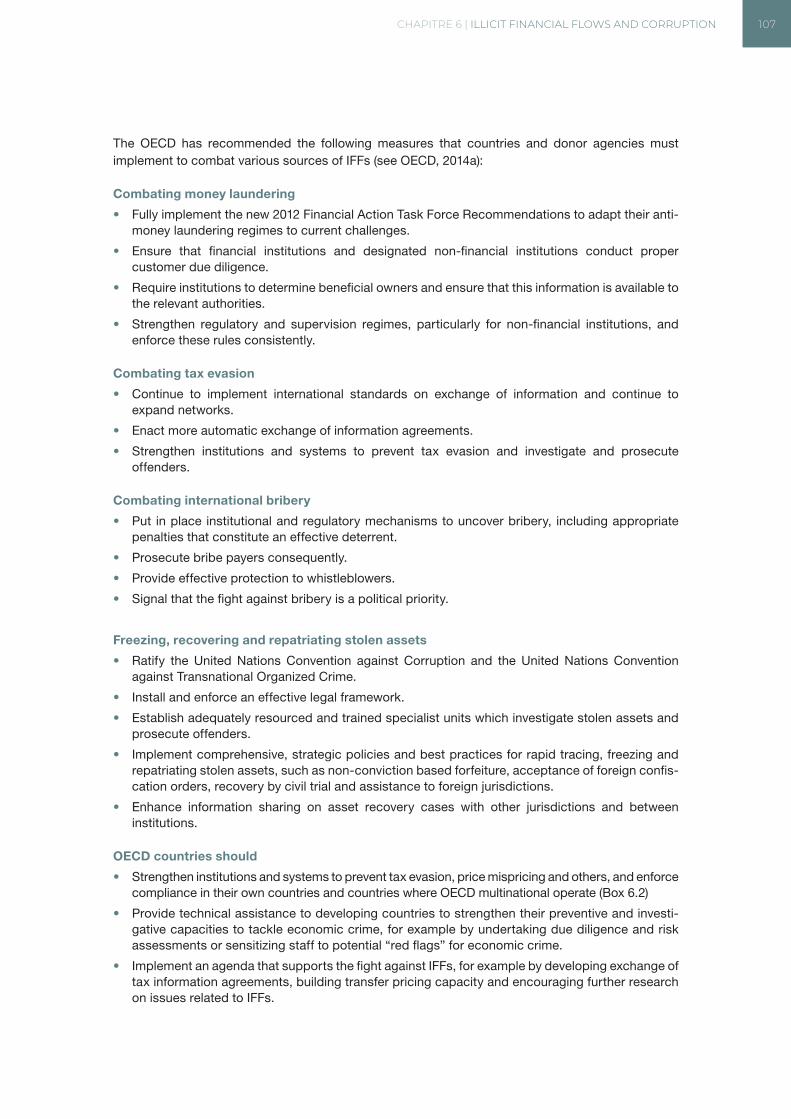
CHAPITRE 6 | ILLICIT FINANCIAL FLOWS AND CORRUPTION 107
The OECD has recommended the following measures that countries and donor agencies must implement to combat various sources of IFFs (see OECD, 2014a):
Combating money laundering
• Fully implement the new 2012 Financial Action Task Force Recommendations to adapt their anti-money laundering regimes to current challenges.
• Ensure that financial institutions and designated non-financial institutions conduct proper customer due diligence.
• Require institutions to determine beneficial owners and ensure that this information is available to the relevant authorities.
• Strengthen regulatory and supervision regimes, particularly for non-financial institutions, and enforce these rules consistently.
Combating tax evasion
• Continue to implement international standards on exchange of information and continue to expand networks.
• Enact more automatic exchange of information agreements.
• Strengthen institutions and systems to prevent tax evasion and investigate and prosecute offenders.
Combating international bribery
• Put in place institutional and regulatory mechanisms to uncover bribery, including appropriate penalties that constitute an effective deterrent.
• Prosecute bribe payers consequently.
• Provide effective protection to whistleblowers.
• Signal that the fight against bribery is a political priority.
Freezing, recovering and repatriating stolen assets
• Ratify the United Nations Convention against Corruption and the United Nations Convention against Transnational Organized Crime.
• Install and enforce an effective legal framework.
• Establish adequately resourced and trained specialist units which investigate stolen assets and prosecute offenders.
• Implement comprehensive, strategic policies and best practices for rapid tracing, freezing and repatriating stolen assets, such as non-conviction based forfeiture, acceptance of foreign confis-cation orders, recovery by civil trial and assistance to foreign jurisdictions.
• Enhance information sharing on asset recovery cases with other jurisdictions and between institutions.
OECD countries should
• Strengthen institutions and systems to prevent tax evasion, price mispricing and others, and enforce compliance in their own countries and countries where OECD multinational operate (Box 6.2)
• Provide technical assistance to developing countries to strengthen their preventive and investi-gative capacities to tackle economic crime, for example by undertaking due diligence and risk assessments or sensitizing staff to potential “red flags” for economic crime.
• Implement an agenda that supports the fight against IFFs, for example by developing exchange of tax information agreements, building transfer pricing capacity and encouraging further research on issues related to IFFs.
108 FISCAL SPACE FOR SOCIAL PROTECTION | A Handbook for Assessing Financing Options
Developing countries should
• Strengthen national inter-agency co-ordination mechanisms to combat IFFs. In order to ensure an effective response, governments need to build institutional mechanisms that assign clear responsibilities and facilitate straight-forward co-ordination and collaboration between different agencies both at the level of policy design and implementation.
• Policymakers and stakeholders should have a more strategic overview of IFFs, and must assess the potential trade-offs and synergies in an inter-disciplinary manner, better inform policy making upstream, and help government actors to take more effective actions. Effective policy, therefore, will necessarily be based on an approach that emphasizes coherence – including through:
• Identifying and raising awareness of the types, magnitudes and risks of IFFs (particularly at the political and policy making level).
• Considering the contextual factors that allow IFFs to thrive.
• Supporting coherence within and between national and international normative frameworks (vertical coherence).
• Identifying critical, prioritized interactions across economic, social and environmental areas to address IFFs (horizontal coherence).
Box 6.2 Fighting tax evasion - The US Foreign Account Tax Compliance Act (FATCA)
The Foreign Account Tax Compliance Act (FATCA) is a federal law enacted in 2010 that requires all US taxpayers (individuals and companies) to report on their financial accounts held outside of the US and requires all foreign financial institutions/banks to search their records for US persons and report their assets and identities to the US Internal Revenue Service (IRS). An initiative of the Obama Administration in their efforts to promote economic recovery after the financial crisis. Failure to report results in an initial penalty of US$ 10,000, and up to US$ 50,000 for continued failure following IRS notification. In addition, FATCA requires foreign financial institutions/banks to report information directly to the IRS about financial accounts held by US taxpayers; for this, in early 2015 nearly 60 countries have signed intergovernmental agreements with the United States regarding the implementation of FATCA, including traditional tax heavens like Cayman Islands, Gibraltar, Isle of Man, Liechtenstein, Luxemburg, Malta, Switzerland and Virgin Islands, among other countries. Critics point out that FATCA has focused on identifying middle class tax evaders instead of wealthy persons and corporations that use more sophisticated methods, but it has been an important start.
Source: Ortiz et al., 2017, based on OECD, 2014, US Internal Revenue Service, and US Department of Treasury.
However, political commitment is vital. Policy issues that cut across traditional policy-making boundaries cannot be addressed effectively by a single policy unit located within a policy silo at a lower level of the administration. Instead, support from the highest level and whole-of-government approaches are instrumental for a successful strategy to counter IFFs.
It is also important that the government reaches out to non-state actors and incorporate them into the effort to stem IFFs. This includes the financial sector as well as professions, such as lawyers and accountants since they are in charge of implementing a substantial share of the preventive measures devised by policy makers. Private companies, too, have a role to play in the process and their participation could provide valuable feedback about the direct impact of new policies, and help to ensure better coherence. In general, feedback mechanisms and statistical tools are essential to avoid or address unintended consequences and incoherent outcomes. Civil society actors also play an important role to create awareness and monitor progress.
CHAPITRE 6 | ILLICIT FINANCIAL FLOWS AND CORRUPTION 109
Box 6.3 Progress in measuring and tackling IFFs
A broad set of international conventions, standards, and bodies has been developed in order to combat IFFs. These include UN conventions which establish minimum standards that all countries are expected to meet in order to avoid providing a safe haven for various kinds of IFFs. At the UN level, the key instruments which establish legal obligations are:
• United Nations Convention against Illicit Traffic in Narcotic Drugs and Psychotropic Substances 1988 (Vienna Convention). This includes provisions on money laundering and international cooperation.
• United Nations Convention against Transnational Organized Crime 2000 (Palermo Convention). This requires countries to criminalize money laundering, and includes frameworks for extradi-tion, mutual legal assistance and law enforcement cooperation.
• International Convention for the Suppression of the Financing of Terrorism 1999 – requires states to criminalize the financing of terrorism, and adopt powers to freeze and seize funds intended to be used for terrorist activities.
• United Nations Convention against Corruption 2003 (Merida Convention) – requires measures to prevent and criminalize corruption, provide international cooperation and asset recovery on corruption cases.
• United Nations Model Double Taxation Convention between Developed and Developing Coun-tries forms part of the continuing international efforts aimed at eliminating double taxation. The UN Model generally favours retention of greater so called “source country” taxing rights under a tax treaty—the taxation rights of the host country of investment—as compared to those of the “residence country” of the investor. This has long been regarded as an issue of special significance to developing countries.
• In addition, a number of UN Security Council Resolutions have introduced measures to counter IFFs, in particular by establishing targeted financial sanctions regimes applied to Al Qaida and other terrorist groups.
The United Nations Office on Drugs and Crime (UNODC) is actively involved in working with a variety of stakeholders to improve methodologies to measure IFFs – including Member States, multilateral organizations, non-governmental organizations, academia and other stakeholders.
The OECD and the other bodies above are also active in producing guidance and analysis to support implementation of the standards and of other measures to counter IFFs. This includes best practices in the implementation of specific requirements, guidance on tools or methods to improve effectiveness in certain policy areas, and studies analysing specific problems which arise in rela-tion to the standards.
The OECD report Measuring OECD Responses to Illicit Financial Flows from Developing Countries shows that progress has been made in recent years, but continued international support is needed to tackle existing performance gaps and shortfalls. Key findings include:
• 27 out of 34 OECD countries store or require some beneficial ownership information for legal persons, but no country is fully compliant with the beneficial ownership requirement for legal arrangements.
• Across all OECD countries as of 2012, only 221 individuals and 90 companies have sanctioned for foreign bribery, around half of all OECD countries have yet to see a single prosecution.
• Between 2010 and 2012, OECD countries have returned US$ 147 million and frozen almost US$ 1.4 billion assets.
• 30 out of 34 OECD countries do not properly regulate and supervise designated non-financial professions and businesses which may pose money laundering risks.
• Since 2000, OECD countries have signed roughly 1300 bilateral exchange of information agree-ments with developing countries.
Source: UNDOC-OECD, 2016.
110 FISCAL SPACE FOR SOCIAL PROTECTION | A Handbook for Assessing Financing Options
Governments also need to engage with international norms and standards, including peer review mechanisms, multilateral co-operation initiatives, and information exchange mechanisms; establish bilateral co-operation, in particular with countries which are key sources and destinations for IFFs; and identify how development assistance policies can support measures to combat IFFs in order to improve coherence and ensure coordinated global action. The international community, particularly members of the G20 and the OECD Development Assistance Committee (DAC), has an important role to play (see Box 6.4). At the international level, global standards to identify and prevent cases of money laundering need to be strengthened and enforced, including rules to identify politically exposed persons and beneficial owners. The international community can also advance interna-tional standards related to tax evasion and avoidance, such as rules requiring MNCs to report on their country of operation and tax authorities to automatically exchange information, while main-taining policy coherence. Increased enforcement of foreign bribery infractions and the freezing and repatriation of stolen assets may also help to send the message that corruption is not tolerated (Martini, 2014).
Box 6.4 OECD and other international mechanisms for combatting IFFs
The OECD sets (or hosts) the main international standards and standard-setting bodies which are responsible for setting international (soft) law on tax matters:
• OECD Model Tax Convention - The OECD published its first draft Double Taxation Convention on Income and Capital in 1963, building on work which had begun in the League of Nations in the 1920s. Today more than 3,000 bilateral tax treaties are based on the OECD Model, which addresses key issues arising in the international tax system including to promote the elimination of double taxation and to prevent fiscal evasion.
• Multilateral Convention on Mutual Administrative Assistance in Tax Matters - The multilateral Convention was developed by the OECD and Council of Europe in 1988 as a legal instrument for countries to undertake cross-border cooperation to counter tax evasion and avoidance in areas including exchange of tax information (on request, automatic and spontaneous) as well as assistance in tax collection and simultaneous tax examinations. The multilateral Convention was updated in 2010 with an amending Protocol to reflect the latest standards, including in the area of tax information exchange, and to allow the Convention to be signed by all States (not only OECD or Council of Europe members). Today (March 2015) there are 85 jurisdictions participating in the Convention, and that number is growing rapidly.
• OECD Convention on Combating Bribery of Foreign Public Officials in International Business Transactions (the OECD Anti Bribery Convention / ABC) – Countries which join the OECD ABC agree to establish a criminal offence of bribing a foreign public official in their national laws, and to implement effective policies to prevent, detect, investigate and sanction foreign bribery committed by individuals and/or companies.
In addition to the conventions and standards above, there are a range of initiatives and dialogues which aim to improve the capacity of governments and the functioning of the international systems for combating illicit financial flows, many of them led by the OECD. These include:
• Regional Anti-Corruption Initiatives, reaching out to non-OECD countries on bribery and corrup-tion issues.
• CleanGovBiz – This initiative supports governments, business and civil society to build integrity and fight corruption. It draws together existing anti-corruption tools in its CleanGovBiz Toolkit, reinforces their implementation, improves co-ordination among relevant players and monitors progress towards integrity.
• The OECD Recommendation on Public Procurement (and corresponding Toolkit) include guide-lines for enhancing integrity and transparency in public procurement, which is vulnerable to corruption (including mis-invoicing) and/or bribery (whether from domestic or foreign sources).
CHAPITRE 6 | ILLICIT FINANCIAL FLOWS AND CORRUPTION 111
• The OECD Principles on Transparency and Integrity in Lobbying, as well as the OECD Recommen-dations for Managing Conflict of Interest and Improving Ethical Conduct in the Public Service.
• Oslo Dialogue on Tax and Crime - Promoting a whole of government approach to fighting tax crime and other financial crimes, this initiative was launched in 2011 and has included the estab-lishment in 2014 of the OECD International Academy for Tax Crime Investigation near Rome, Italy.
• The Stolen Asset Recovery Initiative (StAR) - is a partnership between the World Bank Group and the United Nations Office on Drugs and Crime (UNODC) that works with developing countries and financial centres to prevent the laundering of the proceeds of corruption and to facilitate more systematic and timely return of stolen assets. The StAR Initiative has jointly published with the OECD Working Group on Bribery an analysis on the Identification and Quantification of the Proceeds of Bribery.
• Tax and Development - The OECD’s Task Force on Tax and Development was created in 2010 and has an advisory role to the OECD’s Committee on Fiscal Affairs and the Development Assistance Committee. Participants are officials from OECD and developing countries, business, NGOs and other international organizations. Key elements of the Tax and Development Programme’s work agenda include: promoting the link between State building; Taxation and Aid; supporting developing countries build capacity on transfer pricing and other international tax issues as well as natural resource taxation; and supporting low-income countries improve transparency and governance of tax incentive regimes.
• Extractive Industries Transparency Initiative (EITI) – a global standard to promote openness and accountable management of natural resources, through full disclosure of taxes and other payments made by oil, gas, and mining companies.
6.4 SOME CHALLENGES
The preceding discussion has revealed that measures to combat IFFs involve a wide range of policy areas, domestic and international. This can potentially create policy conflicts between objectives relating to IFFs and other policy objectives as well as unforeseen conflicts which may arise from the way policies are implemented – these are minor, considering the large public benefits of combatting IIFs. This section briefly reflects on some issues in this regard.
Financial Inclusion: There can be tensions between financial inclusion goals and the measures to counter illicit finance. For example, preventive measures to counter money laundering require financial institutions to verify the identity of their customers. But many people in developing countries lack identity documentation, and risk being excluded from access to financial services by customer identification rules. The Financial Action Task Force (FATF) has developed guidance on financial inclusion, which sets out how countries can pursue the objective of financial inclusion without compromising measures to combat crime – for example by relaxing identification requirements or using alternative means of identification in low-risk situations, or by using thresholds and ongoing monitoring to mitigate the risks of reduced customer due diligence.
De-risking and migrant remittances: De-risking is a relatively recent phenomenon of financial institutions ceasing to do business with certain high-risk categories of customers – particularly operators of money and value transfer services and non-profit organizations. This affects both new customers, who are unable to open accounts, and existing customers whose accounts have been closed. Operators of money and value transfer services are critical channels for remittance flows. Preventing new operators from accessing the financial system creates barriers to market entry and
112 FISCAL SPACE FOR SOCIAL PROTECTION | A Handbook for Assessing Financing Options
competition, and threatens to raise remittance costs. De-risking may also increase the overall risks of illicit financing, by encouraging the use of informal and unregulated channels once formal channels are closed. There are several ways countries can seek to influence de-risking behaviour by banks, such as through dialogues between regulators, supervisors, and the financial sector to clarify the expectations of supervisors regarding risk management of operators of money and value transfer services. However, de-risking is a global phenomenon, and national authorities’ capacity to address it is limited. Hence, action may be needed to address this issue at the global level.
Data Protection: Conflicts can arise with data protection requirements, for example FATF Recom-mendations require financial institutions to retain customer and account information for a minimum of five years (to ensure an adequate trail for investigators), while data protection rules set a maximum data retention period of five years (to prevent the misuse of old information). Countries have been able to manage this policy conflict, through coordination between the regulatory authorities responsible for data protection and for IFFs, and through dialogue with the private sector entities which are affected by both requirements.
Voluntary Tax Compliance Programmes: These programmes enable taxpayers to normalize their situation, regarding income and assets which were previously unreported for tax purposes. These programmes offer an opportunity to maximize the benefits of improvements in transparency and exchange of information for tax purposes, to increase short-term tax revenues and improve medium-term tax compliance. But, they need to tread a fine line between encouraging non- compliant taxpayers to permanently improve their compliance (a balancing act in itself) and retaining the support and compliance of the vast majority of taxpayers who are already compliant. They also need to be consistent with relevant rules in the non-tax area such as anti-money laundering rules, to ensure they are not misused. The FATF has set out principles governing how these programmes should manage this risk.
Impact on markets and financial stability: In some cases, the volume of IFFs into or out of a country can be very large, and can have a noticeable impact on the legitimate economy, including specific sectors, or the economy as a whole. For example, IFFs from some developing countries can be large enough to place long-term downward pressure on exchange rates, affecting the economy as a whole. Countries have to design appropriate macro-prudential regulations and policy coherence is vital for mitigating this problem.
Spill-over: IFFs can be a cause for concern even in jurisdictions which have low domestic levels of proceeds-generating crimes, corruption, and tax evasion – and therefore face low domestic risks of IFFs. But, international risks - e.g. inflows of the proceeds of foreign crimes, or foreign bribery by companies located in the country, are also relevant when deciding how strongly to prioritize actions against illicit finance. A country which relaxed its controls on the basis that its domestic risks are low could potentially become a haven for illicit finance originating in other countries – even if its risk assessment is correct.
Diplomatic Relations: Measures to counter illicit finance can have diplomatic costs – particularly where the policies of other countries or the personal interests of their leaders and officials are affected, as is often the case for investigations of bribery and corruption. The OECD ABC explicitly prohibits countries from taking such considerations into account in the decision to investigate and prosecute foreign bribery. Constitutional or operational independence of investigators and prosecutors from the Executive is a key element to prevent this type of influence, since the politicians and officials who are exposed to this pressure do not have the power to end or prevent the opening of investigations.
CHAPITRE 6 | ILLICIT FINANCIAL FLOWS AND CORRUPTION 113
6.5 CONCLUDING REMARKS
Curtailing IFFs can generate substantial amount of resources for critical economic and social investments in many developing countries, given the vast amount of resources that illegally escape developing countries each year. However, no individual country can succeed on its own, given its complexity and web of cross-boundary activities. In particular, developed countries have a respon-sibility to support developing countries’ efforts by not only providing technical assistance, but also implementing measures themselves against bank-secrecy, tax-havens, international bribery and MNCs’ profit shifting. Therefore, finance ministries and tax authorities in developing and developed countries need to cooperate in a global resource bargain to close existing loopholes that help IFFs. International civil society organizations (CSOs), such as Global Financial Integrity and Tax Justice Network, are playing critical role in creating awareness and constructing data by researching on IFFs, offshore finance and tax havens. National CSOs should join hands with such organizations to monitor progress at the national level, especially in implementing various UN Conventions to combat sources of IFFs.
6.6 KEY DOCUMENTS AND DATA SOURCES
Kar, D. and Spanjers, J. 2015. Illicit Financial Flows from Developing Countries: 2004-2013. Washington DC: Global Financial Integrity. This is the seventh in annual series of the Global Financial Integrity report. It has estimates of IFFs at the country-level and aggregated global-level. It also has policy recommendations to combat IFFs and methodologies for estimating IFFs.
Global Financial Integrity. 2015. Financial Flows and Tax Havens: Combining to Limit the Lives of Billions of People. Washington DC: Global Financial Integrity. This is the most comprehensive analysis of global financial flows impacting developing countries compiled to date and focuses particular attention on the deleterious effects of offshore tax havens. A portion of illicit financial flows is also addressed, because with both flow data and deposit data it is often difficult to disaggregate between legally and illegally derived components. It has glossaries of different terminologies used in the literature on IFFs and detailed discussions of various method-ologies which explain why there differences in data obtained from different sources.
OECD. 2014. Illicit Flows from Developing Countries: Measuring OECD Responses. Paris: OECDThis is the first OECD report to measure how well countries are performing in their fight against IFFs. It draws on public data describing the situation in these policy areas and the role of donor agencies. The report is a key output of the OECD Strategy on Development, which was launched in 2012, and provides a unique comparison of country performance on some of these global standards.
114 FISCAL SPACE FOR SOCIAL PROTECTION | A Handbook for Assessing Financing Options
Data sources
Global Financial Integrity database, http://www.gfintegrity.org/issues/data-by-country/
IMF Balance of Payments (BoP): IMF database provides international economic transactions data and International Investment Position (IIP) data. For the purposes of calculating unrecorded capital flight, the following time series can be found in this database: current account, foreign direct invest-ment, and change in reserves.
IMF International Financial Statistics (IFS): IMF database containing all aspects of international and domestic finance. For the purposes of calculating IFFs, the IFS database contains supplementary trade data.
Learning accomplishments
After reading this chapter, a reader should have a good grasp of:
• the extent of illicit financial flows and their significance for development finance
• what countries can do to combat illicit financial flows
• what the international community and organizations can do, and what international frameworks are available to combat illicit financial flows
• what are the trade-offs that countries have to manage when combating illicit financial flows, and the high cost of inaction.
CHAPTER 7 | PUBLIC EXPENDITURE REPRIORITIZATION 115
CHAPTER 7. PUBLIC EXPENDITURE REPRIORITIZATION
LEARNING OBJECTIVES
• Know about public expenditure reprioritization
• Identify public sector potential areas for reprioritization
• Understand basics of Public Expenditure Reviews for reprioritization
• Appreciate political economy considerations of public expenditure allocations
• Know key resources and data sources
CONTENTS
• Rationale for expenditure reprioritization
• Public Expenditure Reviews
• Quality of public expenditures: indicators and attribution
• Political economy of budget allocations
• Key resources and data sources
This chapter discusses the rationale for and policy implications of public expenditure reprioritization as an option for fiscal space, replacing high-cost, low-impact investments with others with higher developmental benefits. It also discusses the basic features of Public Expenditure Review (PER), a methodology used for objectively analysing public financial management and current budgetary allocations, and challenges involved. Changes in budgetary allocations often face resistance from vested interests which can be overcome if there is a strong political will, backed by evidence-based analysis of government’s policy programmes. Although regular review and reprioritization of public expenditure should be part of the national budgeting process, it is usually sensitive and therefore politically difficult.
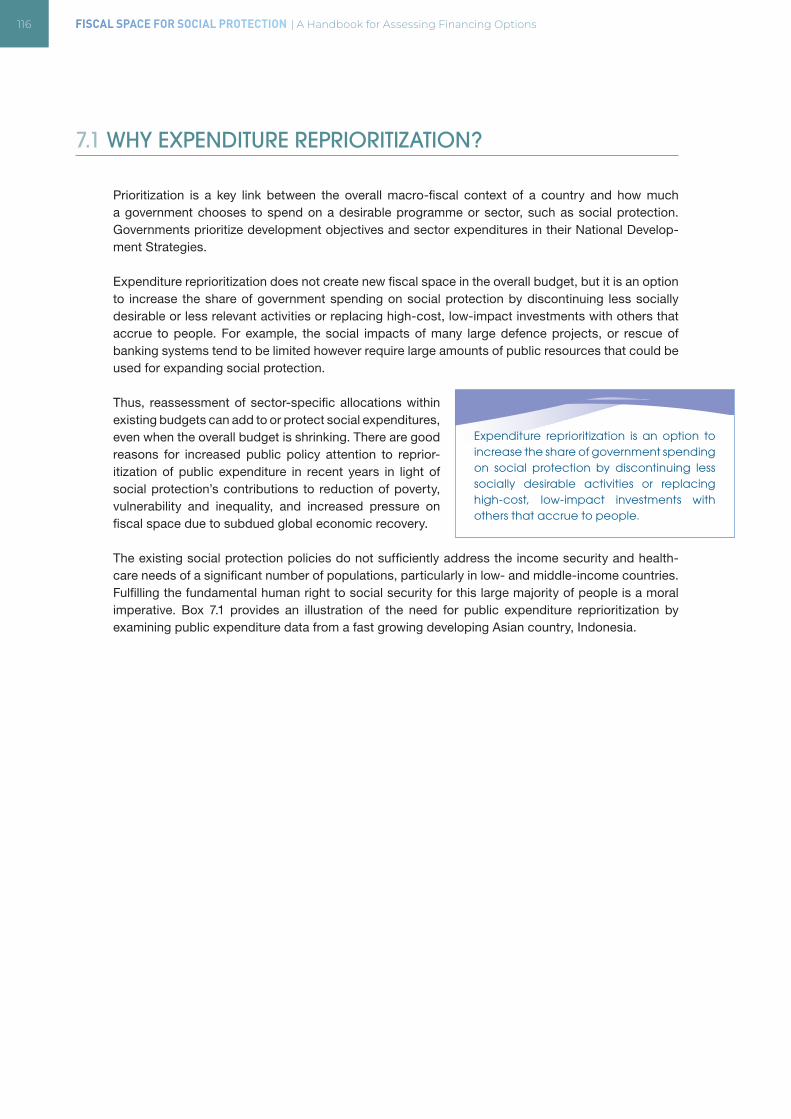
116 FISCAL SPACE FOR SOCIAL PROTECTION | A Handbook for Assessing Financing Options
7.1 WHY EXPENDITURE REPRIORITIZATION?
Prioritization is a key link between the overall macro-fiscal context of a country and how much a government chooses to spend on a desirable programme or sector, such as social protection. Governments prioritize development objectives and sector expenditures in their National Develop-ment Strategies. Expenditure reprioritization does not create new fiscal space in the overall budget, but it is an option to increase the share of government spending on social protection by discontinuing less socially desirable or less relevant activities or replacing high-cost, low-impact investments with others that accrue to people. For example, the social impacts of many large defence projects, or rescue of banking systems tend to be limited however require large amounts of public resources that could be used for expanding social protection.
Thus, reassessment of sector-specific allocations within existing budgets can add to or protect social expenditures, even when the overall budget is shrinking. There are good reasons for increased public policy attention to reprior-itization of public expenditure in recent years in light of social protection’s contributions to reduction of poverty, vulnerability and inequality, and increased pressure on fiscal space due to subdued global economic recovery.
The existing social protection policies do not sufficiently address the income security and health-care needs of a significant number of populations, particularly in low- and middle-income countries. Fulfilling the fundamental human right to social security for this large majority of people is a moral imperative. Box 7.1 provides an illustration of the need for public expenditure reprioritization by examining public expenditure data from a fast growing developing Asian country, Indonesia.
Expenditure reprioritization is an option to increase the share of government spending on social protection by discontinuing less socially desirable activities or replacing high-cost, low-impact investments with others that accrue to people.
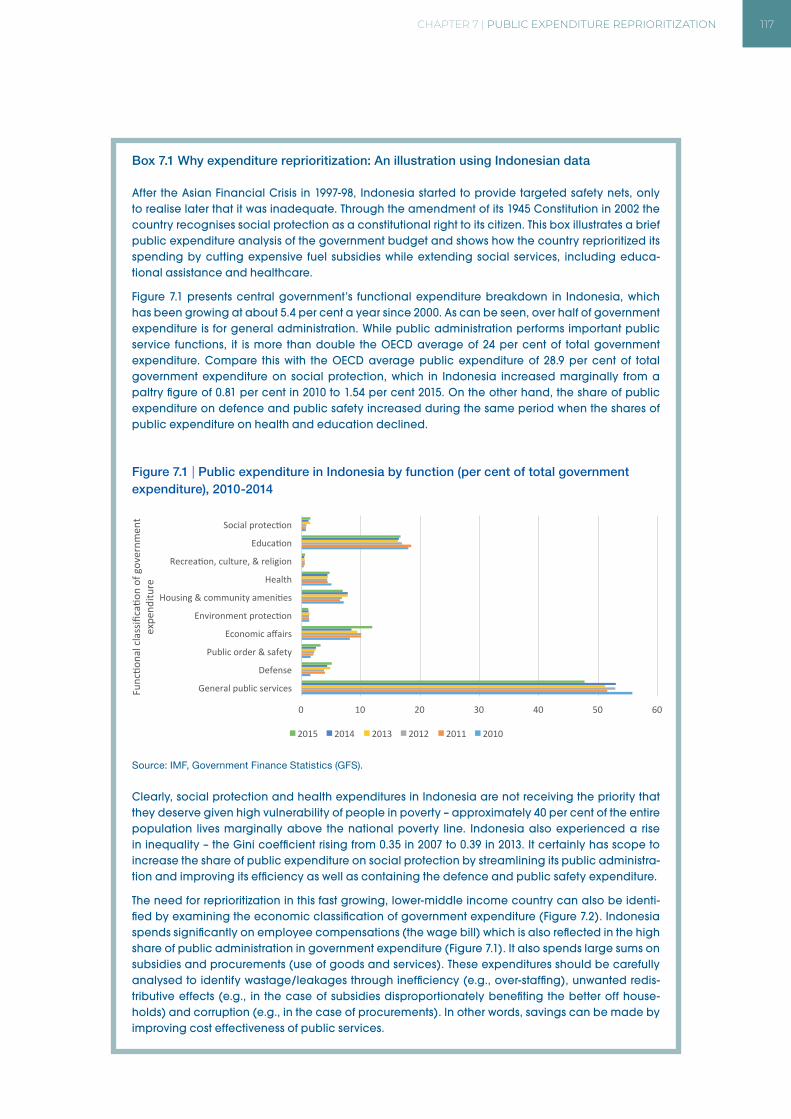
CHAPTER 7 | PUBLIC EXPENDITURE REPRIORITIZATION 117
Box 7.1 Why expenditure reprioritization: An illustration using Indonesian data
After the Asian Financial Crisis in 1997-98, Indonesia started to provide targeted safety nets, only to realise later that it was inadequate. Through the amendment of its 1945 Constitution in 2002 the country recognises social protection as a constitutional right to its citizen. This box illustrates a brief public expenditure analysis of the government budget and shows how the country reprioritized its spending by cutting expensive fuel subsidies while extending social services, including educa-tional assistance and healthcare.
Figure 7.1 presents central government’s functional expenditure breakdown in Indonesia, which has been growing at about 5.4 per cent a year since 2000. As can be seen, over half of government expenditure is for general administration. While public administration performs important public service functions, it is more than double the OECD average of 24 per cent of total government expenditure. Compare this with the OECD average public expenditure of 28.9 per cent of total government expenditure on social protection, which in Indonesia increased marginally from a paltry figure of 0.81 per cent in 2010 to 1.54 per cent 2015. On the other hand, the share of public expenditure on defence and public safety increased during the same period when the shares of public expenditure on health and education declined.
Figure 7.1 | Public expenditure in Indonesia by function (per cent of total government expenditure), 2010-2014
Source: IMF, Government Finance Statistics (GFS).
Clearly, social protection and health expenditures in Indonesia are not receiving the priority that they deserve given high vulnerability of people in poverty – approximately 40 per cent of the entire population lives marginally above the national poverty line. Indonesia also experienced a rise in inequality – the Gini coefficient rising from 0.35 in 2007 to 0.39 in 2013. It certainly has scope to increase the share of public expenditure on social protection by streamlining its public administra-tion and improving its efficiency as well as containing the defence and public safety expenditure.
The need for reprioritization in this fast growing, lower-middle income country can also be identi-fied by examining the economic classification of government expenditure (Figure 7.2). Indonesia spends significantly on employee compensations (the wage bill) which is also reflected in the high share of public administration in government expenditure (Figure 7.1). It also spends large sums on subsidies and procurements (use of goods and services). These expenditures should be carefully analysed to identify wastage/leakages through inefficiency (e.g., over-staffing), unwanted redis-tributive effects (e.g., in the case of subsidies disproportionately benefiting the better off house-holds) and corruption (e.g., in the case of procurements). In other words, savings can be made by improving cost effectiveness of public services.
0 10 20 30 40 50 60
Generalpublicservices
Defense
Publicorder&safety
Economicaffairs
EnvironmentprotecAon
Housing&communityameniAes
Health
RecreaAon,culture,&religion
EducaAon
SocialprotecAon
Func
Aona
lclassificaAo
nofgov
ernm
ent
expe
nditu
re
2015 2014 2013 2012 2011 2010
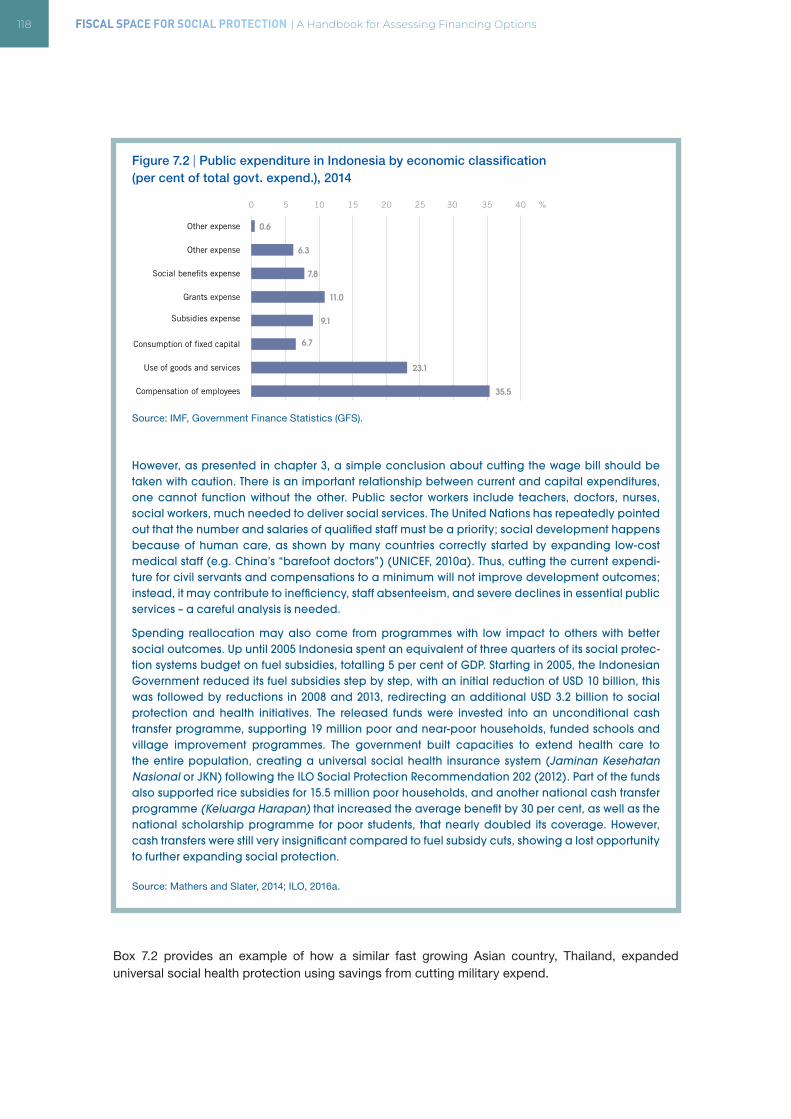
118 FISCAL SPACE FOR SOCIAL PROTECTION | A Handbook for Assessing Financing Options
Figure 7.2 | Public expenditure in Indonesia by economic classification (per cent of total govt. expend.), 2014
Source: IMF, Government Finance Statistics (GFS).
However, as presented in chapter 3, a simple conclusion about cutting the wage bill should be taken with caution. There is an important relationship between current and capital expenditures, one cannot function without the other. Public sector workers include teachers, doctors, nurses, social workers, much needed to deliver social services. The United Nations has repeatedly pointed out that the number and salaries of qualified staff must be a priority; social development happens because of human care, as shown by many countries correctly started by expanding low-cost medical staff (e.g. China’s “barefoot doctors”) (UNICEF, 2010a). Thus, cutting the current expendi-ture for civil servants and compensations to a minimum will not improve development outcomes; instead, it may contribute to inefficiency, staff absenteeism, and severe declines in essential public services – a careful analysis is needed.
Spending reallocation may also come from programmes with low impact to others with better social outcomes. Up until 2005 Indonesia spent an equivalent of three quarters of its social protec-tion systems budget on fuel subsidies, totalling 5 per cent of GDP. Starting in 2005, the Indonesian Government reduced its fuel subsidies step by step, with an initial reduction of USD 10 billion, this was followed by reductions in 2008 and 2013, redirecting an additional USD 3.2 billion to social protection and health initiatives. The released funds were invested into an unconditional cash transfer programme, supporting 19 million poor and near-poor households, funded schools and village improvement programmes. The government built capacities to extend health care to the entire population, creating a universal social health insurance system (Jaminan Kesehatan Nasional or JKN) following the ILO Social Protection Recommendation 202 (2012). Part of the funds also supported rice subsidies for 15.5 million poor households, and another national cash transfer programme (Keluarga Harapan) that increased the average benefit by 30 per cent, as well as the national scholarship programme for poor students, that nearly doubled its coverage. However, cash transfers were still very insignificant compared to fuel subsidy cuts, showing a lost opportunity to further expanding social protection.
Source: Mathers and Slater, 2014; ILO, 2016a.
Box 7.2 provides an example of how a similar fast growing Asian country, Thailand, expanded universal social health protection using savings from cutting military expend.
0 5 10 15 20 25 30 35 40 %
Other expense
Other expense
6.3
Social bene�ts expense 7.8
0.6
Grants expense 11.0
Subsidies expense 9.1
Consumption of �xed capital 6.7
Use of goods and services 23.1
Compensation of employees 35.5
CHAPTER 7 | PUBLIC EXPENDITURE REPRIORITIZATION 119
Box 7.2 Thailand: Reallocating military expenditures for the Universal Health Care Scheme
The 1997-1998 Asian Financial Crisis severely hit the Thai economy and its society. With the backing of the 1997 Constitution, civil society calls to address neglected social policies led the government to adopt the Universal Coverage Scheme in 2001. Given that approximately a third of the popu-lation was excluded from health coverage at that time, most of which belonged to the informal agricultural sector without regular income, achieving universal coverage through contributory schemes alone was not possible, it needed budget support. Most of the funding for the UCS were financed through reduced spending on defence (from around 25 per cent of total expenditures in the 1970s to 15 per cent during the 2000s and to 7.62 per cent in 2015) and lower debt service payments. The government included the Universal Coverage Scheme as part of a more general fiscal stimulus plan, other measures increased the amount of money in the hands of people with a high propensity to spend, including the creation of a People’s Bank, a debt moratorium for farmers and a village fund.
Source: Duran-Valverde and Pacheco, 2012.
7.1.1 The political economy of expenditure reprioritization
Though expenditure reprioritization is the most commonly advised financing measure by the IFIs and donors, it not a straight forward matter. It is actually one of the most difficult to implement financing options, as it tends to be resisted by those likely to lose out due to cuts or elimination of programmes – for example, the military if defence cuts are proposed. Although it is useful to be cognizant of formal budgeting processes (described in chapter 3), it does not fully explain how resources are allocated within the budget. There is a large body of research work that tries to identify the determinants of public expenditure allocations (and, more broadly, public policy) decision-making.
The literature on public choice and public finance describes how different interest groups within and outside of government compete to influence public policies and budget allocations. In cases where labour and social sector ministries are not able to garner support, the result may be reduced allocations for labour related policies or social investments.
Social dialogue that includes all relevant stakeholders (including trade unions, employers, CSOs) and public debates can help to minimize the possible influence of powerful lobbying groups on public policy-making, and strategically replace high-cost, low-impact expenditures with interventions that have high social returns.
Attention is needed when expenditure reprioritization has detrimental social impacts. Various studies have highlighted the risks of social budget items being the most affected/cut during fiscal consoli-dation and adjustment processes (e.g. Cornia et al., 1987; Ortiz and Cummins, 2012; Ravallion, 2002 and 2006), precisely at a time when social expenditures are more needed. As presented in chapter 3, typical austerity budget cuts to watch out are:
• Elimination or reduction of universal subsidies, including on fuel, agriculture and food products;
• Wage bill cuts or caps, including the salaries and number of education, health and social workers;
• Rationalizing and further targeting social protection systems;
• Inadequate pension and health reforms;
• Privatization of public assets.
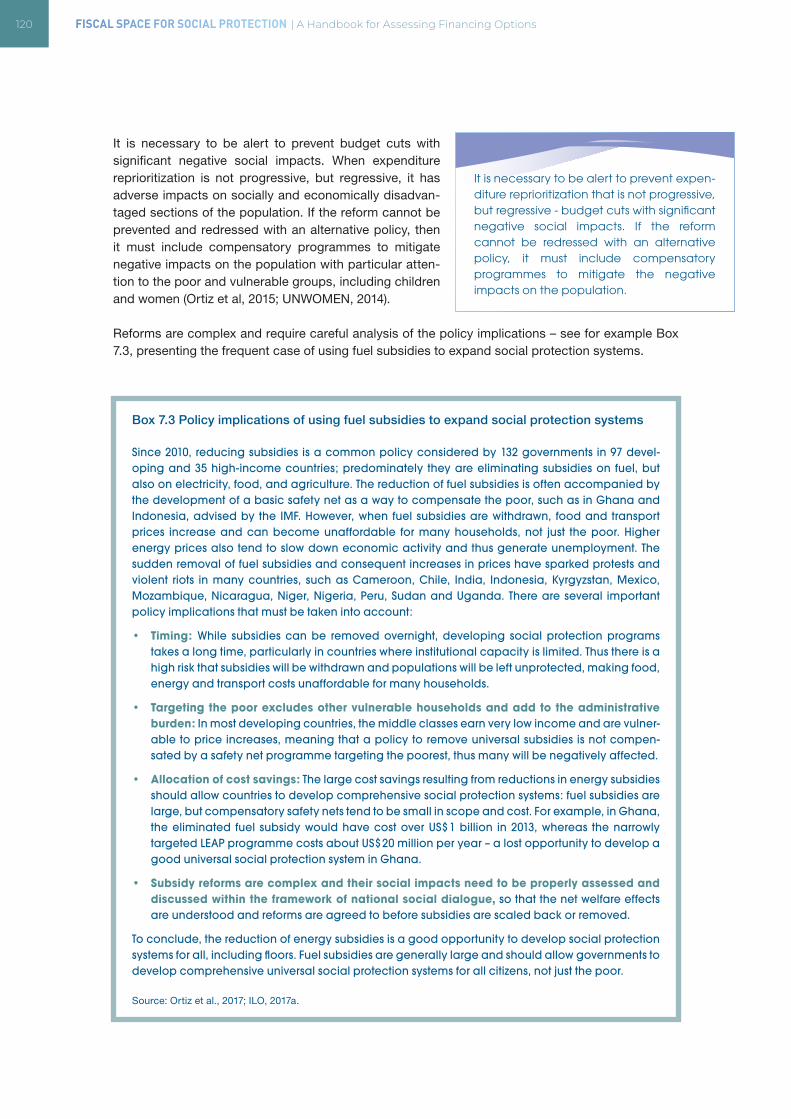
120 FISCAL SPACE FOR SOCIAL PROTECTION | A Handbook for Assessing Financing Options
It is necessary to be alert to prevent budget cuts with significant negative social impacts. When expenditure reprioritization is not progressive, but regressive, it has adverse impacts on socially and economically disadvan-taged sections of the population. If the reform cannot be prevented and redressed with an alternative policy, then it must include compensatory programmes to mitigate negative impacts on the population with particular atten-tion to the poor and vulnerable groups, including children and women (Ortiz et al, 2015; UNWOMEN, 2014).
Reforms are complex and require careful analysis of the policy implications – see for example Box 7.3, presenting the frequent case of using fuel subsidies to expand social protection systems.
Box 7.3 Policy implications of using fuel subsidies to expand social protection systems
Since 2010, reducing subsidies is a common policy considered by 132 governments in 97 devel-oping and 35 high-income countries; predominately they are eliminating subsidies on fuel, but also on electricity, food, and agriculture. The reduction of fuel subsidies is often accompanied by the development of a basic safety net as a way to compensate the poor, such as in Ghana and Indonesia, advised by the IMF. However, when fuel subsidies are withdrawn, food and transport prices increase and can become unaffordable for many households, not just the poor. Higher energy prices also tend to slow down economic activity and thus generate unemployment. The sudden removal of fuel subsidies and consequent increases in prices have sparked protests and violent riots in many countries, such as Cameroon, Chile, India, Indonesia, Kyrgyzstan, Mexico, Mozambique, Nicaragua, Niger, Nigeria, Peru, Sudan and Uganda. There are several important policy implications that must be taken into account:
• Timing: While subsidies can be removed overnight, developing social protection programs takes a long time, particularly in countries where institutional capacity is limited. Thus there is a high risk that subsidies will be withdrawn and populations will be left unprotected, making food, energy and transport costs unaffordable for many households.
• Targeting the poor excludes other vulnerable households and add to the administrative burden: In most developing countries, the middle classes earn very low income and are vulner-able to price increases, meaning that a policy to remove universal subsidies is not compen-sated by a safety net programme targeting the poorest, thus many will be negatively affected.
• Allocation of cost savings: The large cost savings resulting from reductions in energy subsidies should allow countries to develop comprehensive social protection systems: fuel subsidies are large, but compensatory safety nets tend to be small in scope and cost. For example, in Ghana, the eliminated fuel subsidy would have cost over US$ 1 billion in 2013, whereas the narrowly targeted LEAP programme costs about US$ 20 million per year – a lost opportunity to develop a good universal social protection system in Ghana.
• Subsidy reforms are complex and their social impacts need to be properly assessed and discussed within the framework of national social dialogue, so that the net welfare effects are understood and reforms are agreed to before subsidies are scaled back or removed.
To conclude, the reduction of energy subsidies is a good opportunity to develop social protection systems for all, including floors. Fuel subsidies are generally large and should allow governments to develop comprehensive universal social protection systems for all citizens, not just the poor.
Source: Ortiz et al., 2017; ILO, 2017a.
It is necessary to be alert to prevent expen-diture reprioritization that is not progressive, but regressive - budget cuts with significant negative social impacts. If the reform cannot be redressed with an alternative policy, it must include compensatory programmes to mitigate the negative impacts on the population.
CHAPTER 7 | PUBLIC EXPENDITURE REPRIORITIZATION 121
Thus, public expenditure reforms are complex and deserve careful analysis to ensure positive social outcomes, and above all to avoid regressive developmental impacts. Social dialogue that includes all relevant stakeholders, organizations representative of workers and employers, CSOs and govern-ment, and public open debates are strategic tools to replace high-cost, low-impact interventions.
7.2 PUBLIC EXPENDITURE REVIEWS (PERS)
PERs are becoming increasingly important in view of growing pressure on public expenditure, espe-cially when the scope for raising revenues commensurately through traditional means (e.g. taxation) is limited. PERs reinforce the connection between funding decisions and policy priorities (shall this policy be funded with public money?) and subsequently between funding levels and results delivered to end-users (what is the value for public money?). The overarching goals of evaluation are generally the following:
i) to assess a public policy and its impact versus fact-based public needs,
ii) to provide evidence to help policy-makers establish whether an intervention is successful or not, and
iii) to define the scope for improvement, strategic overhaul or operational resources adjustment.
Therefore, the purpose of a PER is to ascertain the rationale for continued government expenditure, analyse the allocation of public resources and provide an objective assessment of the efficiency, effectiveness and sustainability of public spending.
PERs look at both recurrent and capital expenditures, and attempt to review the joint impact of both types of spending on budgetary outcomes within the broader context of economic growth, social development, poverty/inequality reduction and other strategic goals expressed in National Develop-ment Strategies (United Nations, 2008). The National Development Strategy and Action Plan, with the agreed priority policies in the short, medium and long term to achieve national development targets, including the SDGs, should have adequate budgetary allocations to support priority policies, preferably in a Medium-Term Expenditure Framework (MTEF) linking programmes to a multi-annual budget. As explained in chapter 3, the MTEF is a multiyear framework that allows a country to tie its current annual budget to a rolling budget that will be implemented over the coming years while maintaining the policy orientation of the budget within the sectors.
7.2.1 Criteria for evaluation
When reviewing public expenditure, a number of criteria need to be selected for assessing how expen-diture is allocated. The criteria to evaluate a policy would typically include effectiveness, efficiency and sustainability, sometimes value-for-money is added: (i) effectiveness, assessing to what extent the results
of an intervention delivered the objectives agreed in the National Development Strategy;
Though expenditure reprioritization is the most commonly advised financing measures, it is actually one of the most difficult options, as it tends to be resisted by those who lose out due to cuts or elimina-tion of programmes. Social dialogue and public open debates are strategic tools to minimize the influence of powerful lobbying groups on public policy-making.
122 FISCAL SPACE FOR SOCIAL PROTECTION | A Handbook for Assessing Financing Options
(ii) efficiency, assessing to what extent output was generated with an adequate level of input (whether the same output could be achieved with less or whether the unsatisfactory output is due to inadequate funding);
(iii) sustainability, assessing to what extent the expenditure commitments will remain within the expected revenues (whether the current levels of expenditure conforms with the medium-term expenditure framework/MTEF), and if not, what adjustments or new sources of financing could be found;
(iv) value for money, i.e. utility derived from every purchase or every sum of money spent. However, this should not be confined to strict financial cost-benefit analysis or financial rates of return, which are driven by the minimum purchase price (economy) or the maximum efficiency and effec-tiveness of the purchase. The “value for money” criteria must also take into account positive or negative side effects, including impacts on poverty, inequality, gender, environment and access.
7.2.2 Reviewing the effectiveness, efficiency and sustainability of public policies
The first step consists of:
• Listing the existing policies and programmes to address a national objective/SDG target in a country
• Assessing the gaps: Do these policies/programmes address the priorities identified in the National Development Strategy? Who benefits? Which groups/areas are not covered?
• If existing programmes were scaled up, would they redress the existing social or economic prob-lems and achieve a national objective? Are they the right programmes? How do they contribute to achieving the SDGs and national development goals? Are there any adjustments that can be done to improve efficient delivery?
• Are there more cost-effective options to meet the social needs identified in the National Develop-ment Strategy?
In general, all countries have some social, economic and environmental policies in place. However, the effectiveness of existing programmes is often limited due to:
• Limited coverage: a number of social programmes are designed to benefit higher income segments and population in urban areas, with less focus on people in the informal sector in rural areas and not adequately covered by many public services.
• Inadequate policy design: Often programmes were designed long ago and require significant improvements in equity and efficiency. Many sectoral policies designed in the 1980s-90s are inadequate to generate decent employment, equity and social cohesion, or maximize synergies with economic development (e.g. residual/minimal public policies, labour market flexibilization, fees-for-services); they require re-thinking.
• Insufficient funds: Developing country governments traditionally have invested little in social sectors, especially during the 1980s and 1990s.
• Under-funded recurrent expenditures: Although recurrent expenditures like salaries of civil servants absorb most of the national budget in developing countries, they remain under-funded. Salaries of qualified staff should be a priority; social development happens because of human care (as discussed, earlier, a teacher does not need a school to teach, and many countries correctly started by expanding low-cost medical staff, e.g. China’s “barefoot doctors”). If resources are increased, they need to better cover recurrent expenditures, such as medical supplies or textbooks, as they are critical to programme success.
CHAPTER 7 | PUBLIC EXPENDITURE REPRIORITIZATION 123
• Limited capital investments: Capital expenditures (and even expenditures for rehabilitation of existing facilities) tend to be limited in developing countries, often financed by donors. Capital investments are necessary, particularly in rural areas; but new construction should be carefully evaluated to assess the social cost-benefit, in the context of the overall budget, as infrastructure is expensive and creates new recurrent costs (see discussion in chapter 3).
• Funds incorrectly distributed within a sector: Often, most funds go to high-cost low-impact programmes that benefit a few, e.g., highly specialized hospitals in the capital, instead of being invested in high-impact programmes that benefit the majority, such as more and better funded and staffed local health clinics.
• Lack of inter-sectoral linkages, wasting development potential; for instance, providing wheel-chairs for people who need them can help to promote mobility, but unless accessible urban infrastructure and transport exist, people in wheelchairs cannot have independent living. Similar, spending heavily in education without parallel macroeconomic policies that generate employ-ment – education alone does not produce jobs.
Evaluating the cost-effectiveness of a programme/policy requires impartial assessment of the following:
• Programme coverage (beneficiaries and benefits)
• The population covered by a programme/policy, including the distributional impacts on the different population groups of a country.
• The adequacy of benefits to serve the identified needs of people.
• The cost of the programme/policy (as a percentage of gross domestic product and total public expenditure), including contingent liabilities, as a result of possible government guarantees to the programmes (e.g. public-private partnerships or PPPs), compared to other programmes (e.g. public programmes tend to be more cost-effective).
• Administrative costs, as a percentage of total costs, and how the costs compare with other programmes (e.g. means-testing targeting tends to be expensive);
• Implementation capacity to deliver programmes (e.g. complex targeted programmes should be avoided where local government capacity is low);
• Governance concerns: staff absenteeism; evidence that resources may be siphoned off.
• Long-term social benefits and positive externalities on development
• The opportunity cost of the policy/programme and its alternatives.
Assessing the sustainability and affordability of public policies and programmes is an essential part of PERs. Is there sufficient fiscal space to maintain the programme over time? This requires:
• An estimation of projected costs and a country’s revenues.
• The government’s medium-term sectoral plans and expected changes in allocations as a result of development priorities. The existence of an MTEF is very helpful here.
• If there is a financing gap, evaluate possible internal sources of funding, starting by use of non- productive expenditures (e.g. military, representational) or expenditures with low social returns (e.g. benefiting only upper income groups).
7.2.3 Value for money: Beyond simple financial cost-benefit analysis
In reviewing public expenditure, one overarching objective is to enhance the quality of various expen-diture components. But how to judge the quality? Public expenditures may fulfil various objectives, such as fairness and redistribution, macroeconomic stabilization, homogeneous service coverage across the whole national territory, sustainable development through environmental protection. These objectives may differ not only across functions of government but also within them.
124 FISCAL SPACE FOR SOCIAL PROTECTION | A Handbook for Assessing Financing Options
To provide examples, social protection mainly fulfils income-smoothing as well as redistributive and stabilization objectives. For a number of public goods and services (such as education, healthcare or infrastructure), policy-makers need to ensure sufficient coverage for all areas of the country or sectors of the population, which may conflict with pure cost-effectiveness considerations.
Within social protection, a distinction could be made between schemes more directly linked to redistribution and shock stabilization (e.g. unemployment benefits and minimum income) and other schemes such as pensions which aim at income smoothing over the life cycle. As different goals do not necessarily lead to similar recommendations as regards the expenditure mix and the design of policies within each expenditure item, the meaning of high quality expenditure depends on the goal to which greater importance is attached.
Once objectives are defined, the efficiency (i.e. maximizing results for given inputs) and cost- effectiveness (i.e. obtaining a certain level of results with minimum inputs) of spending in reaching them should be the centre of the analysis. This essentially refers to the ratio between inputs used to produce public goods/services and outputs. Such analysis entails complex measurement issues, as figures on the level of expenditures are not informative of their efficiency (for example, a large spending on education does not automatically lead to a high educational attainment) and have to be complemented by output indicators.
With respect to inputs, indicators on levels of expenditures, even with a more detailed breakdown than the classification of functions of government (COFOG) data, need ideally to be complemented by further indicators to assess the way policies are designed and implemented within different functions and sub-sectors of the administration. This includes, for instance, indicators such as the number of teachers per one thousand inhabitants, the number of pupils per class or per teacher in the case of education, or the number of hospital beds per one thousand inhabitants for healthcare. In addition, more efficient public procurement, which account for between 15 per cent (low-income countries) and 20 per cent (high-income countries) of GDP, can also largely contribute to raise the overall efficiency level of public expenditure.
The identification of appropriate output indicators can be controversial and remains to some extent arbitrary, while also posing significant statistical problems, as indicators are often available for a reduced number of countries and not sufficiently disaggregated by different socio-economic or income groups. To compound the problem, they are not regularly calculated and updated which prevents their use for tracking progress over time and also they come from different sources raising problems of comparability with other indicators.
Moreover, the ultimate goal is to assess the contribution of public expenditures to socioeco-nomic outcomes, such as growth, employment, reductions in poverty, inequality and vulnerability or improvement of population’s access to quality healthcare for enhancing living conditions and economic security, rather than pure material outputs. The link between inputs, outputs and outcomes is even more complex and still far from being fully understood across most government functions.
The transmission links between expenditure and socio-economic or developmental objectives differ across different functions/types, calling for a specific analysis of each individual spending item. Furthermore, there are cases when expenditure in one area affects outcomes in other areas, e.g. expenditure aimed at improving the environmental quality of the air has a positive effect on health thereby reducing the need for healthcare expenditure and bringing overall efficiency gains (i.e. reduction in work days lost for sickness leaves).
CHAPTER 7 | PUBLIC EXPENDITURE REPRIORITIZATION 125
7.2.4 Challenges of PERs
The design, conduct and implementation of PERs are highly complex processes requiring strong expertise in many fields: knowledge of administrative processes, data analysis and cost/saving esti-mation, transformation of complex organizations, project management etc. Moreover, PERs can be time-consuming and may take a number of years to complete for the entire public sector or govern-ment functions. PERs are also very expensive. For example, the cost of the ten Public Environmental Expenditure Reviews (PEERs) reviewed by Swanson and Lunderthors in 2003 averaged US$ 200,000 for a full review (see Swanson and Lundethors, 2003). Recently, shorter PER exercises have been proposed, to deliver faster results. Different methodologies have been developed to assess the efficiency and the effectiveness of government expenditures, which all provide relevant information, but none is flawless. Concerns for quality of public expenditure through increased linkage of spending to measurable results have in recent years led many countries (especially in the OECD) to the performance-based budgeting (discussed in chapter 3) for a better fund allocation in the budgetary process across all policy areas. Social budgeting and gender-budgeting (discussed also in chapter 3) are two other institutionalized processes. They can result in significant adjustments to the budgetary process for budgetary plan-ning exercises to enhance allocation, efficiency/effectiveness and sustainability of public spending in desirable programmes/sectors, such as social protection and gender-mainstreaming.
Finally, what is needed is inculcating a culture of openness and transparency to enable public scrutiny and effective participation by stakeholders, especially by CSOs, including independent researchers, trade unions, business community and media, as discussed in chapter 3. Social dialogue and public scrutiny can quickly identify corruptions and effectiveness of government expenditure. Thus, they allow replacing high-cost/low-impact investments, eliminate inefficiencies and fight corruption. They can create political support to withstand resistance from inefficient and ineffective programmes.
7.3 CONCLUDING REMARKS
Expenditure reprioritization does not create new fiscal space in the overall budget, but it is an option to increase the share of government spending on social protection by discontinuing less socially desirable/less relevant activities or replacing high-cost, low-impact investments with others with larger social impacts.
There is no one-size-fits-all methodology for spending reviews or expenditure reprioritization, and some can be very complex as well as costly and time consuming. Yet, expenditure reviews can be done reasonably rapidly by following some simple steps beginning with identifying the gaps, for instance coverage shortfalls in the case of social protection in the country in question, based on the objectives agreed in National Development Strategies. This will determine the financing needs vis-à-vis the country’s public expenditure shares of different sectors and programmes, and will provide indication of the relative over-funding and under-funding of different sectors/programmes. Finally, as a cross-check the budgetary process should examine the public economic/functional expenditure trends to identify areas for cost control, especially to minimize leakages/wastage due to inefficiency, over-staffing and corruption. An expenditure reprioritization exercise should be part of regular budgetary process for ensuring desired public policy outcomes of expenditure allocations.
126 FISCAL SPACE FOR SOCIAL PROTECTION | A Handbook for Assessing Financing Options
Regressive reprioritization, such as austerity cuts, should be avoided as it leads to detrimental social impacts. On the other hand, progressive reprioritization is resisted by the groups benefiting from the status quo. Interest groups play an important role in determining public policy priorities and budgetary allocations. Informed tripartite social dialogue and open public debates involving representatives from employers and workers organizations, CSOs, and independent researchers can neutralize interest group pressure and help find fiscal space for expanding social protection coverage. However, it should be borne in mind that expenditure reviews and reprioritizations do not generally yield substantial savings to be used for expanding social protection coverage within the overall fiscal sustainability parameters. Reprioritization is usually sensitive and therefore politically difficult.
7.4 KEY DOCUMENTS AND DATA SOURCES
ECLAC. 2017. Training manual: the design and conduct of Public Expenditure Reviews in Carib-bean countries (Port Spain: United Nations Economic Commission for LatinAmerica and the Caribbean).
A comprehensive easy-to-read manual that illustrates step by step the main areas of Public Expen-diture Reviews.
Pradhan, S. 1996. Evaluating Public Spending: A Framework for Public Expenditure Reviews, World Bank Discussion Papers No. 323 (Washington D.C.: The World Bank).
This is one of the earliest papers that provides a framework for systematic evaluation of public expenditures. It illustrates how this framework can be applied to analyse broad allocations of spending within and across sectors, drawing upon some key findings and country examples from major sectors (e.g., health, education, and infrastructure). The paper should be useful to policy-makers in developing countries, staff in donor organizations, as well as researchers working on public expenditure issues.
Mogues, T. 2012. What determines public expenditure allocations?: A review of theories and implications for agricultural public investment, ESA Working paper No. 12-06. (Rome: FAO).
This paper addresses the determinants of public expenditure policies, by reviewing theories and empirical investigations of what features explain the budget process and how the various attributes of actors—including politicians, bureaucrats, interest groups, and donors—and of institutions and political and economic governance environments affect the prioritization of public investments.
Data sourcesGovernment finance statistics – revenues and expenditures – are available from:
• Ministry of Finance, National Budget documents
• IMF, Government Finance Statistics;
• World Bank, World Development Indicators
CHAPTER 7 | PUBLIC EXPENDITURE REPRIORITIZATION 127
Learning accomplishments
After completing this chapter, the reader should:
• Understand public expenditure reprioritization as an option to finance social protection;
• Know how to conduct a rapid assessment of public expenditures for reprioritization;
• Know about the basics of more rigorous public expenditure reviews (PERs);
• Have a good understanding of data and other limitations, especially of expertise and skills needed for a more rigorous PER;
• Appreciate the importance of political economy considerations and the critical role that social dialogue with trade unions, employers, CSOs and governments can play in both influencing budgetary allocations and revenue measures;
• Know about the key resources and data sources.

CHAPTER 8 | USING FISCAL AND FOREIGN EXCHANGE RESERVES 129
CHAPTER 8. USING FISCAL AND FOREIGN EXCHANGE RESERVES
LEARNING OBJECTIVES
• Know the concepts of fiscal and foreign exchange reserves and the rationales for holding them
• Appreciate the reasons and costs of holding excess fiscal and foreign exchange reserves
• Understand the rationale as well as the disadvantages of sovereign wealth funds
• Learn how excess reserves can be used to create fiscal space for social protection and socio-economic development, through public investment and vehicles such as national and regional development banks
• Know about key resources and data sources
CONTENTS
• Fiscal reserves: Their sources and purposes
• Sovereign wealth funds: Scale and rationale
• Foreign exchange reserves: Scale and rationale
• Excess reserves for social development: Public investments and development banks
• Key documents and data sources
In recent years, especially since the late 1990s, many developing countries have accumulated signif-icant amount of fiscal and foreign exchange reserves, often as a policy of “self-insurance” to prevent the need to borrow in case of crises/shocks. This has been mainly a result of commodity price booms, especially in Africa, Central Asia and Middle East. Some remittance earning countries, such as Bangladesh, have also accumulated foreign exchange reserves over and above what is deemed necessary for balance of payments purposes. Following the 1997-98 Asian Financial Crisis, some East and Southeast Asian countries have also accumulated large sums of foreign reserves as a precautionary measures against sudden capital flights or speculative attacks on their currencies.
130 FISCAL SPACE FOR SOCIAL PROTECTION | A Handbook for Assessing Financing Options
This chapter provides an overview of fiscal and foreign exchange reserves in developing countries, and reflects on their rationales. It also discusses pros and cons of large fiscal and foreign reserves and highlights how such reserves can be used for meeting social and development needs sustainably.
8.1 WHY USE FISCAL AND FOREIGN EXCHANGE RESERVES
Fiscal reserves and central bank foreign exchange reserves (also known as international reserves) are potential sources of financing for investments in socio-economic development. Fiscal reserves are collected through government budget surpluses, profits of state-owned companies, privatiza-tion receipts or other government net income (the classic example is export revenues from natural resources, such as oil). Foreign exchange reserves, on the other hand, are accumulated through foreign exchange market interventions by central banks within the context of current account surpluses and/or capital inflows.
Developing countries’ fiscal reserves in 2017 in sovereign wealth funds (SWFs) were over US$ 2.5 trillion (US$ 616.5 billion, excluding China) (Table 8.1). Total foreign exchange reserves, excluding gold, of developing countries reached at a peak in 2015 to more than US$ 7 trillion (Figure 8.1). This is a huge sum of money that can be potentially accessed for developmental purposes.
There may be good reasons for accumulating fiscal and foreign exchange reserves, especially for commodity exporters, as they face boom-bust cycles. By building up fiscal reserves during good times, countries can consis-tently implement counter-cyclical fiscal policies, i.e., increase public expenditure in bad times. In other words, fiscal reserves enable countries to cope with the conse-quences of unforeseen events in the world or the region that would have serious implications for public finance. Reserves, thus accumulated, can be kept at the Central Bank, or used for national development through National or Regional Development Banks that would generate returns, or used to create sovereign wealth funds (SWFs) for investing in diversified assets in global capital markets to create fiscal space for the future. Accumulation of excess foreign exchange reserves is aimed to protect the economy from sudden inflows and outflows of large sums of capital.
However, such precautionary actions against external shocks or for stabilization can have a signif-icant social opportunity cost. For example, SWFs and excess foreign exchange reserves at the Central Bank could be used more productively for developmental purposes, such as reducing infra-structure gaps or improving public health, social protection and education systems. That strategy should simultaneously achieve stabilization and development objectives for both present and future generations. Another reason why countries do not use their fiscal and foreign exchange reserves domestically for developmental purposes is a perceived risk of short-run macroeconomic instability in terms of higher inflation and real exchange rate appreciation; however, as explained in Chapter 10, moderate inflation or debt levels do not necessarily cause macroeconomic instability. Thus reserves are signif-icant potential sources of financing for social protection and other social investments.
Fiscal reserves and central bank foreign exchange reserves are potential sources of financing for investments in socio-eco-nomic development accruing to women, children and other social groups.
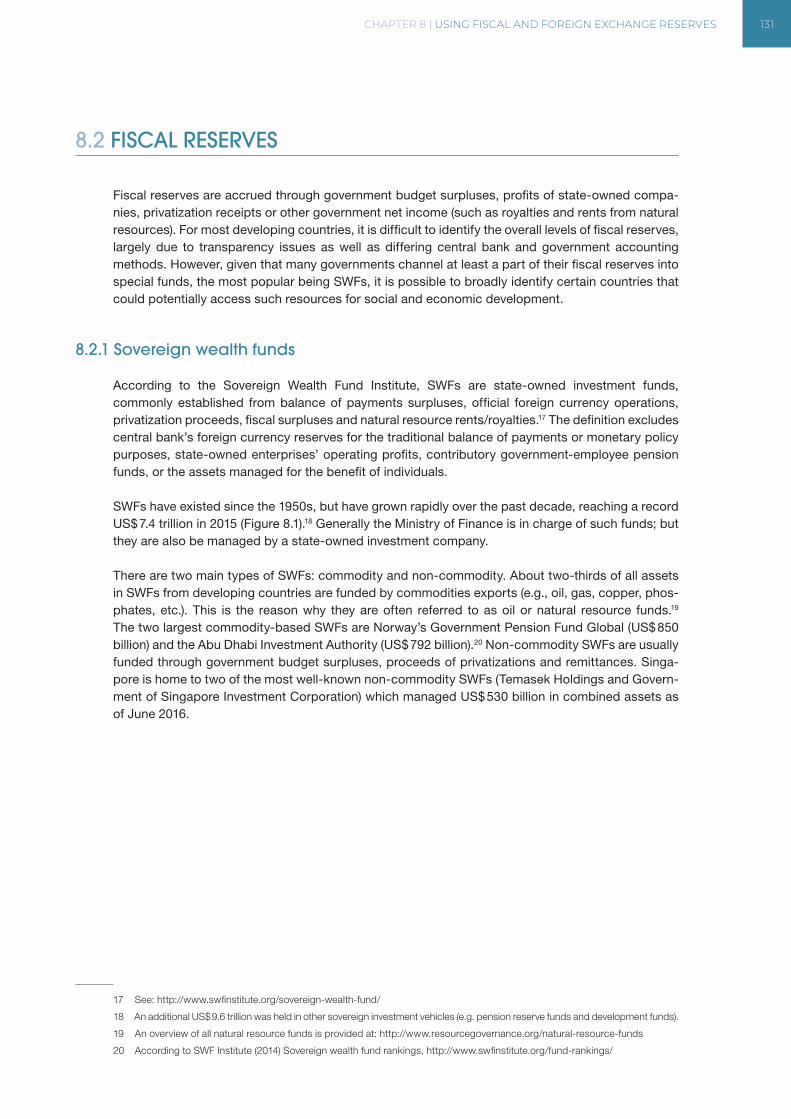
CHAPTER 8 | USING FISCAL AND FOREIGN EXCHANGE RESERVES 131
8.2 FISCAL RESERVES
Fiscal reserves are accrued through government budget surpluses, profits of state-owned compa-nies, privatization receipts or other government net income (such as royalties and rents from natural resources). For most developing countries, it is difficult to identify the overall levels of fiscal reserves, largely due to transparency issues as well as differing central bank and government accounting methods. However, given that many governments channel at least a part of their fiscal reserves into special funds, the most popular being SWFs, it is possible to broadly identify certain countries that could potentially access such resources for social and economic development.
8.2.1 Sovereign wealth funds
According to the Sovereign Wealth Fund Institute, SWFs are state-owned investment funds, commonly established from balance of payments surpluses, official foreign currency operations, privatization proceeds, fiscal surpluses and natural resource rents/royalties.17 The definition excludes central bank’s foreign currency reserves for the traditional balance of payments or monetary policy purposes, state-owned enterprises’ operating profits, contributory government-employee pension funds, or the assets managed for the benefit of individuals.
SWFs have existed since the 1950s, but have grown rapidly over the past decade, reaching a record US$ 7.4 trillion in 2015 (Figure 8.1).18 Generally the Ministry of Finance is in charge of such funds; but they are also be managed by a state-owned investment company.
There are two main types of SWFs: commodity and non-commodity. About two-thirds of all assets in SWFs from developing countries are funded by commodities exports (e.g., oil, gas, copper, phos-phates, etc.). This is the reason why they are often referred to as oil or natural resource funds.19 The two largest commodity-based SWFs are Norway’s Government Pension Fund Global (US$ 850 billion) and the Abu Dhabi Investment Authority (US$ 792 billion).20 Non-commodity SWFs are usually funded through government budget surpluses, proceeds of privatizations and remittances. Singa-pore is home to two of the most well-known non-commodity SWFs (Temasek Holdings and Govern-ment of Singapore Investment Corporation) which managed US$ 530 billion in combined assets as of June 2016.
17 See: http://www.swfinstitute.org/sovereign-wealth-fund/
18 An additional US$ 9.6 trillion was held in other sovereign investment vehicles (e.g. pension reserve funds and development funds).
19 An overview of all natural resource funds is provided at: http://www.resourcegovernance.org/natural-resource-funds
20 According to SWF Institute (2014) Sovereign wealth fund rankings, http://www.swfinstitute.org/fund-rankings/
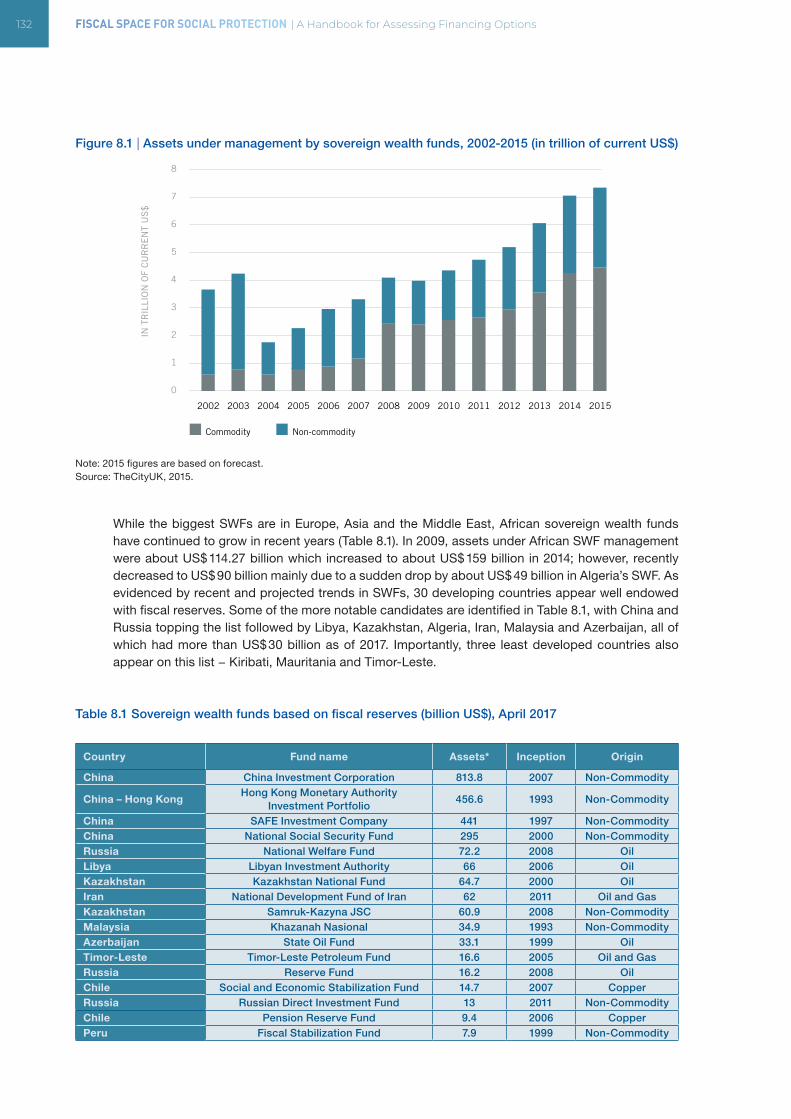
132 FISCAL SPACE FOR SOCIAL PROTECTION | A Handbook for Assessing Financing Options
Figure 8.1 | Assets under management by sovereign wealth funds, 2002-2015 (in trillion of current US$)
Note: 2015 figures are based on forecast.Source: TheCityUK, 2015.
While the biggest SWFs are in Europe, Asia and the Middle East, African sovereign wealth funds have continued to grow in recent years (Table 8.1). In 2009, assets under African SWF management were about US$ 114.27 billion which increased to about US$ 159 billion in 2014; however, recently decreased to US$ 90 billion mainly due to a sudden drop by about US$ 49 billion in Algeria’s SWF. As evidenced by recent and projected trends in SWFs, 30 developing countries appear well endowed with fiscal reserves. Some of the more notable candidates are identified in Table 8.1, with China and Russia topping the list followed by Libya, Kazakhstan, Algeria, Iran, Malaysia and Azerbaijan, all of which had more than US$ 30 billion as of 2017. Importantly, three least developed countries also appear on this list − Kiribati, Mauritania and Timor-Leste.
Table 8.1 Sovereign wealth funds based on fiscal reserves (billion US$), April 2017
Country Fund name Assets* Inception Origin
China China Investment Corporation 813.8 2007 Non-Commodity
China – Hong KongHong Kong Monetary Authority
Investment Portfolio456.6 1993 Non-Commodity
China SAFE Investment Company 441 1997 Non-CommodityChina National Social Security Fund 295 2000 Non-CommodityRussia National Welfare Fund 72.2 2008 OilLibya Libyan Investment Authority 66 2006 OilKazakhstan Kazakhstan National Fund 64.7 2000 OilIran National Development Fund of Iran 62 2011 Oil and GasKazakhstan Samruk-Kazyna JSC 60.9 2008 Non-CommodityMalaysia Khazanah Nasional 34.9 1993 Non-CommodityAzerbaijan State Oil Fund 33.1 1999 OilTimor-Leste Timor-Leste Petroleum Fund 16.6 2005 Oil and GasRussia Reserve Fund 16.2 2008 OilChile Social and Economic Stabilization Fund 14.7 2007 CopperRussia Russian Direct Investment Fund 13 2011 Non-CommodityChile Pension Reserve Fund 9.4 2006 CopperPeru Fiscal Stabilization Fund 7.9 1999 Non-Commodity
IN T
RIL
LIO
N O
F C
UR
RE
NT
US
$
0
1
2
3
4
5
6
7
8
Commodity Non-commodity
2002 2003 2004 2005 2006 2007 2008 2009 2010 2011 2012 2013 2014 2015
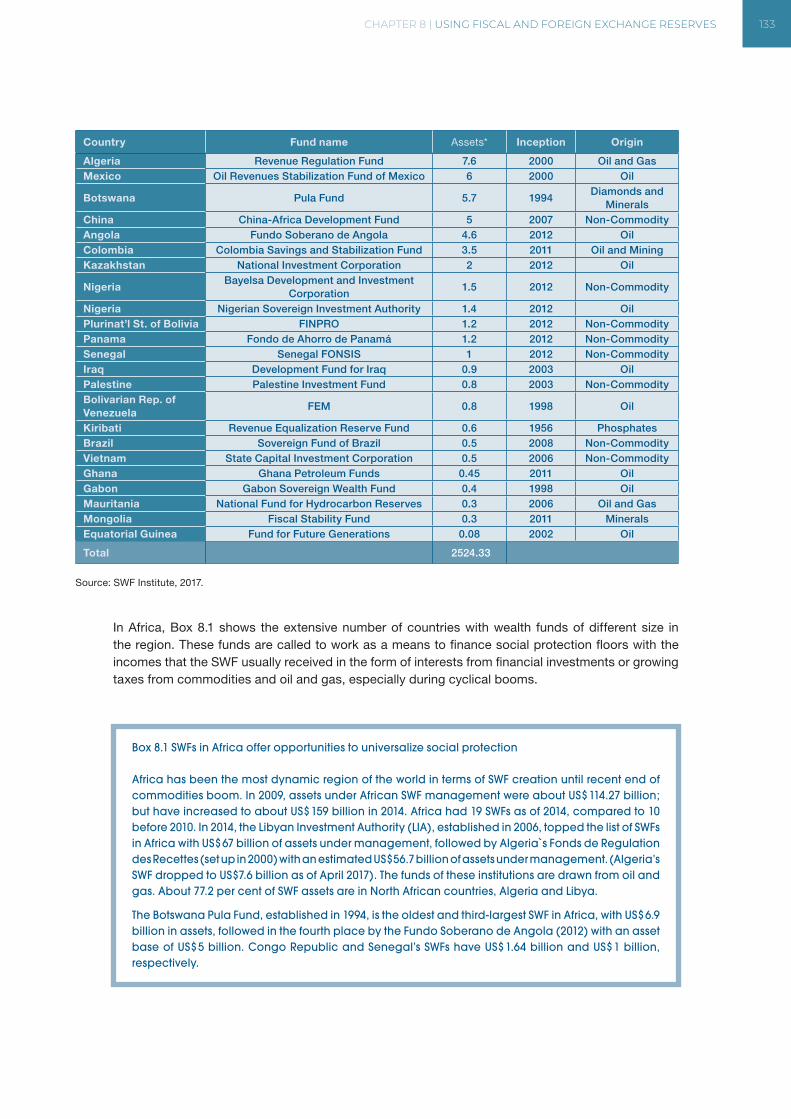
CHAPTER 8 | USING FISCAL AND FOREIGN EXCHANGE RESERVES 133
Country Fund name Assets* Inception Origin
Algeria Revenue Regulation Fund 7.6 2000 Oil and GasMexico Oil Revenues Stabilization Fund of Mexico 6 2000 Oil
Botswana Pula Fund 5.7 1994Diamonds and
MineralsChina China-Africa Development Fund 5 2007 Non-CommodityAngola Fundo Soberano de Angola 4.6 2012 OilColombia Colombia Savings and Stabilization Fund 3.5 2011 Oil and MiningKazakhstan National Investment Corporation 2 2012 Oil
NigeriaBayelsa Development and Investment
Corporation1.5 2012 Non-Commodity
Nigeria Nigerian Sovereign Investment Authority 1.4 2012 OilPlurinat’l St. of Bolivia FINPRO 1.2 2012 Non-CommodityPanama Fondo de Ahorro de Panamá 1.2 2012 Non-CommoditySenegal Senegal FONSIS 1 2012 Non-CommodityIraq Development Fund for Iraq 0.9 2003 OilPalestine Palestine Investment Fund 0.8 2003 Non-CommodityBolivarian Rep. of Venezuela
FEM 0.8 1998 Oil
Kiribati Revenue Equalization Reserve Fund 0.6 1956 PhosphatesBrazil Sovereign Fund of Brazil 0.5 2008 Non-CommodityVietnam State Capital Investment Corporation 0.5 2006 Non-CommodityGhana Ghana Petroleum Funds 0.45 2011 OilGabon Gabon Sovereign Wealth Fund 0.4 1998 OilMauritania National Fund for Hydrocarbon Reserves 0.3 2006 Oil and GasMongolia Fiscal Stability Fund 0.3 2011 MineralsEquatorial Guinea Fund for Future Generations 0.08 2002 Oil
Total 2524.33
Source: SWF Institute, 2017.
In Africa, Box 8.1 shows the extensive number of countries with wealth funds of different size in the region. These funds are called to work as a means to finance social protection floors with the incomes that the SWF usually received in the form of interests from financial investments or growing taxes from commodities and oil and gas, especially during cyclical booms.
Box 8.1 SWFs in Africa offer opportunities to universalize social protection
Africa has been the most dynamic region of the world in terms of SWF creation until recent end of commodities boom. In 2009, assets under African SWF management were about US$ 114.27 billion; but have increased to about US$ 159 billion in 2014. Africa had 19 SWFs as of 2014, compared to 10 before 2010. In 2014, the Libyan Investment Authority (LIA), established in 2006, topped the list of SWFs in Africa with US$ 67 billion of assets under management, followed by Algeria s Fonds de Regulation des Recettes (set up in 2000) with an estimated US$56.7 billion of assets under management. (Algeria’s SWF dropped to US$7.6 billion as of April 2017). The funds of these institutions are drawn from oil and gas. About 77.2 per cent of SWF assets are in North African countries, Algeria and Libya.
The Botswana Pula Fund, established in 1994, is the oldest and third-largest SWF in Africa, with US$ 6.9 billion in assets, followed in the fourth place by the Fundo Soberano de Angola (2012) with an asset base of US$ 5 billion. Congo Republic and Senegal’s SWFs have US$ 1.64 billion and US$ 1 billion, respectively.
134 FISCAL SPACE FOR SOCIAL PROTECTION | A Handbook for Assessing Financing Options
African SWFs are largely commodity based, with 14 being sourced from oil and gas, 3 from other minerals, and two from non-commodity sources. About 83 per cent of African SWF assets are drawn from oil and 17 per cent from minerals and other sources. Partly given their role in smoothing out economic and fiscal cycles, most African SWFs have at least a stabilization purpose. However, most African SWFs do not have clear fiscal rules to allow them to cover some fiscal deficits during economic downturns.
Other diverse motives range from intergenerational savings accumulation, buffers against economic shocks, and wealth diversification and domestic investment (e.g. in infrastructure). About 33 per cent of African SWFs invested in infrastructure assets. Many SWFs (78 per cent) invested in fixed income assets, reflecting the dominance of the stabilization role.
Given Africa’s large human development deficits, and extreme vulnerability and economic inse-curity of its population, African SWFs should consider using incomes from SWFs to expand social protection floors with an aim to universalize their social protection. This should also include devel-oping clear guidelines to enable the use of SWF incomes during economic downturns.
Source: Hove, 2016.
8.2.2 Arguments for SWFs
The primary functions of a SWF are to stabilize the country’s economy through diversification and to generate wealth for future generations. Hence they are sometimes called “stabilization funds” and “future funds”. SWFs can have the following advantages:
• Protect and stabilize the budget and economy from excess volatility in revenues/ exports
• Assist monetary authorities dissipate unwanted liquidity due to foreign exchange inflows by investing in international capital market
• Help diversify away from non-renewable commodity dependence by preventing appreciation of exchange rates due to large inflows of foreign exchange earnings from commodity exports
• Earn greater returns by investing in diversified assets than foreign exchange reserves which are generally kept in low yield US Treasury bonds, and hence increase savings for future generations
• Help long-term capital growth to sustainably fund social and economic development programmes
SWFs are invested in different financial assets in the international capital market to minimize risks and maximize returns. A number of reasons are used for this strategy of investing in international capital market instead of domestically. First, investment projects or social programmes funded through fiscal surpluses from commodity exports may not be sustainable due to uncertainty or volatility of international commodity prices and demand as has been seen in Bolivarian Republic of Venezuela, especially when a country fails to adequately diversify its economy away from commodity depen-dence during the boom time. Second, many developing countries may not have the institutional and administrative capacity to prepare enough projects to absorb large amounts of spending (Box 8.2). There could also be supply rigidity which may spill-over into balance of payments deficits and/or higher levels of inflation. Third, spending on non-tradable sectors may also cause exchange rate appreciation due to skill shortages and hence adversely affect economic diversification. On the other hand, investing foreign exchange earnings abroad helps maintain an undervalued exchange rate which boost exports, and thus creates a virtuous circle of exports-foreign exchange earnings-export led growth.
CHAPTER 8 | USING FISCAL AND FOREIGN EXCHANGE RESERVES 135
8.2.3 Disadvantages of SWFs
However, SWFs can have following important disadvantages, particularly when their level of fund accumulation is too high:
• Expose developing countries to financial crises or economic shocks in developed countries where these funds are invested.
• High social opportunity cost, especially in countries with high levels of poverty and development deficits – many have questioned why funds from Southern countries must be invested in interna-tional capital markets often in the North.
SWFs from the South mostly buy assets, real estates, sovereign and corporate debts, private equity, hedge funds and commodity stocks in the North, which can expose the countries in the South to financial crises or economic shocks in the North. Many have also questioned the logic of investing earned public income for capital market growth in order to spend at some future point in time, when those resources could be invested in needed social and economic goods and services at home today. Thus, the concerns of vulnerability, risks and social opportunity cost have led many to argue against SWFs and in favour of spending fiscal surpluses domestically on worthwhile social and investment projects. This can be very relevant especially in countries with high levels of poverty and other deprivations (Box 8.2).
Therefore, policymakers will have to weigh the risks and opportunity costs against the social benefits of using fiscal or foreign exchange earning surpluses. There must be a balance between saving for the future and addressing the current development needs, taking into account country specific institutional and administrative capacity as well as overall circumstances.
Box 8.2 When resources and poverty abound: The paradox of Timor-Leste
A number of countries are sitting atop abundant natural resource funds, yet social indicators and progress toward development objectives remain dismal. One such case is Timor-Leste where 41.8 per cent of the population lives below the national poverty line; 45.4 per cent of the population has access to electricity; and for every 1,000 babies born, 45 die before their first birthday. Its human development index (HDI), after rising from 0.470 in 2000 to 0.620 in 2012, declined to 0.605 in 2015. Yet, at the same time, Timor-Leste has an estimated US$ 16.6 billion stored in a SWF. If these funds were simply divided up amongst the population, they could, in effect, increase the average Timorese per capita income many fold. So why is not the government using the available resources to ramp up investments in its people?
Timor-Leste’s government faces many development challenges. In addition to rampant poverty and unemployment, infrastructure remains dilapidated following years of conflict, and, despite vast petroleum reserves, it is the most oil dependent country in the world. Perhaps the biggest challenge, however, is the lack of institutional capacity, which makes it difficult for the government to effectively deliver public goods and services, especially to the poorest groups. As a result, present spending levels have stretched administrative capacities and created bottlenecks in the economy. The govern-ment has recognized the existing constraints and developed a plan to address budget under-exe-cution and to build administrative capacities; possibilities for procuring external capacities are also being explored for areas that are locally unavailable. With capacity development–especially “investing in investing”—now at the fore of the government’s agenda, further tapping into available fiscal reserves could lead to a big return on socio-eco-nomic investments in the near future.
Many have questioned why funds from Southern countries in sovereign wealth funds must be invested in international capital markets in the North
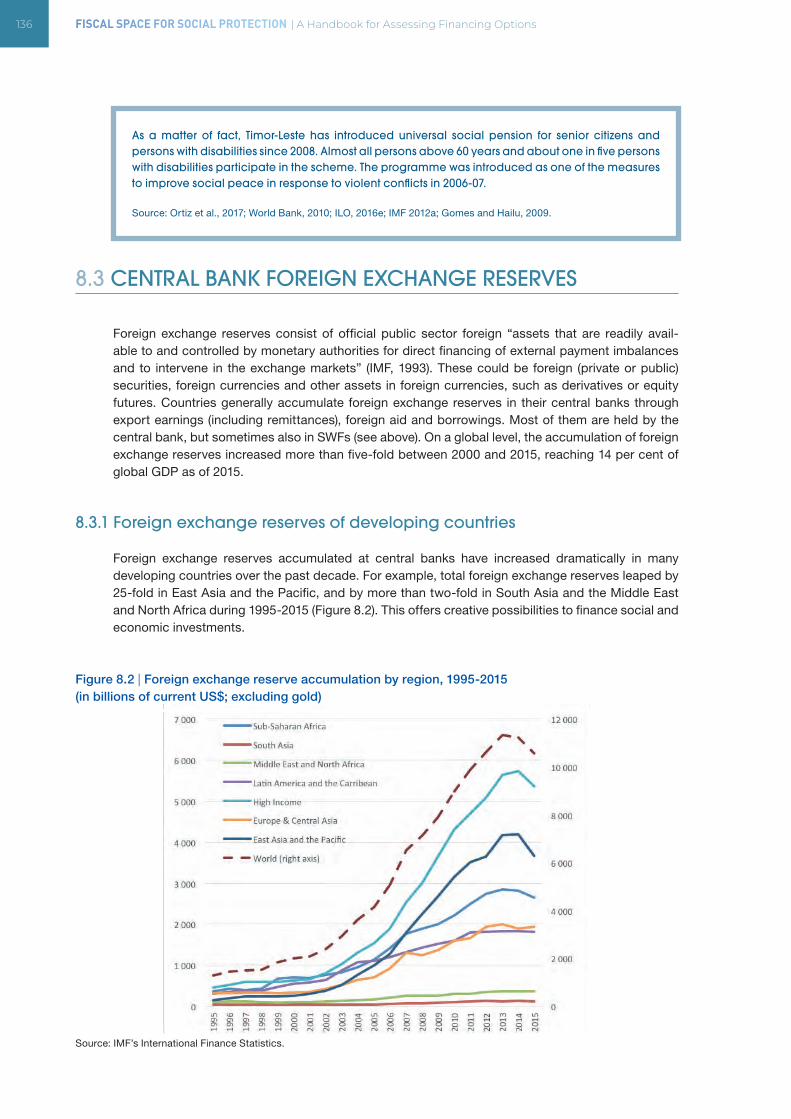
136 FISCAL SPACE FOR SOCIAL PROTECTION | A Handbook for Assessing Financing Options
As a matter of fact, Timor-Leste has introduced universal social pension for senior citizens and persons with disabilities since 2008. Almost all persons above 60 years and about one in five persons with disabilities participate in the scheme. The programme was introduced as one of the measures to improve social peace in response to violent conflicts in 2006-07.
Source: Ortiz et al., 2017; World Bank, 2010; ILO, 2016e; IMF 2012a; Gomes and Hailu, 2009.
8.3 CENTRAL BANK FOREIGN EXCHANGE RESERVES
Foreign exchange reserves consist of official public sector foreign “assets that are readily avail-able to and controlled by monetary authorities for direct financing of external payment imbalances and to intervene in the exchange markets” (IMF, 1993). These could be foreign (private or public) securities, foreign currencies and other assets in foreign currencies, such as derivatives or equity futures. Countries generally accumulate foreign exchange reserves in their central banks through export earnings (including remittances), foreign aid and borrowings. Most of them are held by the central bank, but sometimes also in SWFs (see above). On a global level, the accumulation of foreign exchange reserves increased more than five-fold between 2000 and 2015, reaching 14 per cent of global GDP as of 2015.
8.3.1 Foreign exchange reserves of developing countries
Foreign exchange reserves accumulated at central banks have increased dramatically in many developing countries over the past decade. For example, total foreign exchange reserves leaped by 25-fold in East Asia and the Pacific, and by more than two-fold in South Asia and the Middle East and North Africa during 1995-2015 (Figure 8.2). This offers creative possibilities to finance social and economic investments.
Figure 8.2 | Foreign exchange reserve accumulation by region, 1995-2015 (in billions of current US$; excluding gold)
Source: IMF’s International Finance Statistics.
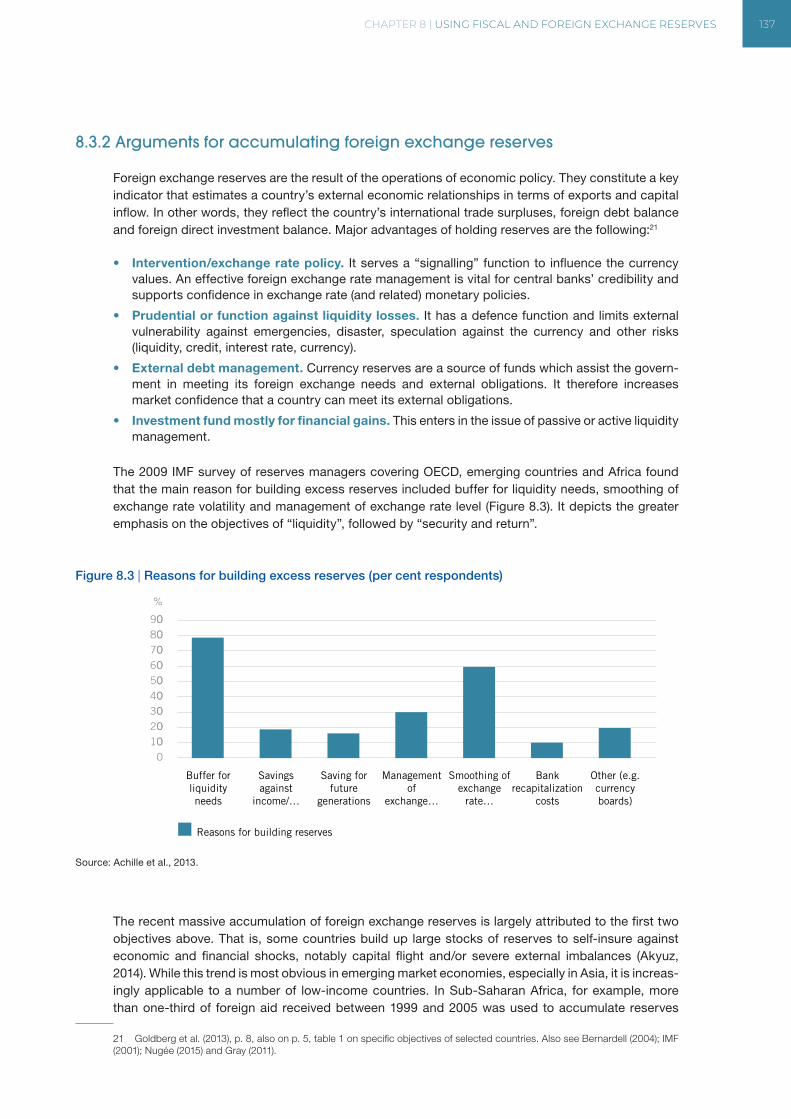
CHAPTER 8 | USING FISCAL AND FOREIGN EXCHANGE RESERVES 137
8.3.2 Arguments for accumulating foreign exchange reserves
Foreign exchange reserves are the result of the operations of economic policy. They constitute a key indicator that estimates a country’s external economic relationships in terms of exports and capital inflow. In other words, they reflect the country’s international trade surpluses, foreign debt balance and foreign direct investment balance. Major advantages of holding reserves are the following:21
• Intervention/exchange rate policy. It serves a “signalling” function to influence the currency values. An effective foreign exchange rate management is vital for central banks’ credibility and supports confidence in exchange rate (and related) monetary policies.
• Prudential or function against liquidity losses. It has a defence function and limits external vulnerability against emergencies, disaster, speculation against the currency and other risks (liquidity, credit, interest rate, currency).
• External debt management. Currency reserves are a source of funds which assist the govern-ment in meeting its foreign exchange needs and external obligations. It therefore increases market confidence that a country can meet its external obligations.
• Investment fund mostly for financial gains. This enters in the issue of passive or active liquidity management.
The 2009 IMF survey of reserves managers covering OECD, emerging countries and Africa found that the main reason for building excess reserves included buffer for liquidity needs, smoothing of exchange rate volatility and management of exchange rate level (Figure 8.3). It depicts the greater emphasis on the objectives of “liquidity”, followed by “security and return”.
Figure 8.3 | Reasons for building excess reserves (per cent respondents)
Source: Achille et al., 2013.
The recent massive accumulation of foreign exchange reserves is largely attributed to the first two objectives above. That is, some countries build up large stocks of reserves to self-insure against economic and financial shocks, notably capital flight and/or severe external imbalances (Akyuz, 2014). While this trend is most obvious in emerging market economies, especially in Asia, it is increas-ingly applicable to a number of low-income countries. In Sub-Saharan Africa, for example, more than one-third of foreign aid received between 1999 and 2005 was used to accumulate reserves
21 Goldberg et al. (2013), p. 8, also on p. 5, table 1 on specific objectives of selected countries. Also see Bernardell (2004); IMF (2001); Nugée (2015) and Gray (2011).
0000000000
102030405060708090
%
Buffer forliquidityneeds
Savingsagainst
income/…
Saving forfuture
generations
Managementof
exchange…
Smoothing ofexchange
rate…
Bankrecapitalization
costs
Other (e.g.currencyboards)
Reasons for building reserves
138 FISCAL SPACE FOR SOCIAL PROTECTION | A Handbook for Assessing Financing Options
(IMF, 2007, p. 42). Secondly, countries also stockpiled foreign exchange reserves as part of broader efforts to stabilize their macro-economy, especially exchange rates. This is most commonly linked to export-led growth strategies based on exchange rate regimes with de jure or de facto pegs to the US dollar or currency baskets. Accumulated foreign exchange reserves help countries to intervene in the exchange market to keep them under-valued to boost exports.
8.3.3 Disadvantages of accumulating foreign reserves
There is a general agreement that countries need foreign currency reserves. However, the strategy is not without challenges. It has at least the following disadvantages:
• Defining the right level is difficult, binding metrics on the ideal level are not readily available.
• Though there is no one “right” level for all types of countries at any time; evidence shows that developing countries are over-accumulating reserves.
• It can have significant developmental opportunity cost. The UN, the IMF and many governments have expressed concerns at the recent rise in size and the strategy itself of reserve accumulation as self-insurance, instead of using the funds for much needed developmental and social needs (Box 8.4).
• It shows the wrong policy priorities: In democracies, it is difficult to justify keeping excess reserves inside Central Bank coffers (normally invested in short-term US Treasury Bills) when there are high human needs, poor and vulnerable populations, and the coverage and quality of education, health and other public services are low.
• Excess foreign exchange reserves accumulated can be a significant source of fiscal space for social and economic development for women and other social groups.
Opinions vary regarding the right level of currency reserves. The difficulty is compounded by the fact that there is no one “right” level for all types of countries at any time. It all depends on circumstances, context, the economic structure and institutions and, last but not least, on the intended objectives (Box 8.3). Countries have to set a minimum required which meets the identified need, but this process is not an exact science. Most countries holds a comfort margin above the set minimum (Nugée, 2015; Gray, 2011).
It is difficult to justify keeping excess reserves inside Central Bank coffers (normally invested in short-term US Treasury Bills) when there are high human needs, poor and vulnerable populations, and the coverage and quality of education, health and other public services are low.
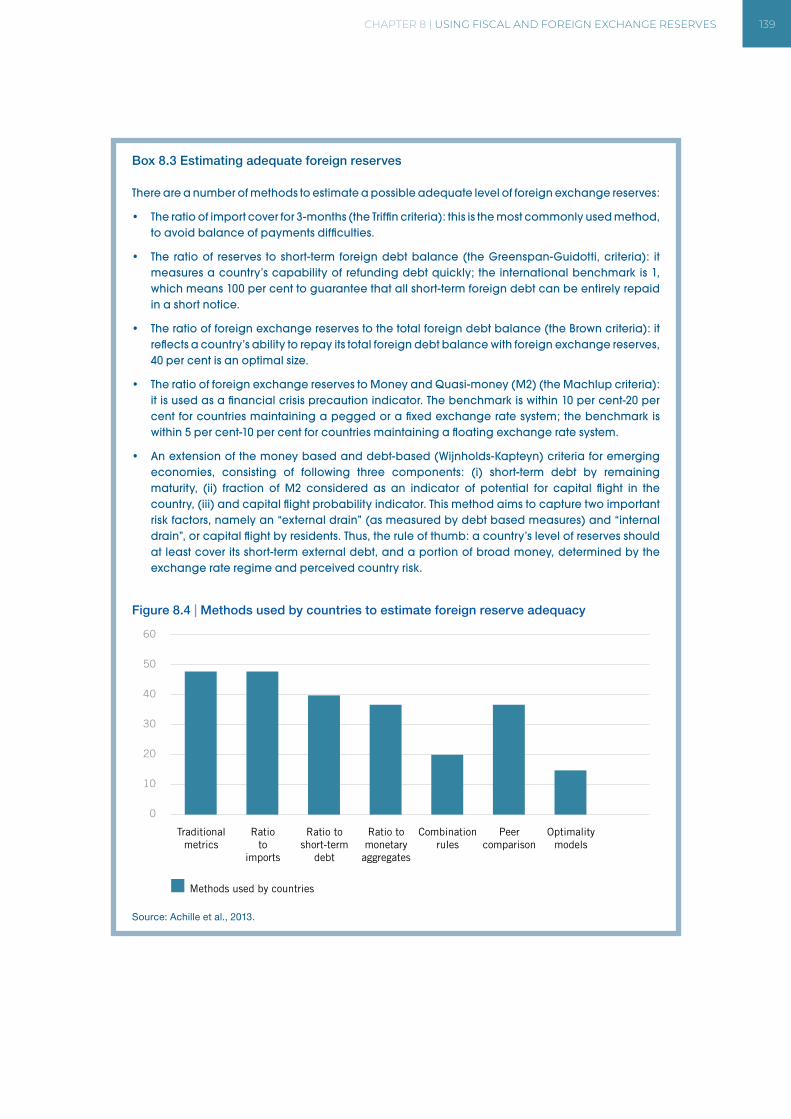
CHAPTER 8 | USING FISCAL AND FOREIGN EXCHANGE RESERVES 139
Box 8.3 Estimating adequate foreign reserves
There are a number of methods to estimate a possible adequate level of foreign exchange reserves:
• The ratio of import cover for 3-months (the Triffin criteria): this is the most commonly used method, to avoid balance of payments difficulties.
• The ratio of reserves to short-term foreign debt balance (the Greenspan-Guidotti, criteria): it measures a country’s capability of refunding debt quickly; the international benchmark is 1, which means 100 per cent to guarantee that all short-term foreign debt can be entirely repaid in a short notice.
• The ratio of foreign exchange reserves to the total foreign debt balance (the Brown criteria): it reflects a country’s ability to repay its total foreign debt balance with foreign exchange reserves, 40 per cent is an optimal size.
• The ratio of foreign exchange reserves to Money and Quasi-money (M2) (the Machlup criteria): it is used as a financial crisis precaution indicator. The benchmark is within 10 per cent-20 per cent for countries maintaining a pegged or a fixed exchange rate system; the benchmark is within 5 per cent-10 per cent for countries maintaining a floating exchange rate system.
• An extension of the money based and debt-based (Wijnholds-Kapteyn) criteria for emerging economies, consisting of following three components: (i) short-term debt by remaining maturity, (ii) fraction of M2 considered as an indicator of potential for capital flight in the country, (iii) and capital flight probability indicator. This method aims to capture two important risk factors, namely an “external drain” (as measured by debt based measures) and “internal drain”, or capital flight by residents. Thus, the rule of thumb: a country’s level of reserves should at least cover its short-term external debt, and a portion of broad money, determined by the exchange rate regime and perceived country risk.
Figure 8.4 | Methods used by countries to estimate foreign reserve adequacy
Source: Achille et al., 2013.
0
10
20
30
40
50
60
%
Traditionalmetrics
Ratioto
imports
Ratio toshort-term
debt
Ratio tomonetary
aggregates
Combinationrules
Peercomparison
Optimalitymodels
Methods used by countries
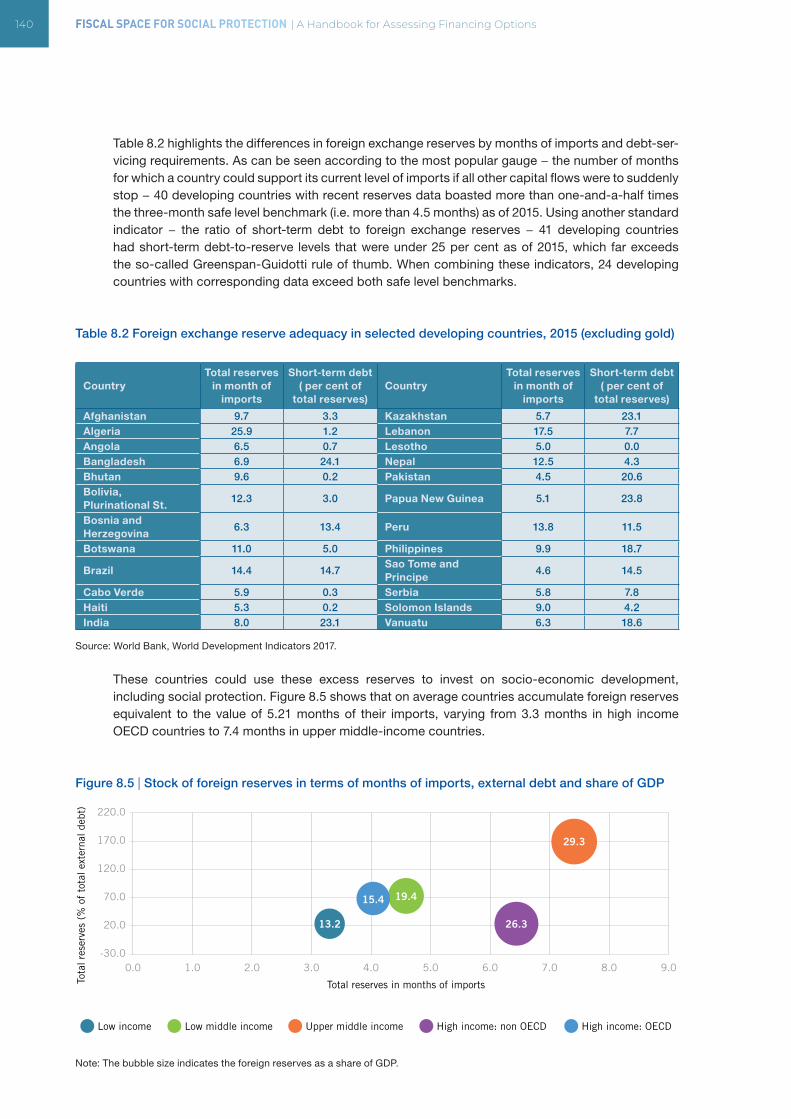
140 FISCAL SPACE FOR SOCIAL PROTECTION | A Handbook for Assessing Financing Options
Table 8.2 highlights the differences in foreign exchange reserves by months of imports and debt-ser-vicing requirements. As can be seen according to the most popular gauge − the number of months for which a country could support its current level of imports if all other capital flows were to suddenly stop − 40 developing countries with recent reserves data boasted more than one-and-a-half times the three-month safe level benchmark (i.e. more than 4.5 months) as of 2015. Using another standard indicator − the ratio of short-term debt to foreign exchange reserves − 41 developing countries had short-term debt-to-reserve levels that were under 25 per cent as of 2015, which far exceeds the so-called Greenspan-Guidotti rule of thumb. When combining these indicators, 24 developing countries with corresponding data exceed both safe level benchmarks.
Table 8.2 Foreign exchange reserve adequacy in selected developing countries, 2015 (excluding gold)
CountryTotal reserves
in month of imports
Short-term debt ( per cent of
total reserves)Country
Total reserves in month of
imports
Short-term debt ( per cent of
total reserves)
Afghanistan 9.7 3.3 Kazakhstan 5.7 23.1Algeria 25.9 1.2 Lebanon 17.5 7.7Angola 6.5 0.7 Lesotho 5.0 0.0Bangladesh 6.9 24.1 Nepal 12.5 4.3Bhutan 9.6 0.2 Pakistan 4.5 20.6Bolivia, Plurinational St.
12.3 3.0 Papua New Guinea 5.1 23.8
Bosnia and Herzegovina
6.3 13.4 Peru 13.8 11.5
Botswana 11.0 5.0 Philippines 9.9 18.7
Brazil 14.4 14.7Sao Tome and Principe
4.6 14.5
Cabo Verde 5.9 0.3 Serbia 5.8 7.8Haiti 5.3 0.2 Solomon Islands 9.0 4.2India 8.0 23.1 Vanuatu 6.3 18.6
Source: World Bank, World Development Indicators 2017.
These countries could use these excess reserves to invest on socio-economic development, including social protection. Figure 8.5 shows that on average countries accumulate foreign reserves equivalent to the value of 5.21 months of their imports, varying from 3.3 months in high income OECD countries to 7.4 months in upper middle-income countries.
Figure 8.5 | Stock of foreign reserves in terms of months of imports, external debt and share of GDP
Note: The bubble size indicates the foreign reserves as a share of GDP.
-30.00.0
20.0
70.0
120.0
170.0
220.0
Low income Low middle income
Total reserves in months of imports
Upper middle income High income: non OECD High income: OECD
1.0 2.0 3.0 4.0 5.0 6.0 7.0 8.0 9.0
Tota
l res
erve
s (%
of
tota
l ext
erna
l deb
t)
13.2
19.4
26.3
29.3
15.4
CHAPTER 8 | USING FISCAL AND FOREIGN EXCHANGE RESERVES 141
In practice, most governments invest their reserves in the US Treasury Bills, considered the least risky investment available with high liquidity (maturity dates as short as four weeks). However, given extremely low returns from the US Treasury Bills, central banks in the developing countries holding excess reserves should re-assess their current risk and investment portfolios. By investing their excess reserves in better yielding, yet safe, portfolios, countries can generate revenues for expanding fiscal space.
Box 8.4 Developmental opportunity cost of excess reserves
Many, including within central banks, the UN and the IMF, have expressed concerns at the recent rise in size and the strategy itself of reserve accumulation as self-insurance. They point to the signif-icant opportunity costs related to the maintenance of funds in currency and asset portfolios that produce returns lower than those of many alternative investments, such as social protection. Nobel laureate J. Stiglitz has underscored that the total social cost of holding excess reserves is around US$ 300 billion per year in developing countries, which is approximately equal to the amount of resources needed by developing countries to fund basic investments to meet the MDGs at the time.For example, estimates show that African countries have held excess foreign currency reserves in the range of US$ 165.5 and US$ 193.6 billion on average per year between 2000 and 2011. This was more than the infrastructure financing gap identified at US$ 93 billion per year; and the social cost of holding these excess reserves could range from 0.35 per cent to 1.67 per cent on average in GDP terms.
Foreign reserves for prudential motivation are to some degree less relevant currently and can be covered by a combination of deposit insurance, standing credit facilities and mostly supervision and regulation. Large reserves normally have low rates of return. Nevertheless, they point to the fact that the inadequacies of the global economic governance architecture, especially the lack of adequate safety-net against sudden capital outflows or liquidity crisis, are the main reasons why countries are engaged in this strategy of self-insurance even if it is costly. Therefore, until better international solutions are put in place, developing countries need to explore alternative uses of foreign exchange reserves for economic and social development. Source: Stiglitz, 2006; Gallagher and Shrestha, 2012; Achille et al., 2013.
8.4 USING FOREIGN RESERVES FOR DEVELOPMENT: PUBLIC INVESTMENTS, NATIONAL AND REGIONAL DEVELOPMENT BANKS
It is therefore important for developing countries to consider how foreign currency reserves can be used for social and economic investments. The simplest way to do so is to do public investments; for example, allocating excess reserves to one or several Ministries so they extend their current programmes. This is the case in many developing countries, such as Botswana and Namibia, who have used the foreign reserves resulting from diamonds and minerals to support universal social protection for all older citizens (Global Partnership for Universal Social Protection, 2017). Also, while central bank reserves are not “free” resources, they could be used as foreign currency liquidity guarantees to lower costs of external borrowing for financing domestic development projects.
In addition to financing domestic projects, developing countries can also seek to achieve longer-term investment returns on their excess foreign exchange through national and regional development banks.
142 FISCAL SPACE FOR SOCIAL PROTECTION | A Handbook for Assessing Financing Options
National development banks are public banks that support investment projects in economic and social development; they are normally funded by public funds such as excess reserves, though sometimes also private funds. National development banks exist in many countries, a typical example is the Bank for National Economic and Social Development of Brazil or BNDES, created in 1952, which has a portfolio supporting mostly large infrastructure projects. Others have more diversified portfolios, including social investments, such as the recently created Bank for Economic and Social Development (BANDES) and the Women’s Development Bank of the Bolivarian Republic of Vene-zuela, under the Ministry of People’s Power for Finance. BANDES supports advice and investments in less developed areas, fostering local development, offering concessional rates to public/social enterprises (such as SOEs, cooperatives or community ownership), on lending to rural, industrial, SME and mutual banks, supporting everything from milk producers to health services. European countries have a significant number of national development banks to support SMEs, often with special women and green investment windows.
Regional Development Banks: South-South transfers are often mediated through the setting up of regional development banks. The earliest South-South multilateral banks and institutions were founded in the Arab and Muslim world during the high oil price period of the 1970s’ as vehicles to transfer resources from the oil-rich countries to poorer countries. One such example is the Islamic Development Bank to foster economic development and social progress of Muslim communities. In 2006, it announced a major funding operation in support of MDG-related expenditures among its member states. The second-largest regional development bank is the Arab Fund for Economic and Social Development (AFESD), which provides soft lending for Arab League countries, mostly for infrastructure projects.
There are also many successful cases outside of the Muslim world, such as the Andean Devel-opment Corporation (CAF), created in 1970, and owned by 19 countries (17 of Latin America and the Caribbean, Spain and Portugal) and 13 private banks in the region. With an asset value of over US$ 32 billion (in 2015), the CAF aims to promote sustainable development through credit opera-tions, non-reimbursable resources, and supporting technical and financial structuring of projects in the public and private sectors of Latin America - its infrastructure investment in the region has surpassed investments by the World Bank and the Inter-American Development Bank. Also in Latin America, countries are collaborating to create alternative regional development banks, such as the Bank of the Bolivarian Alliance for the People of the Americas (ALBA) and the Bank of the South to channel excess foreign exchange reserves to support regional investments (Ortiz, 2008).
Following this trend, the five BRICS countries, Brazil, Russia, India, China and South Africa, launched the new BRICS Development Bank in 2015 with US$ 50 billion in initial capital to fund mostly infra-structure projects, with a focus on Africa. In 2017, it expects to fund 15 new projects with a total value of between US$ 2.5 billion and US$ 3 billion. The bank is also looking to add new members.
In addition, BRICS countries also launched the US$ 100 billion Contingent Reserve Arrangement (CRA) to help countries manage balance-of-payments and exchange rate crises through provision of short-term liquidity. This builds on the Chiang Mai Initiative started in 2010 in Asia, with the 10 countries of the Association of South-East Asian Nations (ASEAN) plus China, Japan and Korea (10+3) contributing US$ 120 billion, later increasing to US$ 240 billion, to serve as a reserve-pooling mechanism to help manage short-term liquidity problems in the region. The Fondo Latinoamericano de Reservas (known by its acronym FLAR) also serves a similar purpose (Griffith-Jones, 2014).
The Asian Infrastructure Investment Bank (AIIB) is another Southern multilateral development bank with a mission to improve social and economic outcomes in Asia, financed mostly by China’s foreign reserves. The starting capital of the bank was US$ 100 billion, equivalent to two-thirds of the capital of the Asian Development Bank and about half that of the World Bank. Headquartered in Beijing, it began operations in January 2016 and has 93 members worldwide.
CHAPTER 8 | USING FISCAL AND FOREIGN EXCHANGE RESERVES 143
8.5 CONCLUDING REMARKS
Fiscal and foreign exchange reserves present possibilities for governments to enhance fiscal space for social protection. There is now consensus that countries should use macro-prudential regula-tions to manage capital flows; there are also regional swap and financial safety-net initiatives. These developments mitigate the precautionary needs for holding excess foreign reserves and hence widen the scope for their domestic use within an accommodating macroeconomic policy framework. This scope is further enhanced by globally low inflationary environment. Considering the huge financing gap, therefore, countries should look for investing at least some of their excess foreign reserves for closing their development deficits. Sovereign wealth funds, national and regional development banks, and simply public expenditures offer a good vehicle for fiscal and foreign reserves to earn better returns than investing them in low return US treasury bonds to enable countries to expand their social protection coverage.
8.6 KEY RESOURCES AND DATA SOURCES
Gallagher, K.; Shrestha, E. 2012. “The Social Cost of Self-Insurance: Financial Crisis, Reserve Accumulation, and Developing Countries”, in Global Policy, Vol. 3, No. 4, pp. 501-509.
This paper examines the extent to which foreign exchange reserves were accumulated during the global financial crisis and the social costs of any excess accumulation, estimated as high as 1.8 per cent of GDP for the developing world. It agrees with the economics profession and in international financial institutions that capital controls can be effective may provide an opportunity for developing nations to buffer their economies from external shock and free up opportunity for productive invest-ment for development purposes.
Griffith-Jones, S, and Ocampo, J.A. 2009, “Sovereign Wealth Funds: A Developing Country Perspective” in Revue d’économie financière, Special Issue, pp. 241- 254.
This paper analyses the rationale for SWFs and the implications for the world economy. It details the evolution of foreign exchange assets in different parts of the developing world, the relative impor-tance of the current vs. the capital accounts as the source of those assets, and discusses some categorizations of SWFs. It also reviews the rapidly growing literature on the determinants of reserve accumulation in developing countries, emphasizing in particular the competitiveness vs. self-insur-ance motives for such accumulation, and briefly examine some of the literature on optimal reserves.
Achille, C.; Mezui, M.; Duru, U. 2013. Holding Excess Foreign Reserves Versus Infrastructure Finance: What should Africa do?, African Development Bank Working Paper No. 178 (Tunis, African Development Bank).
This paper provides a good review of literature on the objectives of reserves management and provides a brief overview on the concepts of reserve adequacy and social cost of excess reserves. It also provides empirical estimates of the optimal level of reserves based on two commonly used methods and investigates the social cost of holding excess reserves in African countries, from 2000 to 2011. It then discusses various options for African countries for investing excess reserves to meet their infrastructure needs.
144 FISCAL SPACE FOR SOCIAL PROTECTION | A Handbook for Assessing Financing Options
Data sources
• IMF, International Financial Statistics (IFS)
• World Bank, Global Economic Monitor database
• Global Finance Database (uses the IMF and World Bank data to calculate foreign reserves of countries)
Learning accomplishments
After reading this chapter, a reader should have a good grasp of:
• The concepts of fiscal and foreign exchange reserves and why countries accumulate excess reserves
• The opportunity costs of holding excess fiscal and foreign exchange reserves
• SWFs and how they and other vehicles can be utilized to invest excess reserves for higher returns to create fiscal space for social protection
• Downsides of SWFs
• Using foreign reserves for development: Public Investment, National and Regional Development Banks
• Key resources and data sources
CHAPTER 9 | MANAGING SOVEREIGN DEBT: BORROWING AND DEBT RESTRUCTURING 145
CHAPTER 9. MANAGING SOVEREIGN DEBT: BORROWING AND DEBT RESTRUCTURING
LEARNING OBJECTIVES
• Understand that countries may either borrow or restructure their debt, and the debate around optimal debt-GDP ratio
• Recognize countries’ room to borrow and know about sources of borrowing
• Learn the scope and options to reduce/restructure debt
• Know about key resources and data sources
CONTENTS
• Borrowing or restructuring sovereign debt for social protection
• Optimal debt levels
• Scope for and sources of borrowing
• The concepts of illegitimate debt
• Scope and options to restructure debt
• Debt audits and the need for an international debt work-out mechanism
It is well accepted that sound debt management is a key principle of a good macroeconomic policy framework conducive to inclusive development. This chapter discusses pros and cons of borrowing and debt restructuring as options for fiscal space – some countries will be able to borrow, and others however need to reduce debt service. The chapter briefly reviews the empirical literature on optimal debt levels (section 9.2). This discussion is crucial as often countries are constrained by a sense of optimality of debt beyond which debt may retard long-term growth. It is followed by identification of developing countries which may be in a position to borrow sustainably and various borrowing options available to them (section 9.3). The chapter then discusses the problems of countries with significant debt, and the possibilities and various alternatives to reduce it through debt workouts (section 9.4).
Managing sovereign debt is another important option to expand fiscal space for social development. Some countries are in a position to borrow, while others must restructure to reduce debt service.
146 FISCAL SPACE FOR SOCIAL PROTECTION | A Handbook for Assessing Financing Options
9.1 BORROWING OR RESTRUCTURING SOVEREIGN DEBT FOR FISCAL SPACE
Borrowing or restructuring existing debt is another important option to expand fiscal space for socio-economic investments with positive impacts on women, children and other population groups.
Borrowing is being generally avoided for the fear of macroeconomic instability which can retard growth. However, as highlighted in chapter 8, this was influenced by the experience of some extreme cases, especially during the debt crisis episode of the 1980s. The fear of growth-retarding debt was over-played and not enough distinction was made between domestic and external public debt. Furthermore, as recent studies at the IMF reveal, debt-financed infrastructure investment and social spending have positive inclusive growth impacts, especially in a slow-growth environment when the actual output is well below the potential (IMF, 2014). Additionally, restrictive macroeconomic policies and fiscal consolidation can harm the economy by adversely affecting productivity growth and contributing to growing inequality. Debt management, including borrowing and restructuring, is critical for a sound macroeconomic framework that supports jobs and national development.
Studies have shown that high external debt distress or debt crisis could lead to a loss of capital market access and a disruption of financial intermediation, hindering economic activities. This is particularly likely when there is no international legal framework for fair and orderly sovereign debt work-outs. Therefore, countries with very high levels of sovereign external debt should seek to restructure existing debt either by debt re-negotiation, debt relief / forgiveness, debt swaps / conver-sion, debt repudiation or default, especially when the legitimacy of the debt is questionable and/or the opportunity cost in terms of worsening social outcomes is high. In recent years, more than 100 countries have successfully re-negotiated and worked out debt, directing debt servicing savings to development, including social programmes (Ortiz et al., 2017). It is now well accepted that countries can create fiscal space to increase social spending through debt restructuring.
9.2 OPTIMAL DEBT LEVEL?
The IMF (2002) uses a 40 per cent long-term debt-to-GDP ratio as the ceiling for developing coun-tries and emerging economies in order to ensure fiscal sustainability and macroeconomic stability. For developed countries, it uses a debt-GDP threshold of 60 per cent. The IMF uses these thresholds in its global macroeconomic model which assigns a dual role to fiscal policy: (1) smoothing out business cycles in the short run; (2) meeting targets for debt sustainability in the long run.
Are these benchmarks really optimal? The IMF paper does not explain the basis for the suggested benchmark for developing and emerging economies. However, one can find some clue in the 2002 ‘sustainability framework’ of the IMF which notes “...an external debt ratio of about 40 percent provides a useful benchmark” (IMF, 2002, p. 25). In interpreting this benchmark, the authors of the report issue an important caveat: “… it bears emphasizing that a debt ratio above 40 percent of GDP by no means necessarily implies a crisis – indeed … there is an 80 percent probability of not having a crisis (even when the debt ratio exceeds 40 percent of GDP).”
The authors of a 2010 IMF study on fiscal space emphasize that the debt limit found in their research “is not an absolute and immutable barrier ... Nor should the limit be interpreted as being the optimal level of public debt” (Ostry et al., 2010). According to this study of 23 advanced countries, the esti-mated debt limits, using the historical interest rate–growth rate differential, range from about 150 to 260 per cent of GDP, with a median of 192 per cent. The study assumes that interest rate–growth rate
CHAPTER 9 | MANAGING SOVEREIGN DEBT: BORROWING AND DEBT RESTRUCTURING 147
differentials are generally projected to be less favourable than the historical experience, and finds the corresponding median long-run debt ratio to be 63 per cent of GDP and the median maximum debt ratio to be 183 per cent of GDP.
The 60 per cent figure was one of a handful of targets European governments set at the start of the 1990s to prepare for economic and monetary union and the eventual formation of the euro zone. There was no hint of optimality; it was the median debt-to-GDP ratio in the EU countries at the time the Maastricht Treaty was negotiated.
As long as there is spare capacity in the economy or unemployment, higher fiscal deficits add to purchasing power and do not exert any upward pressure on interest rates or inflation, nor do they cause large current account deficits. However, it is often claimed that higher public debt today has to be paid by higher tax tomorrow. This is not necessarily true. As long as the interest on the debt is less than the annual increase in nominal GDP, the debt need not be repaid because it will be a shrinking fraction of GDP.
It was pointed out more than half a century ago by Evsey Domar that “the problem of the burden of debt is essentially a problem of achieving a growing national income” (Domar, 1944, p. 822). Evsey Domar again emphasized 50 years later that “the proper solution of the debt problem lies not in tying ourselves into a financial straight-jacket, but in achieving faster growth of the GNP” (Domar, 1993, p. 478) In other words, it seems that the most important challenge is to improve the “quality of the spending that we are financing with debt” and here social protection initiatives appear at the top of the options in terms of cost-effectiveness and long-run impact on development. This observation is highly relevant during the current environment of historically low interest rates with negative real interest rates in many developed countries, and when the need to reignite robust inclusive growth is the greatest since the Great Recession of 2008-2009. As emphasized by UNCTAD, an optimal debt-to-GDP ratio is arbitrary since public debt can be beneficial over the long term if interest payments are less than the annual increase in nominal GDP (UNCTAD, 2011).
It is highly worth to point out recent IMF research findings on the debt-growth relationship. A 2015 IMF research paper concluded that “Empirical evidence suggests that the level at which the debt-to-GDP ratio starts to harm long-run growth is likely to vary with the level of economic development and to depend on other factors, such as the investor base” (IMF, 2015). An earlier 2014 research using historical growth and debt data concluded: “… there is no simple threshold above which debt ratios severely undermine medium-term growth prospects. On the contrary, the association between debt and growth at high levels of debt becomes rather weak when the focus is on any but the shortest-term relationship—especially when compared with the average growth performance of country peers. Furthermore… countries with high but declining debt have historically grown just as fast as their peers.” (Pescatori et al. 2014, p. 42). Thus, the IMF research highlight the following important policy implications:
• Debt levels are weak predictors of growth outcomes, and policies that aim to strengthen growth should thus consider a variety of other factors;
• The fact that high but declining debt does not negatively affect growth suggests a more optimistic assessment of the outlook for countries currently dealing with high debt;
• The absence of a specific debt threshold above which growth prospects are severely impaired means that economies can focus on the net medium-term effects of stabilization policies rather than worry that a short-term excursion above a particular debt threshold will lead to large and negative results.
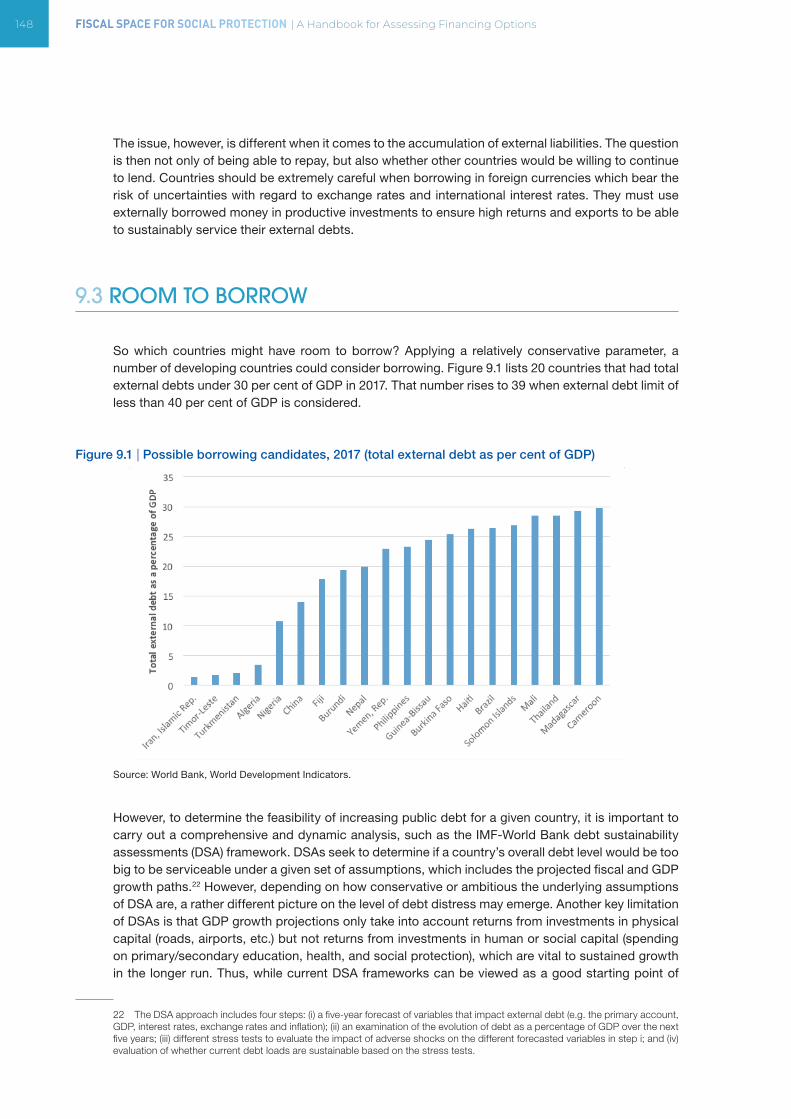
148 FISCAL SPACE FOR SOCIAL PROTECTION | A Handbook for Assessing Financing Options
The issue, however, is different when it comes to the accumulation of external liabilities. The question is then not only of being able to repay, but also whether other countries would be willing to continue to lend. Countries should be extremely careful when borrowing in foreign currencies which bear the risk of uncertainties with regard to exchange rates and international interest rates. They must use externally borrowed money in productive investments to ensure high returns and exports to be able to sustainably service their external debts.
9.3 ROOM TO BORROW
So which countries might have room to borrow? Applying a relatively conservative parameter, a number of developing countries could consider borrowing. Figure 9.1 lists 20 countries that had total external debts under 30 per cent of GDP in 2017. That number rises to 39 when external debt limit of less than 40 per cent of GDP is considered.
Figure 9.1 | Possible borrowing candidates, 2017 (total external debt as per cent of GDP)
Source: World Bank, World Development Indicators.
However, to determine the feasibility of increasing public debt for a given country, it is important to carry out a comprehensive and dynamic analysis, such as the IMF-World Bank debt sustainability assessments (DSA) framework. DSAs seek to determine if a country’s overall debt level would be too big to be serviceable under a given set of assumptions, which includes the projected fiscal and GDP growth paths.22 However, depending on how conservative or ambitious the underlying assumptions of DSA are, a rather different picture on the level of debt distress may emerge. Another key limitation of DSAs is that GDP growth projections only take into account returns from investments in physical capital (roads, airports, etc.) but not returns from investments in human or social capital (spending on primary/secondary education, health, and social protection), which are vital to sustained growth in the longer run. Thus, while current DSA frameworks can be viewed as a good starting point of
22 The DSA approach includes four steps: (i) a five-year forecast of variables that impact external debt (e.g. the primary account, GDP, interest rates, exchange rates and inflation); (ii) an examination of the evolution of debt as a percentage of GDP over the next five years; (iii) different stress tests to evaluate the impact of adverse shocks on the different forecasted variables in step i; and (iv) evaluation of whether current debt loads are sustainable based on the stress tests.
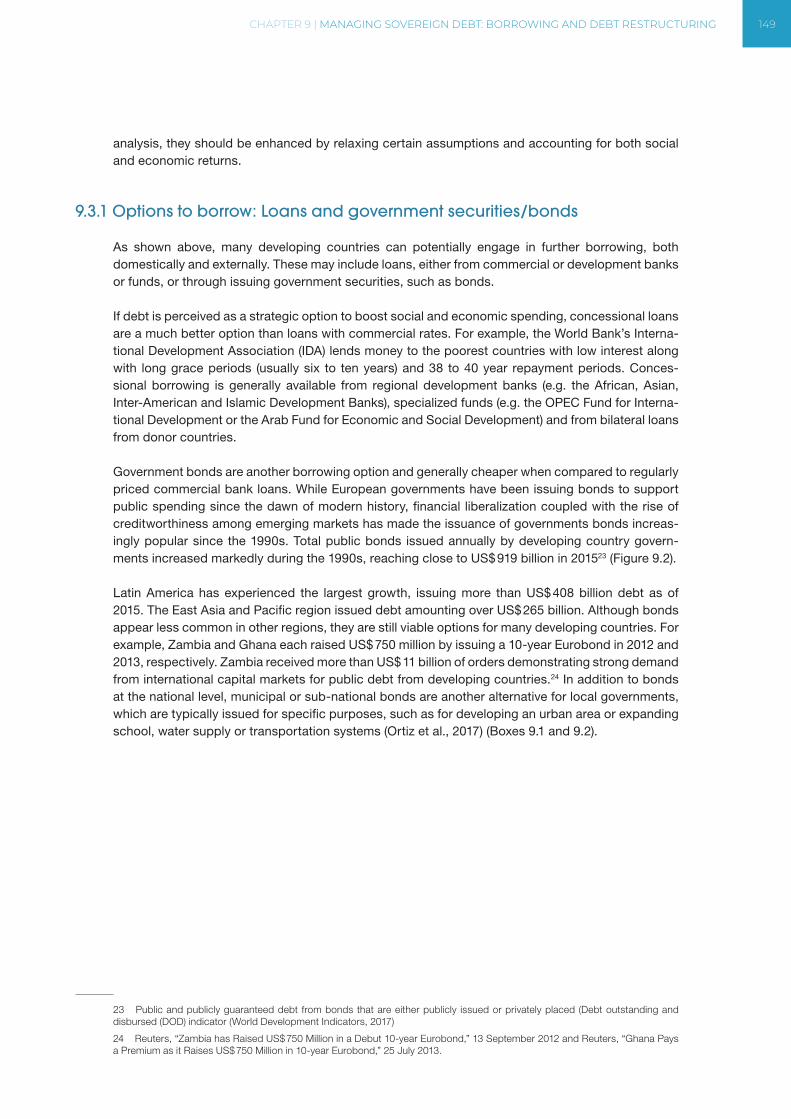
CHAPTER 9 | MANAGING SOVEREIGN DEBT: BORROWING AND DEBT RESTRUCTURING 149
analysis, they should be enhanced by relaxing certain assumptions and accounting for both social and economic returns.
9.3.1 Options to borrow: Loans and government securities/bonds
As shown above, many developing countries can potentially engage in further borrowing, both domestically and externally. These may include loans, either from commercial or development banks or funds, or through issuing government securities, such as bonds.
If debt is perceived as a strategic option to boost social and economic spending, concessional loans are a much better option than loans with commercial rates. For example, the World Bank’s Interna-tional Development Association (IDA) lends money to the poorest countries with low interest along with long grace periods (usually six to ten years) and 38 to 40 year repayment periods. Conces-sional borrowing is generally available from regional development banks (e.g. the African, Asian, Inter-American and Islamic Development Banks), specialized funds (e.g. the OPEC Fund for Interna-tional Development or the Arab Fund for Economic and Social Development) and from bilateral loans from donor countries.
Government bonds are another borrowing option and generally cheaper when compared to regularly priced commercial bank loans. While European governments have been issuing bonds to support public spending since the dawn of modern history, financial liberalization coupled with the rise of creditworthiness among emerging markets has made the issuance of governments bonds increas-ingly popular since the 1990s. Total public bonds issued annually by developing country govern-ments increased markedly during the 1990s, reaching close to US$ 919 billion in 201523 (Figure 9.2). Latin America has experienced the largest growth, issuing more than US$ 408 billion debt as of 2015. The East Asia and Pacific region issued debt amounting over US$ 265 billion. Although bonds appear less common in other regions, they are still viable options for many developing countries. For example, Zambia and Ghana each raised US$ 750 million by issuing a 10-year Eurobond in 2012 and 2013, respectively. Zambia received more than US$ 11 billion of orders demonstrating strong demand from international capital markets for public debt from developing countries.24 In addition to bonds at the national level, municipal or sub-national bonds are another alternative for local governments, which are typically issued for specific purposes, such as for developing an urban area or expanding school, water supply or transportation systems (Ortiz et al., 2017) (Boxes 9.1 and 9.2).
23 Public and publicly guaranteed debt from bonds that are either publicly issued or privately placed (Debt outstanding and disbursed (DOD) indicator (World Development Indicators, 2017)
24 Reuters, “Zambia has Raised US$ 750 Million in a Debut 10-year Eurobond,” 13 September 2012 and Reuters, “Ghana Pays a Premium as it Raises US$ 750 Million in 10-year Eurobond,” 25 July 2013.
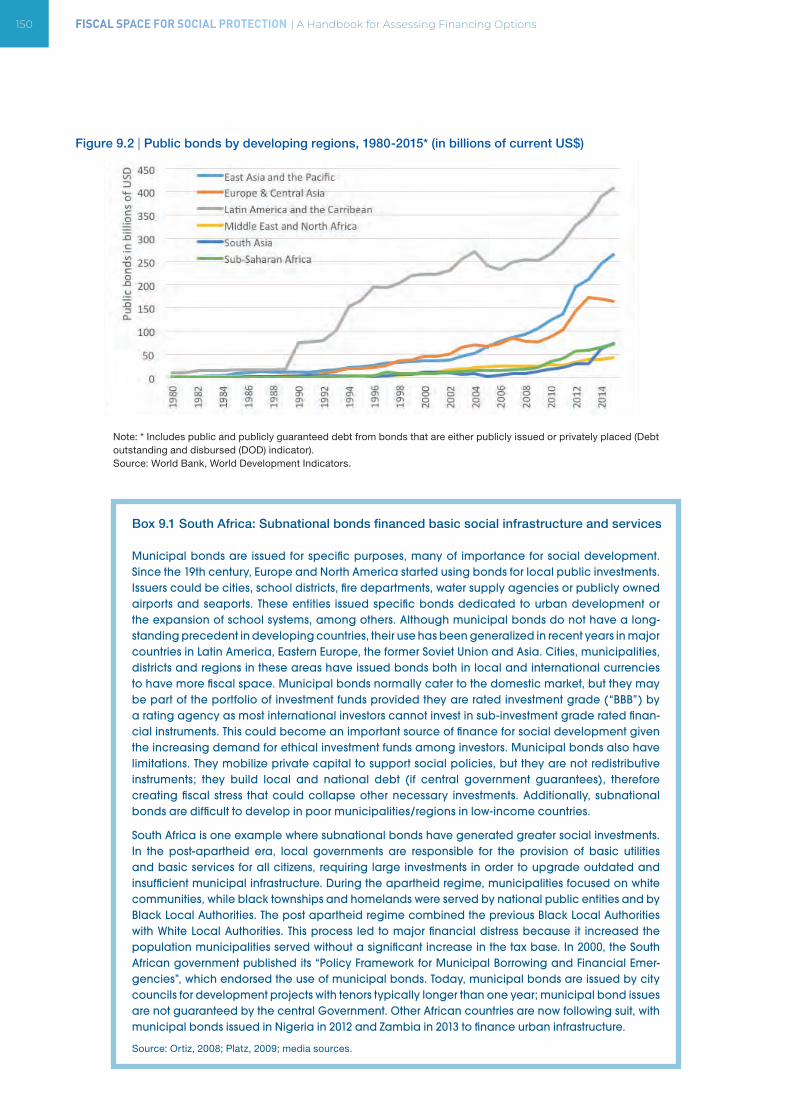
150 FISCAL SPACE FOR SOCIAL PROTECTION | A Handbook for Assessing Financing Options
Figure 9.2 | Public bonds by developing regions, 1980-2015* (in billions of current US$)
Note: * Includes public and publicly guaranteed debt from bonds that are either publicly issued or privately placed (Debt outstanding and disbursed (DOD) indicator).Source: World Bank, World Development Indicators.
Box 9.1 South Africa: Subnational bonds financed basic social infrastructure and services
Municipal bonds are issued for specific purposes, many of importance for social development. Since the 19th century, Europe and North America started using bonds for local public investments. Issuers could be cities, school districts, fire departments, water supply agencies or publicly owned airports and seaports. These entities issued specific bonds dedicated to urban development or the expansion of school systems, among others. Although municipal bonds do not have a long-standing precedent in developing countries, their use has been generalized in recent years in major countries in Latin America, Eastern Europe, the former Soviet Union and Asia. Cities, municipalities, districts and regions in these areas have issued bonds both in local and international currencies to have more fiscal space. Municipal bonds normally cater to the domestic market, but they may be part of the portfolio of investment funds provided they are rated investment grade (“BBB”) by a rating agency as most international investors cannot invest in sub-investment grade rated finan-cial instruments. This could become an important source of finance for social development given the increasing demand for ethical investment funds among investors. Municipal bonds also have limitations. They mobilize private capital to support social policies, but they are not redistributive instruments; they build local and national debt (if central government guarantees), therefore creating fiscal stress that could collapse other necessary investments. Additionally, subnational bonds are difficult to develop in poor municipalities/regions in low-income countries.
South Africa is one example where subnational bonds have generated greater social investments. In the post-apartheid era, local governments are responsible for the provision of basic utilities and basic services for all citizens, requiring large investments in order to upgrade outdated and insufficient municipal infrastructure. During the apartheid regime, municipalities focused on white communities, while black townships and homelands were served by national public entities and by Black Local Authorities. The post apartheid regime combined the previous Black Local Authorities with White Local Authorities. This process led to major financial distress because it increased the population municipalities served without a significant increase in the tax base. In 2000, the South African government published its “Policy Framework for Municipal Borrowing and Financial Emer-gencies”, which endorsed the use of municipal bonds. Today, municipal bonds are issued by city councils for development projects with tenors typically longer than one year; municipal bond issues are not guaranteed by the central Government. Other African countries are now following suit, with municipal bonds issued in Nigeria in 2012 and Zambia in 2013 to finance urban infrastructure.
Source: Ortiz, 2008; Platz, 2009; media sources.
CHAPTER 9 | MANAGING SOVEREIGN DEBT: BORROWING AND DEBT RESTRUCTURING 151
Box 9.2 Colombia’s Social Impact Bond: An innovative public-private partnership (PPP)
In March 2017, the Department of Social Prosperity of the government of Colombia launched the first Social Impact Bond (SIB) in a developing country. SIBs have existed since 2010, mostly in the UK and the US. SIBs are a kind of debt-based, public-private-partnership (PPP), in which investors put funds upfront into a program and get paid when results are achieved within a pre-determined period of time. The Colombian SIB program’s objective is to improve urban employment: it will support skills training and labour services for job placement and retention of 500 poor unemployed persons, 18-40 years old, in the cities of Bogotá, Cali, and Pereira. The investors are a number of Colombian foundations, who pay for the services upfront. The Fundación Corona serves acts as an intermediary and manages the contracts with several service providers. In the first year of the SIB, the Department of Social Prosperity will repay investors for the successful job placement and retention of beneficiaries for at least three months; in the second and third year. Repayments will come from the Swiss Secretariat for Economic Affairs (SECO) and the Inter-American Development Bank (IDB). The outcome funds total US$ 765,000, and the maximum return is 8 per cent (nominal). The consulting firm Deloitte will provide independent verification of the outcomes achieved.
The first SIB was implemented in 2010 in the UK for the purpose of reducing prison recidivism among short-term male prisoners. This was also the purpose of the first SIB in the US. The majority of SIBs worldwide are focused on employment (26 SIBs), child welfare (8 SIBs) and education and health (6 SIBs). A positive trait of SIBs is that, if service providers do not achieve the outcome objectives, the government does not incur losses. SIBs are still experimental and, in higher income countries, have not always led to successful outcomes, leading to investor losses, such as the SIB intended for 10,000 beneficiaries in Rikers Island Prison in New York which did not result in a statistically signifi-cant reduction in recidivism by Year 3 of the intervention, leading to a US$ 7.2 million investor loss. Additionally, a number of challenges have been flagged about SIBs in developing countries, including: (i) the number of willing investors tends to be less; (ii) public opinion often regards SIBs as equivalent to the privatization of government services and thus projects may face resistance; (iii) intermediation, impartial monitoring and data availability are crucial in a SIB and these are costly.
Source: Ortiz et al., 2017; de la Pena, 2014; Gustafsson-Wright et al., 2015; media sources.
Although international commercial bank loans are a least preferred option for governments due to associated fees and higher interest rates, developing countries are increasingly accessing these resources when faced with financing gaps. For example, Tanzania borrowed US$ 1.5 billion from local and foreign banks to boost its 2011 budget and cover a deficit left by an unexpected withdrawal of donor support.25
9.4 DEBT RESTRUCTURING
Debt restructuring and debt relief to help countries to recover are not new. For example, in 1953, West Germany’s creditors, US, UK, France, Belgium and the Netherlands, agreed to reduce Germa-ny’s outstanding debt, borrowed between the wars and immediately afterwards, by 62.5 per cent. A moratorium of five years was also granted and claims for war debt and damages, caused by the Nazi invasion and occupation, were postponed sine die. It is estimated that the total debt reclaimed by the Allied powers from Germany was reduced by 90 per cent. What is more, the repayment terms for the remainder were restructured to allow Germany to repay not exceeding 5 per cent of its export revenues. This meant that the creditor countries had a stake in Germany’s export-oriented recovery.
25 The Citizen, “Tanzania: World Bank Faults Govt’s Borrowing Plan,” 5 June 2010.
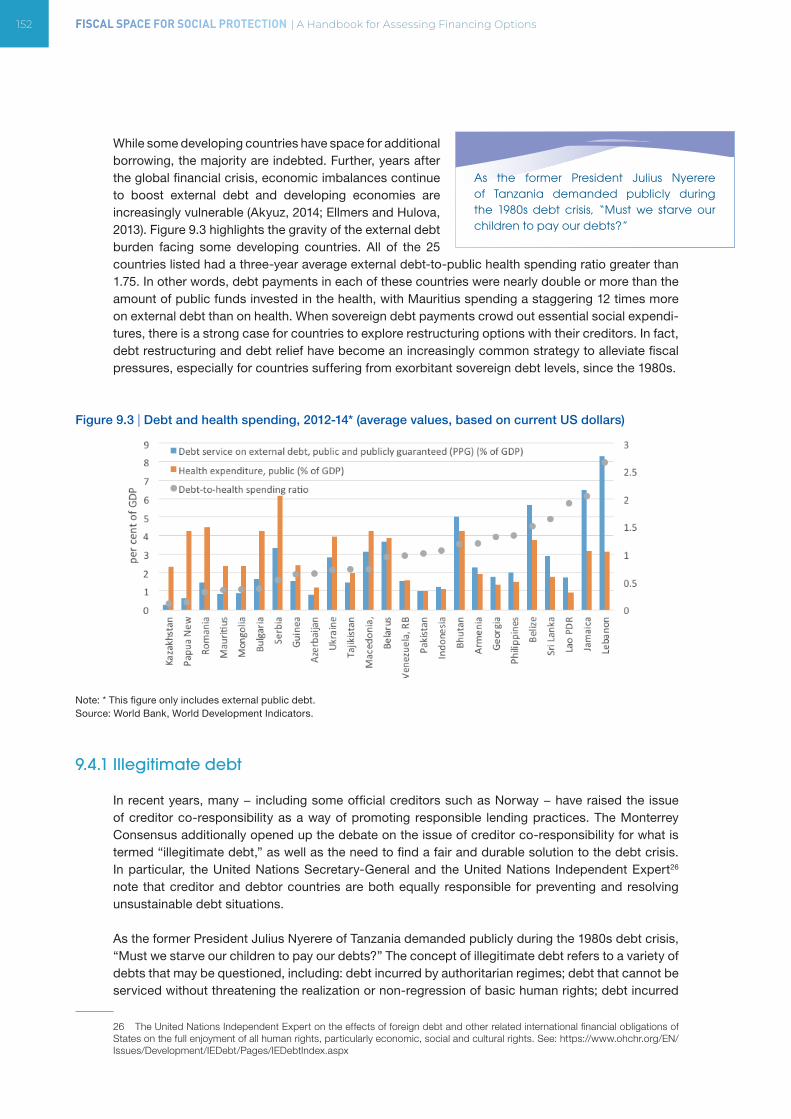
152 FISCAL SPACE FOR SOCIAL PROTECTION | A Handbook for Assessing Financing Options
While some developing countries have space for additional borrowing, the majority are indebted. Further, years after the global financial crisis, economic imbalances continue to boost external debt and developing economies are increasingly vulnerable (Akyuz, 2014; Ellmers and Hulova, 2013). Figure 9.3 highlights the gravity of the external debt burden facing some developing countries. All of the 25 countries listed had a three-year average external debt-to-public health spending ratio greater than 1.75. In other words, debt payments in each of these countries were nearly double or more than the amount of public funds invested in the health, with Mauritius spending a staggering 12 times more on external debt than on health. When sovereign debt payments crowd out essential social expendi-tures, there is a strong case for countries to explore restructuring options with their creditors. In fact, debt restructuring and debt relief have become an increasingly common strategy to alleviate fiscal pressures, especially for countries suffering from exorbitant sovereign debt levels, since the 1980s.
Figure 9.3 | Debt and health spending, 2012-14* (average values, based on current US dollars)
Note: * This figure only includes external public debt.Source: World Bank, World Development Indicators.
9.4.1 Illegitimate debt
In recent years, many − including some official creditors such as Norway − have raised the issue of creditor co-responsibility as a way of promoting responsible lending practices. The Monterrey Consensus additionally opened up the debate on the issue of creditor co-responsibility for what is termed “illegitimate debt,” as well as the need to find a fair and durable solution to the debt crisis. In particular, the United Nations Secretary-General and the United Nations Independent Expert26 note that creditor and debtor countries are both equally responsible for preventing and resolving unsustainable debt situations.
As the former President Julius Nyerere of Tanzania demanded publicly during the 1980s debt crisis, “Must we starve our children to pay our debts?” The concept of illegitimate debt refers to a variety of debts that may be questioned, including: debt incurred by authoritarian regimes; debt that cannot be serviced without threatening the realization or non-regression of basic human rights; debt incurred
26 The United Nations Independent Expert on the effects of foreign debt and other related international financial obligations of States on the full enjoyment of all human rights, particularly economic, social and cultural rights. See: https://www.ohchr.org/EN/Issues/Development/IEDebt/Pages/IEDebtIndex.aspx
As the former President Julius Nyerere of Tanzania demanded publicly during the 1980s debt crisis, “Must we starve our children to pay our debts?”
CHAPTER 9 | MANAGING SOVEREIGN DEBT: BORROWING AND DEBT RESTRUCTURING 153
under predatory repayment terms, including usurious interest rates; debt converted from private (commercial) to public debt under pressure to bail out creditors; loans used for morally reprehensible purposes, such as the financing of a suppressive regime; and debt resulting from irresponsible projects that failed to serve development objectives or caused harm to the people or the environment (United Nations, 2009).
9.4.2 Options to restructure debt: Renegotiation, debt relief, debt swaps, repudiation and default
In practice, there are five main options available to governments to restructure sovereign debt, which include: (i) re-negotiating debt; (ii) achieving debt relief/forgiveness; (iii) debt swaps/conversions; (iv) repudiating debt and; (v) defaulting. These options have been successfully applied by more than 100 countries that have successfully re-negotiated and worked out debt, directing debt servicing savings to development, including social programmes. These are described in the following.
Debt re-negotiation: A first option is to restructure debt via voluntary negotiations and collec-tive action clauses. Voluntary negotiations have mostly applied to bank loans, as demonstrated by the more than 60 countries that have successfully re-negotiated terms between 1990 and the mid 2000s.27 These processes, however, take an average of five years, which carry a high re-negotiation cost since governments cannot resume international borrowing during that time. Collective action clauses are most commonly used to restructure government bonds and take much less time than voluntary negotiations (about one year on average); through collective action clauses included in bond contracts, many countries have successfully reached agreements with commercial creditors to lengthen the maturity and lower the coupon (face value) of outstanding bonds.
Debt relief/forgiveness: A second option is to negotiate debt forgiveness. This has happened through creditor-led forums, such as the Paris and London Clubs, which are used to restructure or cancel bilateral and commercial debt, respectively, as well as the Heavily Indebted Poor Countries Initiative (HIPC) executed by the IMF and World Bank. HIPC has been the most prominent option for debt relief. Launched in 1996, 36 low-income countries had reached their completion points as of mid-2017 by meeting debt relief criteria. While earlier these countries were spending more on debt service than on health and education combined, on average, social spending now accounts for roughly five times their amount of debt-service payments (IMF, 2017b).28 But only low income countries could access HIPC. Other countries had to resort to other debt restructuring. And for low income counties, debt forgiveness has been slow to deliver (Figure 9.4), and the benefits of agreed debt reduction have proven far less than hoped for in most cases (UNCTAD, 2008, pp. 139-141).
27 Countries that restructured sovereign debt during 2000-2004 include Angola, Cameroon, Central Africa Republic, Dominica, Gabon, Guyana, Honduras, Kenya, Madagascar, Myanmar, Nicaragua, Serbia and Montenegro, Seychelles, Tanzania, Yemen and Zimbabwe; See Table 5 in Bai and Zhang (2009) for the list since 1990.
28 See IMF Factsheet on HIPC Initiative to ensure that no poor country faces a debt burden it cannot manage.
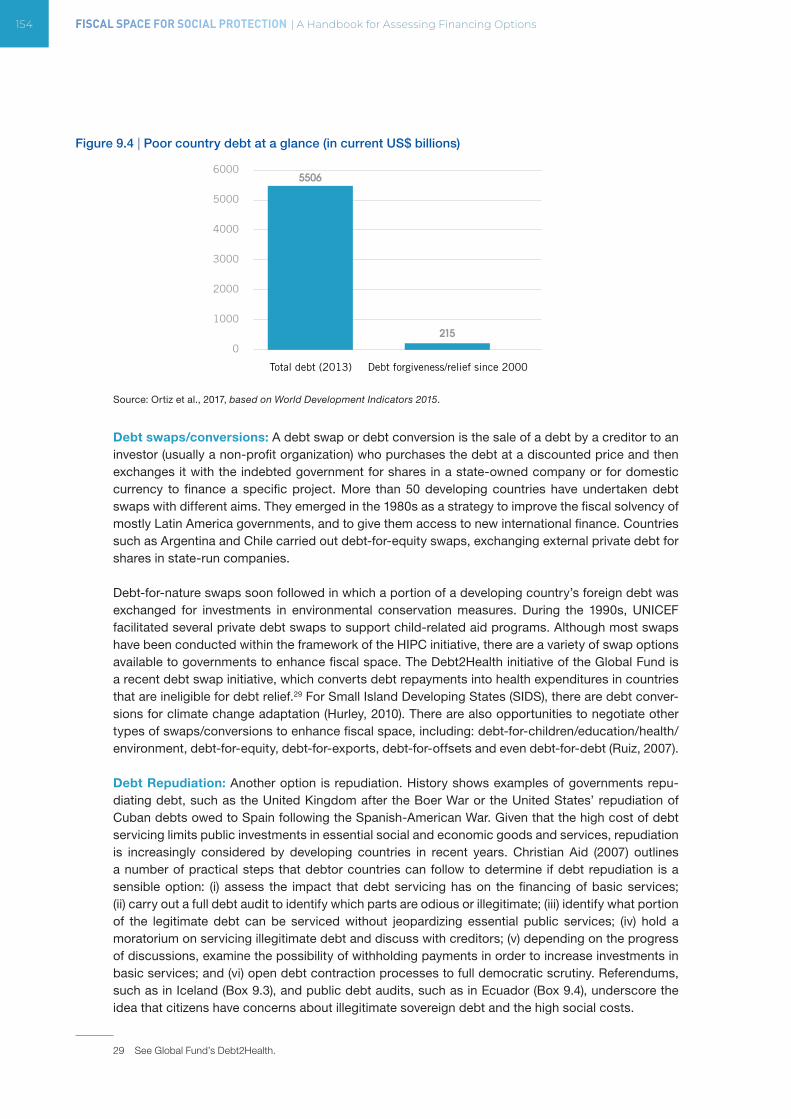
154 FISCAL SPACE FOR SOCIAL PROTECTION | A Handbook for Assessing Financing Options
Figure 9.4 | Poor country debt at a glance (in current US$ billions)
Source: Ortiz et al., 2017, based on World Development Indicators 2015.
Debt swaps/conversions: A debt swap or debt conversion is the sale of a debt by a creditor to an investor (usually a non-profit organization) who purchases the debt at a discounted price and then exchanges it with the indebted government for shares in a state-owned company or for domestic currency to finance a specific project. More than 50 developing countries have undertaken debt swaps with different aims. They emerged in the 1980s as a strategy to improve the fiscal solvency of mostly Latin America governments, and to give them access to new international finance. Countries such as Argentina and Chile carried out debt-for-equity swaps, exchanging external private debt for shares in state-run companies.
Debt-for-nature swaps soon followed in which a portion of a developing country’s foreign debt was exchanged for investments in environmental conservation measures. During the 1990s, UNICEF facilitated several private debt swaps to support child-related aid programs. Although most swaps have been conducted within the framework of the HIPC initiative, there are a variety of swap options available to governments to enhance fiscal space. The Debt2Health initiative of the Global Fund is a recent debt swap initiative, which converts debt repayments into health expenditures in countries that are ineligible for debt relief.29 For Small Island Developing States (SIDS), there are debt conver-sions for climate change adaptation (Hurley, 2010). There are also opportunities to negotiate other types of swaps/conversions to enhance fiscal space, including: debt-for-children/education/health/environment, debt-for-equity, debt-for-exports, debt-for-offsets and even debt-for-debt (Ruiz, 2007).
Debt Repudiation: Another option is repudiation. History shows examples of governments repu-diating debt, such as the United Kingdom after the Boer War or the United States’ repudiation of Cuban debts owed to Spain following the Spanish-American War. Given that the high cost of debt servicing limits public investments in essential social and economic goods and services, repudiation is increasingly considered by developing countries in recent years. Christian Aid (2007) outlines a number of practical steps that debtor countries can follow to determine if debt repudiation is a sensible option: (i) assess the impact that debt servicing has on the financing of basic services; (ii) carry out a full debt audit to identify which parts are odious or illegitimate; (iii) identify what portion of the legitimate debt can be serviced without jeopardizing essential public services; (iv) hold a moratorium on servicing illegitimate debt and discuss with creditors; (v) depending on the progress of discussions, examine the possibility of withholding payments in order to increase investments in basic services; and (vi) open debt contraction processes to full democratic scrutiny. Referendums, such as in Iceland (Box 9.3), and public debt audits, such as in Ecuador (Box 9.4), underscore the idea that citizens have concerns about illegitimate sovereign debt and the high social costs.
29 See Global Fund’s Debt2Health.
0
1000
2000
3000
4000
5000
6000
Total debt (2013) Debt forgiveness/relief since 2000
5506
215
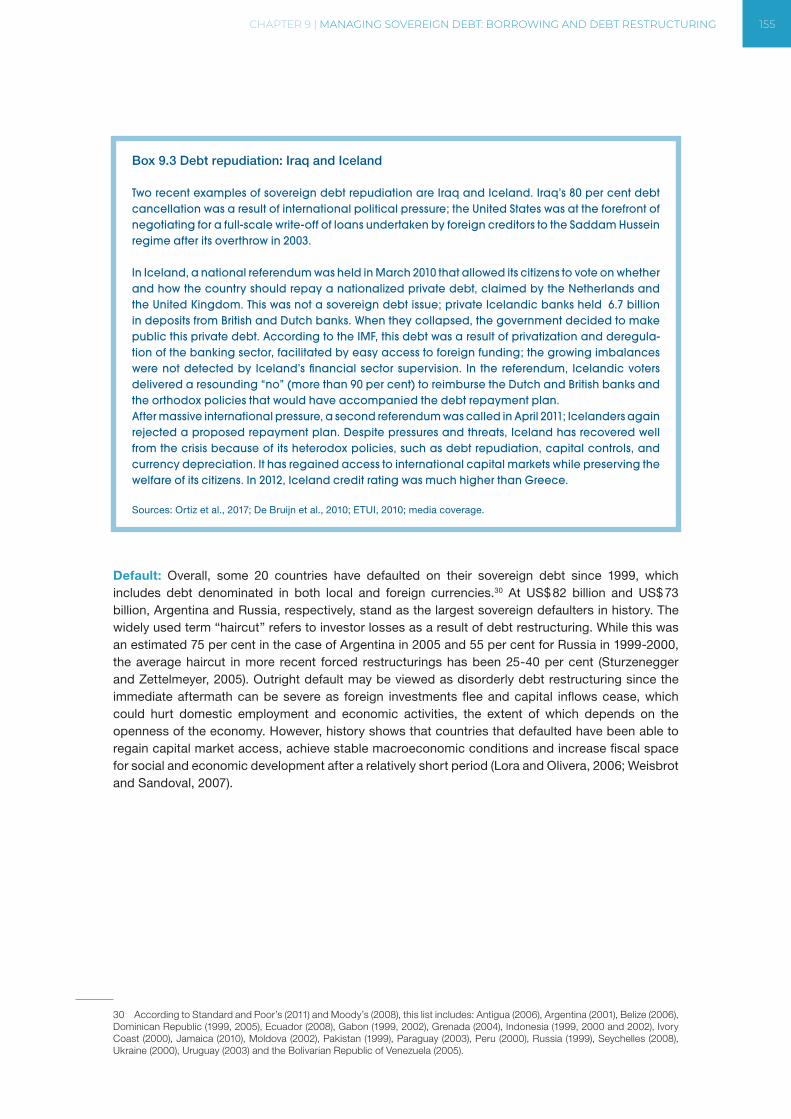
CHAPTER 9 | MANAGING SOVEREIGN DEBT: BORROWING AND DEBT RESTRUCTURING 155
Box 9.3 Debt repudiation: Iraq and Iceland
Two recent examples of sovereign debt repudiation are Iraq and Iceland. Iraq’s 80 per cent debt cancellation was a result of international political pressure; the United States was at the forefront of negotiating for a full-scale write-off of loans undertaken by foreign creditors to the Saddam Hussein regime after its overthrow in 2003.
In Iceland, a national referendum was held in March 2010 that allowed its citizens to vote on whether and how the country should repay a nationalized private debt, claimed by the Netherlands and the United Kingdom. This was not a sovereign debt issue; private Icelandic banks held €6.7 billion in deposits from British and Dutch banks. When they collapsed, the government decided to make public this private debt. According to the IMF, this debt was a result of privatization and deregula-tion of the banking sector, facilitated by easy access to foreign funding; the growing imbalances were not detected by Iceland’s financial sector supervision. In the referendum, Icelandic voters delivered a resounding “no” (more than 90 per cent) to reimburse the Dutch and British banks and the orthodox policies that would have accompanied the debt repayment plan. After massive international pressure, a second referendum was called in April 2011; Icelanders again rejected a proposed repayment plan. Despite pressures and threats, Iceland has recovered well from the crisis because of its heterodox policies, such as debt repudiation, capital controls, and currency depreciation. It has regained access to international capital markets while preserving the welfare of its citizens. In 2012, Iceland credit rating was much higher than Greece. Sources: Ortiz et al., 2017; De Bruijn et al., 2010; ETUI, 2010; media coverage.
Default: Overall, some 20 countries have defaulted on their sovereign debt since 1999, which includes debt denominated in both local and foreign currencies.30 At US$ 82 billion and US$ 73 billion, Argentina and Russia, respectively, stand as the largest sovereign defaulters in history. The widely used term “haircut” refers to investor losses as a result of debt restructuring. While this was an estimated 75 per cent in the case of Argentina in 2005 and 55 per cent for Russia in 1999-2000, the average haircut in more recent forced restructurings has been 25-40 per cent (Sturzenegger and Zettelmeyer, 2005). Outright default may be viewed as disorderly debt restructuring since the immediate aftermath can be severe as foreign investments flee and capital inflows cease, which could hurt domestic employment and economic activities, the extent of which depends on the openness of the economy. However, history shows that countries that defaulted have been able to regain capital market access, achieve stable macroeconomic conditions and increase fiscal space for social and economic development after a relatively short period (Lora and Olivera, 2006; Weisbrot and Sandoval, 2007).
30 According to Standard and Poor’s (2011) and Moody’s (2008), this list includes: Antigua (2006), Argentina (2001), Belize (2006), Dominican Republic (1999, 2005), Ecuador (2008), Gabon (1999, 2002), Grenada (2004), Indonesia (1999, 2000 and 2002), Ivory Coast (2000), Jamaica (2010), Moldova (2002), Pakistan (1999), Paraguay (2003), Peru (2000), Russia (1999), Seychelles (2008), Ukraine (2000), Uruguay (2003) and the Bolivarian Republic of Venezuela (2005).
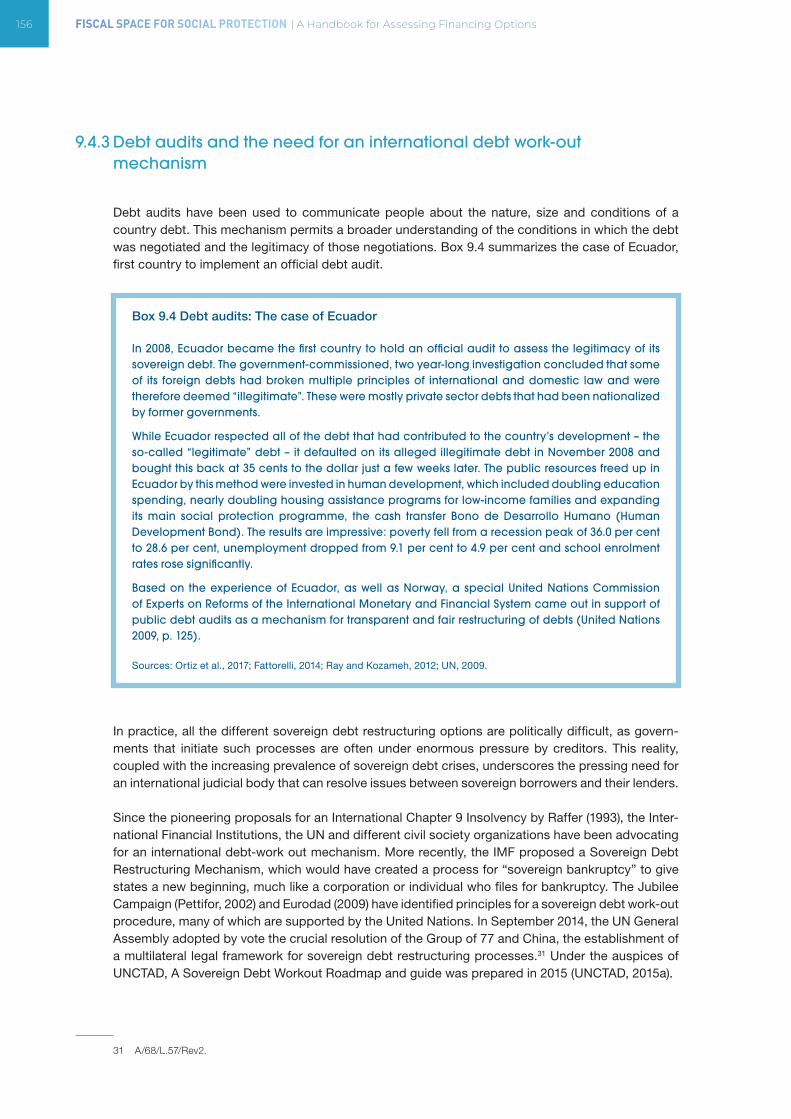
156 FISCAL SPACE FOR SOCIAL PROTECTION | A Handbook for Assessing Financing Options
9.4.3 Debt audits and the need for an international debt work-out mechanism
Debt audits have been used to communicate people about the nature, size and conditions of a country debt. This mechanism permits a broader understanding of the conditions in which the debt was negotiated and the legitimacy of those negotiations. Box 9.4 summarizes the case of Ecuador, first country to implement an official debt audit.
Box 9.4 Debt audits: The case of Ecuador
In 2008, Ecuador became the first country to hold an official audit to assess the legitimacy of its sovereign debt. The government-commissioned, two year-long investigation concluded that some of its foreign debts had broken multiple principles of international and domestic law and were therefore deemed “illegitimate”. These were mostly private sector debts that had been nationalized by former governments.
While Ecuador respected all of the debt that had contributed to the country’s development – the so-called “legitimate” debt – it defaulted on its alleged illegitimate debt in November 2008 and bought this back at 35 cents to the dollar just a few weeks later. The public resources freed up in Ecuador by this method were invested in human development, which included doubling education spending, nearly doubling housing assistance programs for low-income families and expanding its main social protection programme, the cash transfer Bono de Desarrollo Humano (Human Development Bond). The results are impressive: poverty fell from a recession peak of 36.0 per cent to 28.6 per cent, unemployment dropped from 9.1 per cent to 4.9 per cent and school enrolment rates rose significantly.
Based on the experience of Ecuador, as well as Norway, a special United Nations Commission of Experts on Reforms of the International Monetary and Financial System came out in support of public debt audits as a mechanism for transparent and fair restructuring of debts (United Nations 2009, p. 125).
Sources: Ortiz et al., 2017; Fattorelli, 2014; Ray and Kozameh, 2012; UN, 2009.
In practice, all the different sovereign debt restructuring options are politically difficult, as govern-ments that initiate such processes are often under enormous pressure by creditors. This reality, coupled with the increasing prevalence of sovereign debt crises, underscores the pressing need for an international judicial body that can resolve issues between sovereign borrowers and their lenders. Since the pioneering proposals for an International Chapter 9 Insolvency by Raffer (1993), the Inter-national Financial Institutions, the UN and different civil society organizations have been advocating for an international debt-work out mechanism. More recently, the IMF proposed a Sovereign Debt Restructuring Mechanism, which would have created a process for “sovereign bankruptcy” to give states a new beginning, much like a corporation or individual who files for bankruptcy. The Jubilee Campaign (Pettifor, 2002) and Eurodad (2009) have identified principles for a sovereign debt work-out procedure, many of which are supported by the United Nations. In September 2014, the UN General Assembly adopted by vote the crucial resolution of the Group of 77 and China, the establishment of a multilateral legal framework for sovereign debt restructuring processes.31 Under the auspices of UNCTAD, A Sovereign Debt Workout Roadmap and guide was prepared in 2015 (UNCTAD, 2015a).
31 A/68/L.57/Rev2.
CHAPTER 9 | MANAGING SOVEREIGN DEBT: BORROWING AND DEBT RESTRUCTURING 157
9.5 CONCLUDING REMARKS
Borrowing or restructuring debt are important options to expand fiscal space for socio-economic investments with positive impacts on women, children and other population groups. Recent research, especially within the IMF has revealed that there is “no magic” debt threshold beyond which debt may dramatically compromise medium-term growth. Trends in debt seem to influence growth more than debt level per se. The IMF research also finds that the debt-growth relation depends on country specific circumstances. These findings give policymakers greater flexibility when considering to borrow for developmental purposes, including social protection. Moreover, while the best path toward an ultimate objective of declining debt ratios may vary depending on a country’s circumstances, the debt sustainability analysis should explicitly consider medium and long-term growth potential of both economic and social investment. In fact, debt should be sustainable if debt-financed government expenditure enhances both growth and productivity. The claim that government deficits will need to be ‘financed’ with higher tax rates in future is spurious as revenues are bound to rise in an expanding economy. Understanding this requires abandoning the narrow concept of “sound” finance, which looks only on the balance sheet of the government, in favour of “functional” finance, which evaluates government finance based on its developmental impacts. Countries with very high levels of sovereign external debt should seek to restructure existing debt, either by debt re-negotiation, debt relief/forgiveness, debt swaps/conversion, debt repudiation or default, especially when the legitimacy of the debt is questionable and/or the opportunity cost in terms of worsening social outcomes is high. In recent years, more than 100 countries have success-fully re-negotiated and worked out debt, directing debt servicing savings to development, including social programmes. Countries should be more cautious in managing external debt in particular, especially when there is no legal international framework for orderly and fair sovereign debt work-out. They should periodically conduct audit of all debts to ascertain their development impacts and to initiate debt restructuring well in advance of reaching an unsustainable level.
9.6 KEY DOCUMENTS AND DATA SOURCES
Pescatori, A.; Sandri, D.; Simon, J. 2014. “No Magic Threshold”, in IMF Finance and Development, Vol. 51, No. 2, pp. 39-42.
Comprehensive review of literature on debt-growth relation. It applies a new approach and utilizes a new and comprehensive IMF database on gross government debt-to-GDP ratios, interest payments, and primary deficits that covers nearly all the 188 IMF members—for many of them from 1875 to 2011 and finds that there is no simple threshold above which debt ratios severely undermine medium-term growth prospects.
UNCTAD. 2015. Sovereign Debt Workouts: Going Forward Roadmap and Guide (Geneva)
United Nations proposal to improve the coherence, fairness and efficiency of sovereign debt work-outs. This roadmap contains: (i) A concise summary of the key problems of current practice; (ii) A set of five principles for sovereign debt workouts; (iii) Global reforms recommended for smoothing debt workouts; (iv) Steps to be taken by debtor states prior to debt workouts; (v) Recommendations for a reformed debt workout process; (vi) Recommendations for courts deciding sovereign debt cases.
158 FISCAL SPACE FOR SOCIAL PROTECTION | A Handbook for Assessing Financing Options
The Roadmap is accompanied by a Guide, which provides an in-depth explanation of the principles and recommendations contained in this Roadmap.
EURODAD, LATINDADD and AFRODAD:
The European Network on Debt and Development (EURODAD) and its sister organizations, the Latin American and African Fora and Networks on Debt and Development (LATINDADD and AFRODAD), offer meaningful civil society analysis of debt trends and alternatives. See: https://eurodad.org/ https://www.latindadd.org/ http://www.afrodad.org/
Data sources
IMF, Historical Public Debt Database
Compilation of the first truly comprehensive database on gross government debt-to-GDP ratios, covering nearly the entire IMF membership (174 countries) and spanning an exceptionally long time period. The database was constructed by bringing together a number of other datasets and informa-tion from original sources. For the most recent years, the data are linked to the IMF World Economic Outlook (WEO) database to facilitate regular updates.
World Bank, Quarterly Public Sector Debt
Jointly developed by the World Bank and the International Monetary Fund, brings together detailed public sector debt data of selected countries. It includes country and cross-country tables, and specific public debt components. The data represent the following sectors on an as-available basis: general government; otherwise central government; otherwise budgetary central government; nonfinancial public corporations and financial public corporations and a table presenting the total public sector debt.
Joint External Debt Hub (JEDH): A new initiative of BIS, IMF, OECD and World Bank
A database with 92 types of time series, mostly of Gross External Debt with its sectoral composition and other kind of specifications; data are available for 216 countries and from 1990 onwards.
Learning accomplishments
After reading this chapter, a reader should have a good grasp of:
• The debate around optimal debt-GDP ratio;
• Countries’ room to borrow and potential sources of borrowing;
• The scope and options for debt restructuring/work outs;
• The concepts of illegitimate debt, debt audits and the need for an international debt work-out mechanism;
• Key resources and data sources.
CHAPTER 10 | A MORE ACCOMMODATING MACROECONOMIC FRAMEWORK 159
CHAPTER 10. A MORE ACCOMMODATING MACROECONOMIC FRAMEWORK
LEARNING OBJECTIVES
• Learn the importance of macroeconomic policy framework and how it can be made more accommodative
• Know the limitations of the orthodox macroeconomic policy framework since the 1980s and historical role of macroeconomic social protection policies to foster growth and stabilization
• Appreciate the weak empirical foundation of conventional wisdom with regards to inflation-growth, debt-growth, aid-exchange rate relationships
• Understand monetary and fiscal policies for fiscal space
• Know about key resources and data sources
CONTENTS
• Why accommodative macroeconomic policies
• Macroeconomic policies and social protection
• Restoring macroeconomic policy space for development and stabilization
• Accommodative macroeconomic frameworks for fiscal space: Fiscal and monetary policies
• Key documents and data sources
This chapter highlights the need for an accommodative macroeconomic policy framework. In doing so, it briefly provides a critique of the conventional macroeconomic policy framework stressing the historical role of macroeconomic policies in fostering economic growth and stabilizing the economy (section 10.2). It then critically evaluates key hypotheses at the heart of the conventional macro-economic policy framework and reviews empirical evidence to show that there is room for accom-modating macroeconomic policies in most developing countries (section 10.3). In section 10.4, the chapter discusses how macroeconomic policies can be made more accommodative.
160 FISCAL SPACE FOR SOCIAL PROTECTION | A Handbook for Assessing Financing Options
10.1 WHY ACCOMMODATIVE MACROECONOMIC POLICIES?
Traditionally, macroeconomic stability and fiscal/debt sustainability are at the core of the analysis to identify fiscal space. However, over the years since the debt crisis of the 1980s and during the struc-tural adjustment programmes of the IMF supported by the World Bank, macroeconomic stability has been defined in a narrow sense, focused only on nominal targets, such as budget deficits and inflation rates.
Based on the experience of the 1990s, the World Bank’s Growth Commission concluded that, “The principles of … macroeconomic stability… have been interpreted narrowly to mean “minimize fiscal deficits, minimize inflation …with the assumption that the more of these changes the better, at all times and in all places— overlooking the fact that these expedients are just some of the ways in which these principles can be implemented” (Growth Commission, 2005, p.11). The IMF Independent Evaluation Office (IMF-IEO), acknowledged that “much of the fiscal adjustment achieved is through measures that do not assure long-term sustainability and flexibility of fiscal systems to future shocks” (IMF, 2003, p.9). The Growth Commission also noted the unsustainability of severe fiscal adjustment in the long-run and observed, “it is clear that there is more to macroeconomic stability than a super-ficial reading of the size of the fiscal deficit”. It also noted: “the goal of achieving macroeconomic stability does not imply a need to minimize fiscal deficits at all times” (Growth Commission, 2005, p. 9-11).
Thus, it was recognized by the Development Committee of the IMF and the World Bank that adjustment programmes, by focusing too narrowly on fiscal-deficit targets, often ignored the quality of the underlying adjustment (Devel-opment Committee, 2006). That is, fiscal adjustment was often achieved by cutting public investment in infra-structure and human capital, crucial for long-term growth potential. The self-defeating outcome of such a narrowly defined concept of macroeconomic stability in the adjust-ment programmes was summarized as “like walking up the down escalator when growth-promoting spending is cut so much as to lower growth and thus the present value of future tax revenues to a degree that more than offsets the improvement in the cash deficit’’ (Easterly et al., 2008, p.37).
Moreover, the strict adherence to some pre-determined nominal targets for the inflation rate or fiscal position (debt or budget deficit/surplus) made macroeconomic policies pro-cyclical exacerbating the negative output and employment impacts of shocks. As the Growth Commission noted, “Among developing countries, fiscal pro-cyclicality peaked in the 1980s and … remained much higher than in more advanced countries [in the 1990s]. Pro-cyclical fiscal policy played a key role in some of the recent crises” (Growth Commission, 2005, p. 104).
Additionally, countries had to adhere to an “expenditure ceiling” due to IMF’s loan conditionality. They were discouraged to spend even when they had fiscal space or received more aid on the ground that it would cause either exchange rate overvaluation or higher inflation, a phenomenon, known as Dutch disease, which disadvantages the tradable sector. For example, following a comprehensive study of aid in Sub-Saharan Africa, the IMF-IEO found that nearly three-quarters of aid given to poor countries between 1999 and 2005 was used to accumulate reserves (36 per cent) and pay off debt (37 per cent) rather than invest in much needed economic and social programmes (IMF-IEO, 2007, p. 42). Thus, scaling-up of aid was not favoured on the ground that increased aid inflows were
The goals of macroeconomic policy are multiple, from supporting growth, price stabilization or inflation control, to smoothing economic cycles, reducing unemployment and poverty, and promoting equity. However, “the principles of … macroeconomic stability… have been interpreted narrowly to mean ‘minimize fiscal deficits, minimize inflation’ …with the assumption that the more of these changes the better, at all times and in all places… /…the expected growth benefits failed to materialize and worsened poverty” (Growth Commission, 2005)
CHAPTER 10 | A MORE ACCOMMODATING MACROECONOMIC FRAMEWORK 161
likely to generate macroeconomic imbalances in the short-run. However, there is scant evidence of so-called Dutch disease, while many worthwhile social and development projects remained under-funded, especially in low-income countries.
Thus, the policymakers must move away from a short-term bias to an approach that explicitly prior-itizes productive investment and equity. The concept of macroeconomic stability must be broad-ened to acknowledge that the goals of macroeconomic policy are multiple, from supporting growth, price stabilization or inflation control, to smoothing economic cycles, reducing unemployment and poverty, and promoting equity. This would allow not only consistent counter-cyclical macroeconomic policies, but also more development-promoting public expenditure, such as on education, health, social protection and infrastructure.
There is an extensive stream of literature that alerts on the negative impacts of strong austerity or fiscal consolidation in the economy (Blyth, 2013). As presented in chapter 7, social transfers, subsi-dies and wages, as well as infrastructure budgets, are usually among the most affected items when fiscal austerity is implemented, with pervasive effects on overall population wellbeing (especially lower income families) and economic competitiveness –hence, long-run economic growth. In other words, development is heavily hit when budgets are cut. However, this should not be interpreted as a license to be fiscally irresponsible, a situation that can affect the macroeconomic stability and the sustainability of the same social protection programs for women, children and other social groups that may be currently protected. Increasing deficits that generate growing public debts may be diffi-cult to sustain if the economy is not growing at high rates, if the financial system is not capable of providing enough funds to close the fiscal gap and re-pay previous debt and/or the international context does not favour the internal dynamics of the country.
An accommodative macroeconomic policy framework creates an enabling environment for consid-ering options such as using fiscal and monetary policies, higher level of public borrowing, and scaling-up of aid. In other words, with an accommodating macroeconomic policy framework, the size of the overall budget or fiscal space can become larger. Moreover, by linking the additional fiscal space to growth enhancing public expenditure, it not only ensures long-term macroeconomic stability but also generates more fiscal space as the economy sustainably grows.
10.2 MACROECONOMIC POLICIES: HISTORICAL ROLES AND NEW ORTHODOXY
Macroeconomic policies are generally understood as a set of policies aimed at stabilizing the economy and enabling sustainable growth. The former is typically formulated in terms of internal balance and external balance. The internal balance means “full” or high level of employment with stable wage growth and stable (or “reasonable”) inflation, and external balance means a balance between exports and imports, or earnings of foreign exchange sufficient to pay for imports.
The two main policies for macroeconomic management are fiscal policy and monetary policy. Fiscal policy comprises government revenue and expenditure and monetary policy deals with money (credit) supply and interest rates.
However, fiscal and monetary policies need support from other policies due to complications arising from conflicts among the goals. For example, policies aimed at reducing external deficit may trigger a recession and, therefore, compromise an economy’s internal balance. In such a situation, addi-tional policy instruments, such as social protection can be helpful. (Box 10.1).
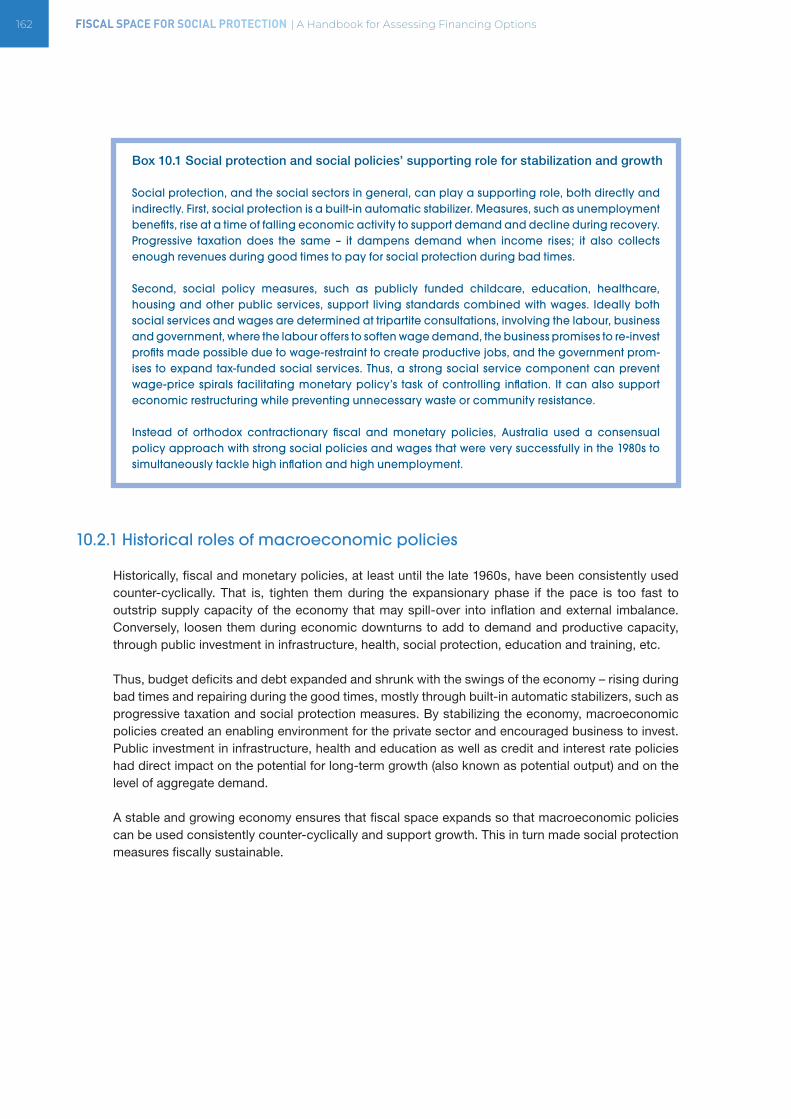
162 FISCAL SPACE FOR SOCIAL PROTECTION | A Handbook for Assessing Financing Options
Box 10.1 Social protection and social policies’ supporting role for stabilization and growth
Social protection, and the social sectors in general, can play a supporting role, both directly and indirectly. First, social protection is a built-in automatic stabilizer. Measures, such as unemployment benefits, rise at a time of falling economic activity to support demand and decline during recovery. Progressive taxation does the same – it dampens demand when income rises; it also collects enough revenues during good times to pay for social protection during bad times.
Second, social policy measures, such as publicly funded childcare, education, healthcare, housing and other public services, support living standards combined with wages. Ideally both social services and wages are determined at tripartite consultations, involving the labour, business and government, where the labour offers to soften wage demand, the business promises to re-invest profits made possible due to wage-restraint to create productive jobs, and the government prom-ises to expand tax-funded social services. Thus, a strong social service component can prevent wage-price spirals facilitating monetary policy’s task of controlling inflation. It can also support economic restructuring while preventing unnecessary waste or community resistance.
Instead of orthodox contractionary fiscal and monetary policies, Australia used a consensual policy approach with strong social policies and wages that were very successfully in the 1980s to simultaneously tackle high inflation and high unemployment.
10.2.1 Historical roles of macroeconomic policies
Historically, fiscal and monetary policies, at least until the late 1960s, have been consistently used counter-cyclically. That is, tighten them during the expansionary phase if the pace is too fast to outstrip supply capacity of the economy that may spill-over into inflation and external imbalance. Conversely, loosen them during economic downturns to add to demand and productive capacity, through public investment in infrastructure, health, social protection, education and training, etc.
Thus, budget deficits and debt expanded and shrunk with the swings of the economy – rising during bad times and repairing during the good times, mostly through built-in automatic stabilizers, such as progressive taxation and social protection measures. By stabilizing the economy, macroeconomic policies created an enabling environment for the private sector and encouraged business to invest. Public investment in infrastructure, health and education as well as credit and interest rate policies had direct impact on the potential for long-term growth (also known as potential output) and on the level of aggregate demand.
A stable and growing economy ensures that fiscal space expands so that macroeconomic policies can be used consistently counter-cyclically and support growth. This in turn made social protection measures fiscally sustainable.
CHAPTER 10 | A MORE ACCOMMODATING MACROECONOMIC FRAMEWORK 163
10.2.2 New orthodoxy and shrinking of macroeconomic policy’s developmental role
This scenario changed markedly since the early 1980s when the agenda of privatization, liberaliza-tion and globalization reforms, with macroeconomic stabilization at the core, was advanced by the IMF and the World Bank. This, however, shrunk macroeconomic policy space and fiscal space for development, while countries were focused on stabilization. The reform agenda was too optimistic about reforms growth impacts and ignored possible negative consequences, according to the IMF’s Independent Evaluation Office (IMF-IEO, 2003, p.6).
A more recent IMF study acknowledged that the reform agenda, in particular fiscal consolidation and capital account liberalization, has not delivered as expected (Ostry et al, 2006). The Growth Commission concluded: “Macroeconomic policies improved in a majority of developing countries in the 1990s, but the expected growth benefits failed to materialize…In addition, a series of financial crises severely depressed growth and worsened poverty” (Growth Commission, 2005, p. 93).
The deregulation of the financial sector made it difficult for the monetary authority to control money supply and direct credit to desirable activities. This saw a rise in speculative activities which caused bubbles that busted too frequently.
When a country allowed free flow of foreign capital, the ability of monetary authority to set the interest rate became restricted. It cannot lower interest rates to support investment and growth for the fear of capital moving out. On the other hand, if it is left high, a large amount of foreign currencies will flow in which can increase the fragility of a country’s financial sector. The financial sector may not be able to efficiently allocate excess capital to profitable and socially desirable investment. It can also make an economy very vulnerable to the risk of sudden flow rever-sals. Thus, there have been frequent financial crises since the 1990s, the latest one in 2008 engulfing all developed and many developing economies.
Liberalization and globalization adversely affected governments’ revenues and taxing capacity. As highlighted in chapter 5, developing countries have steadily reduced tariff rates since the 1990s, lowering their capacity to generate revenue from trade. Countries also often engage in tax competi-tion lowering tax rates (otherwise increase tax concessions) in a bid to attract direct foreign invest-ment, although there is no certainty that lower tax rates or higher tax concessions attract more foreign investment. On the other hand, such tax concessions constitute a loss of revenue that may compromise the government’s ability to finance important social programmes. Privatization also affected government revenues as governments sold off profitable state enterprises. Thus, almost every government – in developed and developing countries – is in fiscal or revenue crises.
Thus, these developments shrunk both policy and fiscal space. Fiscal and monetary policies became pro-cyclical, and the shrinking of fiscal space created pressure on the government to cut social protection, exacerbating pro-cyclicality of fiscal policy.
Since the early 1980s when the agenda of stabilization, privatization and liberalization was advanced by the international financial institutions, policy space and fiscal space for development was shrunk. Fiscal and monetary policies became pro-cyclical, and the shrinking of fiscal space created pressure on the government to cut social expenditures including social protection.
164 FISCAL SPACE FOR SOCIAL PROTECTION | A Handbook for Assessing Financing Options
10.3 KEY HYPOTHESES OF NEW ORTHODOXY: A CRITICAL EVALUATION
Restoring macroeconomic policy space requires critical evaluations of some of the basic premises of new orthodoxy. Restrictive macroeconomic policies are premised on the claims that (i) government deficits crowd out private investment; (ii) public debt impedes growth; (iii) inflation retards growth and (iv) higher aid inflows cause real exchange rate appreciation. However, empirical evidence supporting these claims is not robust.
10.3.1 Government deficits crowd-out or crowd-in private investment?
A lingering concern is the spectre of “crowding-out”, the idea that government domestic borrowing drives up interest rates adversely affecting private investment. Extensive research, even within the IMF, could not find convincing evidence to support the crowding-out claim (IMF, 2014 and 2015). This is not surprising as the crowding-out view ignores the adverse effects that a depressed economy may have on investment through low demand, low profitability and financial crunches. After all, government action is necessitated, in the first place, by inadequate private spending.
More importantly, the immediate financial implication of expansionary fiscal policy is to augment the cash reserves of private sector banks where government cheques are deposited. This, in turn, increases (net) liquidity if the central bank does not implement offsetting money market operations. Hence, the actual central bank discount rate should decrease, exerting downward pressure on retail interest rates. This should, therefore, encourage, rather than crowd-out private investment.
Moreover, interest rate is only one factor to influence private investment; there are other factors, such as availability of quality infrastructure and human capital, which are more important for the private sector’s investment decision. So, if the government borrows for such productivity raising investment, there should be crowding-in of private investment.
10.3.2 Debt and growth
Figure 10.1, taken from the IMF’s Fiscal Monitor (May, 2010), suggests that there is no clear relation between debt and growth. The negative relation is influenced by large outliers, debt-GDP ratios, exceeding 100 per cent. More importantly, the discussion should distinguish between domestic debt and foreign debt. Governments must be careful about borrowing overseas. Its ability to service foreign debt can be affected by sudden shifts in the global economy pushing interest rates up and/or adversely affecting export earnings.
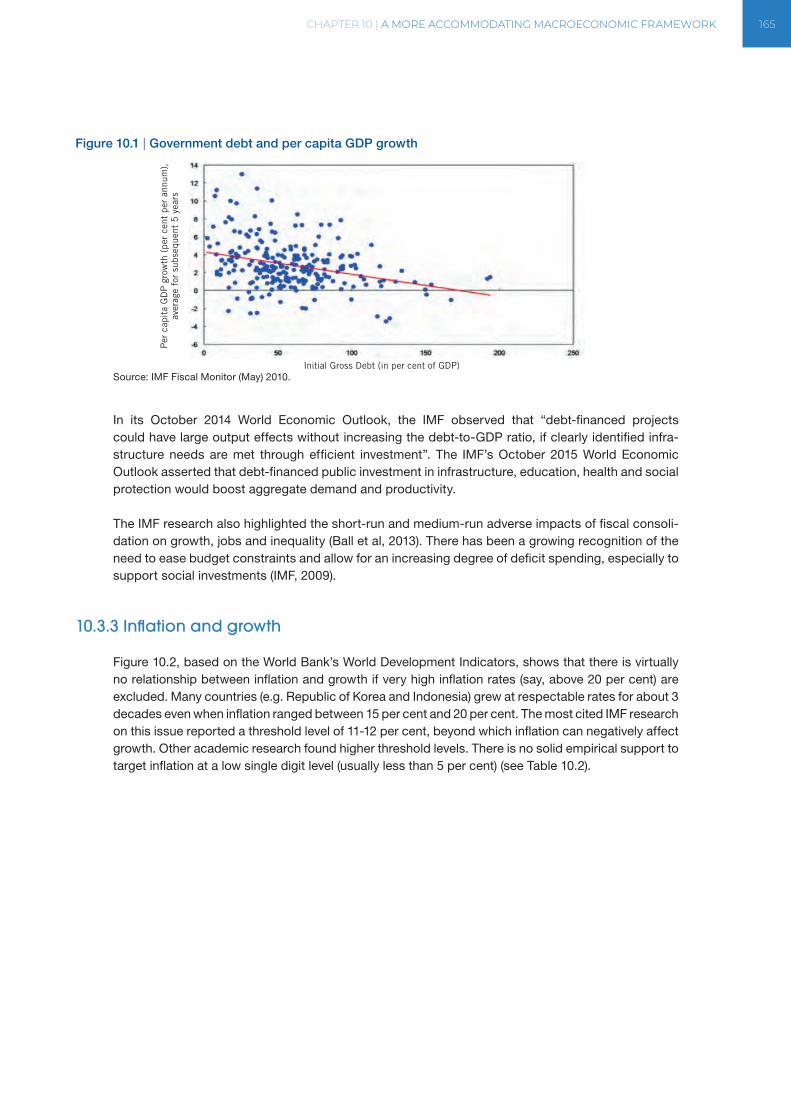
CHAPTER 10 | A MORE ACCOMMODATING MACROECONOMIC FRAMEWORK 165
Figure 10.1 | Government debt and per capita GDP growth
Source: IMF Fiscal Monitor (May) 2010.
In its October 2014 World Economic Outlook, the IMF observed that “debt-financed projects could have large output effects without increasing the debt-to-GDP ratio, if clearly identified infra-structure needs are met through efficient investment”. The IMF’s October 2015 World Economic Outlook asserted that debt-financed public investment in infrastructure, education, health and social protection would boost aggregate demand and productivity.
The IMF research also highlighted the short-run and medium-run adverse impacts of fiscal consoli-dation on growth, jobs and inequality (Ball et al, 2013). There has been a growing recognition of the need to ease budget constraints and allow for an increasing degree of deficit spending, especially to support social investments (IMF, 2009).
10.3.3 Inflation and growth
Figure 10.2, based on the World Bank’s World Development Indicators, shows that there is virtually no relationship between inflation and growth if very high inflation rates (say, above 20 per cent) are excluded. Many countries (e.g. Republic of Korea and Indonesia) grew at respectable rates for about 3 decades even when inflation ranged between 15 per cent and 20 per cent. The most cited IMF research on this issue reported a threshold level of 11-12 per cent, beyond which inflation can negatively affect growth. Other academic research found higher threshold levels. There is no solid empirical support to target inflation at a low single digit level (usually less than 5 per cent) (see Table 10.2).
Initial Gross Debt (in per cent of GDP)
Per
cap
ita
GD
P g
row
th (
per
cent
per
ann
um),
aver
age
for
subs
eque
nt 5
yea
rs
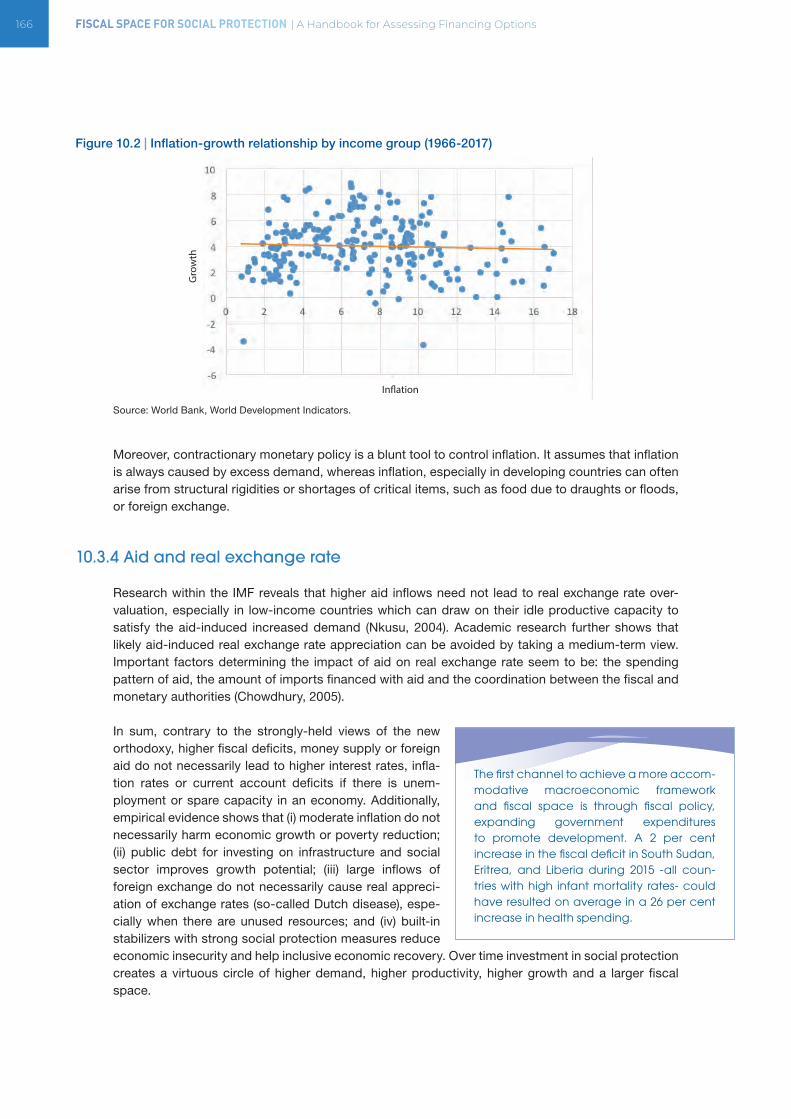
166 FISCAL SPACE FOR SOCIAL PROTECTION | A Handbook for Assessing Financing Options
Figure 10.2 | Inflation-growth relationship by income group (1966-2017)
Source: World Bank, World Development Indicators.
Moreover, contractionary monetary policy is a blunt tool to control inflation. It assumes that inflation is always caused by excess demand, whereas inflation, especially in developing countries can often arise from structural rigidities or shortages of critical items, such as food due to draughts or floods, or foreign exchange.
10.3.4 Aid and real exchange rate
Research within the IMF reveals that higher aid inflows need not lead to real exchange rate over-valuation, especially in low-income countries which can draw on their idle productive capacity to satisfy the aid-induced increased demand (Nkusu, 2004). Academic research further shows that likely aid-induced real exchange rate appreciation can be avoided by taking a medium-term view. Important factors determining the impact of aid on real exchange rate seem to be: the spending pattern of aid, the amount of imports financed with aid and the coordination between the fiscal and monetary authorities (Chowdhury, 2005).
In sum, contrary to the strongly-held views of the new orthodoxy, higher fiscal deficits, money supply or foreign aid do not necessarily lead to higher interest rates, infla-tion rates or current account deficits if there is unem-ployment or spare capacity in an economy. Additionally, empirical evidence shows that (i) moderate inflation do not necessarily harm economic growth or poverty reduction; (ii) public debt for investing on infrastructure and social sector improves growth potential; (iii) large inflows of foreign exchange do not necessarily cause real appreci-ation of exchange rates (so-called Dutch disease), espe-cially when there are unused resources; and (iv) built-in stabilizers with strong social protection measures reduce economic insecurity and help inclusive economic recovery. Over time investment in social protection creates a virtuous circle of higher demand, higher productivity, higher growth and a larger fiscal space.
The first channel to achieve a more accom-modative macroeconomic framework and fiscal space is through fiscal policy, expanding government expenditures to promote development. A 2 per cent increase in the fiscal deficit in South Sudan, Eritrea, and Liberia during 2015 -all coun-tries with high infant mortality rates- could have resulted on average in a 26 per cent increase in health spending.
In�ation
Gro
wth
CHAPTER 10 | A MORE ACCOMMODATING MACROECONOMIC FRAMEWORK 167
10.4 ACCOMMODATIVE MACROECONOMIC POLICIES FOR FISCAL SPACE
10.4.1 Fiscal policy
The first channel to achieve a more accommodative macroeconomic framework and fiscal space is through expanding government expenditures to influence the economy and development of a country. As part of the crisis response, there has been a growing recognition of the need to ease budget constraints and allow for an increasing degree of deficit spending, especially to support social investments (IMF, 2009). By doing so, more resources can be allocated to address the impacts of the crisis and support poverty-reducing and employment-generating economic growth. To demonstrate the potential size of resources that could be freed up for social protection spending through larger—albeit reasonable—fiscal deficits, consider Sub-Saharan Africa. Of the 46 countries in the region for which there is fiscal balance data, 39 were forecasted to have run fiscal deficits in 2015 (Table 10.1). If each of these countries increased the size of their current deficit by two percentage points, public health spending could jump by more than 5 per cent, on average, in terms of their current health budget (Column C). Some countries, however, could experience vast increases in available resources for public health. For example, a 2 per cent increase in the fiscal deficit in South Sudan, Eritrea, and Liberia during 2015 − all countries with high infant mortality rates − could have resulted on average in a 26 per cent increase in health spending (Column C). In fact, many developing countries increased their deficits to finance pressing needs during the Global Recession (Box 10.2).
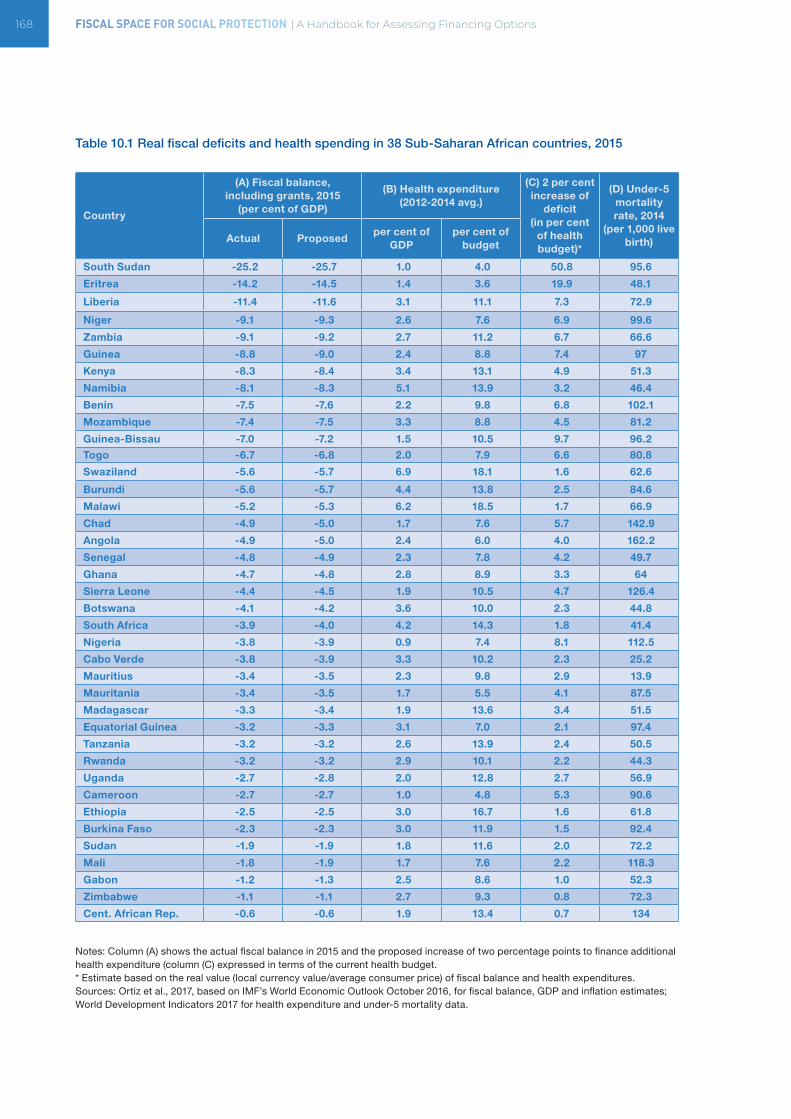
168 FISCAL SPACE FOR SOCIAL PROTECTION | A Handbook for Assessing Financing Options
Table 10.1 Real fiscal deficits and health spending in 38 Sub-Saharan African countries, 2015
Country
(A) Fiscal balance, including grants, 2015
(per cent of GDP)
(B) Health expenditure (2012-2014 avg.)
(C) 2 per cent increase of
deficit (in per cent
of health budget)*
(D) Under-5 mortality rate, 2014
(per 1,000 live birth)Actual Proposed
per cent of GDP
per cent of budget
South Sudan -25.2 -25.7 1.0 4.0 50.8 95.6
Eritrea -14.2 -14.5 1.4 3.6 19.9 48.1
Liberia -11.4 -11.6 3.1 11.1 7.3 72.9
Niger -9.1 -9.3 2.6 7.6 6.9 99.6
Zambia -9.1 -9.2 2.7 11.2 6.7 66.6
Guinea -8.8 -9.0 2.4 8.8 7.4 97
Kenya -8.3 -8.4 3.4 13.1 4.9 51.3
Namibia -8.1 -8.3 5.1 13.9 3.2 46.4
Benin -7.5 -7.6 2.2 9.8 6.8 102.1
Mozambique -7.4 -7.5 3.3 8.8 4.5 81.2
Guinea-Bissau -7.0 -7.2 1.5 10.5 9.7 96.2
Togo -6.7 -6.8 2.0 7.9 6.6 80.8
Swaziland -5.6 -5.7 6.9 18.1 1.6 62.6
Burundi -5.6 -5.7 4.4 13.8 2.5 84.6
Malawi -5.2 -5.3 6.2 18.5 1.7 66.9
Chad -4.9 -5.0 1.7 7.6 5.7 142.9
Angola -4.9 -5.0 2.4 6.0 4.0 162.2
Senegal -4.8 -4.9 2.3 7.8 4.2 49.7
Ghana -4.7 -4.8 2.8 8.9 3.3 64
Sierra Leone -4.4 -4.5 1.9 10.5 4.7 126.4
Botswana -4.1 -4.2 3.6 10.0 2.3 44.8
South Africa -3.9 -4.0 4.2 14.3 1.8 41.4
Nigeria -3.8 -3.9 0.9 7.4 8.1 112.5
Cabo Verde -3.8 -3.9 3.3 10.2 2.3 25.2
Mauritius -3.4 -3.5 2.3 9.8 2.9 13.9
Mauritania -3.4 -3.5 1.7 5.5 4.1 87.5
Madagascar -3.3 -3.4 1.9 13.6 3.4 51.5
Equatorial Guinea -3.2 -3.3 3.1 7.0 2.1 97.4
Tanzania -3.2 -3.2 2.6 13.9 2.4 50.5
Rwanda -3.2 -3.2 2.9 10.1 2.2 44.3
Uganda -2.7 -2.8 2.0 12.8 2.7 56.9
Cameroon -2.7 -2.7 1.0 4.8 5.3 90.6
Ethiopia -2.5 -2.5 3.0 16.7 1.6 61.8
Burkina Faso -2.3 -2.3 3.0 11.9 1.5 92.4
Sudan -1.9 -1.9 1.8 11.6 2.0 72.2
Mali -1.8 -1.9 1.7 7.6 2.2 118.3
Gabon -1.2 -1.3 2.5 8.6 1.0 52.3
Zimbabwe -1.1 -1.1 2.7 9.3 0.8 72.3
Cent. African Rep. -0.6 -0.6 1.9 13.4 0.7 134
Notes: Column (A) shows the actual fiscal balance in 2015 and the proposed increase of two percentage points to finance additional health expenditure (column (C) expressed in terms of the current health budget.* Estimate based on the real value (local currency value/average consumer price) of fiscal balance and health expenditures. Sources: Ortiz et al., 2017, based on IMF’s World Economic Outlook October 2016, for fiscal balance, GDP and inflation estimates; World Development Indicators 2017 for health expenditure and under-5 mortality data.
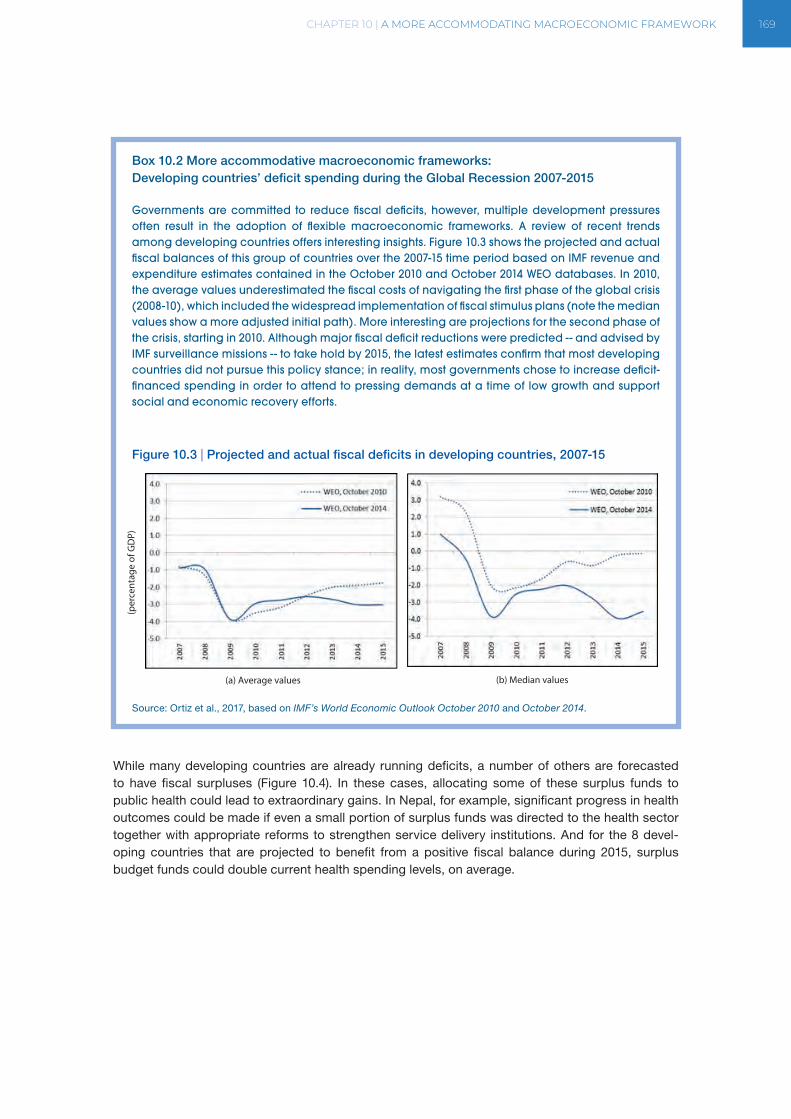
CHAPTER 10 | A MORE ACCOMMODATING MACROECONOMIC FRAMEWORK 169
Box 10.2 More accommodative macroeconomic frameworks: Developing countries’ deficit spending during the Global Recession 2007-2015
Governments are committed to reduce fiscal deficits, however, multiple development pressures often result in the adoption of flexible macroeconomic frameworks. A review of recent trends among developing countries offers interesting insights. Figure 10.3 shows the projected and actual fiscal balances of this group of countries over the 2007-15 time period based on IMF revenue and expenditure estimates contained in the October 2010 and October 2014 WEO databases. In 2010, the average values underestimated the fiscal costs of navigating the first phase of the global crisis (2008-10), which included the widespread implementation of fiscal stimulus plans (note the median values show a more adjusted initial path). More interesting are projections for the second phase of the crisis, starting in 2010. Although major fiscal deficit reductions were predicted -- and advised by IMF surveillance missions -- to take hold by 2015, the latest estimates confirm that most developing countries did not pursue this policy stance; in reality, most governments chose to increase deficit- financed spending in order to attend to pressing demands at a time of low growth and support social and economic recovery efforts.
Figure 10.3 | Projected and actual fiscal deficits in developing countries, 2007-15
Source: Ortiz et al., 2017, based on IMF’s World Economic Outlook October 2010 and October 2014.
While many developing countries are already running deficits, a number of others are forecasted to have fiscal surpluses (Figure 10.4). In these cases, allocating some of these surplus funds to public health could lead to extraordinary gains. In Nepal, for example, significant progress in health outcomes could be made if even a small portion of surplus funds was directed to the health sector together with appropriate reforms to strengthen service delivery institutions. And for the 8 devel-oping countries that are projected to benefit from a positive fiscal balance during 2015, surplus budget funds could double current health spending levels, on average.
(a) Average values (b) Median values
(per
cent
age
of G
DP)
(a) Average values (b) Median values
(per
cent
age
of G
DP)
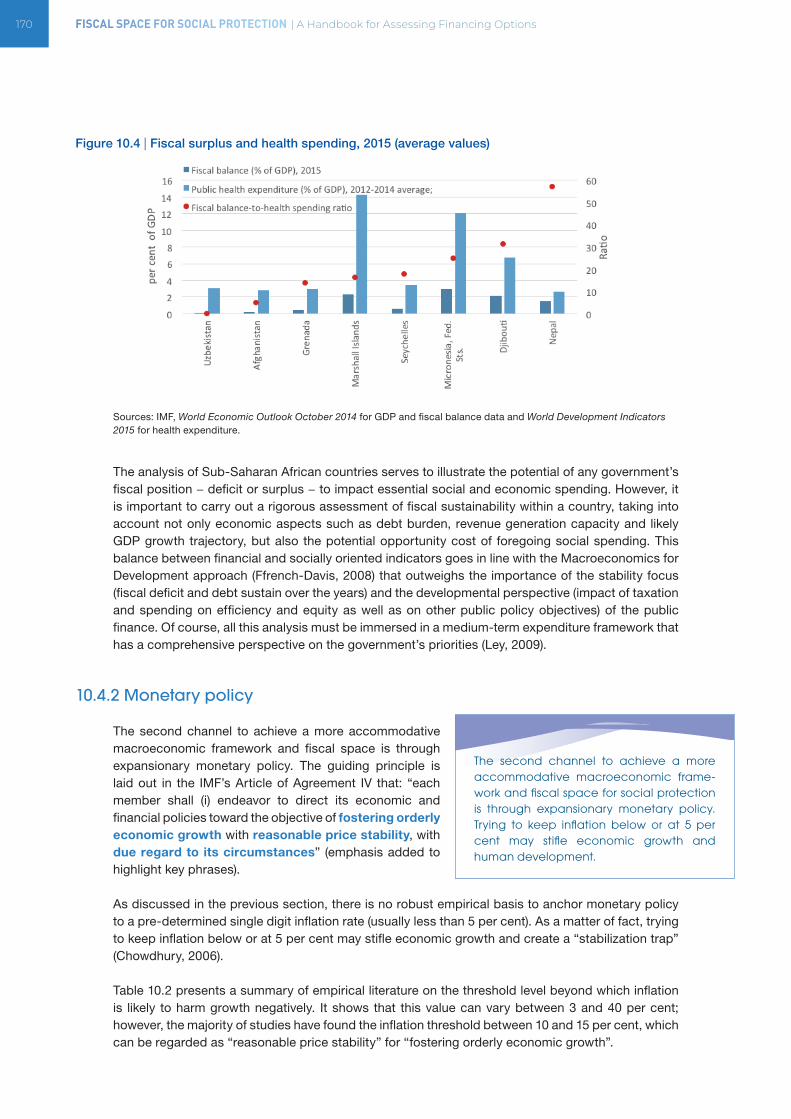
170 FISCAL SPACE FOR SOCIAL PROTECTION | A Handbook for Assessing Financing Options
Figure 10.4 | Fiscal surplus and health spending, 2015 (average values)
Sources: IMF, World Economic Outlook October 2014 for GDP and fiscal balance data and World Development Indicators 2015 for health expenditure.
The analysis of Sub-Saharan African countries serves to illustrate the potential of any government’s fiscal position − deficit or surplus − to impact essential social and economic spending. However, it is important to carry out a rigorous assessment of fiscal sustainability within a country, taking into account not only economic aspects such as debt burden, revenue generation capacity and likely GDP growth trajectory, but also the potential opportunity cost of foregoing social spending. This balance between financial and socially oriented indicators goes in line with the Macroeconomics for Development approach (Ffrench-Davis, 2008) that outweighs the importance of the stability focus (fiscal deficit and debt sustain over the years) and the developmental perspective (impact of taxation and spending on efficiency and equity as well as on other public policy objectives) of the public finance. Of course, all this analysis must be immersed in a medium-term expenditure framework that has a comprehensive perspective on the government’s priorities (Ley, 2009).
10.4.2 Monetary policy
The second channel to achieve a more accommodative macroeconomic framework and fiscal space is through expansionary monetary policy. The guiding principle is laid out in the IMF’s Article of Agreement IV that: “each member shall (i) endeavor to direct its economic and financial policies toward the objective of fostering orderly economic growth with reasonable price stability, with due regard to its circumstances” (emphasis added to highlight key phrases).
As discussed in the previous section, there is no robust empirical basis to anchor monetary policy to a pre-determined single digit inflation rate (usually less than 5 per cent). As a matter of fact, trying to keep inflation below or at 5 per cent may stifle economic growth and create a “stabilization trap” (Chowdhury, 2006).
Table 10.2 presents a summary of empirical literature on the threshold level beyond which inflation is likely to harm growth negatively. It shows that this value can vary between 3 and 40 per cent; however, the majority of studies have found the inflation threshold between 10 and 15 per cent, which can be regarded as “reasonable price stability” for “fostering orderly economic growth”.
The second channel to achieve a more accommodative macroeconomic frame-work and fiscal space for social protection is through expansionary monetary policy. Trying to keep inflation below or at 5 per cent may stifle economic growth and human development.
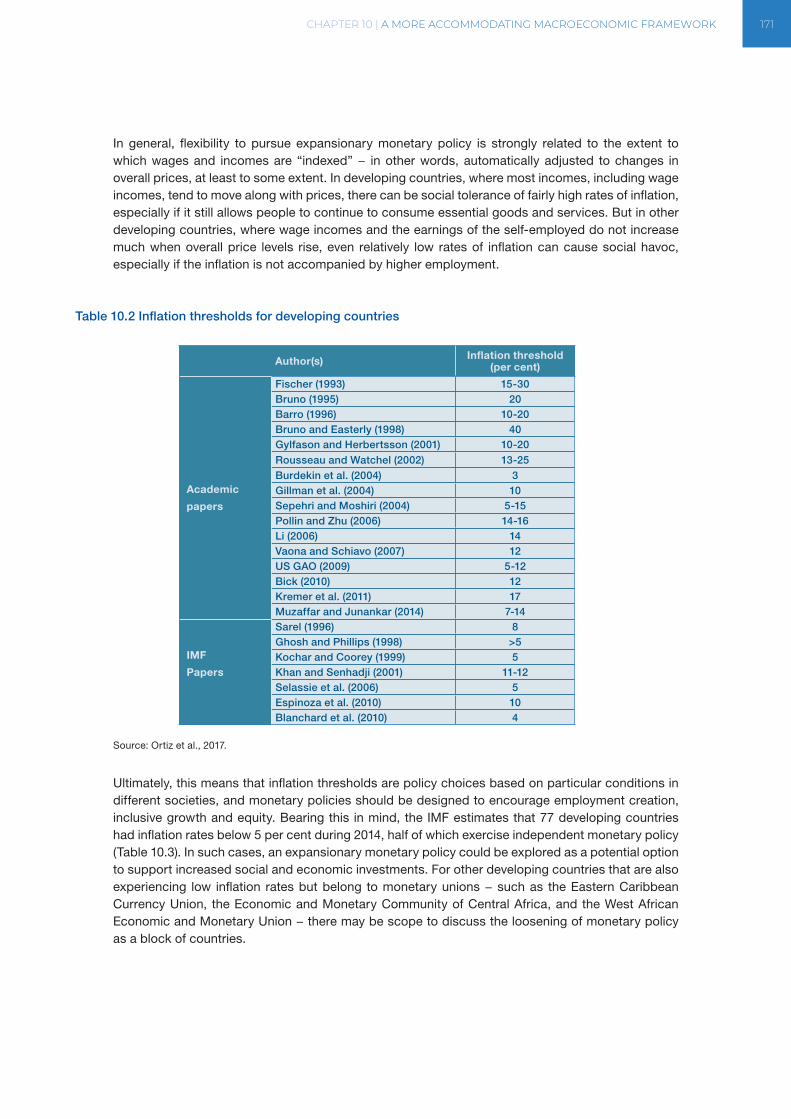
CHAPTER 10 | A MORE ACCOMMODATING MACROECONOMIC FRAMEWORK 171
In general, flexibility to pursue expansionary monetary policy is strongly related to the extent to which wages and incomes are “indexed” − in other words, automatically adjusted to changes in overall prices, at least to some extent. In developing countries, where most incomes, including wage incomes, tend to move along with prices, there can be social tolerance of fairly high rates of inflation, especially if it still allows people to continue to consume essential goods and services. But in other developing countries, where wage incomes and the earnings of the self-employed do not increase much when overall price levels rise, even relatively low rates of inflation can cause social havoc, especially if the inflation is not accompanied by higher employment.
Table 10.2 Inflation thresholds for developing countries
Author(s) Inflation threshold(per cent)
Academic
papers
Fischer (1993) 15-30Bruno (1995) 20Barro (1996) 10-20Bruno and Easterly (1998) 40Gylfason and Herbertsson (2001) 10-20Rousseau and Watchel (2002) 13-25Burdekin et al. (2004) 3Gillman et al. (2004) 10Sepehri and Moshiri (2004) 5-15Pollin and Zhu (2006) 14-16Li (2006) 14Vaona and Schiavo (2007) 12US GAO (2009) 5-12Bick (2010) 12Kremer et al. (2011) 17Muzaffar and Junankar (2014) 7-14
IMF
Papers
Sarel (1996) 8Ghosh and Phillips (1998) >5Kochar and Coorey (1999) 5Khan and Senhadji (2001) 11-12Selassie et al. (2006) 5Espinoza et al. (2010) 10Blanchard et al. (2010) 4
Source: Ortiz et al., 2017.
Ultimately, this means that inflation thresholds are policy choices based on particular conditions in different societies, and monetary policies should be designed to encourage employment creation, inclusive growth and equity. Bearing this in mind, the IMF estimates that 77 developing countries had inflation rates below 5 per cent during 2014, half of which exercise independent monetary policy (Table 10.3). In such cases, an expansionary monetary policy could be explored as a potential option to support increased social and economic investments. For other developing countries that are also experiencing low inflation rates but belong to monetary unions − such as the Eastern Caribbean Currency Union, the Economic and Monetary Community of Central Africa, and the West African Economic and Monetary Union − there may be scope to discuss the loosening of monetary policy as a block of countries.
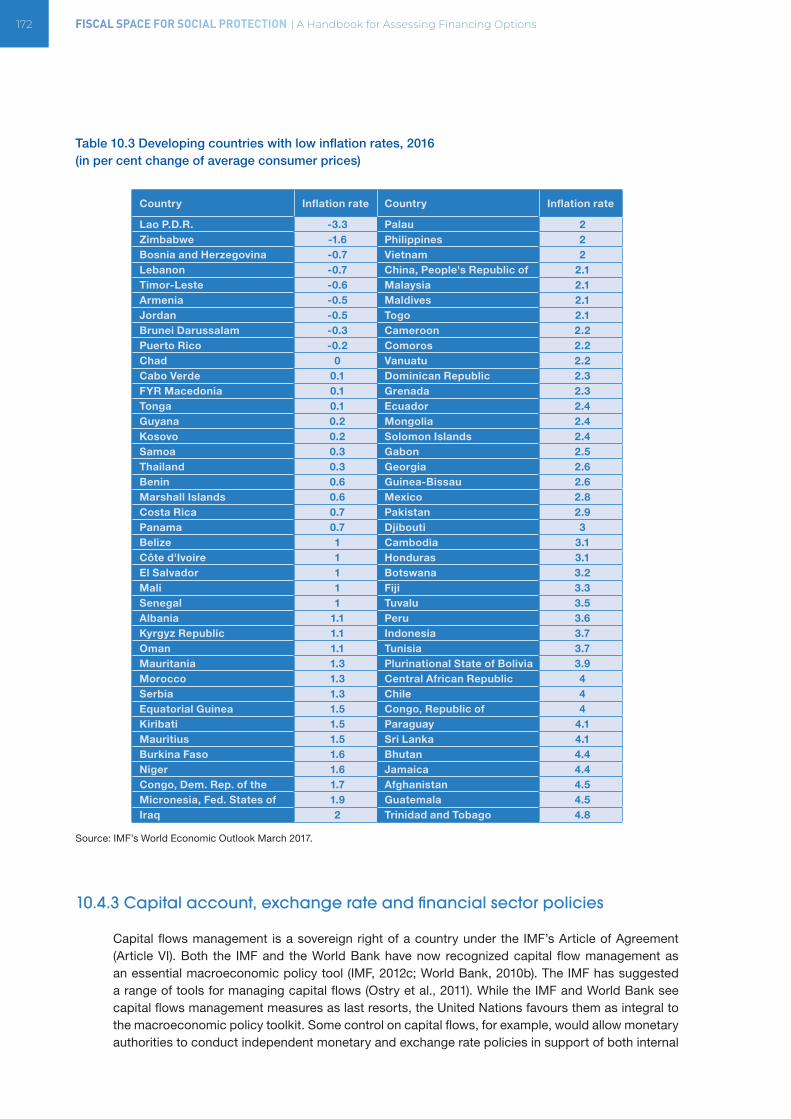
172 FISCAL SPACE FOR SOCIAL PROTECTION | A Handbook for Assessing Financing Options
Table 10.3 Developing countries with low inflation rates, 2016 (in per cent change of average consumer prices)
Country Inflation rate Country Inflation rate
Lao P.D.R. -3.3 Palau 2Zimbabwe -1.6 Philippines 2Bosnia and Herzegovina -0.7 Vietnam 2Lebanon -0.7 China, People's Republic of 2.1Timor-Leste -0.6 Malaysia 2.1Armenia -0.5 Maldives 2.1Jordan -0.5 Togo 2.1Brunei Darussalam -0.3 Cameroon 2.2Puerto Rico -0.2 Comoros 2.2Chad 0 Vanuatu 2.2Cabo Verde 0.1 Dominican Republic 2.3FYR Macedonia 0.1 Grenada 2.3Tonga 0.1 Ecuador 2.4Guyana 0.2 Mongolia 2.4Kosovo 0.2 Solomon Islands 2.4Samoa 0.3 Gabon 2.5Thailand 0.3 Georgia 2.6Benin 0.6 Guinea-Bissau 2.6Marshall Islands 0.6 Mexico 2.8Costa Rica 0.7 Pakistan 2.9Panama 0.7 Djibouti 3Belize 1 Cambodia 3.1Côte d'Ivoire 1 Honduras 3.1El Salvador 1 Botswana 3.2Mali 1 Fiji 3.3Senegal 1 Tuvalu 3.5Albania 1.1 Peru 3.6Kyrgyz Republic 1.1 Indonesia 3.7Oman 1.1 Tunisia 3.7Mauritania 1.3 Plurinational State of Bolivia 3.9Morocco 1.3 Central African Republic 4Serbia 1.3 Chile 4Equatorial Guinea 1.5 Congo, Republic of 4Kiribati 1.5 Paraguay 4.1Mauritius 1.5 Sri Lanka 4.1Burkina Faso 1.6 Bhutan 4.4Niger 1.6 Jamaica 4.4Congo, Dem. Rep. of the 1.7 Afghanistan 4.5Micronesia, Fed. States of 1.9 Guatemala 4.5Iraq 2 Trinidad and Tobago 4.8
Source: IMF’s World Economic Outlook March 2017.
10.4.3 Capital account, exchange rate and financial sector policies
Capital flows management is a sovereign right of a country under the IMF’s Article of Agreement (Article VI). Both the IMF and the World Bank have now recognized capital flow management as an essential macroeconomic policy tool (IMF, 2012c; World Bank, 2010b). The IMF has suggested a range of tools for managing capital flows (Ostry et al., 2011). While the IMF and World Bank see capital flows management measures as last resorts, the United Nations favours them as integral to the macroeconomic policy toolkit. Some control on capital flows, for example, would allow monetary authorities to conduct independent monetary and exchange rate policies in support of both internal
CHAPTER 10 | A MORE ACCOMMODATING MACROECONOMIC FRAMEWORK 173
and external balances. Likewise, some regulation of the financial sector would allow monetary authorities to influence credit allocation to the socially desirable sectors, including promoting financial inclusion. This would also allow the fiscal authority to borrow when needed without being hostage to the financial speculators. Policy space thus restored would allow tolerance of moderate inflation and budget deficits. This immediately widens the fiscal space through moderate expansion of money, credit and deficit financing.
10.5 CONCLUDING REMARKS
Historically, macroeconomic policies, with built-in strong automatic stabilizers, have been counter- cyclical and growth promoting. Social protection and macro-prudential regulations provided supporting roles. Restoring the historical role of macroeconomic policies with a strong social protec-tion system at their core requires revisiting the orthodox macroeconomic policy framework and the reform paradigm that emphasize balancing fiscal budget, low inflation, deregulation, privatization and liberalization.
With macro-prudential regulations on capital flows and the supporting role of public provision of social goods (e.g. healthcare, education etc.), countries can accommodate moderate inflation and budget deficits. Ultimately, this means that inflation and deficit thresholds are arbitrary policy choices; thus governments have some room for manoeuvre to design monetary and fiscal policies to generate employment and social protection. This more accommodative macroeconomic framework allows countries to significantly expand their policy space and fiscal space by using a combination of (i) fiscal surplus and central bank’s excess foreign exchange reserves, (ii) domestic borrowing (or external debt restructuring/repudiation), and (iii) scaled-up foreign aid, as discussed in chapters 8, 9, and 11, respectively.
The two main policies for macroeconomic management are fiscal policy and monetary policy. Fiscal policy comprises government revenue and expenditure and monetary policy deals with money (credit) supply and interest rates. Thus, a more accommodative macroeconomic framework would allow for some tolerance for fiscal deficit and inflation, to expand government expenditures to promote development. There is no robust empirical basis to anchor monetary policy to a pre-determined single digit inflation rate (usually less than 5 per cent).
However, this does not mean any complacency on the part of policymakers. Accommodating macro-economic policies must ensure long-term sustainability by linking additional fiscal space (from fiscal and foreign exchange reserves, borrowing and scaled-up foreign aid) to productive investment for developmental purposes. By contributing to inclusive growth directly and indirectly an expanded universal social protection system, made possible by such additional fiscal space, is unlikely to jeopardize long-term fiscal sustainability.
174 FISCAL SPACE FOR SOCIAL PROTECTION | A Handbook for Assessing Financing Options
10.6 KEY DOCUMENTS AND DATA SOURCES
Chowdhury, A.; Islam, I. 2011. “Attaining the Millennium Development Goals: the role of macro-economic policies”, in International Journal of Social Economics, Vol. 38, No. 12, pp. 930-952.
This paper sheds light on the role of macroeconomic policy-mix in achieving the Millennium Development Goals (MDGs), especially the goal of poverty reduction. It shows the adverse impacts of restrictive macroeconomic policy-mixes pursued by many developing countries as part of condi-tions to receive support from international financial institutions and the donor community. It then discusses how macroeconomic policies can be adjusted to achieve developmental goals, especially reduction of poverty and inequality.
Chowdhury, A.; Islam, I. 2012. “The Debate on Expansionary Fiscal Consolidation: How Robust is the Evidence?”, in The Economic and Labour Relations Review, Vol. 23, No. 3, pp. 13–38.
This paper critically examines the key empirical evidence used to support the fiscal consolidation argument, complemented by a brief assessment of the limitations of the analytical foundation of the growth promoting benefits of the fiscal consolidation thesis. It also reviews the evidence on the debt-growth relationship at some length.
Muzaffar, A. T.; Chowdhury, A. 2014. “The IMF and the policy of low inflation: A review of Article IV consultations for selected Asian developing countries”, in The Economic and Labour Relations Review, Vol. 25, No. 3, pp. 435–454.
This paper provides a comprehensive review of empirical literature on inflation thresholds and concludes that there is no robust empirical support or rationale for the IMF’s preference for low single-digit inflation mostly around 5 per cent or below it.
Ortiz, I.; Cummins, M.; Karunanethy, K. 2017. Fiscal Space for Social Protection and the SDGs: Options to Expand Social Investments in 187 Countries, Extension of Social Security (ESS) Paper Series No. 48 (Geneva and New York, International Labour Organization, UNICEF and UN Women).
Data sources
IMF, World Economic Outlook database https://www.imf.org/en/Data.
Contains updated time series data for GDP growth, inflation, unemployment, payments balances, public debt and deficits.
World Bank, World Development Indicators http://data.worldbank.org/data-catalog/world-development-indicators
The primary World Bank collection of development indicators, compiled from officially-recognized international sources. It presents the most current and accurate global development data available, and includes national, regional and global estimates.
Learning accomplishments
After reading this chapter, a reader should have a good grasp of:
• What is meant by macroeconomic stability and its link to economic growth and social protection
• Limitations of conventional macroeconomic policy framework
• Why the historical role of macroeconomic policies aimed at growth and stabilization should be restored
• How macroeconomic policies can be made more accommodative to create more policy and fiscal space to expand social protection
CHAPTER 11 | FOREIGN AID 175
CHAPTER 11. FOREIGN AID
LEARNING OBJECTIVES
• Appreciate the significance of foreign financial aid for social protection
• Learn key issues of foreign aid for increased fiscal space
• Know the trends and major partners in South-South and South-South-North triangular cooperation
CONTENTS
• North-South transfers – trends, patterns and modalities
• South-South cooperation – trends and patterns
• North-South triangular cooperation – trends and main actors
• Key documents and data sources
Historically, foreign aid played a significant role in easing the fiscal burden of countries attempting to accelerate economic and social development. America’s over US$ 13 billion Marshall Plan (officially the European Recovery Program, ERP) initiative to aid Western Europe’s reconstruction following WW II is the testimony of what injections of large amount of foreign aid can achieve. This chapter discusses the role of foreign financial aid in expanding fiscal space in developing countries. It describes different cooperation mechanisms – North-South, South-South and triangular coopera-tion. It also analyses their global trends and reflects on the significance of various forms and sources of foreign financial assistance for social protection.
176 FISCAL SPACE FOR SOCIAL PROTECTION | A Handbook for Assessing Financing Options
11.1 WHY SCALE UP FOREIGN AID?
Foreign financial aid in the form of Official Development Assistance (ODA) can play an important role, especially in least developed countries (LDCs) or low-income countries (LICs).32 ODA, tradition-ally a tool for North-South support, is increasingly complemented by South-South transfers, thus increasing the variety of financial sources and development cooperation partnerships for developing countries.
Low-income countries (LICs) receive concessional loans from the international financial institutions. Highly-indebted LICs also received debt relief for poverty reduction from the IMF and World Bank. For long, donor countries committed at the United Nations to provide 0.7 per cent per cent of their GNI as aid to LDCs. While a few donor countries have reached this target, the majority have failed. However, as highlighted in chapter 10, many LDCs and LICs had to adhere to an “expenditure-ceiling” under the IMF-World Bank structural adjustment programme even when they received grants from philanthropic foundations and sources such as the Global Fund to Fight AIDS, Tuberculosis and Malaria (Ooms and Schrecker, 2005). It was argued that these countries do not have absorptive capacity, and large aid-induced government spending would likely cause inflation and exchange rate appreciation. Thus, scaling-up of foreign aid was not favoured.
But as demonstrated in the previous chapters, the fear of macroeconomic instability or exchange rate appreciations due to large aid flows and higher public spending was over-played. Moderate inflation and budget deficits do not necessarily lead to macroeconomic instability or debt crises, especially when aid finances social and economic investment to reduce large development deficits. Nor do large inflows of foreign aid cause exchange rate appre-ciations, when countries suffer from under-utilization of resources or wide-spread unemployment and under- employment.
Instead, the main issues, as highlighted in the Addis Ababa Action Agenda, are aid volatility and limited predictability, besides the fact that many donors have failed to meet the UN target of 0.7 per cent of their GNI. Transaction costs, tied aid, lack of policy coherence, fungibility and conditionality further reduce aid effectiveness. Thus, while ODA can and indeed does contribute to build social protection systems in developing countries, it often is not a sustainable financing instrument in the long term, as ODA flows tend to be limited in time and discretional in nature. Nevertheless, ODA can be quite useful, especially for LDCs, in setting up social protection systems/schemes.
32 Although many LDCs are also LICs, there are important distinctions between these two sets of developing countries. A coun-try’s LDC status is determined by three criteria developed at the Unites Nations. These criteria are: income level (GNI US$ 1,035 set in 2015); human asset index and economic venerability index (see https://www.un.org/development/desa/dpad/least-devel-oped-country-category/ldc-criteria.html). On the other hand, the World Bank uses income as the only criteria to classify countries. For the current 2017 fiscal year, low-income economies are defined as those with a GNI per capita, calculated using the World Bank Atlas method, of US$ 1,025 or less in 2015 (see https://datahelpdesk.worldbank.org/knowledgebase/articles/906519-world-bank-country-and-lending-groups).
Historically foreign aid played a significant role to accelerate economic and social development. The US Marshall Plan to aid Western Europe’s reconstruction following WW II is the testimony of what injections of large amount of foreign aid can achieve.
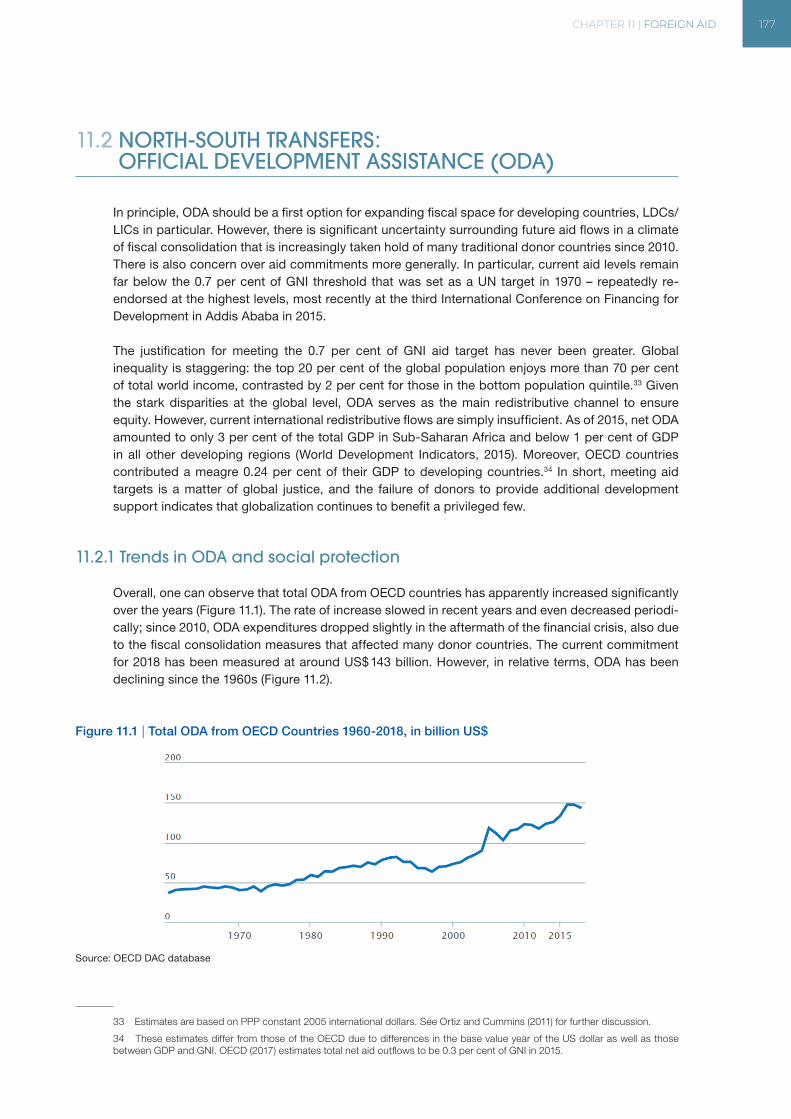
CHAPTER 11 | FOREIGN AID 177
11.2 NORTH-SOUTH TRANSFERS: OFFICIAL DEVELOPMENT ASSISTANCE (ODA)
In principle, ODA should be a first option for expanding fiscal space for developing countries, LDCs/LICs in particular. However, there is significant uncertainty surrounding future aid flows in a climate of fiscal consolidation that is increasingly taken hold of many traditional donor countries since 2010. There is also concern over aid commitments more generally. In particular, current aid levels remain far below the 0.7 per cent of GNI threshold that was set as a UN target in 1970 – repeatedly re- endorsed at the highest levels, most recently at the third International Conference on Financing for Development in Addis Ababa in 2015.
The justification for meeting the 0.7 per cent of GNI aid target has never been greater. Global inequality is staggering: the top 20 per cent of the global population enjoys more than 70 per cent of total world income, contrasted by 2 per cent for those in the bottom population quintile.33 Given the stark disparities at the global level, ODA serves as the main redistributive channel to ensure equity. However, current international redistributive flows are simply insufficient. As of 2015, net ODA amounted to only 3 per cent of the total GDP in Sub-Saharan Africa and below 1 per cent of GDP in all other developing regions (World Development Indicators, 2015). Moreover, OECD countries contributed a meagre 0.24 per cent of their GDP to developing countries.34 In short, meeting aid targets is a matter of global justice, and the failure of donors to provide additional development support indicates that globalization continues to benefit a privileged few.
11.2.1 Trends in ODA and social protection
Overall, one can observe that total ODA from OECD countries has apparently increased significantly over the years (Figure 11.1). The rate of increase slowed in recent years and even decreased periodi-cally; since 2010, ODA expenditures dropped slightly in the aftermath of the financial crisis, also due to the fiscal consolidation measures that affected many donor countries. The current commitment for 2018 has been measured at around US$ 143 billion. However, in relative terms, ODA has been declining since the 1960s (Figure 11.2).
Figure 11.1 | Total ODA from OECD Countries 1960-2018, in billion US$
Source: OECD DAC database
33 Estimates are based on PPP constant 2005 international dollars. See Ortiz and Cummins (2011) for further discussion.
34 These estimates differ from those of the OECD due to differences in the base value year of the US dollar as well as those between GDP and GNI. OECD (2017) estimates total net aid outflows to be 0.3 per cent of GNI in 2015.
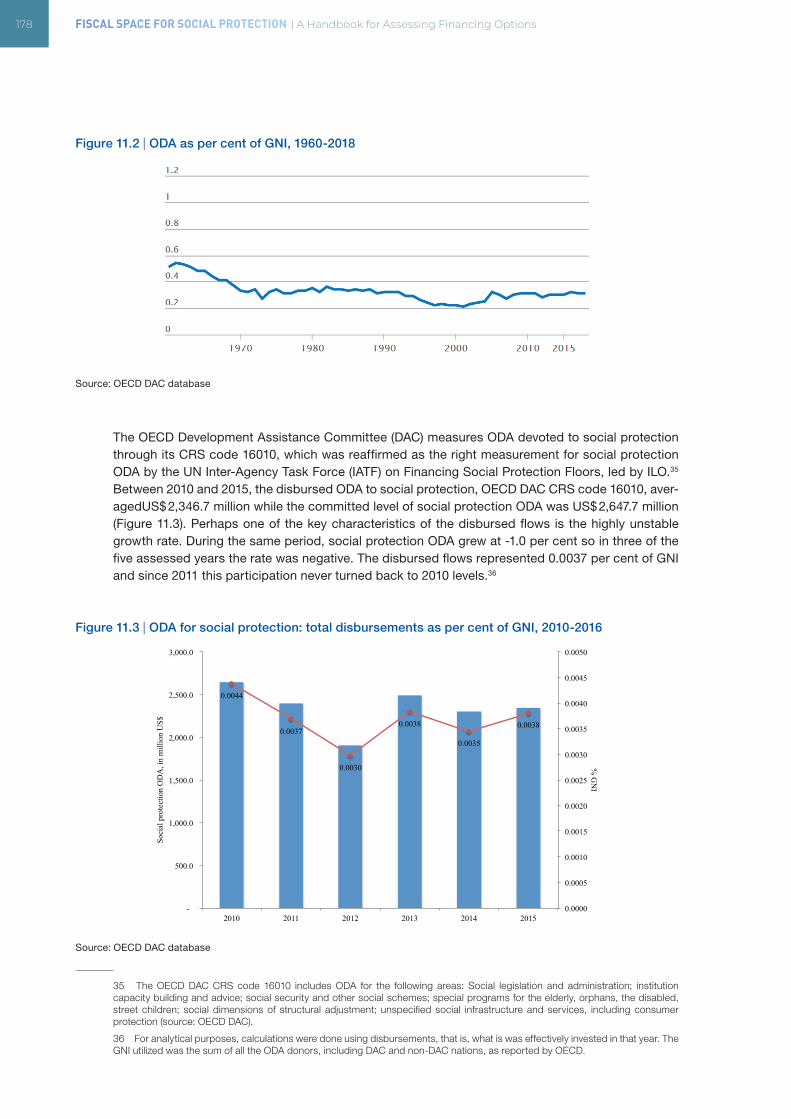
178 FISCAL SPACE FOR SOCIAL PROTECTION | A Handbook for Assessing Financing Options
Figure 11.2 | ODA as per cent of GNI, 1960-2018
Source: OECD DAC database
The OECD Development Assistance Committee (DAC) measures ODA devoted to social protection through its CRS code 16010, which was reaffirmed as the right measurement for social protection ODA by the UN Inter-Agency Task Force (IATF) on Financing Social Protection Floors, led by ILO.35 Between 2010 and 2015, the disbursed ODA to social protection, OECD DAC CRS code 16010, aver-agedUS$ 2,346.7 million while the committed level of social protection ODA was US$ 2,647.7 million (Figure 11.3). Perhaps one of the key characteristics of the disbursed flows is the highly unstable growth rate. During the same period, social protection ODA grew at -1.0 per cent so in three of the five assessed years the rate was negative. The disbursed flows represented 0.0037 per cent of GNI and since 2011 this participation never turned back to 2010 levels.36
Figure 11.3 | ODA for social protection: total disbursements as per cent of GNI, 2010-2016
Source: OECD DAC database
35 The OECD DAC CRS code 16010 includes ODA for the following areas: Social legislation and administration; institution capacity building and advice; social security and other social schemes; special programs for the elderly, orphans, the disabled, street children; social dimensions of structural adjustment; unspecified social infrastructure and services, including consumer protection (source: OECD DAC).
36 For analytical purposes, calculations were done using disbursements, that is, what is was effectively invested in that year. The GNI utilized was the sum of all the ODA donors, including DAC and non-DAC nations, as reported by OECD.
0.0044
0.0037
0.0030
0.0038
0.0035
0.0038
0.0000
0.0005
0.0010
0.0015
0.0020
0.0025
0.0030
0.0035
0.0040
0.0045
0.0050
-
500.0
1,000.0
1,500.0
2,000.0
2,500.0
3,000.0
2010 2011 2012 2013 2014 2015
% G
NI
Soci
al p
rote
ctio
n O
DA
, in
mill
ion
US$
Disbursements, million US$ Disbursements as % GNI
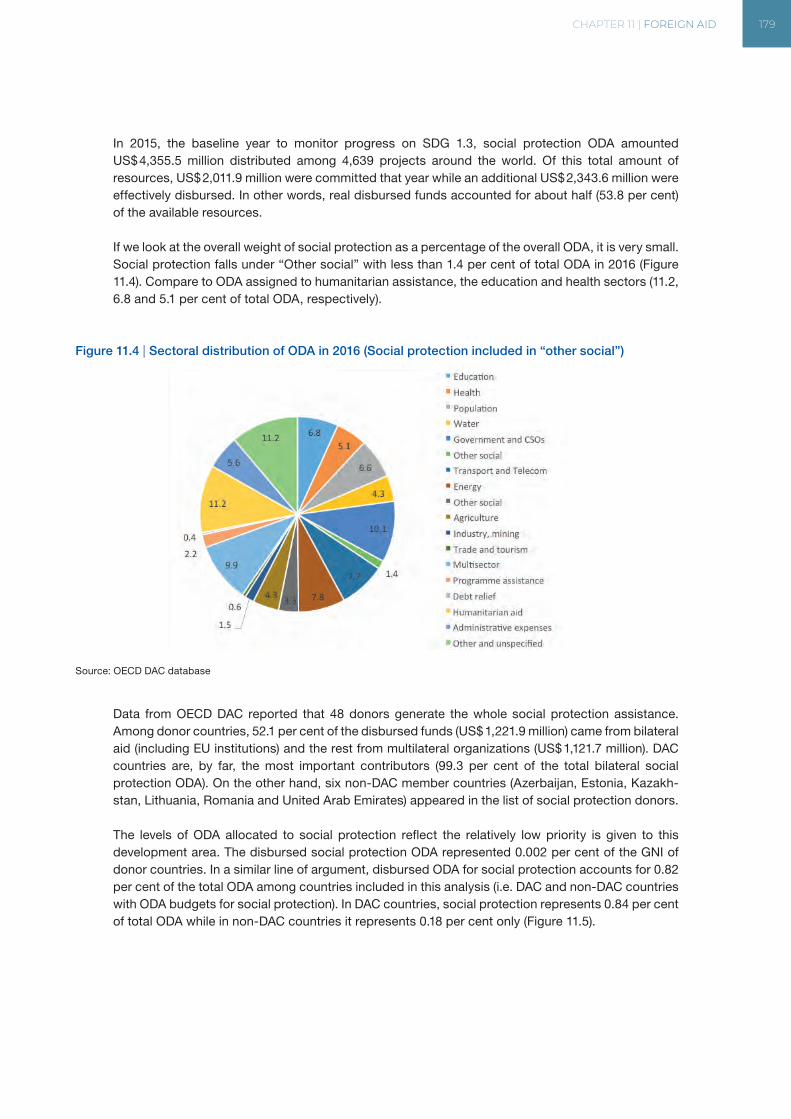
CHAPTER 11 | FOREIGN AID 179
In 2015, the baseline year to monitor progress on SDG 1.3, social protection ODA amounted US$ 4,355.5 million distributed among 4,639 projects around the world. Of this total amount of resources, US$ 2,011.9 million were committed that year while an additional US$ 2,343.6 million were effectively disbursed. In other words, real disbursed funds accounted for about half (53.8 per cent) of the available resources.
If we look at the overall weight of social protection as a percentage of the overall ODA, it is very small. Social protection falls under “Other social” with less than 1.4 per cent of total ODA in 2016 (Figure 11.4). Compare to ODA assigned to humanitarian assistance, the education and health sectors (11.2, 6.8 and 5.1 per cent of total ODA, respectively).
Figure 11.4 | Sectoral distribution of ODA in 2016 (Social protection included in “other social”)
Source: OECD DAC database
Data from OECD DAC reported that 48 donors generate the whole social protection assistance. Among donor countries, 52.1 per cent of the disbursed funds (US$ 1,221.9 million) came from bilateral aid (including EU institutions) and the rest from multilateral organizations (US$ 1,121.7 million). DAC countries are, by far, the most important contributors (99.3 per cent of the total bilateral social protection ODA). On the other hand, six non-DAC member countries (Azerbaijan, Estonia, Kazakh-stan, Lithuania, Romania and United Arab Emirates) appeared in the list of social protection donors.
The levels of ODA allocated to social protection reflect the relatively low priority is given to this development area. The disbursed social protection ODA represented 0.002 per cent of the GNI of donor countries. In a similar line of argument, disbursed ODA for social protection accounts for 0.82 per cent of the total ODA among countries included in this analysis (i.e. DAC and non-DAC countries with ODA budgets for social protection). In DAC countries, social protection represents 0.84 per cent of total ODA while in non-DAC countries it represents 0.18 per cent only (Figure 11.5).
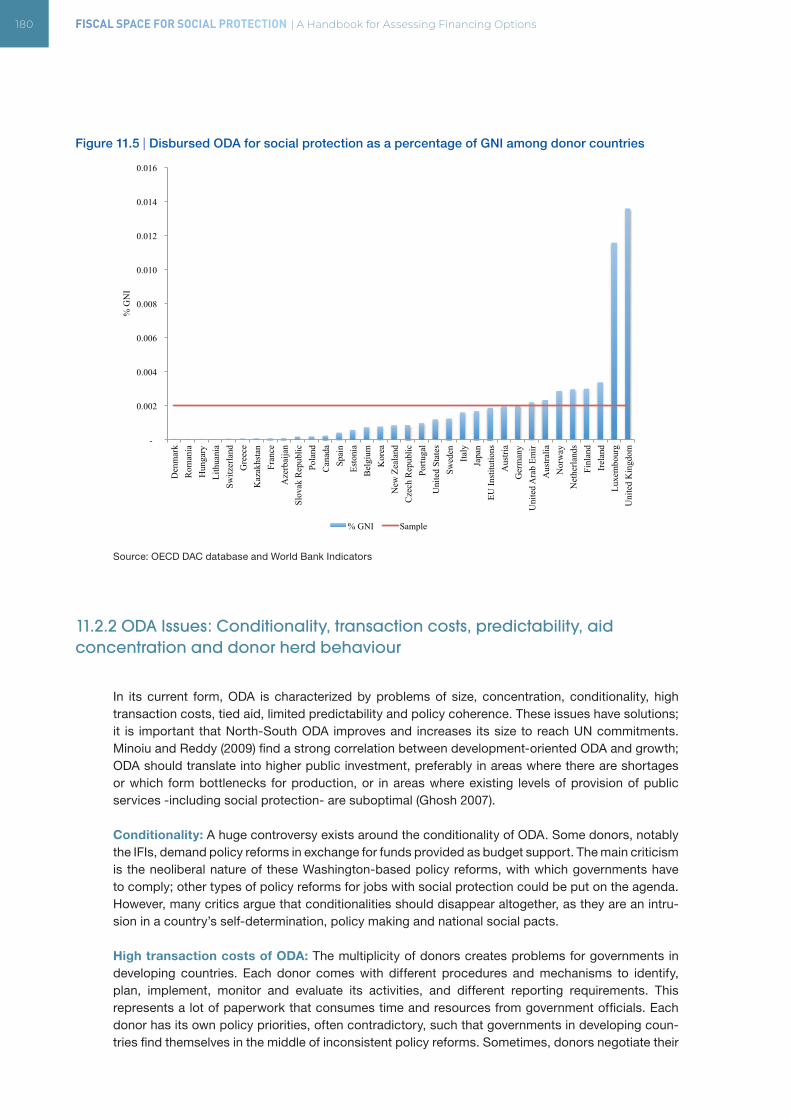
180 FISCAL SPACE FOR SOCIAL PROTECTION | A Handbook for Assessing Financing Options
Figure 11.5 | Disbursed ODA for social protection as a percentage of GNI among donor countries
Source: OECD DAC database and World Bank Indicators
11.2.2 ODA Issues: Conditionality, transaction costs, predictability, aid concentration and donor herd behaviour
In its current form, ODA is characterized by problems of size, concentration, conditionality, high transaction costs, tied aid, limited predictability and policy coherence. These issues have solutions; it is important that North-South ODA improves and increases its size to reach UN commitments. Minoiu and Reddy (2009) find a strong correlation between development-oriented ODA and growth; ODA should translate into higher public investment, preferably in areas where there are shortages or which form bottlenecks for production, or in areas where existing levels of provision of public services -including social protection- are suboptimal (Ghosh 2007).
Conditionality: A huge controversy exists around the conditionality of ODA. Some donors, notably the IFIs, demand policy reforms in exchange for funds provided as budget support. The main criticism is the neoliberal nature of these Washington-based policy reforms, with which governments have to comply; other types of policy reforms for jobs with social protection could be put on the agenda. However, many critics argue that conditionalities should disappear altogether, as they are an intru-sion in a country’s self-determination, policy making and national social pacts.
High transaction costs of ODA: The multiplicity of donors creates problems for governments in developing countries. Each donor comes with different procedures and mechanisms to identify, plan, implement, monitor and evaluate its activities, and different reporting requirements. This represents a lot of paperwork that consumes time and resources from government officials. Each donor has its own policy priorities, often contradictory, such that governments in developing coun-tries find themselves in the middle of inconsistent policy reforms. Sometimes, donors negotiate their
-
0.002
0.004
0.006
0.008
0.010
0.012
0.014
0.016 D
enm
ark
Rom
ania
H
unga
ry
Lith
uani
a Sw
itzer
land
G
reec
e K
azak
hsta
n Fr
ance
A
zerb
aija
n Sl
ovak
Rep
ublic
Po
land
C
anad
a Sp
ain
Esto
nia
Bel
gium
K
orea
N
ew Z
eala
nd
Cze
ch R
epub
lic
Portu
gal
Uni
ted
Stat
es
Swed
en
Italy
Ja
pan
EU In
stitu
tions
A
ustri
a G
erm
any
Uni
ted
Ara
b Em
ir A
ustra
lia
Nor
way
N
ethe
rland
s Fi
nlan
d Ir
elan
d Lu
xem
bour
g U
nite
d K
ingd
om
% G
NI
% GNI Sample
CHAPTER 11 | FOREIGN AID 181
projects directly with ministries, bypassing central planning authorities and thus creating tension within national administrations. Frequently, donors use a joint-piecemeal approach, splitting areas of intervention among them (for instance, a donor contributes to the health sector and another to the education sector, or donors distributing different geographical regions among them) regardless of the magnitude and reliability of their assistance, leaving governments with unbalanced support in the different areas. To remedy these numerous pitfalls resulting from donor multiplicity, an important initiative on Aid Effectiveness, Harmonization and Alignment was launched by OECD DAC. Addi-tionally, new aid instruments were created to pull funds together under the same roof: Sector Wide Approaches (SWAPs) and General Budget Support (GBS) that would allow countries a policy space for both new investment and recurrent costs, explained later in this chapter.
Tied aid: Most ODA remains tied. Tied aid means that development funds are given with the condi-tion that all goods and services have to be procured exclusively from the donor country, no matter the price. For instance, a lot of humanitarian aid to mitigate food emergencies acquires foodstuff from companies in developed countries, instead of buying it cheaper from neighbouring developing countries. Tied aid causes the loss of about 25 per cent of aid, given that cheaper and better quality goods and services could be bought in the international market. Beyond this, procuring goods and services locally develops the domestic economy. Tied aid brings up the question of who benefits from development aid, as tied aid is a de-facto subsidy to companies in the donor country. The solution to this is making aid untied,
Size, predictability and longevity of ODA: Donor agencies have their own disbursement processes, different from the developing countries’ budget cycles; sometimes their funds are unre-liable, disbursements are delayed, and programmes are discontinued. Aid flows tend to rise and fall with economic cycles in donor countries, as well as with shifts in donor policies. This volatility is exacerbated by the gap between commitments and disbursements. Given the magnitude of global inequality, donors should make medium- and long-term ODA commitments and fulfil their obliga-tions to contribute 0.7 per cent of their GNI as they have repeatedly endorsed at the United Nations since 1970.
Concentration of ODA: Concentration of ODA is a major problem, which has direct implications for fiscal space. Given limited development resources and increasing bilateralism, donors oftentimes pick their favourite allied developing countries and those in which they perceive to have strategic interests (the so-called “darlings” of ODA). When measuring average global aid flows between 2010 and 2015, the list of “darlings” includes Afghanistan, Vietnam, Ethiopia, Democratic Republic of Congo, Pakistan and Tanzania (Table 11.1). Overall, 20 countries receive more than 50 per cent of all international assistance. On the other end of the spectrum, many of the neediest countries are virtually left out of aid flows (the “orphans”). Table 11.1 also shows that 13 of the world’s poorest countries received a combined total of less than 7 per cent of all ODA; indeed, there is a strong case for the so-called “orphans” to lobby for increased North-South assistance.
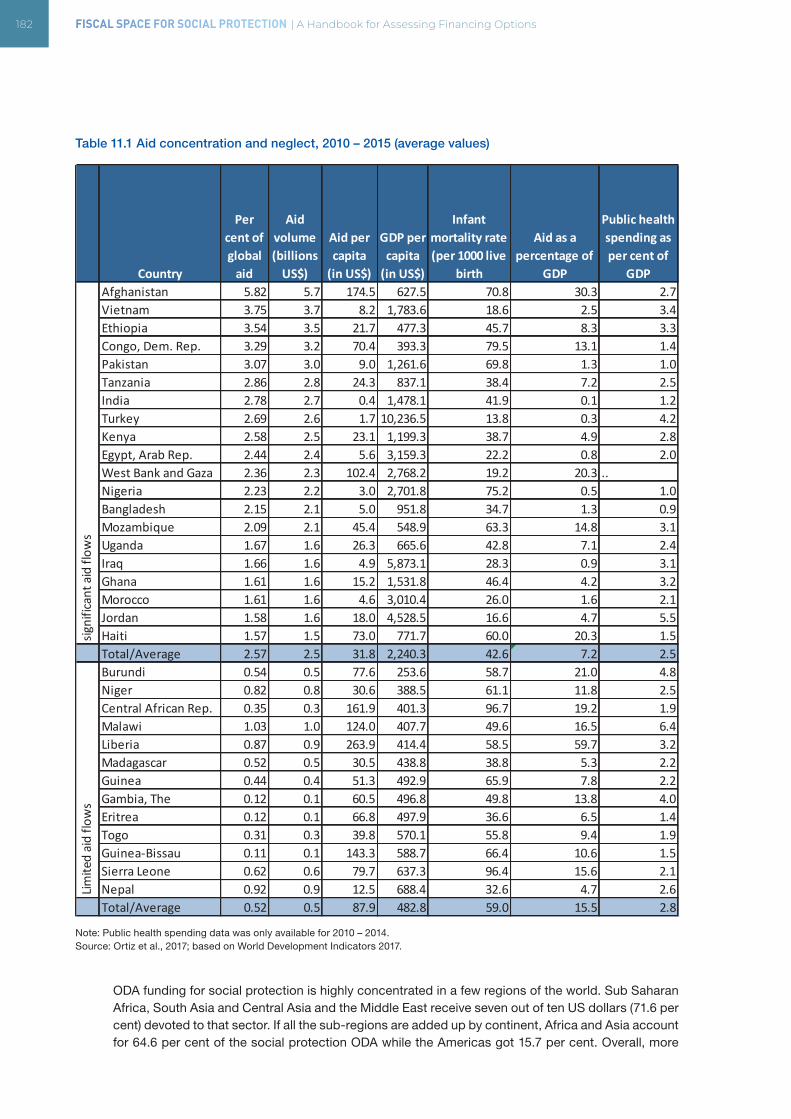
182 FISCAL SPACE FOR SOCIAL PROTECTION | A Handbook for Assessing Financing Options
Table 11.1 Aid concentration and neglect, 2010 – 2015 (average values)
Note: Public health spending data was only available for 2010 – 2014.Source: Ortiz et al., 2017; based on World Development Indicators 2017.
ODA funding for social protection is highly concentrated in a few regions of the world. Sub Saharan Africa, South Asia and Central Asia and the Middle East receive seven out of ten US dollars (71.6 per cent) devoted to that sector. If all the sub-regions are added up by continent, Africa and Asia account for 64.6 per cent of the social protection ODA while the Americas got 15.7 per cent. Overall, more
Afghanistan 5.82 5.7 174.5 627.5 70.8 30.3 2.7Vietnam 3.75 3.7 8.2 1,783.6 18.6 2.5 3.4Ethiopia 3.54 3.5 21.7 477.3 45.7 8.3 3.3Congo, Dem. Rep. 3.29 3.2 70.4 393.3 79.5 13.1 1.4Pakistan 3.07 3.0 9.0 1,261.6 69.8 1.3 1.0Tanzania 2.86 2.8 24.3 837.1 38.4 7.2 2.5India 2.78 2.7 0.4 1,478.1 41.9 0.1 1.2Turkey 2.69 2.6 1.7 10,236.5 13.8 0.3 4.2Kenya 2.58 2.5 23.1 1,199.3 38.7 4.9 2.8Egypt, Arab Rep. 2.44 2.4 5.6 3,159.3 22.2 0.8 2.0West Bank and Gaza 2.36 2.3 102.4 2,768.2 19.2 20.3 ..Nigeria 2.23 2.2 3.0 2,701.8 75.2 0.5 1.0Bangladesh 2.15 2.1 5.0 951.8 34.7 1.3 0.9Mozambique 2.09 2.1 45.4 548.9 63.3 14.8 3.1Uganda 1.67 1.6 26.3 665.6 42.8 7.1 2.4Iraq 1.66 1.6 4.9 5,873.1 28.3 0.9 3.1Ghana 1.61 1.6 15.2 1,531.8 46.4 4.2 3.2Morocco 1.61 1.6 4.6 3,010.4 26.0 1.6 2.1Jordan 1.58 1.6 18.0 4,528.5 16.6 4.7 5.5Haiti 1.57 1.5 73.0 771.7 60.0 20.3 1.5Total/Average 2.57 2.5 31.8 2,240.3 42.6 7.2 2.5Burundi 0.54 0.5 77.6 253.6 58.7 21.0 4.8Niger 0.82 0.8 30.6 388.5 61.1 11.8 2.5Central African Rep. 0.35 0.3 161.9 401.3 96.7 19.2 1.9Malawi 1.03 1.0 124.0 407.7 49.6 16.5 6.4Liberia 0.87 0.9 263.9 414.4 58.5 59.7 3.2Madagascar 0.52 0.5 30.5 438.8 38.8 5.3 2.2Guinea 0.44 0.4 51.3 492.9 65.9 7.8 2.2Gambia, The 0.12 0.1 60.5 496.8 49.8 13.8 4.0Eritrea 0.12 0.1 66.8 497.9 36.6 6.5 1.4Togo 0.31 0.3 39.8 570.1 55.8 9.4 1.9Guinea-Bissau 0.11 0.1 143.3 588.7 66.4 10.6 1.5Sierra Leone 0.62 0.6 79.7 637.3 96.4 15.6 2.1Nepal 0.92 0.9 12.5 688.4 32.6 4.7 2.6Total/Average 0.52 0.5 87.9 482.8 59.0 15.5 2.8
Limite
d ai
d flo
ws
Country
Per cent of global
aid
Infant mortality rate (per 1000 live
birth
Aid as a percentage of
GDP
Public health spending as per cent of
GDP
signi
fican
t aid
flow
s
Aid volume (billions
US$)
Aid per capita
(in US$)
GDP per capita
(in US$)

CHAPTER 11 | FOREIGN AID 183
than 80 per cent of the disbursed ODA flows was addressed to LDCs and Lower Middle-Income Countries (LMICs).
By country, the three most important recipients of social protection ODA (in terms of their partici-pation in GDP) were Rwanda, the West Bank and Gaza Strip and Malawi between 0.64 per cent of GDP and 2.3 per cent of GDP. Indeed, Rwanda and West Bank were the only two countries where the disbursed social protection exceeded 1 per cent of GDP (Figure 11.6).
Figure 11.6 | ODA for social protection as a per cent of GDP, 15 highest beneficiary countries
Source: OECD DAC database.
Furthermore, donor resources tend to move in and out together, causing herd-like behaviour (Frot and Santiso, 2011). IMF country reports and the World Bank’s Country Policy and Institutional Assess-ments (CPIA)37 function like rating signals for donors—similar to international credit rating agencies for private investors. Sometimes there are good reasons for donor withdrawal, such as when the policy-making process is captured by an interest group that benefits disproportionately from public policies rather than ensuring development for the majority of the population. On other hand, however, the IFIs base their ratings on compliance with orthodox policies, which do not always allow for policy flexibility to implement National Development Strategies. Many also argue that the CPIA criteria are based on contractionary policies, that combined with trade liberalization are obstacles to inclusive growth (World Bank, 2010). In addition, only about half of traditional donor aid actually reaches developing countries. Data from the OECD show that just 54 per cent of ODA is Country Programmable Aid (CPA).38 Given that some donors deliver more CPA than others, it may be strategic for governments to target those donors with better records in providing higher amounts of CPA.
37 The CPIAs are the base of the World Bank’s International Development Association (IDA) Resource Allocation Index for IDA eligible countries (concessional loans). Countries are ranked against a set of 16 criteria grouped in four clusters: economic management, structural policies, policies for social inclusion and equity, and public sector management and institutions.
38 The rest is spent on humanitarian aid (11 per cent), in-donor costs (10 per cent), debt relief (10 per cent), and NGOs and local government (3 per cent), with another 12 per cent simply unallocated. See Benn et al. (2010)
0
0.5
1.0
1.5
2.0
2.5
Zim
babw
e
0.15
Tajik
istan
0.15
Moz
ambi
que
0.16
Sier
ra L
eone
0.16
Djib
outi
0.20
Gren
ada
0.22
Guat
emala
0.24
Buru
ndi
0.24
Hondu
ras
0.28
Tanz
ania
0.30
Ethi
opia
0.43
Cent
ral A
frica
n0.55
Malaw
i
0.64Wes
t Ban
k an
d Ga
za
2.04
Rwan
da
2.29
% OF GDP
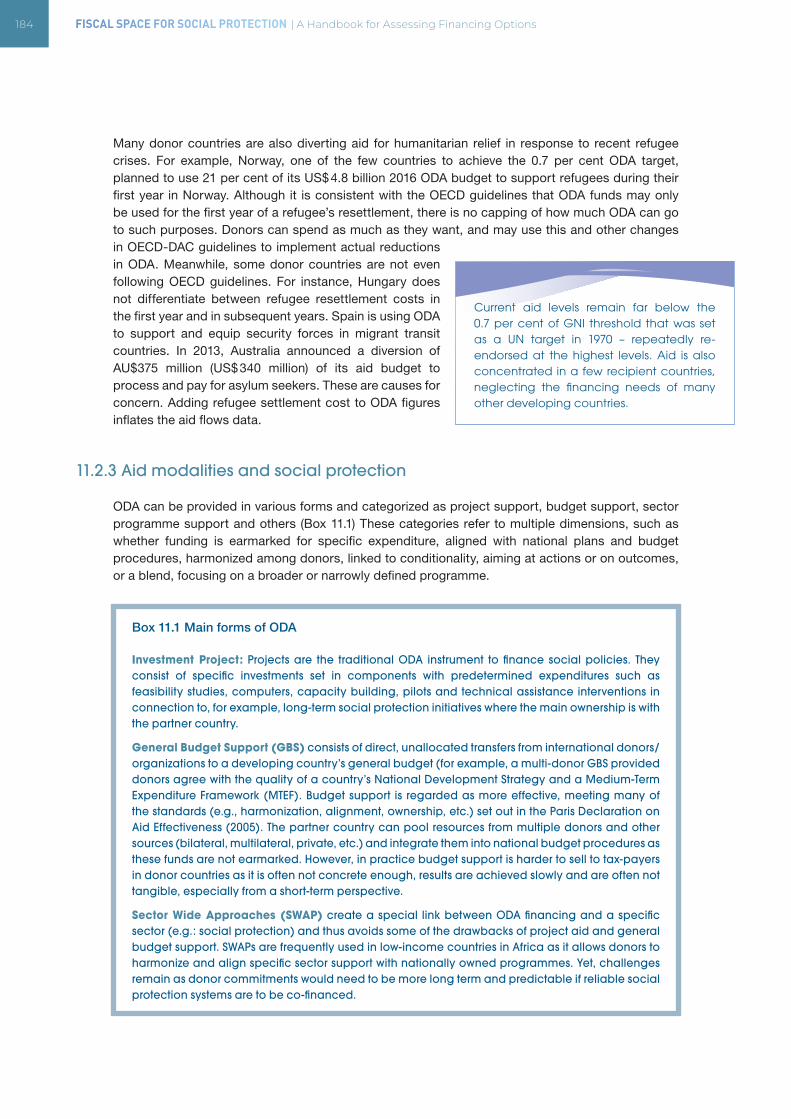
184 FISCAL SPACE FOR SOCIAL PROTECTION | A Handbook for Assessing Financing Options
Many donor countries are also diverting aid for humanitarian relief in response to recent refugee crises. For example, Norway, one of the few countries to achieve the 0.7 per cent ODA target, planned to use 21 per cent of its US$ 4.8 billion 2016 ODA budget to support refugees during their first year in Norway. Although it is consistent with the OECD guidelines that ODA funds may only be used for the first year of a refugee’s resettlement, there is no capping of how much ODA can go to such purposes. Donors can spend as much as they want, and may use this and other changes in OECD-DAC guidelines to implement actual reductions in ODA. Meanwhile, some donor countries are not even following OECD guidelines. For instance, Hungary does not differentiate between refugee resettlement costs in the first year and in subsequent years. Spain is using ODA to support and equip security forces in migrant transit countries. In 2013, Australia announced a diversion of AU$375 million (US$ 340 million) of its aid budget to process and pay for asylum seekers. These are causes for concern. Adding refugee settlement cost to ODA figures inflates the aid flows data.
11.2.3 Aid modalities and social protection
ODA can be provided in various forms and categorized as project support, budget support, sector programme support and others (Box 11.1) These categories refer to multiple dimensions, such as whether funding is earmarked for specific expenditure, aligned with national plans and budget procedures, harmonized among donors, linked to conditionality, aiming at actions or on outcomes, or a blend, focusing on a broader or narrowly defined programme.
Box 11.1 Main forms of ODA
Investment Project: Projects are the traditional ODA instrument to finance social policies. They consist of specific investments set in components with predetermined expenditures such as feasibility studies, computers, capacity building, pilots and technical assistance interventions in connection to, for example, long-term social protection initiatives where the main ownership is with the partner country.
General Budget Support (GBS) consists of direct, unallocated transfers from international donors/organizations to a developing country’s general budget (for example, a multi-donor GBS provided donors agree with the quality of a country’s National Development Strategy and a Medium-Term Expenditure Framework (MTEF). Budget support is regarded as more effective, meeting many of the standards (e.g., harmonization, alignment, ownership, etc.) set out in the Paris Declaration on Aid Effectiveness (2005). The partner country can pool resources from multiple donors and other sources (bilateral, multilateral, private, etc.) and integrate them into national budget procedures as these funds are not earmarked. However, in practice budget support is harder to sell to tax-payers in donor countries as it is often not concrete enough, results are achieved slowly and are often not tangible, especially from a short-term perspective.
Sector Wide Approaches (SWAP) create a special link between ODA financing and a specific sector (e.g.: social protection) and thus avoids some of the drawbacks of project aid and general budget support. SWAPs are frequently used in low-income countries in Africa as it allows donors to harmonize and align specific sector support with nationally owned programmes. Yet, challenges remain as donor commitments would need to be more long term and predictable if reliable social protection systems are to be co-financed.
Current aid levels remain far below the 0.7 per cent of GNI threshold that was set as a UN target in 1970 – repeatedly re- endorsed at the highest levels. Aid is also concentrated in a few recipient countries, neglecting the financing needs of many other developing countries.
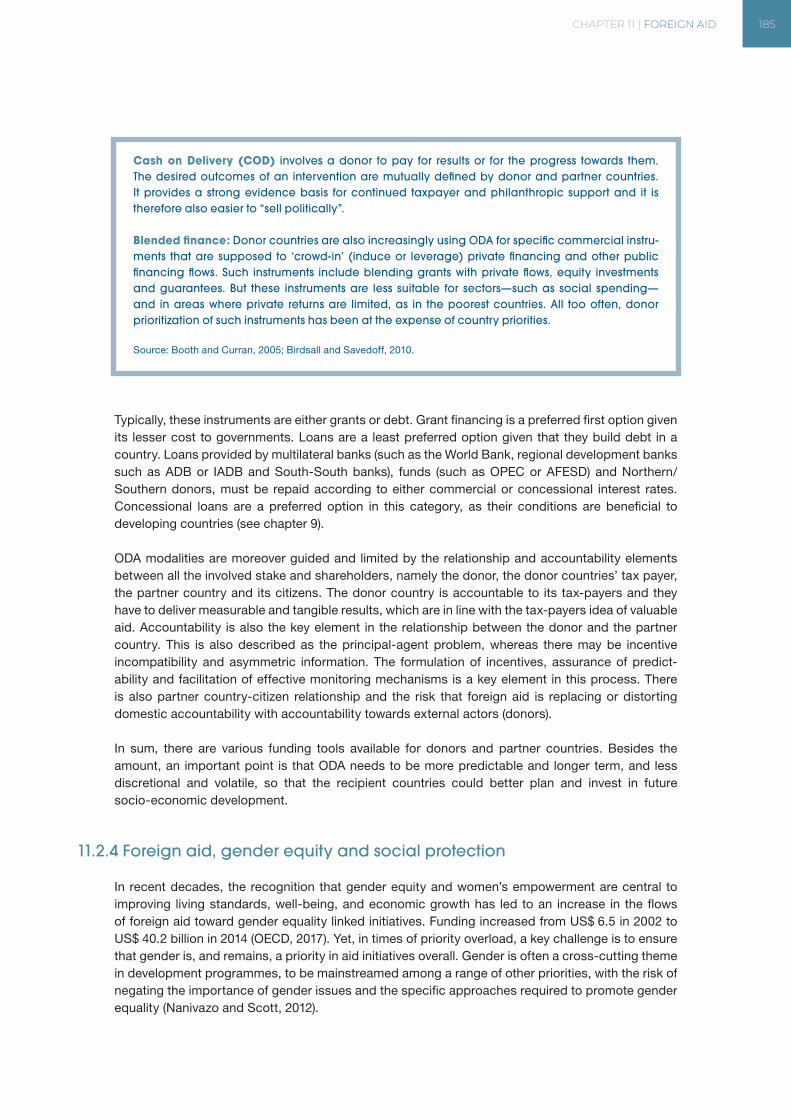
CHAPTER 11 | FOREIGN AID 185
Cash on Delivery (COD) involves a donor to pay for results or for the progress towards them. The desired outcomes of an intervention are mutually defined by donor and partner countries. It provides a strong evidence basis for continued taxpayer and philanthropic support and it is therefore also easier to “sell politically”.
Blended finance: Donor countries are also increasingly using ODA for specific commercial instru-ments that are supposed to ‘crowd-in’ (induce or leverage) private financing and other public financing flows. Such instruments include blending grants with private flows, equity investments and guarantees. But these instruments are less suitable for sectors—such as social spending— and in areas where private returns are limited, as in the poorest countries. All too often, donor prioritization of such instruments has been at the expense of country priorities.
Source: Booth and Curran, 2005; Birdsall and Savedoff, 2010.
Typically, these instruments are either grants or debt. Grant financing is a preferred first option given its lesser cost to governments. Loans are a least preferred option given that they build debt in a country. Loans provided by multilateral banks (such as the World Bank, regional development banks such as ADB or IADB and South-South banks), funds (such as OPEC or AFESD) and Northern/Southern donors, must be repaid according to either commercial or concessional interest rates. Concessional loans are a preferred option in this category, as their conditions are beneficial to developing countries (see chapter 9).
ODA modalities are moreover guided and limited by the relationship and accountability elements between all the involved stake and shareholders, namely the donor, the donor countries’ tax payer, the partner country and its citizens. The donor country is accountable to its tax-payers and they have to deliver measurable and tangible results, which are in line with the tax-payers idea of valuable aid. Accountability is also the key element in the relationship between the donor and the partner country. This is also described as the principal-agent problem, whereas there may be incentive incompatibility and asymmetric information. The formulation of incentives, assurance of predict-ability and facilitation of effective monitoring mechanisms is a key element in this process. There is also partner country-citizen relationship and the risk that foreign aid is replacing or distorting domestic accountability with accountability towards external actors (donors).
In sum, there are various funding tools available for donors and partner countries. Besides the amount, an important point is that ODA needs to be more predictable and longer term, and less discretional and volatile, so that the recipient countries could better plan and invest in future socio-economic development.
11.2.4 Foreign aid, gender equity and social protection
In recent decades, the recognition that gender equity and women’s empowerment are central to improving living standards, well-being, and economic growth has led to an increase in the flows of foreign aid toward gender equality linked initiatives. Funding increased from US$ 6.5 in 2002 to US$ 40.2 billion in 2014 (OECD, 2017). Yet, in times of priority overload, a key challenge is to ensure that gender is, and remains, a priority in aid initiatives overall. Gender is often a cross-cutting theme in development programmes, to be mainstreamed among a range of other priorities, with the risk of negating the importance of gender issues and the specific approaches required to promote gender equality (Nanivazo and Scott, 2012).
186 FISCAL SPACE FOR SOCIAL PROTECTION | A Handbook for Assessing Financing Options
Donors often report against a gender marker. However, although the gender marker is aiming at monitoring aid for gender equality, it is essential to keep in mind that gender marker are relatively subjective, and does not always allow to quantify how much donor activity has contributed to achieving gender equality objectives. An area which requires serious attention in this regard is gender budgeting. Gender budgeting is a process of keeping a gender perspective in policy/programme formulation, its implementation and review. It helps mainstreaming gender in the budgetary process. Gender budgeting is therefore also an important vehicle to facilitate the incorporation of gender perspectives into foreign aid initiatives, especially where foreign aid is provided as general budget support or is allocated to a specific area such as social protection without specifying gender goals. More details on gender budgeting are presented in chapter 3.
On average, women are more likely to be disadvantaged in terms of work opportunities and are more likely to be excluded from formal social protection programmes. Foreign aid is an important contribution to funding women’s economic empowerment in developing countries and can positively contribute to increasing gender equity by supporting gender sensitive social protection policies. Gender sensitive social protection incorporates issues such as providing contributory credit for periods spent with unpaid care work (e.g. care work for family members, children and the elderly, and household work), often carried out by women, or to incorporate measures such as the introduction of universal schemes that provide benefits to informal workers, where women are disproportionately represented at.
Social dialogue being a key aspect in social protection policy making, one has to highlight the impor-tance of women’s representation in any social protection policy formulation and implementation. As the main purpose of social dialogue is to promote consensus building and democratic involvement among the main stakeholders; create ownership among the parties over economic and social issues and reduce social conflict; women’s involvement is key in facilitating sustainable social protection policy making. In general, foreign aid should aim to promote gender sensitive social protection initia-tives are and if they conform with the basic principles of solidarity, collective funding and risk-pooling.
The Sustainable Development Goals further heightened attention given to gender equality and female empowerment since its inception. The role of gender equality in development, growth and poverty reduction has been well documented as well as the role of women’s political empower-ment in promoting gender equality and societal well‐being (Baliamoune-Lutz, 2016). It is therefore desirable to pay attention to the incorporation of gender perspectives into foreign aid funded social protection initiatives and to ensure inclusive development for women and men.
11.3 SOUTH-SOUTH COOPERATION
South-South cooperation dates back to the Asia-Africa Conference of 1955 held in Bandung, Indo-nesia, where countries which gained independence pledged to support the aspirations of others. Now that some of the Southern countries have become economically more advanced, South-South transfers are becoming increasingly important, especially since the mid-2000s. They take place through three main channels of cooperation: (i) bilateral aid; (ii) regional integration; and (iii) regional development banks. Thus, for governments, South-South transfers are a clear avenue to tap into regional and cross-regional resources for social and economic development.
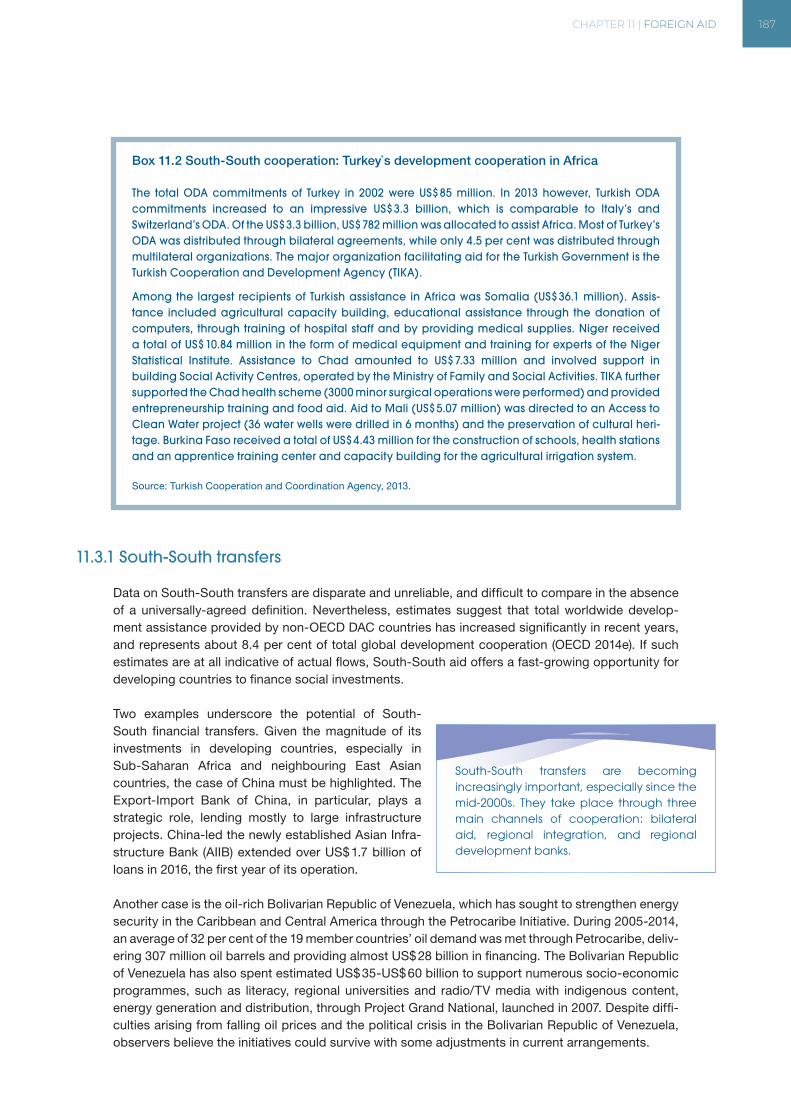
CHAPTER 11 | FOREIGN AID 187
Box 11.2 South-South cooperation: Turkey`s development cooperation in Africa
The total ODA commitments of Turkey in 2002 were US$ 85 million. In 2013 however, Turkish ODA commitments increased to an impressive US$ 3.3 billion, which is comparable to Italy’s and Switzerland’s ODA. Of the US$ 3.3 billion, US$ 782 million was allocated to assist Africa. Most of Turkey’s ODA was distributed through bilateral agreements, while only 4.5 per cent was distributed through multilateral organizations. The major organization facilitating aid for the Turkish Government is the Turkish Cooperation and Development Agency (TIKA).
Among the largest recipients of Turkish assistance in Africa was Somalia (US$ 36.1 million). Assis-tance included agricultural capacity building, educational assistance through the donation of computers, through training of hospital staff and by providing medical supplies. Niger received a total of US$ 10.84 million in the form of medical equipment and training for experts of the Niger Statistical Institute. Assistance to Chad amounted to US$ 7.33 million and involved support in building Social Activity Centres, operated by the Ministry of Family and Social Activities. TIKA further supported the Chad health scheme (3000 minor surgical operations were performed) and provided entrepreneurship training and food aid. Aid to Mali (US$ 5.07 million) was directed to an Access to Clean Water project (36 water wells were drilled in 6 months) and the preservation of cultural heri-tage. Burkina Faso received a total of US$ 4.43 million for the construction of schools, health stations and an apprentice training center and capacity building for the agricultural irrigation system.
Source: Turkish Cooperation and Coordination Agency, 2013.
11.3.1 South-South transfers
Data on South-South transfers are disparate and unreliable, and difficult to compare in the absence of a universally-agreed definition. Nevertheless, estimates suggest that total worldwide develop-ment assistance provided by non-OECD DAC countries has increased significantly in recent years, and represents about 8.4 per cent of total global development cooperation (OECD 2014e). If such estimates are at all indicative of actual flows, South-South aid offers a fast-growing opportunity for developing countries to finance social investments. Two examples underscore the potential of South-South financial transfers. Given the magnitude of its investments in developing countries, especially in Sub-Saharan Africa and neighbouring East Asian countries, the case of China must be highlighted. The Export-Import Bank of China, in particular, plays a strategic role, lending mostly to large infrastructure projects. China-led the newly established Asian Infra-structure Bank (AIIB) extended over US$ 1.7 billion of loans in 2016, the first year of its operation.
Another case is the oil-rich Bolivarian Republic of Venezuela, which has sought to strengthen energy security in the Caribbean and Central America through the Petrocaribe Initiative. During 2005-2014, an average of 32 per cent of the 19 member countries’ oil demand was met through Petrocaribe, deliv-ering 307 million oil barrels and providing almost US$ 28 billion in financing. The Bolivarian Republic of Venezuela has also spent estimated US$ 35-US$ 60 billion to support numerous socio-economic programmes, such as literacy, regional universities and radio/TV media with indigenous content, energy generation and distribution, through Project Grand National, launched in 2007. Despite diffi-culties arising from falling oil prices and the political crisis in the Bolivarian Republic of Venezuela, observers believe the initiatives could survive with some adjustments in current arrangements.
South-South transfers are becoming increasingly important, especially since the mid-2000s. They take place through three main channels of cooperation: bilateral aid, regional integration, and regional development banks.
188 FISCAL SPACE FOR SOCIAL PROTECTION | A Handbook for Assessing Financing Options
Major South-South transfers – bilateral aid (non-OECD donors) – are led by Brazil, China, India, Kuwait, Saudi Arabia, South Africa, United Arab Emirates and the Bolivarian Republic of Venezuela (in alphabetical order).
Box 11.3 South-South bilateral cooperation in Guinea-Bissau
China, Angola and Brazil provided significant financial support to Guinea-Bissau in recent years. China has funded several large projects in Guinea-Bissau, including a 20,000-seat stadium, the National Assembly building (US$ 6 million), a new government office (US$ 12 million) that will house 12 ministries and a hospital (US$ 8 million). China has also provided technical assistance to improve rice production. Angola provided a US$ 12 million (about 1.3 per cent of GDP) grant in February 2011, which the authorities intend to use to finance roads and agriculture projects and to pay previous years’ arrears to the private sector. In October 2010, Angola announced that it would open a US$ 25 million line of credit to support entrepreneurs from both countries who want to invest in Guinea- Bissau. In 2008, Angola provided US$ 10 million in budget support. Brazil has cooperated with Guinea-Bissau across several sectors. It has provided technical assistance to increase agricultural production; established training centres for the military, the police, teachers, and ex-combatants; and helped build capacity to combat HIV/AIDS. UNDP estimates that Brazil’s bilateral assistance to Guinea-Bissau totalled US$ 6.2 million during 2006-09.
Source: IMF, 2011b, p. 7.
11.3.2 South-South regional integration
Regional integration is a major form of South-South cooperation. Regional trading strategies can be an effective means of protecting, promoting and reshaping a region’s division of labour, trade, production and consumption. Regional integration can also help to redress social asymmetries and raise living standards through regional transfers focused on social-economic investments. Exam-ples of Southern regional cooperation include, by alphabetical order: the Bolivarian Alliance of the Peoples of the Americas (ALBA), the Association of South East Asian Nations (ASEAN), the African Union (AU), the Andean Community (CAN), the Caribbean Community (CARICOM), the League of Arab States (LAS), the South Asian Association for Regional Cooperation (SAARC) or the Southern Africa Development Community (SADC), to name a few. In terms of fiscal space, regional formations can offer a means of “locking in” finance for the development of member countries, which can be achieved through regional transfers or through regional development banks.
Box 11.4 ALBA South-South regional transfers in El Salvador
ALBA was created in 2006 to address the ‘’social debt’’ of Latin America, that is, address the needs of those who have lost out in the process of globalization, and as an alternative to the Free Trade Agreement of the Americas. Through regional transfers and policy support, ALBA promotes a new set of public policies to redress social asymmetries and raise living standards, based on social spending, public investment and policies geared towards employment and the expansion of national markets. An example of how ALBA regional transfers work can be found in El Salvador. In 2014, El Salvador became a member of ALBA. In a few months, the country was receiving US$ 90 million to support rural development (subsidizing seeds and fertilizer, providing soft credit and tech-nical assistance to farmers, building rural infrastructure); US$ 14 million for a low-cost national airline, VECA, connecting San Salvador with other Central American capitals (in 2013, the only low-cost flight was to Florida); US$ 2.7 million for education (3,700 grants for secondary and university educa-tion, rebuilding public schools, supporting sports to avoid mara delinquency); in late 2014, ALBA Petróleos El Salvador also started supporting subsidies to domestic cooking gas consumption.
Source: Ortiz et al., 2017; ALBA Petróleos El Salvador and media coverage.
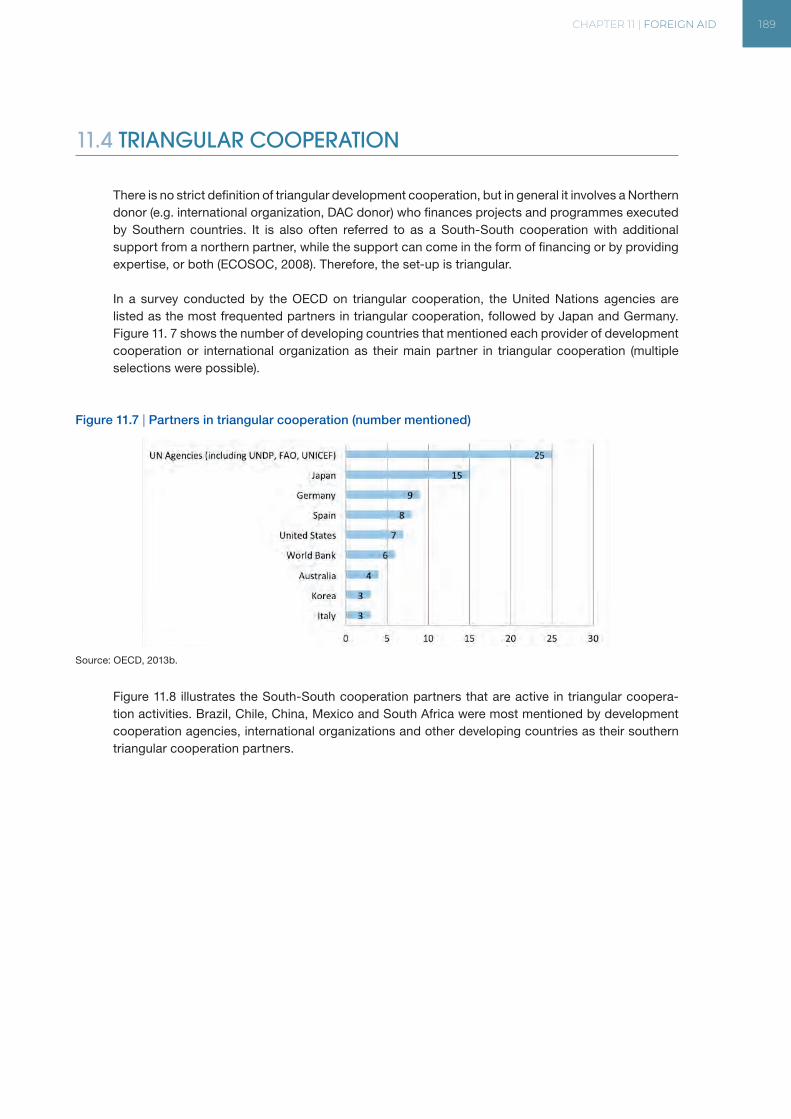
CHAPTER 11 | FOREIGN AID 189
11.4 TRIANGULAR COOPERATION
There is no strict definition of triangular development cooperation, but in general it involves a Northern donor (e.g. international organization, DAC donor) who finances projects and programmes executed by Southern countries. It is also often referred to as a South-South cooperation with additional support from a northern partner, while the support can come in the form of financing or by providing expertise, or both (ECOSOC, 2008). Therefore, the set-up is triangular.
In a survey conducted by the OECD on triangular cooperation, the United Nations agencies are listed as the most frequented partners in triangular cooperation, followed by Japan and Germany. Figure 11. 7 shows the number of developing countries that mentioned each provider of development cooperation or international organization as their main partner in triangular cooperation (multiple selections were possible).
Figure 11.7 | Partners in triangular cooperation (number mentioned)
Source: OECD, 2013b.
Figure 11.8 illustrates the South-South cooperation partners that are active in triangular coopera-tion activities. Brazil, Chile, China, Mexico and South Africa were most mentioned by development cooperation agencies, international organizations and other developing countries as their southern triangular cooperation partners.
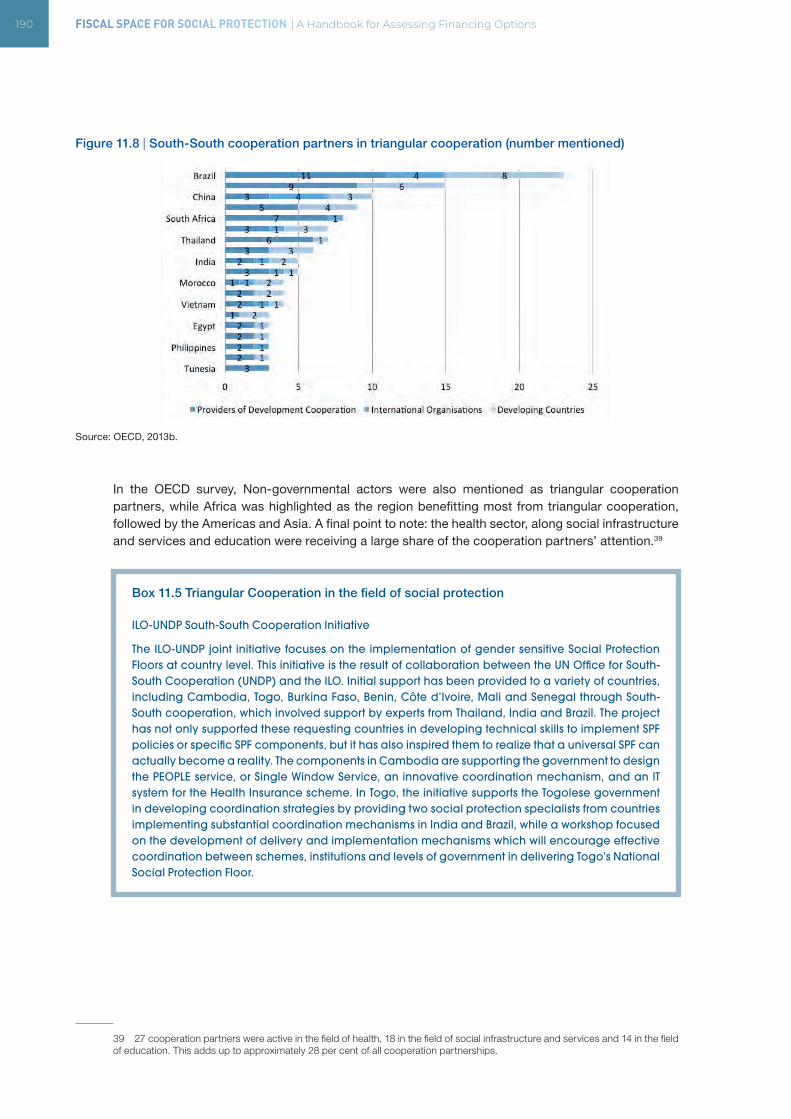
190 FISCAL SPACE FOR SOCIAL PROTECTION | A Handbook for Assessing Financing Options
Figure 11.8 | South-South cooperation partners in triangular cooperation (number mentioned)
Source: OECD, 2013b.
In the OECD survey, Non-governmental actors were also mentioned as triangular cooperation partners, while Africa was highlighted as the region benefitting most from triangular cooperation, followed by the Americas and Asia. A final point to note: the health sector, along social infrastructure and services and education were receiving a large share of the cooperation partners’ attention.39
Box 11.5 Triangular Cooperation in the field of social protection
ILO-UNDP South-South Cooperation Initiative
The ILO-UNDP joint initiative focuses on the implementation of gender sensitive Social Protection Floors at country level. This initiative is the result of collaboration between the UN Office for South-South Cooperation (UNDP) and the ILO. Initial support has been provided to a variety of countries, including Cambodia, Togo, Burkina Faso, Benin, Côte d’Ivoire, Mali and Senegal through South-South cooperation, which involved support by experts from Thailand, India and Brazil. The project has not only supported these requesting countries in developing technical skills to implement SPF policies or specific SPF components, but it has also inspired them to realize that a universal SPF can actually become a reality. The components in Cambodia are supporting the government to design the PEOPLE service, or Single Window Service, an innovative coordination mechanism, and an IT system for the Health Insurance scheme. In Togo, the initiative supports the Togolese government in developing coordination strategies by providing two social protection specialists from countries implementing substantial coordination mechanisms in India and Brazil, while a workshop focused on the development of delivery and implementation mechanisms which will encourage effective coordination between schemes, institutions and levels of government in delivering Togo’s National Social Protection Floor.
39 27 cooperation partners were active in the field of health, 18 in the field of social infrastructure and services and 14 in the field of education. This adds up to approximately 28 per cent of all cooperation partnerships.
CHAPTER 11 | FOREIGN AID 191
ILO – Brazil South-South cooperation projects on social security
The ILO-Brazil partnership has been launched in 2009. Based on experiences and best practices in Latin America, especially in Brazil, the ILO provides technical support to various countries on the field of social security (pensions, unemployment, health insurance, disability and child allow-ances, etc.). This includes specific country initiatives in Timor Leste and Paraguay, focusing on the development of national policies to introduce a national pension scheme and on the ratification of Convention 102, including the development of national policies concerning social security schemes for the unemployed, respectively.
Source: ILO Social Protection Platform.
11.5 CONCLUDING REMARKS
The levels of ODA are far from the UN commitment of 0.7 of GNI of donor countries. Further, in recent years, the trend towards austerity or fiscal consolidation has affected ODA. But ODA can and indeed does contribute to build social protection systems in developing countries. ODA can be very useful, especially for LDCs, in setting up social protection systems/schemes.
There are opportunities for developing countries to enhance fiscal space through strategies to scale-up North-South and South-South financial transfers, including transfers in the framework of a triangular set-up. Similarly, there is an array of innovative sources of development financing avail-able to donor countries, which means that there are no longer any excuses for falling short on aid commitments.
For low-income countries and LDCs, it is essential to actively seek partnerships to attract foreign donor support, as not every country is equally present in the minds of donors. Some of the poorest countries in the world receive limited aid flows. While there are various forms of donor support, the trend is towards budget support accompanied of technical assistance; this trend also reflects the guidelines set out by the DAC Development Committee and UN resolutions.
11.6 KEY RESOURCES AND DATA SOURCES
OECD Development Assistance Directorate Platform https://www.oecd.org/dac/
The OECD platform offers comprehensive analysis, guidelines and data on ODA. Supporting the OECD Development Assistance Committee (DAC), this platform also presents the international principles and standards for development co-operation, and monitors how donors deliver on their commitments.
ECOSOC. 2016. ODA allocation and other trends in development cooperation in LDCs and vulnerable contexts, 2016 Development Cooperation Forum Policy Briefs, No. 13 (New York).
This brief gives an overview of recent trends to inform a discussion on specialized ODA for specific contexts in least developed countries (LDCs); countries in conflict and post-conflict situations and
192 FISCAL SPACE FOR SOCIAL PROTECTION | A Handbook for Assessing Financing Options
other ‘fragile states’, including those which are environmentally vulnerable; and small island devel-oping states (SIDS).
EURODAD European Network on Debt and Developmenthttps://eurodad.org/aid
EURODAD platform contains many critical materials on current aid levels, aid quality and global processes
Data sources
OECD, Development Assistance Committee (DAC) data https://www.oecd.org/dac/financing-sustainable-development/development-finance-data/
Latest data in a range of easy to view formats from high level overviews to country and sector specific data. Also a wide range of data can be downloaded and linked through to OECD databases and aid statistics websites of DAC members.
Learning accomplishments
After reading this chapter readers should have a good grasp of the:
• Significance of foreign aid for social protection
• Trends, patterns and modalities of North-South foreign aid
• Trends and forms of South-South cooperation
• Trends and major partners in triangular cooperation
CHAPTER 12 | SOCIAL DIALOGUE FOR FISCAL SPACE OPTIONS 193
CHAPTER 12. SOCIAL DIALOGUE FOR FISCAL SPACE OPTIONS
LEARNING OBJECTIVES
• Understand social dialogue and tripartism
• Understand the social protection Assessment-Based National Dialogue methodology and its steps:
- Establishment of a national working group on social protection
- Qualitative assessment: Inventory of the existing social protection schemes and identification of social protection gaps
- Financial assessment: Costing different social protection scenarios to close the gaps, the sources of funding and fiscal space options
- Finalization and endorsement
• Appreciate conditions for success of social dialogue
• Importance of social dialogue in promoting gender equality and inclusion
CONTENTS
• Features and typology of social dialogue
• Social Protection Assessment-based National Dialogue
• Social dialogue for fiscal space – key questions
• Key resources
This handbook has demonstrated that there is national capacity to finance socio-economic devel-opment worldwide, even in the poorest countries. There are eight options, presented in this volume: (i) expanding social security coverage and contributory revenues; (ii) increasing tax revenues; (iii) eliminating illicit financing flows; (iv) re-prioritizing public expenditures; (v) using fiscal and foreign exchange reserves. (vi) borrowing or restructuring debt; (vii) adopting a more accommodating macroeconomic framework and; (viii) increasing aid and transfers.
As demonstrated in the earlier chapters, all of the financing options described in this handbook are supported by policy statements of the United Nations and international financial institutions. Govern-ments around the world have been applying them for decades, showing a wide variety of choices
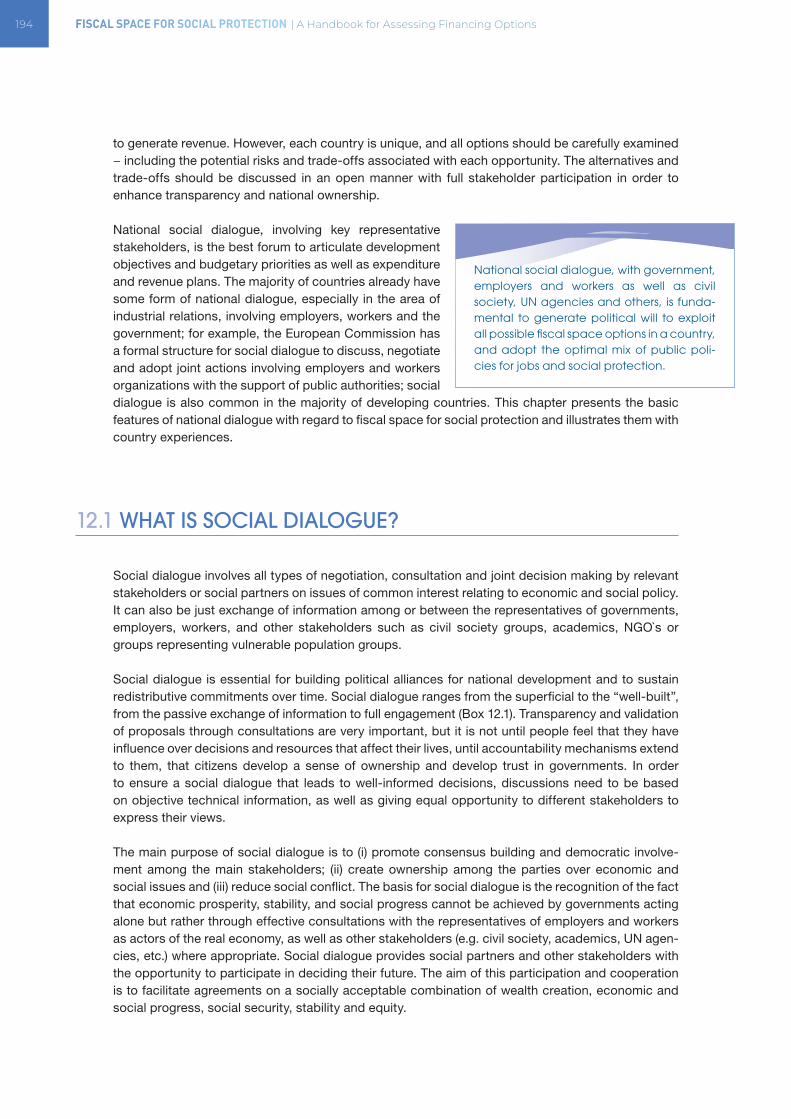
194 FISCAL SPACE FOR SOCIAL PROTECTION | A Handbook for Assessing Financing Options
to generate revenue. However, each country is unique, and all options should be carefully examined − including the potential risks and trade-offs associated with each opportunity. The alternatives and trade-offs should be discussed in an open manner with full stakeholder participation in order to enhance transparency and national ownership. National social dialogue, involving key representative stakeholders, is the best forum to articulate development objectives and budgetary priorities as well as expenditure and revenue plans. The majority of countries already have some form of national dialogue, especially in the area of industrial relations, involving employers, workers and the government; for example, the European Commission has a formal structure for social dialogue to discuss, negotiate and adopt joint actions involving employers and workers organizations with the support of public authorities; social dialogue is also common in the majority of developing countries. This chapter presents the basic features of national dialogue with regard to fiscal space for social protection and illustrates them with country experiences.
12.1 WHAT IS SOCIAL DIALOGUE?
Social dialogue involves all types of negotiation, consultation and joint decision making by relevant stakeholders or social partners on issues of common interest relating to economic and social policy. It can also be just exchange of information among or between the representatives of governments, employers, workers, and other stakeholders such as civil society groups, academics, NGO`s or groups representing vulnerable population groups.
Social dialogue is essential for building political alliances for national development and to sustain redistributive commitments over time. Social dialogue ranges from the superficial to the “well-built”, from the passive exchange of information to full engagement (Box 12.1). Transparency and validation of proposals through consultations are very important, but it is not until people feel that they have influence over decisions and resources that affect their lives, until accountability mechanisms extend to them, that citizens develop a sense of ownership and develop trust in governments. In order to ensure a social dialogue that leads to well-informed decisions, discussions need to be based on objective technical information, as well as giving equal opportunity to different stakeholders to express their views.
The main purpose of social dialogue is to (i) promote consensus building and democratic involve-ment among the main stakeholders; (ii) create ownership among the parties over economic and social issues and (iii) reduce social conflict. The basis for social dialogue is the recognition of the fact that economic prosperity, stability, and social progress cannot be achieved by governments acting alone but rather through effective consultations with the representatives of employers and workers as actors of the real economy, as well as other stakeholders (e.g. civil society, academics, UN agen-cies, etc.) where appropriate. Social dialogue provides social partners and other stakeholders with the opportunity to participate in deciding their future. The aim of this participation and cooperation is to facilitate agreements on a socially acceptable combination of wealth creation, economic and social progress, social security, stability and equity.
National social dialogue, with government, employers and workers as well as civil society, UN agencies and others, is funda-mental to generate political will to exploit all possible fiscal space options in a country, and adopt the optimal mix of public poli-cies for jobs and social protection.
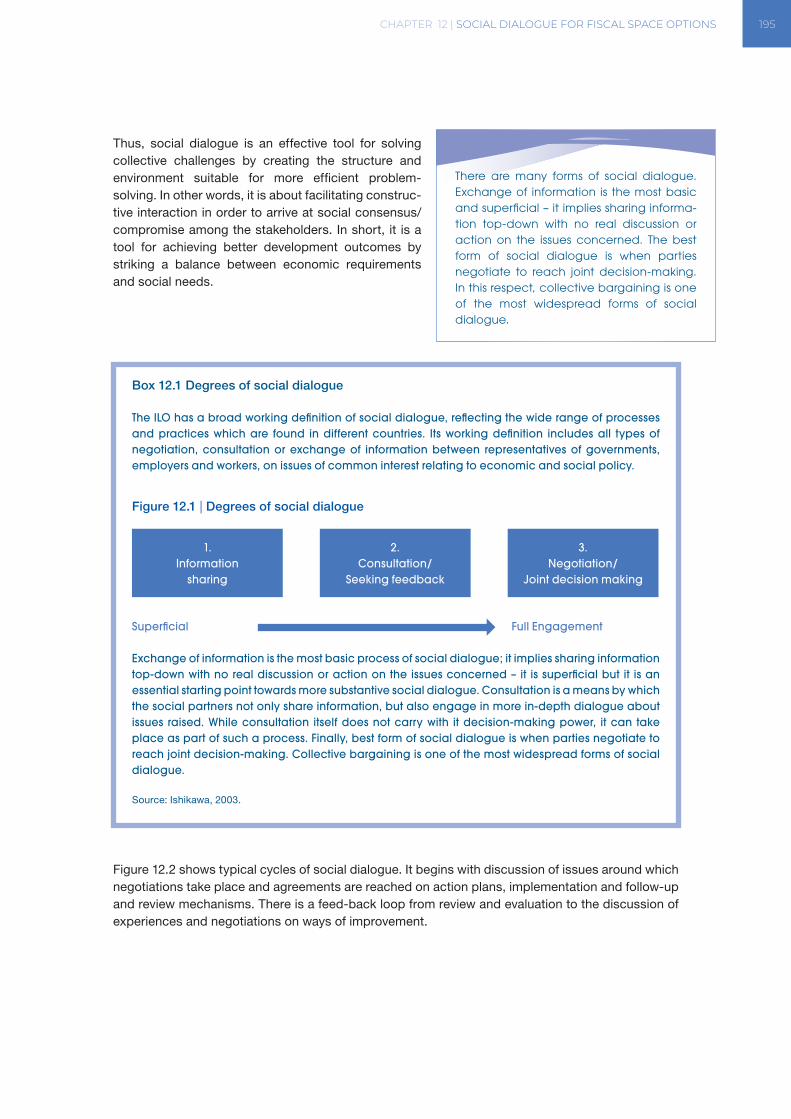
CHAPTER 12 | SOCIAL DIALOGUE FOR FISCAL SPACE OPTIONS 195
Thus, social dialogue is an effective tool for solving collective challenges by creating the structure and environment suitable for more efficient problem- solving. In other words, it is about facilitating construc-tive interaction in order to arrive at social consensus/compromise among the stakeholders. In short, it is a tool for achieving better development outcomes by striking a balance between economic requirements and social needs.
Box 12.1 Degrees of social dialogue
The ILO has a broad working definition of social dialogue, reflecting the wide range of processes and practices which are found in different countries. Its working definition includes all types of negotiation, consultation or exchange of information between representatives of governments, employers and workers, on issues of common interest relating to economic and social policy.
Figure 12.1 | Degrees of social dialogue
Superficial Full Engagement
Exchange of information is the most basic process of social dialogue; it implies sharing information top-down with no real discussion or action on the issues concerned – it is superficial but it is an essential starting point towards more substantive social dialogue. Consultation is a means by which the social partners not only share information, but also engage in more in-depth dialogue about issues raised. While consultation itself does not carry with it decision-making power, it can take place as part of such a process. Finally, best form of social dialogue is when parties negotiate to reach joint decision-making. Collective bargaining is one of the most widespread forms of social dialogue.
Source: Ishikawa, 2003.
Figure 12.2 shows typical cycles of social dialogue. It begins with discussion of issues around which negotiations take place and agreements are reached on action plans, implementation and follow-up and review mechanisms. There is a feed-back loop from review and evaluation to the discussion of experiences and negotiations on ways of improvement.
There are many forms of social dialogue. Exchange of information is the most basic and superficial – it implies sharing informa-tion top-down with no real discussion or action on the issues concerned. The best form of social dialogue is when parties negotiate to reach joint decision-making. In this respect, collective bargaining is one of the most widespread forms of social dialogue.
1.Information
sharing
2.Consultation/
Seeking feedback
3.Negotiation/
Joint decision making
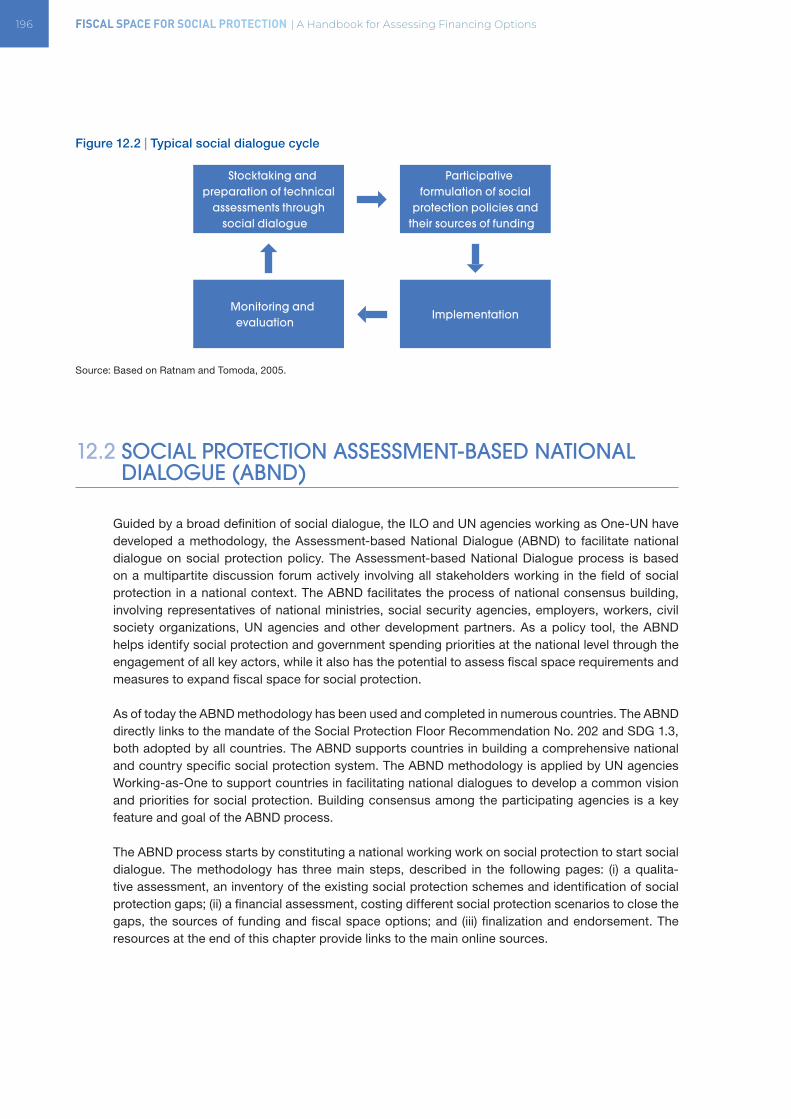
196 FISCAL SPACE FOR SOCIAL PROTECTION | A Handbook for Assessing Financing Options
Figure 12.2 | Typical social dialogue cycle
Source: Based on Ratnam and Tomoda, 2005.
12.2 SOCIAL PROTECTION ASSESSMENT-BASED NATIONAL DIALOGUE (ABND)
Guided by a broad definition of social dialogue, the ILO and UN agencies working as One-UN have developed a methodology, the Assessment-based National Dialogue (ABND) to facilitate national dialogue on social protection policy. The Assessment-based National Dialogue process is based on a multipartite discussion forum actively involving all stakeholders working in the field of social protection in a national context. The ABND facilitates the process of national consensus building, involving representatives of national ministries, social security agencies, employers, workers, civil society organizations, UN agencies and other development partners. As a policy tool, the ABND helps identify social protection and government spending priorities at the national level through the engagement of all key actors, while it also has the potential to assess fiscal space requirements and measures to expand fiscal space for social protection.
As of today the ABND methodology has been used and completed in numerous countries. The ABND directly links to the mandate of the Social Protection Floor Recommendation No. 202 and SDG 1.3, both adopted by all countries. The ABND supports countries in building a comprehensive national and country specific social protection system. The ABND methodology is applied by UN agencies Working-as-One to support countries in facilitating national dialogues to develop a common vision and priorities for social protection. Building consensus among the participating agencies is a key feature and goal of the ABND process.
The ABND process starts by constituting a national working work on social protection to start social dialogue. The methodology has three main steps, described in the following pages: (i) a qualita-tive assessment, an inventory of the existing social protection schemes and identification of social protection gaps; (ii) a financial assessment, costing different social protection scenarios to close the gaps, the sources of funding and fiscal space options; and (iii) finalization and endorsement. The resources at the end of this chapter provide links to the main online sources.
Stocktaking and preparation of technical
assessments through social dialogue
Monitoring and evaluation
Participative formulation of social
protection policies and their sources of funding
Implementation
CHAPTER 12 | SOCIAL DIALOGUE FOR FISCAL SPACE OPTIONS 197
12.2.1 Establishment of a national working group on social protection
A national working group, consisting of key stakeholders, including national ministries, social security agencies, employers, workers, civil society organizations, UN agencies and development partners has to be formed to conduct the ABND process. The involvement of civil society assures to represent the needs and realities of vulnerable people, such as informal economy workers, persons with disabilities, women, children and indigenous people, among others. The working-group is responsible for planning and organizing the activities around the ABND process and provides technical inputs, briefs their respective agencies and partner organizations about the ABND and regularly informs the high-level coordination committee on the progress and findings of the ABND. It is usually chaired by a national ministry and co-facilitated through a development agency that is providing international expertise and supports the lobbying to and endorsement by policy makers.
The ABND process takes over one year and entails general and bilateral consultations, tripartite workshops, and technical seminars to progressively devise a shared vision for the social security situation, the identification of policy gaps and implementation issues, and to draw appropriate policy recommendations for the achievement of a comprehensive social protection floor in line with inter-national labour standards. The participatory approach adopted throughout the ABND exercise raises awareness among line ministries, workers’ and employers’ representatives, civil society organiza-tions, and UN agencies regarding the social protection floor concept, its relevance for the country, and the importance of a coordinated, holistic approach to social protection development.
Box 12.2 Social Protection Assessment-based National Dialogue in Ghana
The ABND process conducted during 2013 – 2014 in Ghana provided an analysis of the existing social protection measures and their sustainability, robustness and efficiency and effectiveness in preventing or reducing poverty, social exclusion and ill health. The report, launched in 2015, provided significant inputs to Ghana s National Social Protection Strategy. The assessment involved a fiscal space analysis, providing guidance on expenditure rationalization and re-prioritization, reduction and termination of energy subsidies for the benefit of social protection expansion and made suggestions on developing a social budgeting tool as a planning instrument to support Ghana s National Social Protection Strategy in the medium and long run. The ABND also provided an estimate of the future cost of implementing these policy options, as well as of their potential impact on poverty reduction based on static micro-simulations. Finally, the report has assessed the governance framework of Ghana’s social protection system and provided recommendations on an appropriate monitoring framework. The assessment exercise in Ghana was particularly inter-esting as it put specific emphasis on the matter of fiscal space, providing the government and social partner s concrete guidance on how to potentially fund the suggested policy scenarios suggested in the report.
Source: ILO, 2015b.
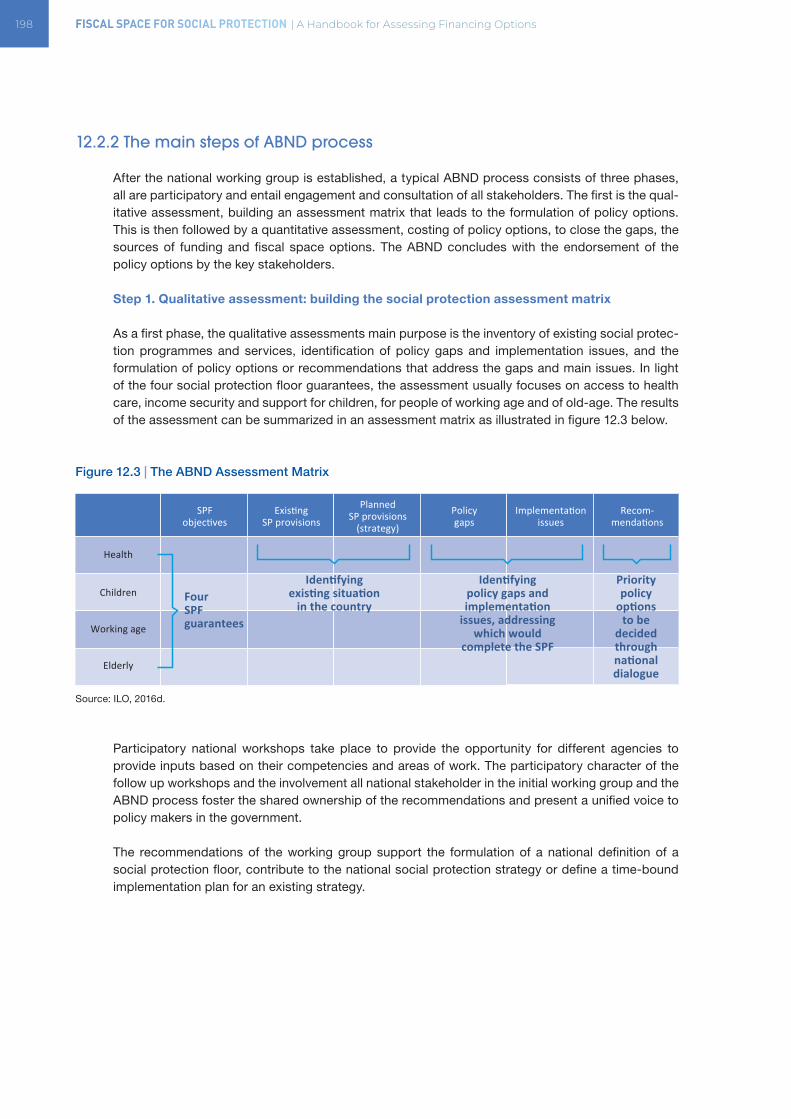
198 FISCAL SPACE FOR SOCIAL PROTECTION | A Handbook for Assessing Financing Options
12.2.2 The main steps of ABND process
After the national working group is established, a typical ABND process consists of three phases, all are participatory and entail engagement and consultation of all stakeholders. The first is the qual-itative assessment, building an assessment matrix that leads to the formulation of policy options. This is then followed by a quantitative assessment, costing of policy options, to close the gaps, the sources of funding and fiscal space options. The ABND concludes with the endorsement of the policy options by the key stakeholders.
Step 1. Qualitative assessment: building the social protection assessment matrix
As a first phase, the qualitative assessments main purpose is the inventory of existing social protec-tion programmes and services, identification of policy gaps and implementation issues, and the formulation of policy options or recommendations that address the gaps and main issues. In light of the four social protection floor guarantees, the assessment usually focuses on access to health care, income security and support for children, for people of working age and of old-age. The results of the assessment can be summarized in an assessment matrix as illustrated in figure 12.3 below.
Figure 12.3 | The ABND Assessment Matrix
Source: ILO, 2016d.
Participatory national workshops take place to provide the opportunity for different agencies to provide inputs based on their competencies and areas of work. The participatory character of the follow up workshops and the involvement all national stakeholder in the initial working group and the ABND process foster the shared ownership of the recommendations and present a unified voice to policy makers in the government.
The recommendations of the working group support the formulation of a national definition of a social protection floor, contribute to the national social protection strategy or define a time-bound implementation plan for an existing strategy.
SPFobjectives
ExistingSP provisions
PlannedSP provisions
(strategy)
Policygaps
Implementationissues
Recom-mendations
Health
Identifyingexisting situation
in the countryFourSPFguarantees
Children
Working age
Elderly
Identifyingpolicy gaps andimplementation
issues, addressingwhich would
complete the SPF
Prioritypolicy
optionsto be
decidedthroughnationaldialogue
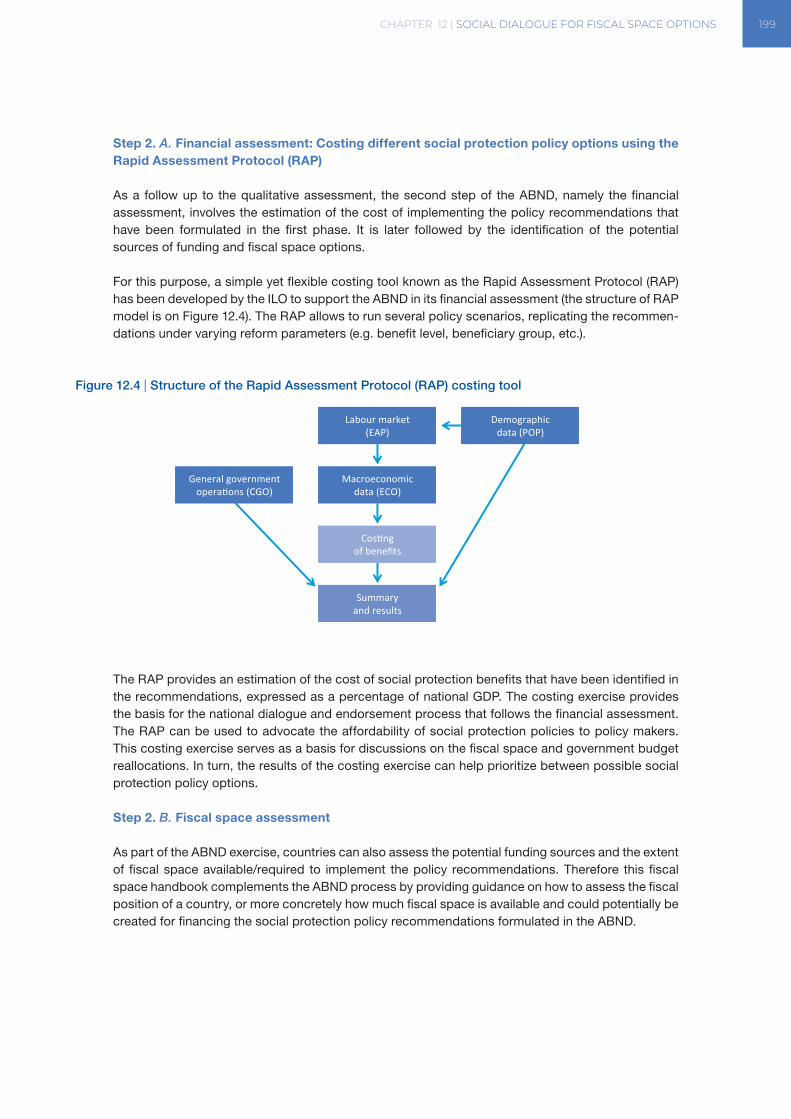
CHAPTER 12 | SOCIAL DIALOGUE FOR FISCAL SPACE OPTIONS 199
Step 2. A. Financial assessment: Costing different social protection policy options using the Rapid Assessment Protocol (RAP)
As a follow up to the qualitative assessment, the second step of the ABND, namely the financial assessment, involves the estimation of the cost of implementing the policy recommendations that have been formulated in the first phase. It is later followed by the identification of the potential sources of funding and fiscal space options.
For this purpose, a simple yet flexible costing tool known as the Rapid Assessment Protocol (RAP) has been developed by the ILO to support the ABND in its financial assessment (the structure of RAP model is on Figure 12.4). The RAP allows to run several policy scenarios, replicating the recommen-dations under varying reform parameters (e.g. benefit level, beneficiary group, etc.).
Figure 12.4 | Structure of the Rapid Assessment Protocol (RAP) costing tool
The RAP provides an estimation of the cost of social protection benefits that have been identified in the recommendations, expressed as a percentage of national GDP. The costing exercise provides the basis for the national dialogue and endorsement process that follows the financial assessment. The RAP can be used to advocate the affordability of social protection policies to policy makers. This costing exercise serves as a basis for discussions on the fiscal space and government budget reallocations. In turn, the results of the costing exercise can help prioritize between possible social protection policy options.
Step 2. B. Fiscal space assessment
As part of the ABND exercise, countries can also assess the potential funding sources and the extent of fiscal space available/required to implement the policy recommendations. Therefore this fiscal space handbook complements the ABND process by providing guidance on how to assess the fiscal position of a country, or more concretely how much fiscal space is available and could potentially be created for financing the social protection policy recommendations formulated in the ABND.
Labour market(EAP)
Macroeconomicdata (ECO)
Costingof benefits
Summaryand results
General governmentoperations (CGO)
Demographicdata (POP)
200 FISCAL SPACE FOR SOCIAL PROTECTION | A Handbook for Assessing Financing Options
Questions to consider on fiscal space options include:
i. Expanding social security coverage and contributory revenues: What is the percentage of workers contributing to social security? Can contributions to social security be extended to more workers? Are current contribution rates adequate? Is there scope to introduce innova-tions like the Monotax to encourage the formalization of workers in the informal economy?
ii. Increasing tax revenues: Have all tax codes and possible modifications been considered and evaluated to maximize public revenue without jeopardizing private investment? Are personal income and corporate tax rates designed to support equitable outcomes? Have finan-cial sector taxes been considered to support productive and social sector investments? What specific collection methods could be strengthened to improve overall revenue streams? Could minor tariff adjustments increase the availability of resources for social investments? Is natural resource extraction adequately taxed? Can tax policies better respond to “boom” and “bust” cycles? Has there been any attempt to earmark an existing tax or introduce a new one to finance specific social investments—taxes on property, inheritances, tourism, tobacco, etc.?
iii. Eliminating illicit financial flows: Has a study been carried out or a policy designed to capture and re-channel illicit financial flows for productive uses? What can be done to curb tax evasion, money laundering, bribery, trade mispricing and other financial crimes are illegal and deprive governments of revenues needed for social and economic development?
iv. Reprioritizing Public Spending: Can government expenditures be re-allocated to support social investments that empower vulnerable households? Are, for example, current mili-tary, infrastructure or commercial sector expenditures justified in light of existing poverty and inequality rates? Has a recent study been conducted to identify measures to enhance the efficiency of current investments, including steps to tackle and prevent corruption and the mismanagement of public funds?
v. Using fiscal and foreign exchange reserves: Are there fiscal reserves, for example, sitting in sovereign wealth funds that could be invested in poor households today? Are excess foreign exchange reserves being maximized and used to foster local and regional development?
vi. Borrowing or restructuring debt: Have all debt options been thoroughly examined to ramp up social investments? What are the distributional impacts of financing government expen-ditures by additional borrowing? Have different maturity and repayment terms been discussed with creditors? Has a public audit been carried out to examine the legitimacy of existing debts?
vii. Adopting a more accommodating macroeconomic framework: Is the macroeconomic framework too constrictive for national development? If so, at what cost macroeconomic stability? Could increasing the fiscal deficit by a percentage point or two create resources that could be used to deliver high-impact social protection? Are current inflation levels unduly restricting employment growth and social investments?
viii. Lobbying for increased aid and transfers: Has the government delivered a convincing case to OECD countries for increased aid, including budget support, to support the scaling up of social investments? Has there been any formal or informal attempt to lobby neighbouring or friendly governments for South-South transfers?
ix. Have all possible options been carefully examined—including the potential risks and trade-offs associated with each opportunity—and discussed in an open social dialogue? Have all possible fiscal scenarios been fully explored? Is there any assessment missing from the national debate? Are all relevant stakeholders, government, employers, workers, civil society, academics, UN agencies and others, being heard and supportive of an agreement that articulates an optimal solution in macroeconomic and fiscal policy, the need for job and income security and human rights?
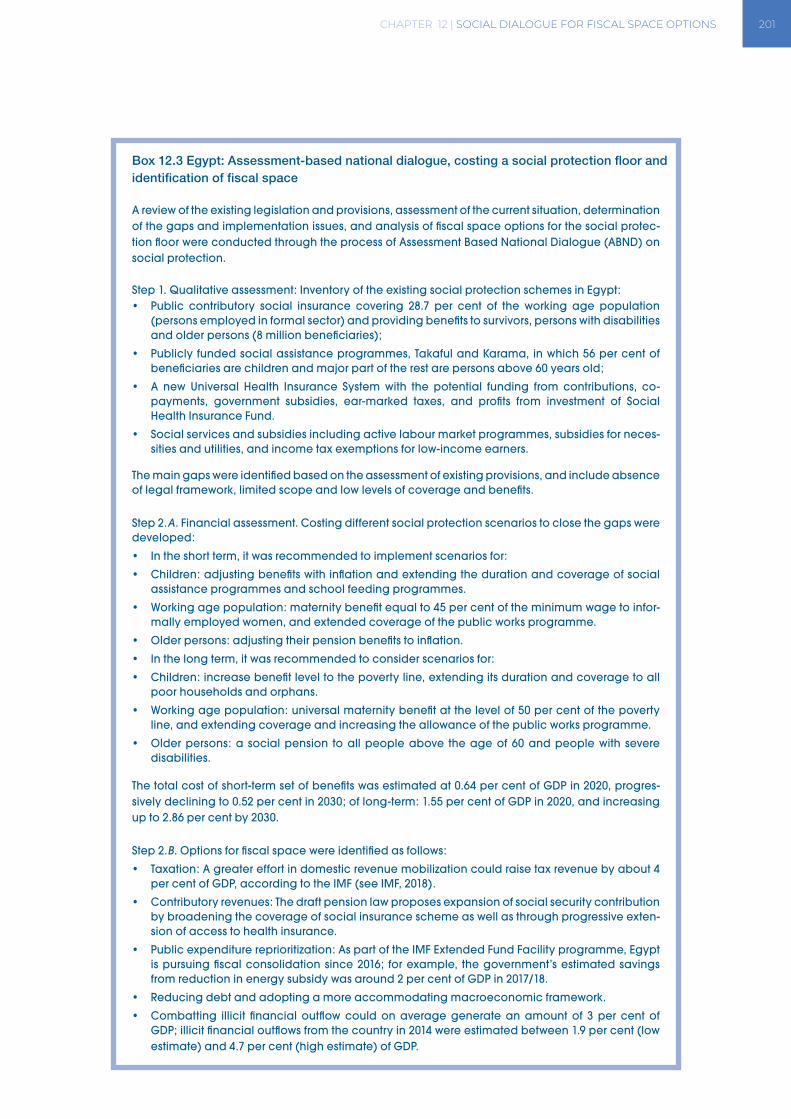
CHAPTER 12 | SOCIAL DIALOGUE FOR FISCAL SPACE OPTIONS 201
Box 12.3 Egypt: Assessment-based national dialogue, costing a social protection floor and identification of fiscal space
A review of the existing legislation and provisions, assessment of the current situation, determination of the gaps and implementation issues, and analysis of fiscal space options for the social protec-tion floor were conducted through the process of Assessment Based National Dialogue (ABND) on social protection.
Step 1. Qualitative assessment: Inventory of the existing social protection schemes in Egypt:• Public contributory social insurance covering 28.7 per cent of the working age population
(persons employed in formal sector) and providing benefits to survivors, persons with disabilities and older persons (8 million beneficiaries);
• Publicly funded social assistance programmes, Takaful and Karama, in which 56 per cent of beneficiaries are children and major part of the rest are persons above 60 years old;
• A new Universal Health Insurance System with the potential funding from contributions, co- payments, government subsidies, ear-marked taxes, and profits from investment of Social Health Insurance Fund.
• Social services and subsidies including active labour market programmes, subsidies for neces-sities and utilities, and income tax exemptions for low-income earners.
The main gaps were identified based on the assessment of existing provisions, and include absence of legal framework, limited scope and low levels of coverage and benefits.
Step 2.A. Financial assessment. Costing different social protection scenarios to close the gaps were developed:
• In the short term, it was recommended to implement scenarios for:
• Children: adjusting benefits with inflation and extending the duration and coverage of social assistance programmes and school feeding programmes.
• Working age population: maternity benefit equal to 45 per cent of the minimum wage to infor-mally employed women, and extended coverage of the public works programme.
• Older persons: adjusting their pension benefits to inflation.
• In the long term, it was recommended to consider scenarios for:
• Children: increase benefit level to the poverty line, extending its duration and coverage to all poor households and orphans.
• Working age population: universal maternity benefit at the level of 50 per cent of the poverty line, and extending coverage and increasing the allowance of the public works programme.
• Older persons: a social pension to all people above the age of 60 and people with severe disabilities.
The total cost of short-term set of benefits was estimated at 0.64 per cent of GDP in 2020, progres-sively declining to 0.52 per cent in 2030; of long-term: 1.55 per cent of GDP in 2020, and increasing up to 2.86 per cent by 2030.
Step 2.B. Options for fiscal space were identified as follows:
• Taxation: A greater effort in domestic revenue mobilization could raise tax revenue by about 4 per cent of GDP, according to the IMF (see IMF, 2018).
• Contributory revenues: The draft pension law proposes expansion of social security contribution by broadening the coverage of social insurance scheme as well as through progressive exten-sion of access to health insurance.
• Public expenditure reprioritization: As part of the IMF Extended Fund Facility programme, Egypt is pursuing fiscal consolidation since 2016; for example, the government’s estimated savings from reduction in energy subsidy was around 2 per cent of GDP in 2017/18.
• Reducing debt and adopting a more accommodating macroeconomic framework.
• Combatting illicit financial outflow could on average generate an amount of 3 per cent of GDP; illicit financial outflows from the country in 2014 were estimated between 1.9 per cent (low estimate) and 4.7 per cent (high estimate) of GDP.
202 FISCAL SPACE FOR SOCIAL PROTECTION | A Handbook for Assessing Financing Options
The above results show that fiscal space options were available in Egypt, even at a time when the government was implementing fiscal consolidation/austerity measures. This was sufficient to cover the costs of both short-term and long-term social protection benefits. Reducing debt, together with a more accommodative macroeconomic framework, could open up greater fiscal space for the country. On the revenue side, government could explore a wider range of tax instruments instead of just relying on the traditional measures such as widening of tax base and improving tax collection methods; examples of other instruments include a “sin tax” on consumption of tobacco and sugar-holding beverages, tourism tax, and a financial transaction tax. The current trend in aid inflow into the country shows limited North-South grants, though the government has received some South-South transfers from Arab countries. Drawing down fiscal savings in special funds such as the sovereign wealth fund and/or using excess foreign exchange reserve could free up some additional fiscal space.
Source: ILO staff estimates based on data from national sources, World Bank World Development Indicators, IMF Government Finance Statistics.
Step 3. Finalization and endorsement A key strength of the ABND process is the formulation of evidence-based and feasible policy recom-mendations that have been developed through participatory national workshops. As a final step in the ABND process, the qualitative and quantitative (financial) assessments are combined in a report that is presented to high-level policy makers for their endorsement. To facilitate the endorsement, countries often adapt the ABND process to existing decision-making and reporting processes and national coordination structures.
The ABND can be a useful tool to guide governments in setting national priorities in the area of social protec-tion, to design a roadmap for the gradual realization of the social protection floor and towards the realization of SDG 1.3 and 3.8, “implement nationally appropriate social protection systems and measures for all, including floors.” Moreover it can help to phase the implementation of the recommendations defined in the final ABND report and to prioritize actions.
An Assessment-Based National Dialogue (ABND) to agree a strategy for the extension of social protection is based in the following steps: (i) establishing of a national working group; (ii) qualitative assessment: inventory of the existing social protection schemes and identification of social protection gaps; (iii) financial assessment: costing different social protection scenarios to close the gaps, the sources of funding and fiscal space options; and (iv) finalization and endorsement.
CHAPTER 12 | SOCIAL DIALOGUE FOR FISCAL SPACE OPTIONS 203
Box 12.4 ABND process in the Republic of Tajikistan
Recognizing the need to improve the social protection system and extend basic social protection coverage to all people, the Ministry of Health and Social Protection (MHSP) of the Republic of Tajik-istan has started an “Assessment-based National Dialogue for a Social Protection Floor”. The MHSP, in cooperation with government bodies, social partners, civil society, academics, UN agencies, and development partners in the Republic of Tajikistan, held the first round table as a part of the ABND in February 2017. The participants recognized the importance of the ABND in Tajikistan and decided to start the process of the national dialogue.
Step 1. Building assessment matrix
In May 2017 during the second national dialogue the Ministry officially announced about the estab-lishment of a social protection floor working group. It was established at two levels: (a) Steering Committee, and (b) an Expert Working Group. During the first round of discussions, in line with ILO Recommendation No. 202, a draft of the assessment matrix mapping social protection schemes of four social protection floor guarantees was built, identifying policy gaps and implementation issues, and designing recommendations for overcoming existing difficulties and barriers. The Expert Working Group have been working during the next few months on updating the assess-ment matrix, which was submitted and validated by the ABND Steering Committee.
The National Dialogue have agreed on priorities in social protection in the Republic of Tajikistan:
• Guarantee good-quality and affordable healthcare services to all;
• Increase the amounts of social child benefits and extend coverage to all children up to 18 years of age;
• Extend maternity and child protection coverage to all women and children;
• Increase the amount of the social old-age pension to 80 per cent of the minimum pension.
Step 2. Costing and fiscal space analysis
As the second step of the ABND the working group at the third national dialogue have been working on formulating recommendations and propose policy scenarios in social protection area in order to close the gaps identified in the assessment matrix. Using the RAP model, the participants calculated the expected costs of introducing higher levels of benefits and pensions and extending coverage for various scenarios.
The cost of implementing universal child benefit at the level of 1.5 per cent of the average wage was estimated at 1.39 per cent of GDP in 2025; providing maternity benefit to the registered unemployed women at the level of 45 per cent of the average wage – 0.01 per cent of GDP in 2025; and increase the amount of the social old-age pension to 80 per cent of the minimum pension – 0.004 per cent of GDP. National dialogue has discussed possible solutions for the fiscal space to implement the scenarios, and recommended detailed analysis as the post-ABND step forward.
Step 3. Finalization and endorsement.
The results of the third ABND were reflected in the technical report “Social Protection Floors in the Republic of Tajikistan: Assessment Based National Dialogue,” and submitted to the Government for validation and further implementation and inclusion into its National Development Strategy.
Source: ILO, 2018b.
Social dialogue and collective bargaining have also great potential as vehicles to facilitate the promo-tion of gender equality. Social dialogue provides the platform to addressing issues of representation and participation in tripartite bodies, as well as within government units, workers’ and employers’ organisations. Most importantly it can ensure that equality issues are on the social dialogue agenda, including within collective bargaining (Briskin and Muller, 2011). For instance, the social partner
204 FISCAL SPACE FOR SOCIAL PROTECTION | A Handbook for Assessing Financing Options
framework agreements of the European Union and the sectoral social dialogue arenas initiated via the European Industry Federations are platforms that have incorporated and taken up gender issues in a social dialogue setting. Gender issues are also relevant in national-level social dialogue institu-tions in countries outside of Europe, and through global framework agreements and World Works Councils. Chile created the Tripartite Commission for Equality of Opportunities for Women at Work in 1995, while Brazil established a Working Group for Elimination of Discrimination in Employment and Occupation in 1996. Similar Tripartite Commissions for Equal Opportunities at Work were also created in Uruguay, Argentina and Paraguay in the following years (Box 12.5).
Box 12.5 Social dialogue for gender equality: The Southern cone countries of Latin America
The second half of the 1990s witnessed the creation of a number of tripartite structures for social dialogue on gender issues in the southern cone countries of Latin America. Following an ILO initiative to train women leaders in workers’ and employers’ organizations and the government on discrimination based on sex, tripartite structures for equality of opportunities in employment were created in Argentina (1998), Chile (1995), Paraguay (1998) and Uruguay (1997), with different degrees of success. A similar institution was also created in El Salvador. In Brazil, a working group on discrimination was created in 1995, but it was only in 2004 when a permanent structure was created: the body deals with discrimination based both on gender and on race.
The “tripartite commissions”, as they are known in the region, have been able to place gender discrimination in employment in the governmental agendas; social dialogue has been strength-ened, and throughout these years, expertise on gender has been reinforced within the workers’ and the employers’ organizations. Important legislative initiatives, such as the approval of the Quota Law in Argentina or the campaign for the promotion of ratification of Convention 156 in Paraguay, have been advanced by the members of these commissions. Women have occupied all leader-ship positions in recent years: the chairperson’s position and the head of secretariat. Professional staff is also women dominated.
The tripartite gender specific commissions are a rather unique experience worldwide. The members have been able to achieve substantive results with, on occasions, very limited resources, as it is the case of Paraguay. Meetings gathering representatives from these social dialogue forums have been regularly organized with the support of the ILO. This has allowed tripartite commissions for equality in employment to act with a single voice in the sub-regional social dialogue forum created within MERCOSUR, the free trade regional grouping of the southern cone countries.
Source: Breneman-Pennas and Catry, 2008.
CHAPTER 12 | SOCIAL DIALOGUE FOR FISCAL SPACE OPTIONS 205
12.3 CONDITIONS FOR SUCCESS AND SUSTAINABILITY
The following conditions are paramount to the success and sustainability of national social dialogue (ILO, 2013a):
• Freedom of Association;
• Democratic foundations;
• Mutual trust and respects of all parties involved;
• Appropriate legislative and policy frameworks and well-resourced mechanisms conducive to, and supportive of social dialogue;
• Strong and independent stakeholder organizations with legitimacy to speak and act with authority on behalf of their constituents;
• Pragmatic approach of all stakeholders, oriented towards problem-solving.
Thus, governments need to create an enabling environment, provide administrative support and create strong independent institutions. The civil society and stakeholder organizations also have critical roles in sensitizing their constituents about issues of interest and in providing appropriate training on technical matters for ensuring fruitful and informed discussions. All participants should have mutual respect, open mind, high level of commitment to the dialogue process and readiness to accept the negotiated outcome.
Social dialogue is likely to fail when it is more adversarial and ideologically charged. A major difficulty also lies in the lack of basic agreement on the approach to economic analysis. This can be linked to different ideological stances of participants. For example, some may believe in a larger role of governments than others. Participants may also not see eye to eye on the impact of deficit financing and public debt or a more accommodative macroeconomic framework. Thus the importance of pragmatic approaches, oriented towards problem-solving - this is essential for social dialogue to result in a successful outcome.
12.4 CONCLUDING REMARKS
National social dialogue has proven to be an effective mechanism to articulate optimal solutions in macroeconomic and fiscal policy, and investments to promote jobs, social protection, support women and children, and human rights. National social dialogue is institutionalized in many coun-tries. While in these countries national development strategies and their financing sources have been shaped through social dialogue, in many other countries this has not been the case. Public policy decisions have often been taken behind closed doors, as technocratic solutions with limited or no consultation, resulting in reduced social investments, lack of public ownership, adverse social impacts, and sometimes civil unrest. National tripartite dialogue, with government, employers and workers as well as civil society, academics, UN agencies and others, is fundamental to generate polit-ical will to exploit all possible fiscal space options in a country, and adopt the optimal mix of public policies for inclusive growth and social justice. Problem solving orientation and pragmatic approach are important for successful outcomes of social dialogue. The Assessment-based National Dialogue methodology is a platform that facilitates national consensus building, involving all key stakeholders, on social protection policy and fiscal space for social protection.
206 FISCAL SPACE FOR SOCIAL PROTECTION | A Handbook for Assessing Financing Options
12.5 KEY RESOURCES
ILO. 2016. Social protection assessment-based national dialogue: A global guide (Geneva).
This is an essential guide for all practitioners involved in conducting the social protection ABND exercise. This global guide offers a standardized approach for conducting ABND exercises. The content of the guide draws from the resources and experiences of the ILO, other UN agencies and UN member States in Africa, Asia, Eastern Europe, and Latin America. The guide can be used as a self-learning tool, as a resource package for delivering training, as well as a guide for conducting full-fledged ABND exercises in respective countries.
ILO. 2013. Social protection floor good practices guide on ABND (Geneva). Available at http://secsoc.ilo.org/abnd/
This is a web-based good practices guide provides a comprehensive treatment of the ABND process including modules, country case studies, and a glossary of technical terms.
Ishikawa, J. 2003. Key Features of National Social Dialogue: A Social Dialogue Resource Book (Geneva, International Labour Office).
The objective of this resource book is to introduce concepts of social dialogue and enabling condi-tions for social dialogue to work effectively and to demonstrate positive features of social dialogue with empirical examples. This book focuses on social dialogue at the national level. However, the information given in this book can also be applied to social dialogue at provincial, regional or state level, especially for countries with a federal structure
Breneman-Pennas, T.; Catry, M. R. 2008. Women’s participation in social dialogue institutions at the national level (Geneva, International Labour Office).
This paper is the result of a comparative research on the status of women as direct participants in social dialogue institutions. It is a first attempt to establish the state of the art on women’s partici-pation in social dialogue institutions, and aims at setting the baseline for future assessments. It also provides material for reflection on how women could be further promoted in policy decision-making. It assesses the extent to which gender is mainstreamed in the agenda of institutionalized social dialogue. It refers to experiences that could be eventually replicated in other countries.
Learning accomplishments
After reading this chapter readers should have a good grasp of the:
• Social dialogue processes and their various features to address fiscal space for social protection
• Understand the ABND methodology and its steps: qualitative assessment, financial assessment, and finalization
• What kind of questions can be considered at the social dialogue on fiscal space
• Promotion of gender equality through social dialogue
207GLOSSARY
ANNEX GLOSSARY
Cash transfer programme. Non-contributory scheme providing cash benefits to individuals or households, usually financed out of taxation, other government revenue, or external grants or loans. Cash transfer programmes may be means tested (targeted to the poor) or universal (for example, for all older persons, or for all children, or for all mothers with newborns).
Contributory scheme. Social protection insurance scheme in which contributions made by protected persons directly determine entitlement to benefits (acquired rights). The most common form of contributory social security schemes is a statutory social insurance scheme, usually covering workers in formal wage employment and, in some countries, the self-employed. Other common types of contributory schemes, providing – in the absence of social insurance – a certain level of protection include national provident funds, which usually pay a lump sum to beneficiaries when particular contingencies occur (typically old age, invalidity or death). In the case of social insur-ance schemes for those in waged or salaried employment, contributions are usually paid by both employees and employers. Contributory schemes can be wholly financed through contributions, but often are partly financed from taxation or other sources; this may be done through a subsidy to cover the deficit, or through a general subsidy supplanting contributions altogether, or by subsidizing only specific groups of contributors or beneficiaries (e.g. those in the informal sector or not contributing because they are caring for children, in military service or unemployed, or have too low a level of income to fully contribute, or receive benefits below a certain threshold because of low contributions in the past).
Consumption tax. Tax on goods and services transactions, such as a Value Added Tax (VAT) or a Goods and Services Tax (GST). From the perspective of the buyer, it is a tax on the purchase price.
Corporate Tax. Tax on the income or capital of corporate entities; generally, this tax is imposed on net profits or net taxable income.
Counter-cyclical. Movement in a direction opposite to that of the fluctuations in an economic cycle i.e. falls during economic boom and rises during economic recession; contrary to cyclical policies, counter-cyclical policies increase public spending in times of economic crisis.
Deadweight loss. A deadweight loss (also known as excess burden or allocative inefficiency) is the cost to society created by market inefficiencies; refers to the costs caused by an inefficient allocation of resources.
Debt restructuring. Process by which a country renegotiates the conditions of its debt when facing problems of liquidity/cash flow and/or financial distress in order to reduce or re-accommodate its debt service and continue regular operations.
Excise duty. A tax on manufactured goods which is levied at the moment of manufacture or import, rather than at sale; this tax is generally designed to discourage the purchase of particular goods, such as alcohol, tobacco, and some energy products.
Financial Activities Tax (FAT). Levied on the sum of the profits and remuneration of financial insti-tutions, and paid to general revenue. FAT seeks to target the value-added by the financial sector.
208 FISCAL SPACE FOR SOCIAL PROTECTION | A Handbook for Assessing Financing Options
Financial Transactions Tax (FTT) or Financial Services Tax (FST). A tax imposed on transactions of banks, insurance companies, securities companies, investment companies and pension funds, etc.; that is, FTT is directed at the transactions executed on financial markets.
Fiscal envelope. The level of resources available for each policy sector in the current year and upcoming years; envelopes are established on an annual basis in the fiscal plan. Fiscal reserves. Public funds accrued through government budget surpluses, profits of state-owned companies, privatization receipts or other government net income (such as royalties and rents from natural resources).
Fiscal space. Fiscal space is defined as the resources available as a result of the active explora-tion and utilization of all possible revenue sources by a government, according to the ILO, UNICEF and UNWOMEN (Ortiz et al., 2017). These UN agencies provide eight financing options for social protection that all countries should consider in national dialogues: (i) expanding social security coverage and contributory revenues, (ii) increasing tax revenues, (iii) eliminating illicit financial flows, (iv) improving efficiency and reallocating public expenditures from socially less desirable areas, (v) tapping into fiscal and foreign exchange reserves, (vi) borrowing or restructuring debt, (vii) adopting a more accommodative macroeconomic framework, and (viii) lobbying for increased aid and trans-fers. The IMF (Heller, 2005) defines fiscal space as the availability of budgetary room that allows a government to provide resources for a desired purpose without any prejudice to the sustainability of a government’s financial position. Roy et al., (2009) from UNDP define fiscal space as the financing that is available to government as a result of concrete policy actions for enhancing resource mobi-lization, and the reforms necessary to secure the enabling governance, institutional and economic environments for these policy actions to be effective, for a specified set of development objectives.Illicit Financial Flow: Money illegally earned, transferred, or used that crosses borders (World Bank website).
Inflation. The increase in the prices of goods and services over time.
Macroeconomic framework. A set of sectoral projections for the real, external, fiscal, and mone-tary sectors.
Medium-term Expenditure Framework (MTEF). Annual, rolling three year-expenditure planning to set out medium-term expenditure priorities and hard budget constraints against which sector plans can be developed and refined.
Negative externalities. A negative externality is the cost that affects a party who did not choose to incur that cost, as a result of an economic transaction, e.g. manufacturing activities that generate pollution impose health costs to society. Governments often take actions to compensate or reduce the negative impact of externalities.
Official Development Assistance (ODA). According to the Development Assistance Committee (OECD, 2008, p.1), the ODA is defined as those flows to countries and territories that are provided by official agencies, including state and local governments, or by their executive agencies; and each transaction of which is administered with the promotion of the economic development and welfare of developing countries as its main objective; and is concessional in character and conveys a grant element of at least 25 per cent.
Performance-Based Budgeting (PBB). Budgeting linking the funds allocated to measurable results.
209GLOSSARY
Personal income tax. Tax on personal income derived through work, business pursuits, invest-ments, property dealings and other sources determined in accordance with the tax law; may be subject to certain deductions or allowances.
Poll tax. A tax levied on every adult, without reference to their income or resources. It is a flat rate tax and very regressive as it does not depend on income or resource levels; normally charged by local governments/municipalities, but made less regressive by basing it on the value of properties.
Progressive policy. A policy that takes a larger percentage from the income of high-income earners than it does from low-income individuals, redistributing from the wealthy to those poorer or lower income.
Public budget. Financial and economic exercise that forecasts the level of revenues and expendi-tures in a determined period of time, normally a fiscal year.
Public Expenditure Review (PER). Methodological framework utilized to assess public expen-ditures trends, composition and distributional effects with a view to improve the developmental outcomes.
Recurrent expenditure. Recurrent expenditure on goods and services is expenditure which does not result in the creation or acquisition of fixed assets (new or second-hand). It consists mainly of expenditure on wages, salaries, and supplements, purchases of goods and services for operation and maintenance, and consumption of fixed capital i.e. depreciation.
Regressive policy. A policy that takes a larger percentage from low-income people than from high-income people, redistributing to the wealthy or taking a larger toll on low-income citizens. A regressive tax is generally a tax that is applied uniformly, as it hits lower-income individuals harder, depending on their relative level of consumption.
Revenue. Income that a government receives; government revenue includes all amounts of money (i.e. taxes) received from sources outside the government entity.
Social assistance. Programs that provide transfers in cash or in-kind to those who are unable to work or excluded from gainful employment and who are deemed eligible, whether on the basis of their income, their vulnerability status or their rights as citizens. Social assistance programmes are usually financed out of taxation, other government revenue, or external grants or loans; they may be means tested (targeted to the poor) or universal (e.g. for all older persons, or all children, or all mothers with newborns, or all persons with disabilities).
Social budgeting. Methodological toolkit used to compile revenues and expenditures of a country´s social protection system and the medium term forecast of those components under certain demo-graphic, economic and legislative assumptions.
Social dialogue. ILO defines to include all types of negotiation, consultation or simply exchange of information between, or among, representatives of governments, employers and workers, on issues of common interest relating to economic and social policy (ILO web site).
210 FISCAL SPACE FOR SOCIAL PROTECTION | A Handbook for Assessing Financing Options
Social insurance. Contributory social protection scheme that guarantees protection through an insurance mechanism, based on: (i) the prior payment of contributions, i.e. before the occurrence of the insured contingency; (ii) risk- sharing or “pooling”; and (iii) the notion of a guarantee. The contributions paid by (or for) insured persons are pooled together and the resulting fund is used to cover the expenses incurred exclusively by those persons affected by the occurrence of the relevant (clearly defined) contingency or contingencies. Contrary to commercial insurance, risk-pooling in social insurance is based on the principle of solidarity as opposed to individually calculated risk premiums.
Social protection or social security. Is a human right and is defined as the set of policies and programs designed to reduce and prevent poverty and vulnerability across the life-cycle. Social protection include nine main areas: child and family benefits, maternity protection, unemployment support, employment injury, sickness benefits, health insurance, old-age pensions, invalidity/disability pensions, and survivors’ pensions. Social protection systems address all these policy areas by a mix of contributory schemes (social insurance) and non-contributory tax-financed social assistance. Social protection or social security is a human right and is enshrined as such in ILO Conventions and Recommendations, the Universal Declaration of Human Rights (1948), the Interna-tional Covenant on Economic, Social and Cultural Rights (1966), and in other major United Nations human rights instruments. States have the legal obligation to protect and promote human rights, including the right to social protection or social security, and ensure that people can realize their rights without discrimination. The overall responsibility of the State includes ensuring the due provi-sion of benefits according to clear and transparent eligibility criteria and entitlements, and the proper administration of the institutions and services.
Social protection floor. Social protection floors are nationally defined sets of basic social secu-rity guarantees that should ensure, at a minimum that, over the life cycle, all in need have access to essential health care and to basic income security which together secure effective access to goods and services defined as necessary at the national level. ILO Recommendation No. 202 (2012) approved by all countries, employers and workers, also states that these basic social security guar-antees should be established by law; national laws and regulations should specify the range, quali-fying conditions and levels of the benefits giving effect to these guarantees, and provide for effective and accessible complaint and appeal procedures.
Social security contributions. Social security contributions are compulsory payments paid to general government that confer entitlement to receive a (contingent) future social benefit.
South-South cooperation. The United Nations (2012, p. 5) defines South-South cooperation (SSC) to be “a process whereby two or more developing countries pursue their individual and/or shared national capacity development objectives through exchanges of knowledge, skills, resources and technical know-how, and through regional and interregional collective actions, including partner-ships involving Governments, regional organizations, civil society, academia and the private sector, for their individual and/or mutual benefit within and across regions.”.
Sovereign wealth funds (SWF). According to the Sovereign Wealth Fund Institute, SWFs are state-owned investment funds, commonly established from balance of payments surpluses, official foreign currency operations, privatization proceeds, fiscal surpluses and natural resource rents/royalties.
Sustainable Development Goals (SDG). Set of goals to end poverty, protect the planet and ensure prosperity for all as part of a new sustainable development agenda (United Nations).
Tax wedge. The tax wedge is defined as the sum of the employee personal income tax and social contributions paid by employees and employers, minus cash benefits, as a proportion of the labour costs for employers (OECD).
211GLOSSARY
Tax allowance. The threshold above which income tax is levied on an individual’s income, this is, the amount of income on which a citizen does not have to pay tax.
Tax Avoidance. The legal use of the tax regime to one’s own advantage in order to reduce the amount of tax that is payable by means that are within the law.
Tax effort. Actual tax revenue as a percentage of estimated potential tax revenue.
Tax evasion. Efforts by individuals, corporations, trusts and other entities to deliberately evade taxes by misrepresenting or concealing the true state of their affairs to the tax authorities. In a strict legal sense, tax evasion is illegal. In a broader sense, tax evasion is the set of actions, legal or illegal, that individuals and firms can adopt to reduce their tax payments. This broader definition includes tax avoidance and aggressive tax planning using loopholes – activities that generally are not illegal, but may be considered morally or socially unacceptable. It is tax evasion in this broader sense that matters most for developing countries.
Tax gap. The difference between estimated potential tax revenue and actual tax revenue; tax evasion and avoidance, tax exemptions, and inequitable rent-sharing in the extractive sector are all significant sources of these tax gaps.
Tax haven. A state, country, or territory where certain taxes are levied at a low rate or not at all. Indi-viduals and/or corporate entities can find it attractive to establish shell subsidiaries or move them-selves to the tax haven to benefit. Other definitions include countries that lack effective exchange of tax information with foreign tax authorities, or have an extensive network of tax treaties, or no requirement for a substantive local presence.
Tax incidence. The analysis of the effect of a particular tax on the distribution of economic welfare. Tax incidence is said to ‘fall’ on the group that ultimately bears the burden of the tax.
Tax. A financial charge or other levy imposed on a taxpayer (an individual or legal entity) by a state, or the functional equivalent of a state, such that failure to pay is punishable by law.
Taxable capacity. The ability of people to pay tax and the ability of the government to collect; the tax effort reflects the degree to which taxable capacity is used. The tax ratio (of total tax revenue to GNP) reflects, however, both tax capacity and effort, the latter influenced by the level of government expenditure and availability and use of non-tax resources.
Taxable income. The base on which an income tax system imposes tax. Generally it includes some or all items of income and is reduced by expenses and other deductions.
Triangular cooperation. Type of relationship that involves a Northern donor (e.g. international orga-nization, DAC donor) who finances projects and programmes executed by Southern countries.
Universal scheme/policy. Policy or scheme that provides benefits to broad categories of the population, without a means-test to the poor. Frequent social protection universal schemes include income schemes to all older persons above a certain age, to all persons with disabilities, to all mothers with newborns, or to all children below a certain age. Some universal schemes also focus on households with specific structures (one-parent households, for example) or occupational groups (such as rural workers).

213BIBLIOGRAPHY
BIBLIOGRAPHY
Achille, C.; Mezui, M.; Duru, U. 2013. Holding excess foreign reserves versus infrastructure finance: What should Africa do?, African Development Bank Working Paper No. 178 (Tunis, African Development Bank).
ADB (Asian Development Bank). 2013. The Social Protection Index: Assessing results for Asia and the Pacific (Manila).
African Union; Economic Commission for Africa. 2015. Report of the High Level Panel on Illicit Financial Flows from Africa.
Agustina, R.; Dartanto, T.; Sitompul, R.; Susilorentni, K. A.; Suparmi, M. K. M.; Achadi, E. L.; Taher, A.; Wirawan, F.; Sungkar, S.; Sundarmono, P.; Shankar, A. H.; Thabrany, H. 2019. “Universal health coverage in Indonesia: Concept, progress, and challenges”, in The Lancet, Vol. 393, No. 10166, pp. 75-102. DOI: https://doi.org/10.1016/S0140-6736(18)31647-7.
Ahmad, E.; Stern, N. 1989. “Taxation for developing countries” in H. Chenery and T.N. Srinivasan (eds): Handbook of Development Economics, Vol. 2 (Elsevier), pp. 1005-1092.
Aizenman, J.; Jinjarak, Y.; Kim, J.; Park, D. 2015. Tax revenue trends in Asia and Latin America: A comparative analysis, NBER Working Paper No. 21755 (Cambridge, MA, National Bureau of Economic Research).
Akyüz, Y. 2014. Internationalization of finance and changing vulnerabilities in emerging and developing economies, UNCTAD Discussion Paper No. 217 (Geneva, United Nations Conference on Trade and Development).
Alderman, H.; Yemtsov, R. 2013. How can safety nets contribute to economic growth?, Policy Research Working Paper, No. WPS 6437 (Washington DC, World Bank).
Allen, R.; Tommasi D. (eds). 2001. Managing public expenditure: A reference book for transition coun-tries (Paris, Organisation for Economic Cooperation and Development).
Atkinson, A. B.1999. The economic consequences of rolling back the welfare state (Boston, MIT Press).
Auerbach, A.; Gale, W. G.; Orszag, P. R. 2004. The U.S. fiscal gap and retirement saving, Economic Studies No. 39, 2004/2 (Paris, Organization for Economic Co-operation and Development). ).
Bai, Y.; Zhang, J. 2012. “Duration of sovereign debt renegotiation”, in Journal of International Economics, Vol. 86, No. 2, pp. 252 – 268. DOI: https://doi.org/10.1016/j.jinteco.2011.08.007.
Baker, D. 2014. Larry Kotlikoff tells us why we should not use infinite horizon budget accounting, CEPR Beat the Press Commentary on Economic Reporting (Washington, DC, Center for Economic and Policy Research).
Baliamoune-Lutz, M. 2016. “The effectiveness of foreign aid to women’s equality organizations in the MENA”, in Journal of International Development, Vol. 28, pp. 320–341. DOI: 10.1002/jid.3214.
Ball, L.; Furceri, D.; Leigh, D.; Loungani, P. 2013. The distributional effects of fiscal consolidation, IMF Working Paper No. WP/13/151 (Washington DC, International Monetary Fund).
Bastagli, F. 2016. Bringing taxation into social protection analysis and planning: Guidance note (London, Overseas Development Institute).
—; Coady, D.; Gupta, S. 2012. Income inequality and fiscal policy, IMF Staff Discussion Note No. SDN/12/08 (Washington DC, International Monetary Fund).
Baunsgaard, T.; Keen M. 2010. “Tax revenue and (or?) trade liberalization”, in Journal of Public Economics, Vol. 94, No. 9–10, pp. 563–577. DOI: https://doi.org/10.1016/j.jpubeco.2009.11.007.
214 FISCAL SPACE FOR SOCIAL PROTECTION | A Handbook for Assessing Financing Options
Beitler, D. 2010. Raising revenue: A review of financial transaction taxes throughout the world, A report for Health Poverty Action and Stamp Out of Poverty (London, Just Economics).
Benedek, D.; Crivelli, E.; Gupta, S.; Muthoora, P. 2012. Foreign aid and revenue: Still a crowding-out effect?, IMF Working Paper No. WP/12/186 (Washington DC, International Monetary Fund).
Benn, J.; Rogerson, A.; Steensen, S. 2010. Getting closer to the core: Measuring country programmable aid, OECD-DCD Development Brief, Issue 1 (Paris, Organization for Economic Co-operation and Development).
Bernardell, C.; Cardon, P.; Coche, J.; Diebold, F. X.; Manganelli, S. 2004. Risk management for central bank foreign reserves (Frankfurt am Main, European Central Bank).
Besley, T.; Kanbur, R. 1990. The principles of targeting, World Bank Working Paper Series N. 385 (Washington DC, World Bank).
Besley, T.; Persson, R. 2014. “Why do developing countries tax so little?”, in Journal of Economic Perspectives, Vol. 28, No. 4, pp. 99–120. DOI: 10.1257/jep.28.4.99.
Birdsall, N.; Savedoff, W. 2010. Cash on Delivery: A new approach to foreign aid (Washington DC, Center for Global Development).
Blyth, M. 2013. Austerity: The history of a dangerous idea (New York, Oxford University Press).
Booth, D.; Curran, Z. 2005. Aid instruments and exclusion, Report for the UK Department for Interna-tional Development. (London, Overseas Development Institute).
Bonnet, F. 2016. Social protection coverage across employment patterns (Geneva, International Labour Organization).
Boyle, N.; Han, C. 2013. Social partnership and austerity shocks in open economies: Why were social pacts institutionalized in Ireland but not Korea?, Paper presented at the Western Political Science Association Conference, 28-30 March 2013, Hollywood, CA, USA.
Breneman-Pennas, T.; Catry, M. R. 2008. Women’s participation in social dialogue institutions at the national level (Geneva, International Labour Organization).
Briskin, L.; Muller, A. 2011. Promoting gender equality through social dialogue: Global trends and persistent obstacles, Industrial and Employment Relations Department Working Paper No. 34 (Geneva, International Labour Organization).
Browne, E. 2015. Social protection: Topic guide (Birmingham, University of Birmingham).
Buchanan, J. 1963. “The economics of earmarked taxes”, in Journal of Political Economy, Vol. 71, No. 5, pp. 457-469. DOI: https://doi.org/10.1086/258794.
Capaldo, J.; Izurieta, A. 2013. “The imprudence of labor market flexibilization in a fiscally austere world”, in International Labour Review, Vol. 152, No. 1, pp. 1-26. DOI: https://doi.org/10.1111/j.1564-913X.2013.00166.x.
Cavallo, E.; Serebrisky, T. (eds). 2016. Saving for development. How Latin America and the Caribbean can save more and better (Washington DC, Inter-American Development Bank and Palgrave McMillan).
Chai, J.; Goyal, R. 2008. Tax concessions and foreign direct investment in the Eastern Caribbean Currency Union, IMF Working Paper No. WP/08/257 (Washington DC, International Monetary Fund).
Chang, H. J. 2007. State owned enterprise reform, United Nations National Development Strategies Policy Notes (New York, United Nations Department for Economic and Social Affairs).
Chowdhury, A. 2005. Foreign aid for tackling HIV/AIDS and human development disaster: Can a large inflow cause macroeconomic instability?: Theory and evidence, (Dhaka, Economic Research Group).
—. 2006. “The ‘Stabilisation Trap’ and poverty reduction – What can monetary policy do?”, in Indian Development Review, Vol. 4, No. 2, pp. 407-432.
—; Islam I. 2011. “Attaining the Millennium Development Goals: The role of macroeconomic poli-cies”, in International Journal of Social Economics, Vol. 38, No. 12, pp. 930-952. DOI: https://doi.org/10.1108/03068291111176301.
215BIBLIOGRAPHY
—; —. 2012. “The Debate on expansionary fiscal consolidation: How robust is the evidence?”, in The Economic and Labour Relations Review, Vol. 23, No. 3, pp. 13–38. DOI: https://doi.org/10.1177/103530461202300302.
Christian Aid. 2007. Debt: The repudiation option (London).
Christian Aid. 2009. False profits: Robbing the poor to keep the rich tax-free (London).
Cichon, M.; Scholz, W.; Van de Meerendonk, A.; Hagemejer, K.; Bertranou, F.; Plamondon, P. 2004. Financing social protection, Quantitative Methods in Social Protection Series (Geneva, International Labour Organization).
Cobham, A. 2005. Tax evasion, tax avoidance and development finance, Queen Elisabeth House Working Paper No. 129 (Oxford, University of Oxford).
Cornia, A.; Jolly, R.; Stewart, F. (eds). 1987. Adjustment with a human face: Volume 1, Protecting the vulnerable and promoting growth (New York, Oxford University Press).
De Bruijn, K.; Kaiser, J.; Dearden, N.; Brynildsen, Ø.; Molina, N. 2010. Europe needs fair and transparent debt work-out mechanisms: Lessons from the Icelandic case (Brussels, European Network on Debt and Development).
de la Pena, I. 2014. A primer on social impact bonds (Santiago de Chile, United Nations Economic Commission for Latin America).
Development Committee. 2006. Fiscal policy for growth and development: An interim report (Wash-ington DC, International Monetary Fund and World Bank).
Development Initiatives. 2015. Getting poverty to zero: financing for social protection in least developed countries, Development Initiative Report No. May 2015 (Bristol).
Domar, E. 1944. “The ‘Burden of the Debt’ and the National Income”, in American Economic Review, Vol. 34, No. 4, pp. 798-827. DOI: https://www.jstor.org/stable/1807397.
—. 1993. “On deficits and debt”, in American Journal of Economics and Sociology, Vol. 52, No. 4, pp. 475-478. DOI: https://www.jstor.org/stable/3487476.
Duran-Valverde, F.; Pacheco, J. F. 2012. Fiscal space and the extension of social protection: Lessons from developing countries, Extension of Social Security (ESS) Paper No. 33 (Geneva, International Labour Organization).
Duran-Valverde, F.; Aguilar, J. F.; Vindas, J. F. O.; Corea, D. M.; de Lima Vieira, A. C. 2013. Innovations in extending social insurance coverage to independent workers: Experiences from Brazil, Cape Verde, Colombia, Costa Rica, Ecuador, Philippines, France and Uruguay, Extension of Social Security (ESS) Document No. 42 (Geneva, ILO).
Easterly, W.; Irwin, T.; Servén, L. 2008. “Walking up the down escalator: Public investment and fiscal stability”, in World Bank Research Observer, Vol. 23, No. 1, pp. 37–56. DOI: https://doi.org/10.1596/1813-9450-4158.
ECLAC (United Nations Economic Commission for Latin America and the Caribbean). 2017. Training manual: the design and conduct of Public Expenditure Reviews in Caribbean countries (Port of Spain).
Ehtisham, A.; Stern, N. 1989. “Taxation for developing countries”, in H. Chenery and T.N. Srinivasan (eds): Handbook of Development Economics, Vol. II, (Amsterdam, Elsevier).
Ellmers, B.; Hulova, D. 2013. The new debt vulnerabilities: 10 reasons why the debt crisis is not over. (Brussels, EURODAD).
Enoff, L.; McKinnon, R. 2011. “Social security contribution collection and compliance: Improving gover-nance to extend social protection”, in International Social Security Review, Vol. 64, No. 4, pp. 99-119. DOI: https://doi.org/10.1111/j.1468-246X.2011.01413.x.
EPS-PEAKS (Economic and Private Sector Professional Evidence and Applied Knowledge Services). 2013. Taxation and developing countries - Training notes (London, Overseas Development Institute).
ETUI (European Trade Union Institute). 2010. European economic and employment policy, ETUI Policy Brief, No. 2/2010 (Brussels).
216 FISCAL SPACE FOR SOCIAL PROTECTION | A Handbook for Assessing Financing Options
EURODAD (European Network on Debt and Development). 2009. A fair and transparent debt work-out procedure: 10 core civil society principles, A EURODAD report (Brussels).
Fattorelli, M. L. 2014. Citizen public debt audit: Experiences and methods (Liège, Committee for the Abolition of Illegitimate Debt; Geneva, Centre Europe-Tiers Monde).
FES (Friedrich Ebert Stiftung). 2015. Civil society guide to National Social Protection Floors. Global policy and development. (Berlin).
—. 2017. Social Protection Floor Index: Update and country studies (Berlin).
Ffrench-Davis, R. 2008. Macroeconomía para el Desarrollo o Macroeconomía Financierista? (Santiago, Chile, ILPES, Curso Internacional, Políticas Macroeconómicas y Finanzas Públicas).
Frot, E.; Santiso, J. 2011. “Herding in aid allocation”, in Kyklos, Vol. 66, No. 1, pp. 54-74. DOI: https://doi.org/10.1111/j.1467-6435.2010.00494.x.
Fultz, E. 2011. Pension crediting for caregivers: Policies in Finland, France, Germany, Sweden, the United Kingdom, Canada and Japan (Washington, DC, Institute for Women’s Policy Research).
Gallagher, K.; Shrestha, E. 2012. “The social cost of self-insurance: Financial crisis, reserve accu-mulation, and developing countries”, in Global Policy, Vol. 3, No. 4, pp. 501-509. DOI: 10.1111/j.1758-5899.2011.00150.x.
Ghosh, J. 2007. Macroeconomics and growth policies: Background note, UN Policy Notes for National Development Strategies (New York, United Nations Department of Economic and Social Affairs).
GIZ (Deutsche Gesellschaft für Internationale Zusammenarbeit). 2010. Gender & taxation: Why care about taxation and gender equality? (Eschborn).
Global Financial Integrity. 2015. Financial flows and tax havens: Combining to limit the lives of billions of people (Washington DC).
Global Partnership for Universal Social Protection USP2030. 2017. Universal Social Protection: Country cases (Geneva and Washington DC, International Labour Organization and World Bank).
Goldberg, L.; Hull C.; Stein, S. 2013. “Do industrialized countries hold the right foreign exchange reserves?”, in Current Issues in Economics and Finances, Vol. 19, No. 1, pp. 1-10 (Federal Reserve Bank of New York).
Gomes, R.; Hailu, D. 2009. “One instrument, many targets: Timor-Leste’s macroeconomic policy challenge”, in One Pager, No. 93 (Brasilia, International Policy Centre for Inclusive Growth).
Grabel, I. 2005. “Taxation of international private capital flows and securities transactions in developing countries: Do public finance considerations augment the macroeconomic dividends?”, in International Review of Applied Economics, Vol.19, No. 4, pp. 477-497. DOI: https://doi.org/10.1080/02692170500213368.
Gray, L.; Hansen, K.; Recica-Kirkbride, P.; Mills, L. 2014. Few and far: The hard facts on stolen asset recovery (Washington DC, World Bank; Paris, Organization for Economic Co-operation and Develop-ment).
Gray, S. 2011. Central bank balances and reserves requirements, IMF Working Paper No. WP/11/36 (Washington DC, International Monetary Fund).
Griffith-Jones, S. 2014. A BRICS development bank: A dream coming true?, UNCTAD Discussion Paper No. 215 (Geneva, United Nations Conference on Trade and Development).
—; Ocampo, J. A. 2009, “Sovereign Wealth Funds: A developing country perspective”, in Revue d’économie financiere, Special Issue, pp. 241- 254.
Growth Commission. 2005. Economic growth in the1990s: Learning from a decade of reform (Washington DC, World Bank).
Gustafsson-Wright, E.; Gardiner, S.; Putcha, V. 2015. The potential and limitations of impact bonds: Lessons from the first five years of experience worldwide (Washington DC, Brookings Institution).
Heller, P. 2005. Understanding fiscal space, IMF Policy Discussion Paper No. PDP/05/4, (Washington DC, International Monetary Fund)
217BIBLIOGRAPHY
Hove, S. 2016. Sovereign Wealth Funds and infrastructure development in Africa, Quantum Global Research Lab Working Paper No. 2016/02 (Zug, Quantum Global Research Lab).
Hurley, G. 2010. Achieving debt sustainability and the MDGs in small island developing states, Paper presented at the Economic and Financial Committee Side Event General Assembly of the United Nations (New York, United Nations).
ICMM (International Council on Mining and Metals). 2014. Enhancing mining’s contribution to the Zambian economy and society. An ICMM report (London).
ILO (International Labour Organization). 1998. Principles of social security (Geneva).
—. 1999. The social budget model: A technical guide (Geneva).
—. 2000. World Labour Report: Income security and social protection in a changing world (Geneva).
—. 2001. Social security: A new consensus (Geneva).
—. 2008. Can low income countries afford basic social security, Social Security Policy Briefings Paper No. 3 (Geneva).
—. 2013a. National Tripartite Social Dialogue: An ILO guide for improved governance (Geneva).
—. 2013b. Social protection floor good practices guide on ABND (Geneva). Available at: http://secsoc.ilo.org/abnd/.
—. 2014a. Uruguay - Monotax: Promoting formalization and protection of independent workers, Social Protection in Action Country Brief No. 2/2014 (Geneva).
—. 2014b. World Social Protection Report 2014/15: Building economic recovery, inclusive development and social justice (Geneva).
—. 2015a. Building social protection floors for All: Global flagship programme (Geneva).
—. 2015b. Rationalizing social protection expenditure in Ghana (consolidated report), ILO Technical Cooperation Report (Geneva).
—. 2016a. Indonesia: Financing social protection through contributions and the removal of fuel subsidy, Social Protection in Action Country Brief (Geneva).
—. 2016b. Developmental impacts of expanding social protection (Geneva).
—. 2016c. ILO Social security inquiry manual (Geneva).
—. 2016d. Social protection assessment-based national dialogue: A global guide (Geneva).
—. 2016e. Timor Leste: Universal old age and disability pensions, Social Protection in Action Country Brief (Geneva).
—. 2016f. Women and Work: Trends 2016 (Geneva).
—. 2016g. Non-Standard Employment around the World: Understanding challenges, shaping prospects (Geneva).
—. 2017a. World Social Protection Report 2017–19: Universal social protection to achieve the Sustain-able Development Goals (Geneva).
—. 2017b. Gender in employment policies and programmes: What works for women? (Geneva).
—. 2018a. Social protection for older persons: Policy trends and statistics 2017-19 (Geneva).
—. 2018b. Social Protection Assessment-Based National Dialogue: Towards a nationally defined social protection floor in the Republic of Tajikistan (Dushambe).
—. 2018c. Women and men in the informal economy: A statistical picture (Geneva).
—. 2018d. Care work and care jobs: For the future of decent work (Geneva).
—. 2018e. Decent work in Portugal 2008–18: From crisis to recovery (Geneva).
—. 2019. A quantum leap for gender equality: For a better future of work for all (Geneva).
218 FISCAL SPACE FOR SOCIAL PROTECTION | A Handbook for Assessing Financing Options
—, forthcoming a. Brazil: Protecting self-employed workers through a Monotax mechanism, Social Protection in Action Country Brief (Geneva).
—, forthcoming b. Universalizing health care in Costa Rica, Social Protection in Action Country Brief (Geneva).
IMF (International Monetary Fund). 1993. Balance of payments manual, Fifth Edition (Washington DC).
—. 2001. Guidelines for foreign exchange reserve management (Washington DC).
—. 2002. Assessing sustainability (Washington DC).
—. 2003. Evaluation Report - Fiscal adjustment in IMF-supported programs (Washington DC).
—. 2007. The IMF and aid to Sub-Saharan Africa (Washington DC).
—. 2009. Creating policy space—Responsive design and streamlined conditionality in recent low-in-come country programs (Washington DC).
—. 2010. Financial sector taxation, IMF’s Report to the G20 (Washington DC).
—. 2011a. Revenue mobilisation in developing countries (Washington DC).
—. 2011b. Guinea Bissau, Country Report No. 11/119 (Washington DC).
—. 2012a. Democratic Republic of Timor-Leste, Country Report No. 12/24 (Washington DC).
—. 2012b. Fiscal regimes for extractive industries: Design and implementation (Washington DC).
—. 2012c. The liberalization and management of capital flows: An institutional view (Washington DC).
—. 2014. World Economic Outlook October 2014 (Washington DC).
—. 2015a. Fiscal policy and long-term growth, IMF Policy Paper (Washington DC).
—. 2015b. World Economic Outlook April 2015 (Washington DC).
—. 2016a. Assessing fiscal space: An initial consistent set of considerations, IMF Staff Paper (Wash-ington DC).
—. 2016b. Corruption: Costs and mitigating strategies, IMF Staff Discussion Note No. SDN/16/05 (Washington DC).
—. 2017a. Costa Rica, Country Report No. 17/156 (Washington DC).
—. 2017b. Debt relief under the Heavily Indebted Poor Countries (HIPC) Initiative, IMF Factsheet (Wash-ington DC).
—. 2018. Arab Republic of Egypt, Country Report No. 18/14 (Washington DC).
Inter-Agency Task Force on Financing for Development. 2016. Coherent policies for combatting Illicit Financial Flows, IATF Issue Brief Series (New York).
IRS (Instituto per la Ricerca Sociale). 2016. The gender pension gap: differences between mothers and women without children (Bologna).
Ishikawa, J. 2003. Key features of National Social Dialogue: A social dialogue resource book (Geneva, International Labour Organization).
ISSA (International Social Security Association). 2011. Success factors in contribution collection and compliance, Social Policy Highlight 20 (Geneva).
Itriago, D. 2011. Owning development: Taxation to fight poverty, Oxfam Research Report (Oxford, Oxfam).
Joshi, A. 2017. Tax and gender in development countries: What are the issues?, ICTD Summary Brief No. 6 (Brighton, International Centre for Tax and Development).
Kar, D.; Cartwright-Smith, D.; Hollingshead, A. 2010. The absorption of illicit financial flows from devel-oping countries: 2002-2006 (Washington DC, Global Financial Integrity).
—; Spanjers, J. 2015. Illicit financial flows from developing countries: 2004-2013 (Washington DC, Global Financial Integrity).
219BIBLIOGRAPHY
Kotlikoff, L. J.; Michel, A. N. 2015. Closing America’s enormous fiscal gap: Who will pay?, MERCATUS Working Paper (Washington DC, George Mason University).
Kuddo, A; Robalino, D.; Weber, M. 2015. Balancing regulations to promote jobs: From employment contracts to unemployment benefits (Washington, DC, World Bank).
Le, T. M.; Moreno-Dodson, B.; Bayraktar, N. 2012. Tax capacity and tax effort extended cross-country analysis from 1994 to 2009, World Bank Policy Research Working Paper No. 6252 (Washington DC, World Bank).
Leading Group on Innovating Financing for Development. 2010. Globalizing solidarity: The case for financial levies, Taskforce on International Financial Transactions and Development Report (Paris, French Ministry of Foreign and European Affairs).
Levy, S. 2010. Good intentions, bad outcomes: Social policy, informality, and economic growth in Mexico (Washington DC, Brookings Institution).
Ley, E. 2009. Fiscal policy for growth, PREM Notes No. 131 (Washington DC, World Bank).
Lora, E.; Olivera, M. 2006. Public debt and social expenditure: Friends or foes?, IADB Working Paper No. 563 (Washington DC, Inter-American Development Bank).
Martini, M. 2014. Combating illicit financial flows: The role of the international Community (Berlin, Transparency International; Bergen, Chr. Michelsen Institute).
Mathers, N.; Slater, R. 2014. Social protection and growth: Research synthesis (Canberra, Department of Foreign Affairs and Trade, Australia).
Mckinsey Global Institute. 2015. The power of parity: How advancing women’s equality can add $12 trillion to global growth (London).
Mezui, C. A. M.; Duru, U. 2013. Holding excess foreign reserves versus infrastructure finance: What should Africa do?, African Development Bank Working Paper No. 178 (Abidjan, African Development Bank).
Minouiu, C.; Reddy, S. 2000. Development aid and economic growth: A positive long-run relation, IMF Working Paper No. WP/09/118 (Washington DC, International Monetary Fund).
Mogues, T. 2012. What determines public expenditure allocations?: A review of theories and implications for agricultural public investment, ESA FAO Working paper No. 12-06 (Rome, Food and Agricultural Organization).
Moody’s. 2008. Sovereign default and recovery rates 1983-2007, Moody’s Global Credit Research (New York).
Muzaffar, A. T.; Chowdhury, A. 2014. “The IMF and the policy of low inflation: A review of Article IV consultations for selected Asian developing countries”, in The Economic and Labour Relations Review, Vol. 25, No. 3, pp. 435–454. DOI: https://doi.org/10.1177/1035304614544272.
—; Junankar, P. N. 2014. “Inflation-growth relationship in selected Asian developing countries: Evidence from panel data”, in Journal of the Asia Pacific Economy, Vol. 19, No. 4, pp. 604-628. DOI: https://doi.org/10.1080/13547860.2014.920594.
Nanivazo, M.; Scott, L. 2012. Gender mainstreaming in Nordic development agencies: Seventeen years after the Beijing conference, WIDER Working Paper No. 2012/91 (Helsinki, United Nations University, World Institute for Development Economics Research).
NHSO (National Health Security Office). 2018. Policy Brief on the Thai UHC systems (Bangkok).
Nkusu, M. 2004. Aid and the Dutch Disease in low-income countries: Informed diagnoses for prudent prognoses, IMF Working Paper No. WP/04/49 (Washington DC, International Monetary Fund).
Norregaard, J. 2013. Taxing immovable property: Revenue potential and implementation challenges, IMF Working Paper No. WP/13/129 (Washington DC, International Monetary Fund).
Norton, A.; Elson, D. 2002. What’s behind the budget?: Politics, rights and accountability in the budget process (London, Overseas Development Institute).
220 FISCAL SPACE FOR SOCIAL PROTECTION | A Handbook for Assessing Financing Options
Nugée, J. 2015. “Foreign exchange reserve management”, in Handbook in Central Banking, No. 19 (London, Bank of England).
O’Donnell, R. 2000. “The New Ireland in the New Europe”, in R. O’Donnell (ed): Europe-The Irish Experi-ence (Dublin, Institute of European Affairs).
OECD (Organization for Economic Co-operation and Development). 2005. Paris Declaration on aid effectiveness (Paris).
—. 2007. Performance budgeting in OECD countries (Paris).
—. 2008. Tax effects on foreign direct investment, OECD Policy Brief February 2008 (Paris).
—. 2013a. The Where” of Development Finance: Towards better targeting of concessional finance (Paris).
—. 2013b. Triangular co-operation: What can we learn from a survey of actors involved?, OECD Develop-ment Co-operation Directorate Report (Paris).
—. 2014a. The rationale for fighting corruption, CleanGovBiz Background Brief (Paris).
—. 2014b. Draft recommendation of the OECD Council on the principles of budgetary governance (Paris).
—. 2014c. OECD principles of budgetary governance (Paris).
—. 2014d. Society at a Glance: Asia/Pacific 2014 (Paris).
—. 2014e. Development cooperation report 2014 (Paris).
—. 2015. Policy coherence for sustainable development: Thematic module on illicit financial flows (Paris).
—. 2017. Development co-operation report 2017: Data for development (Paris).
OHCHR (Office of the United Nations High Commissioner for Human Rights), 2013. Report of the United Nations High Commissioner for Human Rights on austerity measures and economic and social rights, Report No. E/2013/82, UN General Assembly resolution 48/141 (Geneva).
Ooms, G.; Schrecker, T. 2005, “Expenditure ceilings, multilateral financial institutions, and the health of poor populations”, in Lancet, Vol. 365, No. 9473, pp. 1821–1823. DOI: http://doi.org/10.1016/S0140-6736(05)66586-5.
Ortiz, I. 2007. Social Policy Note, UN Policy Notes for National Development Strategies (New York, United Nations Department of Economic and Social Affairs).
—. 2008. “Financing for development”, in K. Hujo and S. McClanahan (eds.): Financing social policy (Geneva, United Nations Research Institute for Social Development; Basingtoke, Palgrave Macmillan).
—; Chai, J.; Cummins, M. 2011a. Austerity measures threaten children and poor households: Recent evidence in public expenditures from 128 developing countries, UNICEF Social and Economic Policy Working Paper No. 2011-09 (New York, UNICEF).
—; —; —. 2011b. Identifying Fiscal Space: Options for Social and Economic Development for Children and Poor Households in 182 Countries UNICEF Social and Economic Policy Working Paper No. April 2011 (New York, UNICEF).
Ortiz, I.; Cummins, M. 2011, Global inequality: Beyond the bottom billion – A rapid review of income distribution in 141 Countries, UNICEF Social and Economic Policy Working Paper No. April 2011 (New York, UNICEF).
—;—. (eds). 2012. A recovery for all: Rethinking socio-economic policies for children and poor house-holds (New York, UNICEF).
—;—; Capaldo, J.; Karunanethy, K. 2015. The decade of adjustment: A review of austerity trends 2010-2020 in 187 countries, Extension of Social Security (ESS) Working Paper No. 53 (Geneva, International Labour Organization, and New York, South Centre and Initiative for Policy Dialogue).
—; —; Karunanethy, K. 2017. Fiscal space for social protection and the SDGs: Options to expand social investments in 187 countries, Extension of Social Security (ESS) Working Paper No. 48 (Geneva, International Labour Organization; New York, UNICEF and UNWOMEN).
221BIBLIOGRAPHY
Ortiz, I.; Schmitt, V.; De, L. (eds). 2016. Social Protection Floors. 3 Volumes (Geneva, International Labour Organization).
—; Durán-Valverde, F.; Urban, S.; Wodsak, V. 2018. Reversing pension privatizations: Rebuilding public pension systems in Eastern Europe (Geneva, International Labour Organization).
Ortiz-Ospina, E.; Roser, M. 2019. “Taxation”, in Our World in Data (University of Oxford).
Ostry, J.; Ghosh, A. R.; Kim, J. I.; Qureshi, M. S. 2010. Fiscal Space, IMF Staff Position Paper No. SPN/10/11 (Washington DC, International Monetary Fund).
—; Ghosh, A. R.; Habermeier, K.; Chamon, M.; Qureshi, M. S.; Laeven, L.; Kokenyne, A. 2011. Managing capital inflows: What tools to use?, IMF Staff Discussion Note No. 11/06 (Washington DC, International Monetary Fund).
—; Loungani, P.; Furceri, D. 2016. “Neoliberalism: Oversold?”, in IMF Finance and Development, Vol. 53, No. 2, pp. 38-41.
Park, D. 2007. Beyond liquidity: New uses for developing Asia’s foreign exchange reserves, ERD Working Paper No. 109 (Manila, Asian Development Bank).
Perez, J. J.; Aouriri, M.; Campos, M.; Celov, D.; Depalo, D.; Papapetrou, E.; Pesliakaite, J.; Ramos, R.; Rodrigues-Vives, M. 2016. The fiscal and macroeconomic effects of government wages and employ-ment reform, European Central Bank Occasional Paper Series No. 176 (Frankfurt am Main, European Central Bank).
Pescatori, A.; Sandri, D.; Simon, J. 2014. “No magic threshold”, in IMF Finance and Development, Vol. 51, No. 2, pp. 39-42.
Pettifor, A. 2002. Chapter 9/11? Resolving international debt crises – The jubilee framework for interna-tional insolvency, A New Economics Foundation Report (London, New Economics Foundation).
Platz, D. 2009. Infrastructure finance in developing countries - the potential of sub-sovereign bonds, DESA Working Paper No. 76 (New York, United Nations Department of Economic and Social Affairs).
Pradhan, S. 1996. Evaluating public spending: A framework for public expenditure reviews, World Bank Discussion Papers No. 323 (Washington DC, World Bank).
Prichard, W.; Cobham A.; Goodall, A. 2014. ICTD Government revenue dataset, ICTD Working Paper No. 19 (Brighton, Institute of Development Studies).
Raffer, K. 1993. “What’s good for the United States must be good for the world: Advocating an inter-national chapter 9 insolvency”, in Bruno Kreisky Forum for International Dialogue (ed): From Cancun to Vienna: International development in a new world. pp. 64-74.
Ratnam, V; Tomoda, S. 2005. Practical guide for strengthening social dialogue in public service reform (Geneva, International Labour Organization).
Ravallion, M. 2002. “Are the poor protected from budget cuts? Evidence for Argentina”, in Journal of Applied Economics, Vol. 5, No. 1, pp. 95-121. DOI: https://doi.org/10.1080/15140326.2002.12040572.
—. 2006. “Who is protected? On the incidence of fiscal adjustment”, in A. Mody and C. Pattillo (eds.): Macroeconomic Policies and Poverty Reduction (London, Routledge).
Ray, R.; Kozameh, S. 2012. Ecuador’s economy since 2007, Center for Economic and Policy Research Paper No. May 2012 (Washington DC, Center for Economic and Policy Research).
Rodríguez, P. L.; Morales, J. R.; Monaldi, F. J. 2012. Direct distribution of oil revenues in Venezuela: A viable alternative?, Center for Global Development Working Paper No. 306 (Washington DC, Center for Global Development).
Roy, R.; Heuty, A.; Letouze, E. 2007. Fiscal space for what: Analytical issues from a human development perspective, presented at the G-20 Workshop on Fiscal Policy, 30 June – 2 July 2007, Istanbul, Turkey (New York, United Nations Development Programme).
Roy, R.; Heuty, A. (eds). 2009. Fiscal space: Policy options for financing human development (New York, UNDP; London, Earthscan).
222 FISCAL SPACE FOR SOCIAL PROTECTION | A Handbook for Assessing Financing Options
Ruiz, M. 2007. Debt swaps for development: Creative solution or smoke screen?, EURODAD report No. October 2007 (Brussels, European Network on Debt and Development).
Schick, A.; OECD Senior Budget Officials. 2009. Evolutions in budgetary practice, (Paris, Organization for Economic Co-operation and Development).
Scholz, W.; Cichon, M.; Hagemejer, K. 2000. Social budgeting (Geneva, International Labour Organiza-tion).
Schmitt, V. 2011. ILO Convention 102 on Social security. International Labour Organization Decent Work Team Bangkok, Experts meeting in Jakarta, 12-15 December 2011.
Sen, A. K. 1995. “The political economy of targeting”, in D. Van de Walle and K. Nead (eds): Public spending and the Poor (Baltimore, John Hopkins University Press).
Standard and Poor’s. 2011. Default, transition, and recovery: Sovereign defaults and rating transition data 2010 update, Ratings Direct on the Global Credit Portal (New York).
Stiglitz, J. E. 2006. Making globalization work (New York, W.W. Norton and Company).
Sturzenegger, F.; Zettelmeyer, J. 2005. Haircuts: estimating investor losses in sovereign debt restructur-ings, IMF Working Paper No. 05/137 (Washington DC, International Monetary Fund).
SWFI (Sovereign Wealth Fund Institute), Sovereign Wealth Funds based on fiscal reserves April, 2017 (Las Vegas).
Swanson, A.; Lundethors, L. 2003. Public environmental expenditure reviews (PEERS): Experience and emerging Practice (Washington DC, World Bank).
Tandon, A.; Fleisher, L.; Li, R.; Yap, W. A. 2014. Reprioritizing government spending on health: Pushing an elephant up the stairs?, World Bank HNP Discussion Paper No. 85773 (Washington DC, World Bank).
Tatsiramos, K. 2009. “Unemployment insurance in Europe: Unemployment duration and subsequent employment stability, in Journal of the European Economic Association, Vol. 7, No. 6, pp. 1225–1260. DOI: 10.1162/JEEA.2009.7.6.1225.
Teja, R. S. 1988. “The case for earmarked taxes”, in IMF Staff Papers, Vol. 35, No. 3, pp. 523-533. (Washington DC, International Monetary Fund).
TheCityUK, 2015. Sovereign wealth funds 2015 Report (London).
Turkish Coordination and Cooperation Agency (TIKA). 2013. Turkish development assistance report 2013 (Ankara).
UN (United Nations). 2008. National development strategies policy notes (New York, United Nations Department of Economic and Social Affairs).
—. 2009a. Effects of foreign debt and other related international financial obligations of States on the full enjoyment of all human rights, particularly economic, social and cultural Rights, A Note by the United Nations Secretary-General No. A/64/289 (New York).
—. 2009b. Report of the Commission of Experts of the President of the United Nations General Assembly on Reforms of the International Monetary and Financial System (New York).
UN ECOSOC (United Nations Economic and Social Council). 2008. Background study for the Develop-ment Cooperation Forum: Trends in South-South and triangular development cooperation (New York, United Nations).
—. 2016. ODA allocation and other trends in development cooperation in LDCs and vulnerable contexts, 2016 Development Cooperation Forum Policy Briefs, No. 13 (New York, United Nations).
UNCTAD (United Nations Conference on Trade and Development). 2008. Trade and Development Report 2008 (Geneva).
—. 2011. Trade and Development Report 2011 (Geneva).
—. 2014. Trade and Development Report 2014 (Geneva).
—. 2015a. Sovereign Debt Workouts: Going forward roadmap and guide (Geneva).
223BIBLIOGRAPHY
—. 2015b. World Investment Report 2015: Reforming international investment governance (Geneva).
—. 2017. Beyond austerity: Towards a global new deal. Trade and Development Report 2017 (Geneva).
UNICEF (United Nations International Children’s Emergency Fund). 2007. Social budgeting in Kenya: Concepts and Practice, UNICEF Division of Policy and Planning Working Paper (New York).
—. 2010a. Protecting salaries of frontline teachers and health workers, UNICEF Social and Economic Policy Working Brief No. April 2010 (New York).
—. 2010b. Rapid assessment of unintended consequences of the discontinuation of salary incentives for the social sector in Cambodia (New York).
—. 2017. Is every child counted? Status of data for children in the SDGs (New York).
—. 2018. Fiscal space for children in Rwanda: A summary of the approach and options (Kigali).
UNODC (United Nations Office on Drugs and Crime); OECD (Organisation for Economic Cooperation and Development). 2016. Coherent policies for combatting Illicit Financial Flows, Issue Brief Series (Vienna, UNODC; Paris, OECD).
UNRISD (United Nations Research Institute for Social Development). 2010. Combating poverty and inequality: Structural change, social policy and politics (Geneva).
—. 2016. Policy innovations for transformative change: UNRISD flagship report 2016 (Geneva).
UN System Task Team (United Nations System Task Team). 2012. Social protection: A development priority in the post-2015 UN development agenda, Thematic Think Piece (New York).
UNWOMEN. 2014. The global economic crisis and gender equality (New York).
—. 2015. Progress of the world’s women 2015-2016: Transforming economies, realizing rights (New York).
—. 2018a. Turning promises into action: gender equality in the 2030 agenda for sustainable develop-ment, Report Summary (New York).
—. 2018b. Gender, taxation and equality in developing countries: Issues and policy recommendations, UN Women Discussion paper (New York).
Vandierendonck, C. 2014. Public spending reviews: Design, conduct, implementation, EU Economic Papers No. 525 (Brussels, European Commission).
Visser, J. 2001. “Industrial Relations and Social Dialogue”, in P. Auer (ed): Changing labour markets in Europe: The role of institutions and policies (Geneva, International Labour Organization), pp. 184-242.
Weisbrot, M.; Sandoval, L. 2007. Argentina’s economic recovery: Policy choices and implications, CEPR Paper No. October 2007 (Washington DC, Center for Economic and Policy Research).
WHO (World Health Organization). 2004. Tax-based financing for health systems: Options and experi-ences, WHO Discussion Papers No. 4-2004 (Geneva).
—. 2009. Public health, innovation and intellectual property, Expert Working Group on Research and Development Financing Report No. December 2009 (Geneva).
—. 2014. Raising tax on tobacco – What you need to know (Geneva).
Williams, C. C.; Kedir, A. 2018. “Explaining cross-national variations in the prevalence of informal sector entrepreneurship: Lessons from a survey of 142 countries”, in Journal of Developmental Entrepreneur-ship, Vol. 23, No. 1, pp. 1-23. DOI: 10.1142/S108494671850005X.
Williams, M. V. 2006. “Foreign exchange reserves – how much is enough?”, in BIS Review, No. 1/2006, pp. 1-12.
World Bank. 2010a. A 2009 update of poverty incidence in Timor-Leste using the survey-to-survey imputation method (Washington DC).
—. 2010b. Global Economic Prospects: Crisis, finance, and growth (Washington DC).
—. 2016. The World Bank Group’s response to illicit financial flows: A stocktaking (Washington DC).
224 FISCAL SPACE FOR SOCIAL PROTECTION | A Handbook for Assessing Financing Options
—; ILO (International Labour Organization). 2015. A shared mission for universal social protection, A Concept Note (Geneva).
World Economic Forum. 2018. The global gender gap report 2018 (Geneva).
WTO (World Trade Organization). 2010. World tariff profiles 2010 (Geneva).
Yikona, S.; Slot, B.; Geller, M.; Hansen, B.; El Kadiri, F. 2011. Ill-gotten money and the economy: Experiences from Malawi and Namibia (Washington DC, World Bank).

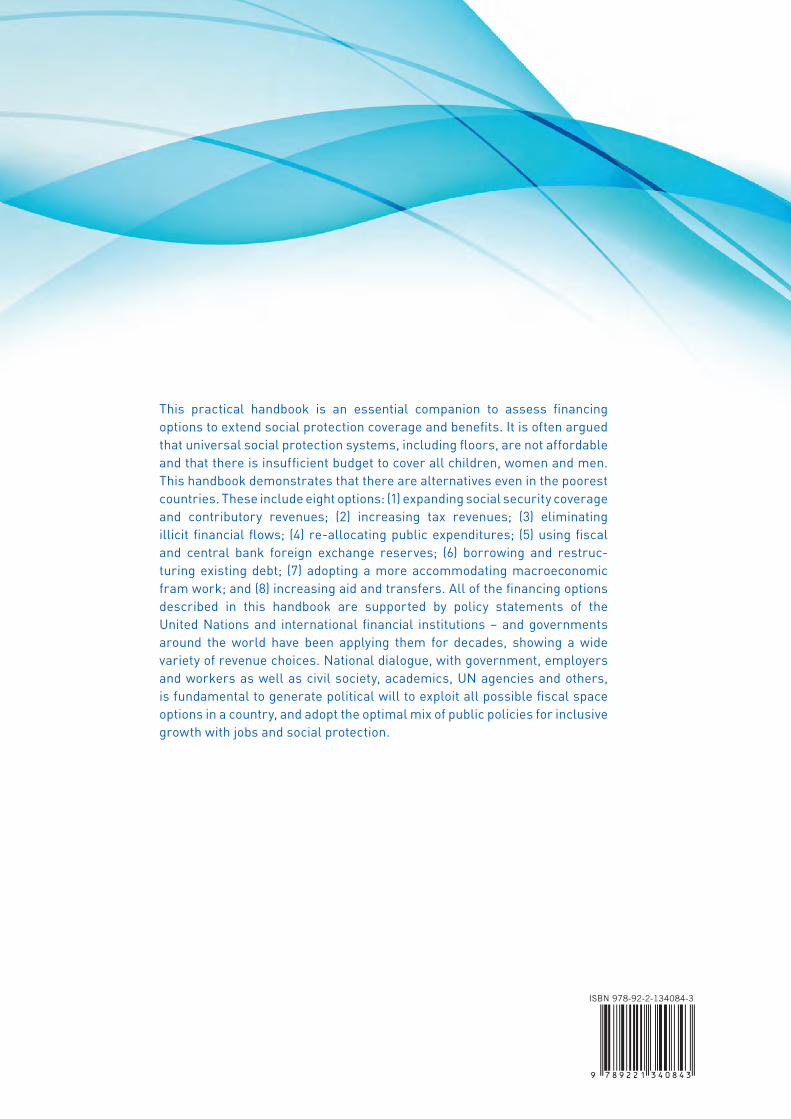
This practical handbook is an essential companion to assess financing options to extend social protection coverage and benefits. It is often argued that universal social protection systems, including floors, are not affordable and that there is insufficient budget to cover all children, women and men. This handbook demonstrates that there are alternatives even in the poorest countries. These include eight options: (1) expanding social security coverage and contributory revenues; (2) increasing tax revenues; (3) eliminating illicit financial flows; (4) re-allocating public expenditures; (5) using fiscal and central bank foreign exchange reserves; (6) borrowing and restruc-turing existing debt; (7) adopting a more accommodating macroeconomic fram work; and (8) increasing aid and transfers. All of the financing options described in this handbook are supported by policy statements of the United Nations and international financial institutions – and governments around the world have been applying them for decades, showing a wide variety of revenue choices. National dialogue, with government, employers and workers as well as civil society, academics, UN agencies and others, is fundamental to generate political will to exploit all possible fiscal space options in a country, and adopt the optimal mix of public policies for inclusive growth with jobs and social protection.
Isabel Ortiz
Anis Chowdhury
Fabio Durán-Valverde
Taneem Muzaffar
Stefan UrbanILO
- UN
WOM
EN
FIS
CAL
SPAC
E FO
R SO
CIAL
PRO
TECT
ION
A H
andb
ook
for
Ass
essi
ng F
inan
cing
Opt
ions
FISCAL SPACE FOR SOCIAL PROTECTIONA Handbook for Assessing Financing Options