fiscal year 2018 (ending march 31, 2019) 2q financial results … year 2018 (ending... · source:...
TRANSCRIPT

Fiscal Year 2018 (Ending March 31, 2019)
2Q Financial Results Briefing Session Materials
November 21, 2018
Takahisa Nishikawa, Representative Director and President
Hiroshi Fujii, Director and General Manager of the Finance Dept.
Nikko Co., Ltd.(Tokyo Stock Exchange Code: 6306)
1

www.nikko-net.co.jp Copyright NIKKO CO., LTD. 2018 All rights reserved.
Contents
Improving Disclosure
Company Overview
FY 2018 1H Business Climate and Medium-Term Management Plan
FY 2018 1H (Apr-Sep) Results
FY 2018 Full-year Outlook
Reference Materials
2
p. 3
p. 4-7
p. 8-14
p. 15-24
p. 25-29
p. 30-38

www.nikko-net.co.jp Copyright NIKKO CO., LTD. 2018 All rights reserved.
Improving Disclosure
Disclosing additional explanation materials when announcing financial results
Preparing and disclosing financial results briefing session materials (in English)
Disclosing explanatory materials with explanatory statements attached
Preparing and disclosing Q&A for financial results briefing sessions
Holding 1Q and 3Q conferences
Publication of the corporate report in Japanese and English by an outside company
Oct 22: NIKKO Messe 2018, an exhibition of new products for investors and security analysts
3

www.nikko-net.co.jp Copyright NIKKO CO., LTD. 2018 All rights reserved.
Company Overview
4

www.nikko-net.co.jp Copyright NIKKO CO., LTD. 2018 All rights reserved.
■Name: Nikko Co., Ltd.■Head office: 1013-1, Eigashima, Okubo-cho, Akashi,
Hyogo Prefecture■Established: August 13, 1919■Capital: 9,197 million yen (as of March 31, 2018)■Consolidated net sales: 35,114 million yen (FY 2017)■Consolidated operating income: 2,103 million yen (FY 2017)■Ratio of net sales outside Japan: 11.7% (FY 2017)■Subsidiaries: 7 (FY 2017)■Employees (consolidated): 807 (as of March 31, 2018)■Governance structure: Company with Board of Corporate Auditors
Directors: 7, of which 2 are outside directorsCorporate auditors: 4, of which 3 are outside auditors (as of March 31, 2018)
Management Philosophy
Adopting a customer-first policy, the Nikko Group provides customers with truly satisfactory products and services, while continually promoting self-reform aimed at winning broad trust and fulfilling our mission as a solutions partner evolving with customers.
AP-related business
48.9%BP-
related business
27.1%
Environment- and conveyor-related business 11.2%
Other business
12.8%
Net sales breakdown by business segment (FY 2017)
Company Overview (1)
* AP: Asphalt plantBP: (Concrete) batching plant
5

www.nikko-net.co.jp Copyright NIKKO CO., LTD. 2018 All rights reserved.
1968 Ichiishi Kogyosho (M&A)
1971 Nikko Electronics (subsidiary)
1983 Nikko Machinery (subsidiary)
1994 TOMBO Industry (subsidiary)
1995 NIKKO-SEC (subsidiary)
2002 Niigata Engineering (transfer of business)
2006 Mitsubishi Heavy Industries (transfer of business)
2008 Maekawa Kogyosho(M&A)
History
1919 Established TOMBO brand hand tools
1951 Concrete mixer Winch
1956 Ready-mixed concrete plant
1958 Asphalt plant
1962 Pipe support
1963 Pipe scaffolding
1966 Conveyor system
1983 Floodgate
2000 System for cleaning oil-polluted soil
2001 Waste plastic treatment system
2007 Concrete pump
2015 Crusher (import and sales)
1919 Head office factory
1938 Industrial machinery factory
1968 Tokyo factory
1994 Satte factory
2004 Shanghai Jiading factory
2014 Kakogawa factory
2016 Fukusaki factory
1993 Capital participation in Benninghoven(Germany)
1994 Nikko Baumaschinen(Germany)
1997 Taipei branch (Taiwan)
2001 Nikko (Shanghai) Construction Machinery
2010 Shantui ChutianConstruction Machinery
Company Overview (2)
6
August 2019: Centennial of founding
Products Production Sites Overseas ExpansionGroup Expansion in Japan(including acquisitions and
transfer of business)

www.nikko-net.co.jp Copyright NIKKO CO., LTD. 2018 All rights reserved.
Core technologies
Mixing and kneading
Products and ServicesAsphalt plantsBatching plantsRecycling plants
Financial BenefitsCash flow creationImprovement in profit marginInternal reserves for investing in growthDividends to shareholders
Consideration for Society and the Environment
Introduction of recirculating plants for energy savingNoise, safety, and disaster-prevention measuresRaising compliance awareness
A century of providing machines that build cities.Contributing to the establishment of a recycling-oriented society.
Outcome
Making customer companies more profitable
Contributing to local society through infrastructure provision
Contributing to a sustainable recycling-oriented society
Strong brand and excellent reputation
Raising employee satisfaction
Improving shareholder return
Input
A solid financial base
Original technology with high entry barriers
R&D capability for meeting customer needs
Trusted by customer companies as a solutions partner
Partnership with suppliers
Output
Listening to customers and
identifying issues
Conducting simulation tests
Presenting estimate
Order receipt ManufacturingInstallation at
siteMaintenance
933 estimates69,900 mil. yen
244 orders10,200 mil. yen
In Japan, 12,000 mil. yen
Estimates, orders, and maintenance are actual results for FY 2017 (Nikko non-consolidated)
Nikko’s Business Model
Final year of medium-term management plan (FY 2018)Net sales 32,000 mil. yenOperating margin 7%
7

www.nikko-net.co.jp Copyright NIKKO CO., LTD. 2018 All rights reserved.
FY 2018 1H Business Climate and Medium-Term Management Plan
8

www.nikko-net.co.jp Copyright NIKKO CO., LTD. 2018 All rights reserved. 9
FY 2018 1H (Apr-Sep) Business Climate
AP-related business
FY 2018 Apr-Sep asphalt mixture production volume 16.76 mil. tons (down 5.1% year on year)
Virgin mixture 4.02 mil. tons (down 3.1% year on year)
Recycled mixture 12.73 mil. tons (down 5.7% year on year)
*Recycled mixture ratio: 76.0% Source: Japan Asphalt Mixture Association
Demand for asphalt plants was 28 units (incl. 14 recycling units)(FY 2017 1H: 25 units [incl. 16 recycling units]) Study by Nikko
BP-related business
FY 2018 Apr-Sep ready-mixed concrete shipment volume was 41.40 mil. m3 (down 0.8% year on year)Source: National Federation of Ready-Mixed Concrete Industrial Associations and National Federation of Ready-Mixed Concrete Cooperatives Association
Demand for concrete plants was 26 units (36 units a year ago), or 10,800 mil. yen (11,800 mil. yen a year ago).Source: Japan Construction Equipment Manufacturers Association’s Concrete Plant Subcommittee
1H (Apr-Sep) Actual Year-on-year change
· Net sales 14,697 mil. yen (1,456) mil. yen / (9.0)%
· Operating income 474 mil. yen (334) mil. yen / (35.6)%
· Net income 564 mil. yen (179) mil. yen / (24.1)%
FY 2019 1H Results
Business climate and operation policy
Sales of domestic BP products were lower than the previous year. As for AP sales, domestic and Chinese sales rose compared with a year earlier, while exports to ASEAN and Russia fell significantly.
Sales of maintenance service increased for AP and slightly declined for BP. New orders received fell for both AP and BP.
Full-year capital investment plans of domestic AP customers are in line with FY 2017 and the business climate in China is as good as the previous year.
We will continue to follow up by analyzing investment estimates of visitors to NIKKO Messe 2018 held from Oct 22 to Nov 2.

www.nikko-net.co.jp Copyright NIKKO CO., LTD. 2018 All rights reserved. 10
Current Medium-Term Management Plan (FY 2016-18)
24,812
24,864
22,175
25,035
26,942
23,856
23,971
23,803
24,553
27,087
32,073
30,707
34,110
32,717
35,114
32,500
32,000
33,443
248 185
(55)
271 189
(98)
265 470 541
1,186
2,249 1,832
1,629 1,944 2,103
1,600
2,240 1,882
(500)
500
1,500
2,500
3,500
4,500
(5,000)
5,000
15,000
25,000
35,000
45,000
Net sales Operating income
Medium-Term
Management Plan
period
(mil. yen)
1.0% 0.7%(0.2)%
1.1%0.7%
(0.4)%
1.1%2.0% 2.2%
4.4%
7.0%
6.0%
4.8%
5.9% 6.0%
4.9%
7.0%
5.6%

www.nikko-net.co.jp Copyright NIKKO CO., LTD. 2018 All rights reserved.
Product development aimed at encouraging investment in small to midsize asphalt plants
Enabling plant operation with fewer workersDevelopment of control functions
Development of new mixer for BP
Development of small mobile (vehicle-mounted) BP for construction work and disaster recovery
Stabilization of domestic core businesses
· Develop automated operations console for one-man AP control
· Enhance BP maintenance and management functions(Upgrade operations console)
· Pursue mixing and kneading functions from new perspective
(Aim for development in two years after structural studies and repeated testing)
· Number of plants is assumed to decline with factory consolidation(Aim for development in one year)
· Improve appearance so product can be shown off proudly
· Convert to structure easier to maintain
· Improve ease of device unit replacement
Formulating product plans linking to demand, to raise customer value in Japan and overseas
Current Medium-Term Management Plan (FY 2016-18)
Created Value Pack (VP) Series, our flagship asphalt plant brand
Total of 5 units, including FY 2018 plans, worth 1,340 mil. yen
Actual product was displayed at NIKKO Messe 2018
Development of new AP operation console and new BP operation console were completed
Available since May 2018
Actual product was displayed at NIKKO Messe 2018
Continued with development of automated operation console for one-man AP control
Development of new mixer was completed
Prototype was displayed at NIKKO Messe 2018
To conduct test from FY 2019 for making it a product
Actual product was displayed at NIKKO Messe 2018
11

www.nikko-net.co.jp Copyright NIKKO CO., LTD. 2018 All rights reserved.
Entry into other business areas of conveyance and environment
Promotion of crusher business
Promotion of product business with a view to tunnel work
Business promotion aimed at becoming a comprehensive thermal processing manufacturer
Japan: Growth strategiesCreating new product value by merging the core technologies and strengths of each business
Current Medium-Term Management Plan (FY 2016-18)
Tied up with a leading engineering company to deliver 900 million yen worth of equipment to a steel works using core technologies for heating
Repeat inquiries from the customer for overseas installation
Internal manufacturing of impact crusher was accomplished
Actual product was displayed at NIKKO Messe 2018
SEC engineering method
Completed performance testing of ultra-strong fiber-reinforced concrete mixing and kneading
Development of Mobix and BP for tunnels was completed
Actual product was displayed at NIKKO Messe 2018
Improved functionality of existing products (recycling dryer, bags, etc.)
In process of product development based on heating technology road map
12
· Develop primary crushers· Strengthen engineering
capability for crushing technologies
· Promote investment proposals including mobile crushers
· Develop equipment for discharging, backfilling, and solidifying dirt
· Develop BP for tunnels and surface scraping equipment for maintenance
· Acquire high-temperature processing technology including incineration furnace technology, and develop products
· Merging core technologies, develop equipment able to handle multiple kinds of materials

www.nikko-net.co.jp Copyright NIKKO CO., LTD. 2018 All rights reserved.
Development of new products that match the needs of the target countries in Southeast Asia, and of new sales channels
Increasing sales in Chinese market
Acquiring and training personnel to strengthen maintenance business in countries where we are active
Looking for new production sites
Formulating product plans linking to demand, to raise customer value in Japan and overseas
Overseas: Growth strategies
Current Medium-Term Management Plan (FY 2016-18)
Completed mobile plant development and producing locally in Thailand
Obtained services of 1 sales agent in Indonesia
Obtained services of 2 production sites in Thailand
Obtained services of casting factory in Malaysia
From 13 AP in FY 2015 to 18 in FY 2017 (of which 4 environmentally friendly urban type and 6 with recycling functions)
Net sales increase 1.5x from 2,100 to 3,300 mil. yen (FY 2017)
FY 2018 forecast: 3,570 mil. yen
Hired 1 person each from Taiwan, Vietnam and Malaysia
Obtained services of Malaysian casting firm to increase rate of overseas-sourced products
Currently looking for new production sites
13
· Expand sales of recycling equipment and energy-saving products
· Introduce equipment to raise production volume of core products
· Hire and train sales personnel to expand sales
· Select areas where proper cost and quality management are possible
· Gather information widely, including through tie-ups with Japanese companies doing business in our target countries
· Build readiness, including by newly dispatching service personnel

www.nikko-net.co.jp Copyright NIKKO CO., LTD. 2018 All rights reserved.
Topics
14
NIKKO Messe 2018 (from Oct 22 to Nov 2)
Number of visitors
Number of visitorsExisting
businessNew Total
AP 355 46 401
BP 202 35 237
Environment- and conveyor-related 90 4 94
Other business 77 5 82
Sales agents’ association 149 – 149
Overseas 64 – 64
Total 937 90 1,027
Cooperating engineering shops 123 – 123
Suppliers 95 5 100
Investors, security analysts, individual
shareholders, media, etc.– – 100
Number of items on display
AP-related business 6
BP-related business 8
Maintenance service 10
Environment- and
conveyor-related7
Mobile products 5
Other business 14
Total 50
<Outcome>AP ValuePack inquiries Scheduled in 2019 1 unit 450 mil. yen
Scheduled in 2020 1 unit 450 mil. yenAsphalt crusher Promotion using actual product of a major user
600 units in the Japanese market (incl. target of 500 units; annual demand is 15 to 20 units)Setting 2 units a year as an initial target, 50% of dynamic share early on
BP Promoted new operation console and alliance with new customer support center (CSC) to users of products of other companiesShowcased the upgraded operation consoleA foothold for increasing the market share by replacing operation consoles of other companies, mixers and Nikko-made plant body
<Goals>1. Compilation of 2016-2018 Medium-Term
Management PlanAn event commemorating 100th anniversary
2. Showcase our innovative spirit based on continuous development of new products
3. Expand sales of new products and propose new business models(e.g. recycling burner + crusher; remote maintenance
linked with new operation console)4. Improve ability to explain, primarily in young
employees, and gather customer needs

www.nikko-net.co.jp Copyright NIKKO CO., LTD. 2018 All rights reserved.
FY 2018 1H (Apr-Sep) Results
15

www.nikko-net.co.jp Copyright NIKKO CO., LTD. 2018 All rights reserved.
1H ActualFull year
Actual1H Actual YoY change
YoY change
(%)
1H forecast
(initial)
Full-year
forecast
(revised)
Net sales 16,153 35,114 14,697 (1,456) (9.0)% 16,000 32,500
Operating income 808 2,103 474 (334) (41.4)% 950 1,600
Operating margin 5.0% 6.0% 3.2% – – 5.9% 4.9%
Ordinary income 925 2,239 595 (330) (35.6)% 1,050 1,750
Net income attributable
to owners of parent743 1,490 564 (179) (24.1)% 750 1,400
New orders received 15,933 33,616 13,854 (2,079) (13.0)% 16,000 32,500
Order backlog 11,409 10,132 9,289 (2,120) (18.6)% 10,132 10,132
Exchange rate (EUR/JPY) 132.21 127.19 130.62 (1.59) – 130.00 130.00
Exchange rate (RMB/JPY) 16.90 16.63 17.00 +0.10 – 17.00 16.50
FY 2018FY 2017
FY 2018 1H Performance Highlights (1)
Operating income declined 334 mil. yen to 474 mil. yen due to sales decline (down 1,500 mil. yen year on year) of the domestic BP-related business and higher SG&A expenses (up 100 mil. yen year on year). Cost-of-sales ratio improved 1.3% thanks to lower outsourcing cost, etc.
(yen)
16
(mil. yen)

www.nikko-net.co.jp Copyright NIKKO CO., LTD. 2018 All rights reserved.
1H Actual Full year Actual 1H Actual YoY change1H forecast
(initial)
Full-year forecast
(revised)
+401
105.4%
(35)
92.2%
(1,736)
69.0%
(311)
53.5%
(355)
75.6%
+7
106.9%
+234
114.1%
(14)
86.9%
(519) (1,031) (502) – (520) (1,020)
1,700
170
10.0%
Corporate expenses
4.9%
1,660
107
6.5%
4,480
462
10.3% – 10.0%
Asphalt plant-
related
business
Concrete
plant-related
business
Environment-
and conveyor-
related
business
Other business
Net sales 1,894 4,800
Operating income 93 480
Operating margin
Operating income 108 300
Operating margin 9.8% 10.7%
101
7.0%
130
10.0%
308
7.8% –
Operating margin 9.3% 9.1%
Net sales 1,098 2,8001,453
10.7%
3,931
11.9% 10.0%
1,300
–
Net sales 3,870 8,100
Operating income 358 740
5,606
669
9,521
1,015
4,200
420
Operating income 415 1,100
Operating margin 5.3% 6.5%
450
6.1%
1,348
7.8%
750
8.5%–
Net sales 7,833 16,8007,432 17,179
FY 2018FY 2017
8,800
FY 2018 1H Performance Highlights (2)
17
(mil. yen)

www.nikko-net.co.jp Copyright NIKKO CO., LTD. 2018 All rights reserved.
1.7%10.3%
0.5%
7.6%0.8%
7.6% 4.9%8.2%
-0.5%5.4%
6,436
9,328
6,033
10,919
6,179
9,974
7,991
10,968
5,415
9,282
112
962
33
835
48
760
392
902
(26)
500
(200)
0
200
400
600
800
1,000
1,200
(2,000)
0
2,000
4,000
6,000
8,000
10,000
12,000
FY 20161Q
2Q 3Q 4Q FY20171Q
2Q 3Q 4Q FY20181Q
2Q 3Q 4Q
Op
erat
ing
inco
me
Ne
t sa
les
Net sales Operating income Net sales Operating margin
32,717
1,944
35,114
2,103
32,500
1,600
(mil. yen)
18
Quarterly net sales and operating income trends

www.nikko-net.co.jp Copyright NIKKO CO., LTD. 2018 All rights reserved.
Asphalt Plant-Related Business
Note: Numbers for the second to fourth quarters of each fiscal year are year-to-date cumulative.
19
FY 20161Q
2Q 3Q 4QFY2017
1Q2Q 3Q 4Q
FY20181Q
2Q
New orders received 2,932 7,686 9,505 16,718 2,803 8,254 10,571 17,182 2,787 6,501
Net sales 2,935 8,033 10,494 16,580 2,768 7,431 11,585 17,180 2,361 7,833
Operating income 103 659 593 1,253 100 450 768 1,348 42 415
Operating margin 3.5% 8.2% 5.7% 7.6% 3.6% 6.1% 6.6% 7.8% 1.8% 5.3%
0%
1%
2%
3%
4%
5%
6%
7%
8%
9%
0
5,000
10,000
15,000
20,000
25,000
Op
erat
ing
mar
gin
Am
ou
nt
(mil.
yen
)
New orders received: Declined year on year as expected domestic orders were delayed into 2H. Overseas, there were deferring and delays in progress due to the foreign exchange situation and policy changes in the target countries.
Net sales: Initial order backlog of plant products in Japan was high and exceeded the level in the same period a year ago. Maintenance also exceeded the level in the same period a year ago.Overseas, other than China, saw a significant decline (down 700 mil. yen).
Operating income: Domestic sales of both plant products and maintenance service exceeded the levels in the same period a year ago, but exports and sales in China were lower than the same period a year ago.

www.nikko-net.co.jp Copyright NIKKO CO., LTD. 2018 All rights reserved.
Concrete Plant-Related Business
20
Note: Numbers for the second to fourth quarters of each fiscal year are year-to-date cumulative.
FY 20161Q
2Q 3Q 4QFY2017
1Q2Q 3Q 4Q
FY20181Q
2Q
New orders received 3,047 5,254 7,998 9,965 1,458 4,273 6,428 9,066 1,351 3,834
Net sales 2,106 4,384 6,579 9,356 2,236 5,606 6,896 9,522 1,671 3,870
Operating income 113 496 731 1,006 145 668 736 1,015 66 358
Operating margin 5.4% 11.3% 11.1% 10.8% 6.5% 11.9% 10.7% 10.7% 3.9% 9.3%
0%
2%
4%
6%
8%
10%
12%
0
2,000
4,000
6,000
8,000
10,000
12,000
14,000
Op
erat
ing
mar
gin
Am
ou
nt
(mil.
yen
)
New orders received: Declined compared with the same period a year earlier due to delay in order receipt timing.Net sales: Declined compared with the same period a year earlier, as order backlog was low as of the end of FY
2017.Operating income: Declined year on year due to sales decline.

www.nikko-net.co.jp Copyright NIKKO CO., LTD. 2018 All rights reserved.
FY 20161Q
2Q 3Q 4QFY2017
1Q2Q 3Q 4Q
FY20181Q
2Q
New orders received 580 1,167 1,760 3,202 864 1,516 2,160 2,947 413 1,056
Net sales 511 1,371 1,913 2,647 407 1,452 2,971 3,932 462 1,098
Operating income 76 254 307 369 24 100 215 306 59 108
Operating margin 14.9% 18.5% 16.0% 13.9% 5.9% 6.9% 7.2% 7.8% 12.8% 9.8%
0%
10%
20%
0
5,000
10,000
Op
erat
ing
mar
gin
Am
ou
nt
(mil.
yen
)
Environment- and Conveyor-Related, and Other Businesses
Environment- and conveyor-related business
21
FY 20161Q
2Q 3Q 4QFY2017
1Q2Q 3Q 4Q
FY20181Q
2Q
New orders received 871 2,154 3,215 4,247 768 1,885 3,143 4,420 1,140 2,461
Net sales 882 1,972 2,805 4,133 766 1,660 2,687 4,481 921 1,894
Operating income 55 184 224 417 22 107 227 463 21 93
Operating margin 6.2% 9.3% 8.0% 10.1% 2.9% 6.4% 8.4% 10.3% 2.3% 4.9%
0%
10%
20%
0
5,000
10,000
Op
erat
ing
mar
gin
Am
ou
nt
(mil.
yen
)
Other business
Note: Numbers for the second to fourth quarters of each fiscal year are year-to-date cumulative.

www.nikko-net.co.jp Copyright NIKKO CO., LTD. 2018 All rights reserved.
Analysis of FY 2018 2Q Ordinary Income Change Factors
Higher SG&Aexpenses
Increase in other non-operating
income
Ordinary income (330)
(Sales decline of 1,456 mil. yen)
(73.7%→74.9%)
(mil. yen)
22
Lower net sales
Improvement in cost-of-sales ratio
Analysis of factors contributing to changes in FY 2018 2Q ordinary income
Higher foreign exchange losses
(Cost of introducing sales support system: 14 mil. yen)
FY 2017: 100 mil. yen in Reversal of allowance for doubtful accounts at Nikko Shanghai
Net salesCost-of-sales ratio
SG&A expensesForeign exchange
Other non-operating incomeFY2018 2QFY2017 2Q
(361) (7)(158)

www.nikko-net.co.jp Copyright NIKKO CO., LTD. 2018 All rights reserved.
Balance Sheet Trends
(mil. yen)
23
+

www.nikko-net.co.jp Copyright NIKKO CO., LTD. 2018 All rights reserved.
15 15 15 15 15
20
25 25 25 30
15 15 15
20 20
25
25 30
35 30
202.4%
54.4%
208.2%
34.2%33.0%
28.0% 22.1%
106.9%
47.3%
32.7%
0%
50%
100%
150%
200%
250%
¥0
¥10
¥20
¥30
¥40
¥50
¥60
¥70
FY 2009 FY 2010 FY 2011 FY 2012 FY 2013 FY 2014 FY 2015 FY 2016 FY 2017 FY 2018 (E)
Interim dividends Year-end dividends Total return ratio
Trends in Dividends and Total Return Ratio
24
(mil. yen)
Share buyback 1 1 4 9 1 2 1 1,006 246 –
Treasury stock retirement
0 0 0 0 0 0 0 0 752 –

www.nikko-net.co.jp Copyright NIKKO CO., LTD. 2018 All rights reserved.
FY 2018 Full-year Outlook
25

www.nikko-net.co.jp Copyright NIKKO CO., LTD. 2018 All rights reserved.
2H ActualFull year
Actual
2H forecast
(revised)
Full-year
forecast
(revised)
YoY changeYoY change
(%)
Full-year
forecast
(initial)
Net sales 18,961 35,114 17,803 32,500 (2,614) (7.4)% 34,000
Operating income 1,296 2,103 1,126 1,600 (503) (24.0)% 2,150
Operating margin 6.8% 6.0% 6.3% 4.9% – – 6.3%
Ordinary income 1,314 2,239 1,155 1,750 (489) (21.8)% 2,300
Net income attributable
to owners of parent747 1,490 836 1,400 (90) (6.1)% 1,550
New orders received 17,683 33,616 18,646 32,500 (1,116) (3.3)% 34,000
Order backlog 10,132 10,132 10,132 10,132 0 +0.0% 10,132
Exchange rate (EUR/JPY) 132.21 127.19 130.00 130.00 +2.81 – 132.50
Exchange rate (RMB/JPY) 16.90 16.63 16.50 16.50 (0.13) – 17.00
FY 2017 FY 2018
FY 2018 Full-year Performance Forecast
(yen)
26
(Assumptions)
Sales: Expected to fall reflecting decline in orders for both AP and BP in 1H and overseas orders for AP.Operating income: Expected to decline, as raw materials prices are expected to remain high.Orders: Exports are expected to decline reflecting foreign exchange and changes in situation of Russian Far East.Order backlog: In line with the initial forecast, as the domestic situation does not change.
(mil. yen)
www.nikko-net.co.jp Copyright NIKKO CO., LTD. 2018 All rights reserved.
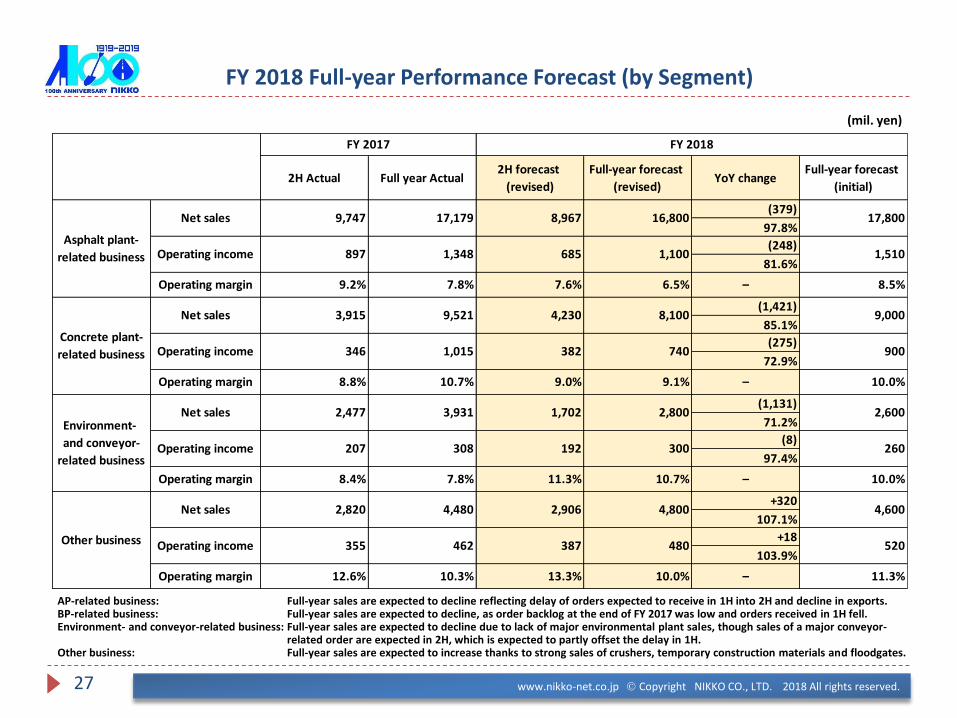
FY 2018 Full-year Performance Forecast (by Segment)
27
AP-related business: Full-year sales are expected to decline reflecting delay of orders expected to receive in 1H into 2H and decline in exports.BP-related business: Full-year sales are expected to decline, as order backlog at the end of FY 2017 was low and orders received in 1H fell.Environment- and conveyor-related business: Full-year sales are expected to decline due to lack of major environmental plant sales, though sales of a major conveyor-
related order are expected in 2H, which is expected to partly offset the delay in 1H.Other business: Full-year sales are expected to increase thanks to strong sales of crushers, temporary construction materials and floodgates.
(mil. yen)
2H Actual Full year Actual2H forecast
(revised)
Full-year forecast
(revised)YoY change
Full-year forecast
(initial)
(379)
97.8%
(248)
81.6%
(1,421)
85.1%
(275)
72.9%
(1,131)
71.2%
(8)
97.4%
+320
107.1%
+18
103.9%
–
–
–
–12.6% 10.0%
9.1%
300
11.3%
13.3%
8.8%
2,477
2,820
308
4,800
2,800
11.3%
2,600
260
10.0%
4,600
520
1,510
8.5%
9,000
900
10.0%
17,800
10.7%
192
355
Net sales 16,800
9.2%
8,100
Operating income 740
9,521
1,015
4,230
382
3,915
346
17,179 8,9679,747
Asphalt plant-
related business
FY 2017 FY 2018
Operating income 1,100
Operating margin 6.5%
1,348
7.8%
685
7.6%
897
10.7%
3,931
9.0%
1,702
480387
2,906
7.8%
207
8.4%
10.3%
4,480
462
Concrete plant-
related business
Environment-
and conveyor-
related business
Other business
Net sales
Operating margin
Net sales
Net sales
Operating income
Operating margin
Operating income
Operating margin

www.nikko-net.co.jp Copyright NIKKO CO., LTD. 2018 All rights reserved.
Analysis of Difference between Forecast and Result in 1H, and Difference between Initial 2H Forecast and Revised Budget
28
Difference between forecast and actual result in 1H (mil. yen)
Impact of unachieved
sales forecast
Export (740) (110) High raw materials prices (60)
China (265) (70) Additional costs incurred by environmental plants (60)
Conveyance (150) (20) Decline in rate of plant operation (25)
Environment (120) (20) Expenses resulting from complaints (80)
Other business (28) (5) Other factors (26)
Total (1,303) (225) Total difference in operating income between forecast and actual result (476)
Net sales
Operating income
Impact of other factors
Difference between 2H initial and revised forecasts
Initial Revised Initial Revised
18,000 17,803 1,200 1,126
Individual analysis of initial and revised forecasts
Net salesOperating
income
Export 400 40 Net sales offset only 400 mil. yen of the unachieved 1H portion. Some 20 mil. yen short of annual profit forecast.
China 265 45 While net sales forecast will be met in 2H, annual profit will be 25 mil. yen short of forecast due to rising personnel costs.
Conveyance 200 50 Net sales forecast to be met in 2H, and will be 50 mil. yen extra. Annual profit will be 30 mil. yen more than the forecast.
Domestic AP (300) (30) Annual profit/loss will be 365 mil. yen short.
Domestic BP (600) (100) Annual profit/loss will be 160 mil. yen short.
Other business (162) (79)
Total (197) (74)
Net sales Operating income

www.nikko-net.co.jp Copyright NIKKO CO., LTD. 2018 All rights reserved.
Analysis of FY 2018 Ordinary Income Change Factors
Ordinary income (489)
29
(mil. yen)
Analysis of factors contributing to changes in FY 2018 full-year ordinary income (forecast)
(298)(200)
Initial forecast2,239 (280) +480 (150) 0 +11 2,300

www.nikko-net.co.jp Copyright NIKKO CO., LTD. 2018 All rights reserved. 30
Reference Materials

www.nikko-net.co.jp Copyright NIKKO CO., LTD. 2018 All rights reserved.
69,417
44,882
24,301
15,084 12,629 9,667
9,295
11,421
30,264
43,800
39,813
34,781
30,369
29,199
17,671
16,768
1,782 1,726
1,581
1,270 1,158
1,030
1,020
0
200
400
600
800
1,000
1,200
1,400
1,600
1,800
2,000
0
10,000
20,000
30,000
40,000
50,000
60,000
70,000
80,000
90,0008
8
89
90
91
92
93
94
95
96
97
98
99
00
01
02
03
04
05
06
07
08
09
10
11
12
13
14
15
16
17
20
18
(E)
(FY
)
FY 2
01
7/2
Q
FY 2
01
8/2
Q
Nu
mb
er o
f p
lan
ts
Mix
ture
vo
lum
e m
anu
fact
ure
d(1
,00
0to
ns)
Virgin mixture Recycled mixture Plants installed
AP-Related Business Climate and Outlook
Demand rebounded for recovery from the Great East Japan Earthquake and other needs, but both asphalt mixture manufacturing volume and asphalt plant installations have been declining since FY 2013.FY 2018 is also expected to fall somewhat from the previous fiscal year, as the demand situation continues to be severe.AP demand, however, should be in line with the previous fiscal year, as highway companies that have been putting off equipment upgrades have strong investment appetite.
31
Source: Japan Asphalt Mixture Association. FY 2018 figures are Nikko estimates.
Asphalt mixture volume manufactured and number of asphalt plants installed

www.nikko-net.co.jp Copyright NIKKO CO., LTD. 2018 All rights reserved.
01 02 03 04 05 06 07 08 09 10 11 12 13 14 15 16 17
2018
(E)(FY)
FY20171H
FY20181H
(R) industry units 28 30 27 20 12 20 15 9 14 14 25 24 29 22 29 23 29 26 16 14
(V) industry units 20 24 18 18 5 6 10 3 7 10 10 10 18 10 16 16 14 18 9 14
Nikko (V) share 55% 58% 56% 67% 60% 67% 70% 0% 71% 70% 80% 70% 72% 60% 81% 69% 64% 44% 44% 50%
Nikko (R) share 64% 63% 67% 85% 75% 65% 60% 67% 71% 71% 84% 67% 69% 73% 76% 78% 72% 65% 56% 64%
Overall Nikko share 60% 61% 62% 76% 71% 65% 64% 50% 71% 71% 83% 68% 70% 69% 78% 74% 70% 57% 52% 57%
0%
20%
40%
60%
80%
100%
0
20
40
60
80
100
Nik
ko p
lan
t sh
are
Ind
ust
ry n
um
ber
of
pla
nts
14 15 16 172018 (E)
(FY)
FY2018
1H
VP units 0 0 1 2 2 1
VP sales 0 0 211 580 553 295
Midship units 1 2 1 1 1 1
Midship sales 375 1,060 410 406 337 337
Crushing plant units 1 1 0 1 0 0
Crushing plant sales 72 152 0 125 0 0
AP-Related Business Details and Strategy for the Future (1)
New product performance in AP-related business
32
(units, mil. yen)
Asphalt plant demand and Nikko share
Source: Prepared by Nikko.
Going after users by adding to lineup new equipment, such as VP Type asphalt plant series, recycling unit, warm-mix asphalt equipment, and crushing equipment for asphalt plants

www.nikko-net.co.jp Copyright NIKKO CO., LTD. 2018 All rights reserved.
2,088 2,262 2,668 2,825 2,980 2,956
3,965
4,466
1,110
8.5%8.4%
8.3%9.2%
8.7%9.0%
11.3%
13.7%
7.6%
0.0%
5.0%
10.0%
15.0%
0
1,000
2,000
3,000
4,000
5,000
11 12 13 14 15 16 17 FY 2018forecast
FY20181H
Per
cen
t o
f co
nso
lidat
ed n
et s
ales
Net
sal
es(m
il. y
en)
Net sales Percent of Group net sales
AP-Related Business Details and Strategy for the Future (2)
Users looking to cut costs prefer recycled mixturesInterest in environmental products is on the rise.
Nikko overseas sales and sales ratio Nikko Shanghai net sales trends
Nikko Shanghai AP unit sales trends
33
1,695 1,552 1,669
2,027 2,087
2,131
3,299 3,570
1,031
0
1,000
2,000
3,000
4,000
Nik
ko S
han
ghai
net
sale
s
11
12
13
14
15
16
17
FY 2
01
8 fo
reca
st
FY2
01
8 1
H
Net
sal
es(m
il. y
en)
14 14
9 8 8 912
14
5
1 1
31
4 31
21 3
65
1
0
5
10
15
20
11
12
13
14
15
16
17
FY 2
01
8 fo
reca
st
FY2
01
8 1
H
Un
its
Virgin Recycled Virgin & recycled

www.nikko-net.co.jp Copyright NIKKO CO., LTD. 2018 All rights reserved.
13,14111,188
9,210 8370
8150
4,172
4,140
11,977 yen
14,630 yen4,291 4,046
3,4563351
0
1,000
2,000
3,000
4,000
5,000
6,000
0
5,000
10,000
15,000
20,000
Nu
mb
er o
f p
lan
ts
Rea
dy-
mix
ed c
on
cret
e sh
ipp
ed (
10
,00
0 c
ub
ic m
eter
s)
Ready-mixed concrete shipped (10,000 cubic meters)
Ready-mixed concrete price (nationwide)
Number of plants
BP-Related Business Climate and Outlook
34
Source: National Federation of Ready-Mixed Concrete Industrial Associations; Ministry of Economy, Trade and Industry’s Ready-mixed Concrete Statistics Survey (price); FY 2018 figures are Nikko estimates.
While construction investment started in line with the previous year, it slightly declined due to process delay caused by labor shortage resulting from workstyle reform, etc.In the medium- to long-term, the market may gradually slow after the Tokyo Olympic Games.FY 2018 Apr-Sep ready-mixed concrete shipment volume was in line with the same period a year ago at 41.40 mil. m3 (down 0.8% year on year).In the medium- to long-term, consolidation of ready-mixed concrete plants in each area is expected to gradually progress.
Trends in ready-mixed concrete shipments, price, and plants
www.nikko-net.co.jp Copyright NIKKO CO., LTD. 2018 All rights reserved.
02 03 04 05 06 07 08 09 10 11 12 13 14 15 16FY
2017
FY20171H
FY20181H
Total demand (monetary amount) 194 209 201 199 186 198 170 151 116 123 140 199 218 239 240 233 118 108
Total shipped units 140 140 97 113 99 105 76 57 48 52 55 93 93 98 90 72 36 26
0
20
40
60
80
100
120
140
160
0
50
100
150
200
250
300
Dem
and
vo
lum
e (u
nit
s)
Dem
and
am
ou
nt
(10
0 m
il. y
en)
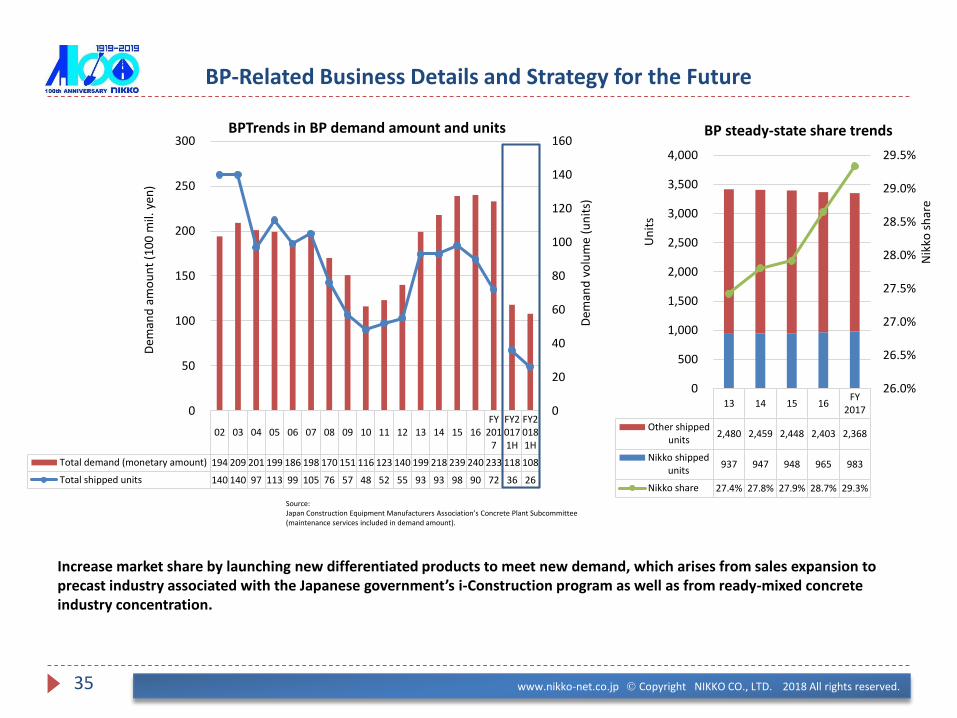
BPTrends in BP demand amount and units
BP-Related Business Details and Strategy for the Future
35
Increase market share by launching new differentiated products to meet new demand, which arises from sales expansion to precast industry associated with the Japanese government’s i-Construction program as well as from ready-mixed concrete industry concentration.
Source: Japan Construction Equipment Manufacturers Association’s Concrete Plant Subcommittee (maintenance services included in demand amount).
13 14 15 16FY
2017
Other shippedunits
2,480 2,459 2,448 2,403 2,368
Nikko shippedunits
937 947 948 965 983
Nikko share 27.4% 27.8% 27.9% 28.7% 29.3%
26.0%
26.5%
27.0%
27.5%
28.0%
28.5%
29.0%
29.5%
0
500
1,000
1,500
2,000
2,500
3,000
3,500
4,000
Nik
ko s
har
e
Un
its
BP steady-state share trends

www.nikko-net.co.jp Copyright NIKKO CO., LTD. 2018 All rights reserved.
Trends in Net Sales, Profit, Cash Flows, and Other Indicators
1Q 2Q 3Q 4Q 1Q 2Q 3Q 4Q 1Q 2Q
6,436 9,328 6,034 10,919 6,179 9,974 7,992 10,969 5,415 9,282
AP-related business 2,935 5,099 2,462 6,084 2,768 4,664 4,155 5,592 2,361 5,472
BP-related business 2,106 2,278 2,195 2,777 2,236 3,370 1,291 2,624 1,671 2,199Environment- and conveyor-
related business511 861 542 733 407 1,046 1,519 959 462 636
Other business 882 1,091 834 1,326 766 894 1,027 1,793 921 973
112 963 33 836 48 760 393 902 (26) 500
AP-related business 103 556 (66) 660 100 350 318 580 42 373
BP-related business 113 384 236 273 145 524 68 278 66 292Environment- and conveyor-
related business76 178 54 61 24 77 115 92 59 49
Other business 55 129 41 192 22 85 121 234 21 72
Corporate expenses (236) (285) (230) (351) (244) (275) (231) (281) (216) (286)
187 957 67 782 161 764 431 883 87 508
124 766 28 422 182 561 308 439 130 434
- -
- -
209 - 194 - 232 - 191 - 267 -
- -245
5,064
(316)Cash flow from investing activities
Total dividend
Share buyback
Net sales
Operating income
Ordinary income
Net income attributable to owners
of parent
Cash flow from operating activities 274
FY 2018
41
1,006
FY 2016 FY 2017
(mil. yen)
36

www.nikko-net.co.jp Copyright NIKKO CO., LTD. 2018 All rights reserved.
Trends in New Orders Received and Order Backlog per Business Segment
1Q 2Q 3Q 4Q 1Q 2Q 3Q 4Q 1Q 2Q
AP-related business 2,932 7,687 9,506 16,718 2,803 8,254 10,572 17,182 2,787 6,501
BP-related business 3,047 5,255 7,999 9,965 1,458 4,274 6,430 9,066 1,351 3,834
Environment- and
conveyor-related business580 1,168 1,762 3,202 864 1,517 2,162 2,947 413 1,056
Other business 871 2,155 3,216 4,247 768 1,886 3,144 4,420 1,140 2,461
Total 7,432 16,266 22,485 34,134 5,896 15,933 22,309 33,616 5,693 13,854
1Q 2Q 3Q 4Q 1Q 2Q 3Q 4Q 1Q 2Q
AP-related business 6,024 5,680 5,038 6,356 6,391 7,178 5,341 6,359 6,784 5,027
BP-related business 3,658 3,587 4,136 3,350 2,572 2,018 2,883 2,894 2,575 2,858
Environment- and
conveyor-related business885 612 663 1,371 1,827 1,434 560 387 338 345
Other business 425 618 846 551 553 776 1,008 490 710 1,058
Total 10,993 10,499 10,684 11,629 11,346 11,408 9,793 10,132 10,409 9,289
FY 2018
FY 2018
FY 2016 FY 2017New orders received
(cumulative)
FY 2016 FY 2017End-of-term order
backlog
37
(mil. yen)

www.nikko-net.co.jp Copyright NIKKO CO., LTD. 2018 All rights reserved.
Trends in Capital Investment, Depreciation and Amortization, R&D Expenses, and Nonfinancial Data
FY 2011 FY 2012 FY 2013 FY 2014 FY 2015 FY 2016 FY 2017 FY2018 1H FY 2018 (E)
292 335 844 815 877 1,261 550 1,143 1,200
432 389 395 422 487 482 472 226 495
239 256 295 276 227 271 291 145 300
775 763 767 796 803 797 807 816
44.2 44.7 43.3 43.1 42.2 42.3 42.2 41.9
21.5 21.2 20 19.3 18.2 18.5 18.3 18.1
10 11 11 10 12 15 17 18
92 90 91 95 92 91 101 95
92 90 91 95 94 93 101 101
Average years of service
(non-consolidated)Female employees
(non-consolidated)Overseas employees
(consolidated)Foreign national employees
(consolidated)
Capital investment
Depreciation and amortization
R&D expenses
Employees (consolidated):
Average age of employees
(non-consolidated)
38
New products for reducing environmental impact
FY 2013 FY 2014 FY 2015 FY 2016 FY 2017 FY 2018
New products
· Specialized sand drying
equipment
· High temperature preheating
burner
· NTB-II burner · New-type bag filter · VP Series asphalt plants
—
· Foamed asphalt
manufacturing equipment
Features
reducing
environmental
impact
· Improved plant production
efficiency
· Energy saving
· Energy saving
· Higher combustion efficiency
in low-combustion range
· Space saving
· Energy saving, exhaust gas
reduction
· Low noise
· Preventing diffusion of
recycled material odorous gas—
· Support for manufacture of
warm-mix asphalt
(persons, years old, or years)
(mil. yen)

Future projections and other forward-looking statements in this material were prepared based on information currently available to the management.These statements contain risks and uncertainties, such as changes in performance outlook due to the financial situation for the Company in Japan and abroad, industry trends, product demand and supply, advances in new technology, and other factors.Accordingly, investment decisions should not be made based only on the forward-looking statements in this material.Note also that forward-looking statements in this material are subject to change without prior notice, except where procedures are required by law.
39
Please feel free to contact us as follows if you desire a meeting or have other requests.(Meetings in Tokyo are also possible.)
E-mail: [email protected]
Contact: Saburo Hachiken, Finance Department, Nikko Co., Ltd.
Tel: +81-78-947-3141